Lake Ronkonkoma, NY Map & Demographics
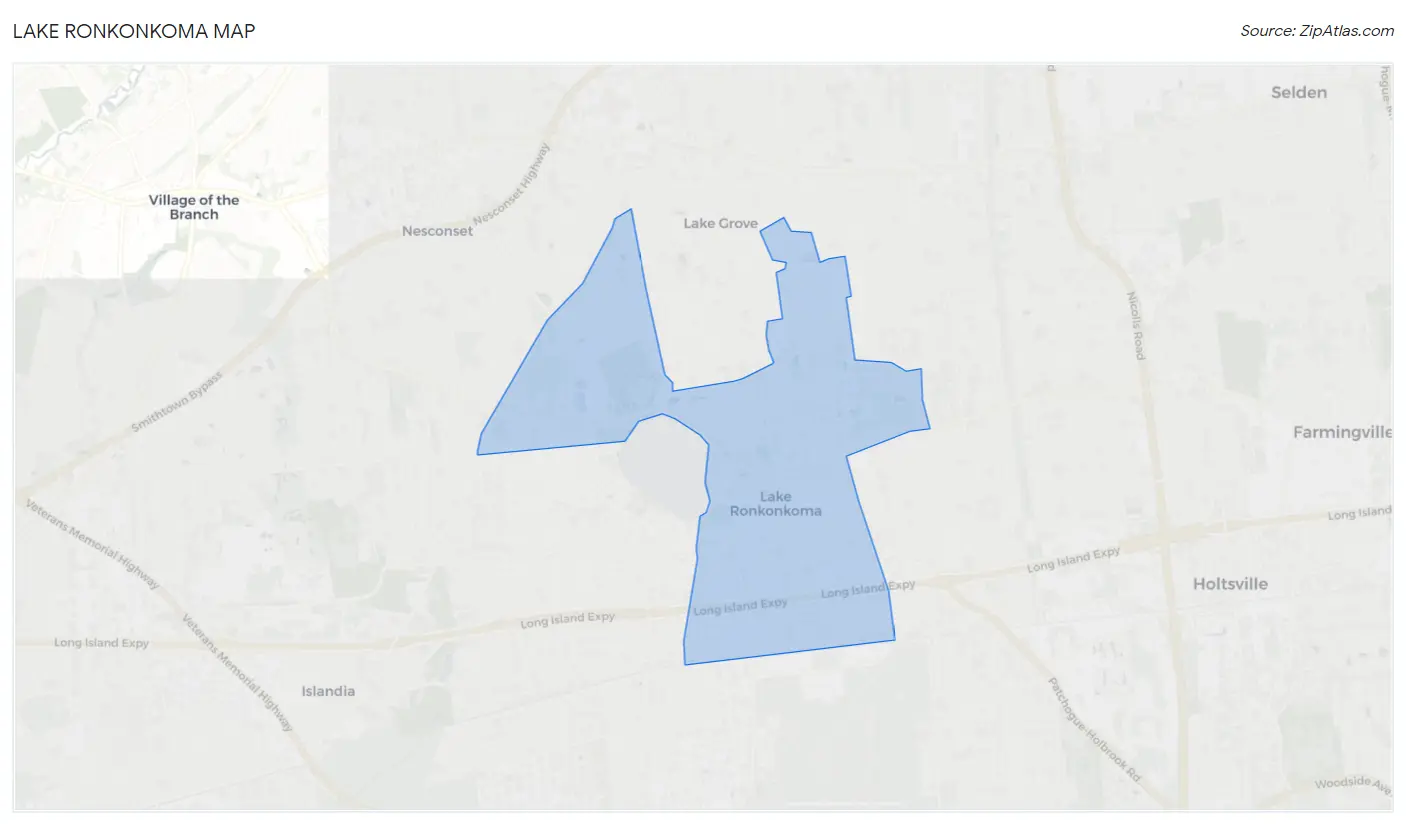
Lake Ronkonkoma Map
Lake Ronkonkoma Overview
$44,859
PER CAPITA INCOME
$120,625
AVG FAMILY INCOME
$98,922
AVG HOUSEHOLD INCOME
39.1%
WAGE / INCOME GAP [ % ]
60.9¢/ $1
WAGE / INCOME GAP [ $ ]
0.42
INEQUALITY / GINI INDEX
18,339
TOTAL POPULATION
8,790
MALE POPULATION
9,549
FEMALE POPULATION
92.05
MALES / 100 FEMALES
108.63
FEMALES / 100 MALES
42.8
MEDIAN AGE
3.5
AVG FAMILY SIZE
2.8
AVG HOUSEHOLD SIZE
9,927
LABOR FORCE [ PEOPLE ]
66.8%
PERCENT IN LABOR FORCE
5.8%
UNEMPLOYMENT RATE
Income in Lake Ronkonkoma
Income Overview in Lake Ronkonkoma
Per Capita Income in Lake Ronkonkoma is $44,859, while median incomes of families and households are $120,625 and $98,922 respectively.
| Characteristic | Number | Measure |
| Per Capita Income | 18,339 | $44,859 |
| Median Family Income | 4,224 | $120,625 |
| Mean Family Income | 4,224 | $138,055 |
| Median Household Income | 6,504 | $98,922 |
| Mean Household Income | 6,504 | $122,481 |
| Income Deficit | 4,224 | $0 |
| Wage / Income Gap (%) | 18,339 | 39.07% |
| Wage / Income Gap ($) | 18,339 | 60.93¢ per $1 |
| Gini / Inequality Index | 18,339 | 0.42 |
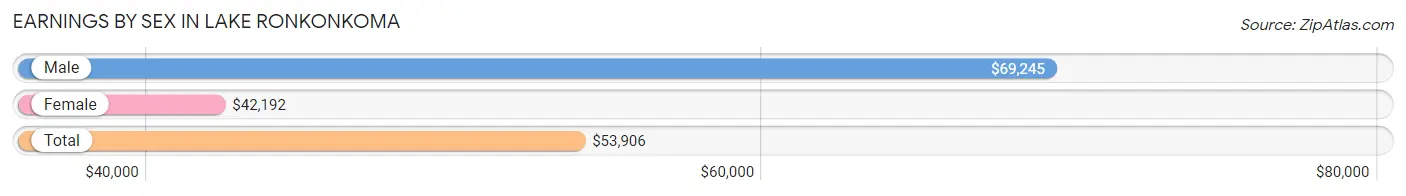
Earnings by Sex in Lake Ronkonkoma
Average Earnings in Lake Ronkonkoma are $53,906, $69,245 for men and $42,192 for women, a difference of 39.1%.
| Sex | Number | Average Earnings |
| Male | 5,082 (50.2%) | $69,245 |
| Female | 5,034 (49.8%) | $42,192 |
| Total | 10,116 (100.0%) | $53,906 |
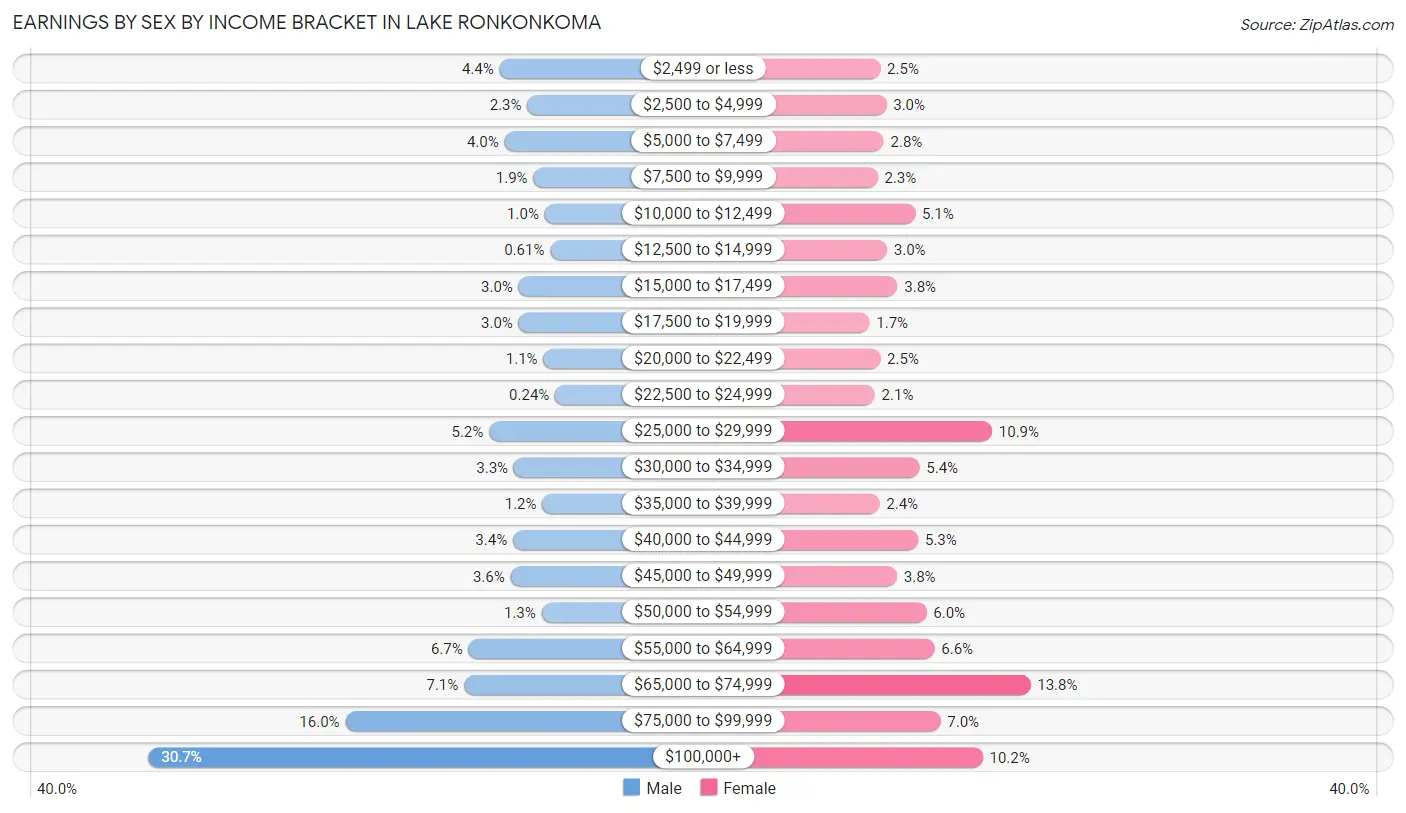
Earnings by Sex by Income Bracket in Lake Ronkonkoma
The most common earnings brackets in Lake Ronkonkoma are $100,000+ for men (1,561 | 30.7%) and $65,000 to $74,999 for women (692 | 13.8%).
| Income | Male | Female |
| $2,499 or less | 224 (4.4%) | 126 (2.5%) |
| $2,500 to $4,999 | 118 (2.3%) | 149 (3.0%) |
| $5,000 to $7,499 | 205 (4.0%) | 139 (2.8%) |
| $7,500 to $9,999 | 95 (1.9%) | 116 (2.3%) |
| $10,000 to $12,499 | 52 (1.0%) | 257 (5.1%) |
| $12,500 to $14,999 | 31 (0.6%) | 151 (3.0%) |
| $15,000 to $17,499 | 151 (3.0%) | 191 (3.8%) |
| $17,500 to $19,999 | 151 (3.0%) | 85 (1.7%) |
| $20,000 to $22,499 | 57 (1.1%) | 126 (2.5%) |
| $22,500 to $24,999 | 12 (0.2%) | 105 (2.1%) |
| $25,000 to $29,999 | 264 (5.2%) | 547 (10.9%) |
| $30,000 to $34,999 | 169 (3.3%) | 274 (5.4%) |
| $35,000 to $39,999 | 61 (1.2%) | 123 (2.4%) |
| $40,000 to $44,999 | 173 (3.4%) | 269 (5.3%) |
| $45,000 to $49,999 | 182 (3.6%) | 189 (3.7%) |
| $50,000 to $54,999 | 64 (1.3%) | 300 (6.0%) |
| $55,000 to $64,999 | 342 (6.7%) | 330 (6.6%) |
| $65,000 to $74,999 | 359 (7.1%) | 692 (13.8%) |
| $75,000 to $99,999 | 811 (16.0%) | 353 (7.0%) |
| $100,000+ | 1,561 (30.7%) | 512 (10.2%) |
| Total | 5,082 (100.0%) | 5,034 (100.0%) |
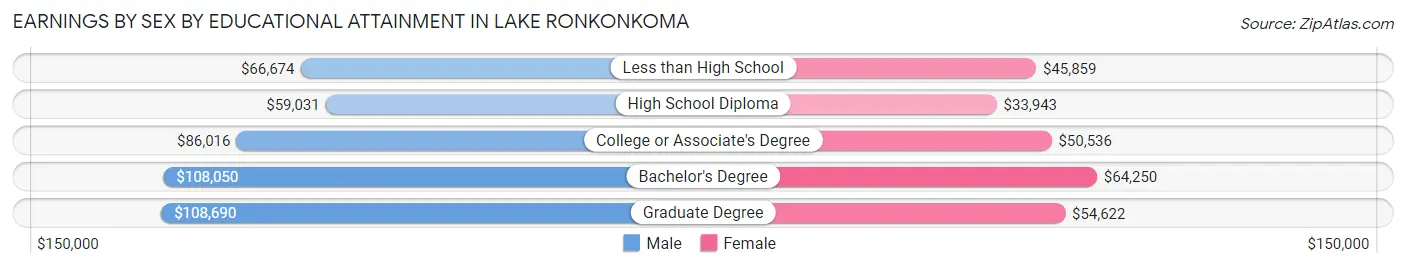
Earnings by Sex by Educational Attainment in Lake Ronkonkoma
Average earnings in Lake Ronkonkoma are $75,843 for men and $48,098 for women, a difference of 36.6%. Men with an educational attainment of graduate degree enjoy the highest average annual earnings of $108,690, while those with high school diploma education earn the least with $59,031. Women with an educational attainment of bachelor's degree earn the most with the average annual earnings of $64,250, while those with high school diploma education have the smallest earnings of $33,943.
| Educational Attainment | Male Income | Female Income |
| Less than High School | $66,674 | $45,859 |
| High School Diploma | $59,031 | $33,943 |
| College or Associate's Degree | $86,016 | $50,536 |
| Bachelor's Degree | $108,050 | $64,250 |
| Graduate Degree | $108,690 | $54,622 |
| Total | $75,843 | $48,098 |
Family Income in Lake Ronkonkoma
Family Income Brackets in Lake Ronkonkoma
According to the Lake Ronkonkoma family income data, there are 946 families falling into the $100,000 to $149,999 income range, which is the most common income bracket and makes up 22.4% of all families. Conversely, the $10,000 to $14,999 income bracket is the least frequent group with only 4 families (0.1%) belonging to this category.
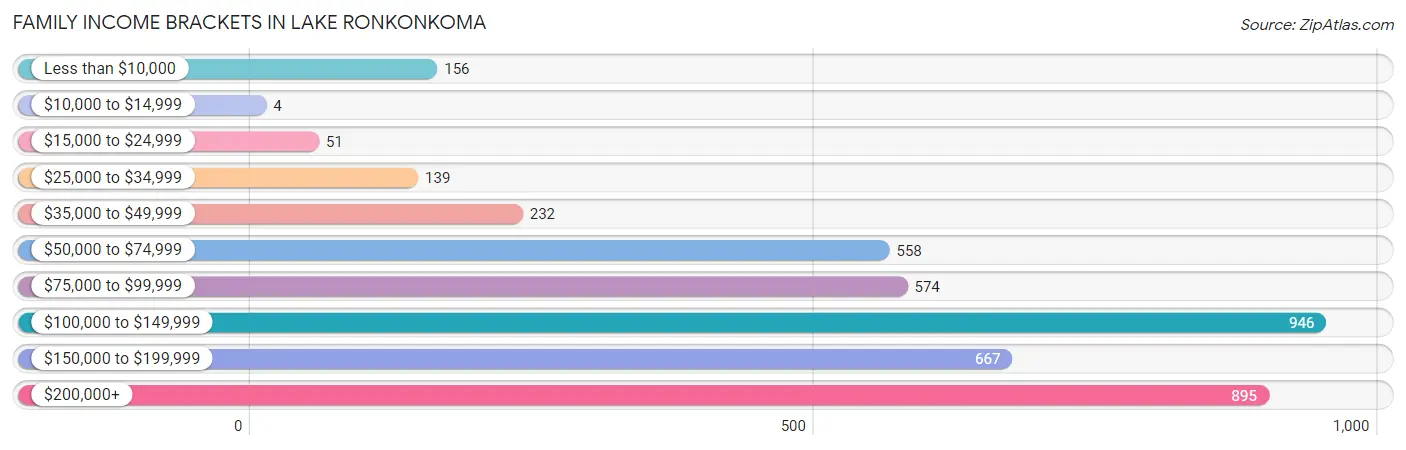
| Income Bracket | # Families | % Families |
| Less than $10,000 | 156 | 3.7% |
| $10,000 to $14,999 | 4 | 0.1% |
| $15,000 to $24,999 | 51 | 1.2% |
| $25,000 to $34,999 | 139 | 3.3% |
| $35,000 to $49,999 | 232 | 5.5% |
| $50,000 to $74,999 | 558 | 13.2% |
| $75,000 to $99,999 | 574 | 13.6% |
| $100,000 to $149,999 | 946 | 22.4% |
| $150,000 to $199,999 | 667 | 15.8% |
| $200,000+ | 895 | 21.2% |
Family Income by Famaliy Size in Lake Ronkonkoma
7+ person families (184 | 4.4%) account for the highest median family income in Lake Ronkonkoma with $214,500 per family, while 2-person families (1,601 | 37.9%) have the highest median income of $45,852 per family member.
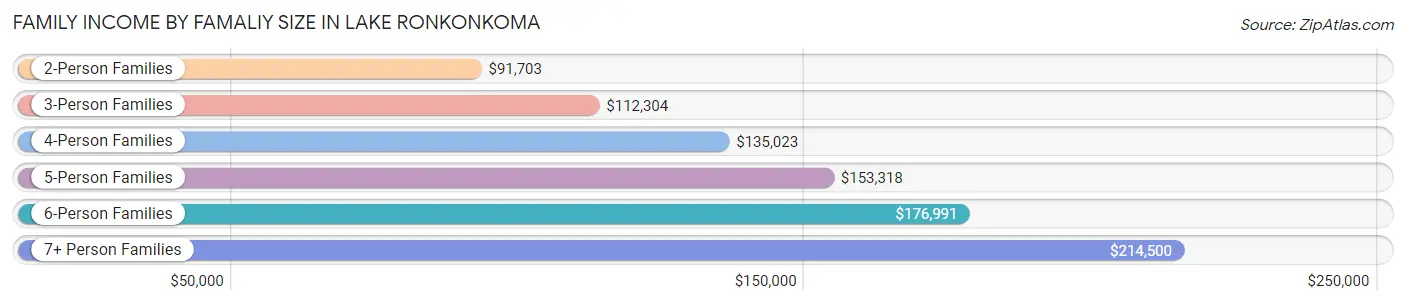
| Income Bracket | # Families | Median Income |
| 2-Person Families | 1,601 (37.9%) | $91,703 |
| 3-Person Families | 862 (20.4%) | $112,304 |
| 4-Person Families | 807 (19.1%) | $135,023 |
| 5-Person Families | 593 (14.0%) | $153,318 |
| 6-Person Families | 177 (4.2%) | $176,991 |
| 7+ Person Families | 184 (4.4%) | $214,500 |
| Total | 4,224 (100.0%) | $120,625 |
Family Income by Number of Earners in Lake Ronkonkoma
The median family income in Lake Ronkonkoma is $120,625, with families comprising 3+ earners (830) having the highest median family income of $196,477, while families with no earners (416) have the lowest median family income of $55,682, accounting for 19.7% and 9.9% of families, respectively.
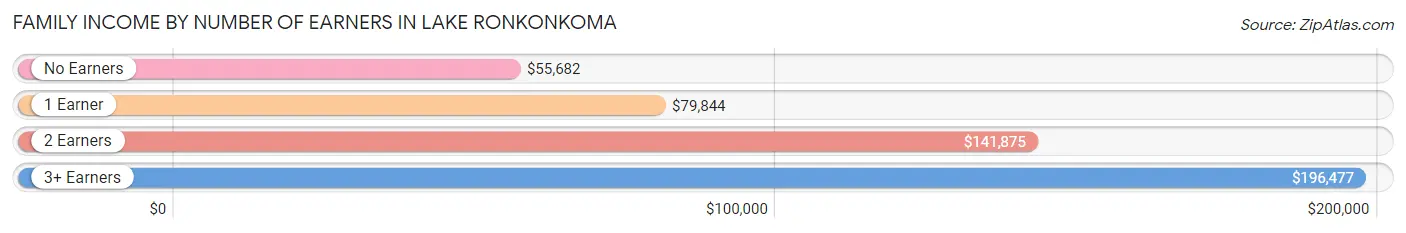
| Number of Earners | # Families | Median Income |
| No Earners | 416 (9.9%) | $55,682 |
| 1 Earner | 1,225 (29.0%) | $79,844 |
| 2 Earners | 1,753 (41.5%) | $141,875 |
| 3+ Earners | 830 (19.7%) | $196,477 |
| Total | 4,224 (100.0%) | $120,625 |
Household Income in Lake Ronkonkoma
Household Income Brackets in Lake Ronkonkoma
With 1,171 households falling in the category, the $100,000 to $149,999 income range is the most frequent in Lake Ronkonkoma, accounting for 18.0% of all households. In contrast, only 124 households (1.9%) fall into the $10,000 to $14,999 income bracket, making it the least populous group.
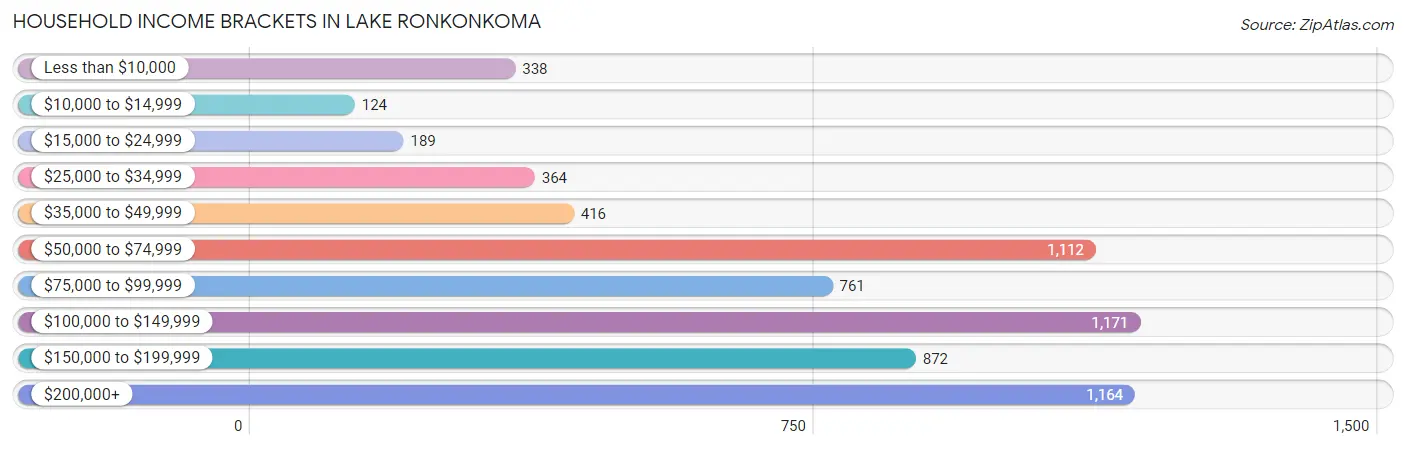
| Income Bracket | # Households | % Households |
| Less than $10,000 | 338 | 5.2% |
| $10,000 to $14,999 | 124 | 1.9% |
| $15,000 to $24,999 | 189 | 2.9% |
| $25,000 to $34,999 | 364 | 5.6% |
| $35,000 to $49,999 | 416 | 6.4% |
| $50,000 to $74,999 | 1,112 | 17.1% |
| $75,000 to $99,999 | 761 | 11.7% |
| $100,000 to $149,999 | 1,171 | 18.0% |
| $150,000 to $199,999 | 872 | 13.4% |
| $200,000+ | 1,164 | 17.9% |
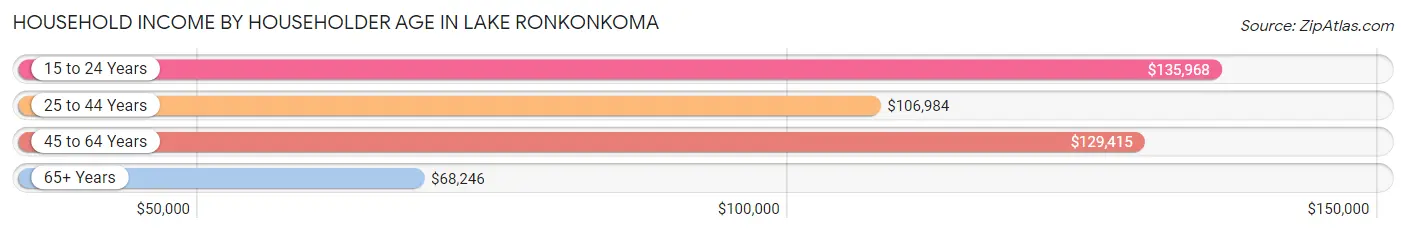
Household Income by Householder Age in Lake Ronkonkoma
The median household income in Lake Ronkonkoma is $98,922, with the highest median household income of $135,968 found in the 15 to 24 years age bracket for the primary householder. A total of 102 households (1.6%) fall into this category. Meanwhile, the 65+ years age bracket for the primary householder has the lowest median household income of $68,246, with 1,924 households (29.6%) in this group.
| Income Bracket | # Households | Median Income |
| 15 to 24 Years | 102 (1.6%) | $135,968 |
| 25 to 44 Years | 1,535 (23.6%) | $106,984 |
| 45 to 64 Years | 2,943 (45.3%) | $129,415 |
| 65+ Years | 1,924 (29.6%) | $68,246 |
| Total | 6,504 (100.0%) | $98,922 |
Poverty in Lake Ronkonkoma
Income Below Poverty by Sex and Age in Lake Ronkonkoma
With 9.0% poverty level for males and 7.9% for females among the residents of Lake Ronkonkoma, 15 year old males and under 5 year old females are the most vulnerable to poverty, with 70 males (40.7%) and 116 females (22.7%) in their respective age groups living below the poverty level.
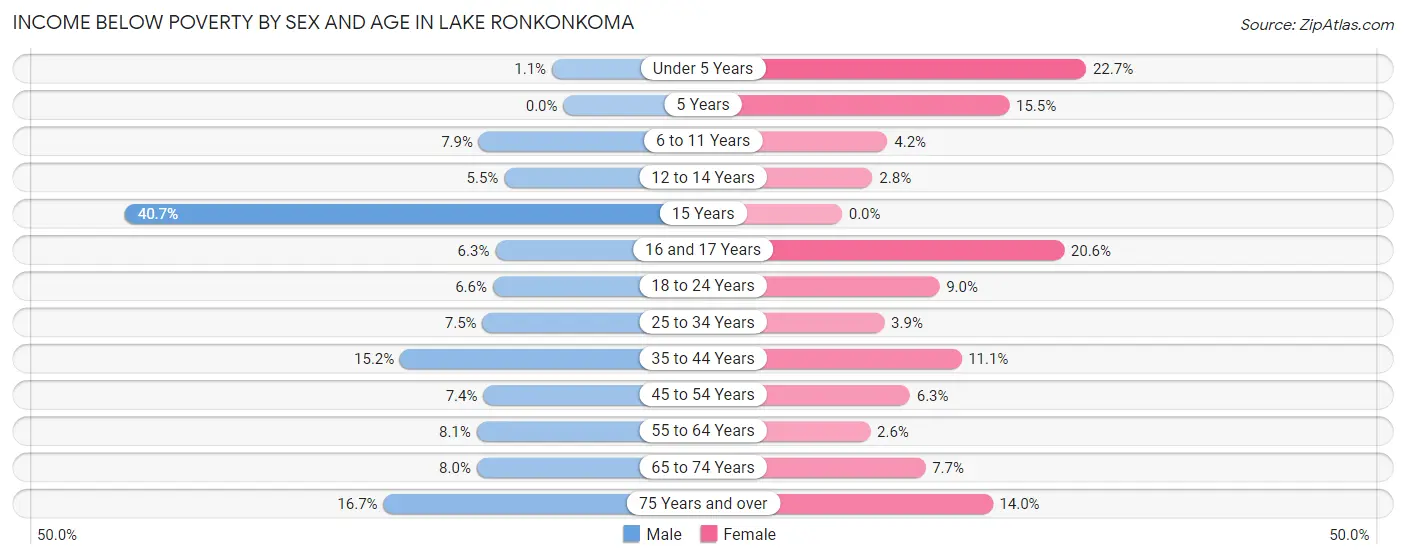
| Age Bracket | Male | Female |
| Under 5 Years | 4 (1.1%) | 116 (22.7%) |
| 5 Years | 0 (0.0%) | 18 (15.5%) |
| 6 to 11 Years | 42 (7.9%) | 31 (4.2%) |
| 12 to 14 Years | 20 (5.5%) | 12 (2.8%) |
| 15 Years | 70 (40.7%) | 0 (0.0%) |
| 16 and 17 Years | 16 (6.3%) | 27 (20.6%) |
| 18 to 24 Years | 39 (6.6%) | 87 (9.0%) |
| 25 to 34 Years | 84 (7.5%) | 43 (3.9%) |
| 35 to 44 Years | 140 (15.1%) | 118 (11.1%) |
| 45 to 54 Years | 99 (7.4%) | 92 (6.3%) |
| 55 to 64 Years | 124 (8.1%) | 32 (2.6%) |
| 65 to 74 Years | 75 (8.0%) | 84 (7.7%) |
| 75 Years and over | 79 (16.7%) | 91 (14.0%) |
| Total | 792 (9.0%) | 751 (7.9%) |
Income Above Poverty by Sex and Age in Lake Ronkonkoma
According to the poverty statistics in Lake Ronkonkoma, males aged 5 years and females aged 15 years are the age groups that are most secure financially, with 100.0% of males and 100.0% of females in these age groups living above the poverty line.
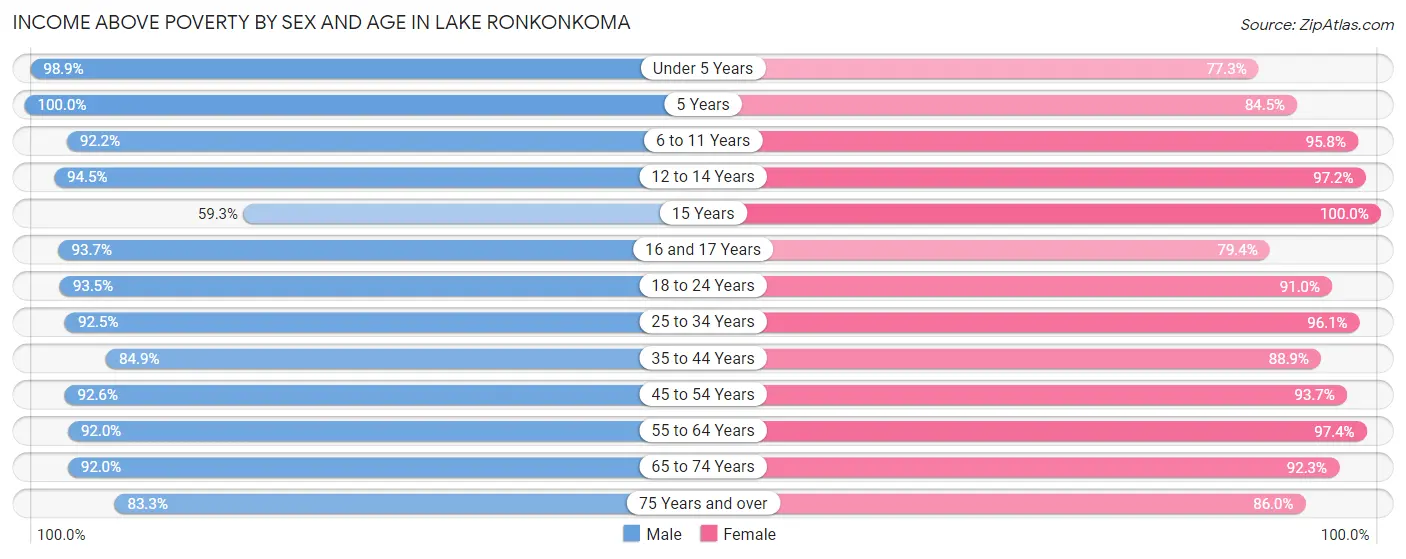
| Age Bracket | Male | Female |
| Under 5 Years | 375 (98.9%) | 396 (77.3%) |
| 5 Years | 144 (100.0%) | 98 (84.5%) |
| 6 to 11 Years | 493 (92.1%) | 701 (95.8%) |
| 12 to 14 Years | 344 (94.5%) | 411 (97.2%) |
| 15 Years | 102 (59.3%) | 50 (100.0%) |
| 16 and 17 Years | 237 (93.7%) | 104 (79.4%) |
| 18 to 24 Years | 556 (93.4%) | 875 (91.0%) |
| 25 to 34 Years | 1,035 (92.5%) | 1,051 (96.1%) |
| 35 to 44 Years | 784 (84.9%) | 947 (88.9%) |
| 45 to 54 Years | 1,234 (92.6%) | 1,366 (93.7%) |
| 55 to 64 Years | 1,416 (91.9%) | 1,187 (97.4%) |
| 65 to 74 Years | 858 (92.0%) | 1,001 (92.3%) |
| 75 Years and over | 394 (83.3%) | 560 (86.0%) |
| Total | 7,972 (91.0%) | 8,747 (92.1%) |
Income Below Poverty Among Married-Couple Families in Lake Ronkonkoma
The poverty statistics for married-couple families in Lake Ronkonkoma show that 2.5% or 81 of the total 3,221 families live below the poverty line. Families with 3 or 4 children have the highest poverty rate of 6.8%, comprising of 24 families. On the other hand, families with 1 or 2 children have the lowest poverty rate of 1.5%, which includes 17 families.
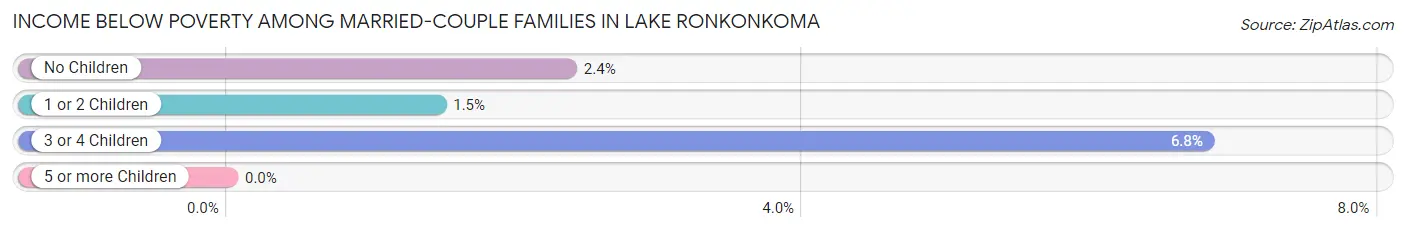
| Children | Above Poverty | Below Poverty |
| No Children | 1,657 (97.6%) | 40 (2.4%) |
| 1 or 2 Children | 1,154 (98.6%) | 17 (1.5%) |
| 3 or 4 Children | 329 (93.2%) | 24 (6.8%) |
| 5 or more Children | 0 (0.0%) | 0 (0.0%) |
| Total | 3,140 (97.5%) | 81 (2.5%) |
Income Below Poverty Among Single-Parent Households in Lake Ronkonkoma
According to the poverty data in Lake Ronkonkoma, 13.3% or 41 single-father households and 19.5% or 135 single-mother households are living below the poverty line. Among single-father households, those with no children have the highest poverty rate, with 41 households (21.2%) experiencing poverty. Likewise, among single-mother households, those with 3 or 4 children have the highest poverty rate, with 18 households (43.9%) falling below the poverty line.
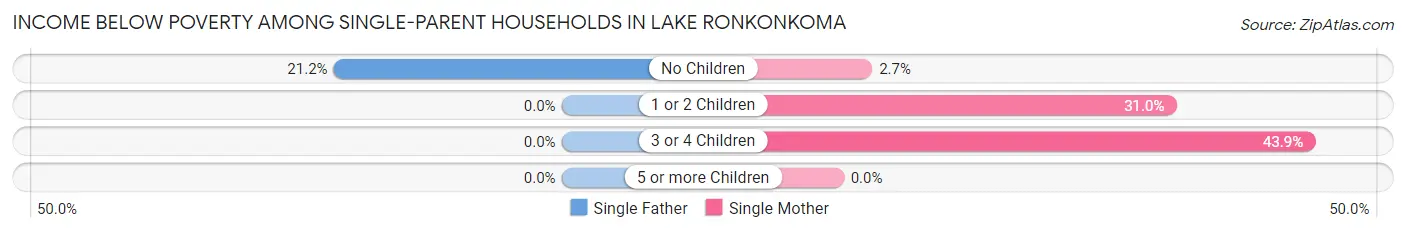
| Children | Single Father | Single Mother |
| No Children | 41 (21.2%) | 8 (2.7%) |
| 1 or 2 Children | 0 (0.0%) | 109 (31.0%) |
| 3 or 4 Children | 0 (0.0%) | 18 (43.9%) |
| 5 or more Children | 0 (0.0%) | 0 (0.0%) |
| Total | 41 (13.3%) | 135 (19.5%) |
Income Below Poverty Among Married-Couple vs Single-Parent Households in Lake Ronkonkoma
The poverty data for Lake Ronkonkoma shows that 81 of the married-couple family households (2.5%) and 176 of the single-parent households (17.5%) are living below the poverty level. Within the married-couple family households, those with 3 or 4 children have the highest poverty rate, with 24 households (6.8%) falling below the poverty line. Among the single-parent households, those with 3 or 4 children have the highest poverty rate, with 18 household (43.9%) living below poverty.
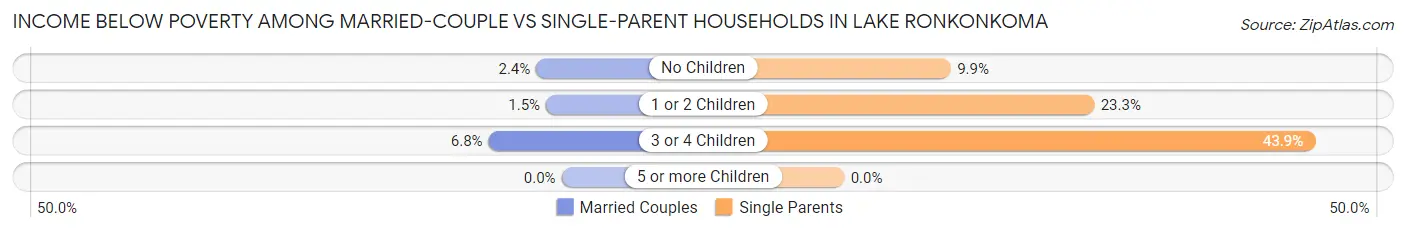
| Children | Married-Couple Families | Single-Parent Households |
| No Children | 40 (2.4%) | 49 (9.9%) |
| 1 or 2 Children | 17 (1.5%) | 109 (23.3%) |
| 3 or 4 Children | 24 (6.8%) | 18 (43.9%) |
| 5 or more Children | 0 (0.0%) | 0 (0.0%) |
| Total | 81 (2.5%) | 176 (17.5%) |
Race in Lake Ronkonkoma
The most populous races in Lake Ronkonkoma are White / Caucasian (15,078 | 82.2%), Hispanic or Latino (2,852 | 15.5%), and Two or more Races (1,365 | 7.4%).
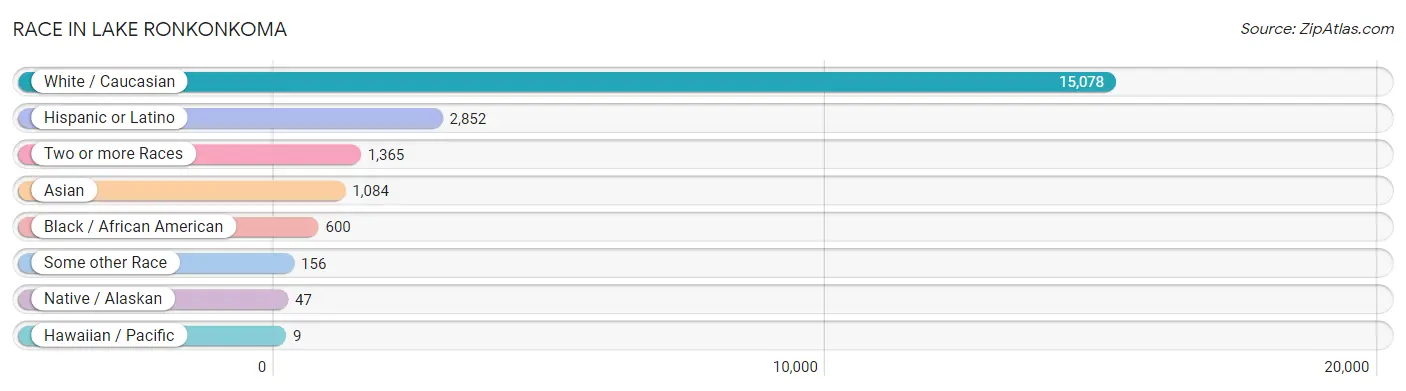
| Race | # Population | % Population |
| Asian | 1,084 | 5.9% |
| Black / African American | 600 | 3.3% |
| Hawaiian / Pacific | 9 | 0.1% |
| Hispanic or Latino | 2,852 | 15.5% |
| Native / Alaskan | 47 | 0.3% |
| White / Caucasian | 15,078 | 82.2% |
| Two or more Races | 1,365 | 7.4% |
| Some other Race | 156 | 0.9% |
| Total | 18,339 | 100.0% |
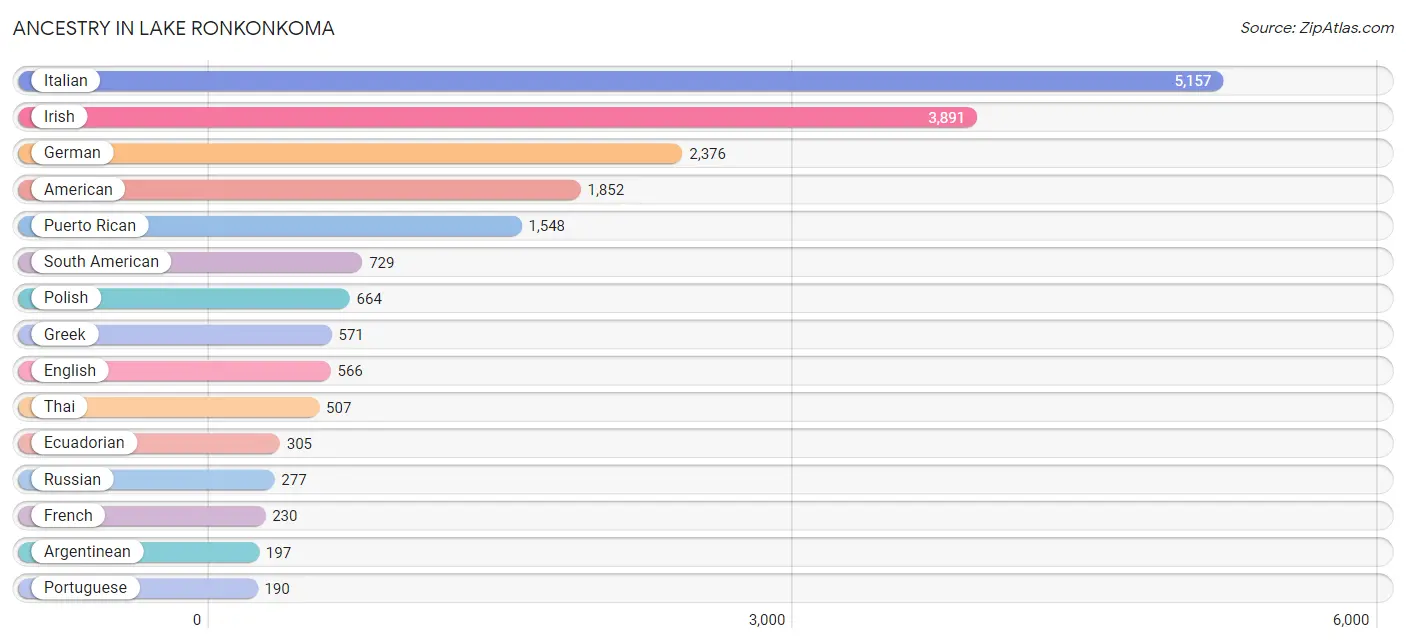
Ancestry in Lake Ronkonkoma
The most populous ancestries reported in Lake Ronkonkoma are Italian (5,157 | 28.1%), Irish (3,891 | 21.2%), German (2,376 | 13.0%), American (1,852 | 10.1%), and Puerto Rican (1,548 | 8.4%), together accounting for 80.8% of all Lake Ronkonkoma residents.
| Ancestry | # Population | % Population |
| Afghan | 13 | 0.1% |
| African | 75 | 0.4% |
| American | 1,852 | 10.1% |
| Argentinean | 197 | 1.1% |
| Austrian | 46 | 0.3% |
| Brazilian | 9 | 0.1% |
| British | 23 | 0.1% |
| Burmese | 50 | 0.3% |
| Central American | 175 | 0.9% |
| Central American Indian | 27 | 0.2% |
| Colombian | 170 | 0.9% |
| Costa Rican | 14 | 0.1% |
| Cuban | 6 | 0.0% |
| Cypriot | 11 | 0.1% |
| Czech | 32 | 0.2% |
| Danish | 45 | 0.3% |
| Dominican | 39 | 0.2% |
| Dutch | 78 | 0.4% |
| Eastern European | 61 | 0.3% |
| Ecuadorian | 305 | 1.7% |
| English | 566 | 3.1% |
| European | 57 | 0.3% |
| Finnish | 5 | 0.0% |
| French | 230 | 1.3% |
| French Canadian | 20 | 0.1% |
| German | 2,376 | 13.0% |
| Greek | 571 | 3.1% |
| Guatemalan | 86 | 0.5% |
| Haitian | 82 | 0.4% |
| Honduran | 28 | 0.2% |
| Hungarian | 31 | 0.2% |
| Indian (Asian) | 44 | 0.2% |
| Irish | 3,891 | 21.2% |
| Israeli | 27 | 0.2% |
| Italian | 5,157 | 28.1% |
| Jamaican | 19 | 0.1% |
| Korean | 175 | 0.9% |
| Lithuanian | 33 | 0.2% |
| Mexican | 147 | 0.8% |
| Mexican American Indian | 31 | 0.2% |
| Native Hawaiian | 9 | 0.1% |
| Nigerian | 4 | 0.0% |
| Norwegian | 49 | 0.3% |
| Panamanian | 2 | 0.0% |
| Peruvian | 5 | 0.0% |
| Polish | 664 | 3.6% |
| Portuguese | 190 | 1.0% |
| Puerto Rican | 1,548 | 8.4% |
| Romanian | 26 | 0.1% |
| Russian | 277 | 1.5% |
| Salvadoran | 45 | 0.3% |
| Scotch-Irish | 2 | 0.0% |
| Scottish | 34 | 0.2% |
| Slavic | 9 | 0.1% |
| South American | 729 | 4.0% |
| South American Indian | 1 | 0.0% |
| Spaniard | 9 | 0.1% |
| Spanish | 28 | 0.2% |
| Sri Lankan | 25 | 0.1% |
| Subsaharan African | 79 | 0.4% |
| Swedish | 98 | 0.5% |
| Swiss | 8 | 0.0% |
| Thai | 507 | 2.8% |
| Turkish | 27 | 0.2% |
| Ukrainian | 57 | 0.3% |
| Uruguayan | 52 | 0.3% |
| Vietnamese | 87 | 0.5% | View All 67 Rows |
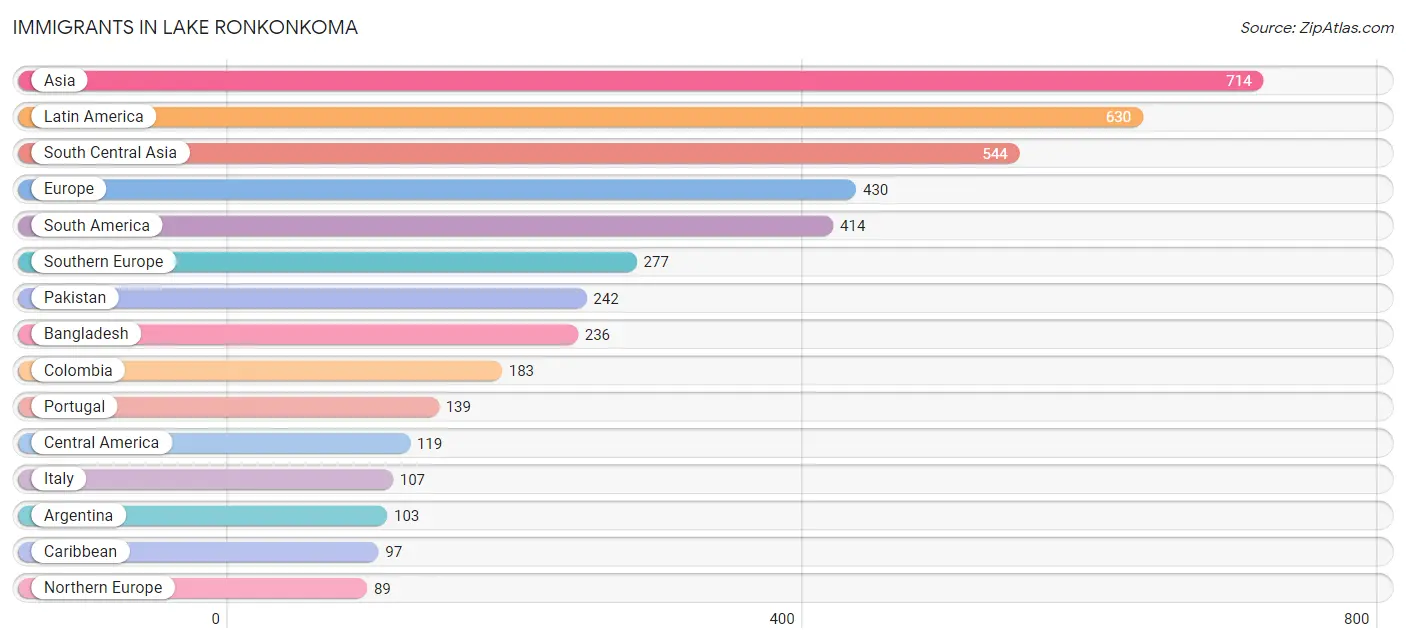
Immigrants in Lake Ronkonkoma
The most numerous immigrant groups reported in Lake Ronkonkoma came from Asia (714 | 3.9%), Latin America (630 | 3.4%), South Central Asia (544 | 3.0%), Europe (430 | 2.3%), and South America (414 | 2.3%), together accounting for 14.9% of all Lake Ronkonkoma residents.
| Immigration Origin | # Population | % Population |
| Afghanistan | 13 | 0.1% |
| Africa | 50 | 0.3% |
| Argentina | 103 | 0.6% |
| Asia | 714 | 3.9% |
| Bangladesh | 236 | 1.3% |
| Brazil | 42 | 0.2% |
| Canada | 25 | 0.1% |
| Caribbean | 97 | 0.5% |
| Central America | 119 | 0.6% |
| Chile | 7 | 0.0% |
| China | 50 | 0.3% |
| Colombia | 183 | 1.0% |
| Costa Rica | 12 | 0.1% |
| Dominican Republic | 25 | 0.1% |
| Eastern Africa | 46 | 0.3% |
| Eastern Asia | 60 | 0.3% |
| Eastern Europe | 30 | 0.2% |
| Ecuador | 22 | 0.1% |
| El Salvador | 7 | 0.0% |
| England | 6 | 0.0% |
| Europe | 430 | 2.3% |
| Germany | 34 | 0.2% |
| Greece | 31 | 0.2% |
| Guatemala | 35 | 0.2% |
| Haiti | 49 | 0.3% |
| Honduras | 21 | 0.1% |
| India | 52 | 0.3% |
| Israel | 27 | 0.2% |
| Italy | 107 | 0.6% |
| Kenya | 26 | 0.1% |
| Korea | 10 | 0.1% |
| Latin America | 630 | 3.4% |
| Mexico | 42 | 0.2% |
| Nigeria | 4 | 0.0% |
| Northern Europe | 89 | 0.5% |
| Pakistan | 242 | 1.3% |
| Panama | 2 | 0.0% |
| Peru | 1 | 0.0% |
| Philippines | 26 | 0.1% |
| Portugal | 139 | 0.8% |
| Russia | 30 | 0.2% |
| Scotland | 2 | 0.0% |
| South America | 414 | 2.3% |
| South Central Asia | 544 | 3.0% |
| South Eastern Asia | 47 | 0.3% |
| Southern Europe | 277 | 1.5% |
| Sri Lanka | 1 | 0.0% |
| Taiwan | 13 | 0.1% |
| Trinidad and Tobago | 23 | 0.1% |
| Turkey | 30 | 0.2% |
| Uruguay | 52 | 0.3% |
| Venezuela | 4 | 0.0% |
| Vietnam | 21 | 0.1% |
| Western Africa | 4 | 0.0% |
| Western Asia | 63 | 0.3% |
| Western Europe | 34 | 0.2% | View All 56 Rows |
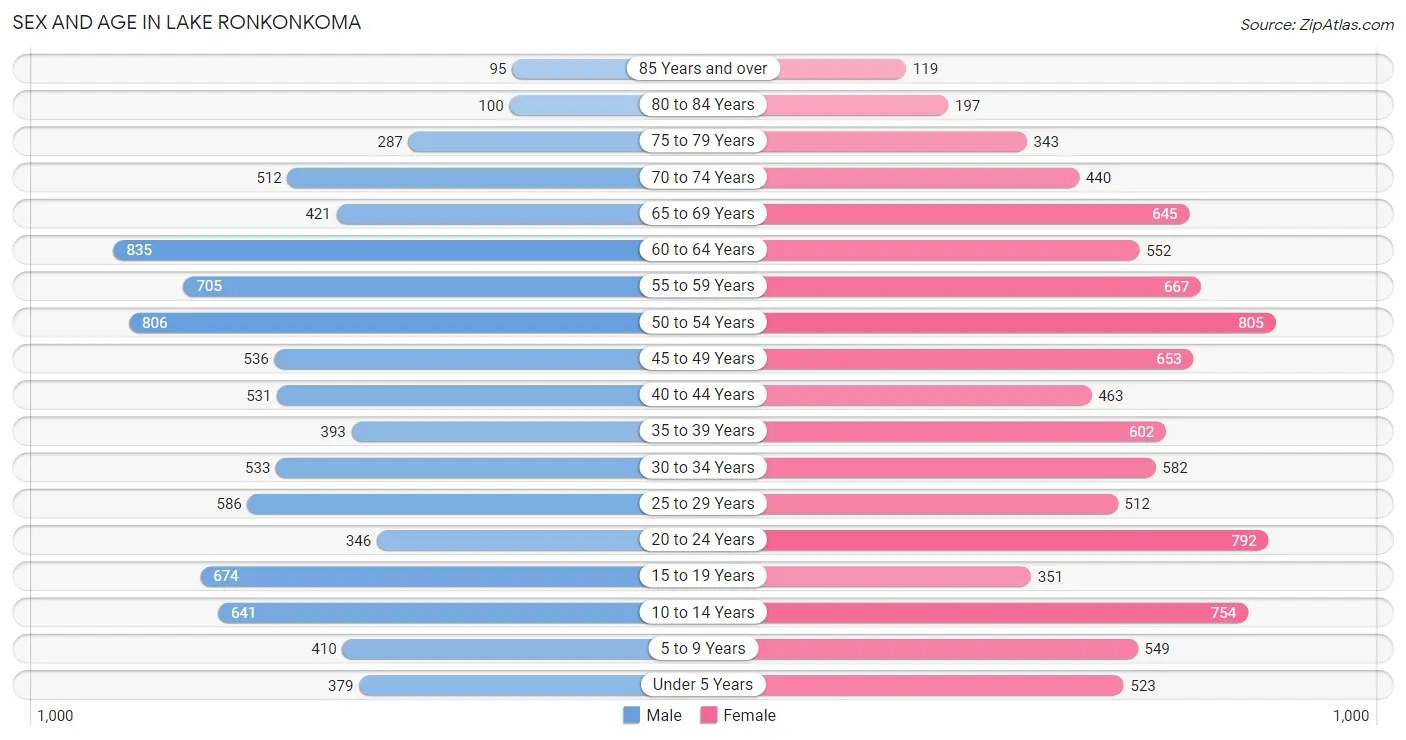
Sex and Age in Lake Ronkonkoma
Sex and Age in Lake Ronkonkoma
The most populous age groups in Lake Ronkonkoma are 60 to 64 Years (835 | 9.5%) for men and 50 to 54 Years (805 | 8.4%) for women.
| Age Bracket | Male | Female |
| Under 5 Years | 379 (4.3%) | 523 (5.5%) |
| 5 to 9 Years | 410 (4.7%) | 549 (5.8%) |
| 10 to 14 Years | 641 (7.3%) | 754 (7.9%) |
| 15 to 19 Years | 674 (7.7%) | 351 (3.7%) |
| 20 to 24 Years | 346 (3.9%) | 792 (8.3%) |
| 25 to 29 Years | 586 (6.7%) | 512 (5.4%) |
| 30 to 34 Years | 533 (6.1%) | 582 (6.1%) |
| 35 to 39 Years | 393 (4.5%) | 602 (6.3%) |
| 40 to 44 Years | 531 (6.0%) | 463 (4.9%) |
| 45 to 49 Years | 536 (6.1%) | 653 (6.8%) |
| 50 to 54 Years | 806 (9.2%) | 805 (8.4%) |
| 55 to 59 Years | 705 (8.0%) | 667 (7.0%) |
| 60 to 64 Years | 835 (9.5%) | 552 (5.8%) |
| 65 to 69 Years | 421 (4.8%) | 645 (6.8%) |
| 70 to 74 Years | 512 (5.8%) | 440 (4.6%) |
| 75 to 79 Years | 287 (3.3%) | 343 (3.6%) |
| 80 to 84 Years | 100 (1.1%) | 197 (2.1%) |
| 85 Years and over | 95 (1.1%) | 119 (1.3%) |
| Total | 8,790 (100.0%) | 9,549 (100.0%) |
Families and Households in Lake Ronkonkoma
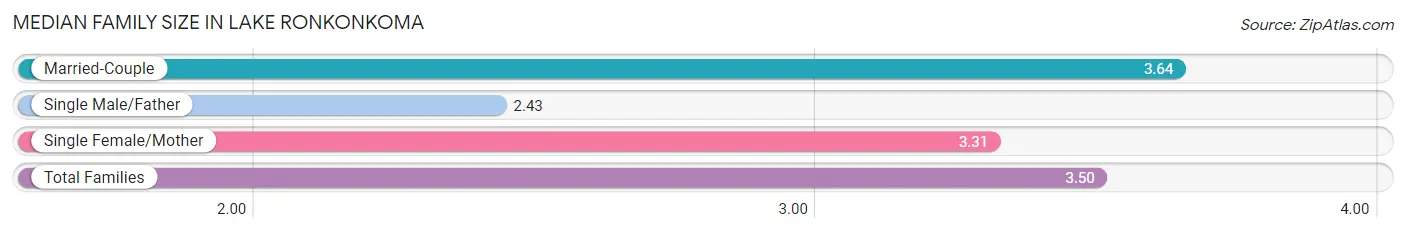
Median Family Size in Lake Ronkonkoma
The median family size in Lake Ronkonkoma is 3.50 persons per family, with married-couple families (3,221 | 76.2%) accounting for the largest median family size of 3.64 persons per family. On the other hand, single male/father families (309 | 7.3%) represent the smallest median family size with 2.43 persons per family.
| Family Type | # Families | Family Size |
| Married-Couple | 3,221 (76.2%) | 3.64 |
| Single Male/Father | 309 (7.3%) | 2.43 |
| Single Female/Mother | 694 (16.4%) | 3.31 |
| Total Families | 4,224 (100.0%) | 3.50 |
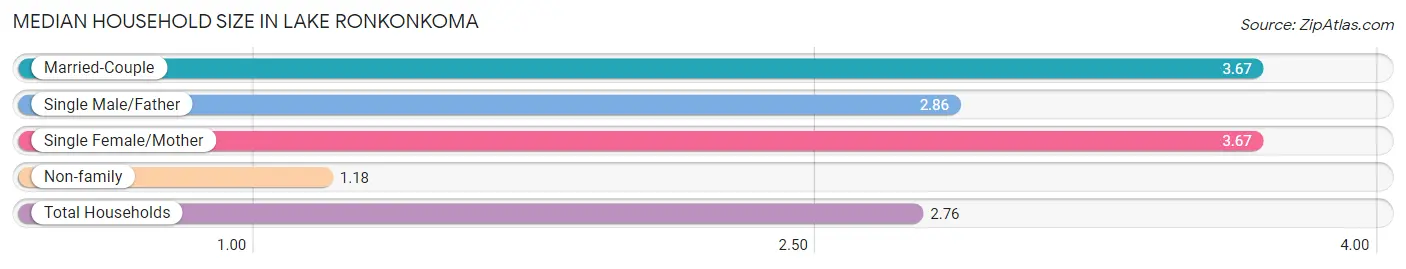
Median Household Size in Lake Ronkonkoma
The median household size in Lake Ronkonkoma is 2.76 persons per household, with married-couple households (3,221 | 49.5%) accounting for the largest median household size of 3.67 persons per household. non-family households (2,280 | 35.1%) represent the smallest median household size with 1.18 persons per household.
| Household Type | # Households | Household Size |
| Married-Couple | 3,221 (49.5%) | 3.67 |
| Single Male/Father | 309 (4.8%) | 2.86 |
| Single Female/Mother | 694 (10.7%) | 3.67 |
| Non-family | 2,280 (35.1%) | 1.18 |
| Total Households | 6,504 (100.0%) | 2.76 |
Household Size by Marriage Status in Lake Ronkonkoma
Out of a total of 6,504 households in Lake Ronkonkoma, 4,224 (64.9%) are family households, while 2,280 (35.1%) are nonfamily households. The most numerous type of family households are 2-person households, comprising 1,428, and the most common type of nonfamily households are 1-person households, comprising 1,937.
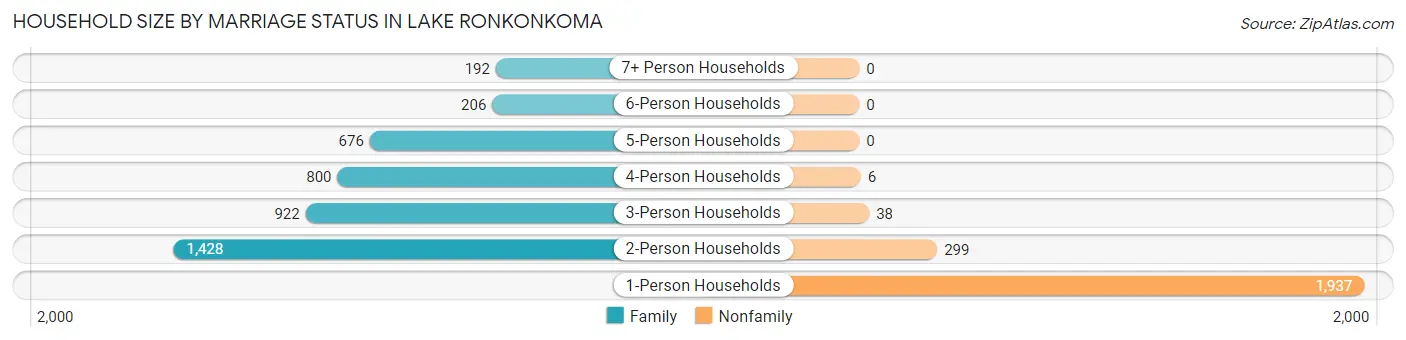
| Household Size | Family Households | Nonfamily Households |
| 1-Person Households | - | 1,937 (29.8%) |
| 2-Person Households | 1,428 (22.0%) | 299 (4.6%) |
| 3-Person Households | 922 (14.2%) | 38 (0.6%) |
| 4-Person Households | 800 (12.3%) | 6 (0.1%) |
| 5-Person Households | 676 (10.4%) | 0 (0.0%) |
| 6-Person Households | 206 (3.2%) | 0 (0.0%) |
| 7+ Person Households | 192 (2.9%) | 0 (0.0%) |
| Total | 4,224 (64.9%) | 2,280 (35.1%) |
Female Fertility in Lake Ronkonkoma
Fertility by Age in Lake Ronkonkoma
Average fertility rate in Lake Ronkonkoma is 34.0 births per 1,000 women. Women in the age bracket of 20 to 34 years have the highest fertility rate with 50.0 births per 1,000 women. Women in the age bracket of 20 to 34 years acount for 68.1% of all women with births.
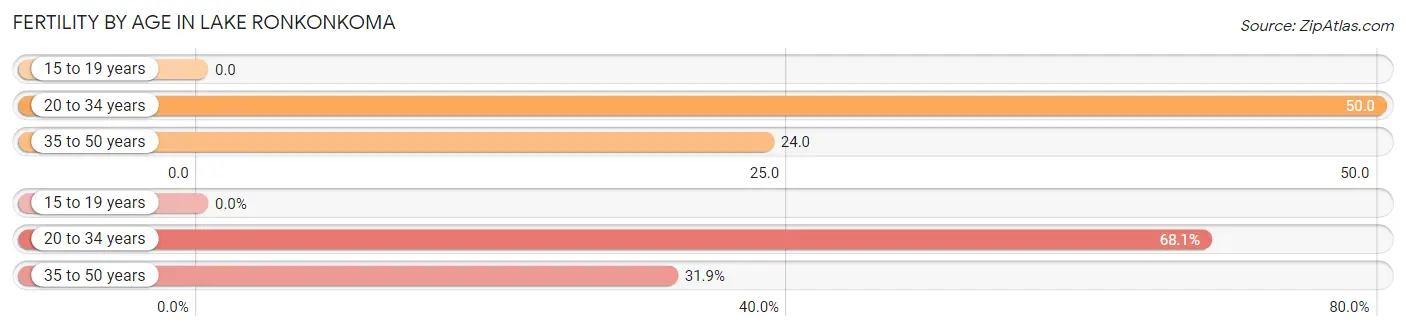
| Age Bracket | Women with Births | Births / 1,000 Women |
| 15 to 19 years | 0 (0.0%) | 0.0 |
| 20 to 34 years | 94 (68.1%) | 50.0 |
| 35 to 50 years | 44 (31.9%) | 24.0 |
| Total | 138 (100.0%) | 34.0 |
Fertility by Age by Marriage Status in Lake Ronkonkoma
80.4% of women with births (138) in Lake Ronkonkoma are married. The highest percentage of unmarried women with births falls into 20 to 34 years age bracket with 28.7% of them unmarried at the time of birth, while the lowest percentage of unmarried women with births belong to 35 to 50 years age bracket with 0.0% of them unmarried.
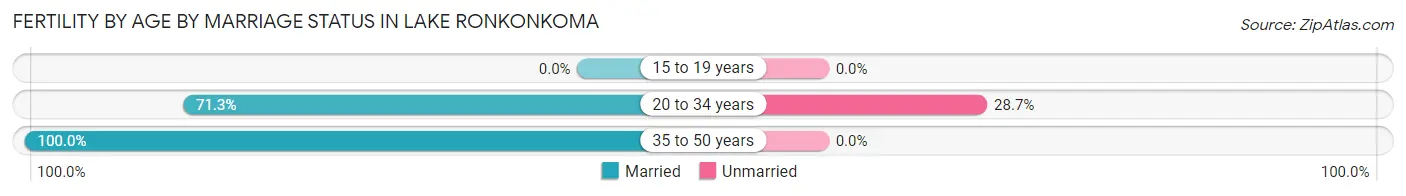
| Age Bracket | Married | Unmarried |
| 15 to 19 years | 0 (0.0%) | 0 (0.0%) |
| 20 to 34 years | 67 (71.3%) | 27 (28.7%) |
| 35 to 50 years | 44 (100.0%) | 0 (0.0%) |
| Total | 111 (80.4%) | 27 (19.6%) |
Fertility by Education in Lake Ronkonkoma
Average fertility rate in Lake Ronkonkoma is 34.0 births per 1,000 women. Women with the education attainment of graduate degree have the highest fertility rate of 81.0 births per 1,000 women, while women with the education attainment of high school diploma have the lowest fertility at 9.0 births per 1,000 women. Women with the education attainment of graduate degree represent 36.2% of all women with births.
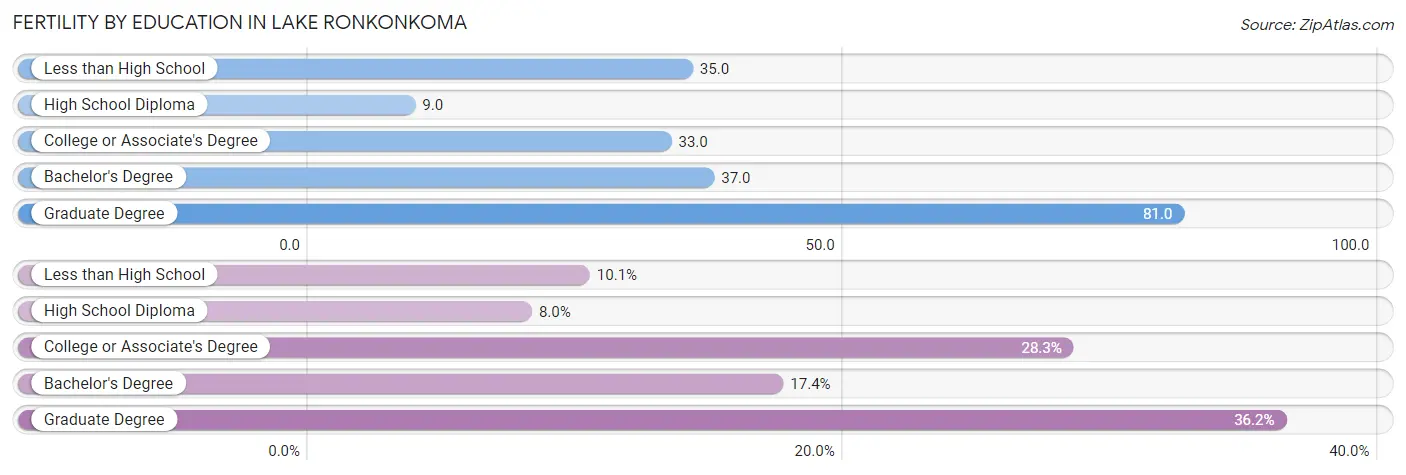
| Educational Attainment | Women with Births | Births / 1,000 Women |
| Less than High School | 14 (10.1%) | 35.0 |
| High School Diploma | 11 (8.0%) | 9.0 |
| College or Associate's Degree | 39 (28.3%) | 33.0 |
| Bachelor's Degree | 24 (17.4%) | 37.0 |
| Graduate Degree | 50 (36.2%) | 81.0 |
| Total | 138 (100.0%) | 34.0 |
Fertility by Education by Marriage Status in Lake Ronkonkoma
19.6% of women with births in Lake Ronkonkoma are unmarried. Women with the educational attainment of bachelor's degree are most likely to be married with 100.0% of them married at childbirth, while women with the educational attainment of high school diploma are least likely to be married with 72.7% of them unmarried at childbirth.
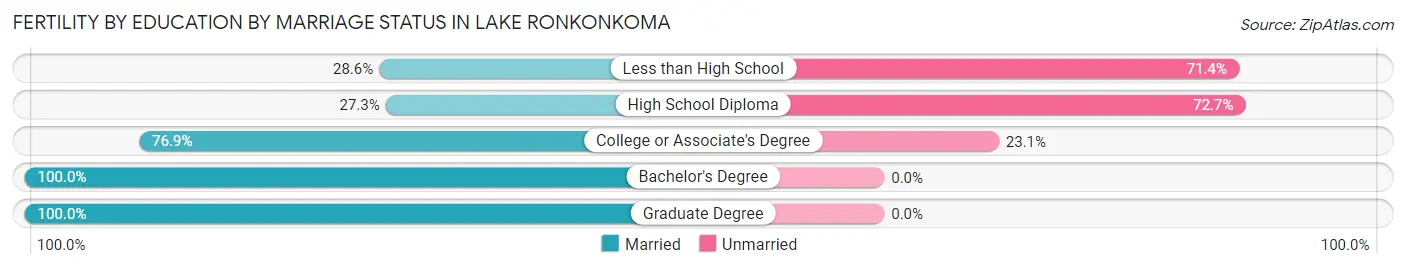
| Educational Attainment | Married | Unmarried |
| Less than High School | 4 (28.6%) | 10 (71.4%) |
| High School Diploma | 3 (27.3%) | 8 (72.7%) |
| College or Associate's Degree | 30 (76.9%) | 9 (23.1%) |
| Bachelor's Degree | 24 (100.0%) | 0 (0.0%) |
| Graduate Degree | 50 (100.0%) | 0 (0.0%) |
| Total | 111 (80.4%) | 27 (19.6%) |
Employment Characteristics in Lake Ronkonkoma
Employment by Class of Employer in Lake Ronkonkoma
Among the 8,884 employed individuals in Lake Ronkonkoma, private company employees (6,124 | 68.9%), local government employees (928 | 10.4%), and not-for-profit organizations (587 | 6.6%) make up the most common classes of employment.
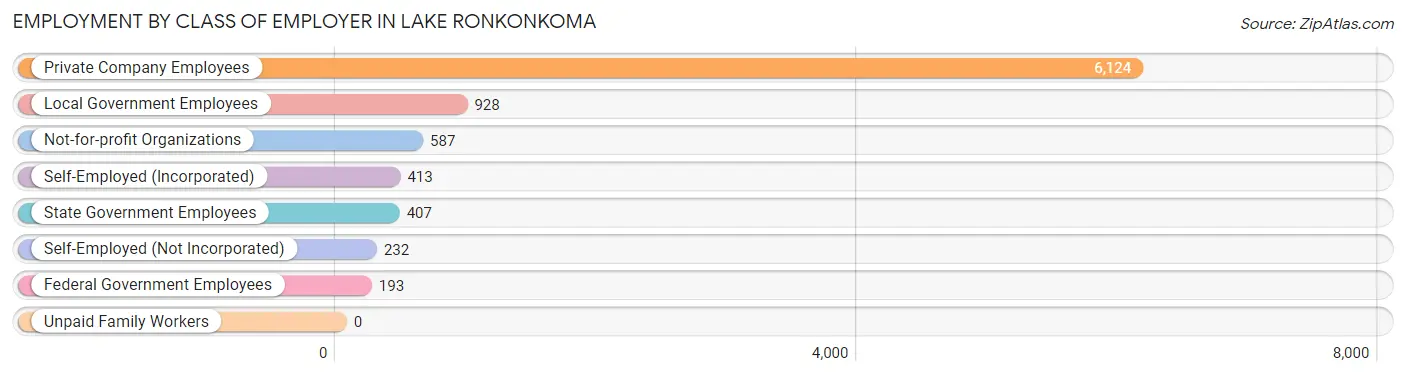
| Employer Class | # Employees | % Employees |
| Private Company Employees | 6,124 | 68.9% |
| Self-Employed (Incorporated) | 413 | 4.6% |
| Self-Employed (Not Incorporated) | 232 | 2.6% |
| Not-for-profit Organizations | 587 | 6.6% |
| Local Government Employees | 928 | 10.4% |
| State Government Employees | 407 | 4.6% |
| Federal Government Employees | 193 | 2.2% |
| Unpaid Family Workers | 0 | 0.0% |
| Total | 8,884 | 100.0% |
Employment Status by Age in Lake Ronkonkoma
According to the labor force statistics for Lake Ronkonkoma, out of the total population over 16 years of age (14,861), 66.8% or 9,927 individuals are in the labor force, with 5.8% or 576 of them unemployed. The age group with the highest labor force participation rate is 35 to 44 years, with 90.1% or 1,792 individuals in the labor force. Within the labor force, the 16 to 19 years age range has the highest percentage of unemployed individuals, with 15.8% or 55 of them being unemployed.
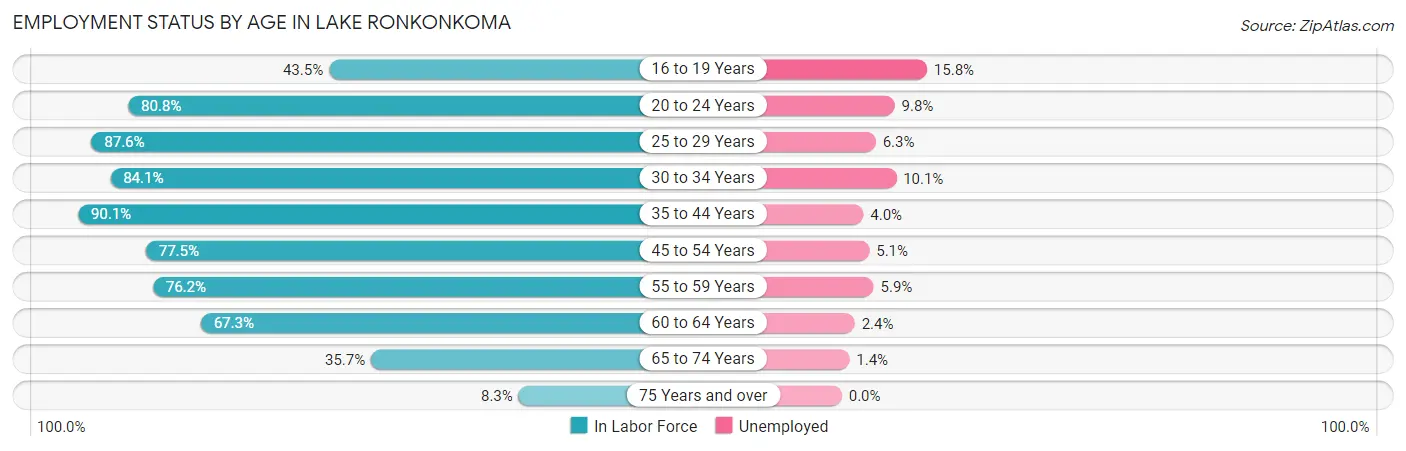
| Age Bracket | In Labor Force | Unemployed |
| 16 to 19 Years | 349 (43.5%) | 55 (15.8%) |
| 20 to 24 Years | 920 (80.8%) | 90 (9.8%) |
| 25 to 29 Years | 962 (87.6%) | 61 (6.3%) |
| 30 to 34 Years | 938 (84.1%) | 95 (10.1%) |
| 35 to 44 Years | 1,792 (90.1%) | 72 (4.0%) |
| 45 to 54 Years | 2,170 (77.5%) | 111 (5.1%) |
| 55 to 59 Years | 1,045 (76.2%) | 62 (5.9%) |
| 60 to 64 Years | 933 (67.3%) | 22 (2.4%) |
| 65 to 74 Years | 720 (35.7%) | 10 (1.4%) |
| 75 Years and over | 95 (8.3%) | 0 (0.0%) |
| Total | 9,927 (66.8%) | 576 (5.8%) |
Employment Status by Educational Attainment in Lake Ronkonkoma
According to labor force statistics for Lake Ronkonkoma, 80.3% of individuals (7,838) out of the total population between 25 and 64 years of age (9,761) are in the labor force, with 5.4% or 423 of them being unemployed. The group with the highest labor force participation rate are those with the educational attainment of bachelor's degree or higher, with 88.9% or 2,675 individuals in the labor force. Within the labor force, individuals with high school diploma education have the highest percentage of unemployment, with 11.3% or 283 of them being unemployed.
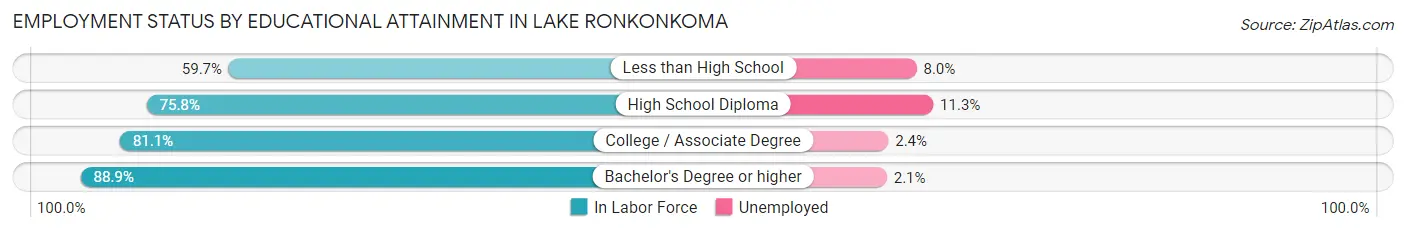
| Educational Attainment | In Labor Force | Unemployed |
| Less than High School | 376 (59.7%) | 50 (8.0%) |
| High School Diploma | 2,504 (75.8%) | 373 (11.3%) |
| College / Associate Degree | 2,286 (81.1%) | 68 (2.4%) |
| Bachelor's Degree or higher | 2,675 (88.9%) | 63 (2.1%) |
| Total | 7,838 (80.3%) | 527 (5.4%) |
Employment Occupations by Sex in Lake Ronkonkoma
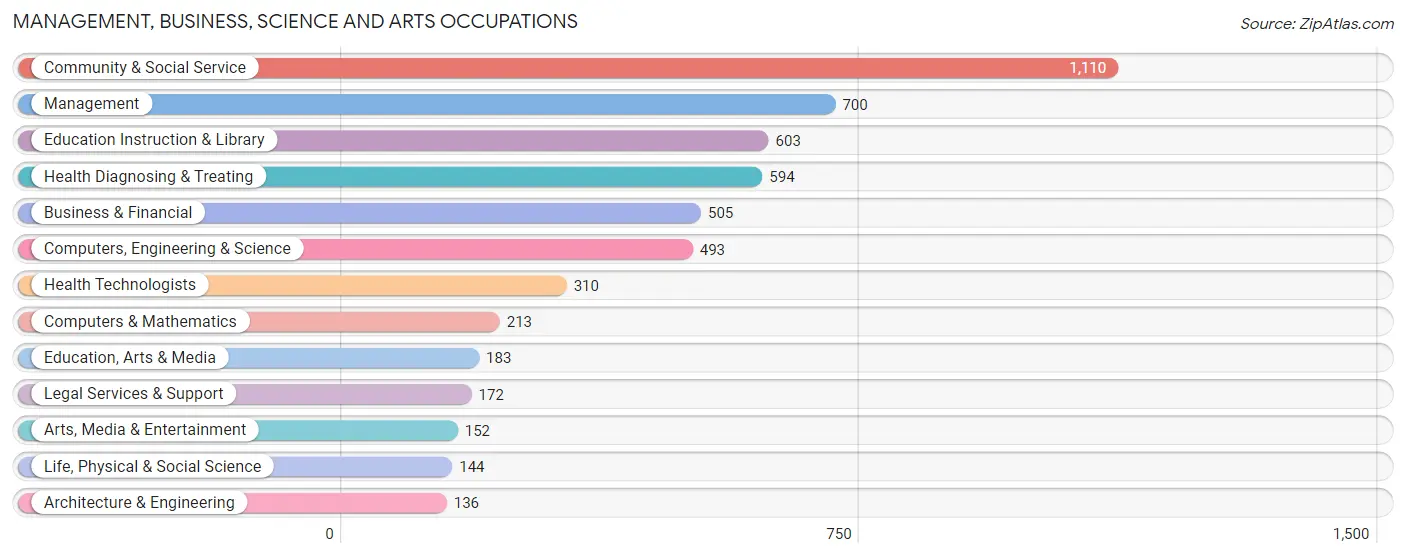
Management, Business, Science and Arts Occupations
The most common Management, Business, Science and Arts occupations in Lake Ronkonkoma are Community & Social Service (1,110 | 11.9%), Management (700 | 7.5%), Education Instruction & Library (603 | 6.5%), Health Diagnosing & Treating (594 | 6.4%), and Business & Financial (505 | 5.4%).
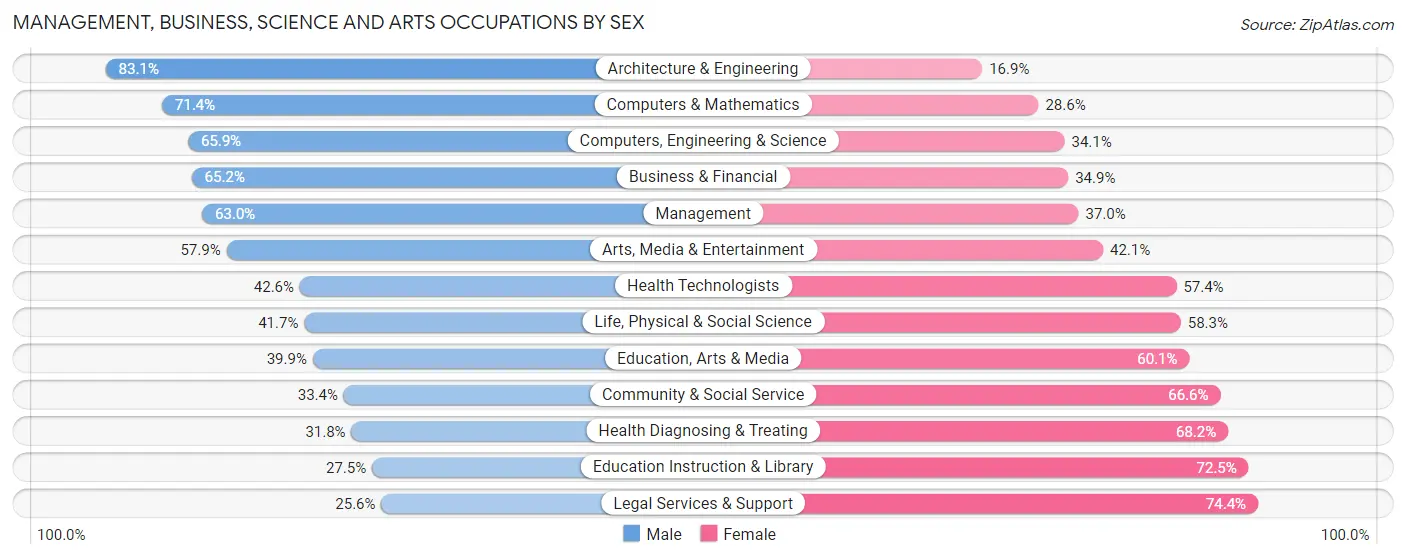
Management, Business, Science and Arts Occupations by Sex
Within the Management, Business, Science and Arts occupations in Lake Ronkonkoma, the most male-oriented occupations are Architecture & Engineering (83.1%), Computers & Mathematics (71.4%), and Computers, Engineering & Science (65.9%), while the most female-oriented occupations are Legal Services & Support (74.4%), Education Instruction & Library (72.5%), and Health Diagnosing & Treating (68.2%).
| Occupation | Male | Female |
| Management | 441 (63.0%) | 259 (37.0%) |
| Business & Financial | 329 (65.1%) | 176 (34.8%) |
| Computers, Engineering & Science | 325 (65.9%) | 168 (34.1%) |
| Computers & Mathematics | 152 (71.4%) | 61 (28.6%) |
| Architecture & Engineering | 113 (83.1%) | 23 (16.9%) |
| Life, Physical & Social Science | 60 (41.7%) | 84 (58.3%) |
| Community & Social Service | 371 (33.4%) | 739 (66.6%) |
| Education, Arts & Media | 73 (39.9%) | 110 (60.1%) |
| Legal Services & Support | 44 (25.6%) | 128 (74.4%) |
| Education Instruction & Library | 166 (27.5%) | 437 (72.5%) |
| Arts, Media & Entertainment | 88 (57.9%) | 64 (42.1%) |
| Health Diagnosing & Treating | 189 (31.8%) | 405 (68.2%) |
| Health Technologists | 132 (42.6%) | 178 (57.4%) |
| Total (Category) | 1,655 (48.6%) | 1,747 (51.3%) |
| Total (Overall) | 4,704 (50.3%) | 4,643 (49.7%) |
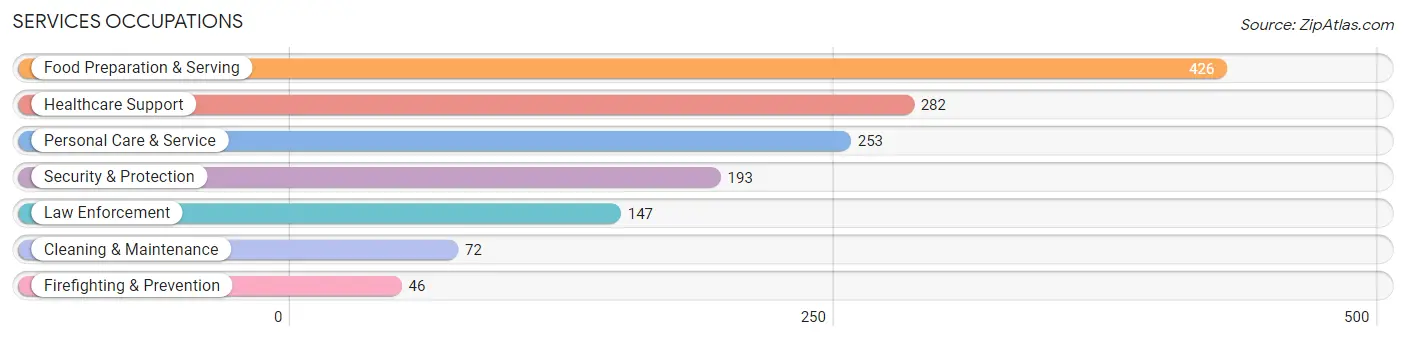
Services Occupations
The most common Services occupations in Lake Ronkonkoma are Food Preparation & Serving (426 | 4.6%), Healthcare Support (282 | 3.0%), Personal Care & Service (253 | 2.7%), Security & Protection (193 | 2.1%), and Law Enforcement (147 | 1.6%).
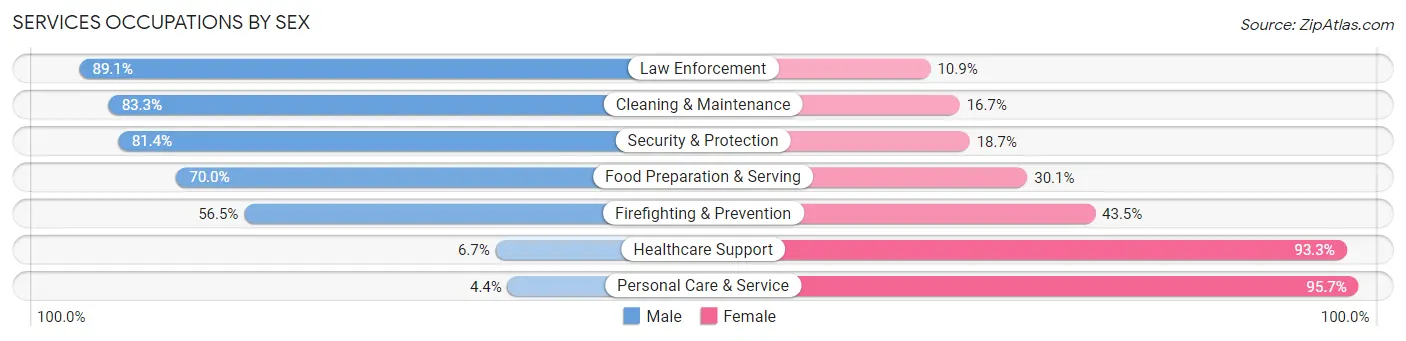
Services Occupations by Sex
Within the Services occupations in Lake Ronkonkoma, the most male-oriented occupations are Law Enforcement (89.1%), Cleaning & Maintenance (83.3%), and Security & Protection (81.4%), while the most female-oriented occupations are Personal Care & Service (95.7%), Healthcare Support (93.3%), and Firefighting & Prevention (43.5%).
| Occupation | Male | Female |
| Healthcare Support | 19 (6.7%) | 263 (93.3%) |
| Security & Protection | 157 (81.4%) | 36 (18.6%) |
| Firefighting & Prevention | 26 (56.5%) | 20 (43.5%) |
| Law Enforcement | 131 (89.1%) | 16 (10.9%) |
| Food Preparation & Serving | 298 (70.0%) | 128 (30.0%) |
| Cleaning & Maintenance | 60 (83.3%) | 12 (16.7%) |
| Personal Care & Service | 11 (4.3%) | 242 (95.7%) |
| Total (Category) | 545 (44.5%) | 681 (55.5%) |
| Total (Overall) | 4,704 (50.3%) | 4,643 (49.7%) |
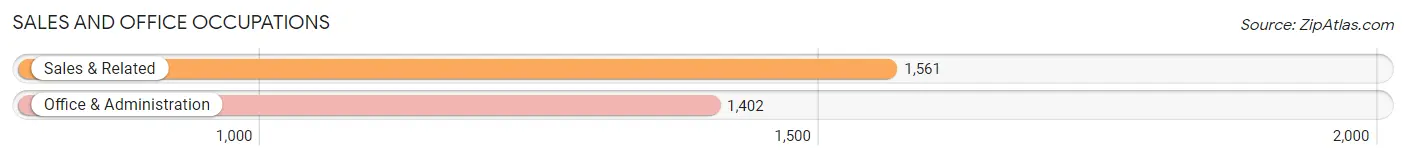
Sales and Office Occupations
The most common Sales and Office occupations in Lake Ronkonkoma are Sales & Related (1,561 | 16.7%), and Office & Administration (1,402 | 15.0%).
Sales and Office Occupations by Sex
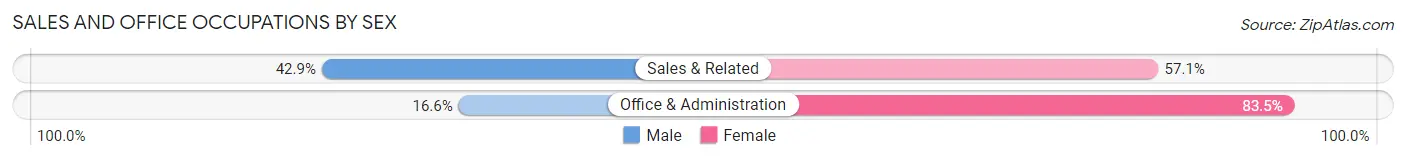
| Occupation | Male | Female |
| Sales & Related | 669 (42.9%) | 892 (57.1%) |
| Office & Administration | 232 (16.6%) | 1,170 (83.5%) |
| Total (Category) | 901 (30.4%) | 2,062 (69.6%) |
| Total (Overall) | 4,704 (50.3%) | 4,643 (49.7%) |
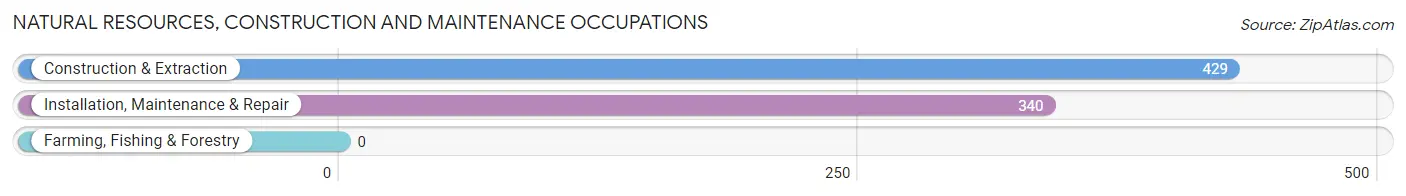
Natural Resources, Construction and Maintenance Occupations
The most common Natural Resources, Construction and Maintenance occupations in Lake Ronkonkoma are Construction & Extraction (429 | 4.6%), and Installation, Maintenance & Repair (340 | 3.6%).
Natural Resources, Construction and Maintenance Occupations by Sex
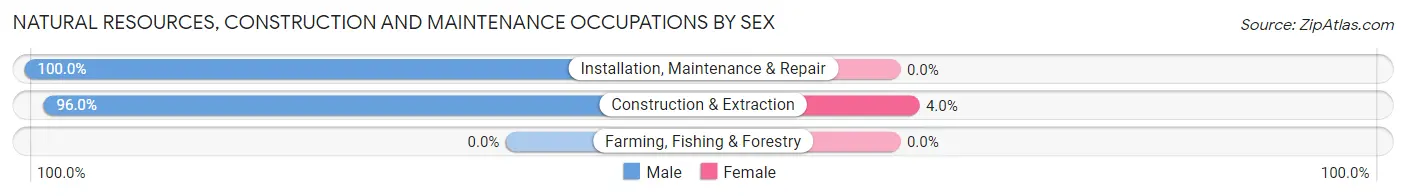
| Occupation | Male | Female |
| Farming, Fishing & Forestry | 0 (0.0%) | 0 (0.0%) |
| Construction & Extraction | 412 (96.0%) | 17 (4.0%) |
| Installation, Maintenance & Repair | 340 (100.0%) | 0 (0.0%) |
| Total (Category) | 752 (97.8%) | 17 (2.2%) |
| Total (Overall) | 4,704 (50.3%) | 4,643 (49.7%) |
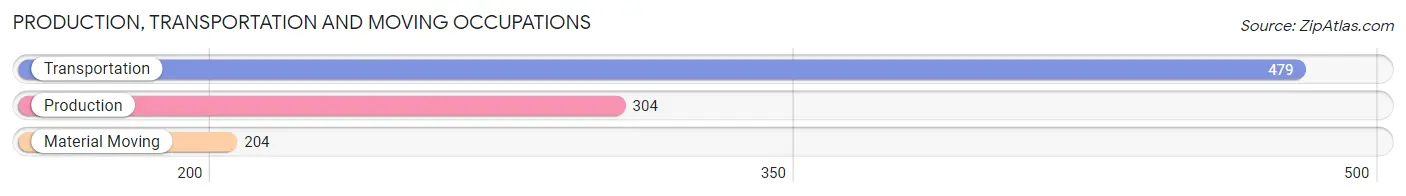
Production, Transportation and Moving Occupations
The most common Production, Transportation and Moving occupations in Lake Ronkonkoma are Transportation (479 | 5.1%), Production (304 | 3.3%), and Material Moving (204 | 2.2%).
Production, Transportation and Moving Occupations by Sex
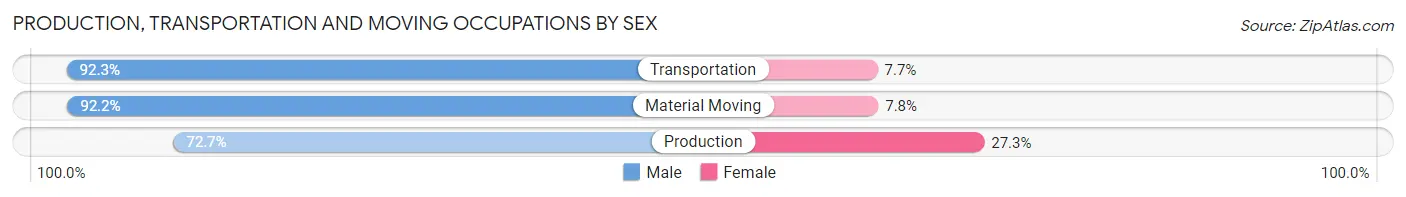
| Occupation | Male | Female |
| Production | 221 (72.7%) | 83 (27.3%) |
| Transportation | 442 (92.3%) | 37 (7.7%) |
| Material Moving | 188 (92.2%) | 16 (7.8%) |
| Total (Category) | 851 (86.2%) | 136 (13.8%) |
| Total (Overall) | 4,704 (50.3%) | 4,643 (49.7%) |
Employment Industries by Sex in Lake Ronkonkoma
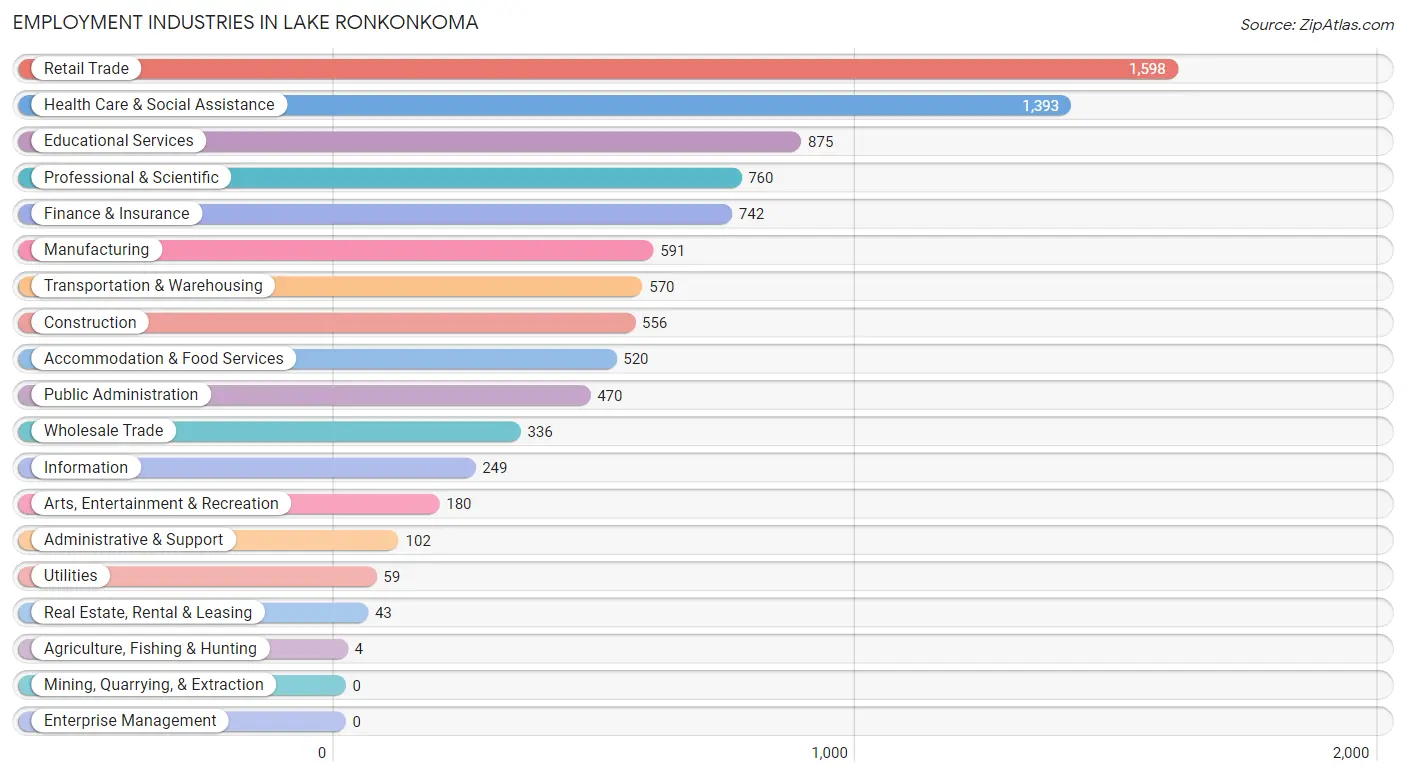
Employment Industries in Lake Ronkonkoma
The major employment industries in Lake Ronkonkoma include Retail Trade (1,598 | 17.1%), Health Care & Social Assistance (1,393 | 14.9%), Educational Services (875 | 9.4%), Professional & Scientific (760 | 8.1%), and Finance & Insurance (742 | 7.9%).
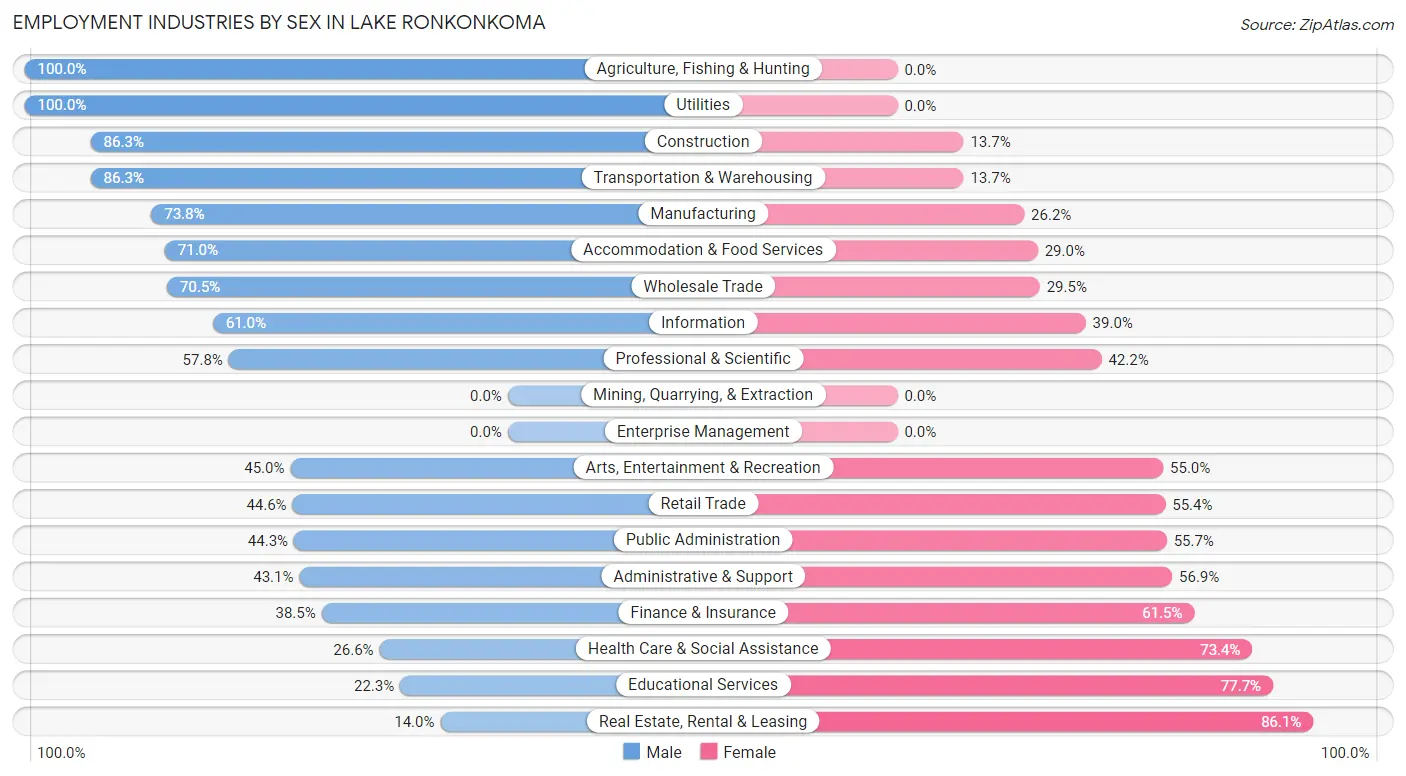
Employment Industries by Sex in Lake Ronkonkoma
The Lake Ronkonkoma industries that see more men than women are Agriculture, Fishing & Hunting (100.0%), Utilities (100.0%), and Construction (86.3%), whereas the industries that tend to have a higher number of women are Real Estate, Rental & Leasing (86.1%), Educational Services (77.7%), and Health Care & Social Assistance (73.4%).
| Industry | Male | Female |
| Agriculture, Fishing & Hunting | 4 (100.0%) | 0 (0.0%) |
| Mining, Quarrying, & Extraction | 0 (0.0%) | 0 (0.0%) |
| Construction | 480 (86.3%) | 76 (13.7%) |
| Manufacturing | 436 (73.8%) | 155 (26.2%) |
| Wholesale Trade | 237 (70.5%) | 99 (29.5%) |
| Retail Trade | 712 (44.6%) | 886 (55.4%) |
| Transportation & Warehousing | 492 (86.3%) | 78 (13.7%) |
| Utilities | 59 (100.0%) | 0 (0.0%) |
| Information | 152 (61.0%) | 97 (39.0%) |
| Finance & Insurance | 286 (38.5%) | 456 (61.5%) |
| Real Estate, Rental & Leasing | 6 (14.0%) | 37 (86.1%) |
| Professional & Scientific | 439 (57.8%) | 321 (42.2%) |
| Enterprise Management | 0 (0.0%) | 0 (0.0%) |
| Administrative & Support | 44 (43.1%) | 58 (56.9%) |
| Educational Services | 195 (22.3%) | 680 (77.7%) |
| Health Care & Social Assistance | 370 (26.6%) | 1,023 (73.4%) |
| Arts, Entertainment & Recreation | 81 (45.0%) | 99 (55.0%) |
| Accommodation & Food Services | 369 (71.0%) | 151 (29.0%) |
| Public Administration | 208 (44.3%) | 262 (55.7%) |
| Total | 4,704 (50.3%) | 4,643 (49.7%) |
Education in Lake Ronkonkoma
School Enrollment in Lake Ronkonkoma
The most common levels of schooling among the 4,039 students in Lake Ronkonkoma are middle school (1,090 | 27.0%), high school (790 | 19.6%), and elementary school (783 | 19.4%).
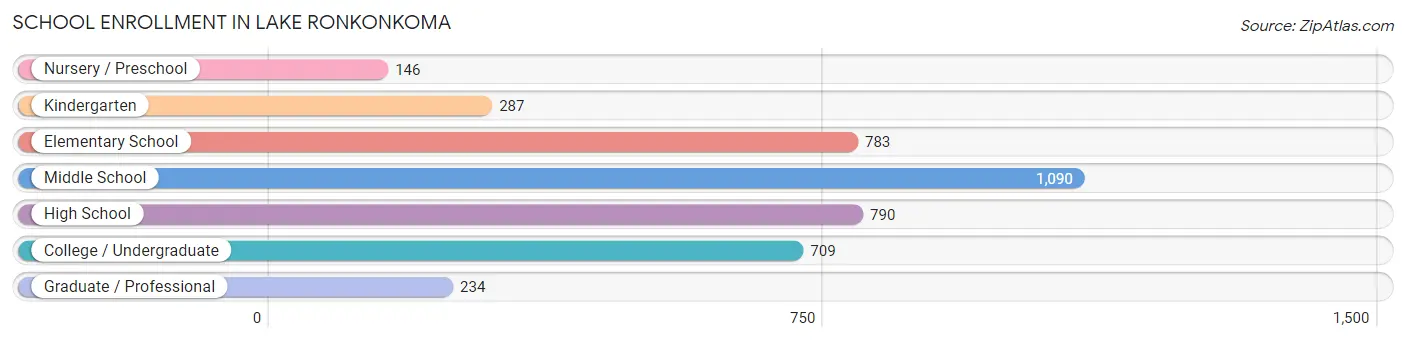
| School Level | # Students | % Students |
| Nursery / Preschool | 146 | 3.6% |
| Kindergarten | 287 | 7.1% |
| Elementary School | 783 | 19.4% |
| Middle School | 1,090 | 27.0% |
| High School | 790 | 19.6% |
| College / Undergraduate | 709 | 17.5% |
| Graduate / Professional | 234 | 5.8% |
| Total | 4,039 | 100.0% |
School Enrollment by Age by Funding Source in Lake Ronkonkoma
Out of a total of 4,039 students who are enrolled in schools in Lake Ronkonkoma, 473 (11.7%) attend a private institution, while the remaining 3,566 (88.3%) are enrolled in public schools. The age group of 25 to 34 year olds has the highest likelihood of being enrolled in private schools, with 110 (54.2% in the age bracket) enrolled. Conversely, the age group of 10 to 14 year olds has the lowest likelihood of being enrolled in a private school, with 1,367 (98.8% in the age bracket) attending a public institution.
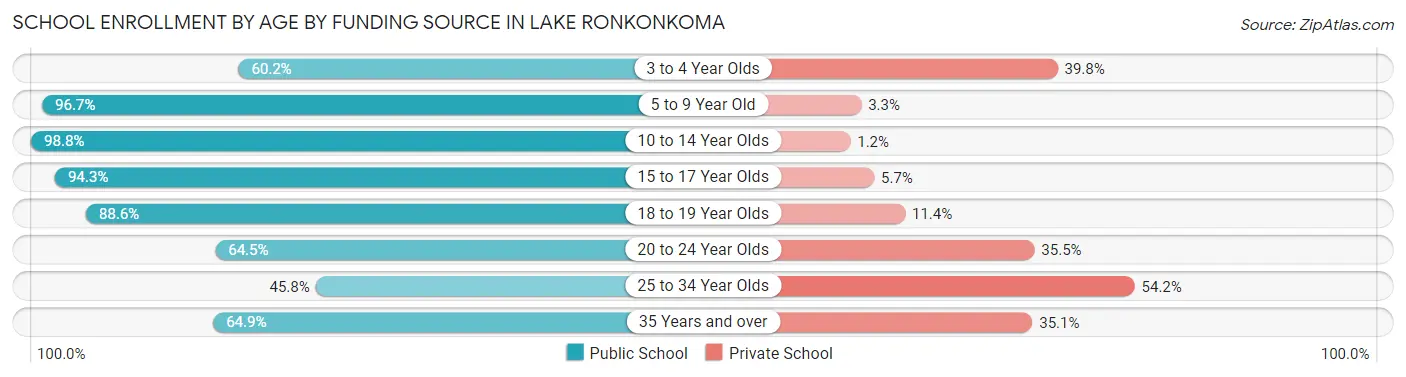
| Age Bracket | Public School | Private School |
| 3 to 4 Year Olds | 74 (60.2%) | 49 (39.8%) |
| 5 to 9 Year Old | 916 (96.7%) | 31 (3.3%) |
| 10 to 14 Year Olds | 1,367 (98.8%) | 17 (1.2%) |
| 15 to 17 Year Olds | 499 (94.3%) | 30 (5.7%) |
| 18 to 19 Year Olds | 248 (88.6%) | 32 (11.4%) |
| 20 to 24 Year Olds | 274 (64.5%) | 151 (35.5%) |
| 25 to 34 Year Olds | 93 (45.8%) | 110 (54.2%) |
| 35 Years and over | 96 (64.9%) | 52 (35.1%) |
| Total | 3,566 (88.3%) | 473 (11.7%) |
Educational Attainment by Field of Study in Lake Ronkonkoma
Business (835 | 22.9%), education (540 | 14.8%), science & technology (293 | 8.0%), psychology (292 | 8.0%), and social sciences (277 | 7.6%) are the most common fields of study among 3,644 individuals in Lake Ronkonkoma who have obtained a bachelor's degree or higher.
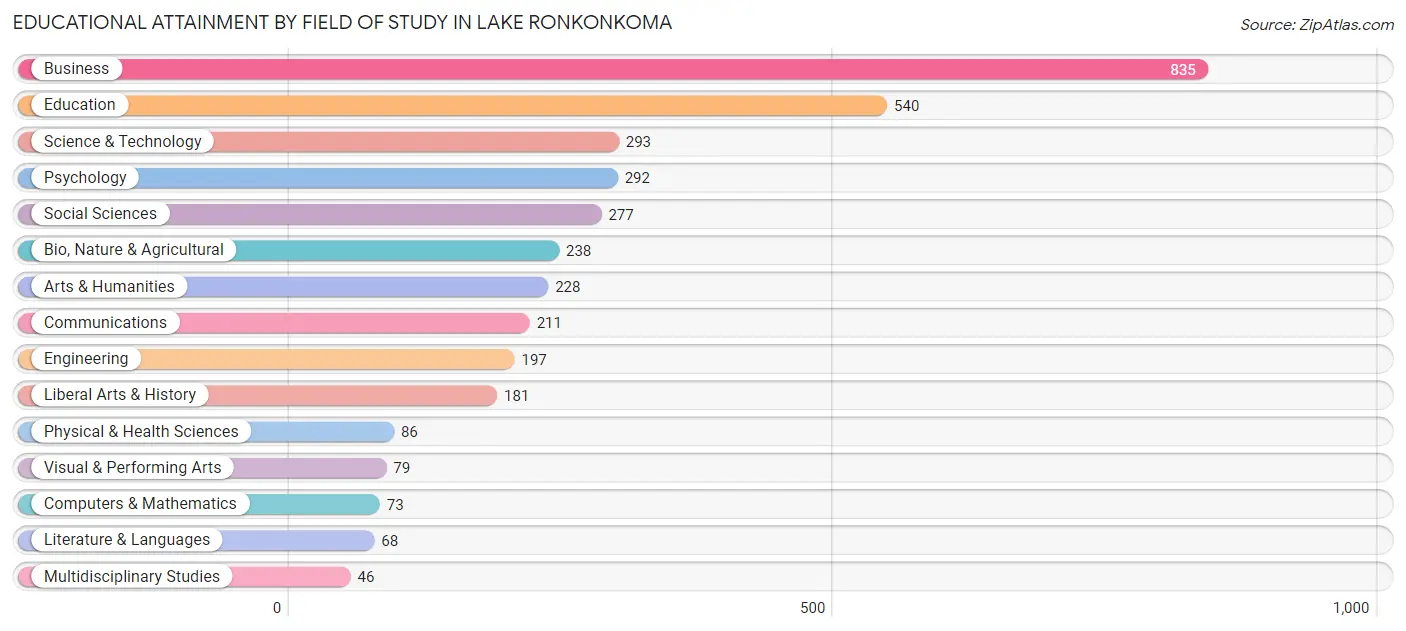
| Field of Study | # Graduates | % Graduates |
| Computers & Mathematics | 73 | 2.0% |
| Bio, Nature & Agricultural | 238 | 6.5% |
| Physical & Health Sciences | 86 | 2.4% |
| Psychology | 292 | 8.0% |
| Social Sciences | 277 | 7.6% |
| Engineering | 197 | 5.4% |
| Multidisciplinary Studies | 46 | 1.3% |
| Science & Technology | 293 | 8.0% |
| Business | 835 | 22.9% |
| Education | 540 | 14.8% |
| Literature & Languages | 68 | 1.9% |
| Liberal Arts & History | 181 | 5.0% |
| Visual & Performing Arts | 79 | 2.2% |
| Communications | 211 | 5.8% |
| Arts & Humanities | 228 | 6.3% |
| Total | 3,644 | 100.0% |
Transportation & Commute in Lake Ronkonkoma
Vehicle Availability by Sex in Lake Ronkonkoma
The most prevalent vehicle ownership categories in Lake Ronkonkoma are males with 2 vehicles (1,658, accounting for 38.1%) and females with 2 vehicles (1,179, making up 36.9%).
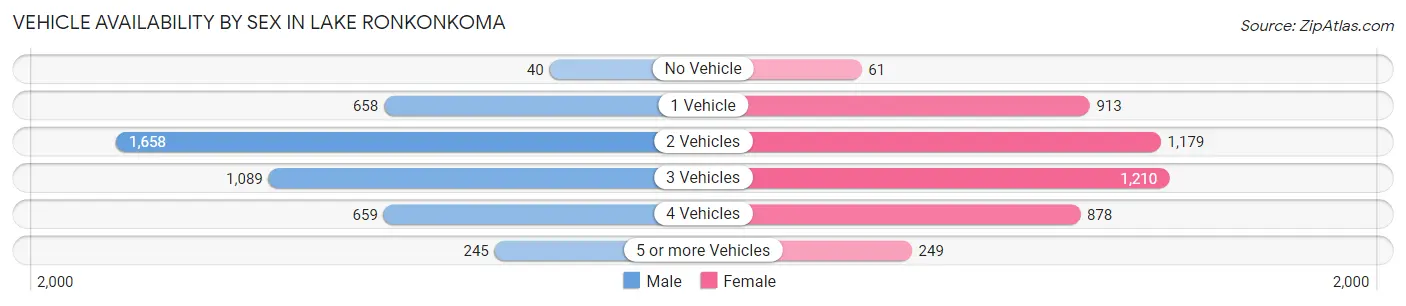
| Vehicles Available | Male | Female |
| No Vehicle | 40 (0.9%) | 61 (1.4%) |
| 1 Vehicle | 658 (15.1%) | 913 (20.3%) |
| 2 Vehicles | 1,658 (38.1%) | 1,179 (26.3%) |
| 3 Vehicles | 1,089 (25.0%) | 1,210 (27.0%) |
| 4 Vehicles | 659 (15.1%) | 878 (19.6%) |
| 5 or more Vehicles | 245 (5.6%) | 249 (5.6%) |
| Total | 4,349 (100.0%) | 4,490 (100.0%) |
Commute Time in Lake Ronkonkoma
The most frequently occuring commute durations in Lake Ronkonkoma are 10 to 14 minutes (1,451 commuters, 17.6%), 30 to 34 minutes (1,333 commuters, 16.2%), and 20 to 24 minutes (1,010 commuters, 12.3%).
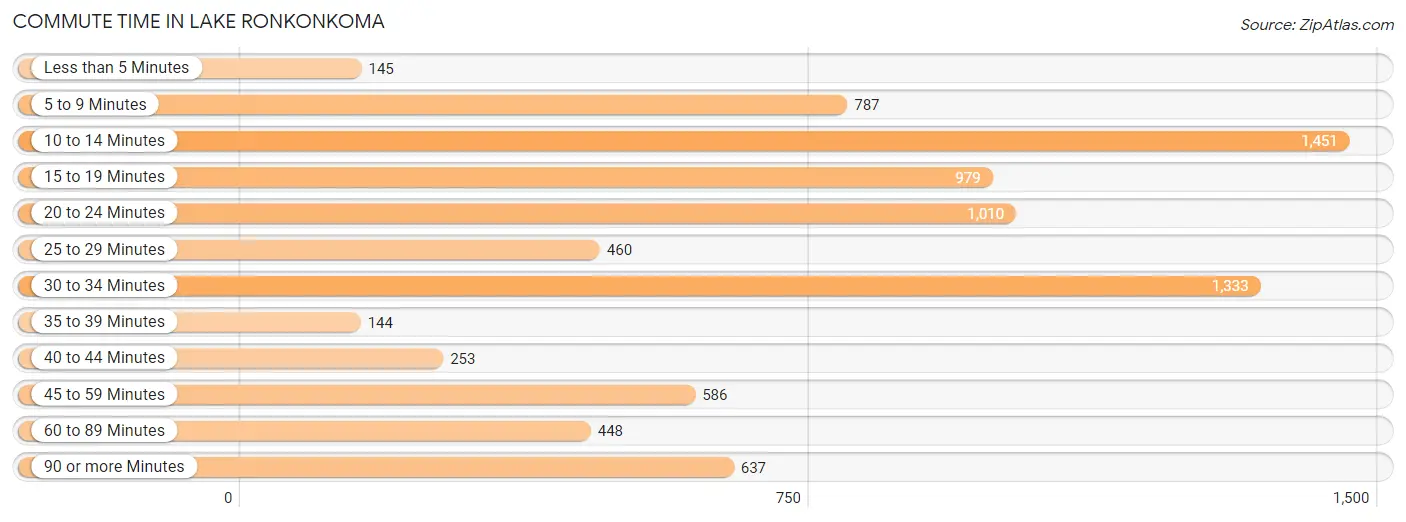
| Commute Time | # Commuters | % Commuters |
| Less than 5 Minutes | 145 | 1.8% |
| 5 to 9 Minutes | 787 | 9.6% |
| 10 to 14 Minutes | 1,451 | 17.6% |
| 15 to 19 Minutes | 979 | 11.9% |
| 20 to 24 Minutes | 1,010 | 12.3% |
| 25 to 29 Minutes | 460 | 5.6% |
| 30 to 34 Minutes | 1,333 | 16.2% |
| 35 to 39 Minutes | 144 | 1.8% |
| 40 to 44 Minutes | 253 | 3.1% |
| 45 to 59 Minutes | 586 | 7.1% |
| 60 to 89 Minutes | 448 | 5.4% |
| 90 or more Minutes | 637 | 7.7% |
Commute Time by Sex in Lake Ronkonkoma
The most common commute times in Lake Ronkonkoma are 30 to 34 minutes (630 commuters, 15.5%) for males and 10 to 14 minutes (874 commuters, 21.0%) for females.
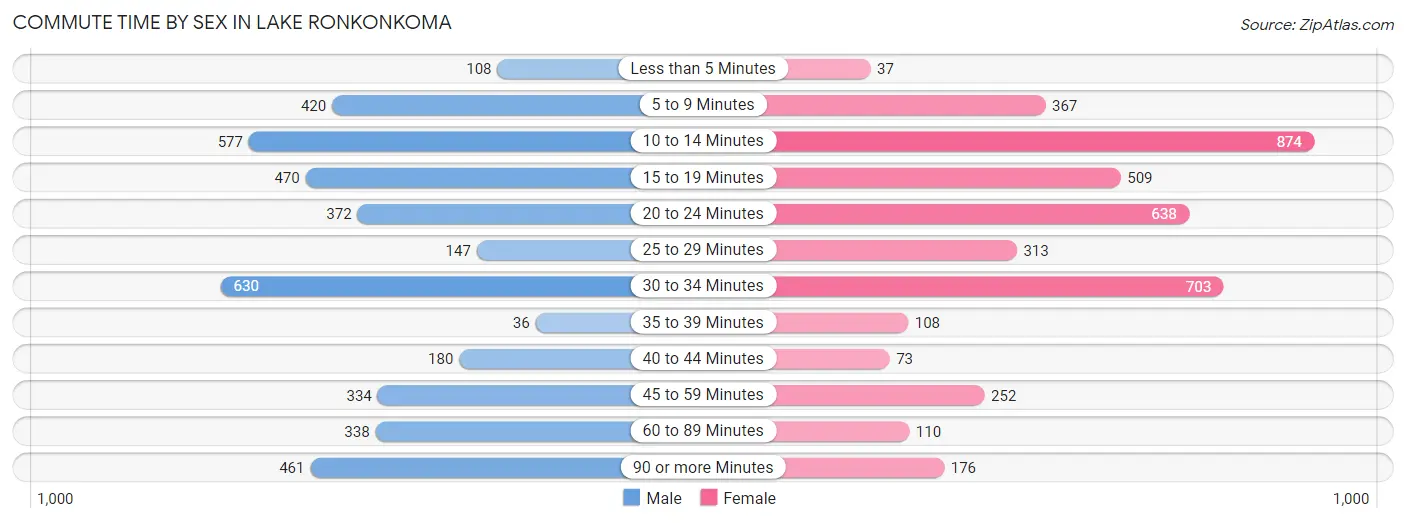
| Commute Time | Male | Female |
| Less than 5 Minutes | 108 (2.6%) | 37 (0.9%) |
| 5 to 9 Minutes | 420 (10.3%) | 367 (8.8%) |
| 10 to 14 Minutes | 577 (14.2%) | 874 (21.0%) |
| 15 to 19 Minutes | 470 (11.5%) | 509 (12.2%) |
| 20 to 24 Minutes | 372 (9.1%) | 638 (15.3%) |
| 25 to 29 Minutes | 147 (3.6%) | 313 (7.5%) |
| 30 to 34 Minutes | 630 (15.5%) | 703 (16.9%) |
| 35 to 39 Minutes | 36 (0.9%) | 108 (2.6%) |
| 40 to 44 Minutes | 180 (4.4%) | 73 (1.8%) |
| 45 to 59 Minutes | 334 (8.2%) | 252 (6.1%) |
| 60 to 89 Minutes | 338 (8.3%) | 110 (2.6%) |
| 90 or more Minutes | 461 (11.3%) | 176 (4.2%) |
Time of Departure to Work by Sex in Lake Ronkonkoma
The most frequent times of departure to work in Lake Ronkonkoma are 8:00 AM to 8:29 AM (690, 16.9%) for males and 8:00 AM to 8:29 AM (895, 21.5%) for females.
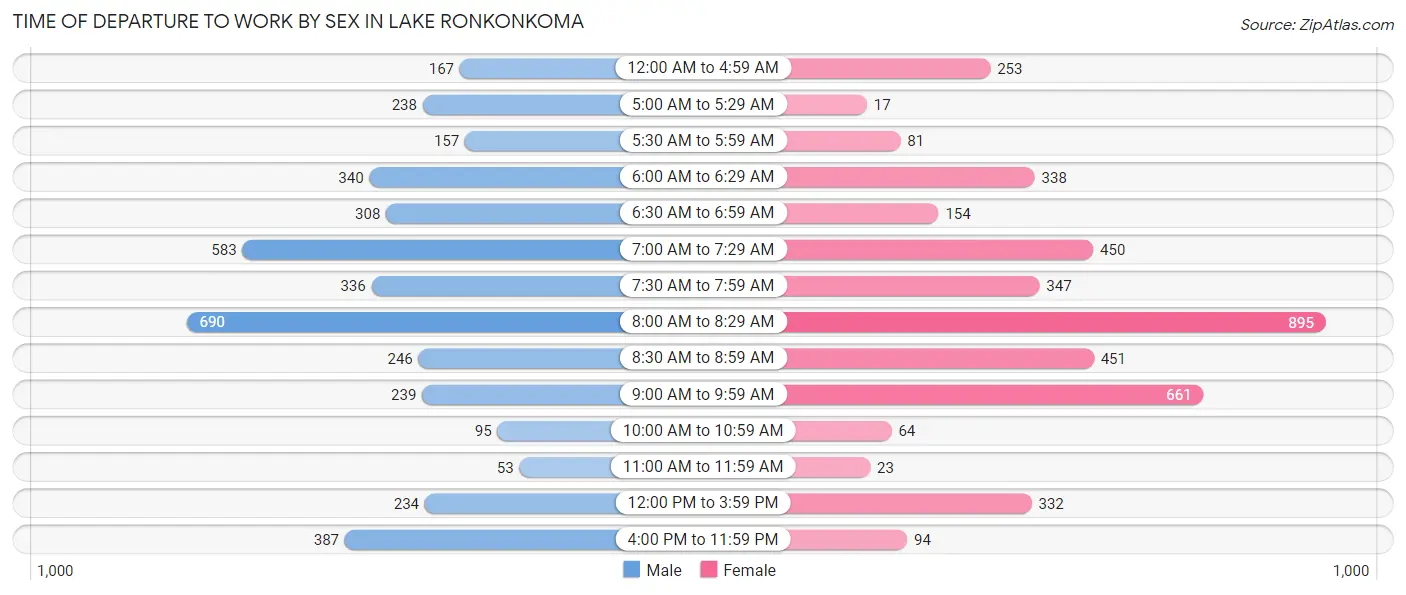
| Time of Departure | Male | Female |
| 12:00 AM to 4:59 AM | 167 (4.1%) | 253 (6.1%) |
| 5:00 AM to 5:29 AM | 238 (5.8%) | 17 (0.4%) |
| 5:30 AM to 5:59 AM | 157 (3.8%) | 81 (1.9%) |
| 6:00 AM to 6:29 AM | 340 (8.4%) | 338 (8.1%) |
| 6:30 AM to 6:59 AM | 308 (7.6%) | 154 (3.7%) |
| 7:00 AM to 7:29 AM | 583 (14.3%) | 450 (10.8%) |
| 7:30 AM to 7:59 AM | 336 (8.3%) | 347 (8.3%) |
| 8:00 AM to 8:29 AM | 690 (16.9%) | 895 (21.5%) |
| 8:30 AM to 8:59 AM | 246 (6.0%) | 451 (10.8%) |
| 9:00 AM to 9:59 AM | 239 (5.9%) | 661 (15.9%) |
| 10:00 AM to 10:59 AM | 95 (2.3%) | 64 (1.5%) |
| 11:00 AM to 11:59 AM | 53 (1.3%) | 23 (0.5%) |
| 12:00 PM to 3:59 PM | 234 (5.8%) | 332 (8.0%) |
| 4:00 PM to 11:59 PM | 387 (9.5%) | 94 (2.3%) |
| Total | 4,073 (100.0%) | 4,160 (100.0%) |
Housing Occupancy in Lake Ronkonkoma
Occupancy by Ownership in Lake Ronkonkoma
Of the total 6,504 dwellings in Lake Ronkonkoma, owner-occupied units account for 4,439 (68.2%), while renter-occupied units make up 2,065 (31.8%).
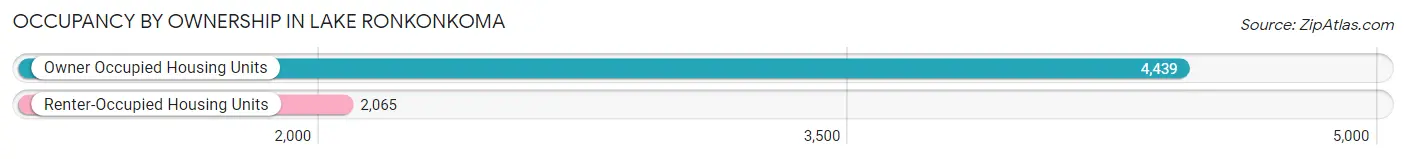
| Occupancy | # Housing Units | % Housing Units |
| Owner Occupied Housing Units | 4,439 | 68.2% |
| Renter-Occupied Housing Units | 2,065 | 31.8% |
| Total Occupied Housing Units | 6,504 | 100.0% |
Occupancy by Household Size in Lake Ronkonkoma
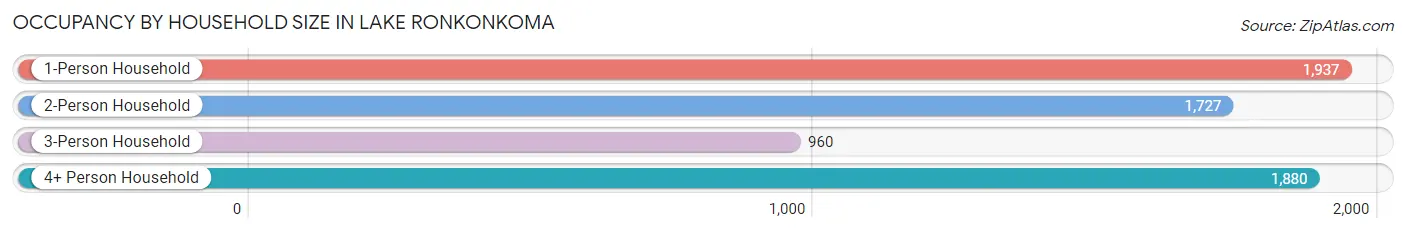
| Household Size | # Housing Units | % Housing Units |
| 1-Person Household | 1,937 | 29.8% |
| 2-Person Household | 1,727 | 26.6% |
| 3-Person Household | 960 | 14.8% |
| 4+ Person Household | 1,880 | 28.9% |
| Total Housing Units | 6,504 | 100.0% |
Occupancy by Ownership by Household Size in Lake Ronkonkoma
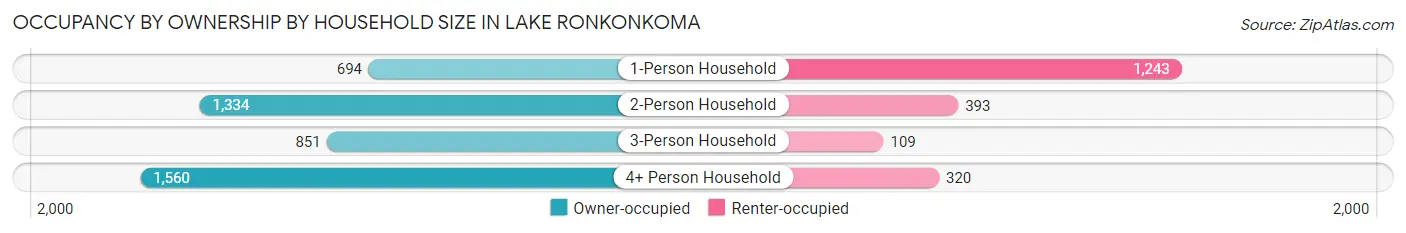
| Household Size | Owner-occupied | Renter-occupied |
| 1-Person Household | 694 (35.8%) | 1,243 (64.2%) |
| 2-Person Household | 1,334 (77.2%) | 393 (22.8%) |
| 3-Person Household | 851 (88.6%) | 109 (11.4%) |
| 4+ Person Household | 1,560 (83.0%) | 320 (17.0%) |
| Total Housing Units | 4,439 (68.2%) | 2,065 (31.8%) |
Occupancy by Educational Attainment in Lake Ronkonkoma
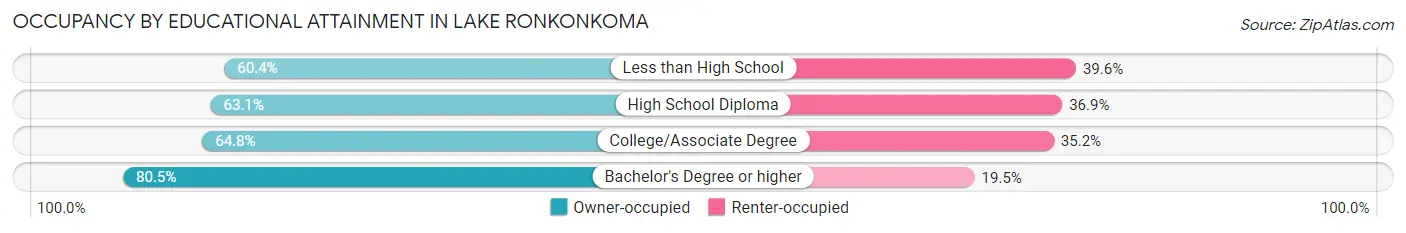
| Household Size | Owner-occupied | Renter-occupied |
| Less than High School | 224 (60.4%) | 147 (39.6%) |
| High School Diploma | 1,468 (63.1%) | 858 (36.9%) |
| College/Associate Degree | 1,305 (64.8%) | 710 (35.2%) |
| Bachelor's Degree or higher | 1,442 (80.5%) | 350 (19.5%) |
Occupancy by Age of Householder in Lake Ronkonkoma
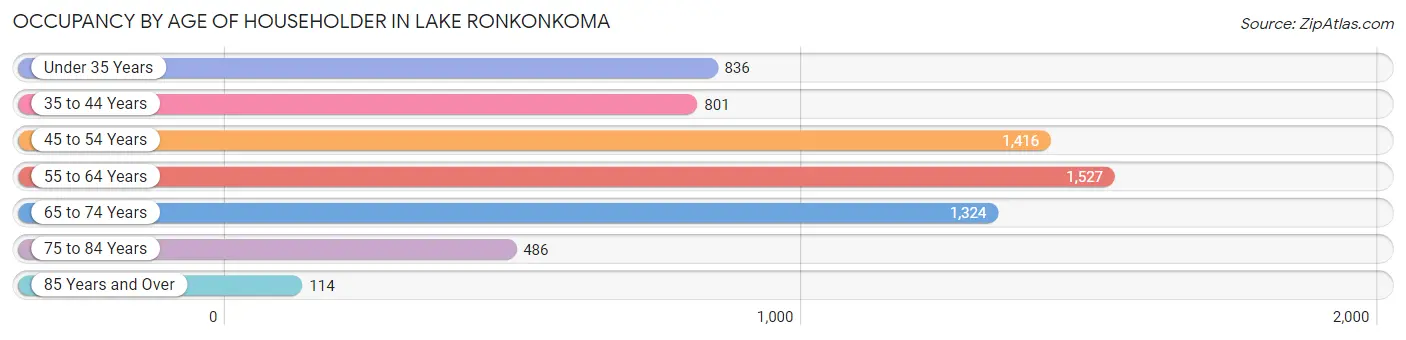
| Age Bracket | # Households | % Households |
| Under 35 Years | 836 | 12.9% |
| 35 to 44 Years | 801 | 12.3% |
| 45 to 54 Years | 1,416 | 21.8% |
| 55 to 64 Years | 1,527 | 23.5% |
| 65 to 74 Years | 1,324 | 20.4% |
| 75 to 84 Years | 486 | 7.5% |
| 85 Years and Over | 114 | 1.8% |
| Total | 6,504 | 100.0% |
Housing Finances in Lake Ronkonkoma
Median Income by Occupancy in Lake Ronkonkoma
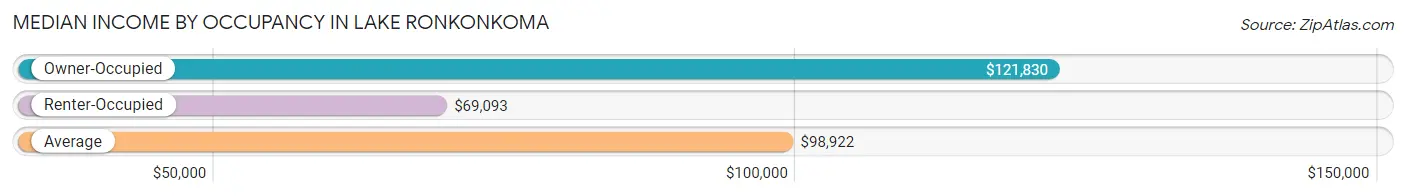
| Occupancy Type | # Households | Median Income |
| Owner-Occupied | 4,439 (68.2%) | $121,830 |
| Renter-Occupied | 2,065 (31.8%) | $69,093 |
| Average | 6,504 (100.0%) | $98,922 |
Occupancy by Householder Income Bracket in Lake Ronkonkoma
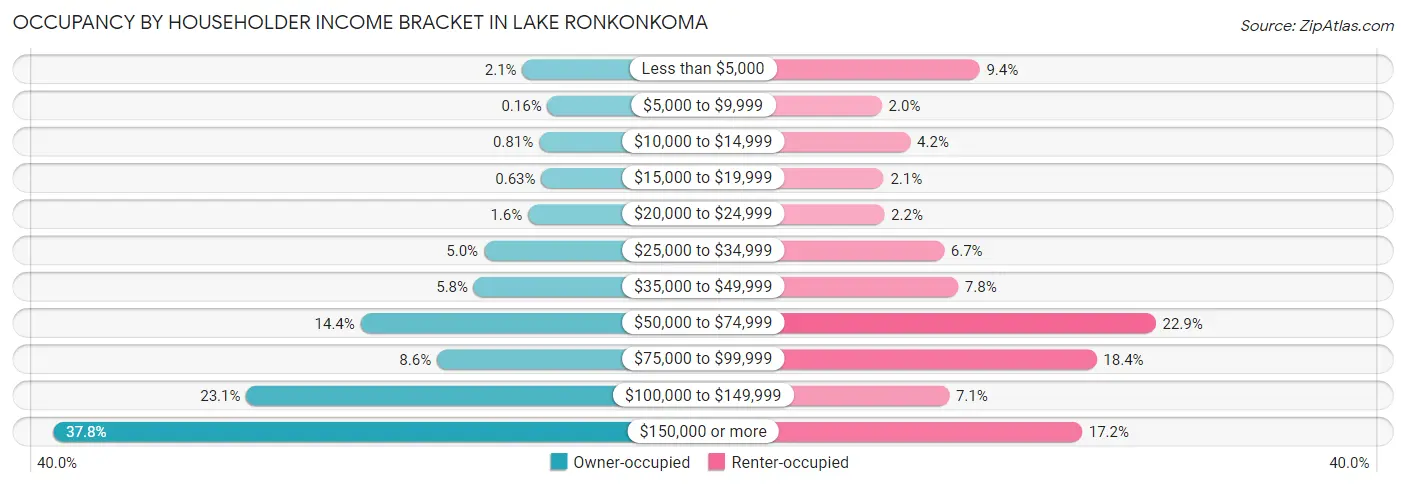
| Income Bracket | Owner-occupied | Renter-occupied |
| Less than $5,000 | 92 (2.1%) | 195 (9.4%) |
| $5,000 to $9,999 | 7 (0.2%) | 41 (2.0%) |
| $10,000 to $14,999 | 36 (0.8%) | 86 (4.2%) |
| $15,000 to $19,999 | 28 (0.6%) | 44 (2.1%) |
| $20,000 to $24,999 | 73 (1.6%) | 45 (2.2%) |
| $25,000 to $34,999 | 222 (5.0%) | 139 (6.7%) |
| $35,000 to $49,999 | 256 (5.8%) | 161 (7.8%) |
| $50,000 to $74,999 | 639 (14.4%) | 472 (22.9%) |
| $75,000 to $99,999 | 381 (8.6%) | 379 (18.3%) |
| $100,000 to $149,999 | 1,026 (23.1%) | 147 (7.1%) |
| $150,000 or more | 1,679 (37.8%) | 356 (17.2%) |
| Total | 4,439 (100.0%) | 2,065 (100.0%) |
Monthly Housing Cost Tiers in Lake Ronkonkoma
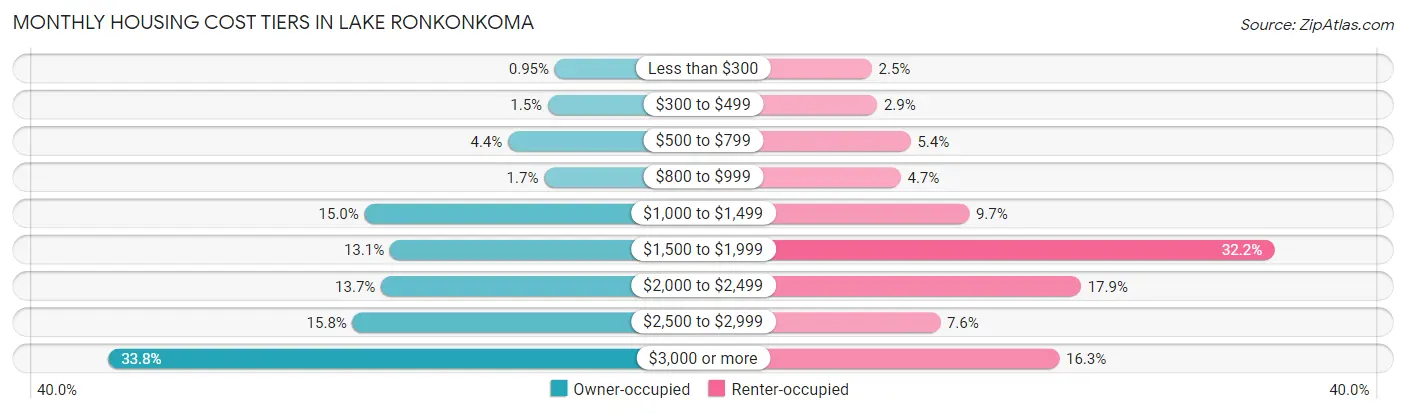
| Monthly Cost | Owner-occupied | Renter-occupied |
| Less than $300 | 42 (0.9%) | 52 (2.5%) |
| $300 to $499 | 65 (1.5%) | 60 (2.9%) |
| $500 to $799 | 195 (4.4%) | 111 (5.4%) |
| $800 to $999 | 77 (1.7%) | 96 (4.6%) |
| $1,000 to $1,499 | 664 (15.0%) | 200 (9.7%) |
| $1,500 to $1,999 | 581 (13.1%) | 664 (32.2%) |
| $2,000 to $2,499 | 610 (13.7%) | 370 (17.9%) |
| $2,500 to $2,999 | 703 (15.8%) | 156 (7.5%) |
| $3,000 or more | 1,502 (33.8%) | 337 (16.3%) |
| Total | 4,439 (100.0%) | 2,065 (100.0%) |
Physical Housing Characteristics in Lake Ronkonkoma
Housing Structures in Lake Ronkonkoma
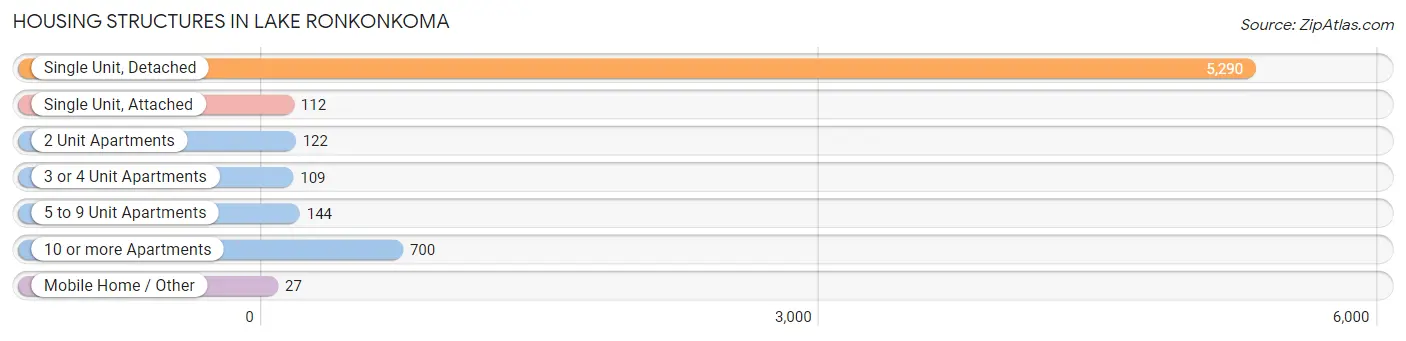
| Structure Type | # Housing Units | % Housing Units |
| Single Unit, Detached | 5,290 | 81.3% |
| Single Unit, Attached | 112 | 1.7% |
| 2 Unit Apartments | 122 | 1.9% |
| 3 or 4 Unit Apartments | 109 | 1.7% |
| 5 to 9 Unit Apartments | 144 | 2.2% |
| 10 or more Apartments | 700 | 10.8% |
| Mobile Home / Other | 27 | 0.4% |
| Total | 6,504 | 100.0% |
Housing Structures by Occupancy in Lake Ronkonkoma
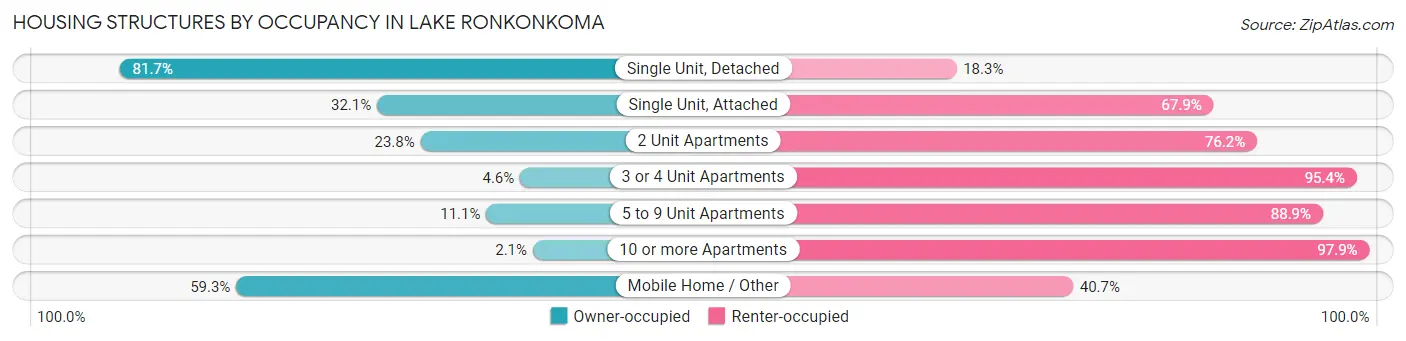
| Structure Type | Owner-occupied | Renter-occupied |
| Single Unit, Detached | 4,322 (81.7%) | 968 (18.3%) |
| Single Unit, Attached | 36 (32.1%) | 76 (67.9%) |
| 2 Unit Apartments | 29 (23.8%) | 93 (76.2%) |
| 3 or 4 Unit Apartments | 5 (4.6%) | 104 (95.4%) |
| 5 to 9 Unit Apartments | 16 (11.1%) | 128 (88.9%) |
| 10 or more Apartments | 15 (2.1%) | 685 (97.9%) |
| Mobile Home / Other | 16 (59.3%) | 11 (40.7%) |
| Total | 4,439 (68.2%) | 2,065 (31.8%) |
Housing Structures by Number of Rooms in Lake Ronkonkoma
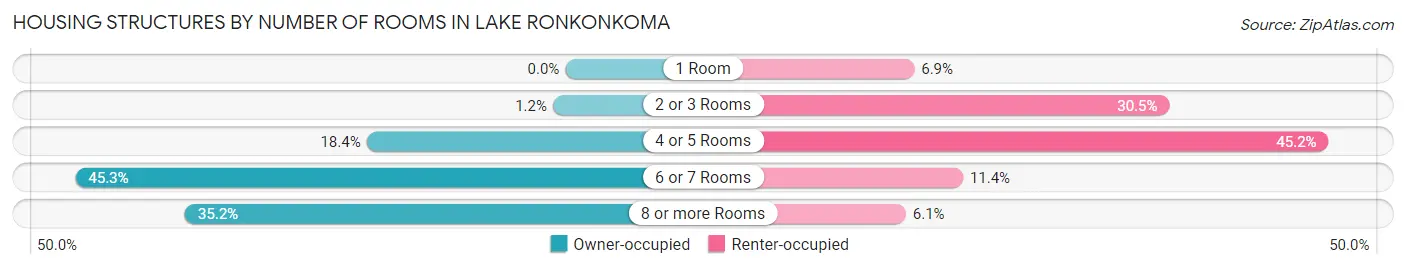
| Number of Rooms | Owner-occupied | Renter-occupied |
| 1 Room | 0 (0.0%) | 142 (6.9%) |
| 2 or 3 Rooms | 51 (1.1%) | 629 (30.5%) |
| 4 or 5 Rooms | 816 (18.4%) | 933 (45.2%) |
| 6 or 7 Rooms | 2,011 (45.3%) | 235 (11.4%) |
| 8 or more Rooms | 1,561 (35.2%) | 126 (6.1%) |
| Total | 4,439 (100.0%) | 2,065 (100.0%) |
Housing Structure by Heating Type in Lake Ronkonkoma
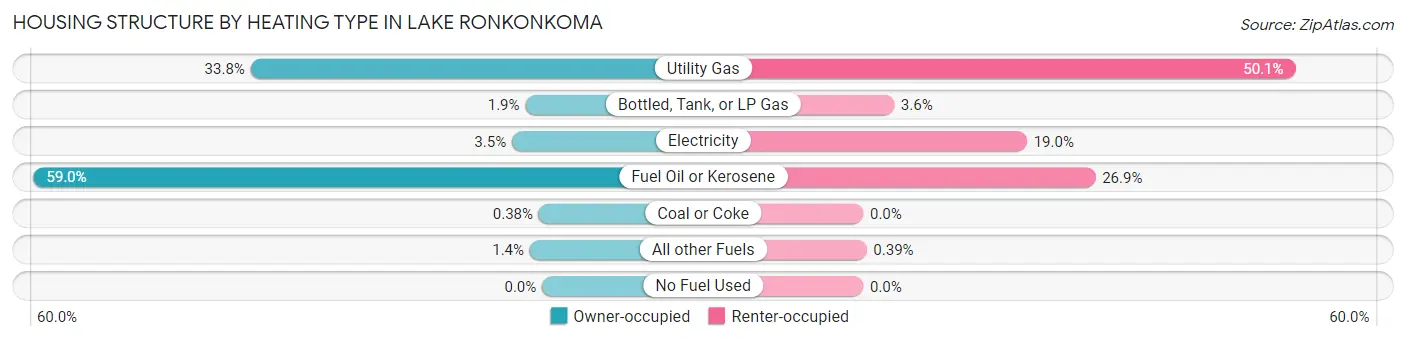
| Heating Type | Owner-occupied | Renter-occupied |
| Utility Gas | 1,500 (33.8%) | 1,035 (50.1%) |
| Bottled, Tank, or LP Gas | 86 (1.9%) | 74 (3.6%) |
| Electricity | 155 (3.5%) | 392 (19.0%) |
| Fuel Oil or Kerosene | 2,618 (59.0%) | 556 (26.9%) |
| Coal or Coke | 17 (0.4%) | 0 (0.0%) |
| All other Fuels | 63 (1.4%) | 8 (0.4%) |
| No Fuel Used | 0 (0.0%) | 0 (0.0%) |
| Total | 4,439 (100.0%) | 2,065 (100.0%) |
Household Vehicle Usage in Lake Ronkonkoma
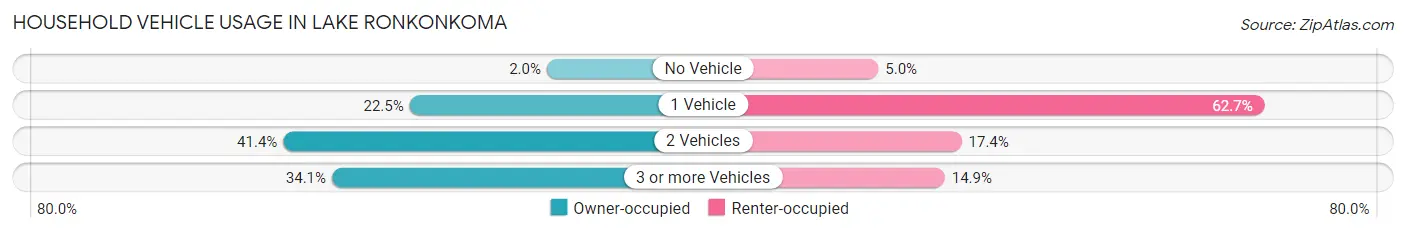
| Vehicles per Household | Owner-occupied | Renter-occupied |
| No Vehicle | 89 (2.0%) | 103 (5.0%) |
| 1 Vehicle | 999 (22.5%) | 1,294 (62.7%) |
| 2 Vehicles | 1,837 (41.4%) | 360 (17.4%) |
| 3 or more Vehicles | 1,514 (34.1%) | 308 (14.9%) |
| Total | 4,439 (100.0%) | 2,065 (100.0%) |
Real Estate & Mortgages in Lake Ronkonkoma
Real Estate and Mortgage Overview in Lake Ronkonkoma
| Characteristic | Without Mortgage | With Mortgage |
| Housing Units | 1,155 | 3,284 |
| Median Property Value | $434,100 | $451,900 |
| Median Household Income | $68,969 | $1,396 |
| Monthly Housing Costs | $1,179 | $1,501 |
| Real Estate Taxes | $8,785 | $6 |
Property Value by Mortgage Status in Lake Ronkonkoma
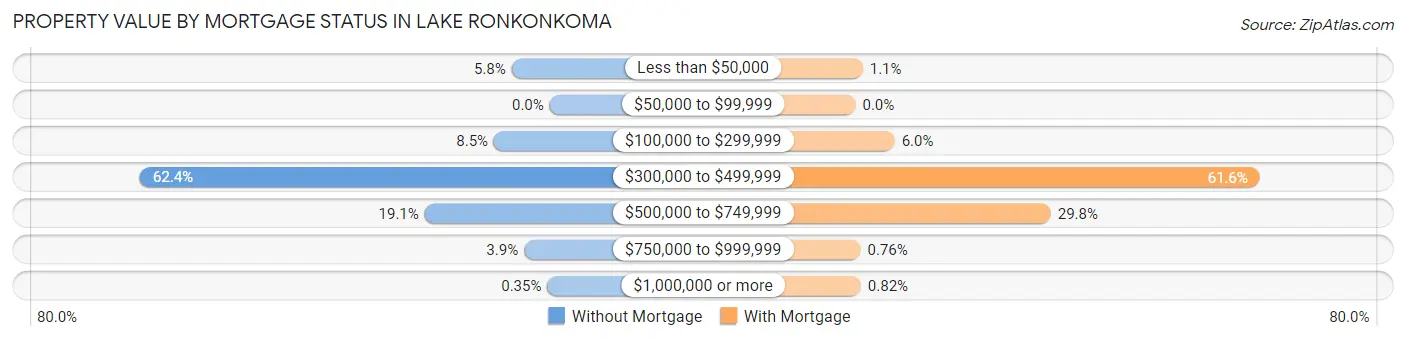
| Property Value | Without Mortgage | With Mortgage |
| Less than $50,000 | 67 (5.8%) | 36 (1.1%) |
| $50,000 to $99,999 | 0 (0.0%) | 0 (0.0%) |
| $100,000 to $299,999 | 98 (8.5%) | 196 (6.0%) |
| $300,000 to $499,999 | 721 (62.4%) | 2,023 (61.6%) |
| $500,000 to $749,999 | 220 (19.1%) | 977 (29.7%) |
| $750,000 to $999,999 | 45 (3.9%) | 25 (0.8%) |
| $1,000,000 or more | 4 (0.4%) | 27 (0.8%) |
| Total | 1,155 (100.0%) | 3,284 (100.0%) |
Household Income by Mortgage Status in Lake Ronkonkoma
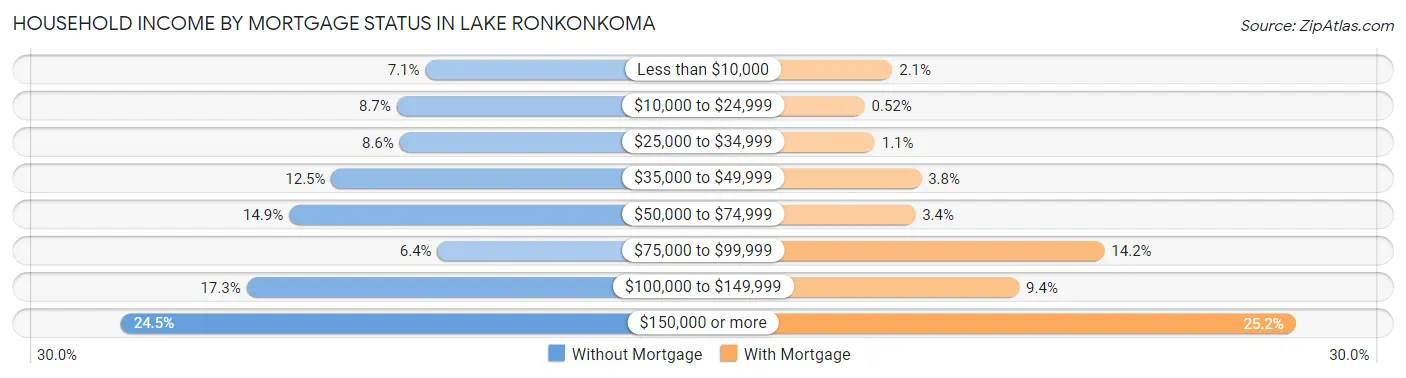
| Household Income | Without Mortgage | With Mortgage |
| Less than $10,000 | 82 (7.1%) | 69 (2.1%) |
| $10,000 to $24,999 | 101 (8.7%) | 17 (0.5%) |
| $25,000 to $34,999 | 99 (8.6%) | 36 (1.1%) |
| $35,000 to $49,999 | 144 (12.5%) | 123 (3.7%) |
| $50,000 to $74,999 | 172 (14.9%) | 112 (3.4%) |
| $75,000 to $99,999 | 74 (6.4%) | 467 (14.2%) |
| $100,000 to $149,999 | 200 (17.3%) | 307 (9.3%) |
| $150,000 or more | 283 (24.5%) | 826 (25.2%) |
| Total | 1,155 (100.0%) | 3,284 (100.0%) |
Property Value to Household Income Ratio in Lake Ronkonkoma
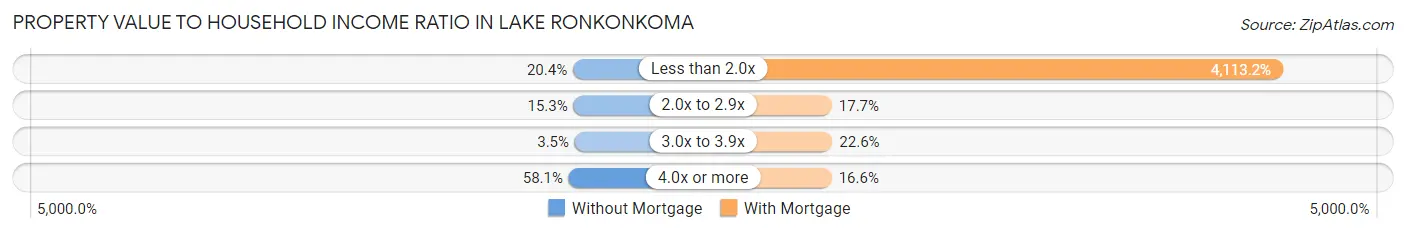
| Value-to-Income Ratio | Without Mortgage | With Mortgage |
| Less than 2.0x | 235 (20.3%) | 135,078 (4,113.2%) |
| 2.0x to 2.9x | 177 (15.3%) | 580 (17.7%) |
| 3.0x to 3.9x | 40 (3.5%) | 741 (22.6%) |
| 4.0x or more | 671 (58.1%) | 545 (16.6%) |
| Total | 1,155 (100.0%) | 3,284 (100.0%) |
Real Estate Taxes by Mortgage Status in Lake Ronkonkoma
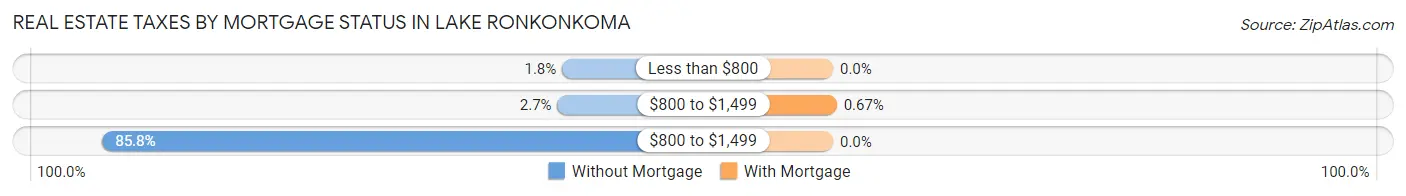
| Property Taxes | Without Mortgage | With Mortgage |
| Less than $800 | 21 (1.8%) | 0 (0.0%) |
| $800 to $1,499 | 31 (2.7%) | 22 (0.7%) |
| $800 to $1,499 | 991 (85.8%) | 0 (0.0%) |
| Total | 1,155 (100.0%) | 3,284 (100.0%) |
Health & Disability in Lake Ronkonkoma
Health Insurance Coverage by Age in Lake Ronkonkoma
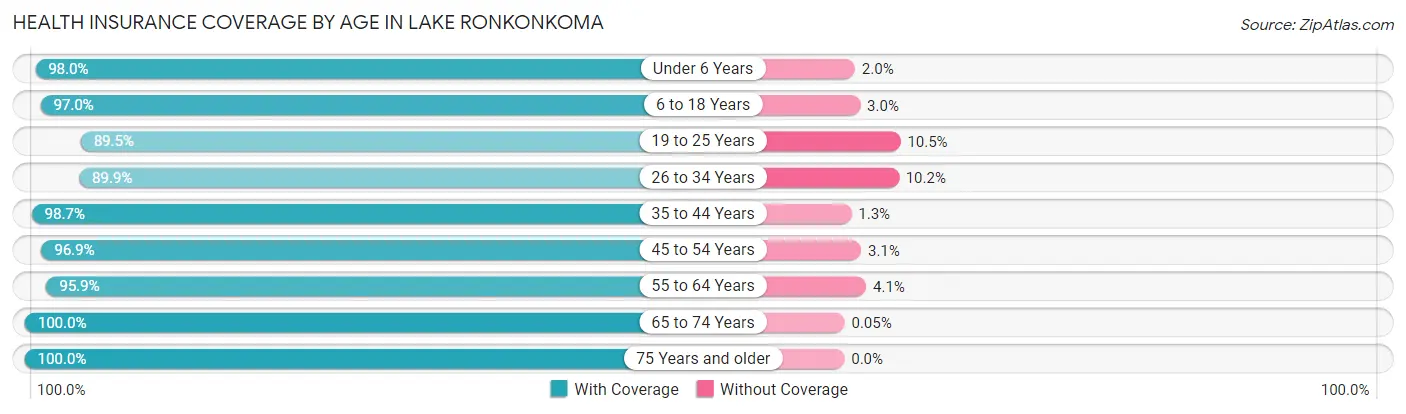
| Age Bracket | With Coverage | Without Coverage |
| Under 6 Years | 1,139 (98.0%) | 23 (2.0%) |
| 6 to 18 Years | 2,755 (97.0%) | 84 (3.0%) |
| 19 to 25 Years | 1,540 (89.5%) | 180 (10.5%) |
| 26 to 34 Years | 1,717 (89.8%) | 194 (10.2%) |
| 35 to 44 Years | 1,963 (98.7%) | 26 (1.3%) |
| 45 to 54 Years | 2,704 (96.9%) | 87 (3.1%) |
| 55 to 64 Years | 2,647 (95.9%) | 112 (4.1%) |
| 65 to 74 Years | 2,017 (100.0%) | 1 (0.1%) |
| 75 Years and older | 1,124 (100.0%) | 0 (0.0%) |
| Total | 17,606 (96.1%) | 707 (3.9%) |
Health Insurance Coverage by Citizenship Status in Lake Ronkonkoma
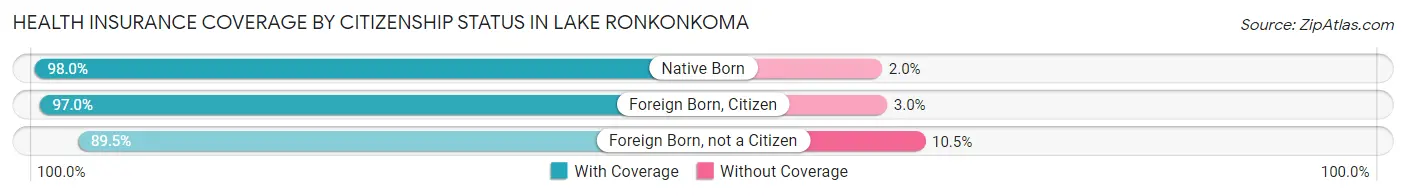
| Citizenship Status | With Coverage | Without Coverage |
| Native Born | 1,139 (98.0%) | 23 (2.0%) |
| Foreign Born, Citizen | 2,755 (97.0%) | 84 (3.0%) |
| Foreign Born, not a Citizen | 1,540 (89.5%) | 180 (10.5%) |
Health Insurance Coverage by Household Income in Lake Ronkonkoma
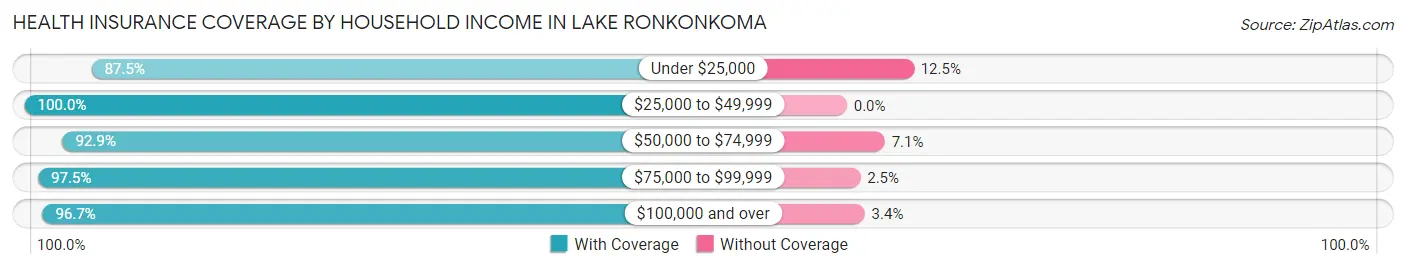
| Household Income | With Coverage | Without Coverage |
| Under $25,000 | 830 (87.5%) | 119 (12.5%) |
| $25,000 to $49,999 | 1,594 (100.0%) | 0 (0.0%) |
| $50,000 to $74,999 | 2,068 (92.9%) | 158 (7.1%) |
| $75,000 to $99,999 | 1,812 (97.5%) | 47 (2.5%) |
| $100,000 and over | 10,954 (96.7%) | 380 (3.4%) |
Public vs Private Health Insurance Coverage by Age in Lake Ronkonkoma
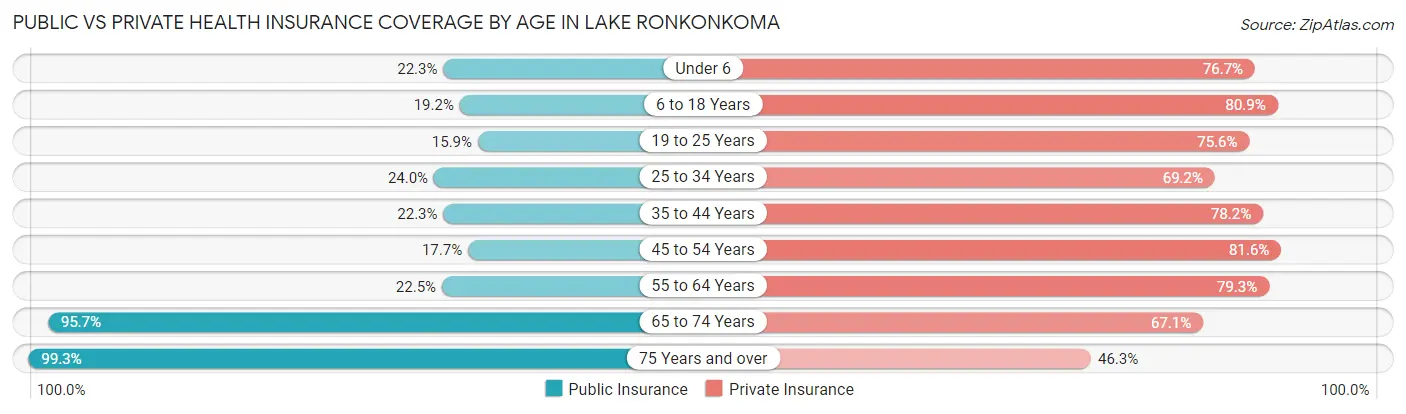
| Age Bracket | Public Insurance | Private Insurance |
| Under 6 | 259 (22.3%) | 891 (76.7%) |
| 6 to 18 Years | 546 (19.2%) | 2,296 (80.9%) |
| 19 to 25 Years | 273 (15.9%) | 1,301 (75.6%) |
| 25 to 34 Years | 459 (24.0%) | 1,323 (69.2%) |
| 35 to 44 Years | 443 (22.3%) | 1,555 (78.2%) |
| 45 to 54 Years | 494 (17.7%) | 2,276 (81.6%) |
| 55 to 64 Years | 622 (22.5%) | 2,188 (79.3%) |
| 65 to 74 Years | 1,931 (95.7%) | 1,353 (67.0%) |
| 75 Years and over | 1,116 (99.3%) | 520 (46.3%) |
| Total | 6,143 (33.5%) | 13,703 (74.8%) |
Disability Status by Sex by Age in Lake Ronkonkoma
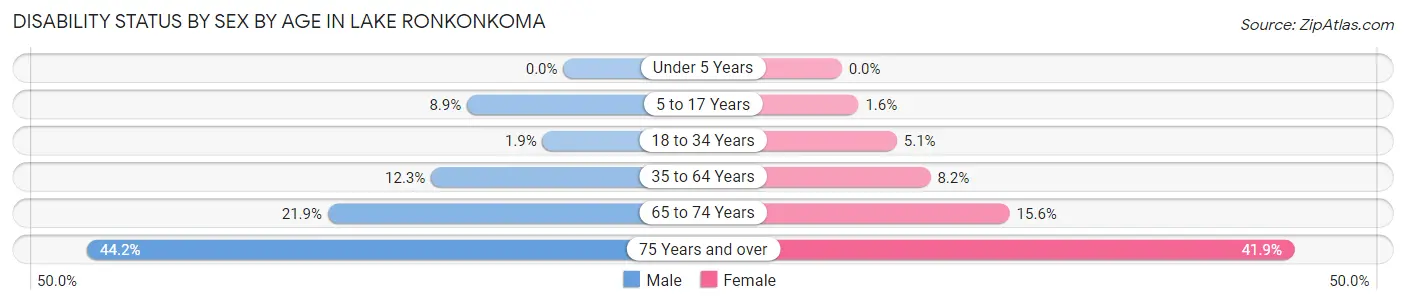
| Age Bracket | Male | Female |
| Under 5 Years | 0 (0.0%) | 0 (0.0%) |
| 5 to 17 Years | 132 (8.9%) | 23 (1.5%) |
| 18 to 34 Years | 33 (1.9%) | 105 (5.1%) |
| 35 to 64 Years | 466 (12.3%) | 308 (8.2%) |
| 65 to 74 Years | 204 (21.9%) | 169 (15.6%) |
| 75 Years and over | 209 (44.2%) | 273 (41.9%) |
Disability Class by Sex by Age in Lake Ronkonkoma
Disability Class: Hearing Difficulty
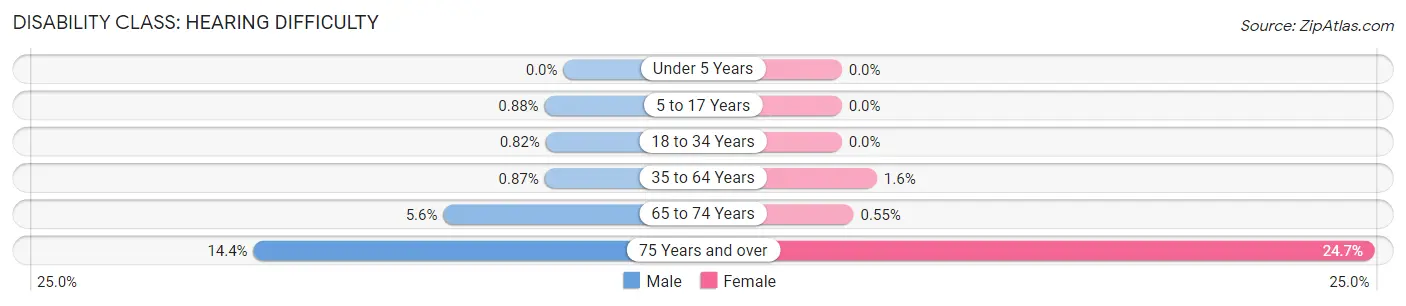
| Age Bracket | Male | Female |
| Under 5 Years | 0 (0.0%) | 0 (0.0%) |
| 5 to 17 Years | 13 (0.9%) | 0 (0.0%) |
| 18 to 34 Years | 14 (0.8%) | 0 (0.0%) |
| 35 to 64 Years | 33 (0.9%) | 61 (1.6%) |
| 65 to 74 Years | 52 (5.6%) | 6 (0.5%) |
| 75 Years and over | 68 (14.4%) | 161 (24.7%) |
Disability Class: Vision Difficulty
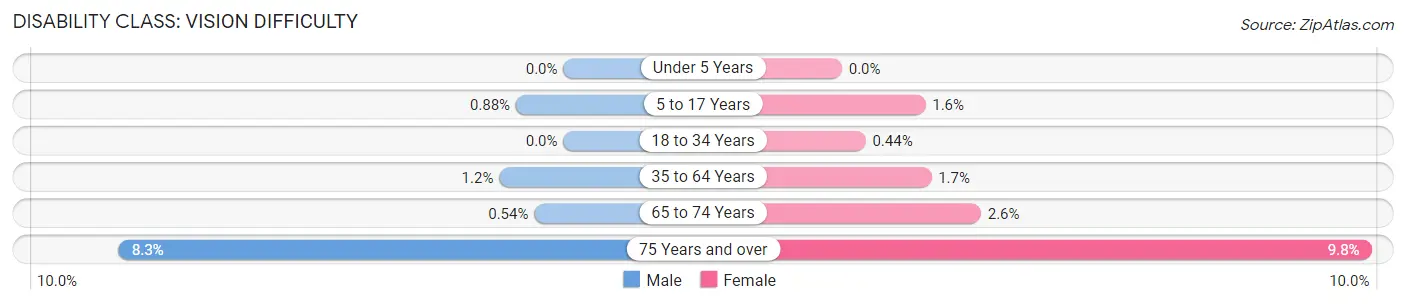
| Age Bracket | Male | Female |
| Under 5 Years | 0 (0.0%) | 0 (0.0%) |
| 5 to 17 Years | 13 (0.9%) | 23 (1.5%) |
| 18 to 34 Years | 0 (0.0%) | 9 (0.4%) |
| 35 to 64 Years | 45 (1.2%) | 62 (1.7%) |
| 65 to 74 Years | 5 (0.5%) | 28 (2.6%) |
| 75 Years and over | 39 (8.3%) | 64 (9.8%) |
Disability Class: Cognitive Difficulty
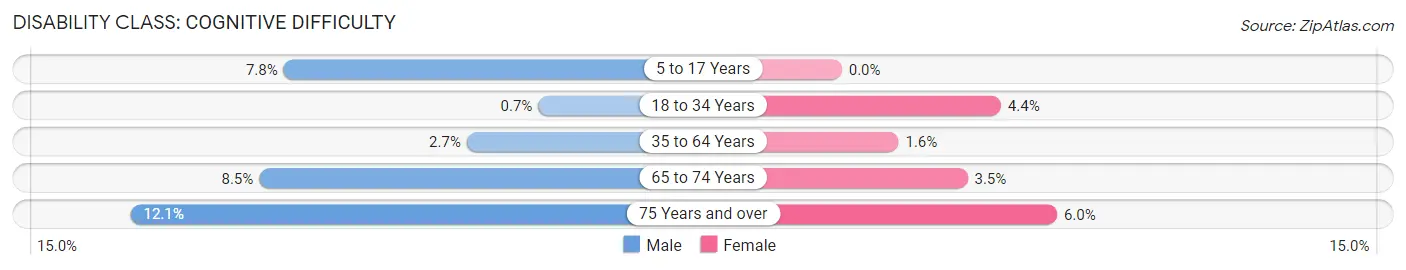
| Age Bracket | Male | Female |
| 5 to 17 Years | 115 (7.8%) | 0 (0.0%) |
| 18 to 34 Years | 12 (0.7%) | 91 (4.4%) |
| 35 to 64 Years | 102 (2.7%) | 59 (1.6%) |
| 65 to 74 Years | 79 (8.5%) | 38 (3.5%) |
| 75 Years and over | 57 (12.0%) | 39 (6.0%) |
Disability Class: Ambulatory Difficulty
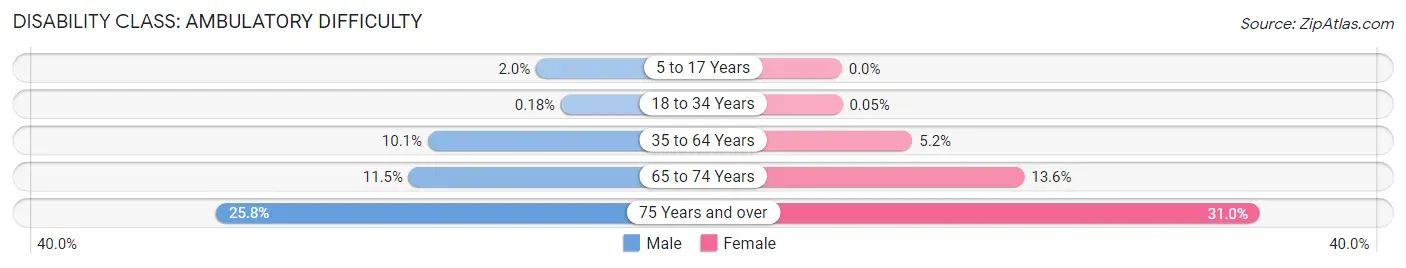
| Age Bracket | Male | Female |
| 5 to 17 Years | 30 (2.0%) | 0 (0.0%) |
| 18 to 34 Years | 3 (0.2%) | 1 (0.1%) |
| 35 to 64 Years | 382 (10.1%) | 196 (5.2%) |
| 65 to 74 Years | 107 (11.5%) | 147 (13.6%) |
| 75 Years and over | 122 (25.8%) | 202 (31.0%) |
Disability Class: Self-Care Difficulty
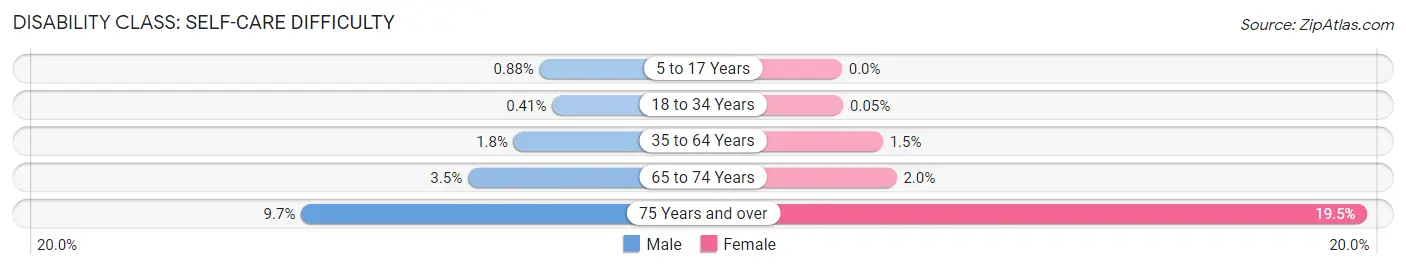
| Age Bracket | Male | Female |
| 5 to 17 Years | 13 (0.9%) | 0 (0.0%) |
| 18 to 34 Years | 7 (0.4%) | 1 (0.1%) |
| 35 to 64 Years | 70 (1.8%) | 57 (1.5%) |
| 65 to 74 Years | 33 (3.5%) | 22 (2.0%) |
| 75 Years and over | 46 (9.7%) | 127 (19.5%) |
Technology Access in Lake Ronkonkoma
Computing Device Access in Lake Ronkonkoma
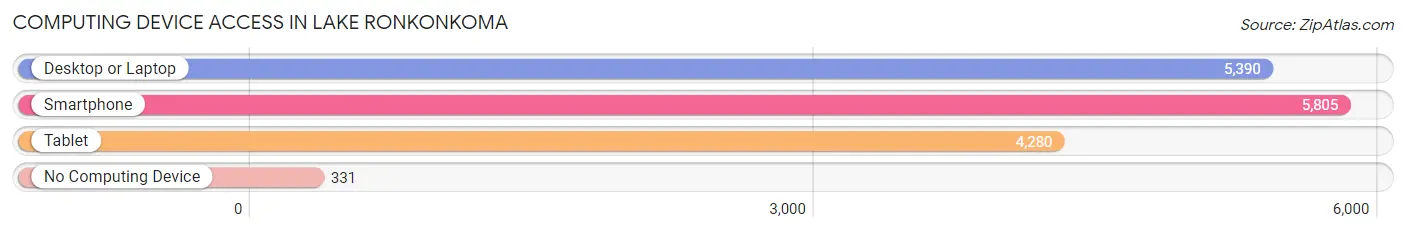
| Device Type | # Households | % Households |
| Desktop or Laptop | 5,390 | 82.9% |
| Smartphone | 5,805 | 89.2% |
| Tablet | 4,280 | 65.8% |
| No Computing Device | 331 | 5.1% |
| Total | 6,504 | 100.0% |
Internet Access in Lake Ronkonkoma
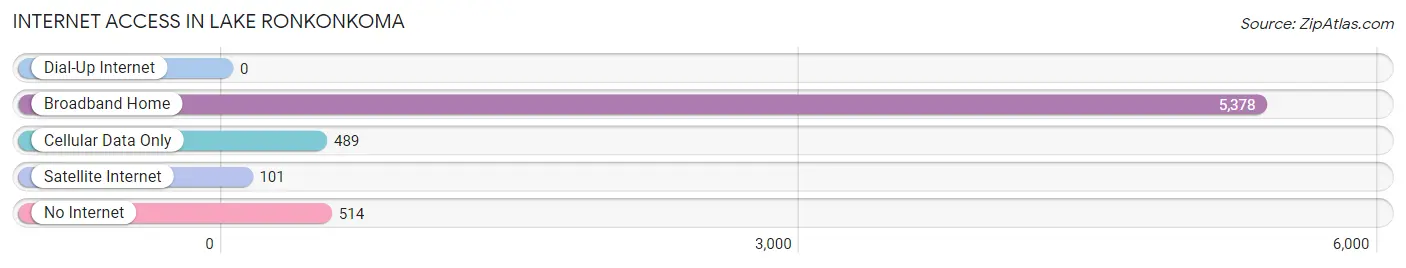
| Internet Type | # Households | % Households |
| Dial-Up Internet | 0 | 0.0% |
| Broadband Home | 5,378 | 82.7% |
| Cellular Data Only | 489 | 7.5% |
| Satellite Internet | 101 | 1.5% |
| No Internet | 514 | 7.9% |
| Total | 6,504 | 100.0% |
Lake Ronkonkoma Summary
Ronkonkoma is a hamlet and census-designated place (CDP) located in the Town of Islip in Suffolk County, New York, United States. The population was 20,155 at the 2010 census.
History
The area now known as Ronkonkoma was originally inhabited by the Secatogue Indians, a sub-tribe of the larger Algonquin Nation. The Secatogue Indians were a peaceful people who lived off the land, fishing, hunting, and gathering. The name Ronkonkoma is derived from the Secatogue Indian word meaning "boundary fishing lake".
The first European settlers arrived in the area in the late 1600s. The area was originally known as Smithtown, after the Smith family who were among the first settlers. In 1845, the area was renamed Ronkonkoma after the lake.
In the late 1800s, the area began to develop as a resort destination. The lake was a popular spot for fishing and swimming, and the area was known for its beautiful scenery. The Long Island Rail Road opened a station in Ronkonkoma in 1875, making it easier for people to visit the area.
In the early 1900s, the area began to develop into a residential community. The population grew steadily throughout the 20th century, and by the 2000 census, the population had reached 20,155.
Geography
Ronkonkoma is located at 40°48'N 73°6'W (40.80, -73.10). According to the United States Census Bureau, the CDP has a total area of 8.2 square miles (21.2 km2), of which 7.9 square miles (20.5 km2) is land and 0.3 square miles (0.7 km2) (3.45%) is water.
The hamlet is located on the south shore of Long Island, and is bordered by the Town of Islip to the west, the Town of Brookhaven to the east, and the Town of Smithtown to the north. The hamlet is located on the north shore of Lake Ronkonkoma, a large freshwater lake that is the largest lake on Long Island.
Economy
Ronkonkoma is a primarily residential community, but it does have a few businesses. The largest employer in the area is the Long Island Rail Road, which has a major maintenance facility in the hamlet. Other businesses in the area include a few small retail stores, restaurants, and a few light industrial businesses.
Demographics
As of the 2010 census, there were 20,155 people, 6,945 households, and 5,093 families residing in the CDP. The population density was 2,541.3 people per square mile (981.2/km2). There were 7,093 housing units at an average density of 894.3 per square mile (345.7/km2). The racial makeup of the CDP was 87.2% White, 4.2% African American, 0.2% Native American, 3.7% Asian, 0.1% Pacific Islander, 2.2% from other races, and 2.5% from two or more races. Hispanic or Latino of any race were 8.7% of the population.
There were 6,945 households, out of which 33.2% had children under the age of 18 living with them, 56.2% were married couples living together, 11.3% had a female householder with no husband present, and 28.2% were non-families. 22.2% of all households were made up of individuals, and 9.2% had someone living alone who was 65 years of age or older. The average household size was 2.87 and the average family size was 3.37.
In the CDP, the population was spread out, with 24.2% under the age of 18, 7.2% from 18 to 24, 30.2% from 25 to 44, 24.2% from 45 to 64, and 14.2% who were 65 years of age or older. The median age was 38 years. For every 100 females, there were 94.2 males. For every 100 females age 18 and over, there were 91.2 males.
The median income for a household in the CDP was $68,945, and the median income for a family was $77,945. Males had a median income of $50,945 versus $37,945 for females. The per capita income for the CDP was $27,945. About 3.2% of families and 4.2% of the population were below the poverty line, including 5.2% of those under age 18 and 4.2% of those age 65 or over.
Common Questions
What is Per Capita Income in Lake Ronkonkoma?
Per Capita income in Lake Ronkonkoma is $44,859.
What is the Median Family Income in Lake Ronkonkoma?
Median Family Income in Lake Ronkonkoma is $120,625.
What is the Median Household income in Lake Ronkonkoma?
Median Household Income in Lake Ronkonkoma is $98,922.
What is Income or Wage Gap in Lake Ronkonkoma?
Income or Wage Gap in Lake Ronkonkoma is 39.1%.
Women in Lake Ronkonkoma earn 60.9 cents for every dollar earned by a man.
What is Inequality or Gini Index in Lake Ronkonkoma?
Inequality or Gini Index in Lake Ronkonkoma is 0.42.
What is the Total Population of Lake Ronkonkoma?
Total Population of Lake Ronkonkoma is 18,339.
What is the Total Male Population of Lake Ronkonkoma?
Total Male Population of Lake Ronkonkoma is 8,790.
What is the Total Female Population of Lake Ronkonkoma?
Total Female Population of Lake Ronkonkoma is 9,549.
What is the Ratio of Males per 100 Females in Lake Ronkonkoma?
There are 92.05 Males per 100 Females in Lake Ronkonkoma.
What is the Ratio of Females per 100 Males in Lake Ronkonkoma?
There are 108.63 Females per 100 Males in Lake Ronkonkoma.
What is the Median Population Age in Lake Ronkonkoma?
Median Population Age in Lake Ronkonkoma is 42.8 Years.
What is the Average Family Size in Lake Ronkonkoma
Average Family Size in Lake Ronkonkoma is 3.5 People.
What is the Average Household Size in Lake Ronkonkoma
Average Household Size in Lake Ronkonkoma is 2.8 People.
How Large is the Labor Force in Lake Ronkonkoma?
There are 9,927 People in the Labor Forcein in Lake Ronkonkoma.
What is the Percentage of People in the Labor Force in Lake Ronkonkoma?
66.8% of People are in the Labor Force in Lake Ronkonkoma.
What is the Unemployment Rate in Lake Ronkonkoma?
Unemployment Rate in Lake Ronkonkoma is 5.8%.