Riverview Park, PA Map & Demographics
Riverview Park Map
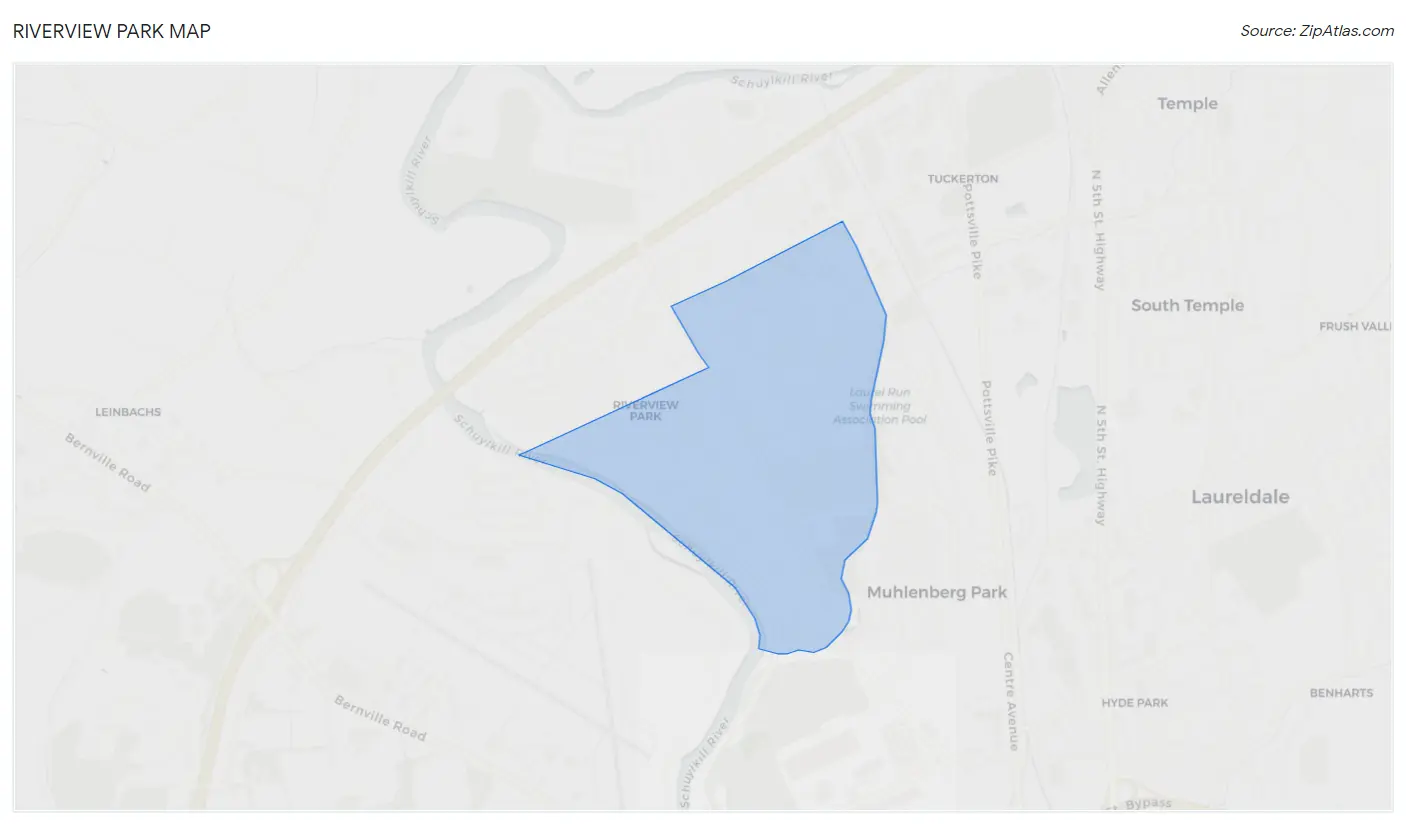
Riverview Park Overview
$45,531
PER CAPITA INCOME
$104,500
AVG FAMILY INCOME
$106,338
AVG HOUSEHOLD INCOME
34.3%
WAGE / INCOME GAP [ % ]
65.7¢/ $1
WAGE / INCOME GAP [ $ ]
0.33
INEQUALITY / GINI INDEX
3,675
TOTAL POPULATION
1,881
MALE POPULATION
1,794
FEMALE POPULATION
104.85
MALES / 100 FEMALES
95.37
FEMALES / 100 MALES
39.9
MEDIAN AGE
3.1
AVG FAMILY SIZE
2.6
AVG HOUSEHOLD SIZE
1,997
LABOR FORCE [ PEOPLE ]
66.6%
PERCENT IN LABOR FORCE
Income in Riverview Park
Income Overview in Riverview Park
Per Capita Income in Riverview Park is $45,531, while median incomes of families and households are $104,500 and $106,338 respectively.
| Characteristic | Number | Measure |
| Per Capita Income | 3,675 | $45,531 |
| Median Family Income | 916 | $104,500 |
| Mean Family Income | 916 | $128,880 |
| Median Household Income | 1,403 | $106,338 |
| Mean Household Income | 1,403 | $120,543 |
| Income Deficit | 916 | $0 |
| Wage / Income Gap (%) | 3,675 | 34.34% |
| Wage / Income Gap ($) | 3,675 | 65.66¢ per $1 |
| Gini / Inequality Index | 3,675 | 0.33 |
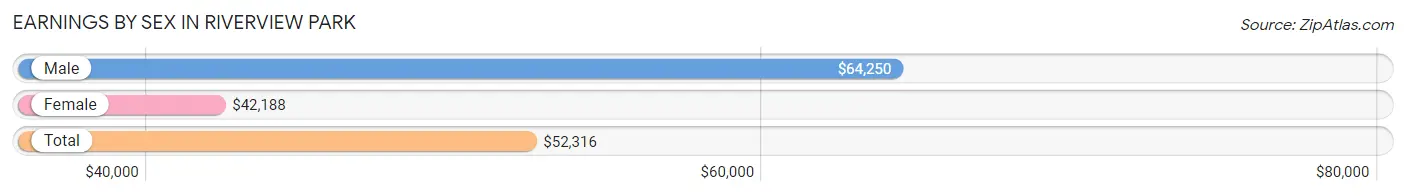
Earnings by Sex in Riverview Park
Average Earnings in Riverview Park are $52,316, $64,250 for men and $42,188 for women, a difference of 34.3%.
| Sex | Number | Average Earnings |
| Male | 1,076 (51.8%) | $64,250 |
| Female | 1,002 (48.2%) | $42,188 |
| Total | 2,078 (100.0%) | $52,316 |
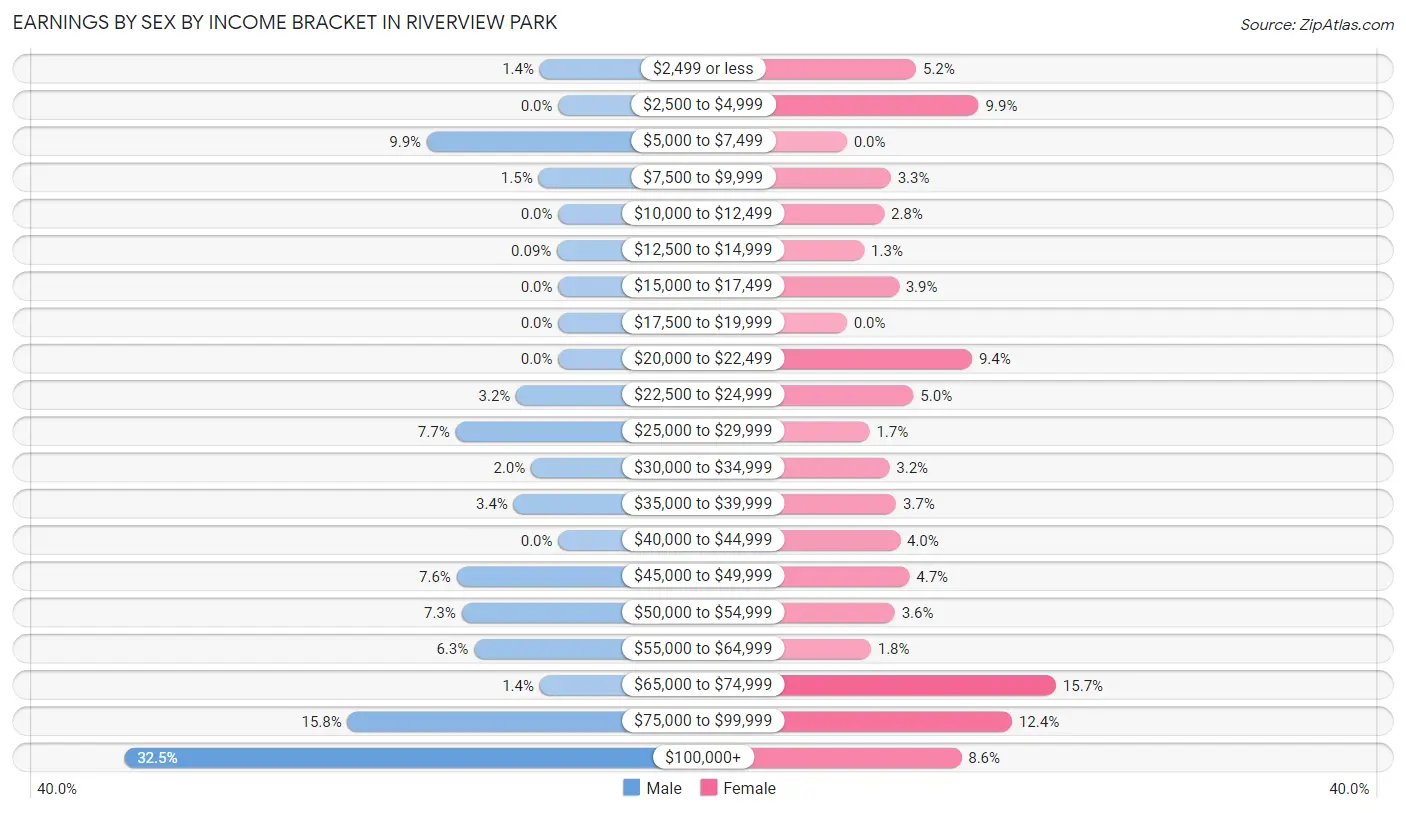
Earnings by Sex by Income Bracket in Riverview Park
The most common earnings brackets in Riverview Park are $100,000+ for men (350 | 32.5%) and $65,000 to $74,999 for women (157 | 15.7%).
| Income | Male | Female |
| $2,499 or less | 15 (1.4%) | 52 (5.2%) |
| $2,500 to $4,999 | 0 (0.0%) | 99 (9.9%) |
| $5,000 to $7,499 | 106 (9.9%) | 0 (0.0%) |
| $7,500 to $9,999 | 16 (1.5%) | 33 (3.3%) |
| $10,000 to $12,499 | 0 (0.0%) | 28 (2.8%) |
| $12,500 to $14,999 | 1 (0.1%) | 13 (1.3%) |
| $15,000 to $17,499 | 0 (0.0%) | 39 (3.9%) |
| $17,500 to $19,999 | 0 (0.0%) | 0 (0.0%) |
| $20,000 to $22,499 | 0 (0.0%) | 94 (9.4%) |
| $22,500 to $24,999 | 34 (3.2%) | 50 (5.0%) |
| $25,000 to $29,999 | 83 (7.7%) | 17 (1.7%) |
| $30,000 to $34,999 | 22 (2.0%) | 32 (3.2%) |
| $35,000 to $39,999 | 36 (3.4%) | 37 (3.7%) |
| $40,000 to $44,999 | 0 (0.0%) | 40 (4.0%) |
| $45,000 to $49,999 | 82 (7.6%) | 47 (4.7%) |
| $50,000 to $54,999 | 78 (7.2%) | 36 (3.6%) |
| $55,000 to $64,999 | 68 (6.3%) | 18 (1.8%) |
| $65,000 to $74,999 | 15 (1.4%) | 157 (15.7%) |
| $75,000 to $99,999 | 170 (15.8%) | 124 (12.4%) |
| $100,000+ | 350 (32.5%) | 86 (8.6%) |
| Total | 1,076 (100.0%) | 1,002 (100.0%) |
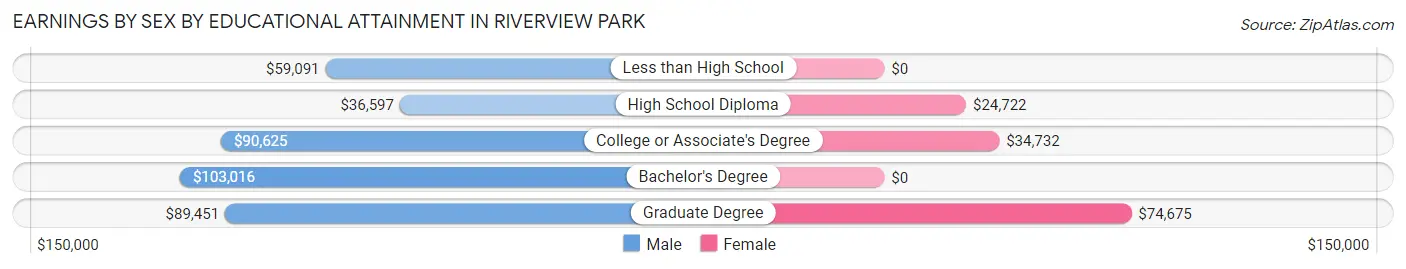
Earnings by Sex by Educational Attainment in Riverview Park
Average earnings in Riverview Park are $81,131 for men and $46,583 for women, a difference of 42.6%. Men with an educational attainment of bachelor's degree enjoy the highest average annual earnings of $103,016, while those with high school diploma education earn the least with $36,597. Women with an educational attainment of graduate degree earn the most with the average annual earnings of $74,675, while those with high school diploma education have the smallest earnings of $24,722.
| Educational Attainment | Male Income | Female Income |
| Less than High School | $59,091 | $0 |
| High School Diploma | $36,597 | $24,722 |
| College or Associate's Degree | $90,625 | $34,732 |
| Bachelor's Degree | $103,016 | $0 |
| Graduate Degree | $89,451 | $74,675 |
| Total | $81,131 | $46,583 |
Family Income in Riverview Park
Family Income Brackets in Riverview Park
According to the Riverview Park family income data, there are 317 families falling into the $100,000 to $149,999 income range, which is the most common income bracket and makes up 34.6% of all families.
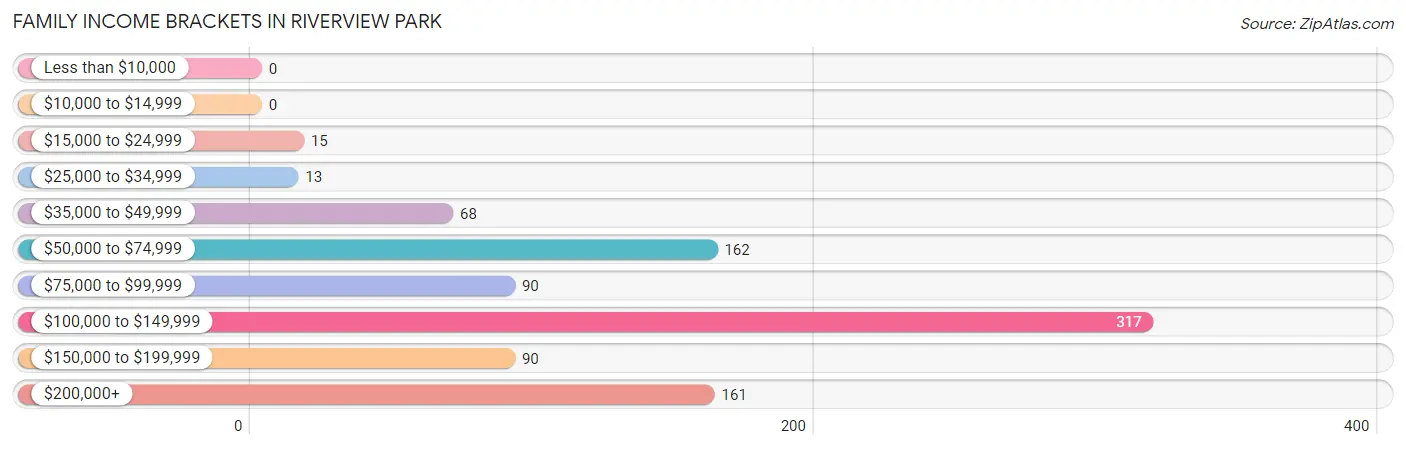
| Income Bracket | # Families | % Families |
| Less than $10,000 | 0 | 0.0% |
| $10,000 to $14,999 | 0 | 0.0% |
| $15,000 to $24,999 | 15 | 1.6% |
| $25,000 to $34,999 | 13 | 1.4% |
| $35,000 to $49,999 | 68 | 7.4% |
| $50,000 to $74,999 | 162 | 17.7% |
| $75,000 to $99,999 | 90 | 9.8% |
| $100,000 to $149,999 | 317 | 34.6% |
| $150,000 to $199,999 | 90 | 9.8% |
| $200,000+ | 161 | 17.6% |
Family Income by Famaliy Size in Riverview Park
6-person families (31 | 3.4%) account for the highest median family income in Riverview Park with $154,018 per family, while 3-person families (160 | 17.5%) have the highest median income of $39,028 per family member.
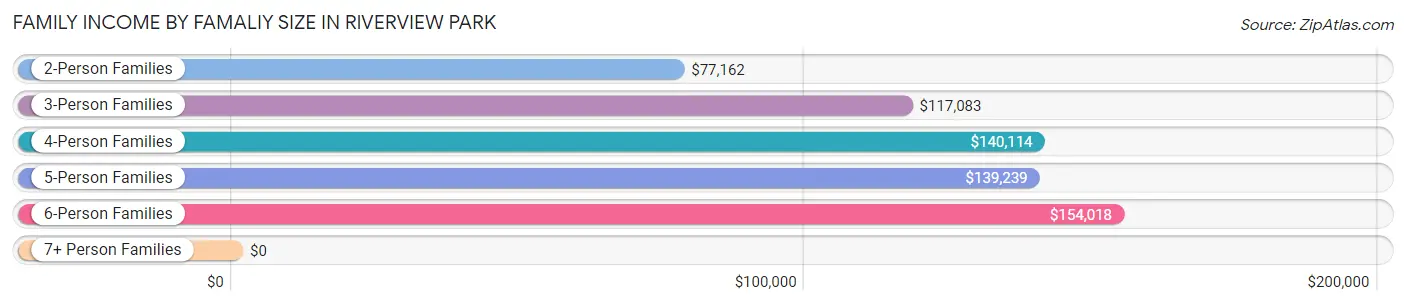
| Income Bracket | # Families | Median Income |
| 2-Person Families | 434 (47.4%) | $77,162 |
| 3-Person Families | 160 (17.5%) | $117,083 |
| 4-Person Families | 174 (19.0%) | $140,114 |
| 5-Person Families | 82 (8.9%) | $139,239 |
| 6-Person Families | 31 (3.4%) | $154,018 |
| 7+ Person Families | 35 (3.8%) | $0 |
| Total | 916 (100.0%) | $104,500 |
Family Income by Number of Earners in Riverview Park
The median family income in Riverview Park is $104,500, with families comprising 2 earners (459) having the highest median family income of $132,792, while families with no earners (133) have the lowest median family income of $74,107, accounting for 50.1% and 14.5% of families, respectively.
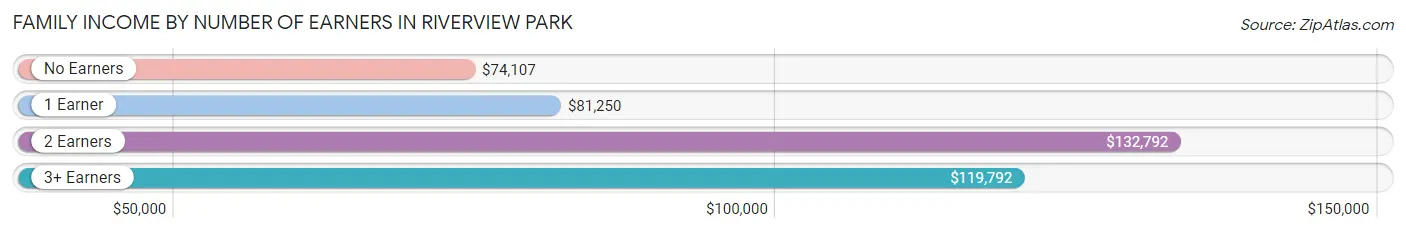
| Number of Earners | # Families | Median Income |
| No Earners | 133 (14.5%) | $74,107 |
| 1 Earner | 232 (25.3%) | $81,250 |
| 2 Earners | 459 (50.1%) | $132,792 |
| 3+ Earners | 92 (10.0%) | $119,792 |
| Total | 916 (100.0%) | $104,500 |
Household Income in Riverview Park
Household Income Brackets in Riverview Park
With 347 households falling in the category, the $100,000 to $149,999 income range is the most frequent in Riverview Park, accounting for 24.7% of all households.
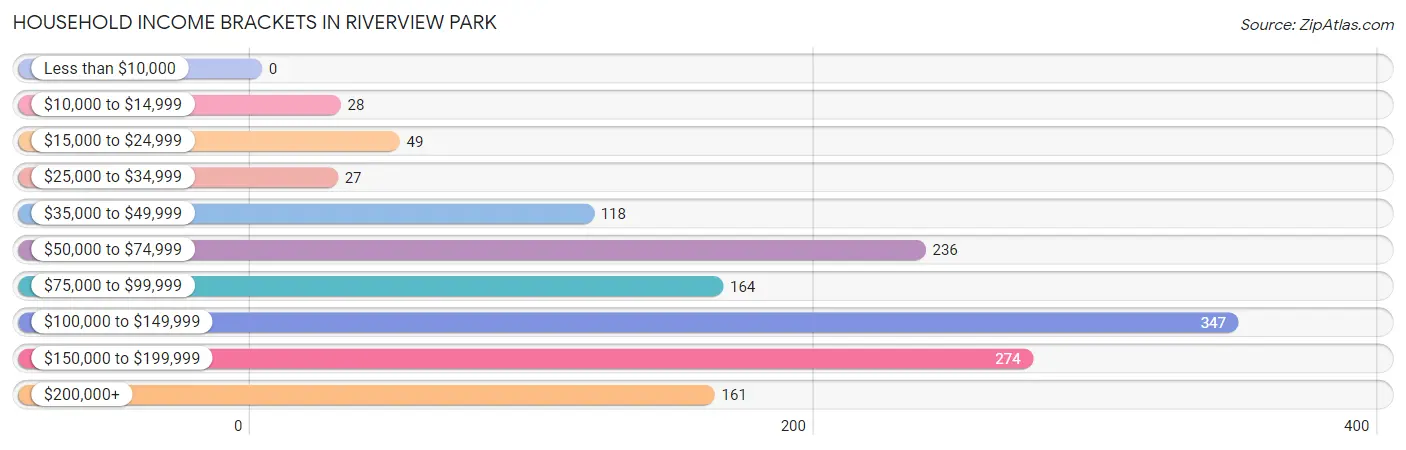
| Income Bracket | # Households | % Households |
| Less than $10,000 | 0 | 0.0% |
| $10,000 to $14,999 | 28 | 2.0% |
| $15,000 to $24,999 | 49 | 3.5% |
| $25,000 to $34,999 | 27 | 1.9% |
| $35,000 to $49,999 | 118 | 8.4% |
| $50,000 to $74,999 | 236 | 16.8% |
| $75,000 to $99,999 | 164 | 11.7% |
| $100,000 to $149,999 | 347 | 24.7% |
| $150,000 to $199,999 | 274 | 19.5% |
| $200,000+ | 161 | 11.5% |
Household Income by Householder Age in Riverview Park
The median household income in Riverview Park is $106,338, with the highest median household income of $175,379 found in the 25 to 44 years age bracket for the primary householder. A total of 419 households (29.9%) fall into this category. Meanwhile, the 15 to 24 years age bracket for the primary householder has the lowest median household income of $0, with 14 households (1.0%) in this group.
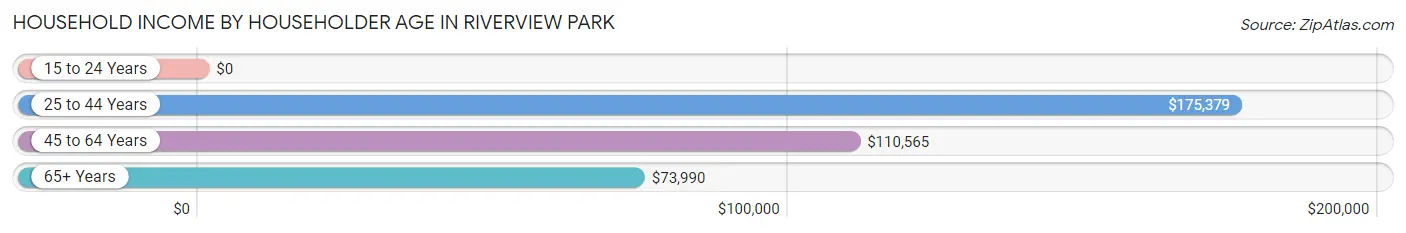
| Income Bracket | # Households | Median Income |
| 15 to 24 Years | 14 (1.0%) | $0 |
| 25 to 44 Years | 419 (29.9%) | $175,379 |
| 45 to 64 Years | 612 (43.6%) | $110,565 |
| 65+ Years | 358 (25.5%) | $73,990 |
| Total | 1,403 (100.0%) | $106,338 |
Poverty in Riverview Park
Income Below Poverty by Sex and Age in Riverview Park
With 1.6% poverty level for males and 3.3% for females among the residents of Riverview Park, 18 to 24 year old males and 65 to 74 year old females are the most vulnerable to poverty, with 13 males (27.1%) and 32 females (17.3%) in their respective age groups living below the poverty level.
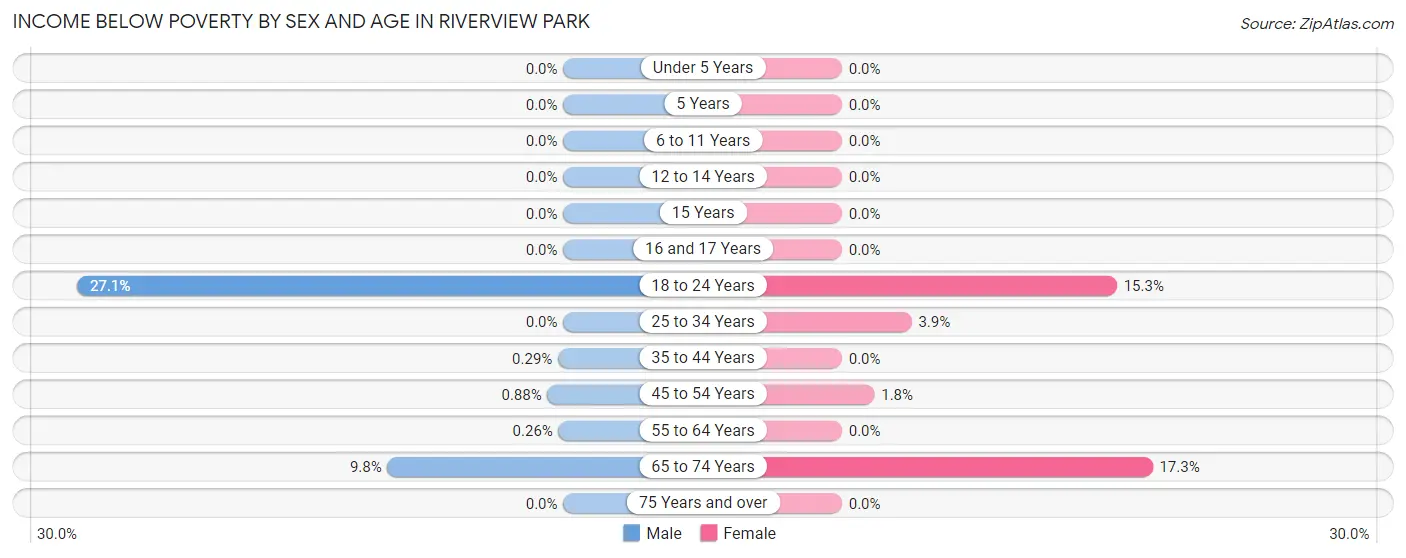
| Age Bracket | Male | Female |
| Under 5 Years | 0 (0.0%) | 0 (0.0%) |
| 5 Years | 0 (0.0%) | 0 (0.0%) |
| 6 to 11 Years | 0 (0.0%) | 0 (0.0%) |
| 12 to 14 Years | 0 (0.0%) | 0 (0.0%) |
| 15 Years | 0 (0.0%) | 0 (0.0%) |
| 16 and 17 Years | 0 (0.0%) | 0 (0.0%) |
| 18 to 24 Years | 13 (27.1%) | 15 (15.3%) |
| 25 to 34 Years | 0 (0.0%) | 10 (3.9%) |
| 35 to 44 Years | 1 (0.3%) | 0 (0.0%) |
| 45 to 54 Years | 1 (0.9%) | 3 (1.8%) |
| 55 to 64 Years | 1 (0.3%) | 0 (0.0%) |
| 65 to 74 Years | 14 (9.8%) | 32 (17.3%) |
| 75 Years and over | 0 (0.0%) | 0 (0.0%) |
| Total | 30 (1.6%) | 60 (3.3%) |
Income Above Poverty by Sex and Age in Riverview Park
According to the poverty statistics in Riverview Park, males aged under 5 years and females aged under 5 years are the age groups that are most secure financially, with 100.0% of males and 100.0% of females in these age groups living above the poverty line.
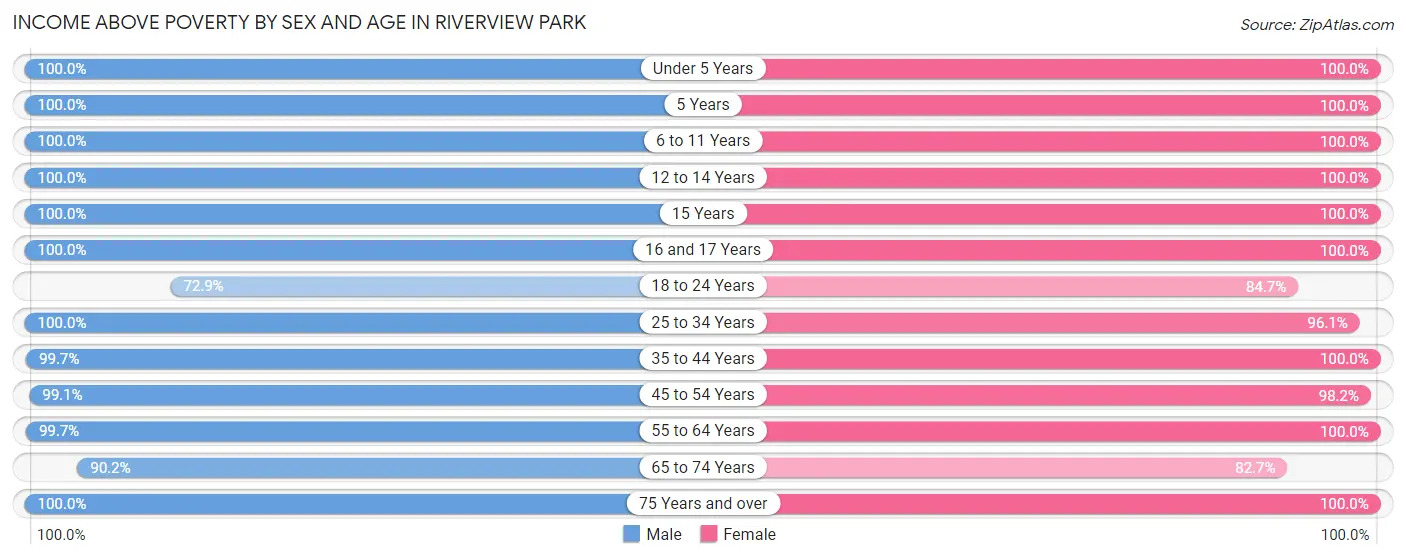
| Age Bracket | Male | Female |
| Under 5 Years | 170 (100.0%) | 120 (100.0%) |
| 5 Years | 7 (100.0%) | 1 (100.0%) |
| 6 to 11 Years | 129 (100.0%) | 92 (100.0%) |
| 12 to 14 Years | 76 (100.0%) | 44 (100.0%) |
| 15 Years | 35 (100.0%) | 2 (100.0%) |
| 16 and 17 Years | 46 (100.0%) | 47 (100.0%) |
| 18 to 24 Years | 35 (72.9%) | 83 (84.7%) |
| 25 to 34 Years | 245 (100.0%) | 248 (96.1%) |
| 35 to 44 Years | 342 (99.7%) | 249 (100.0%) |
| 45 to 54 Years | 113 (99.1%) | 163 (98.2%) |
| 55 to 64 Years | 383 (99.7%) | 395 (100.0%) |
| 65 to 74 Years | 129 (90.2%) | 153 (82.7%) |
| 75 Years and over | 141 (100.0%) | 137 (100.0%) |
| Total | 1,851 (98.4%) | 1,734 (96.7%) |
Income Below Poverty Among Married-Couple Families in Riverview Park
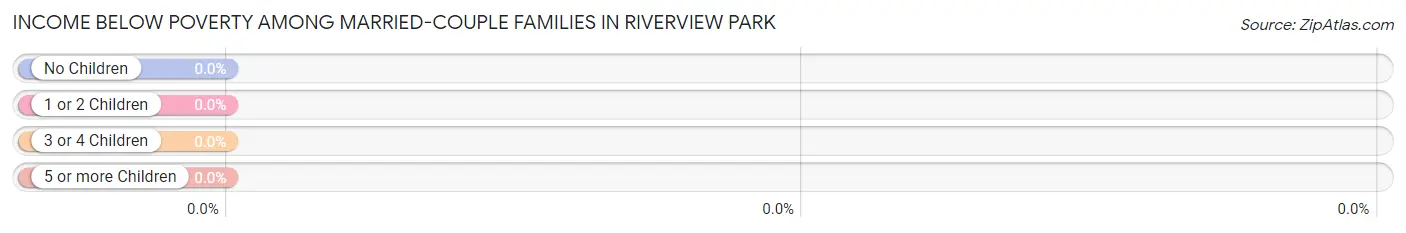
| Children | Above Poverty | Below Poverty |
| No Children | 438 (100.0%) | 0 (0.0%) |
| 1 or 2 Children | 236 (100.0%) | 0 (0.0%) |
| 3 or 4 Children | 99 (100.0%) | 0 (0.0%) |
| 5 or more Children | 0 (0.0%) | 0 (0.0%) |
| Total | 773 (100.0%) | 0 (0.0%) |
Income Below Poverty Among Single-Parent Households in Riverview Park
| Children | Single Father | Single Mother |
| No Children | 0 (0.0%) | 0 (0.0%) |
| 1 or 2 Children | 0 (0.0%) | 0 (0.0%) |
| 3 or 4 Children | 0 (0.0%) | 0 (0.0%) |
| 5 or more Children | 0 (0.0%) | 0 (0.0%) |
| Total | 0 (0.0%) | 0 (0.0%) |
Income Below Poverty Among Married-Couple vs Single-Parent Households in Riverview Park
| Children | Married-Couple Families | Single-Parent Households |
| No Children | 0 (0.0%) | 0 (0.0%) |
| 1 or 2 Children | 0 (0.0%) | 0 (0.0%) |
| 3 or 4 Children | 0 (0.0%) | 0 (0.0%) |
| 5 or more Children | 0 (0.0%) | 0 (0.0%) |
| Total | 0 (0.0%) | 0 (0.0%) |
Race in Riverview Park
The most populous races in Riverview Park are White / Caucasian (2,932 | 79.8%), Hispanic or Latino (422 | 11.5%), and Some other Race (268 | 7.3%).
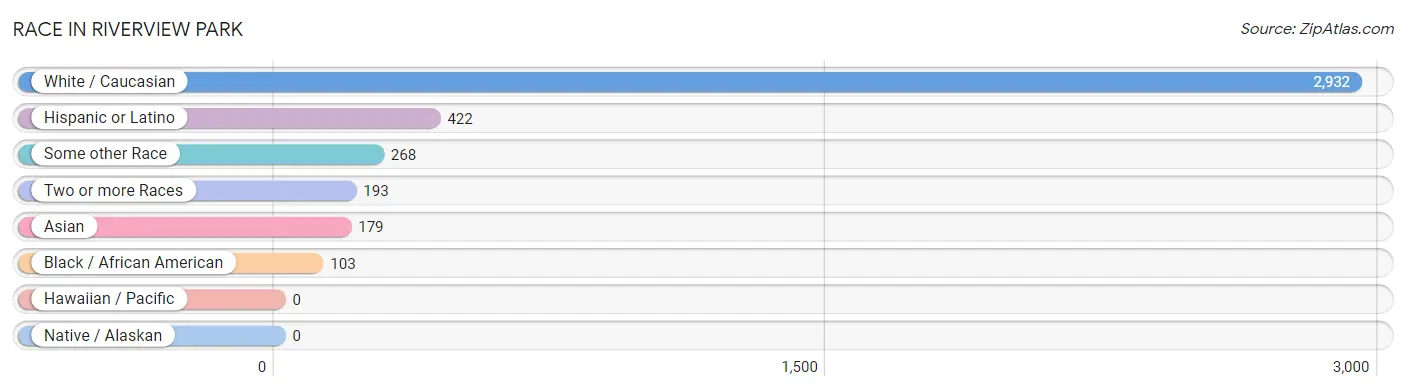
| Race | # Population | % Population |
| Asian | 179 | 4.9% |
| Black / African American | 103 | 2.8% |
| Hawaiian / Pacific | 0 | 0.0% |
| Hispanic or Latino | 422 | 11.5% |
| Native / Alaskan | 0 | 0.0% |
| White / Caucasian | 2,932 | 79.8% |
| Two or more Races | 193 | 5.2% |
| Some other Race | 268 | 7.3% |
| Total | 3,675 | 100.0% |
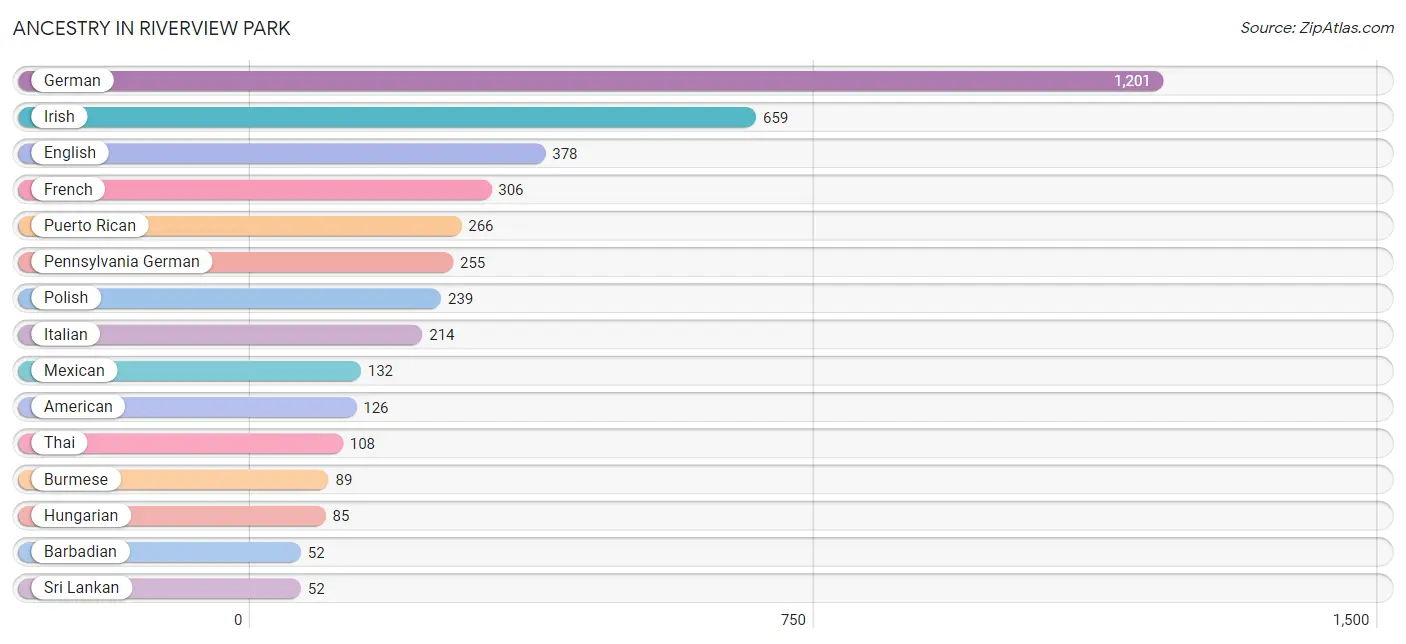
Ancestry in Riverview Park
The most populous ancestries reported in Riverview Park are German (1,201 | 32.7%), Irish (659 | 17.9%), English (378 | 10.3%), French (306 | 8.3%), and Puerto Rican (266 | 7.2%), together accounting for 76.5% of all Riverview Park residents.
| Ancestry | # Population | % Population |
| Afghan | 19 | 0.5% |
| American | 126 | 3.4% |
| Austrian | 15 | 0.4% |
| Barbadian | 52 | 1.4% |
| Burmese | 89 | 2.4% |
| Dominican | 24 | 0.6% |
| Eastern European | 14 | 0.4% |
| English | 378 | 10.3% |
| European | 18 | 0.5% |
| French | 306 | 8.3% |
| German | 1,201 | 32.7% |
| Haitian | 28 | 0.8% |
| Hungarian | 85 | 2.3% |
| Irish | 659 | 17.9% |
| Italian | 214 | 5.8% |
| Latvian | 8 | 0.2% |
| Lithuanian | 31 | 0.8% |
| Mexican | 132 | 3.6% |
| Pennsylvania German | 255 | 6.9% |
| Polish | 239 | 6.5% |
| Puerto Rican | 266 | 7.2% |
| Russian | 20 | 0.5% |
| Sioux | 5 | 0.1% |
| Slovak | 44 | 1.2% |
| Sri Lankan | 52 | 1.4% |
| Swedish | 16 | 0.4% |
| Thai | 108 | 2.9% |
| Ukrainian | 12 | 0.3% |
| Welsh | 18 | 0.5% | View All 29 Rows |
Immigrants in Riverview Park
The most numerous immigrant groups reported in Riverview Park came from Latin America (84 | 2.3%), Asia (75 | 2.0%), South Central Asia (51 | 1.4%), Central America (48 | 1.3%), and Mexico (48 | 1.3%), together accounting for 8.3% of all Riverview Park residents.
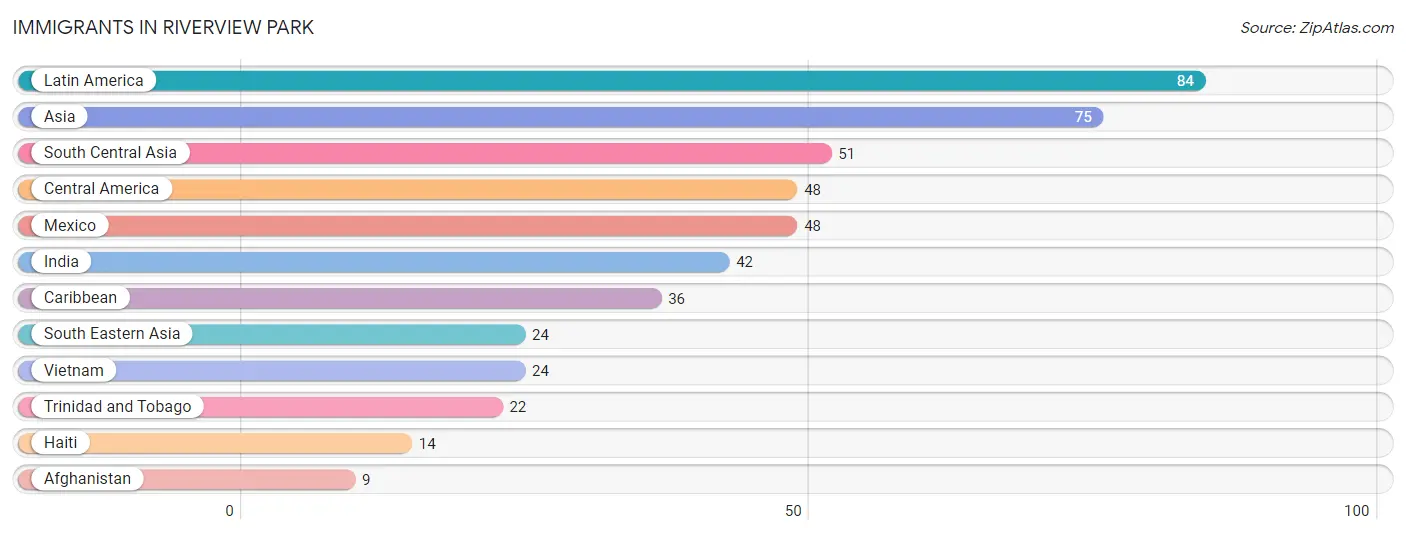
| Immigration Origin | # Population | % Population |
| Afghanistan | 9 | 0.2% |
| Asia | 75 | 2.0% |
| Caribbean | 36 | 1.0% |
| Central America | 48 | 1.3% |
| Haiti | 14 | 0.4% |
| India | 42 | 1.1% |
| Latin America | 84 | 2.3% |
| Mexico | 48 | 1.3% |
| South Central Asia | 51 | 1.4% |
| South Eastern Asia | 24 | 0.6% |
| Trinidad and Tobago | 22 | 0.6% |
| Vietnam | 24 | 0.6% | View All 12 Rows |
Sex and Age in Riverview Park
Sex and Age in Riverview Park
The most populous age groups in Riverview Park are 35 to 39 Years (252 | 13.4%) for men and 25 to 29 Years (208 | 11.6%) for women.
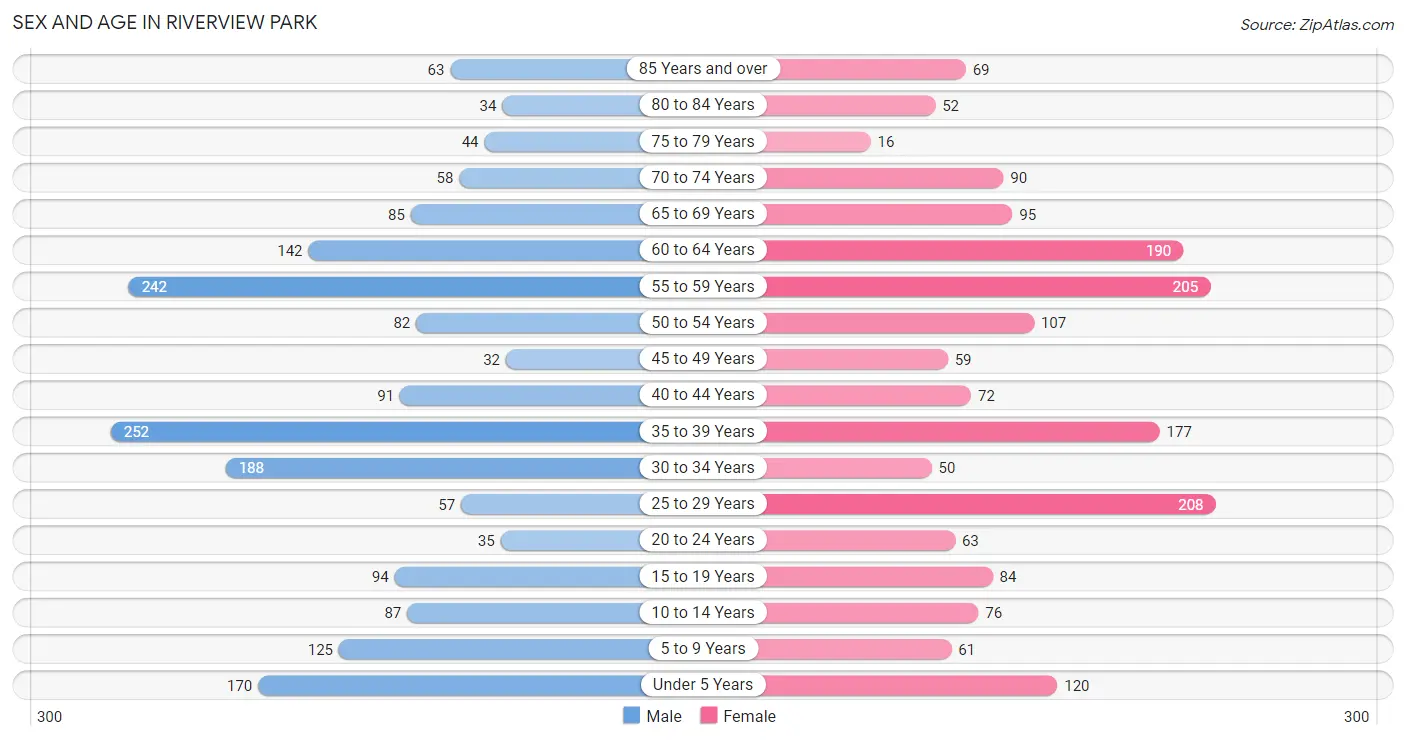
| Age Bracket | Male | Female |
| Under 5 Years | 170 (9.0%) | 120 (6.7%) |
| 5 to 9 Years | 125 (6.7%) | 61 (3.4%) |
| 10 to 14 Years | 87 (4.6%) | 76 (4.2%) |
| 15 to 19 Years | 94 (5.0%) | 84 (4.7%) |
| 20 to 24 Years | 35 (1.9%) | 63 (3.5%) |
| 25 to 29 Years | 57 (3.0%) | 208 (11.6%) |
| 30 to 34 Years | 188 (10.0%) | 50 (2.8%) |
| 35 to 39 Years | 252 (13.4%) | 177 (9.9%) |
| 40 to 44 Years | 91 (4.8%) | 72 (4.0%) |
| 45 to 49 Years | 32 (1.7%) | 59 (3.3%) |
| 50 to 54 Years | 82 (4.4%) | 107 (6.0%) |
| 55 to 59 Years | 242 (12.9%) | 205 (11.4%) |
| 60 to 64 Years | 142 (7.5%) | 190 (10.6%) |
| 65 to 69 Years | 85 (4.5%) | 95 (5.3%) |
| 70 to 74 Years | 58 (3.1%) | 90 (5.0%) |
| 75 to 79 Years | 44 (2.3%) | 16 (0.9%) |
| 80 to 84 Years | 34 (1.8%) | 52 (2.9%) |
| 85 Years and over | 63 (3.4%) | 69 (3.8%) |
| Total | 1,881 (100.0%) | 1,794 (100.0%) |
Families and Households in Riverview Park
Median Family Size in Riverview Park
The median family size in Riverview Park is 3.15 persons per family, with single female/mother families (113 | 12.3%) accounting for the largest median family size of 3.41 persons per family. On the other hand, single male/father families (30 | 3.3%) represent the smallest median family size with 2.17 persons per family.
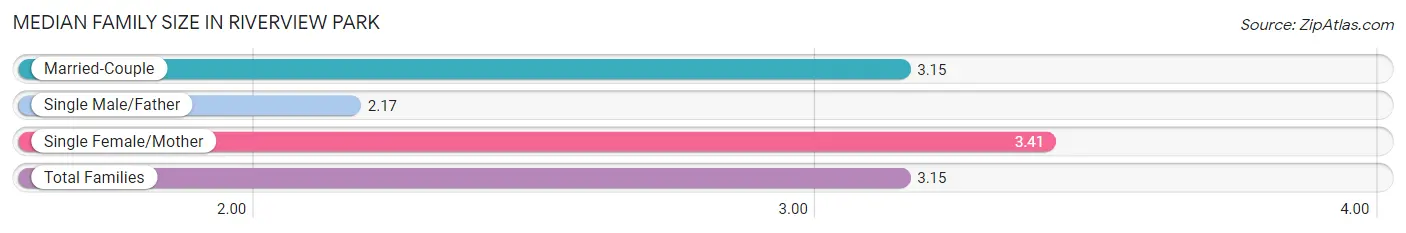
| Family Type | # Families | Family Size |
| Married-Couple | 773 (84.4%) | 3.15 |
| Single Male/Father | 30 (3.3%) | 2.17 |
| Single Female/Mother | 113 (12.3%) | 3.41 |
| Total Families | 916 (100.0%) | 3.15 |
Median Household Size in Riverview Park
The median household size in Riverview Park is 2.62 persons per household, with single female/mother households (113 | 8.1%) accounting for the largest median household size of 3.71 persons per household. non-family households (487 | 34.7%) represent the smallest median household size with 1.48 persons per household.
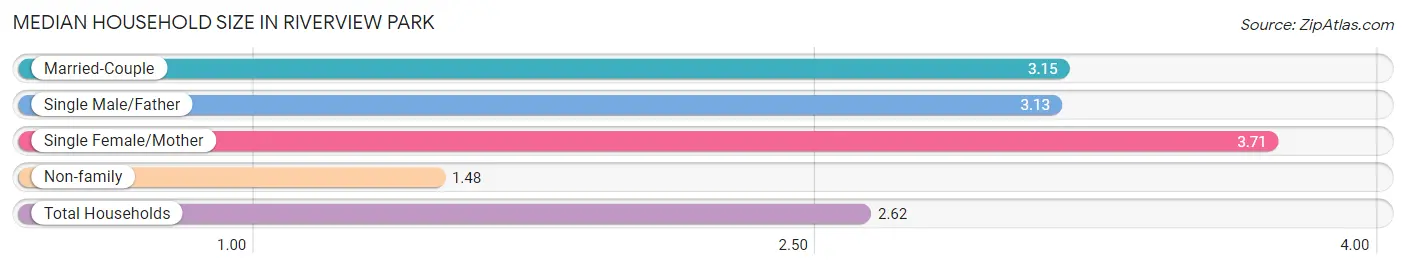
| Household Type | # Households | Household Size |
| Married-Couple | 773 (55.1%) | 3.15 |
| Single Male/Father | 30 (2.1%) | 3.13 |
| Single Female/Mother | 113 (8.1%) | 3.71 |
| Non-family | 487 (34.7%) | 1.48 |
| Total Households | 1,403 (100.0%) | 2.62 |
Household Size by Marriage Status in Riverview Park
Out of a total of 1,403 households in Riverview Park, 916 (65.3%) are family households, while 487 (34.7%) are nonfamily households. The most numerous type of family households are 2-person households, comprising 331, and the most common type of nonfamily households are 2-person households, comprising 249.
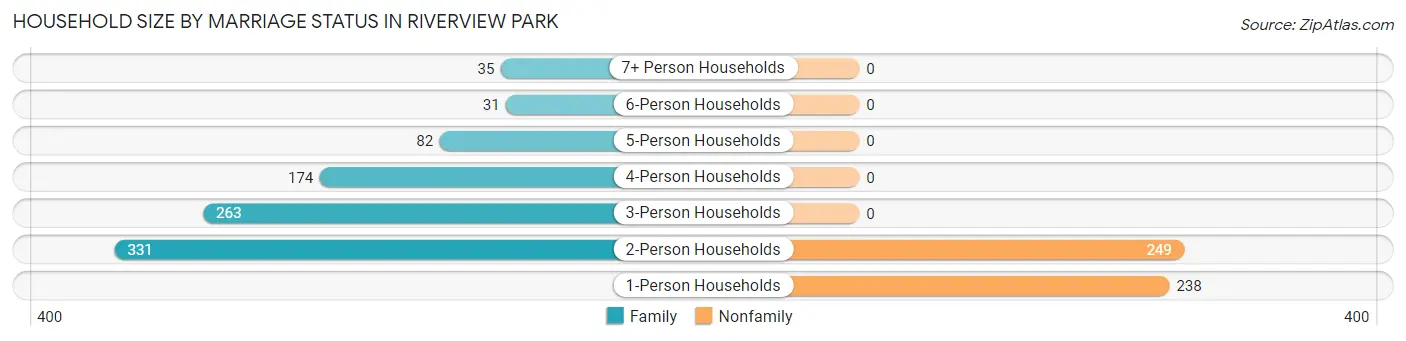
| Household Size | Family Households | Nonfamily Households |
| 1-Person Households | - | 238 (17.0%) |
| 2-Person Households | 331 (23.6%) | 249 (17.7%) |
| 3-Person Households | 263 (18.8%) | 0 (0.0%) |
| 4-Person Households | 174 (12.4%) | 0 (0.0%) |
| 5-Person Households | 82 (5.8%) | 0 (0.0%) |
| 6-Person Households | 31 (2.2%) | 0 (0.0%) |
| 7+ Person Households | 35 (2.5%) | 0 (0.0%) |
| Total | 916 (65.3%) | 487 (34.7%) |
Female Fertility in Riverview Park
Fertility by Age in Riverview Park
Average fertility rate in Riverview Park is 112.0 births per 1,000 women. Women in the age bracket of 35 to 50 years have the highest fertility rate with 163.0 births per 1,000 women. Women in the age bracket of 35 to 50 years acount for 64.2% of all women with births.
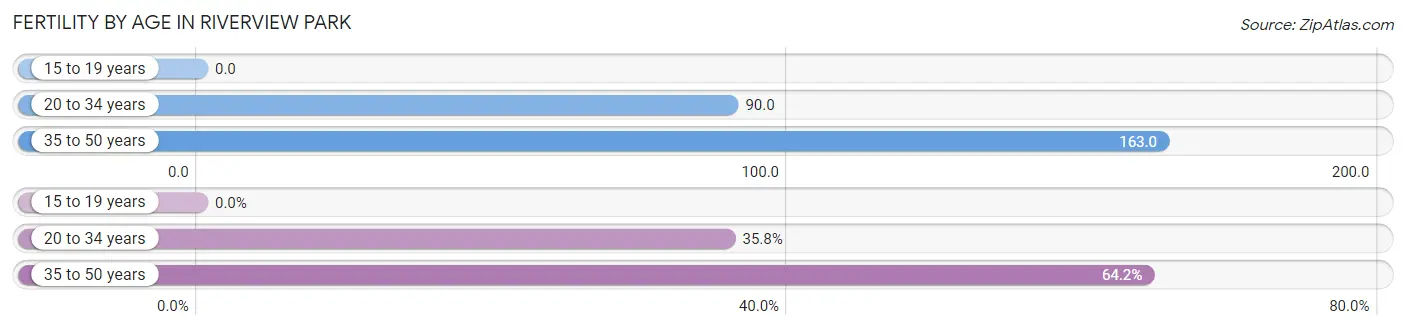
| Age Bracket | Women with Births | Births / 1,000 Women |
| 15 to 19 years | 0 (0.0%) | 0.0 |
| 20 to 34 years | 29 (35.8%) | 90.0 |
| 35 to 50 years | 52 (64.2%) | 163.0 |
| Total | 81 (100.0%) | 112.0 |
Fertility by Age by Marriage Status in Riverview Park
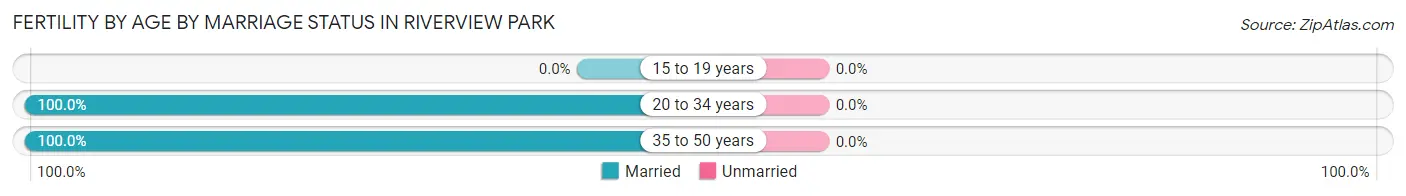
| Age Bracket | Married | Unmarried |
| 15 to 19 years | 0 (0.0%) | 0 (0.0%) |
| 20 to 34 years | 29 (100.0%) | 0 (0.0%) |
| 35 to 50 years | 52 (100.0%) | 0 (0.0%) |
| Total | 81 (100.0%) | 0 (0.0%) |
Fertility by Education in Riverview Park
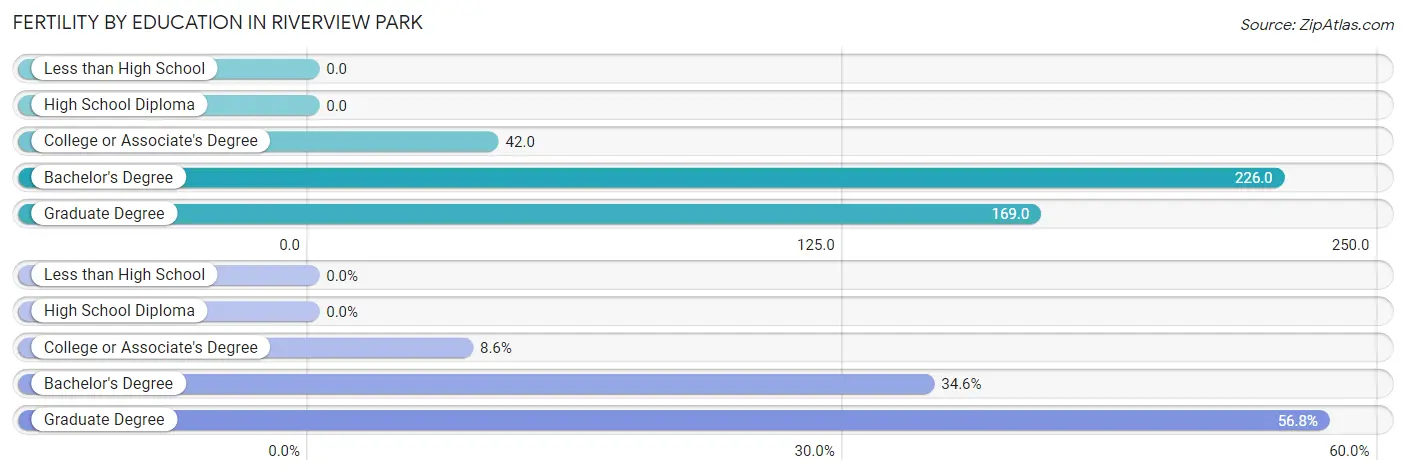
| Educational Attainment | Women with Births | Births / 1,000 Women |
| Less than High School | 0 (0.0%) | 0.0 |
| High School Diploma | 0 (0.0%) | 0.0 |
| College or Associate's Degree | 7 (8.6%) | 42.0 |
| Bachelor's Degree | 28 (34.6%) | 226.0 |
| Graduate Degree | 46 (56.8%) | 169.0 |
| Total | 81 (100.0%) | 112.0 |
Fertility by Education by Marriage Status in Riverview Park
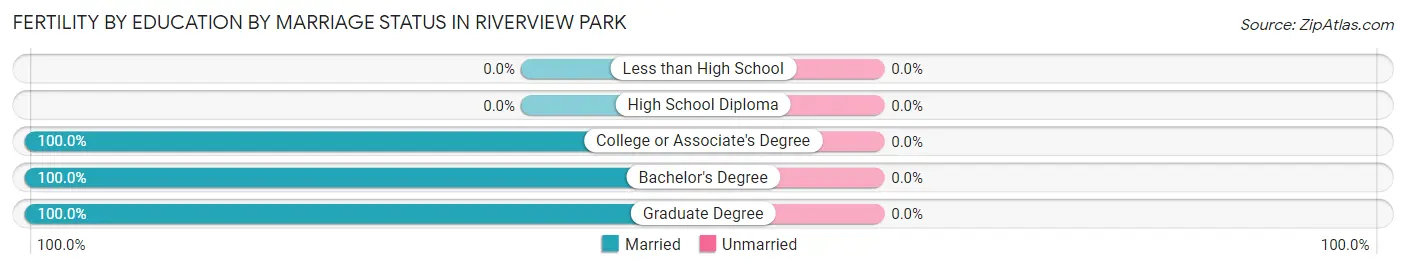
| Educational Attainment | Married | Unmarried |
| Less than High School | 0 (0.0%) | 0 (0.0%) |
| High School Diploma | 0 (0.0%) | 0 (0.0%) |
| College or Associate's Degree | 7 (100.0%) | 0 (0.0%) |
| Bachelor's Degree | 28 (100.0%) | 0 (0.0%) |
| Graduate Degree | 46 (100.0%) | 0 (0.0%) |
| Total | 81 (100.0%) | 0 (0.0%) |
Employment Characteristics in Riverview Park
Employment by Class of Employer in Riverview Park
Among the 1,993 employed individuals in Riverview Park, private company employees (1,186 | 59.5%), not-for-profit organizations (429 | 21.5%), and self-employed (not incorporated) (244 | 12.2%) make up the most common classes of employment.
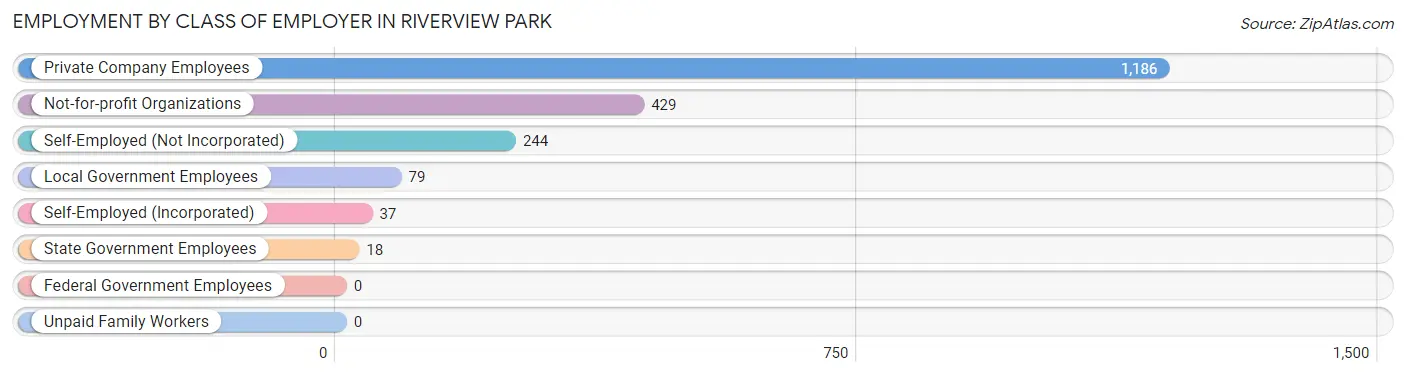
| Employer Class | # Employees | % Employees |
| Private Company Employees | 1,186 | 59.5% |
| Self-Employed (Incorporated) | 37 | 1.9% |
| Self-Employed (Not Incorporated) | 244 | 12.2% |
| Not-for-profit Organizations | 429 | 21.5% |
| Local Government Employees | 79 | 4.0% |
| State Government Employees | 18 | 0.9% |
| Federal Government Employees | 0 | 0.0% |
| Unpaid Family Workers | 0 | 0.0% |
| Total | 1,993 | 100.0% |
Employment Status by Age in Riverview Park
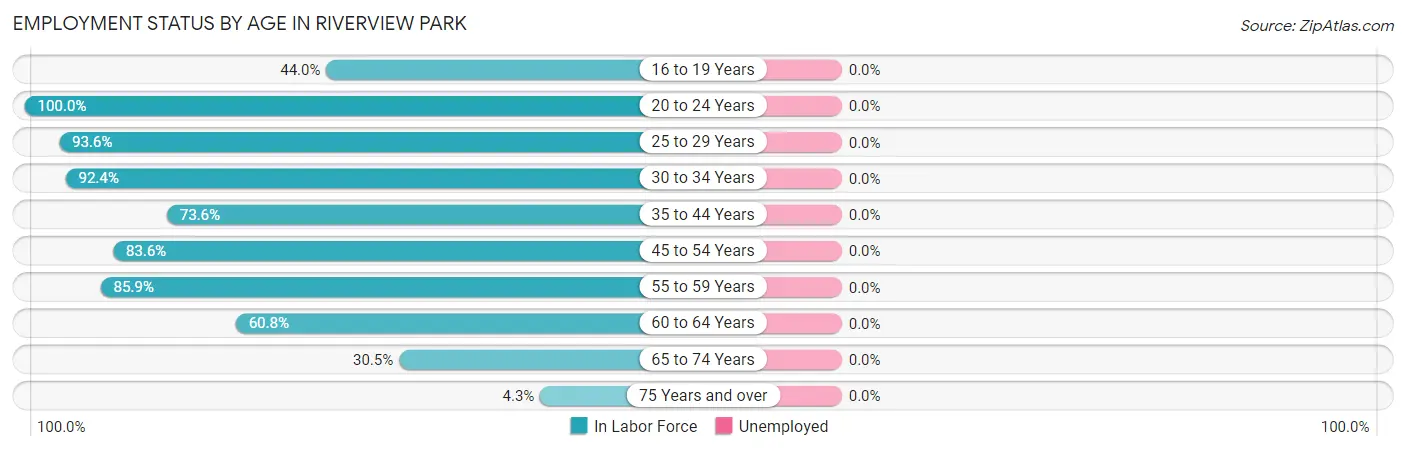
| Age Bracket | In Labor Force | Unemployed |
| 16 to 19 Years | 62 (44.0%) | 0 (0.0%) |
| 20 to 24 Years | 98 (100.0%) | 0 (0.0%) |
| 25 to 29 Years | 248 (93.6%) | 0 (0.0%) |
| 30 to 34 Years | 220 (92.4%) | 0 (0.0%) |
| 35 to 44 Years | 436 (73.6%) | 0 (0.0%) |
| 45 to 54 Years | 234 (83.6%) | 0 (0.0%) |
| 55 to 59 Years | 384 (85.9%) | 0 (0.0%) |
| 60 to 64 Years | 202 (60.8%) | 0 (0.0%) |
| 65 to 74 Years | 100 (30.5%) | 0 (0.0%) |
| 75 Years and over | 12 (4.3%) | 0 (0.0%) |
| Total | 1,997 (66.6%) | 0 (0.0%) |
Employment Status by Educational Attainment in Riverview Park
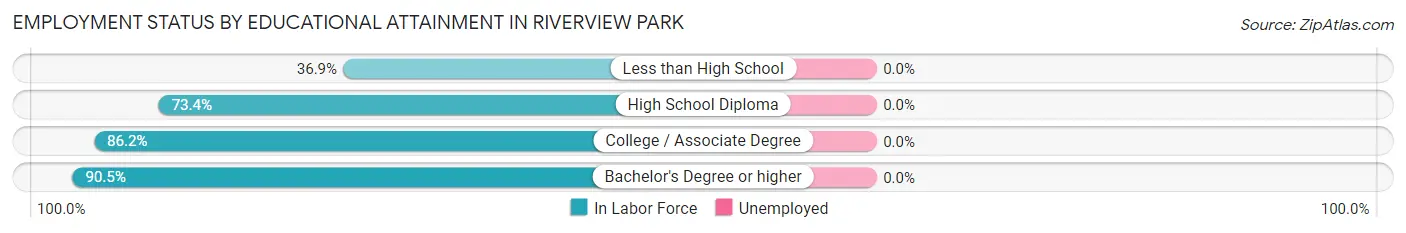
| Educational Attainment | In Labor Force | Unemployed |
| Less than High School | 66 (36.9%) | 0 (0.0%) |
| High School Diploma | 468 (73.4%) | 0 (0.0%) |
| College / Associate Degree | 393 (86.2%) | 0 (0.0%) |
| Bachelor's Degree or higher | 797 (90.5%) | 0 (0.0%) |
| Total | 1,723 (80.0%) | 0 (0.0%) |
Employment Occupations by Sex in Riverview Park
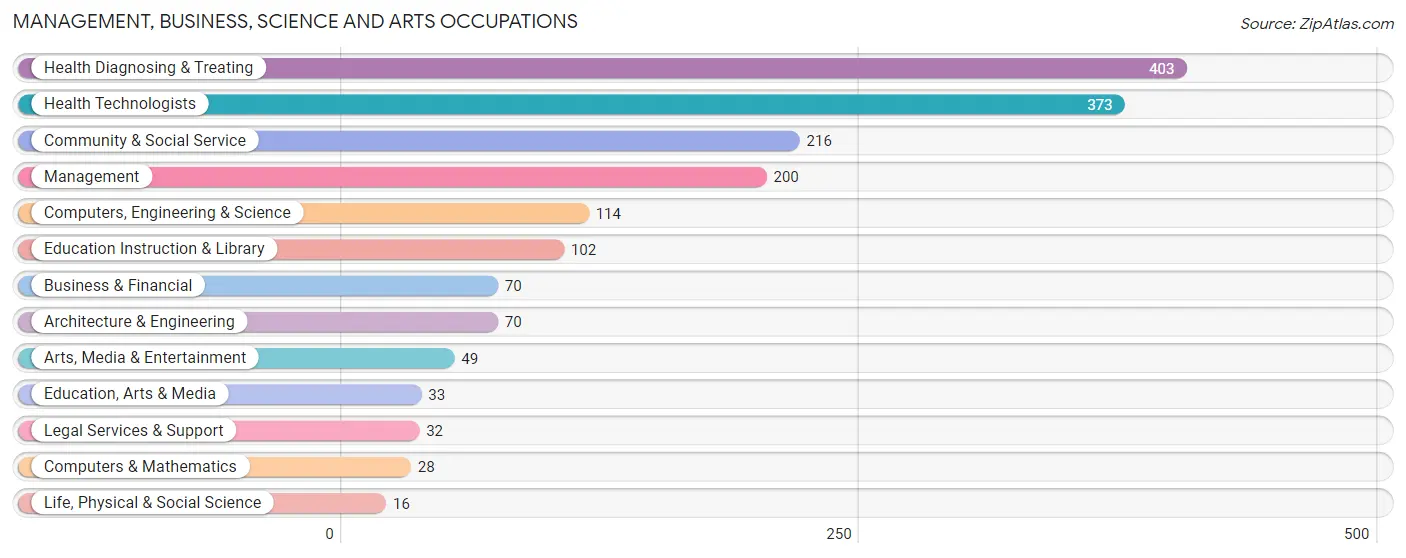
Management, Business, Science and Arts Occupations
The most common Management, Business, Science and Arts occupations in Riverview Park are Health Diagnosing & Treating (403 | 20.2%), Health Technologists (373 | 18.7%), Community & Social Service (216 | 10.8%), Management (200 | 10.0%), and Computers, Engineering & Science (114 | 5.7%).
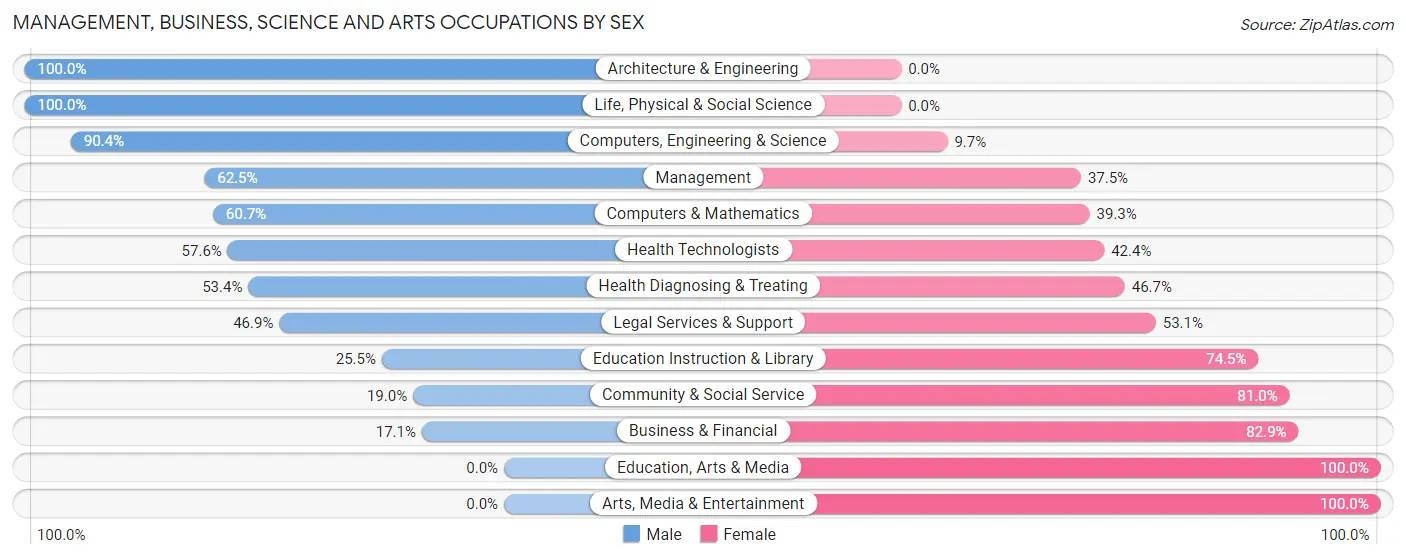
Management, Business, Science and Arts Occupations by Sex
Within the Management, Business, Science and Arts occupations in Riverview Park, the most male-oriented occupations are Architecture & Engineering (100.0%), Life, Physical & Social Science (100.0%), and Computers, Engineering & Science (90.3%), while the most female-oriented occupations are Education, Arts & Media (100.0%), Arts, Media & Entertainment (100.0%), and Business & Financial (82.9%).
| Occupation | Male | Female |
| Management | 125 (62.5%) | 75 (37.5%) |
| Business & Financial | 12 (17.1%) | 58 (82.9%) |
| Computers, Engineering & Science | 103 (90.3%) | 11 (9.7%) |
| Computers & Mathematics | 17 (60.7%) | 11 (39.3%) |
| Architecture & Engineering | 70 (100.0%) | 0 (0.0%) |
| Life, Physical & Social Science | 16 (100.0%) | 0 (0.0%) |
| Community & Social Service | 41 (19.0%) | 175 (81.0%) |
| Education, Arts & Media | 0 (0.0%) | 33 (100.0%) |
| Legal Services & Support | 15 (46.9%) | 17 (53.1%) |
| Education Instruction & Library | 26 (25.5%) | 76 (74.5%) |
| Arts, Media & Entertainment | 0 (0.0%) | 49 (100.0%) |
| Health Diagnosing & Treating | 215 (53.3%) | 188 (46.7%) |
| Health Technologists | 215 (57.6%) | 158 (42.4%) |
| Total (Category) | 496 (49.4%) | 507 (50.5%) |
| Total (Overall) | 1,022 (51.2%) | 974 (48.8%) |
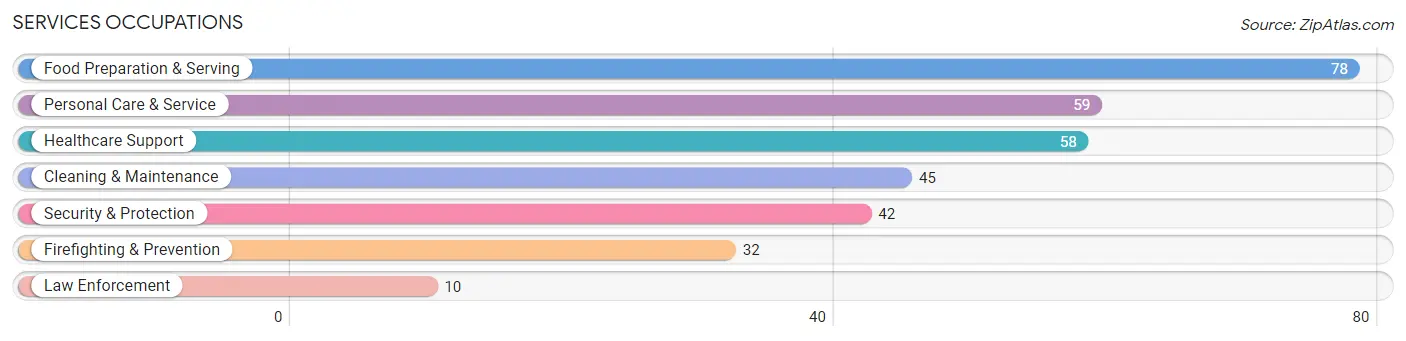
Services Occupations
The most common Services occupations in Riverview Park are Food Preparation & Serving (78 | 3.9%), Personal Care & Service (59 | 3.0%), Healthcare Support (58 | 2.9%), Cleaning & Maintenance (45 | 2.2%), and Security & Protection (42 | 2.1%).
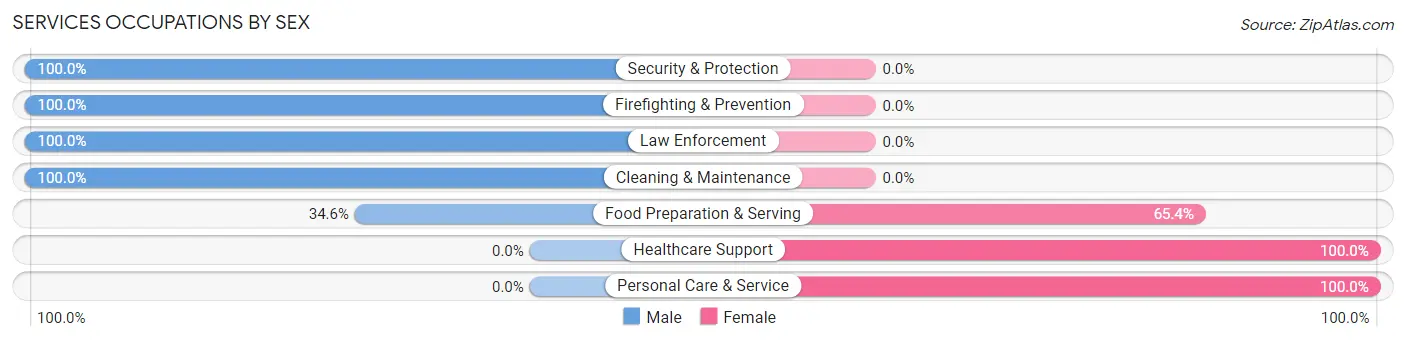
Services Occupations by Sex
Within the Services occupations in Riverview Park, the most male-oriented occupations are Security & Protection (100.0%), Firefighting & Prevention (100.0%), and Law Enforcement (100.0%), while the most female-oriented occupations are Healthcare Support (100.0%), Personal Care & Service (100.0%), and Food Preparation & Serving (65.4%).
| Occupation | Male | Female |
| Healthcare Support | 0 (0.0%) | 58 (100.0%) |
| Security & Protection | 42 (100.0%) | 0 (0.0%) |
| Firefighting & Prevention | 32 (100.0%) | 0 (0.0%) |
| Law Enforcement | 10 (100.0%) | 0 (0.0%) |
| Food Preparation & Serving | 27 (34.6%) | 51 (65.4%) |
| Cleaning & Maintenance | 45 (100.0%) | 0 (0.0%) |
| Personal Care & Service | 0 (0.0%) | 59 (100.0%) |
| Total (Category) | 114 (40.4%) | 168 (59.6%) |
| Total (Overall) | 1,022 (51.2%) | 974 (48.8%) |
Sales and Office Occupations
The most common Sales and Office occupations in Riverview Park are Office & Administration (212 | 10.6%), and Sales & Related (190 | 9.5%).

Sales and Office Occupations by Sex

| Occupation | Male | Female |
| Sales & Related | 104 (54.7%) | 86 (45.3%) |
| Office & Administration | 15 (7.1%) | 197 (92.9%) |
| Total (Category) | 119 (29.6%) | 283 (70.4%) |
| Total (Overall) | 1,022 (51.2%) | 974 (48.8%) |
Natural Resources, Construction and Maintenance Occupations
The most common Natural Resources, Construction and Maintenance occupations in Riverview Park are , and Installation, Maintenance & Repair (55 | 2.8%).
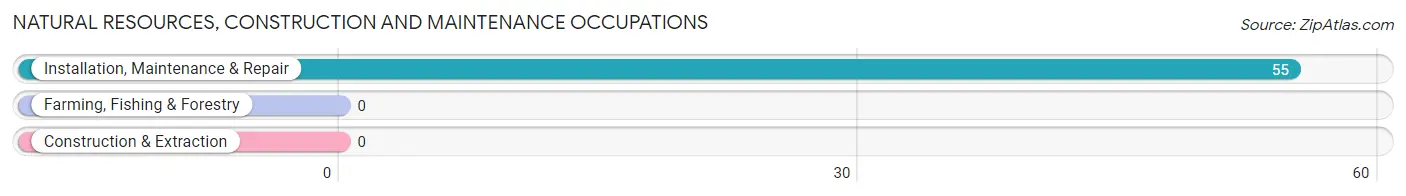
Natural Resources, Construction and Maintenance Occupations by Sex

| Occupation | Male | Female |
| Farming, Fishing & Forestry | 0 (0.0%) | 0 (0.0%) |
| Construction & Extraction | 0 (0.0%) | 0 (0.0%) |
| Installation, Maintenance & Repair | 55 (100.0%) | 0 (0.0%) |
| Total (Category) | 55 (100.0%) | 0 (0.0%) |
| Total (Overall) | 1,022 (51.2%) | 974 (48.8%) |
Production, Transportation and Moving Occupations
The most common Production, Transportation and Moving occupations in Riverview Park are Production (127 | 6.4%), Material Moving (101 | 5.1%), and Transportation (26 | 1.3%).
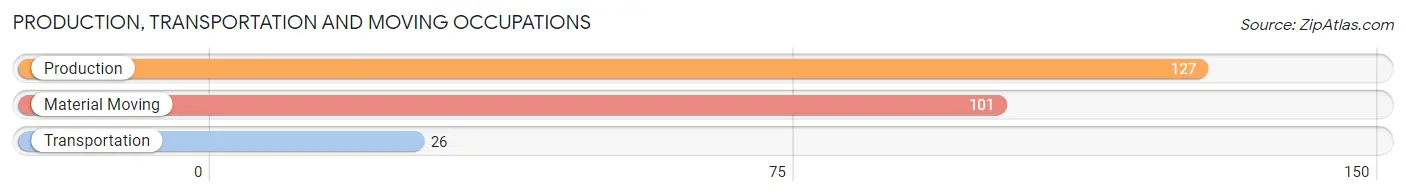
Production, Transportation and Moving Occupations by Sex
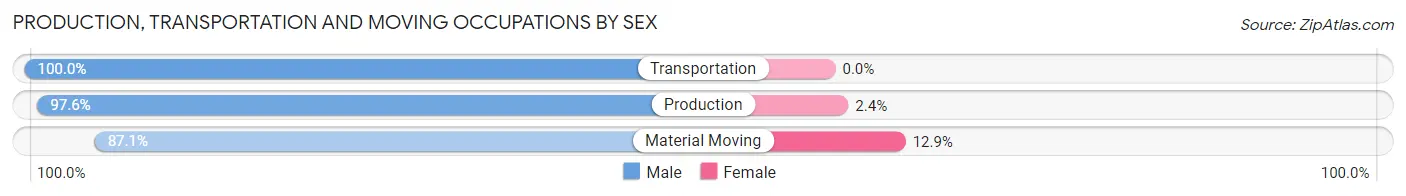
| Occupation | Male | Female |
| Production | 124 (97.6%) | 3 (2.4%) |
| Transportation | 26 (100.0%) | 0 (0.0%) |
| Material Moving | 88 (87.1%) | 13 (12.9%) |
| Total (Category) | 238 (93.7%) | 16 (6.3%) |
| Total (Overall) | 1,022 (51.2%) | 974 (48.8%) |
Employment Industries by Sex in Riverview Park
Employment Industries in Riverview Park
The major employment industries in Riverview Park include Health Care & Social Assistance (546 | 27.4%), Manufacturing (346 | 17.3%), Retail Trade (136 | 6.8%), Educational Services (117 | 5.9%), and Professional & Scientific (98 | 4.9%).
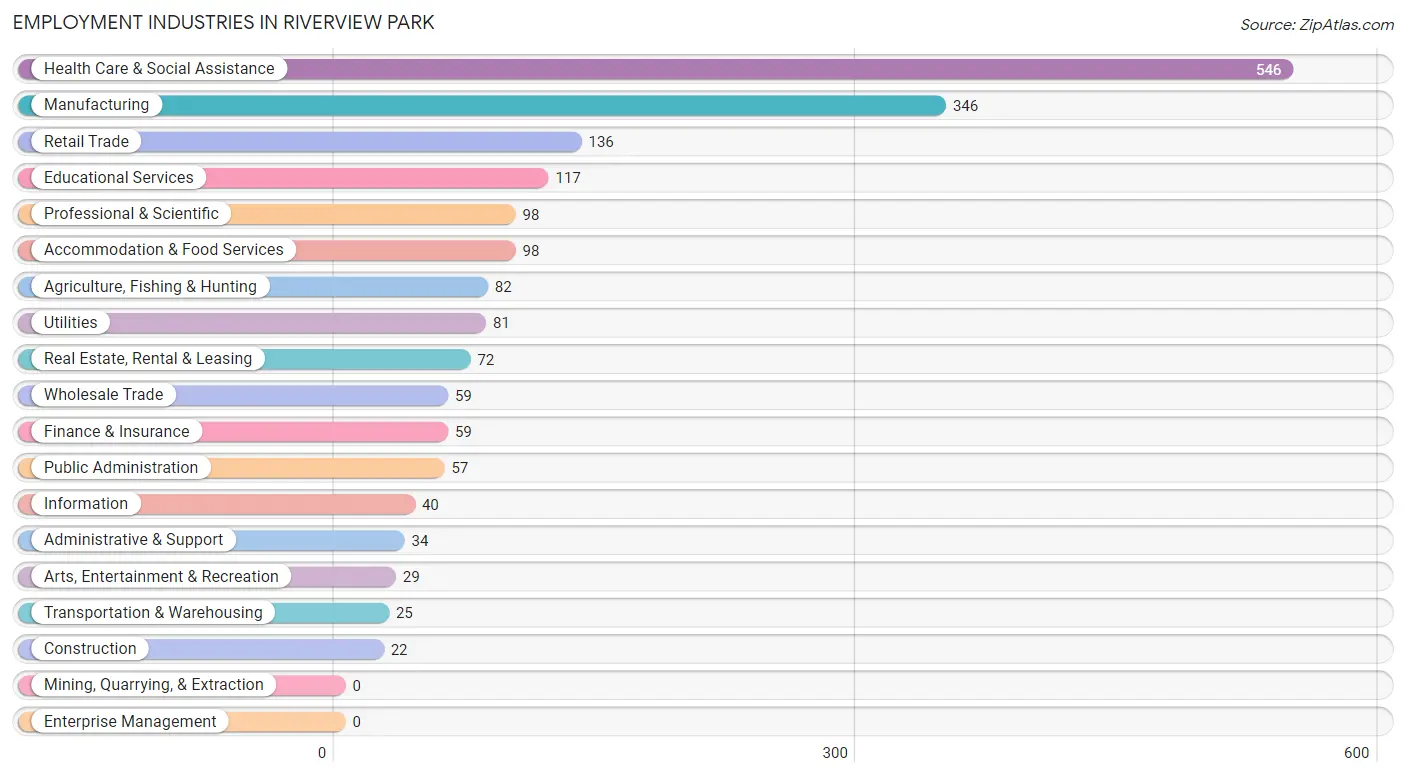
Employment Industries by Sex in Riverview Park
The Riverview Park industries that see more men than women are Agriculture, Fishing & Hunting (100.0%), Construction (100.0%), and Information (100.0%), whereas the industries that tend to have a higher number of women are Arts, Entertainment & Recreation (100.0%), Professional & Scientific (82.7%), and Finance & Insurance (79.7%).
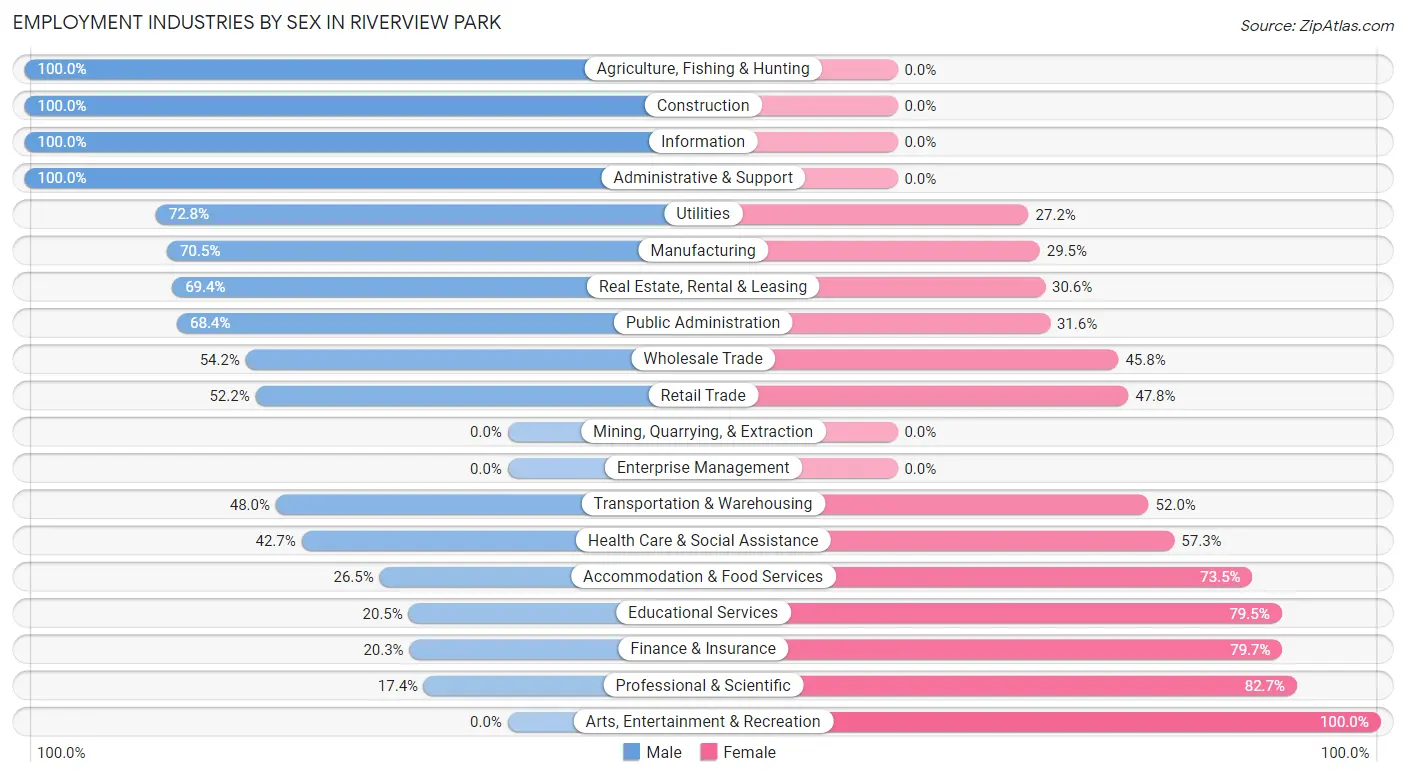
| Industry | Male | Female |
| Agriculture, Fishing & Hunting | 82 (100.0%) | 0 (0.0%) |
| Mining, Quarrying, & Extraction | 0 (0.0%) | 0 (0.0%) |
| Construction | 22 (100.0%) | 0 (0.0%) |
| Manufacturing | 244 (70.5%) | 102 (29.5%) |
| Wholesale Trade | 32 (54.2%) | 27 (45.8%) |
| Retail Trade | 71 (52.2%) | 65 (47.8%) |
| Transportation & Warehousing | 12 (48.0%) | 13 (52.0%) |
| Utilities | 59 (72.8%) | 22 (27.2%) |
| Information | 40 (100.0%) | 0 (0.0%) |
| Finance & Insurance | 12 (20.3%) | 47 (79.7%) |
| Real Estate, Rental & Leasing | 50 (69.4%) | 22 (30.6%) |
| Professional & Scientific | 17 (17.3%) | 81 (82.7%) |
| Enterprise Management | 0 (0.0%) | 0 (0.0%) |
| Administrative & Support | 34 (100.0%) | 0 (0.0%) |
| Educational Services | 24 (20.5%) | 93 (79.5%) |
| Health Care & Social Assistance | 233 (42.7%) | 313 (57.3%) |
| Arts, Entertainment & Recreation | 0 (0.0%) | 29 (100.0%) |
| Accommodation & Food Services | 26 (26.5%) | 72 (73.5%) |
| Public Administration | 39 (68.4%) | 18 (31.6%) |
| Total | 1,022 (51.2%) | 974 (48.8%) |
Education in Riverview Park
School Enrollment in Riverview Park
The most common levels of schooling among the 607 students in Riverview Park are middle school (167 | 27.5%), high school (164 | 27.0%), and elementary school (148 | 24.4%).
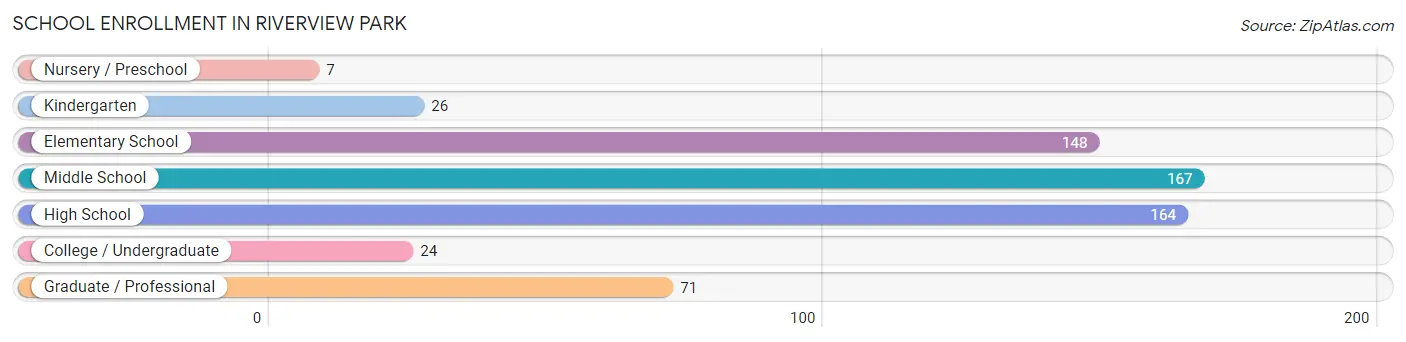
| School Level | # Students | % Students |
| Nursery / Preschool | 7 | 1.1% |
| Kindergarten | 26 | 4.3% |
| Elementary School | 148 | 24.4% |
| Middle School | 167 | 27.5% |
| High School | 164 | 27.0% |
| College / Undergraduate | 24 | 4.0% |
| Graduate / Professional | 71 | 11.7% |
| Total | 607 | 100.0% |
School Enrollment by Age by Funding Source in Riverview Park
Out of a total of 607 students who are enrolled in schools in Riverview Park, 85 (14.0%) attend a private institution, while the remaining 522 (86.0%) are enrolled in public schools. The age group of 25 to 34 year olds has the highest likelihood of being enrolled in private schools, with 22 (52.4% in the age bracket) enrolled. Conversely, the age group of 18 to 19 year olds has the lowest likelihood of being enrolled in a private school, with 47 (100.0% in the age bracket) attending a public institution.
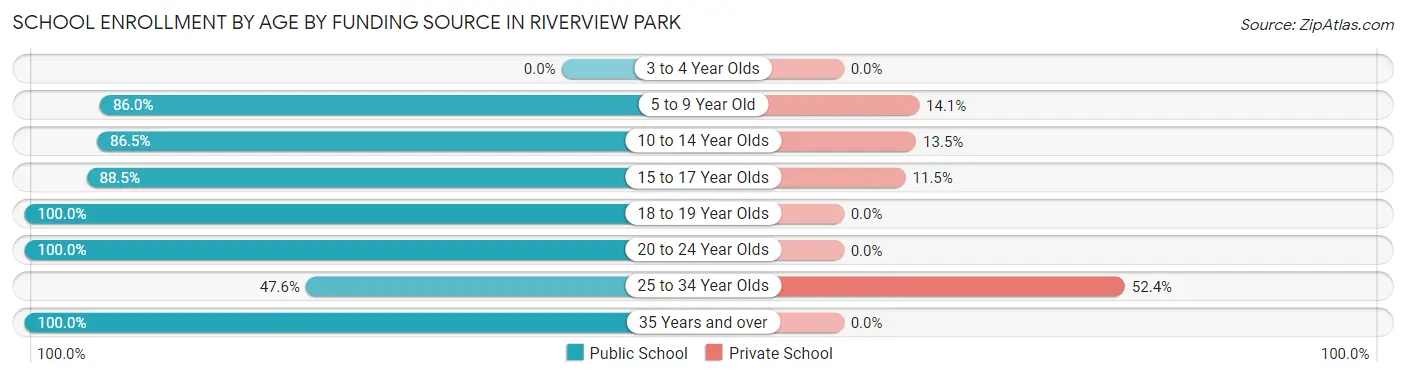
| Age Bracket | Public School | Private School |
| 3 to 4 Year Olds | 0 (0.0%) | 0 (0.0%) |
| 5 to 9 Year Old | 159 (86.0%) | 26 (14.1%) |
| 10 to 14 Year Olds | 141 (86.5%) | 22 (13.5%) |
| 15 to 17 Year Olds | 115 (88.5%) | 15 (11.5%) |
| 18 to 19 Year Olds | 47 (100.0%) | 0 (0.0%) |
| 20 to 24 Year Olds | 19 (100.0%) | 0 (0.0%) |
| 25 to 34 Year Olds | 20 (47.6%) | 22 (52.4%) |
| 35 Years and over | 21 (100.0%) | 0 (0.0%) |
| Total | 522 (86.0%) | 85 (14.0%) |
Educational Attainment by Field of Study in Riverview Park
Science & technology (367 | 33.3%), business (184 | 16.7%), education (160 | 14.5%), bio, nature & agricultural (83 | 7.5%), and liberal arts & history (58 | 5.3%) are the most common fields of study among 1,102 individuals in Riverview Park who have obtained a bachelor's degree or higher.
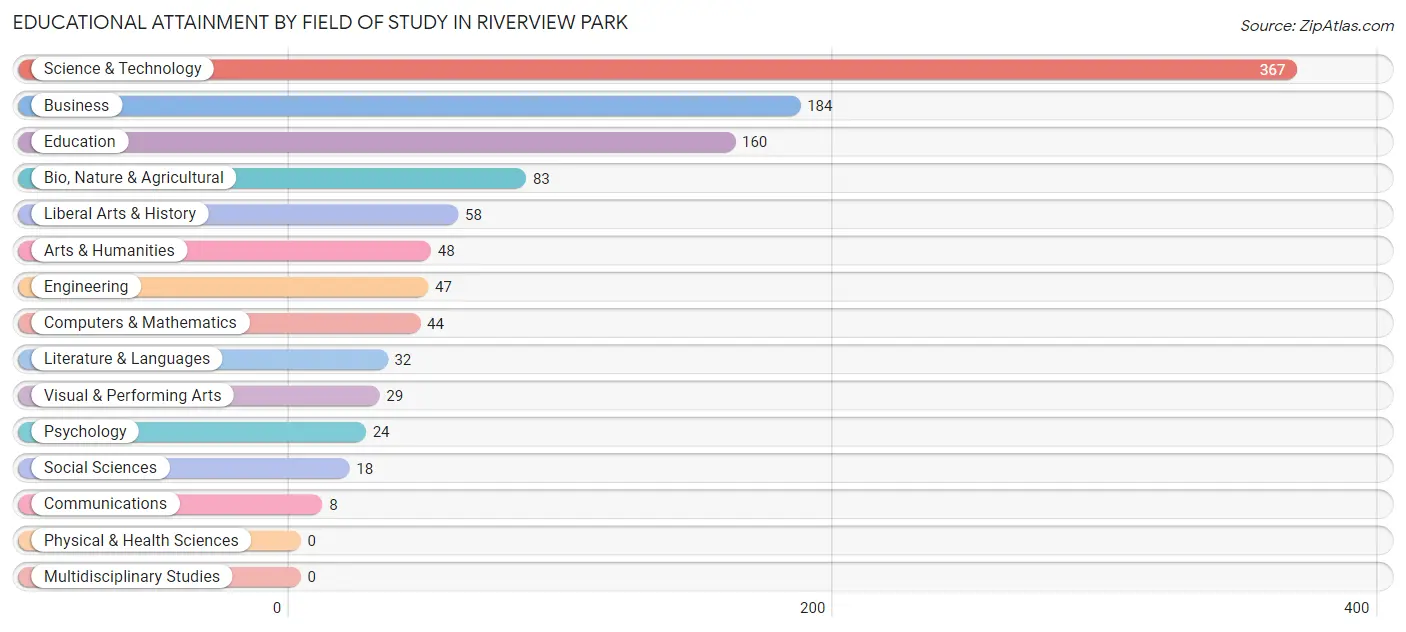
| Field of Study | # Graduates | % Graduates |
| Computers & Mathematics | 44 | 4.0% |
| Bio, Nature & Agricultural | 83 | 7.5% |
| Physical & Health Sciences | 0 | 0.0% |
| Psychology | 24 | 2.2% |
| Social Sciences | 18 | 1.6% |
| Engineering | 47 | 4.3% |
| Multidisciplinary Studies | 0 | 0.0% |
| Science & Technology | 367 | 33.3% |
| Business | 184 | 16.7% |
| Education | 160 | 14.5% |
| Literature & Languages | 32 | 2.9% |
| Liberal Arts & History | 58 | 5.3% |
| Visual & Performing Arts | 29 | 2.6% |
| Communications | 8 | 0.7% |
| Arts & Humanities | 48 | 4.4% |
| Total | 1,102 | 100.0% |
Transportation & Commute in Riverview Park
Vehicle Availability by Sex in Riverview Park
The most prevalent vehicle ownership categories in Riverview Park are males with 2 vehicles (522, accounting for 51.1%) and females with 2 vehicles (417, making up 53.8%).
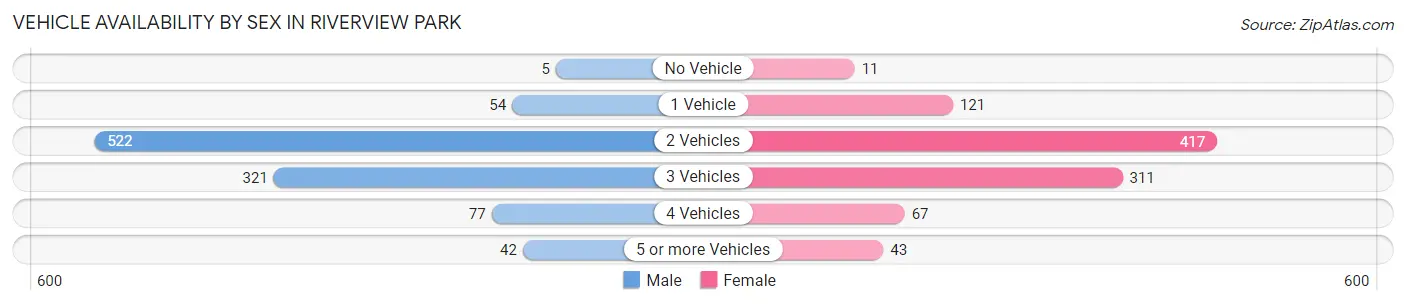
| Vehicles Available | Male | Female |
| No Vehicle | 5 (0.5%) | 11 (1.1%) |
| 1 Vehicle | 54 (5.3%) | 121 (12.5%) |
| 2 Vehicles | 522 (51.1%) | 417 (43.0%) |
| 3 Vehicles | 321 (31.4%) | 311 (32.1%) |
| 4 Vehicles | 77 (7.5%) | 67 (6.9%) |
| 5 or more Vehicles | 42 (4.1%) | 43 (4.4%) |
| Total | 1,021 (100.0%) | 970 (100.0%) |
Commute Time in Riverview Park
The most frequently occuring commute durations in Riverview Park are 15 to 19 minutes (687 commuters, 37.4%), 10 to 14 minutes (297 commuters, 16.2%), and 20 to 24 minutes (252 commuters, 13.7%).
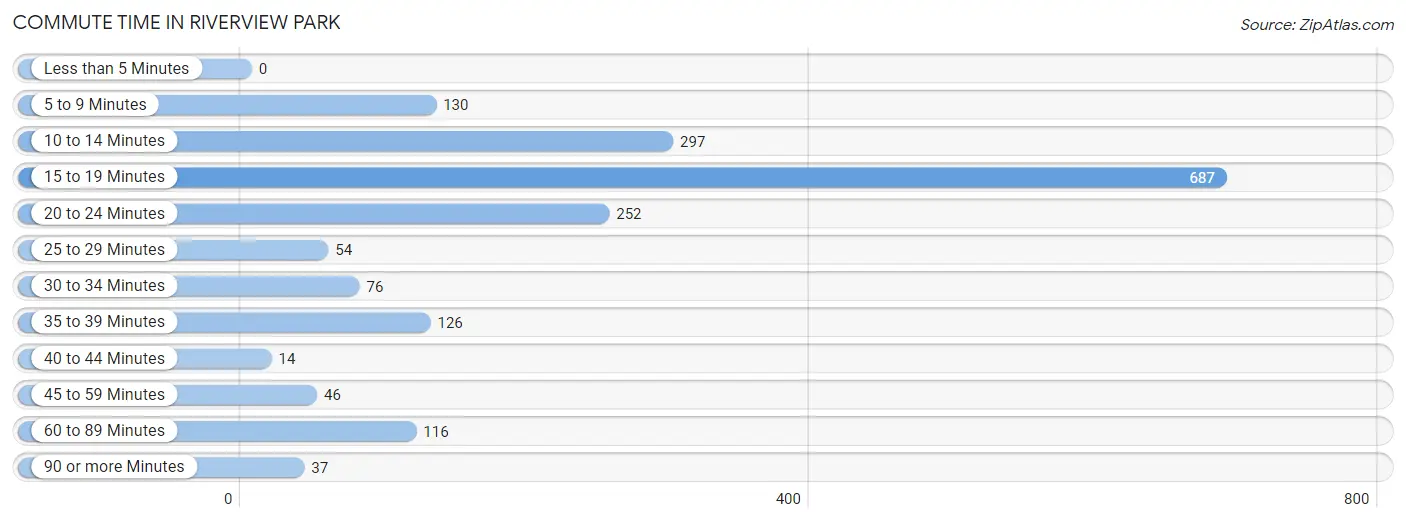
| Commute Time | # Commuters | % Commuters |
| Less than 5 Minutes | 0 | 0.0% |
| 5 to 9 Minutes | 130 | 7.1% |
| 10 to 14 Minutes | 297 | 16.2% |
| 15 to 19 Minutes | 687 | 37.4% |
| 20 to 24 Minutes | 252 | 13.7% |
| 25 to 29 Minutes | 54 | 2.9% |
| 30 to 34 Minutes | 76 | 4.1% |
| 35 to 39 Minutes | 126 | 6.9% |
| 40 to 44 Minutes | 14 | 0.8% |
| 45 to 59 Minutes | 46 | 2.5% |
| 60 to 89 Minutes | 116 | 6.3% |
| 90 or more Minutes | 37 | 2.0% |
Commute Time by Sex in Riverview Park
The most common commute times in Riverview Park are 15 to 19 minutes (327 commuters, 34.1%) for males and 15 to 19 minutes (360 commuters, 41.1%) for females.
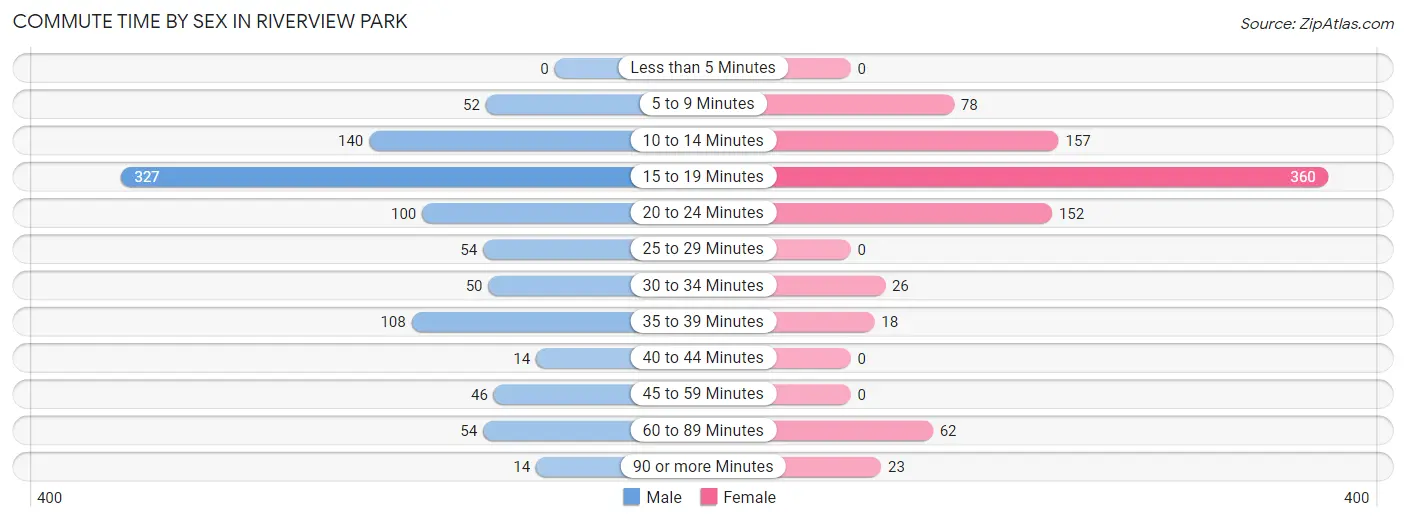
| Commute Time | Male | Female |
| Less than 5 Minutes | 0 (0.0%) | 0 (0.0%) |
| 5 to 9 Minutes | 52 (5.4%) | 78 (8.9%) |
| 10 to 14 Minutes | 140 (14.6%) | 157 (17.9%) |
| 15 to 19 Minutes | 327 (34.1%) | 360 (41.1%) |
| 20 to 24 Minutes | 100 (10.4%) | 152 (17.3%) |
| 25 to 29 Minutes | 54 (5.6%) | 0 (0.0%) |
| 30 to 34 Minutes | 50 (5.2%) | 26 (3.0%) |
| 35 to 39 Minutes | 108 (11.3%) | 18 (2.1%) |
| 40 to 44 Minutes | 14 (1.5%) | 0 (0.0%) |
| 45 to 59 Minutes | 46 (4.8%) | 0 (0.0%) |
| 60 to 89 Minutes | 54 (5.6%) | 62 (7.1%) |
| 90 or more Minutes | 14 (1.5%) | 23 (2.6%) |
Time of Departure to Work by Sex in Riverview Park
The most frequent times of departure to work in Riverview Park are 6:30 AM to 6:59 AM (241, 25.1%) for males and 6:30 AM to 6:59 AM (163, 18.6%) for females.
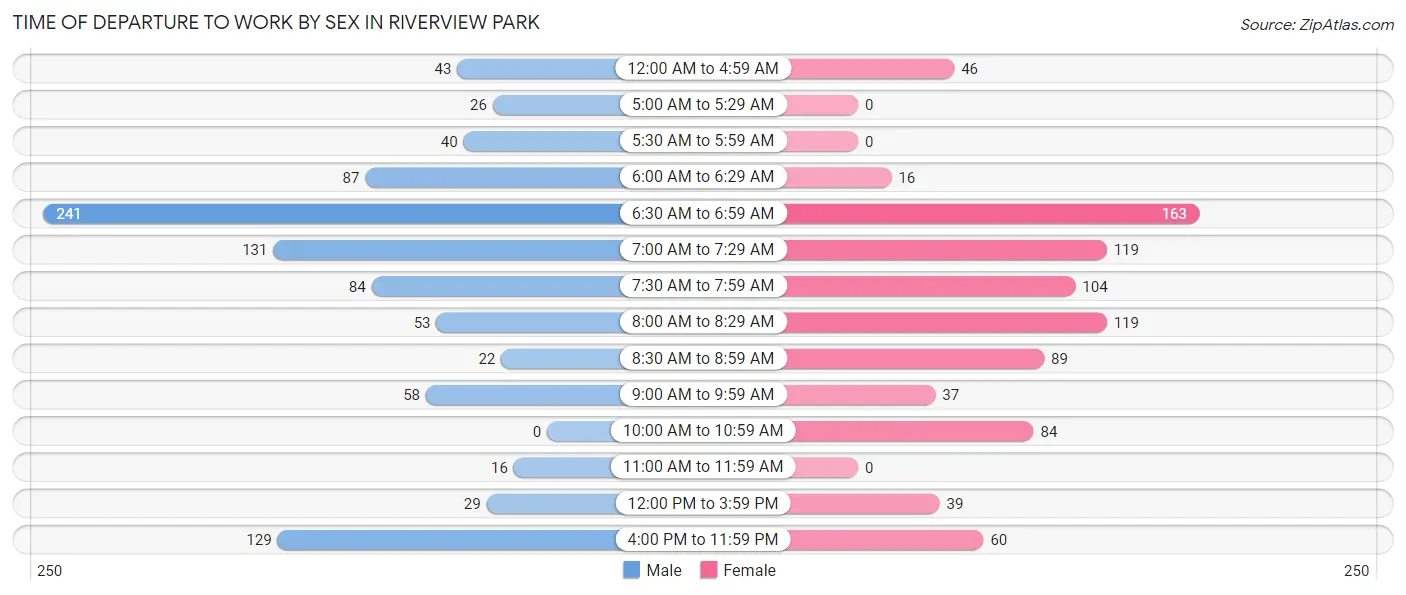
| Time of Departure | Male | Female |
| 12:00 AM to 4:59 AM | 43 (4.5%) | 46 (5.2%) |
| 5:00 AM to 5:29 AM | 26 (2.7%) | 0 (0.0%) |
| 5:30 AM to 5:59 AM | 40 (4.2%) | 0 (0.0%) |
| 6:00 AM to 6:29 AM | 87 (9.1%) | 16 (1.8%) |
| 6:30 AM to 6:59 AM | 241 (25.1%) | 163 (18.6%) |
| 7:00 AM to 7:29 AM | 131 (13.7%) | 119 (13.6%) |
| 7:30 AM to 7:59 AM | 84 (8.8%) | 104 (11.9%) |
| 8:00 AM to 8:29 AM | 53 (5.5%) | 119 (13.6%) |
| 8:30 AM to 8:59 AM | 22 (2.3%) | 89 (10.2%) |
| 9:00 AM to 9:59 AM | 58 (6.0%) | 37 (4.2%) |
| 10:00 AM to 10:59 AM | 0 (0.0%) | 84 (9.6%) |
| 11:00 AM to 11:59 AM | 16 (1.7%) | 0 (0.0%) |
| 12:00 PM to 3:59 PM | 29 (3.0%) | 39 (4.4%) |
| 4:00 PM to 11:59 PM | 129 (13.5%) | 60 (6.9%) |
| Total | 959 (100.0%) | 876 (100.0%) |
Housing Occupancy in Riverview Park
Occupancy by Ownership in Riverview Park
Of the total 1,403 dwellings in Riverview Park, owner-occupied units account for 1,258 (89.7%), while renter-occupied units make up 145 (10.3%).
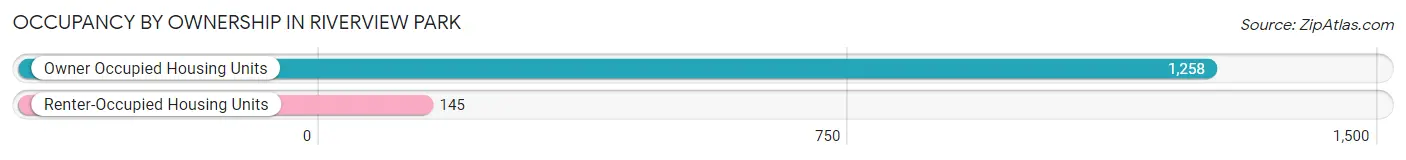
| Occupancy | # Housing Units | % Housing Units |
| Owner Occupied Housing Units | 1,258 | 89.7% |
| Renter-Occupied Housing Units | 145 | 10.3% |
| Total Occupied Housing Units | 1,403 | 100.0% |
Occupancy by Household Size in Riverview Park
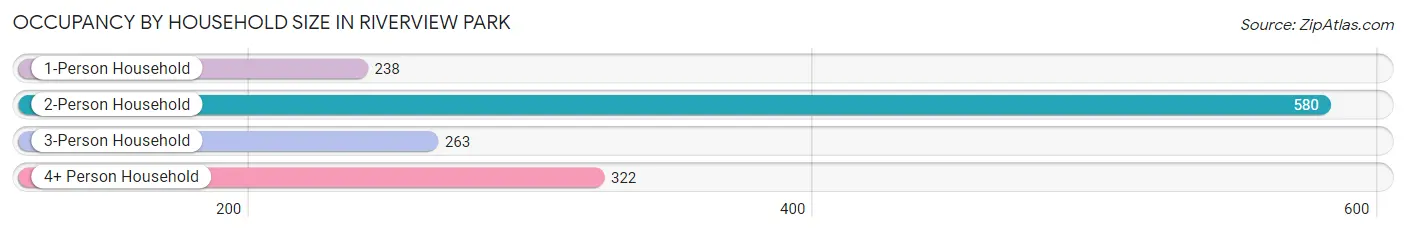
| Household Size | # Housing Units | % Housing Units |
| 1-Person Household | 238 | 17.0% |
| 2-Person Household | 580 | 41.3% |
| 3-Person Household | 263 | 18.8% |
| 4+ Person Household | 322 | 23.0% |
| Total Housing Units | 1,403 | 100.0% |
Occupancy by Ownership by Household Size in Riverview Park
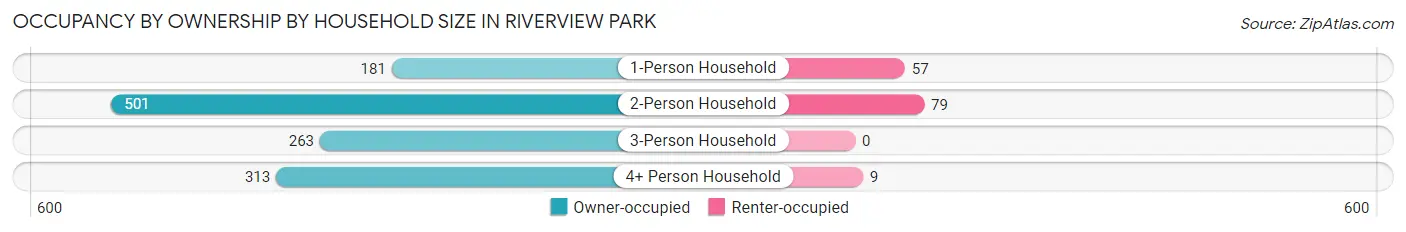
| Household Size | Owner-occupied | Renter-occupied |
| 1-Person Household | 181 (76.0%) | 57 (23.9%) |
| 2-Person Household | 501 (86.4%) | 79 (13.6%) |
| 3-Person Household | 263 (100.0%) | 0 (0.0%) |
| 4+ Person Household | 313 (97.2%) | 9 (2.8%) |
| Total Housing Units | 1,258 (89.7%) | 145 (10.3%) |
Occupancy by Educational Attainment in Riverview Park
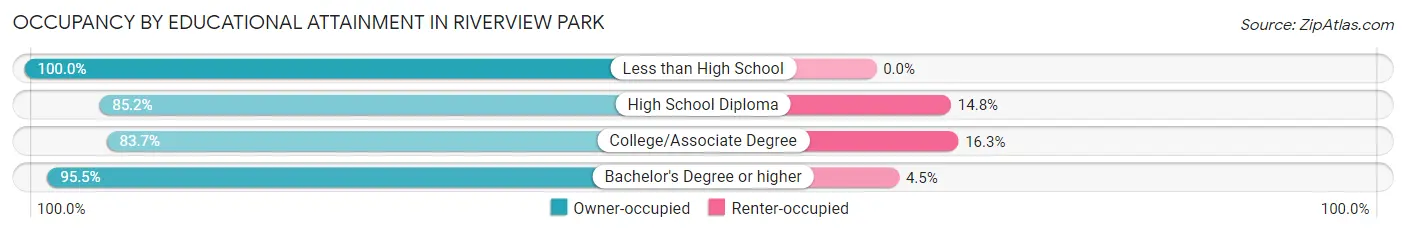
| Household Size | Owner-occupied | Renter-occupied |
| Less than High School | 27 (100.0%) | 0 (0.0%) |
| High School Diploma | 362 (85.2%) | 63 (14.8%) |
| College/Associate Degree | 278 (83.7%) | 54 (16.3%) |
| Bachelor's Degree or higher | 591 (95.5%) | 28 (4.5%) |
Occupancy by Age of Householder in Riverview Park
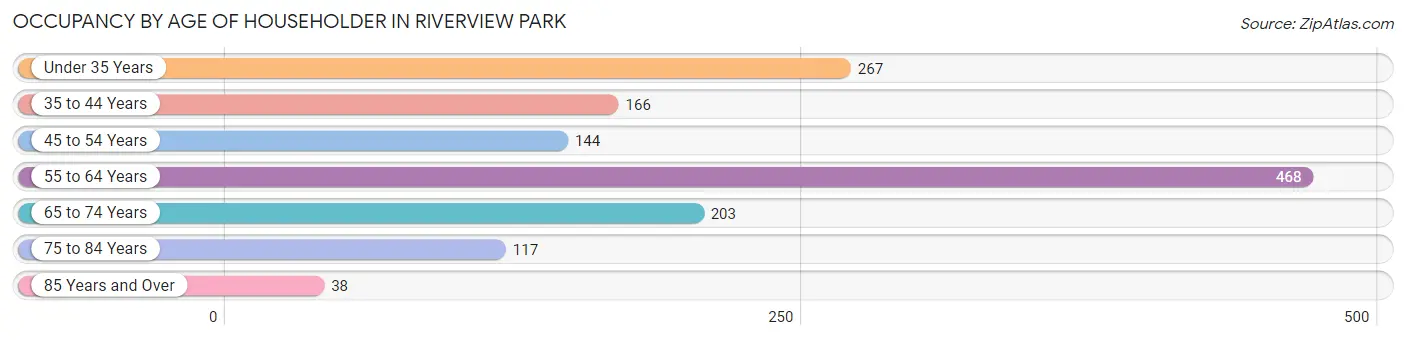
| Age Bracket | # Households | % Households |
| Under 35 Years | 267 | 19.0% |
| 35 to 44 Years | 166 | 11.8% |
| 45 to 54 Years | 144 | 10.3% |
| 55 to 64 Years | 468 | 33.4% |
| 65 to 74 Years | 203 | 14.5% |
| 75 to 84 Years | 117 | 8.3% |
| 85 Years and Over | 38 | 2.7% |
| Total | 1,403 | 100.0% |
Housing Finances in Riverview Park
Median Income by Occupancy in Riverview Park
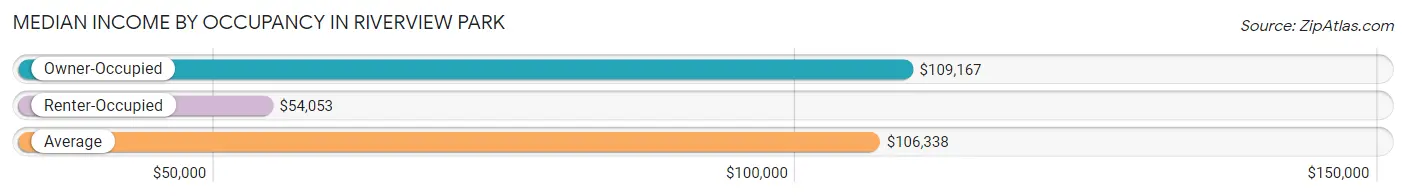
| Occupancy Type | # Households | Median Income |
| Owner-Occupied | 1,258 (89.7%) | $109,167 |
| Renter-Occupied | 145 (10.3%) | $54,053 |
| Average | 1,403 (100.0%) | $106,338 |
Occupancy by Householder Income Bracket in Riverview Park
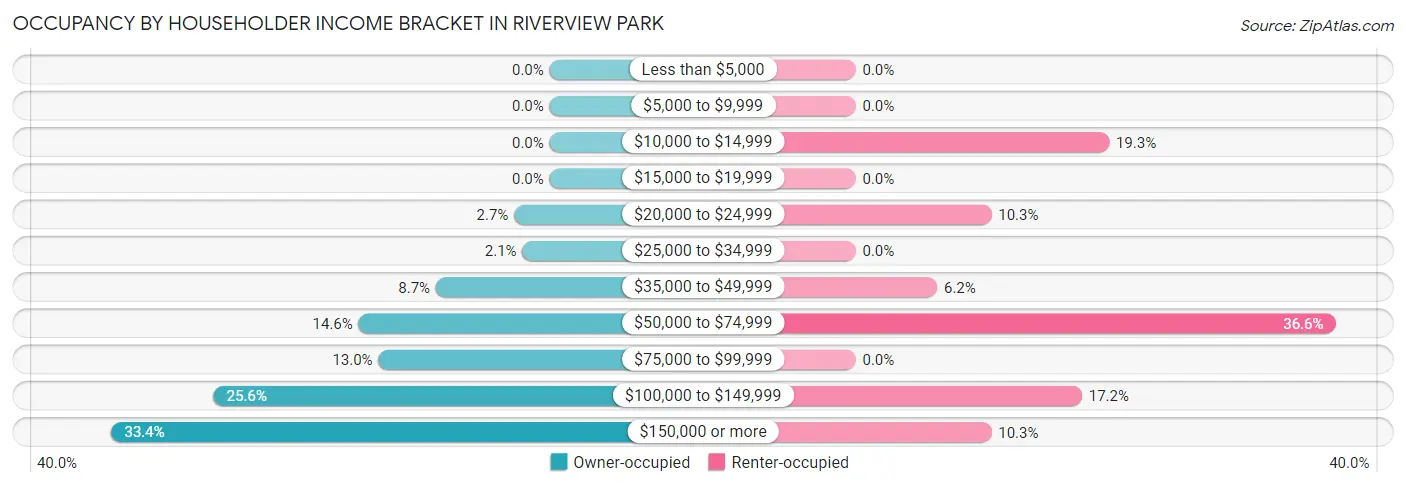
| Income Bracket | Owner-occupied | Renter-occupied |
| Less than $5,000 | 0 (0.0%) | 0 (0.0%) |
| $5,000 to $9,999 | 0 (0.0%) | 0 (0.0%) |
| $10,000 to $14,999 | 0 (0.0%) | 28 (19.3%) |
| $15,000 to $19,999 | 0 (0.0%) | 0 (0.0%) |
| $20,000 to $24,999 | 34 (2.7%) | 15 (10.3%) |
| $25,000 to $34,999 | 26 (2.1%) | 0 (0.0%) |
| $35,000 to $49,999 | 109 (8.7%) | 9 (6.2%) |
| $50,000 to $74,999 | 183 (14.5%) | 53 (36.5%) |
| $75,000 to $99,999 | 164 (13.0%) | 0 (0.0%) |
| $100,000 to $149,999 | 322 (25.6%) | 25 (17.2%) |
| $150,000 or more | 420 (33.4%) | 15 (10.3%) |
| Total | 1,258 (100.0%) | 145 (100.0%) |
Monthly Housing Cost Tiers in Riverview Park
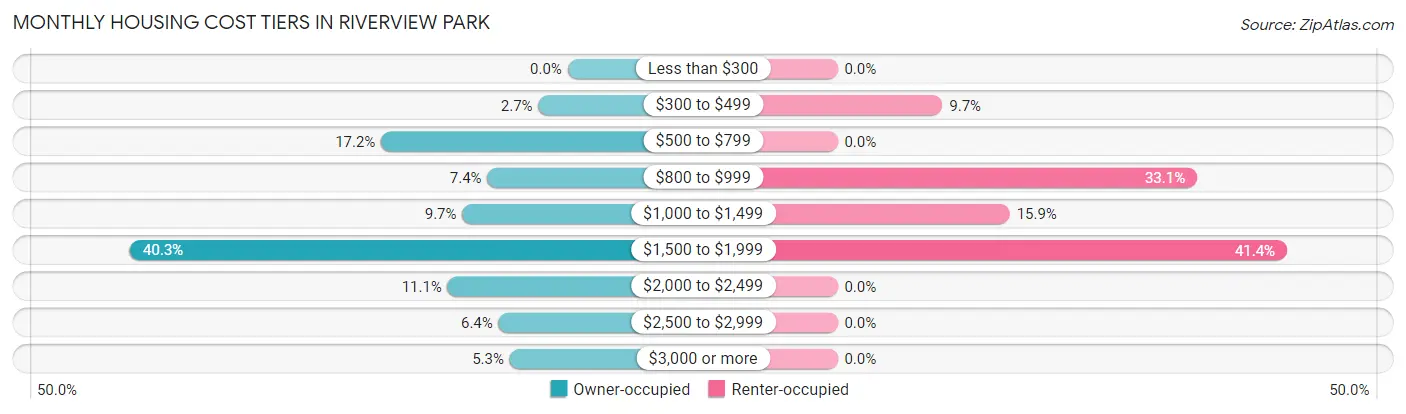
| Monthly Cost | Owner-occupied | Renter-occupied |
| Less than $300 | 0 (0.0%) | 0 (0.0%) |
| $300 to $499 | 34 (2.7%) | 14 (9.7%) |
| $500 to $799 | 216 (17.2%) | 0 (0.0%) |
| $800 to $999 | 93 (7.4%) | 48 (33.1%) |
| $1,000 to $1,499 | 122 (9.7%) | 23 (15.9%) |
| $1,500 to $1,999 | 507 (40.3%) | 60 (41.4%) |
| $2,000 to $2,499 | 139 (11.1%) | 0 (0.0%) |
| $2,500 to $2,999 | 80 (6.4%) | 0 (0.0%) |
| $3,000 or more | 67 (5.3%) | 0 (0.0%) |
| Total | 1,258 (100.0%) | 145 (100.0%) |
Physical Housing Characteristics in Riverview Park
Housing Structures in Riverview Park
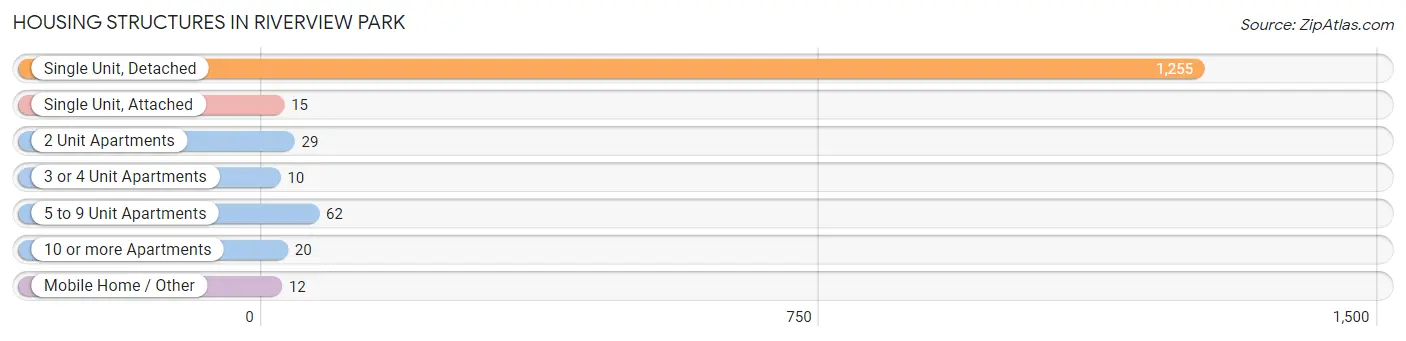
| Structure Type | # Housing Units | % Housing Units |
| Single Unit, Detached | 1,255 | 89.4% |
| Single Unit, Attached | 15 | 1.1% |
| 2 Unit Apartments | 29 | 2.1% |
| 3 or 4 Unit Apartments | 10 | 0.7% |
| 5 to 9 Unit Apartments | 62 | 4.4% |
| 10 or more Apartments | 20 | 1.4% |
| Mobile Home / Other | 12 | 0.9% |
| Total | 1,403 | 100.0% |
Housing Structures by Occupancy in Riverview Park
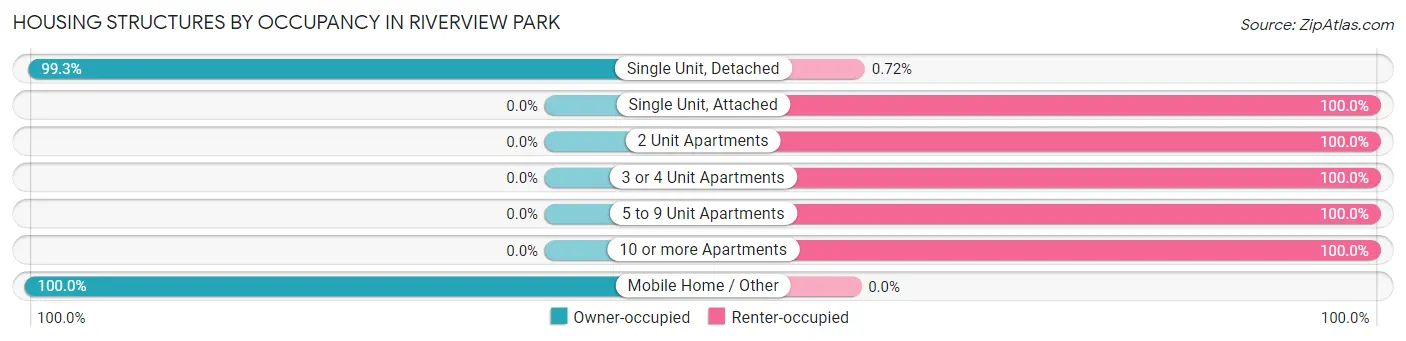
| Structure Type | Owner-occupied | Renter-occupied |
| Single Unit, Detached | 1,246 (99.3%) | 9 (0.7%) |
| Single Unit, Attached | 0 (0.0%) | 15 (100.0%) |
| 2 Unit Apartments | 0 (0.0%) | 29 (100.0%) |
| 3 or 4 Unit Apartments | 0 (0.0%) | 10 (100.0%) |
| 5 to 9 Unit Apartments | 0 (0.0%) | 62 (100.0%) |
| 10 or more Apartments | 0 (0.0%) | 20 (100.0%) |
| Mobile Home / Other | 12 (100.0%) | 0 (0.0%) |
| Total | 1,258 (89.7%) | 145 (10.3%) |
Housing Structures by Number of Rooms in Riverview Park
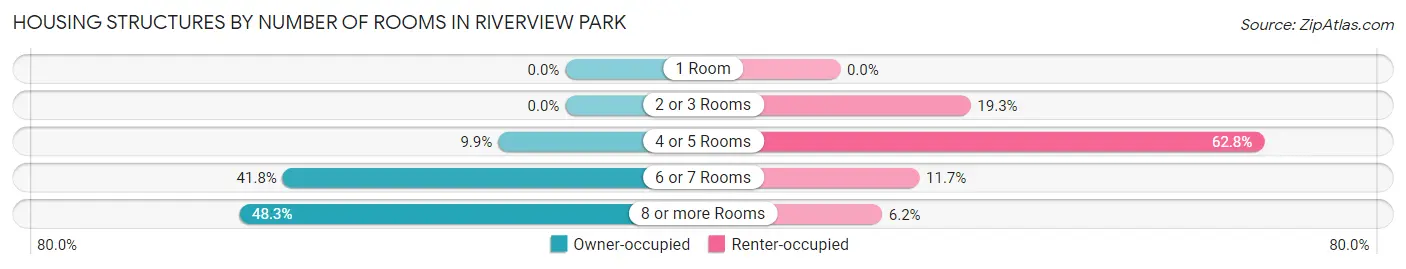
| Number of Rooms | Owner-occupied | Renter-occupied |
| 1 Room | 0 (0.0%) | 0 (0.0%) |
| 2 or 3 Rooms | 0 (0.0%) | 28 (19.3%) |
| 4 or 5 Rooms | 125 (9.9%) | 91 (62.8%) |
| 6 or 7 Rooms | 526 (41.8%) | 17 (11.7%) |
| 8 or more Rooms | 607 (48.2%) | 9 (6.2%) |
| Total | 1,258 (100.0%) | 145 (100.0%) |
Housing Structure by Heating Type in Riverview Park
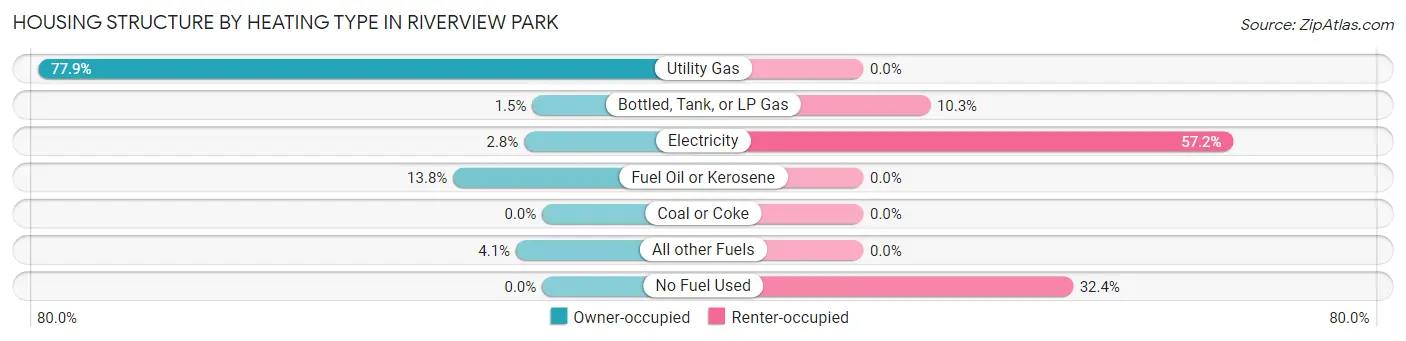
| Heating Type | Owner-occupied | Renter-occupied |
| Utility Gas | 980 (77.9%) | 0 (0.0%) |
| Bottled, Tank, or LP Gas | 19 (1.5%) | 15 (10.3%) |
| Electricity | 35 (2.8%) | 83 (57.2%) |
| Fuel Oil or Kerosene | 173 (13.8%) | 0 (0.0%) |
| Coal or Coke | 0 (0.0%) | 0 (0.0%) |
| All other Fuels | 51 (4.1%) | 0 (0.0%) |
| No Fuel Used | 0 (0.0%) | 47 (32.4%) |
| Total | 1,258 (100.0%) | 145 (100.0%) |
Household Vehicle Usage in Riverview Park
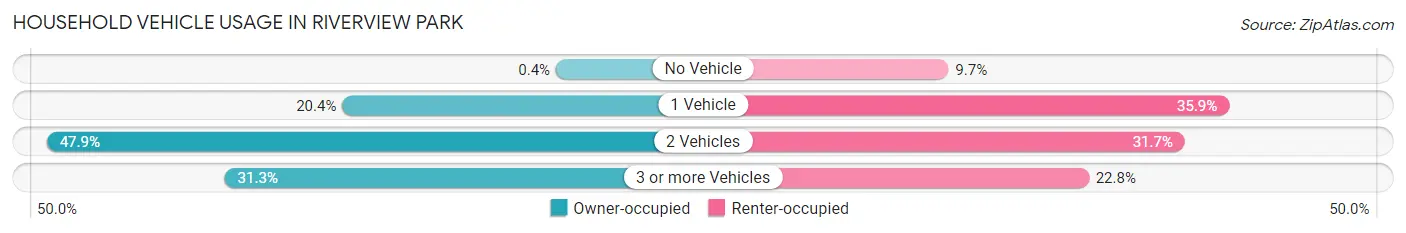
| Vehicles per Household | Owner-occupied | Renter-occupied |
| No Vehicle | 5 (0.4%) | 14 (9.7%) |
| 1 Vehicle | 256 (20.3%) | 52 (35.9%) |
| 2 Vehicles | 603 (47.9%) | 46 (31.7%) |
| 3 or more Vehicles | 394 (31.3%) | 33 (22.8%) |
| Total | 1,258 (100.0%) | 145 (100.0%) |
Real Estate & Mortgages in Riverview Park
Real Estate and Mortgage Overview in Riverview Park
| Characteristic | Without Mortgage | With Mortgage |
| Housing Units | 311 | 947 |
| Median Property Value | $208,000 | $239,400 |
| Median Household Income | $76,655 | $393 |
| Monthly Housing Costs | $672 | $67 |
| Real Estate Taxes | $4,243 | $0 |
Property Value by Mortgage Status in Riverview Park
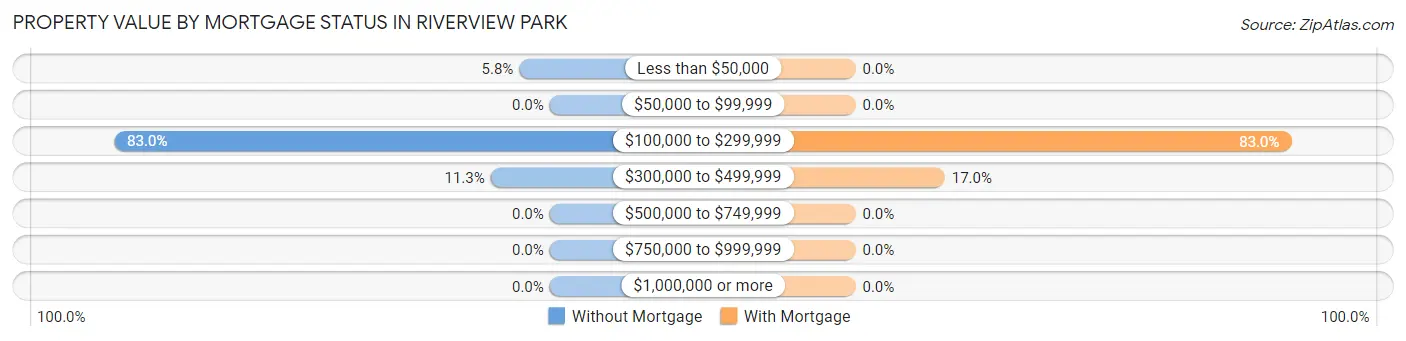
| Property Value | Without Mortgage | With Mortgage |
| Less than $50,000 | 18 (5.8%) | 0 (0.0%) |
| $50,000 to $99,999 | 0 (0.0%) | 0 (0.0%) |
| $100,000 to $299,999 | 258 (83.0%) | 786 (83.0%) |
| $300,000 to $499,999 | 35 (11.3%) | 161 (17.0%) |
| $500,000 to $749,999 | 0 (0.0%) | 0 (0.0%) |
| $750,000 to $999,999 | 0 (0.0%) | 0 (0.0%) |
| $1,000,000 or more | 0 (0.0%) | 0 (0.0%) |
| Total | 311 (100.0%) | 947 (100.0%) |
Household Income by Mortgage Status in Riverview Park
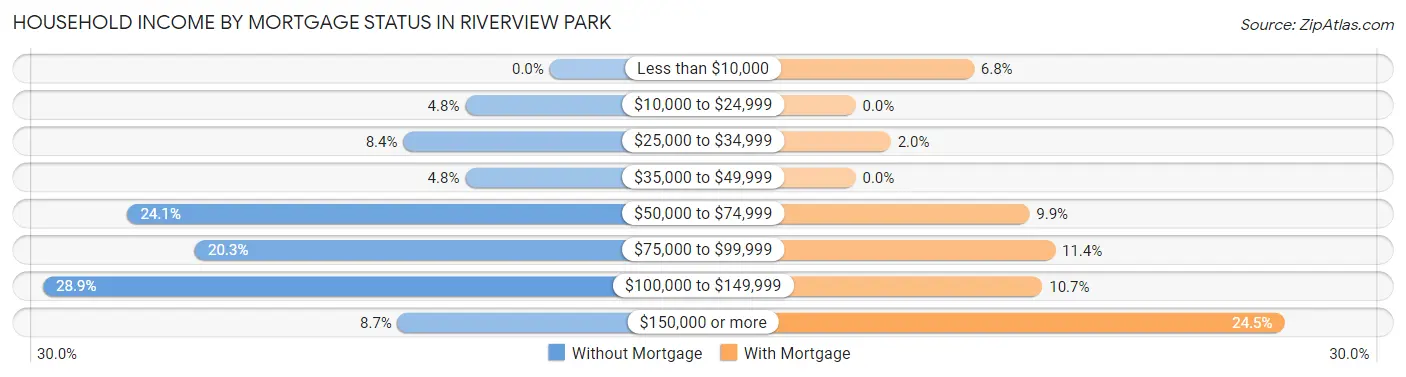
| Household Income | Without Mortgage | With Mortgage |
| Less than $10,000 | 0 (0.0%) | 64 (6.8%) |
| $10,000 to $24,999 | 15 (4.8%) | 0 (0.0%) |
| $25,000 to $34,999 | 26 (8.4%) | 19 (2.0%) |
| $35,000 to $49,999 | 15 (4.8%) | 0 (0.0%) |
| $50,000 to $74,999 | 75 (24.1%) | 94 (9.9%) |
| $75,000 to $99,999 | 63 (20.3%) | 108 (11.4%) |
| $100,000 to $149,999 | 90 (28.9%) | 101 (10.7%) |
| $150,000 or more | 27 (8.7%) | 232 (24.5%) |
| Total | 311 (100.0%) | 947 (100.0%) |
Property Value to Household Income Ratio in Riverview Park
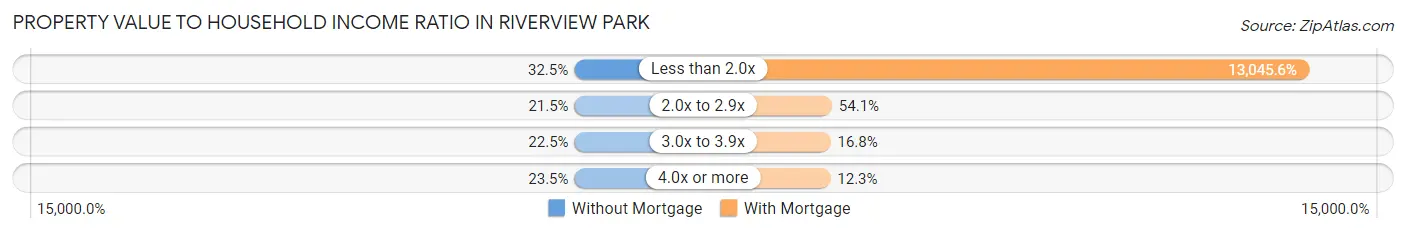
| Value-to-Income Ratio | Without Mortgage | With Mortgage |
| Less than 2.0x | 101 (32.5%) | 123,542 (13,045.6%) |
| 2.0x to 2.9x | 67 (21.5%) | 512 (54.1%) |
| 3.0x to 3.9x | 70 (22.5%) | 159 (16.8%) |
| 4.0x or more | 73 (23.5%) | 116 (12.2%) |
| Total | 311 (100.0%) | 947 (100.0%) |
Real Estate Taxes by Mortgage Status in Riverview Park
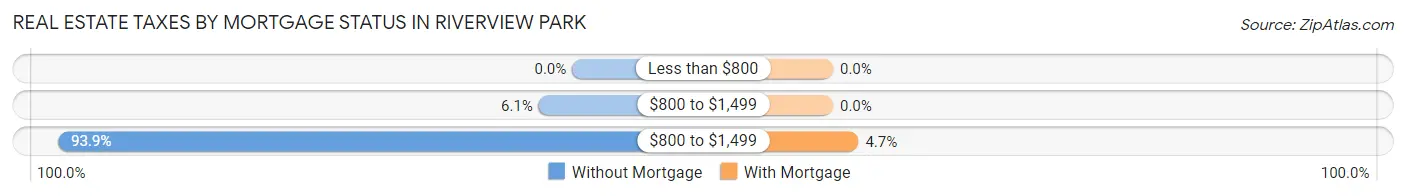
| Property Taxes | Without Mortgage | With Mortgage |
| Less than $800 | 0 (0.0%) | 0 (0.0%) |
| $800 to $1,499 | 19 (6.1%) | 0 (0.0%) |
| $800 to $1,499 | 292 (93.9%) | 44 (4.6%) |
| Total | 311 (100.0%) | 947 (100.0%) |
Health & Disability in Riverview Park
Health Insurance Coverage by Age in Riverview Park
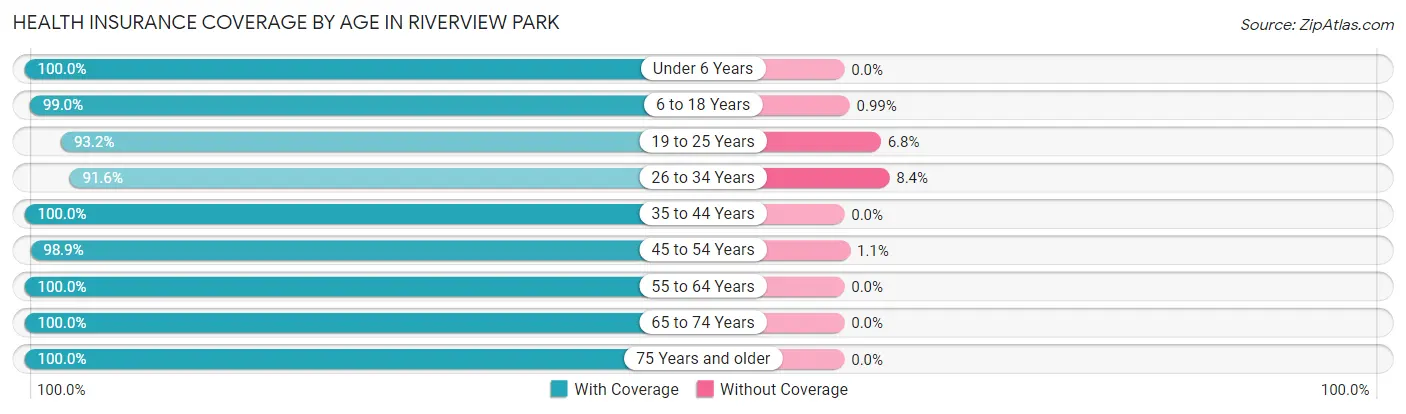
| Age Bracket | With Coverage | Without Coverage |
| Under 6 Years | 298 (100.0%) | 0 (0.0%) |
| 6 to 18 Years | 500 (99.0%) | 5 (1.0%) |
| 19 to 25 Years | 151 (93.2%) | 11 (6.8%) |
| 26 to 34 Years | 415 (91.6%) | 38 (8.4%) |
| 35 to 44 Years | 592 (100.0%) | 0 (0.0%) |
| 45 to 54 Years | 277 (98.9%) | 3 (1.1%) |
| 55 to 64 Years | 779 (100.0%) | 0 (0.0%) |
| 65 to 74 Years | 328 (100.0%) | 0 (0.0%) |
| 75 Years and older | 278 (100.0%) | 0 (0.0%) |
| Total | 3,618 (98.5%) | 57 (1.5%) |
Health Insurance Coverage by Citizenship Status in Riverview Park
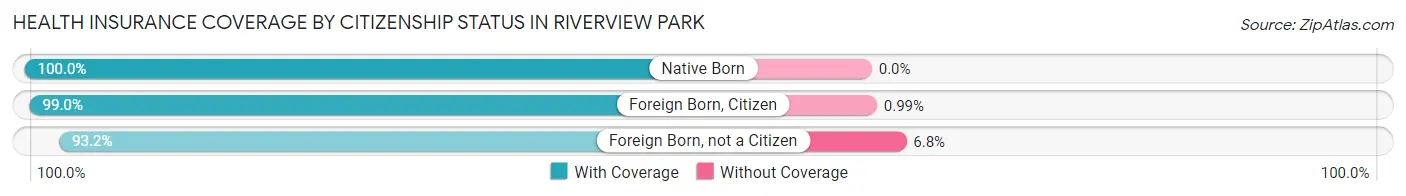
| Citizenship Status | With Coverage | Without Coverage |
| Native Born | 298 (100.0%) | 0 (0.0%) |
| Foreign Born, Citizen | 500 (99.0%) | 5 (1.0%) |
| Foreign Born, not a Citizen | 151 (93.2%) | 11 (6.8%) |
Health Insurance Coverage by Household Income in Riverview Park
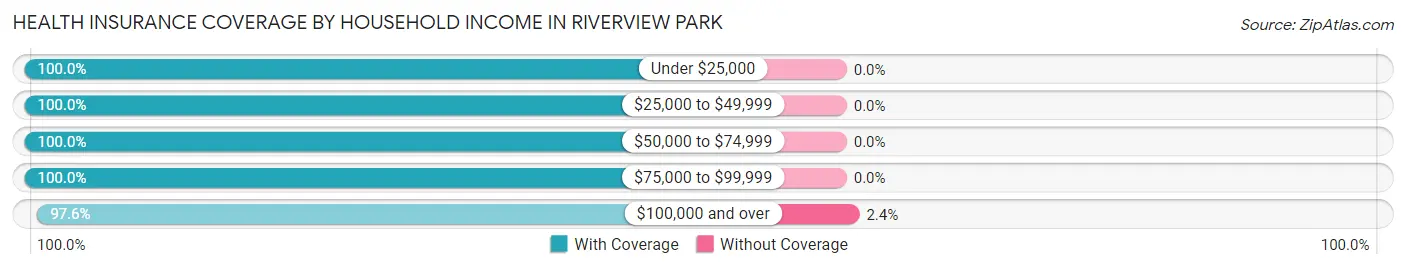
| Household Income | With Coverage | Without Coverage |
| Under $25,000 | 103 (100.0%) | 0 (0.0%) |
| $25,000 to $49,999 | 276 (100.0%) | 0 (0.0%) |
| $50,000 to $74,999 | 567 (100.0%) | 0 (0.0%) |
| $75,000 to $99,999 | 361 (100.0%) | 0 (0.0%) |
| $100,000 and over | 2,307 (97.6%) | 56 (2.4%) |
Public vs Private Health Insurance Coverage by Age in Riverview Park
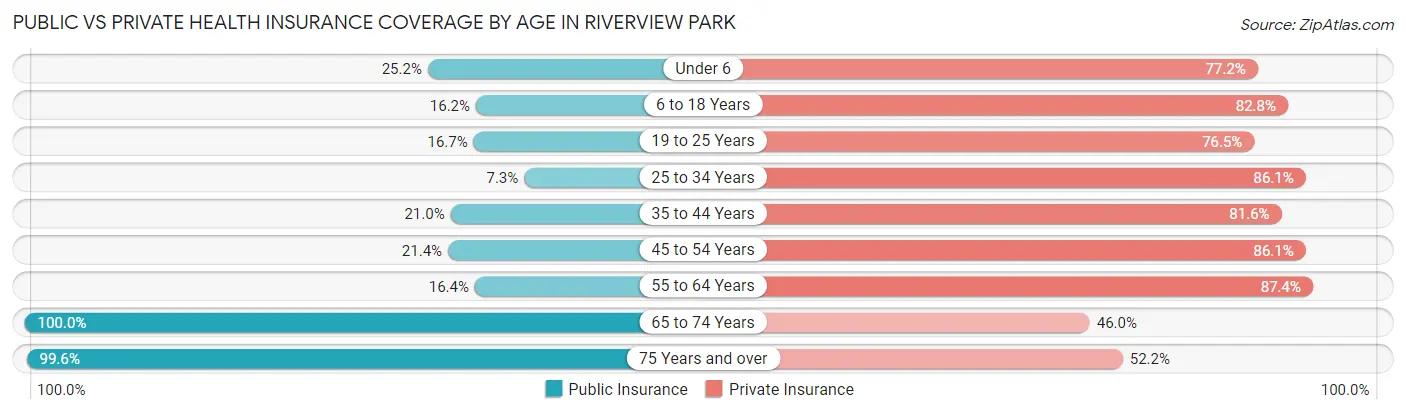
| Age Bracket | Public Insurance | Private Insurance |
| Under 6 | 75 (25.2%) | 230 (77.2%) |
| 6 to 18 Years | 82 (16.2%) | 418 (82.8%) |
| 19 to 25 Years | 27 (16.7%) | 124 (76.5%) |
| 25 to 34 Years | 33 (7.3%) | 390 (86.1%) |
| 35 to 44 Years | 124 (20.9%) | 483 (81.6%) |
| 45 to 54 Years | 60 (21.4%) | 241 (86.1%) |
| 55 to 64 Years | 128 (16.4%) | 681 (87.4%) |
| 65 to 74 Years | 328 (100.0%) | 151 (46.0%) |
| 75 Years and over | 277 (99.6%) | 145 (52.2%) |
| Total | 1,134 (30.9%) | 2,863 (77.9%) |
Disability Status by Sex by Age in Riverview Park
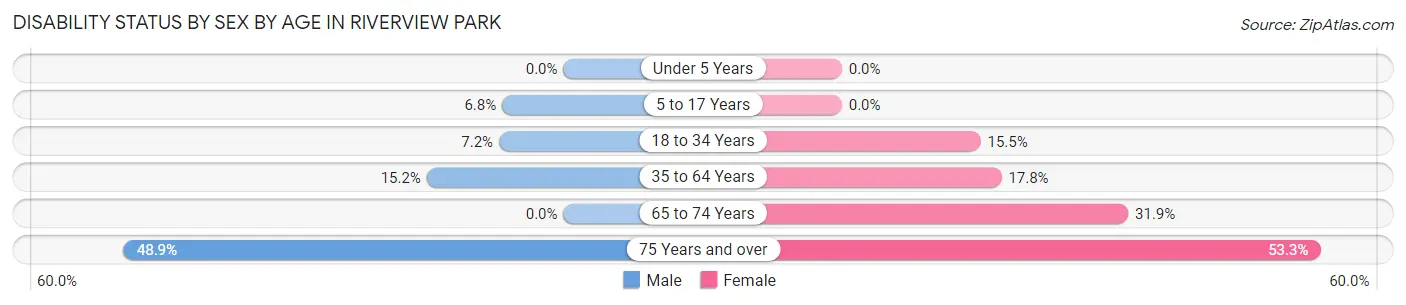
| Age Bracket | Male | Female |
| Under 5 Years | 0 (0.0%) | 0 (0.0%) |
| 5 to 17 Years | 20 (6.8%) | 0 (0.0%) |
| 18 to 34 Years | 21 (7.2%) | 55 (15.4%) |
| 35 to 64 Years | 128 (15.2%) | 144 (17.8%) |
| 65 to 74 Years | 0 (0.0%) | 59 (31.9%) |
| 75 Years and over | 69 (48.9%) | 73 (53.3%) |
Disability Class by Sex by Age in Riverview Park
Disability Class: Hearing Difficulty

| Age Bracket | Male | Female |
| Under 5 Years | 0 (0.0%) | 0 (0.0%) |
| 5 to 17 Years | 0 (0.0%) | 0 (0.0%) |
| 18 to 34 Years | 0 (0.0%) | 0 (0.0%) |
| 35 to 64 Years | 19 (2.3%) | 14 (1.7%) |
| 65 to 74 Years | 0 (0.0%) | 13 (7.0%) |
| 75 Years and over | 45 (31.9%) | 23 (16.8%) |
Disability Class: Vision Difficulty
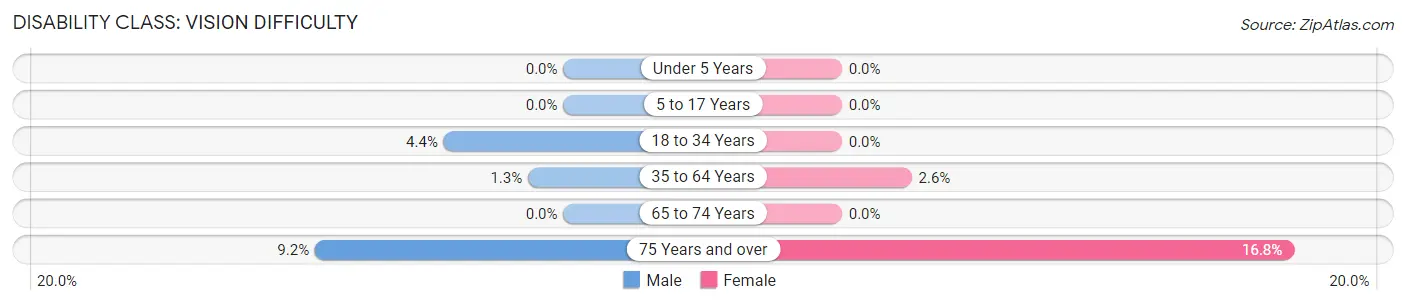
| Age Bracket | Male | Female |
| Under 5 Years | 0 (0.0%) | 0 (0.0%) |
| 5 to 17 Years | 0 (0.0%) | 0 (0.0%) |
| 18 to 34 Years | 13 (4.4%) | 0 (0.0%) |
| 35 to 64 Years | 11 (1.3%) | 21 (2.6%) |
| 65 to 74 Years | 0 (0.0%) | 0 (0.0%) |
| 75 Years and over | 13 (9.2%) | 23 (16.8%) |
Disability Class: Cognitive Difficulty
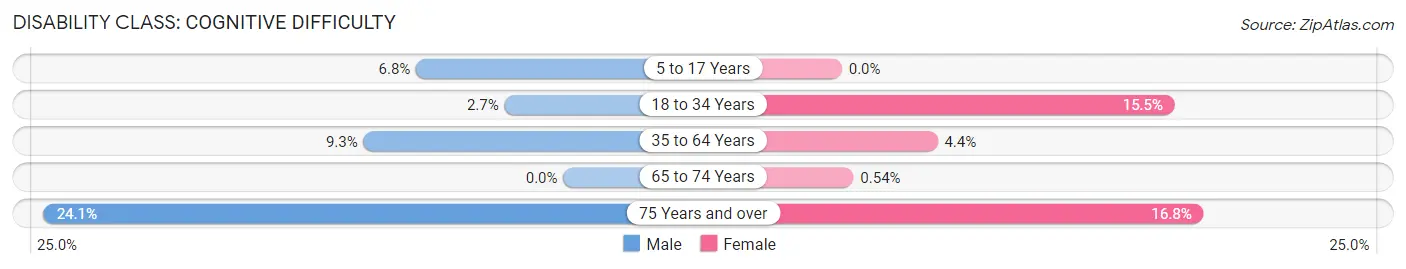
| Age Bracket | Male | Female |
| 5 to 17 Years | 20 (6.8%) | 0 (0.0%) |
| 18 to 34 Years | 8 (2.7%) | 55 (15.4%) |
| 35 to 64 Years | 78 (9.3%) | 36 (4.4%) |
| 65 to 74 Years | 0 (0.0%) | 1 (0.5%) |
| 75 Years and over | 34 (24.1%) | 23 (16.8%) |
Disability Class: Ambulatory Difficulty
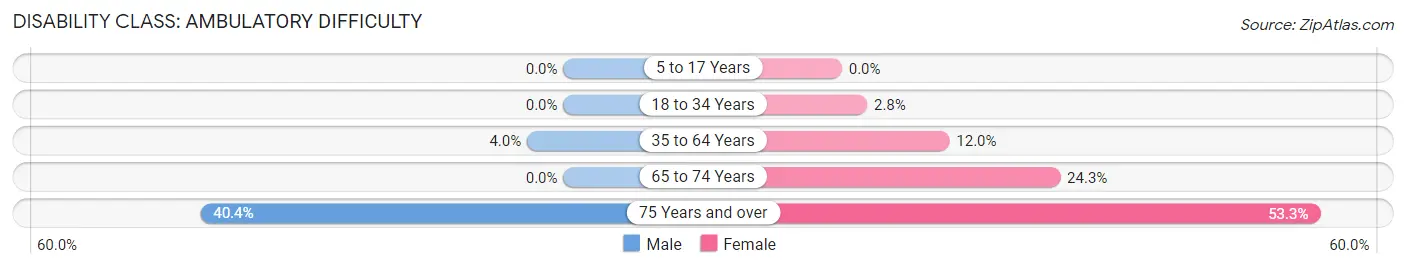
| Age Bracket | Male | Female |
| 5 to 17 Years | 0 (0.0%) | 0 (0.0%) |
| 18 to 34 Years | 0 (0.0%) | 10 (2.8%) |
| 35 to 64 Years | 34 (4.0%) | 97 (12.0%) |
| 65 to 74 Years | 0 (0.0%) | 45 (24.3%) |
| 75 Years and over | 57 (40.4%) | 73 (53.3%) |
Disability Class: Self-Care Difficulty
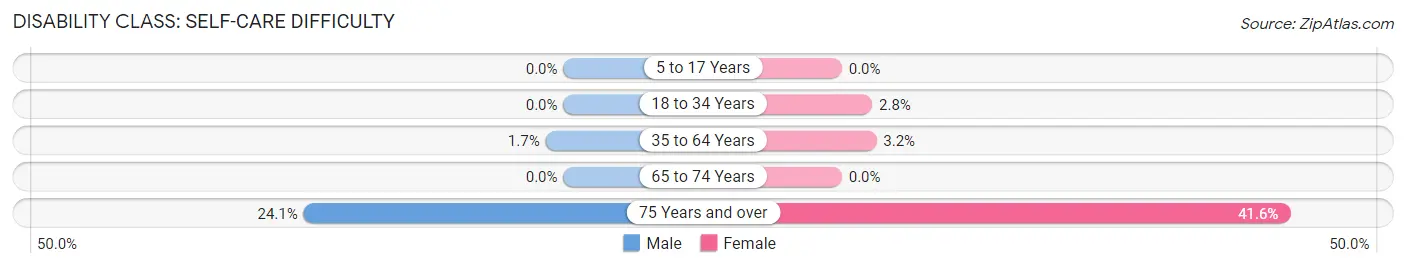
| Age Bracket | Male | Female |
| 5 to 17 Years | 0 (0.0%) | 0 (0.0%) |
| 18 to 34 Years | 0 (0.0%) | 10 (2.8%) |
| 35 to 64 Years | 14 (1.7%) | 26 (3.2%) |
| 65 to 74 Years | 0 (0.0%) | 0 (0.0%) |
| 75 Years and over | 34 (24.1%) | 57 (41.6%) |
Technology Access in Riverview Park
Computing Device Access in Riverview Park
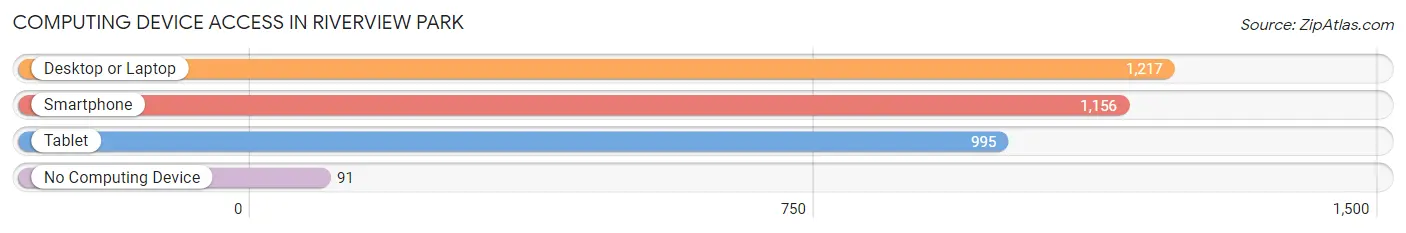
| Device Type | # Households | % Households |
| Desktop or Laptop | 1,217 | 86.7% |
| Smartphone | 1,156 | 82.4% |
| Tablet | 995 | 70.9% |
| No Computing Device | 91 | 6.5% |
| Total | 1,403 | 100.0% |
Internet Access in Riverview Park
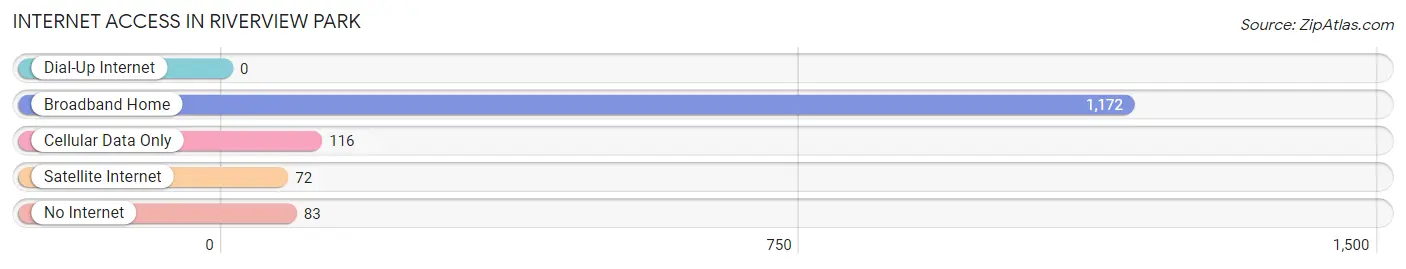
| Internet Type | # Households | % Households |
| Dial-Up Internet | 0 | 0.0% |
| Broadband Home | 1,172 | 83.5% |
| Cellular Data Only | 116 | 8.3% |
| Satellite Internet | 72 | 5.1% |
| No Internet | 83 | 5.9% |
| Total | 1,403 | 100.0% |
Riverview Park Summary
Riverview Park is a neighborhood located in the city of Pittsburgh, Pennsylvania. It is located in the North Side of the city and is bordered by the Allegheny River to the north, the Ohio River to the west, and the neighborhoods of Allegheny West, Manchester, and Marshall-Shadeland to the south and east. The neighborhood is home to a diverse population of approximately 8,000 people.
History
Riverview Park was originally part of the Allegheny Commons, a large tract of land that was granted to the city of Pittsburgh in 1788. The area was used for farming and grazing until the mid-1800s, when it began to be developed for residential use. The first homes in the area were built in the late 1800s, and the neighborhood was officially established in 1891.
The neighborhood was named after the nearby Riverview Park, which was established in 1894. The park was a popular destination for residents of the area, and it featured a variety of attractions, including a roller coaster, a carousel, and a dance hall. The park closed in the 1970s, but the area still retains its name.
Geography
Riverview Park is located in the North Side of Pittsburgh, and is bordered by the Allegheny River to the north, the Ohio River to the west, and the neighborhoods of Allegheny West, Manchester, and Marshall-Shadeland to the south and east. The neighborhood is located approximately 4 miles from downtown Pittsburgh.
The terrain of the neighborhood is mostly flat, with some hills in the northern part of the neighborhood. The area is mostly residential, with some commercial and industrial areas located along the Allegheny River.
Economy
The economy of Riverview Park is largely based on the service industry. The neighborhood is home to a variety of restaurants, bars, and other businesses that serve the local population. There are also several small manufacturing and industrial businesses located in the area.
Demographics
As of the 2010 census, the population of Riverview Park was 8,000. The racial makeup of the neighborhood was 79.3% White, 14.2% African American, 0.3% Native American, 1.2% Asian, and 4.9% from other races. The median household income was $37,945, and the median family income was $45,945.
Conclusion
Riverview Park is a diverse and vibrant neighborhood located in the North Side of Pittsburgh. The area has a rich history, and it is home to a variety of businesses and attractions. The economy of the neighborhood is largely based on the service industry, and the population is diverse and growing. Riverview Park is a great place to live, work, and play.
Common Questions
What is Per Capita Income in Riverview Park?
Per Capita income in Riverview Park is $45,531.
What is the Median Family Income in Riverview Park?
Median Family Income in Riverview Park is $104,500.
What is the Median Household income in Riverview Park?
Median Household Income in Riverview Park is $106,338.
What is Income or Wage Gap in Riverview Park?
Income or Wage Gap in Riverview Park is 34.3%.
Women in Riverview Park earn 65.7 cents for every dollar earned by a man.
What is Inequality or Gini Index in Riverview Park?
Inequality or Gini Index in Riverview Park is 0.33.
What is the Total Population of Riverview Park?
Total Population of Riverview Park is 3,675.
What is the Total Male Population of Riverview Park?
Total Male Population of Riverview Park is 1,881.
What is the Total Female Population of Riverview Park?
Total Female Population of Riverview Park is 1,794.
What is the Ratio of Males per 100 Females in Riverview Park?
There are 104.85 Males per 100 Females in Riverview Park.
What is the Ratio of Females per 100 Males in Riverview Park?
There are 95.37 Females per 100 Males in Riverview Park.
What is the Median Population Age in Riverview Park?
Median Population Age in Riverview Park is 39.9 Years.
What is the Average Family Size in Riverview Park
Average Family Size in Riverview Park is 3.1 People.
What is the Average Household Size in Riverview Park
Average Household Size in Riverview Park is 2.6 People.
How Large is the Labor Force in Riverview Park?
There are 1,997 People in the Labor Forcein in Riverview Park.
What is the Percentage of People in the Labor Force in Riverview Park?
66.6% of People are in the Labor Force in Riverview Park.