Upper Exeter, PA Map & Demographics
Upper Exeter Map
Upper Exeter Overview
$41,957
PER CAPITA INCOME
$81,686
AVG FAMILY INCOME
$81,120
AVG HOUSEHOLD INCOME
0.45
INEQUALITY / GINI INDEX
971
TOTAL POPULATION
539
MALE POPULATION
432
FEMALE POPULATION
124.77
MALES / 100 FEMALES
80.15
FEMALES / 100 MALES
30.0
MEDIAN AGE
2.8
AVG FAMILY SIZE
2.6
AVG HOUSEHOLD SIZE
533
LABOR FORCE [ PEOPLE ]
63.3%
PERCENT IN LABOR FORCE
1.9%
UNEMPLOYMENT RATE
Income in Upper Exeter
Income Overview in Upper Exeter
Per Capita Income in Upper Exeter is $41,957, while median incomes of families and households are $81,686 and $81,120 respectively.
| Characteristic | Number | Measure |
| Per Capita Income | 971 | $41,957 |
| Median Family Income | 305 | $81,686 |
| Mean Family Income | 305 | $111,585 |
| Median Household Income | 379 | $81,120 |
| Mean Household Income | 379 | $98,957 |
| Income Deficit | 305 | $0 |
| Wage / Income Gap (%) | 971 | 0.00% |
| Wage / Income Gap ($) | 971 | 100.00¢ per $1 |
| Gini / Inequality Index | 971 | 0.45 |
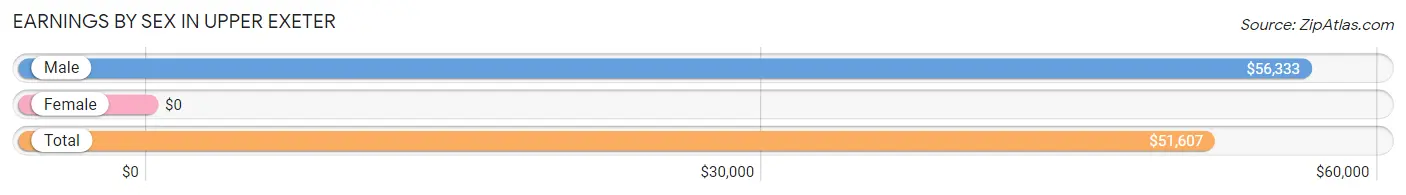
Earnings by Sex in Upper Exeter
| Sex | Number | Average Earnings |
| Male | 279 (49.9%) | $56,333 |
| Female | 280 (50.1%) | $0 |
| Total | 559 (100.0%) | $51,607 |
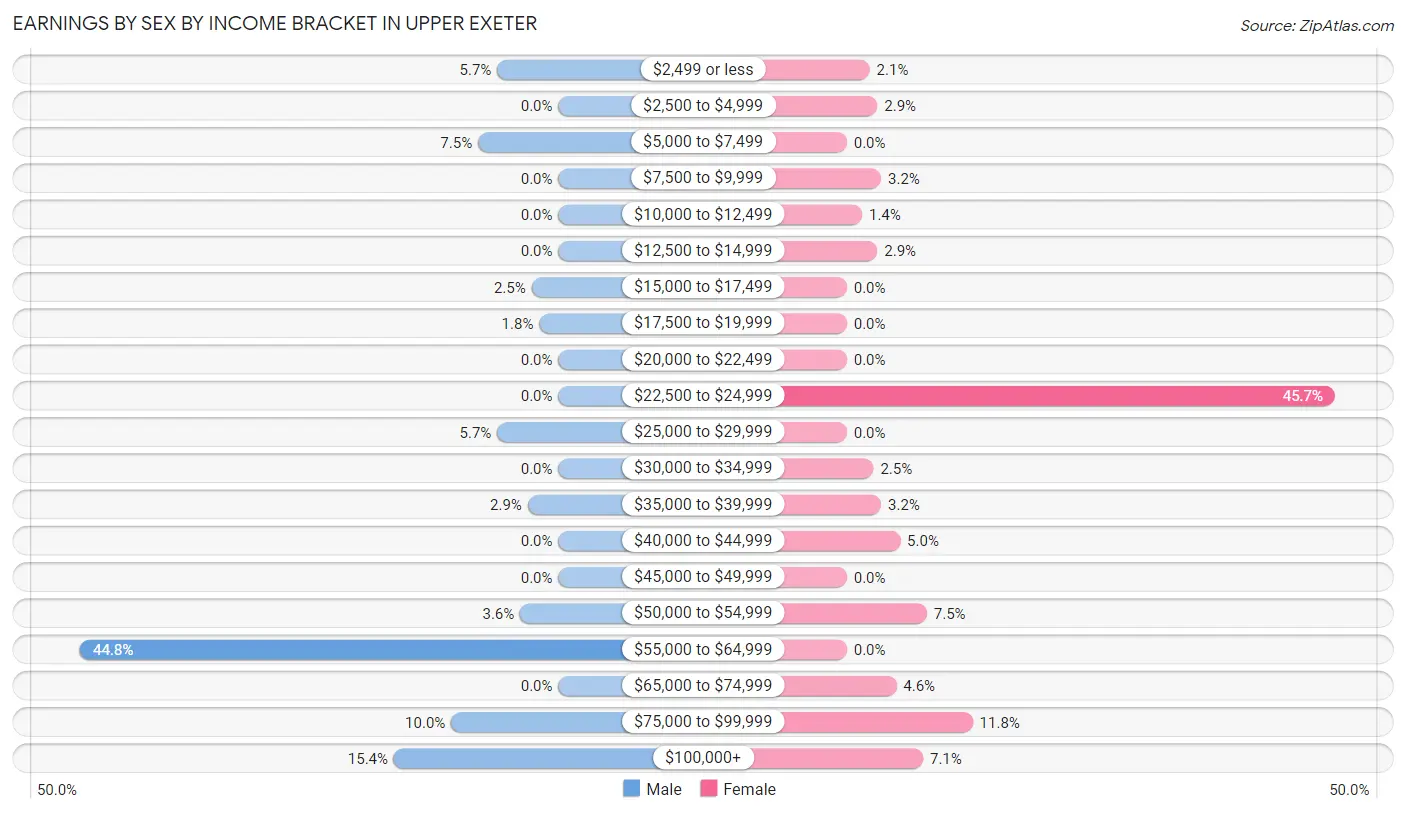
Earnings by Sex by Income Bracket in Upper Exeter
The most common earnings brackets in Upper Exeter are $55,000 to $64,999 for men (125 | 44.8%) and $22,500 to $24,999 for women (128 | 45.7%).
| Income | Male | Female |
| $2,499 or less | 16 (5.7%) | 6 (2.1%) |
| $2,500 to $4,999 | 0 (0.0%) | 8 (2.9%) |
| $5,000 to $7,499 | 21 (7.5%) | 0 (0.0%) |
| $7,500 to $9,999 | 0 (0.0%) | 9 (3.2%) |
| $10,000 to $12,499 | 0 (0.0%) | 4 (1.4%) |
| $12,500 to $14,999 | 0 (0.0%) | 8 (2.9%) |
| $15,000 to $17,499 | 7 (2.5%) | 0 (0.0%) |
| $17,500 to $19,999 | 5 (1.8%) | 0 (0.0%) |
| $20,000 to $22,499 | 0 (0.0%) | 0 (0.0%) |
| $22,500 to $24,999 | 0 (0.0%) | 128 (45.7%) |
| $25,000 to $29,999 | 16 (5.7%) | 0 (0.0%) |
| $30,000 to $34,999 | 0 (0.0%) | 7 (2.5%) |
| $35,000 to $39,999 | 8 (2.9%) | 9 (3.2%) |
| $40,000 to $44,999 | 0 (0.0%) | 14 (5.0%) |
| $45,000 to $49,999 | 0 (0.0%) | 0 (0.0%) |
| $50,000 to $54,999 | 10 (3.6%) | 21 (7.5%) |
| $55,000 to $64,999 | 125 (44.8%) | 0 (0.0%) |
| $65,000 to $74,999 | 0 (0.0%) | 13 (4.6%) |
| $75,000 to $99,999 | 28 (10.0%) | 33 (11.8%) |
| $100,000+ | 43 (15.4%) | 20 (7.1%) |
| Total | 279 (100.0%) | 280 (100.0%) |
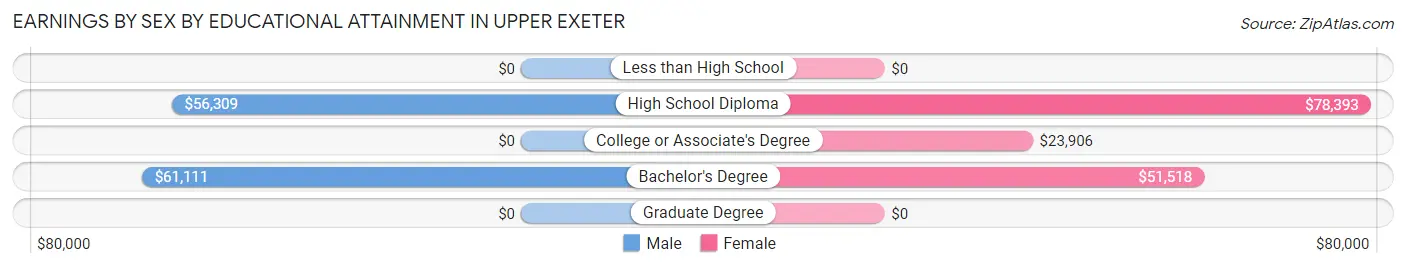
Earnings by Sex by Educational Attainment in Upper Exeter
| Educational Attainment | Male Income | Female Income |
| Less than High School | - | - |
| High School Diploma | $56,309 | $78,393 |
| College or Associate's Degree | - | - |
| Bachelor's Degree | $61,111 | $51,518 |
| Graduate Degree | - | - |
| Total | $56,686 | $0 |
Family Income in Upper Exeter
Family Income Brackets in Upper Exeter
According to the Upper Exeter family income data, there are 112 families falling into the $75,000 to $99,999 income range, which is the most common income bracket and makes up 36.7% of all families.
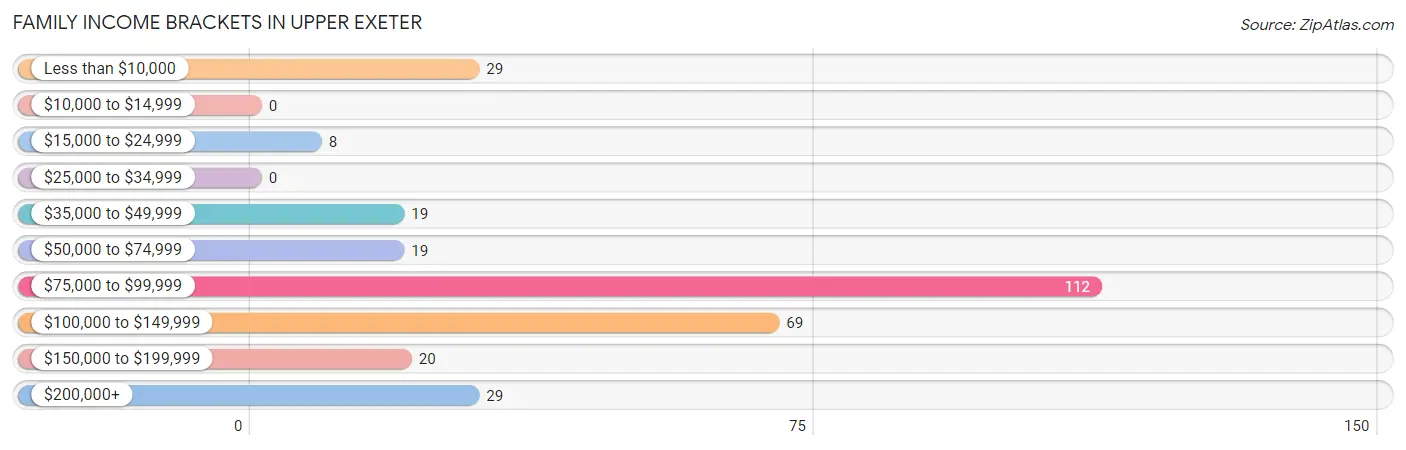
| Income Bracket | # Families | % Families |
| Less than $10,000 | 29 | 9.5% |
| $10,000 to $14,999 | 0 | 0.0% |
| $15,000 to $24,999 | 8 | 2.6% |
| $25,000 to $34,999 | 0 | 0.0% |
| $35,000 to $49,999 | 19 | 6.2% |
| $50,000 to $74,999 | 19 | 6.2% |
| $75,000 to $99,999 | 112 | 36.7% |
| $100,000 to $149,999 | 69 | 22.6% |
| $150,000 to $199,999 | 20 | 6.6% |
| $200,000+ | 29 | 9.5% |
Family Income by Famaliy Size in Upper Exeter
3-person families (148 | 48.5%) account for the highest median family income in Upper Exeter with $81,415 per family, while 2-person families (127 | 41.6%) have the highest median income of $37,266 per family member.
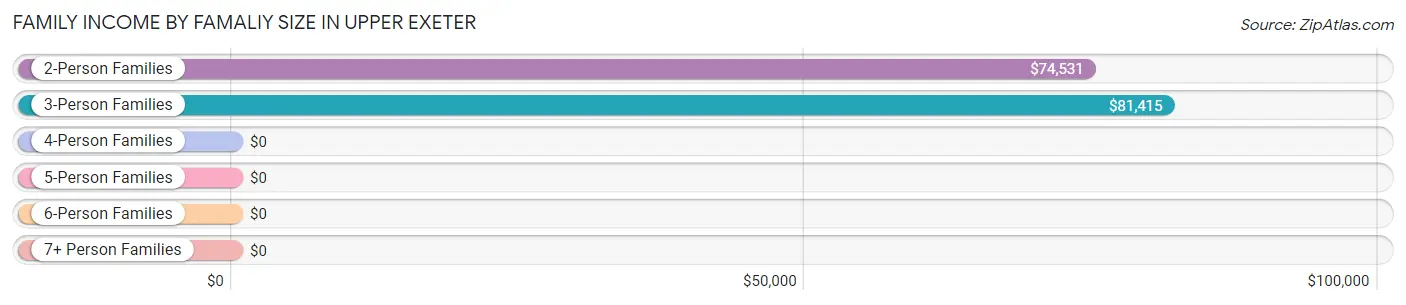
| Income Bracket | # Families | Median Income |
| 2-Person Families | 127 (41.6%) | $74,531 |
| 3-Person Families | 148 (48.5%) | $81,415 |
| 4-Person Families | 10 (3.3%) | $0 |
| 5-Person Families | 20 (6.6%) | $0 |
| 6-Person Families | 0 (0.0%) | $0 |
| 7+ Person Families | 0 (0.0%) | $0 |
| Total | 305 (100.0%) | $81,686 |
Family Income by Number of Earners in Upper Exeter
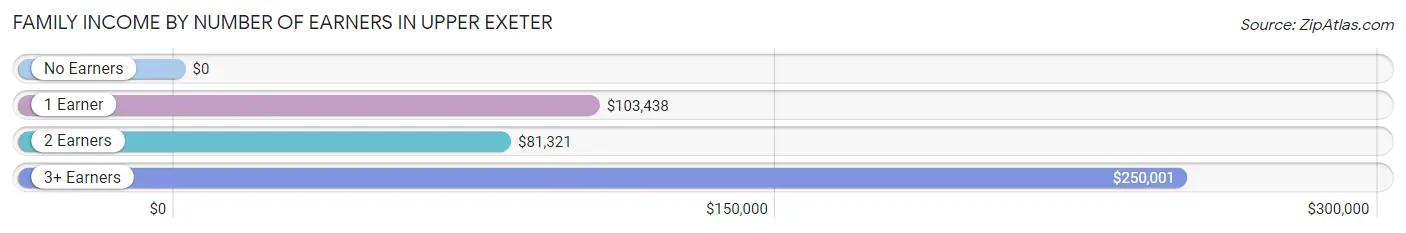
| Number of Earners | # Families | Median Income |
| No Earners | 70 (23.0%) | $0 |
| 1 Earner | 44 (14.4%) | $103,438 |
| 2 Earners | 158 (51.8%) | $81,321 |
| 3+ Earners | 33 (10.8%) | $250,001 |
| Total | 305 (100.0%) | $81,686 |
Household Income in Upper Exeter
Household Income Brackets in Upper Exeter
With 112 households falling in the category, the $75,000 to $99,999 income range is the most frequent in Upper Exeter, accounting for 29.5% of all households. In contrast, only 8 households (2.1%) fall into the $15,000 to $24,999 income bracket, making it the least populous group.
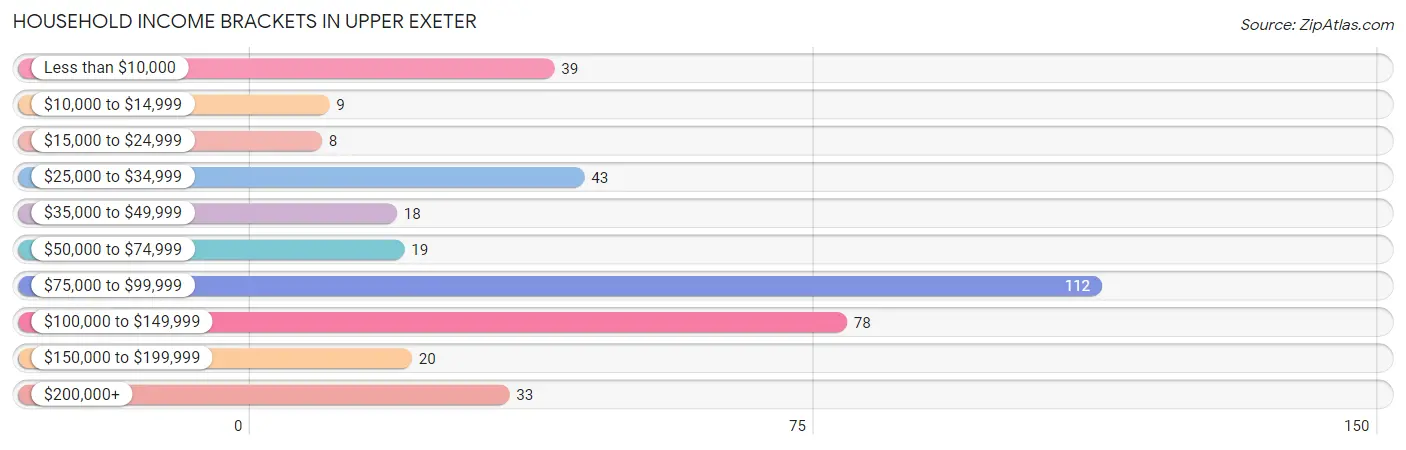
| Income Bracket | # Households | % Households |
| Less than $10,000 | 39 | 10.3% |
| $10,000 to $14,999 | 9 | 2.4% |
| $15,000 to $24,999 | 8 | 2.1% |
| $25,000 to $34,999 | 43 | 11.3% |
| $35,000 to $49,999 | 18 | 4.7% |
| $50,000 to $74,999 | 19 | 5.0% |
| $75,000 to $99,999 | 112 | 29.6% |
| $100,000 to $149,999 | 78 | 20.6% |
| $150,000 to $199,999 | 20 | 5.3% |
| $200,000+ | 33 | 8.7% |
Household Income by Householder Age in Upper Exeter
The median household income in Upper Exeter is $81,120, with the highest median household income of $81,474 found in the 25 to 44 years age bracket for the primary householder. A total of 129 households (34.0%) fall into this category.
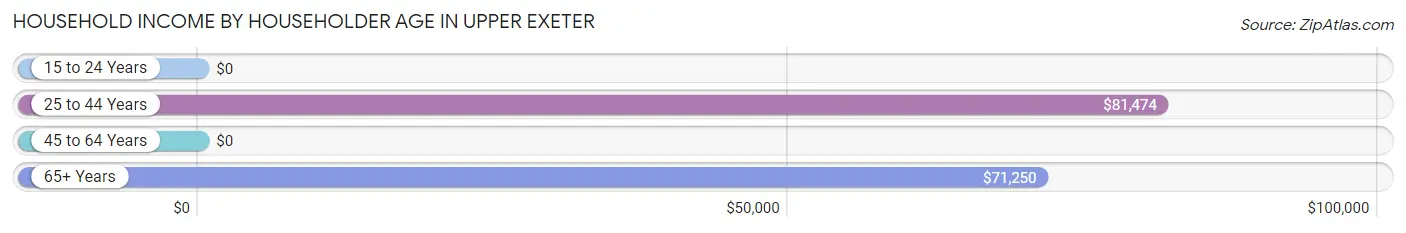
| Income Bracket | # Households | Median Income |
| 15 to 24 Years | 0 (0.0%) | $0 |
| 25 to 44 Years | 129 (34.0%) | $81,474 |
| 45 to 64 Years | 152 (40.1%) | $0 |
| 65+ Years | 98 (25.9%) | $71,250 |
| Total | 379 (100.0%) | $81,120 |
Poverty in Upper Exeter
Income Below Poverty by Sex and Age in Upper Exeter
With 13.0% poverty level for males and 10.0% for females among the residents of Upper Exeter, 16 and 17 year old males and 18 to 24 year old females are the most vulnerable to poverty, with 25 males (53.2%) and 8 females (50.0%) in their respective age groups living below the poverty level.
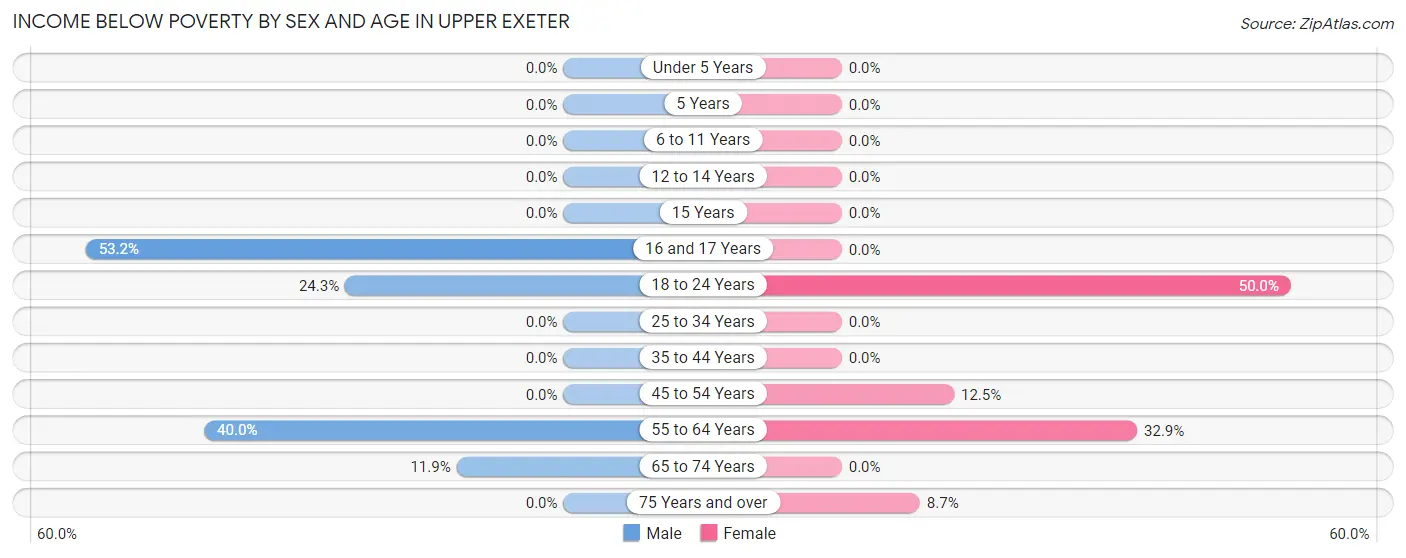
| Age Bracket | Male | Female |
| Under 5 Years | 0 (0.0%) | 0 (0.0%) |
| 5 Years | 0 (0.0%) | 0 (0.0%) |
| 6 to 11 Years | 0 (0.0%) | 0 (0.0%) |
| 12 to 14 Years | 0 (0.0%) | 0 (0.0%) |
| 15 Years | 0 (0.0%) | 0 (0.0%) |
| 16 and 17 Years | 25 (53.2%) | 0 (0.0%) |
| 18 to 24 Years | 9 (24.3%) | 8 (50.0%) |
| 25 to 34 Years | 0 (0.0%) | 0 (0.0%) |
| 35 to 44 Years | 0 (0.0%) | 0 (0.0%) |
| 45 to 54 Years | 0 (0.0%) | 6 (12.5%) |
| 55 to 64 Years | 30 (40.0%) | 25 (32.9%) |
| 65 to 74 Years | 5 (11.9%) | 0 (0.0%) |
| 75 Years and over | 0 (0.0%) | 4 (8.7%) |
| Total | 69 (13.0%) | 43 (10.0%) |
Income Above Poverty by Sex and Age in Upper Exeter
According to the poverty statistics in Upper Exeter, males aged under 5 years and females aged under 5 years are the age groups that are most secure financially, with 100.0% of males and 100.0% of females in these age groups living above the poverty line.
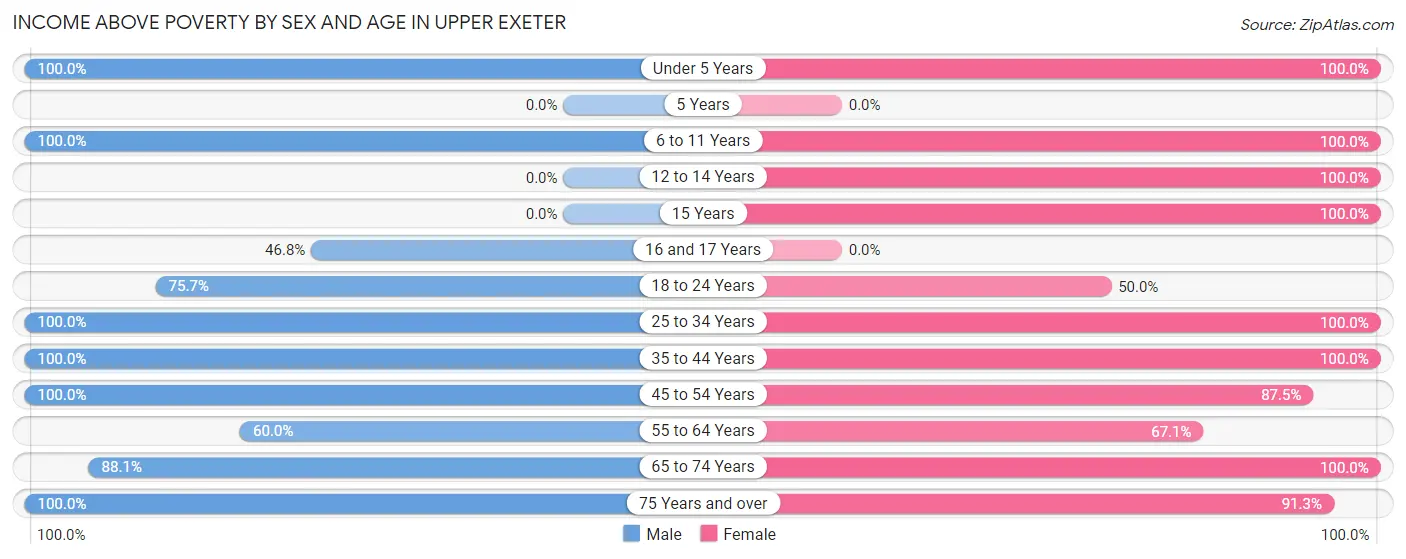
| Age Bracket | Male | Female |
| Under 5 Years | 67 (100.0%) | 8 (100.0%) |
| 5 Years | 0 (0.0%) | 0 (0.0%) |
| 6 to 11 Years | 4 (100.0%) | 9 (100.0%) |
| 12 to 14 Years | 0 (0.0%) | 19 (100.0%) |
| 15 Years | 0 (0.0%) | 14 (100.0%) |
| 16 and 17 Years | 22 (46.8%) | 0 (0.0%) |
| 18 to 24 Years | 28 (75.7%) | 8 (50.0%) |
| 25 to 34 Years | 131 (100.0%) | 152 (100.0%) |
| 35 to 44 Years | 35 (100.0%) | 13 (100.0%) |
| 45 to 54 Years | 65 (100.0%) | 42 (87.5%) |
| 55 to 64 Years | 45 (60.0%) | 51 (67.1%) |
| 65 to 74 Years | 37 (88.1%) | 31 (100.0%) |
| 75 Years and over | 28 (100.0%) | 42 (91.3%) |
| Total | 462 (87.0%) | 389 (90.0%) |
Income Below Poverty Among Married-Couple Families in Upper Exeter
The poverty statistics for married-couple families in Upper Exeter show that 1.9% or 5 of the total 259 families live below the poverty line. Families with no children have the highest poverty rate of 4.3%, comprising of 5 families. On the other hand, families with 1 or 2 children have the lowest poverty rate of 0.0%, which includes 0 families.
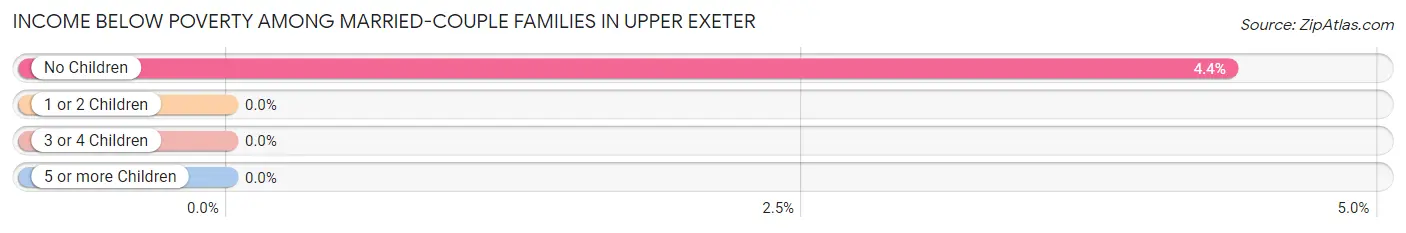
| Children | Above Poverty | Below Poverty |
| No Children | 110 (95.7%) | 5 (4.3%) |
| 1 or 2 Children | 144 (100.0%) | 0 (0.0%) |
| 3 or 4 Children | 0 (0.0%) | 0 (0.0%) |
| 5 or more Children | 0 (0.0%) | 0 (0.0%) |
| Total | 254 (98.1%) | 5 (1.9%) |
Income Below Poverty Among Single-Parent Households in Upper Exeter
According to the poverty data in Upper Exeter, 100.0% or 24 single-father households and 36.4% or 8 single-mother households are living below the poverty line. Among single-father households, those with 1 or 2 children have the highest poverty rate, with 24 households (100.0%) experiencing poverty. Likewise, among single-mother households, those with no children have the highest poverty rate, with 8 households (50.0%) falling below the poverty line.
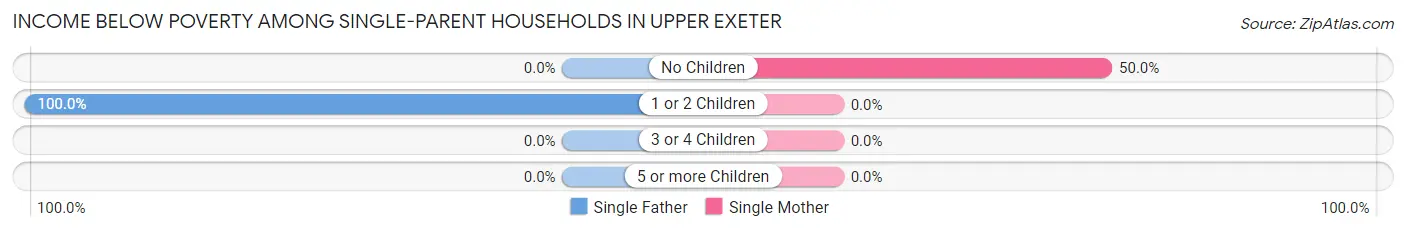
| Children | Single Father | Single Mother |
| No Children | 0 (0.0%) | 8 (50.0%) |
| 1 or 2 Children | 24 (100.0%) | 0 (0.0%) |
| 3 or 4 Children | 0 (0.0%) | 0 (0.0%) |
| 5 or more Children | 0 (0.0%) | 0 (0.0%) |
| Total | 24 (100.0%) | 8 (36.4%) |
Income Below Poverty Among Married-Couple vs Single-Parent Households in Upper Exeter
The poverty data for Upper Exeter shows that 5 of the married-couple family households (1.9%) and 32 of the single-parent households (69.6%) are living below the poverty level. Within the married-couple family households, those with no children have the highest poverty rate, with 5 households (4.3%) falling below the poverty line. Among the single-parent households, those with 1 or 2 children have the highest poverty rate, with 24 household (80.0%) living below poverty.
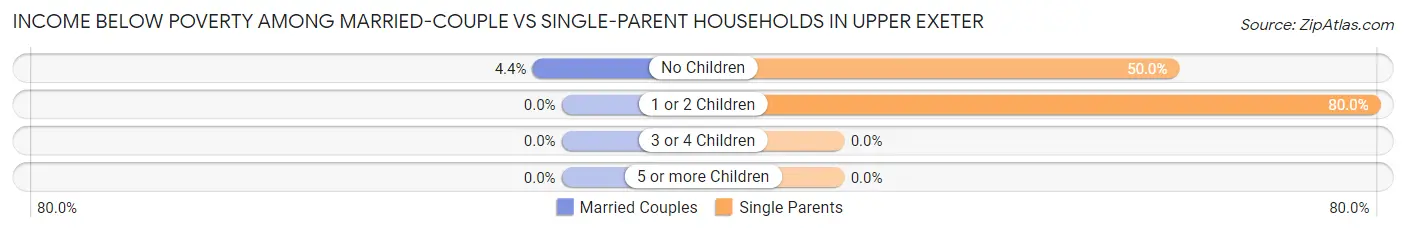
| Children | Married-Couple Families | Single-Parent Households |
| No Children | 5 (4.3%) | 8 (50.0%) |
| 1 or 2 Children | 0 (0.0%) | 24 (80.0%) |
| 3 or 4 Children | 0 (0.0%) | 0 (0.0%) |
| 5 or more Children | 0 (0.0%) | 0 (0.0%) |
| Total | 5 (1.9%) | 32 (69.6%) |
Race in Upper Exeter
The most populous races in Upper Exeter are White / Caucasian (939 | 96.7%), Two or more Races (22 | 2.3%), and Asian (10 | 1.0%).
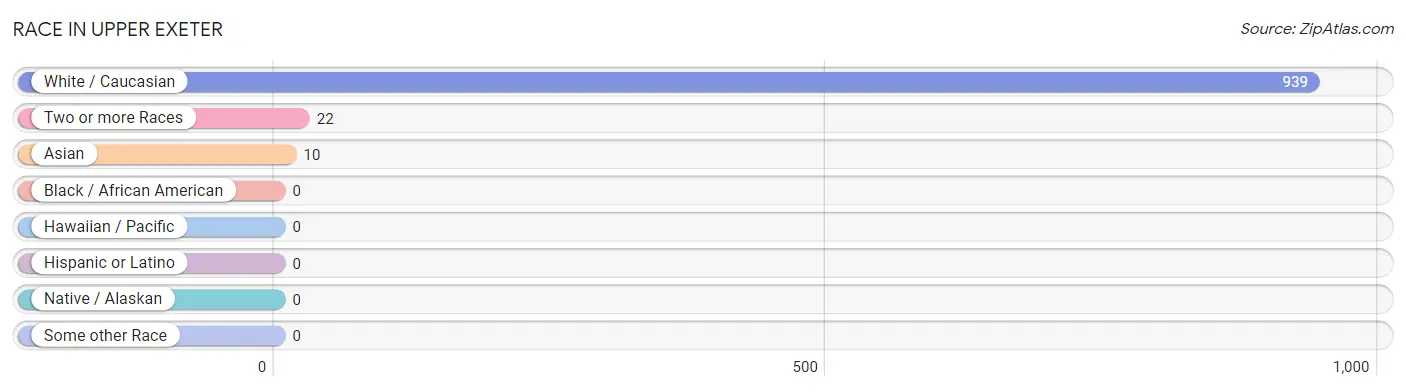
| Race | # Population | % Population |
| Asian | 10 | 1.0% |
| Black / African American | 0 | 0.0% |
| Hawaiian / Pacific | 0 | 0.0% |
| Hispanic or Latino | 0 | 0.0% |
| Native / Alaskan | 0 | 0.0% |
| White / Caucasian | 939 | 96.7% |
| Two or more Races | 22 | 2.3% |
| Some other Race | 0 | 0.0% |
| Total | 971 | 100.0% |
Ancestry in Upper Exeter
The most populous ancestries reported in Upper Exeter are Irish (265 | 27.3%), German (264 | 27.2%), Italian (167 | 17.2%), Welsh (108 | 11.1%), and Polish (103 | 10.6%), together accounting for 93.4% of all Upper Exeter residents.
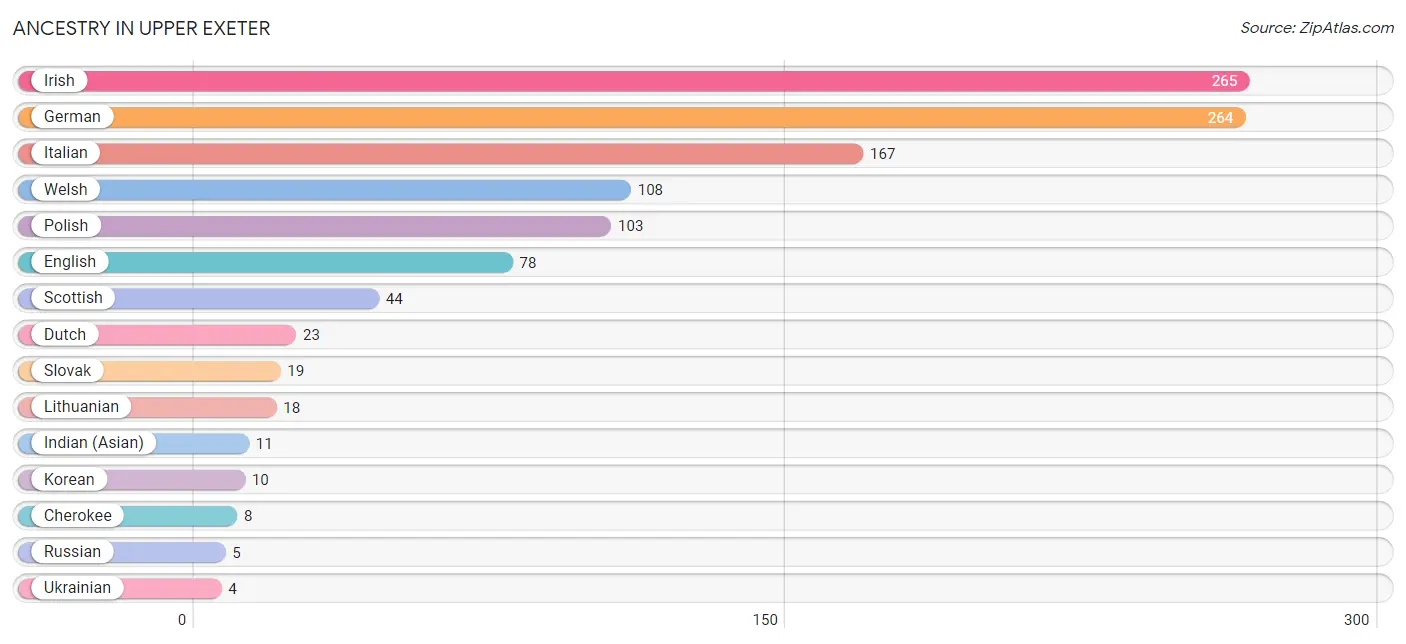
| Ancestry | # Population | % Population |
| Cherokee | 8 | 0.8% |
| Dutch | 23 | 2.4% |
| English | 78 | 8.0% |
| German | 264 | 27.2% |
| Indian (Asian) | 11 | 1.1% |
| Irish | 265 | 27.3% |
| Italian | 167 | 17.2% |
| Korean | 10 | 1.0% |
| Lithuanian | 18 | 1.8% |
| Polish | 103 | 10.6% |
| Russian | 5 | 0.5% |
| Scottish | 44 | 4.5% |
| Slovak | 19 | 2.0% |
| Ukrainian | 4 | 0.4% |
| Welsh | 108 | 11.1% | View All 15 Rows |
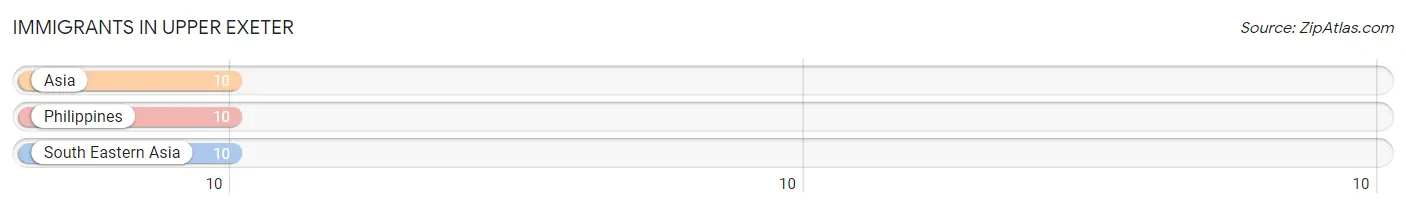
Immigrants in Upper Exeter
The most numerous immigrant groups reported in Upper Exeter came from Asia (10 | 1.0%), Philippines (10 | 1.0%), and South Eastern Asia (10 | 1.0%), together accounting for 3.1% of all Upper Exeter residents.
| Immigration Origin | # Population | % Population |
| Asia | 10 | 1.0% |
| Philippines | 10 | 1.0% |
| South Eastern Asia | 10 | 1.0% | View All 3 Rows |
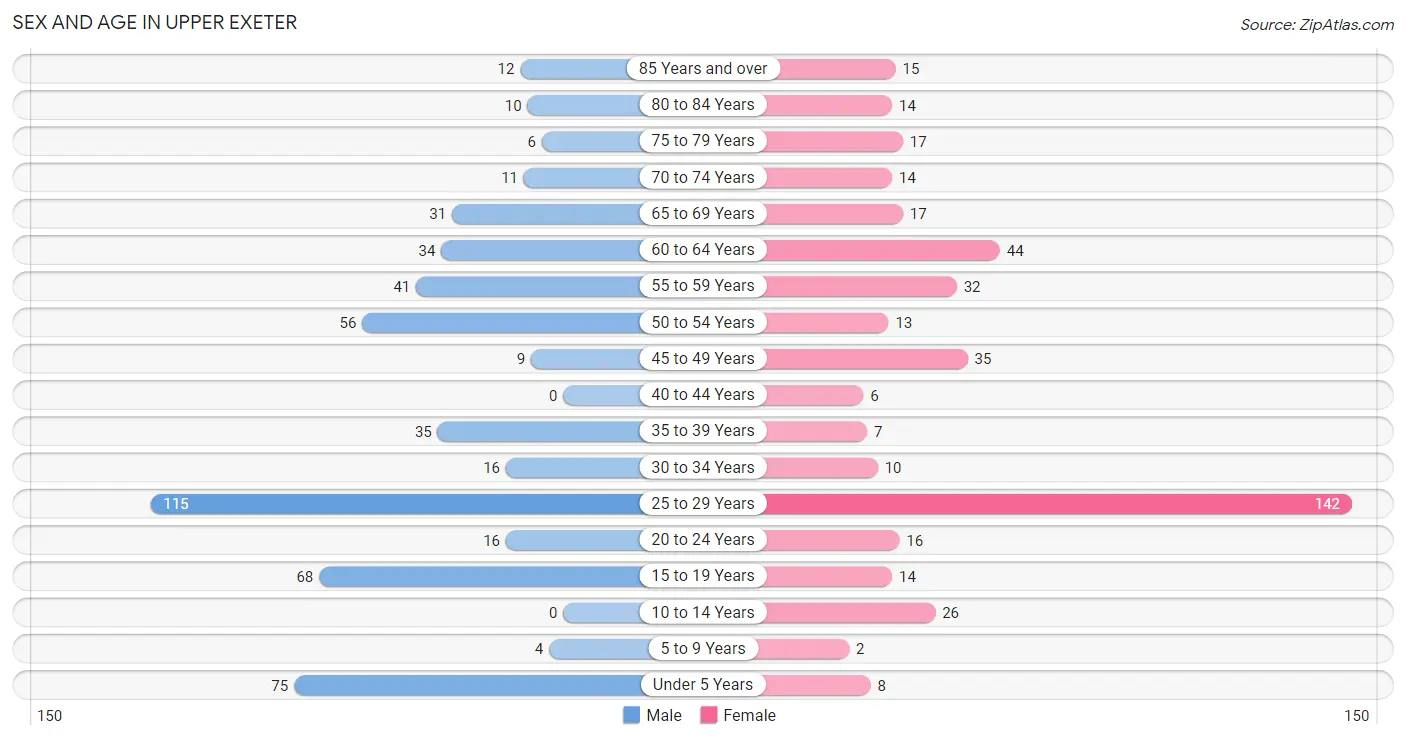
Sex and Age in Upper Exeter
Sex and Age in Upper Exeter
The most populous age groups in Upper Exeter are 25 to 29 Years (115 | 21.3%) for men and 25 to 29 Years (142 | 32.9%) for women.
| Age Bracket | Male | Female |
| Under 5 Years | 75 (13.9%) | 8 (1.8%) |
| 5 to 9 Years | 4 (0.7%) | 2 (0.5%) |
| 10 to 14 Years | 0 (0.0%) | 26 (6.0%) |
| 15 to 19 Years | 68 (12.6%) | 14 (3.2%) |
| 20 to 24 Years | 16 (3.0%) | 16 (3.7%) |
| 25 to 29 Years | 115 (21.3%) | 142 (32.9%) |
| 30 to 34 Years | 16 (3.0%) | 10 (2.3%) |
| 35 to 39 Years | 35 (6.5%) | 7 (1.6%) |
| 40 to 44 Years | 0 (0.0%) | 6 (1.4%) |
| 45 to 49 Years | 9 (1.7%) | 35 (8.1%) |
| 50 to 54 Years | 56 (10.4%) | 13 (3.0%) |
| 55 to 59 Years | 41 (7.6%) | 32 (7.4%) |
| 60 to 64 Years | 34 (6.3%) | 44 (10.2%) |
| 65 to 69 Years | 31 (5.8%) | 17 (3.9%) |
| 70 to 74 Years | 11 (2.0%) | 14 (3.2%) |
| 75 to 79 Years | 6 (1.1%) | 17 (3.9%) |
| 80 to 84 Years | 10 (1.9%) | 14 (3.2%) |
| 85 Years and over | 12 (2.2%) | 15 (3.5%) |
| Total | 539 (100.0%) | 432 (100.0%) |
Families and Households in Upper Exeter
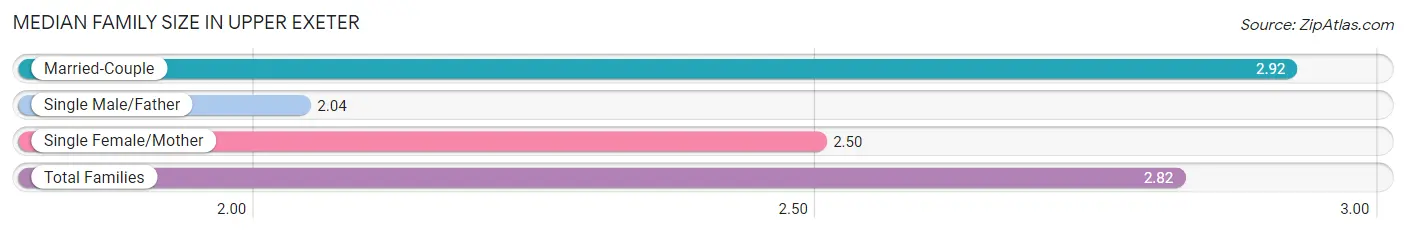
Median Family Size in Upper Exeter
The median family size in Upper Exeter is 2.82 persons per family, with married-couple families (259 | 84.9%) accounting for the largest median family size of 2.92 persons per family. On the other hand, single male/father families (24 | 7.9%) represent the smallest median family size with 2.04 persons per family.
| Family Type | # Families | Family Size |
| Married-Couple | 259 (84.9%) | 2.92 |
| Single Male/Father | 24 (7.9%) | 2.04 |
| Single Female/Mother | 22 (7.2%) | 2.50 |
| Total Families | 305 (100.0%) | 2.82 |
Median Household Size in Upper Exeter
The median household size in Upper Exeter is 2.56 persons per household, with single female/mother households (22 | 5.8%) accounting for the largest median household size of 3.18 persons per household. non-family households (74 | 19.5%) represent the smallest median household size with 1.19 persons per household.

| Household Type | # Households | Household Size |
| Married-Couple | 259 (68.3%) | 2.95 |
| Single Male/Father | 24 (6.3%) | 2.04 |
| Single Female/Mother | 22 (5.8%) | 3.18 |
| Non-family | 74 (19.5%) | 1.19 |
| Total Households | 379 (100.0%) | 2.56 |
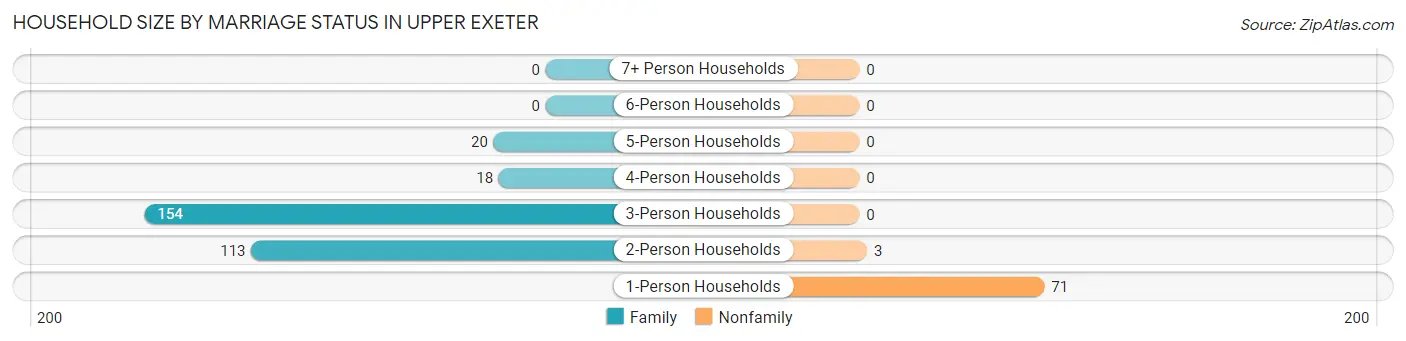
Household Size by Marriage Status in Upper Exeter
Out of a total of 379 households in Upper Exeter, 305 (80.5%) are family households, while 74 (19.5%) are nonfamily households. The most numerous type of family households are 3-person households, comprising 154, and the most common type of nonfamily households are 1-person households, comprising 71.
| Household Size | Family Households | Nonfamily Households |
| 1-Person Households | - | 71 (18.7%) |
| 2-Person Households | 113 (29.8%) | 3 (0.8%) |
| 3-Person Households | 154 (40.6%) | 0 (0.0%) |
| 4-Person Households | 18 (4.8%) | 0 (0.0%) |
| 5-Person Households | 20 (5.3%) | 0 (0.0%) |
| 6-Person Households | 0 (0.0%) | 0 (0.0%) |
| 7+ Person Households | 0 (0.0%) | 0 (0.0%) |
| Total | 305 (80.5%) | 74 (19.5%) |
Female Fertility in Upper Exeter
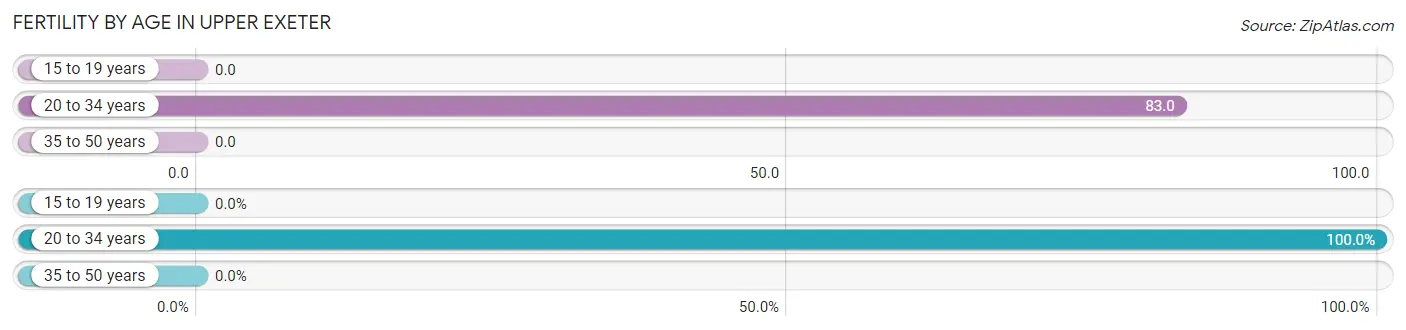
Fertility by Age in Upper Exeter
Average fertility rate in Upper Exeter is 59.0 births per 1,000 women. Women in the age bracket of 20 to 34 years have the highest fertility rate with 83.0 births per 1,000 women. Women in the age bracket of 20 to 34 years acount for 100.0% of all women with births.
| Age Bracket | Women with Births | Births / 1,000 Women |
| 15 to 19 years | 0 (0.0%) | 0.0 |
| 20 to 34 years | 14 (100.0%) | 83.0 |
| 35 to 50 years | 0 (0.0%) | 0.0 |
| Total | 14 (100.0%) | 59.0 |
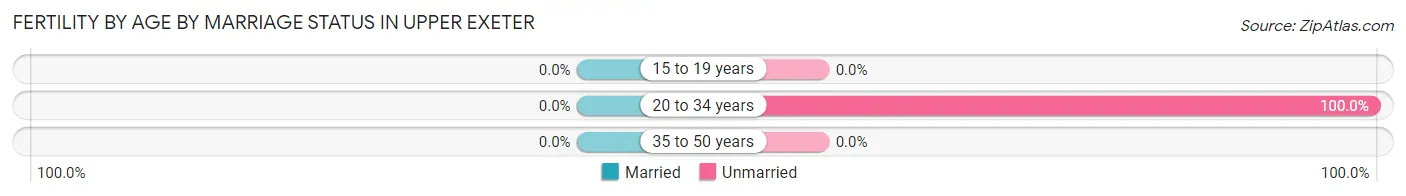
Fertility by Age by Marriage Status in Upper Exeter
| Age Bracket | Married | Unmarried |
| 15 to 19 years | 0 (0.0%) | 0 (0.0%) |
| 20 to 34 years | 0 (0.0%) | 14 (100.0%) |
| 35 to 50 years | 0 (0.0%) | 0 (0.0%) |
| Total | 0 (0.0%) | 14 (100.0%) |
Fertility by Education in Upper Exeter
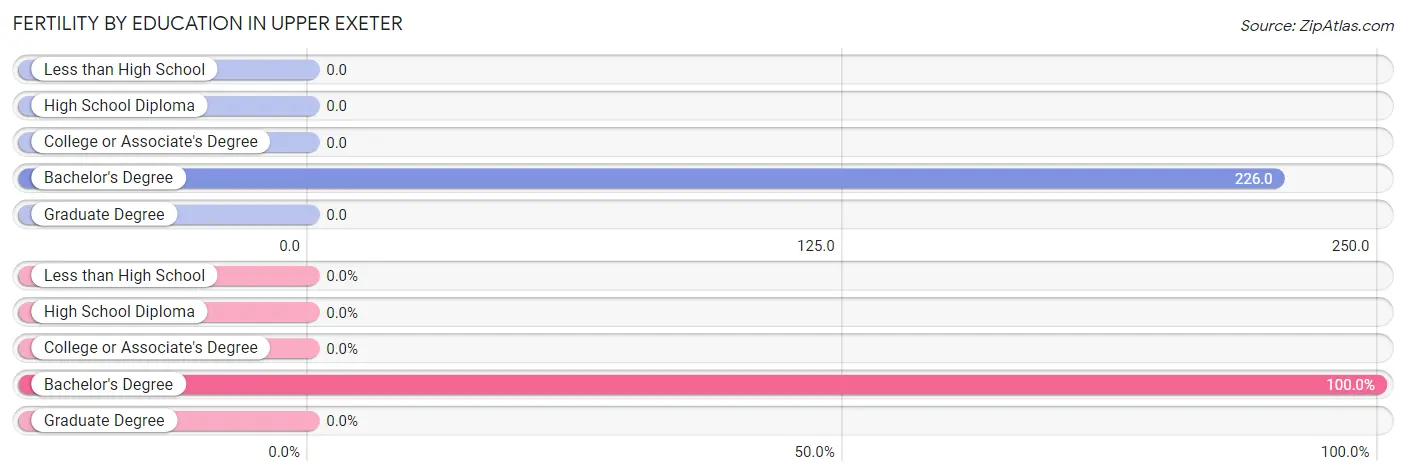
| Educational Attainment | Women with Births | Births / 1,000 Women |
| Less than High School | 0 (0.0%) | 0.0 |
| High School Diploma | 0 (0.0%) | 0.0 |
| College or Associate's Degree | 0 (0.0%) | 0.0 |
| Bachelor's Degree | 14 (100.0%) | 226.0 |
| Graduate Degree | 0 (0.0%) | 0.0 |
| Total | 14 (100.0%) | 59.0 |
Fertility by Education by Marriage Status in Upper Exeter
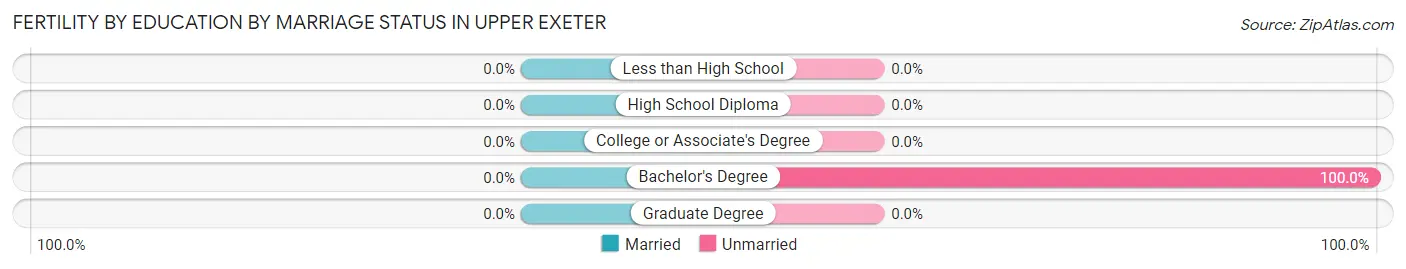
| Educational Attainment | Married | Unmarried |
| Less than High School | 0 (0.0%) | 0 (0.0%) |
| High School Diploma | 0 (0.0%) | 0 (0.0%) |
| College or Associate's Degree | 0 (0.0%) | 0 (0.0%) |
| Bachelor's Degree | 0 (0.0%) | 14 (100.0%) |
| Graduate Degree | 0 (0.0%) | 0 (0.0%) |
| Total | 0 (0.0%) | 14 (100.0%) |
Employment Characteristics in Upper Exeter
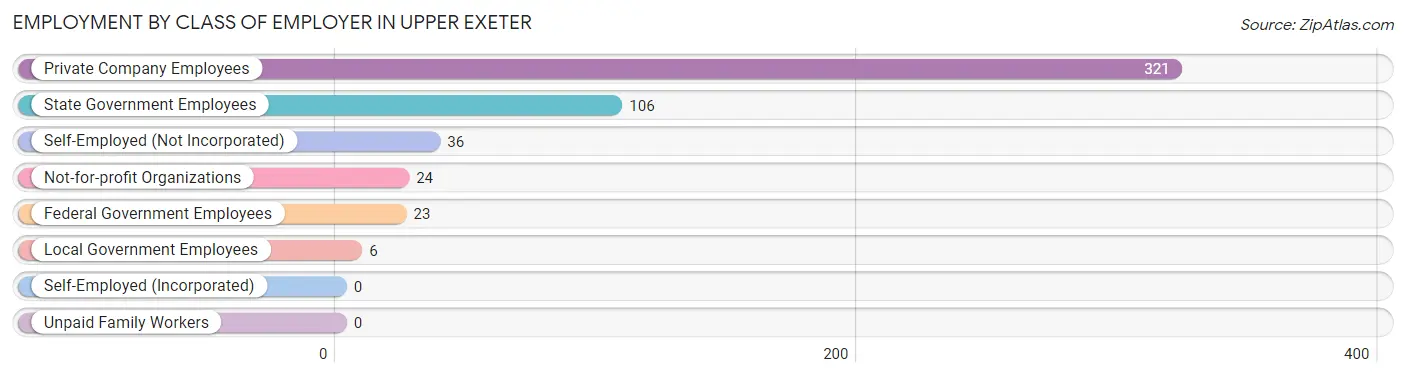
Employment by Class of Employer in Upper Exeter
Among the 516 employed individuals in Upper Exeter, private company employees (321 | 62.2%), state government employees (106 | 20.5%), and self-employed (not incorporated) (36 | 7.0%) make up the most common classes of employment.
| Employer Class | # Employees | % Employees |
| Private Company Employees | 321 | 62.2% |
| Self-Employed (Incorporated) | 0 | 0.0% |
| Self-Employed (Not Incorporated) | 36 | 7.0% |
| Not-for-profit Organizations | 24 | 4.6% |
| Local Government Employees | 6 | 1.2% |
| State Government Employees | 106 | 20.5% |
| Federal Government Employees | 23 | 4.5% |
| Unpaid Family Workers | 0 | 0.0% |
| Total | 516 | 100.0% |
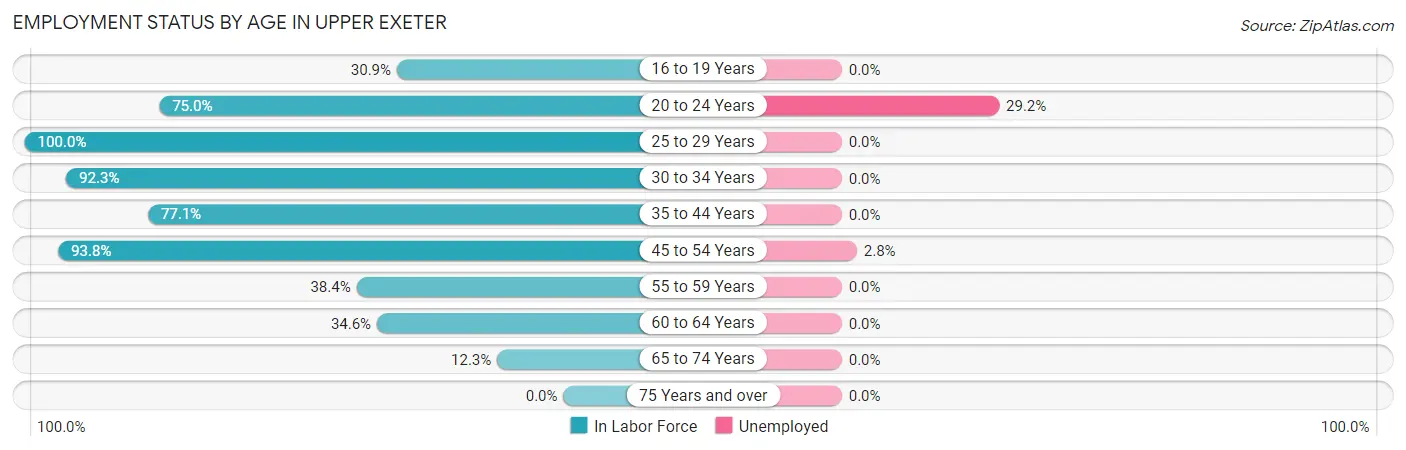
Employment Status by Age in Upper Exeter
According to the labor force statistics for Upper Exeter, out of the total population over 16 years of age (842), 63.3% or 533 individuals are in the labor force, with 1.9% or 10 of them unemployed. The age group with the highest labor force participation rate is 25 to 29 years, with 100.0% or 257 individuals in the labor force. Within the labor force, the 20 to 24 years age range has the highest percentage of unemployed individuals, with 29.2% or 7 of them being unemployed.
| Age Bracket | In Labor Force | Unemployed |
| 16 to 19 Years | 21 (30.9%) | 0 (0.0%) |
| 20 to 24 Years | 24 (75.0%) | 7 (29.2%) |
| 25 to 29 Years | 257 (100.0%) | 0 (0.0%) |
| 30 to 34 Years | 24 (92.3%) | 0 (0.0%) |
| 35 to 44 Years | 37 (77.1%) | 0 (0.0%) |
| 45 to 54 Years | 106 (93.8%) | 3 (2.8%) |
| 55 to 59 Years | 28 (38.4%) | 0 (0.0%) |
| 60 to 64 Years | 27 (34.6%) | 0 (0.0%) |
| 65 to 74 Years | 9 (12.3%) | 0 (0.0%) |
| 75 Years and over | 0 (0.0%) | 0 (0.0%) |
| Total | 533 (63.3%) | 10 (1.9%) |
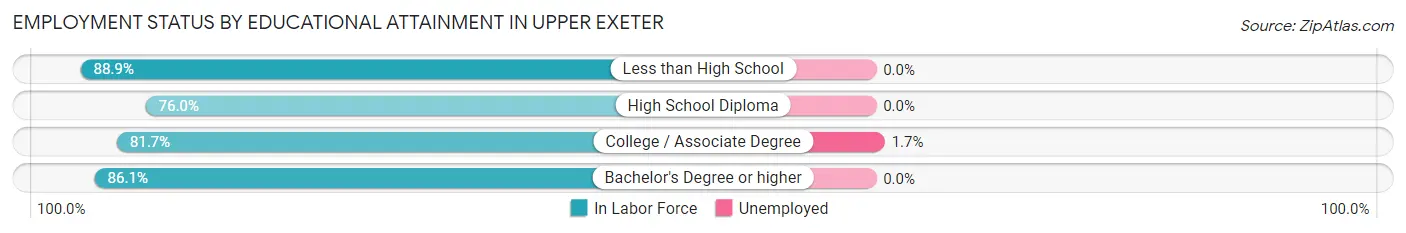
Employment Status by Educational Attainment in Upper Exeter
According to labor force statistics for Upper Exeter, 80.5% of individuals (479) out of the total population between 25 and 64 years of age (595) are in the labor force, with 0.6% or 3 of them being unemployed. The group with the highest labor force participation rate are those with the educational attainment of less than high school, with 88.9% or 16 individuals in the labor force. Within the labor force, individuals with college / associate degree education have the highest percentage of unemployment, with 1.7% or 3 of them being unemployed.
| Educational Attainment | In Labor Force | Unemployed |
| Less than High School | 16 (88.9%) | 0 (0.0%) |
| High School Diploma | 184 (76.0%) | 0 (0.0%) |
| College / Associate Degree | 174 (81.7%) | 4 (1.7%) |
| Bachelor's Degree or higher | 105 (86.1%) | 0 (0.0%) |
| Total | 479 (80.5%) | 4 (0.6%) |
Employment Occupations by Sex in Upper Exeter
Management, Business, Science and Arts Occupations
The most common Management, Business, Science and Arts occupations in Upper Exeter are Community & Social Service (42 | 8.0%), Management (41 | 7.8%), Health Diagnosing & Treating (35 | 6.7%), Health Technologists (35 | 6.7%), and Business & Financial (24 | 4.6%).
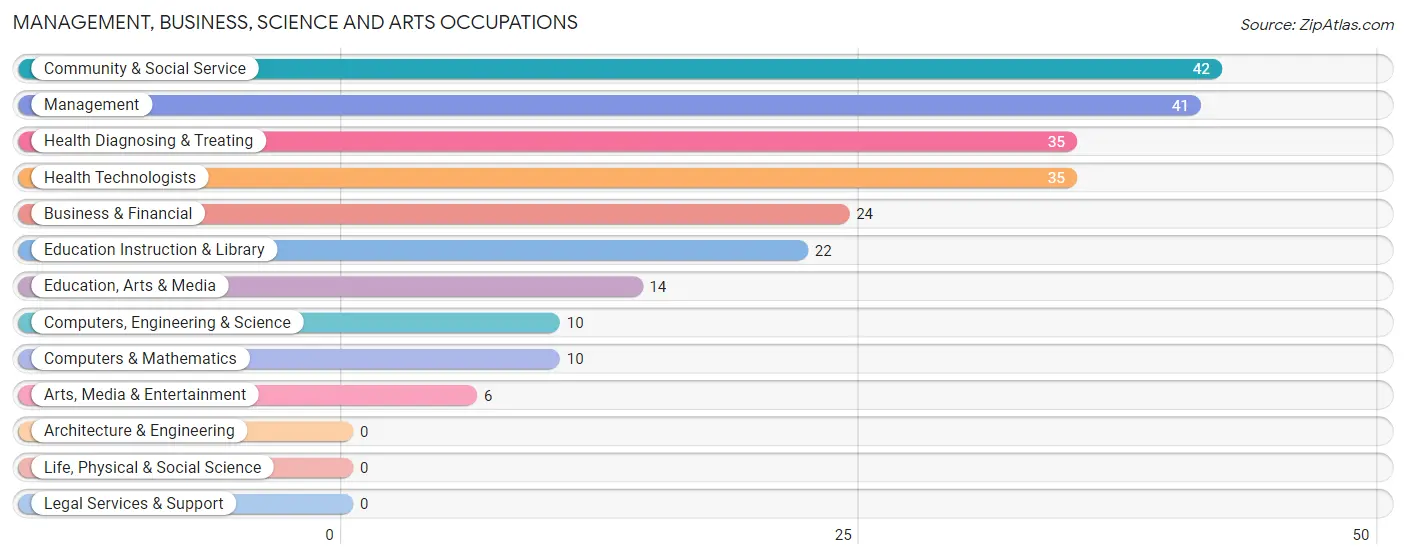
Management, Business, Science and Arts Occupations by Sex
Within the Management, Business, Science and Arts occupations in Upper Exeter, the most male-oriented occupations are Computers, Engineering & Science (100.0%), Computers & Mathematics (100.0%), and Arts, Media & Entertainment (100.0%), while the most female-oriented occupations are Education Instruction & Library (100.0%), Health Diagnosing & Treating (100.0%), and Health Technologists (100.0%).
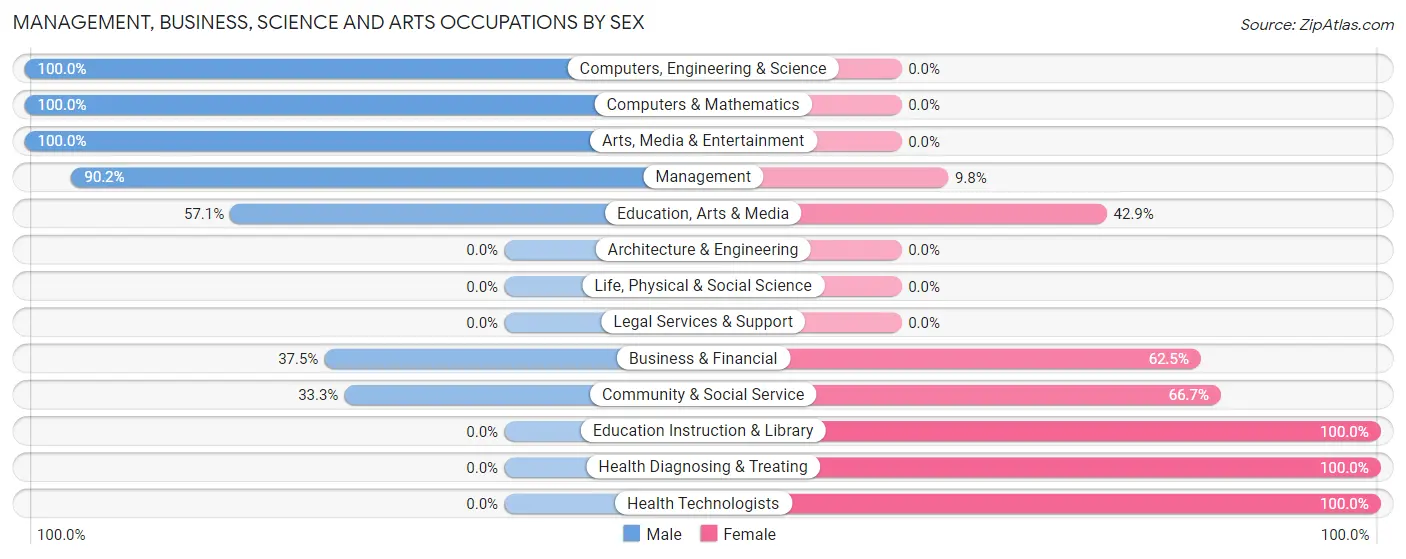
| Occupation | Male | Female |
| Management | 37 (90.2%) | 4 (9.8%) |
| Business & Financial | 9 (37.5%) | 15 (62.5%) |
| Computers, Engineering & Science | 10 (100.0%) | 0 (0.0%) |
| Computers & Mathematics | 10 (100.0%) | 0 (0.0%) |
| Architecture & Engineering | 0 (0.0%) | 0 (0.0%) |
| Life, Physical & Social Science | 0 (0.0%) | 0 (0.0%) |
| Community & Social Service | 14 (33.3%) | 28 (66.7%) |
| Education, Arts & Media | 8 (57.1%) | 6 (42.9%) |
| Legal Services & Support | 0 (0.0%) | 0 (0.0%) |
| Education Instruction & Library | 0 (0.0%) | 22 (100.0%) |
| Arts, Media & Entertainment | 6 (100.0%) | 0 (0.0%) |
| Health Diagnosing & Treating | 0 (0.0%) | 35 (100.0%) |
| Health Technologists | 0 (0.0%) | 35 (100.0%) |
| Total (Category) | 70 (46.1%) | 82 (53.9%) |
| Total (Overall) | 264 (50.5%) | 259 (49.5%) |
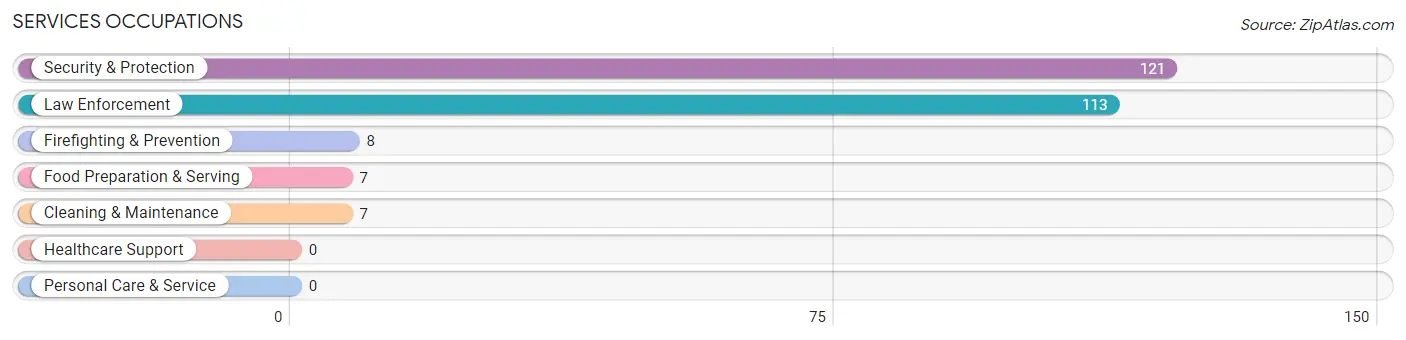
Services Occupations
The most common Services occupations in Upper Exeter are Security & Protection (121 | 23.1%), Law Enforcement (113 | 21.6%), Firefighting & Prevention (8 | 1.5%), Food Preparation & Serving (7 | 1.3%), and Cleaning & Maintenance (7 | 1.3%).
Services Occupations by Sex
Within the Services occupations in Upper Exeter, the most male-oriented occupations are Firefighting & Prevention (100.0%), Food Preparation & Serving (100.0%), and Security & Protection (94.2%), while the most female-oriented occupations are Cleaning & Maintenance (100.0%), Law Enforcement (6.2%), and Security & Protection (5.8%).
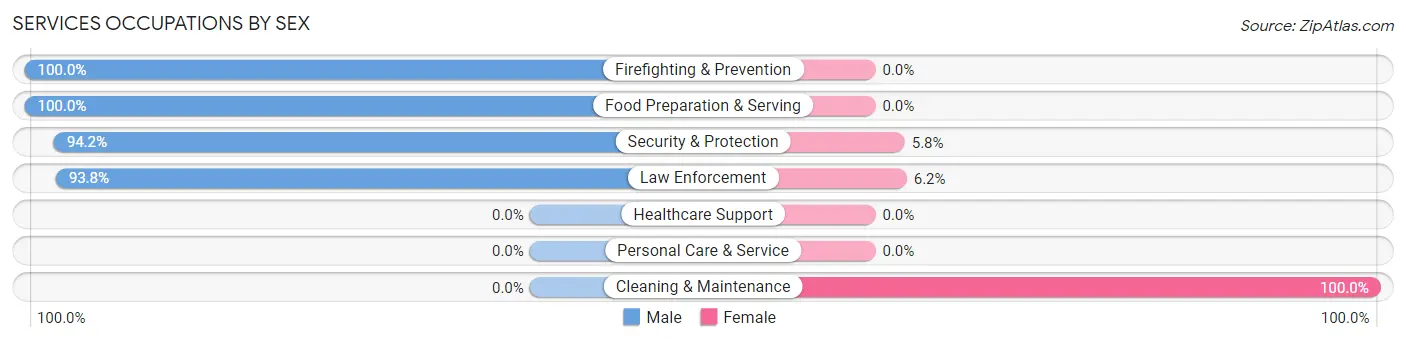
| Occupation | Male | Female |
| Healthcare Support | 0 (0.0%) | 0 (0.0%) |
| Security & Protection | 114 (94.2%) | 7 (5.8%) |
| Firefighting & Prevention | 8 (100.0%) | 0 (0.0%) |
| Law Enforcement | 106 (93.8%) | 7 (6.2%) |
| Food Preparation & Serving | 7 (100.0%) | 0 (0.0%) |
| Cleaning & Maintenance | 0 (0.0%) | 7 (100.0%) |
| Personal Care & Service | 0 (0.0%) | 0 (0.0%) |
| Total (Category) | 121 (89.6%) | 14 (10.4%) |
| Total (Overall) | 264 (50.5%) | 259 (49.5%) |
Sales and Office Occupations
The most common Sales and Office occupations in Upper Exeter are Sales & Related (157 | 30.0%), and Office & Administration (37 | 7.1%).

Sales and Office Occupations by Sex
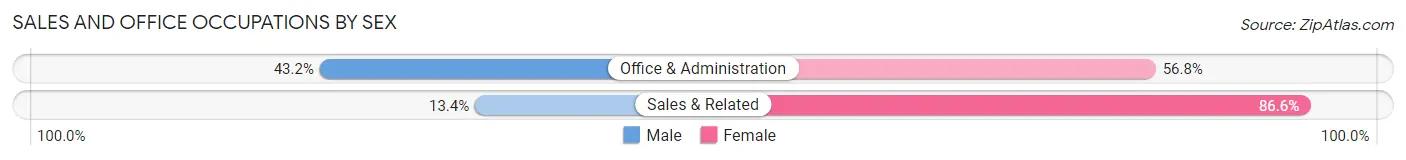
| Occupation | Male | Female |
| Sales & Related | 21 (13.4%) | 136 (86.6%) |
| Office & Administration | 16 (43.2%) | 21 (56.8%) |
| Total (Category) | 37 (19.1%) | 157 (80.9%) |
| Total (Overall) | 264 (50.5%) | 259 (49.5%) |
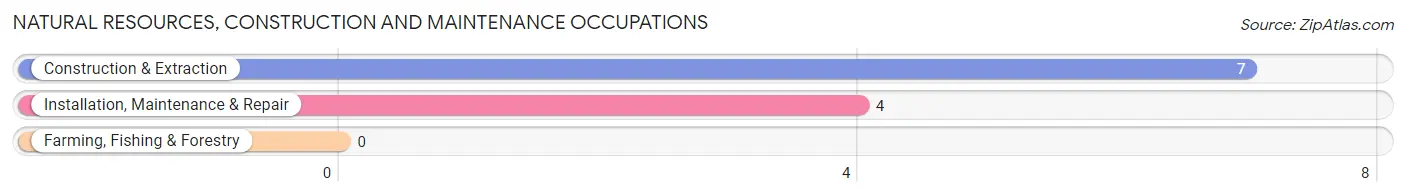
Natural Resources, Construction and Maintenance Occupations
The most common Natural Resources, Construction and Maintenance occupations in Upper Exeter are Construction & Extraction (7 | 1.3%), and Installation, Maintenance & Repair (4 | 0.8%).
Natural Resources, Construction and Maintenance Occupations by Sex
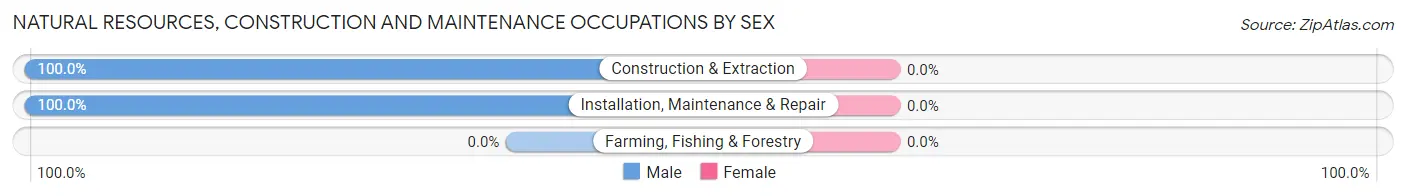
| Occupation | Male | Female |
| Farming, Fishing & Forestry | 0 (0.0%) | 0 (0.0%) |
| Construction & Extraction | 7 (100.0%) | 0 (0.0%) |
| Installation, Maintenance & Repair | 4 (100.0%) | 0 (0.0%) |
| Total (Category) | 11 (100.0%) | 0 (0.0%) |
| Total (Overall) | 264 (50.5%) | 259 (49.5%) |
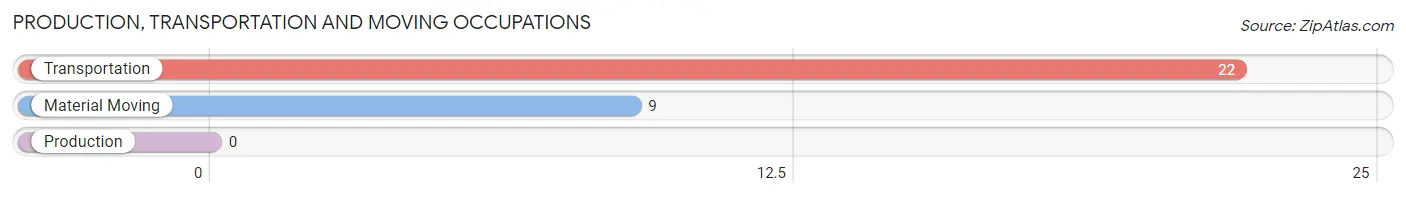
Production, Transportation and Moving Occupations
The most common Production, Transportation and Moving occupations in Upper Exeter are Transportation (22 | 4.2%), and Material Moving (9 | 1.7%).
Production, Transportation and Moving Occupations by Sex
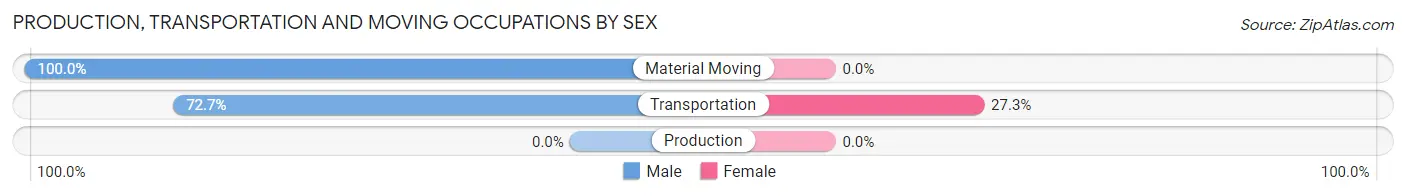
| Occupation | Male | Female |
| Production | 0 (0.0%) | 0 (0.0%) |
| Transportation | 16 (72.7%) | 6 (27.3%) |
| Material Moving | 9 (100.0%) | 0 (0.0%) |
| Total (Category) | 25 (80.6%) | 6 (19.4%) |
| Total (Overall) | 264 (50.5%) | 259 (49.5%) |
Employment Industries by Sex in Upper Exeter
Employment Industries in Upper Exeter
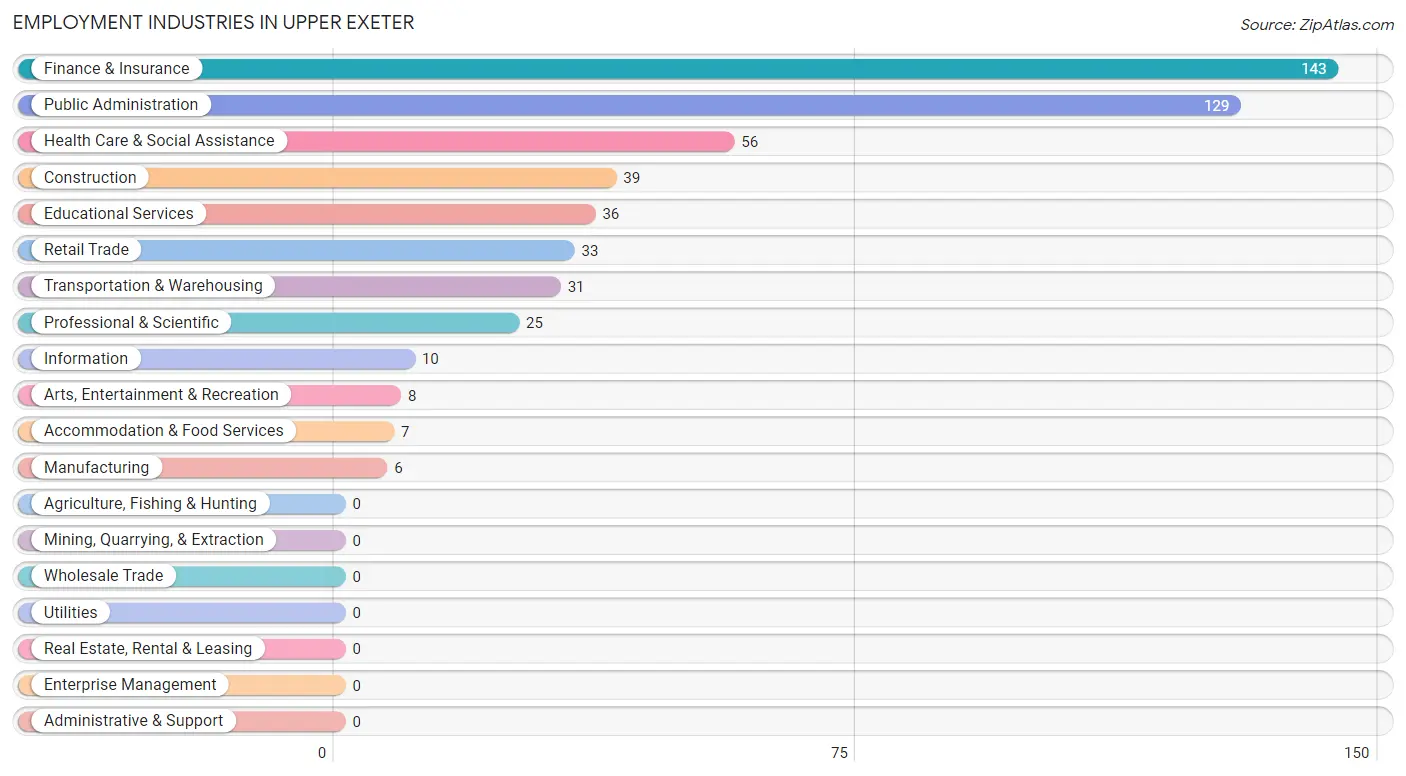
The major employment industries in Upper Exeter include Finance & Insurance (143 | 27.3%), Public Administration (129 | 24.7%), Health Care & Social Assistance (56 | 10.7%), Construction (39 | 7.5%), and Educational Services (36 | 6.9%).
Employment Industries by Sex in Upper Exeter
The Upper Exeter industries that see more men than women are Manufacturing (100.0%), Information (100.0%), and Professional & Scientific (100.0%), whereas the industries that tend to have a higher number of women are Finance & Insurance (100.0%), Health Care & Social Assistance (85.7%), and Educational Services (72.2%).
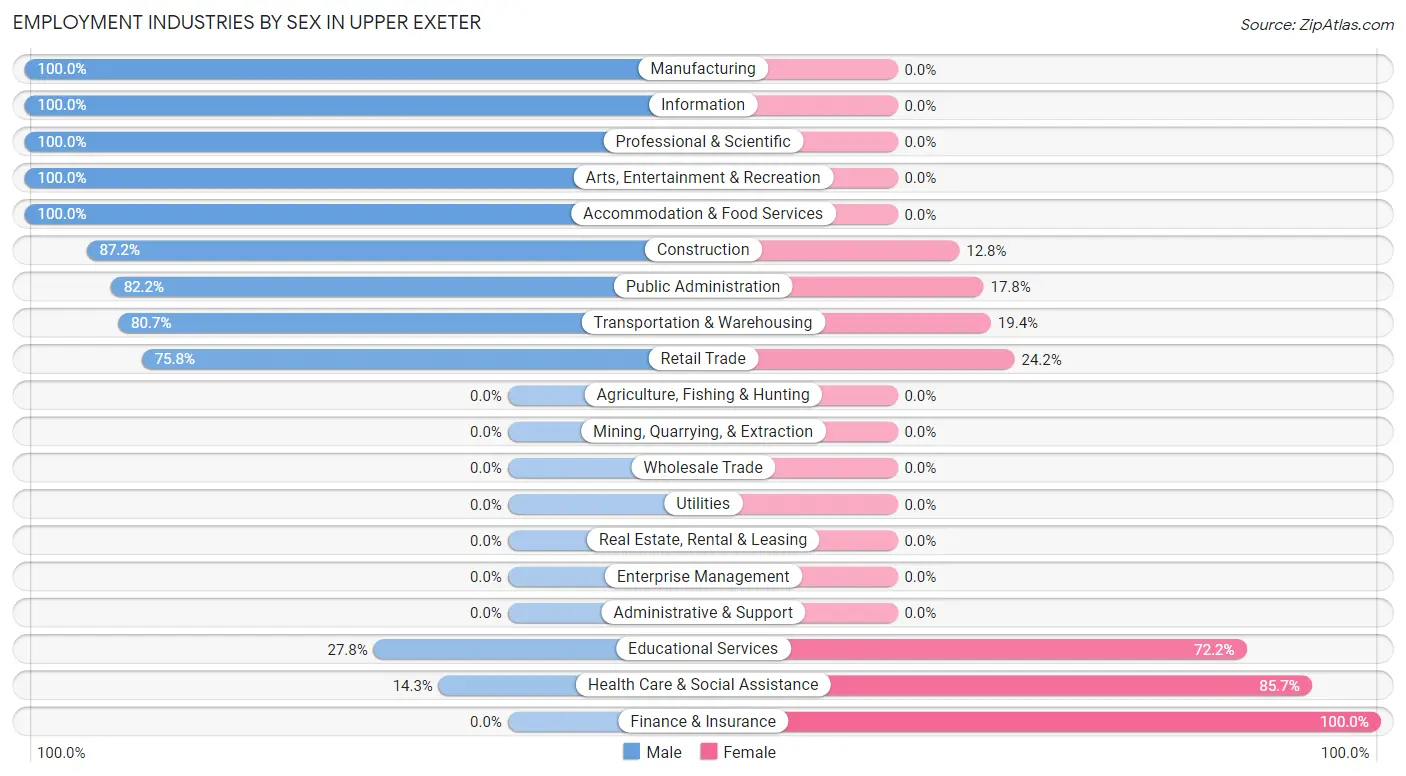
| Industry | Male | Female |
| Agriculture, Fishing & Hunting | 0 (0.0%) | 0 (0.0%) |
| Mining, Quarrying, & Extraction | 0 (0.0%) | 0 (0.0%) |
| Construction | 34 (87.2%) | 5 (12.8%) |
| Manufacturing | 6 (100.0%) | 0 (0.0%) |
| Wholesale Trade | 0 (0.0%) | 0 (0.0%) |
| Retail Trade | 25 (75.8%) | 8 (24.2%) |
| Transportation & Warehousing | 25 (80.6%) | 6 (19.4%) |
| Utilities | 0 (0.0%) | 0 (0.0%) |
| Information | 10 (100.0%) | 0 (0.0%) |
| Finance & Insurance | 0 (0.0%) | 143 (100.0%) |
| Real Estate, Rental & Leasing | 0 (0.0%) | 0 (0.0%) |
| Professional & Scientific | 25 (100.0%) | 0 (0.0%) |
| Enterprise Management | 0 (0.0%) | 0 (0.0%) |
| Administrative & Support | 0 (0.0%) | 0 (0.0%) |
| Educational Services | 10 (27.8%) | 26 (72.2%) |
| Health Care & Social Assistance | 8 (14.3%) | 48 (85.7%) |
| Arts, Entertainment & Recreation | 8 (100.0%) | 0 (0.0%) |
| Accommodation & Food Services | 7 (100.0%) | 0 (0.0%) |
| Public Administration | 106 (82.2%) | 23 (17.8%) |
| Total | 264 (50.5%) | 259 (49.5%) |
Education in Upper Exeter
School Enrollment in Upper Exeter
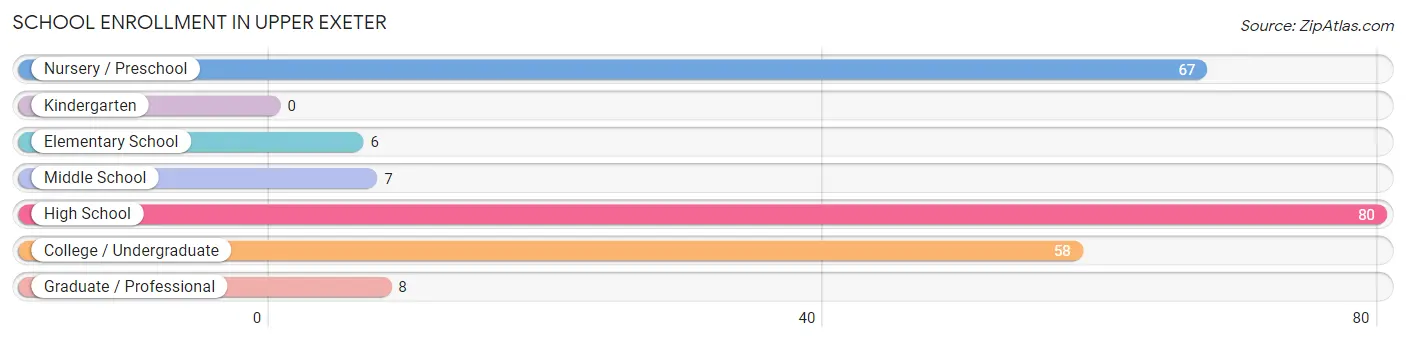
The most common levels of schooling among the 226 students in Upper Exeter are high school (80 | 35.4%), nursery / preschool (67 | 29.6%), and college / undergraduate (58 | 25.7%).
| School Level | # Students | % Students |
| Nursery / Preschool | 67 | 29.6% |
| Kindergarten | 0 | 0.0% |
| Elementary School | 6 | 2.6% |
| Middle School | 7 | 3.1% |
| High School | 80 | 35.4% |
| College / Undergraduate | 58 | 25.7% |
| Graduate / Professional | 8 | 3.5% |
| Total | 226 | 100.0% |
School Enrollment by Age by Funding Source in Upper Exeter
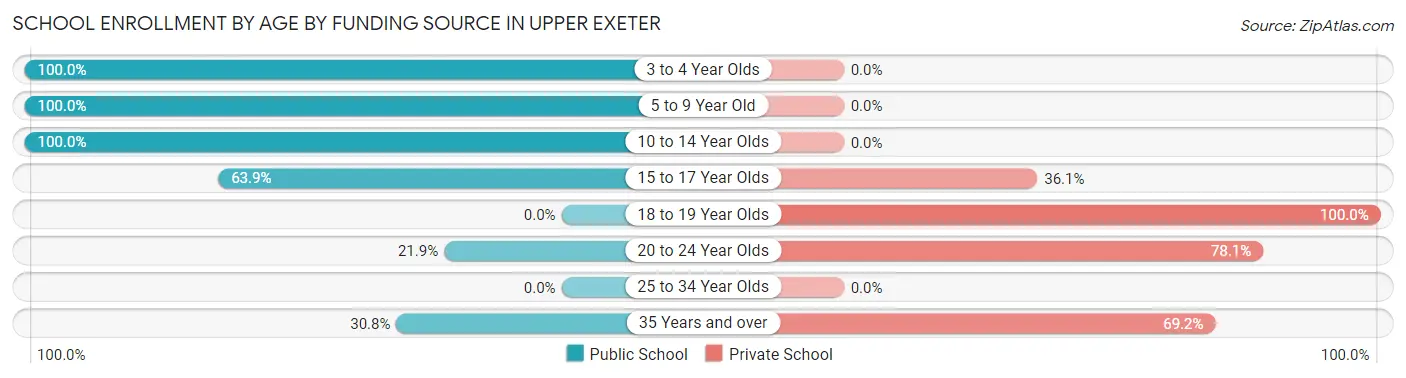
Out of a total of 226 students who are enrolled in schools in Upper Exeter, 77 (34.1%) attend a private institution, while the remaining 149 (65.9%) are enrolled in public schools. The age group of 18 to 19 year olds has the highest likelihood of being enrolled in private schools, with 21 (100.0% in the age bracket) enrolled. Conversely, the age group of 3 to 4 year olds has the lowest likelihood of being enrolled in a private school, with 67 (100.0% in the age bracket) attending a public institution.
| Age Bracket | Public School | Private School |
| 3 to 4 Year Olds | 67 (100.0%) | 0 (0.0%) |
| 5 to 9 Year Old | 6 (100.0%) | 0 (0.0%) |
| 10 to 14 Year Olds | 26 (100.0%) | 0 (0.0%) |
| 15 to 17 Year Olds | 39 (63.9%) | 22 (36.1%) |
| 18 to 19 Year Olds | 0 (0.0%) | 21 (100.0%) |
| 20 to 24 Year Olds | 7 (21.9%) | 25 (78.1%) |
| 25 to 34 Year Olds | 0 (0.0%) | 0 (0.0%) |
| 35 Years and over | 4 (30.8%) | 9 (69.2%) |
| Total | 149 (65.9%) | 77 (34.1%) |
Educational Attainment by Field of Study in Upper Exeter
Science & technology (56 | 28.6%), business (33 | 16.8%), education (25 | 12.8%), liberal arts & history (13 | 6.6%), and engineering (12 | 6.1%) are the most common fields of study among 196 individuals in Upper Exeter who have obtained a bachelor's degree or higher.
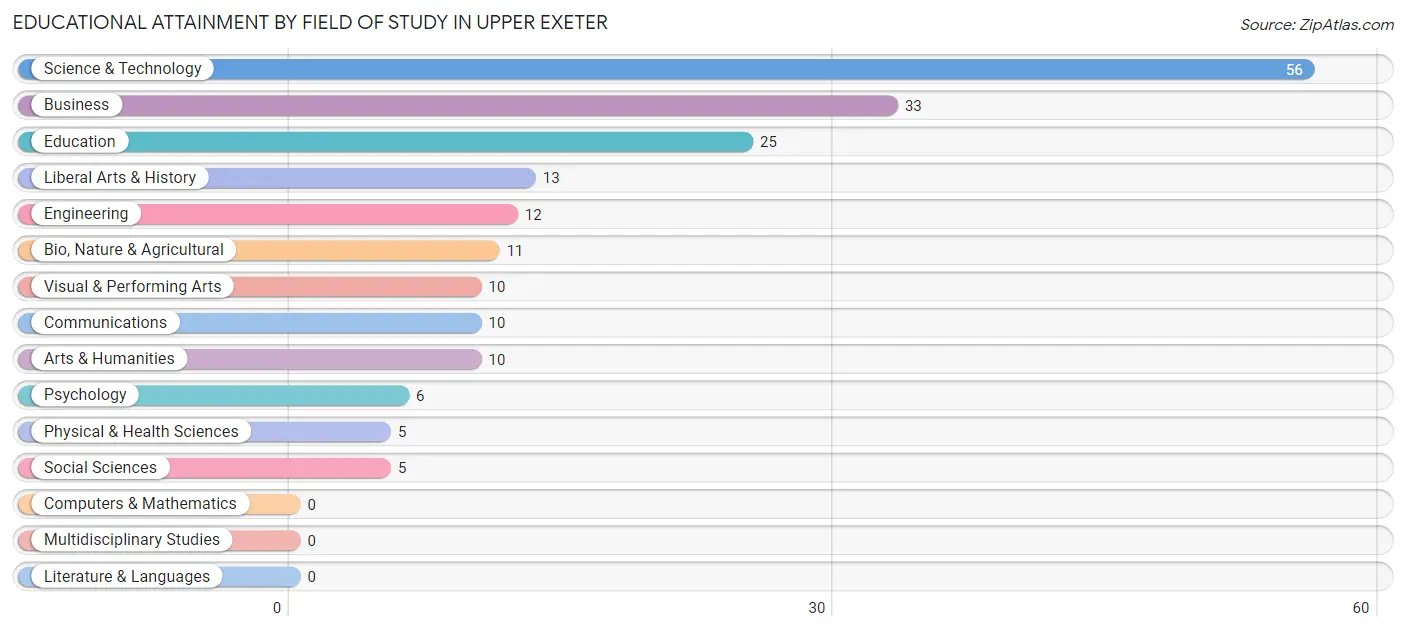
| Field of Study | # Graduates | % Graduates |
| Computers & Mathematics | 0 | 0.0% |
| Bio, Nature & Agricultural | 11 | 5.6% |
| Physical & Health Sciences | 5 | 2.5% |
| Psychology | 6 | 3.1% |
| Social Sciences | 5 | 2.5% |
| Engineering | 12 | 6.1% |
| Multidisciplinary Studies | 0 | 0.0% |
| Science & Technology | 56 | 28.6% |
| Business | 33 | 16.8% |
| Education | 25 | 12.8% |
| Literature & Languages | 0 | 0.0% |
| Liberal Arts & History | 13 | 6.6% |
| Visual & Performing Arts | 10 | 5.1% |
| Communications | 10 | 5.1% |
| Arts & Humanities | 10 | 5.1% |
| Total | 196 | 100.0% |
Transportation & Commute in Upper Exeter
Vehicle Availability by Sex in Upper Exeter
The most prevalent vehicle ownership categories in Upper Exeter are males with 2 vehicles (153, accounting for 59.5%) and females with 2 vehicles (174, making up 59.1%).
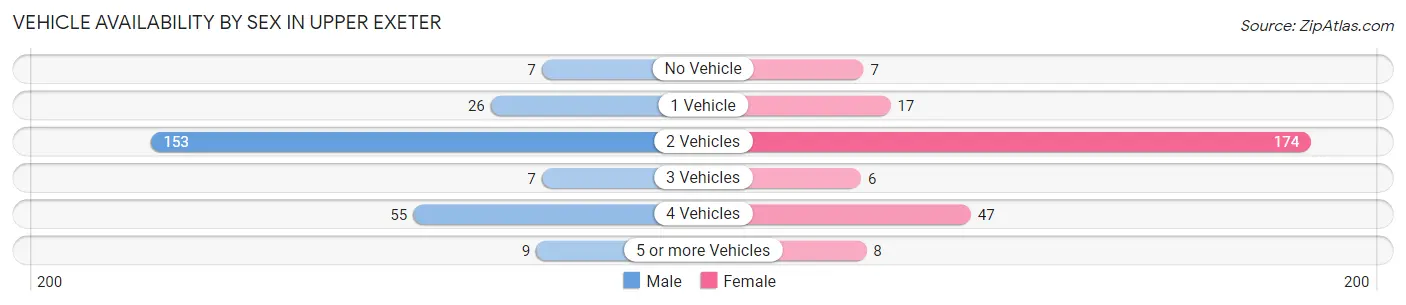
| Vehicles Available | Male | Female |
| No Vehicle | 7 (2.7%) | 7 (2.7%) |
| 1 Vehicle | 26 (10.1%) | 17 (6.6%) |
| 2 Vehicles | 153 (59.5%) | 174 (67.2%) |
| 3 Vehicles | 7 (2.7%) | 6 (2.3%) |
| 4 Vehicles | 55 (21.4%) | 47 (18.1%) |
| 5 or more Vehicles | 9 (3.5%) | 8 (3.1%) |
| Total | 257 (100.0%) | 259 (100.0%) |
Commute Time in Upper Exeter
The most frequently occuring commute durations in Upper Exeter are 20 to 24 minutes (145 commuters, 32.0%), 25 to 29 minutes (113 commuters, 24.9%), and 30 to 34 minutes (85 commuters, 18.8%).
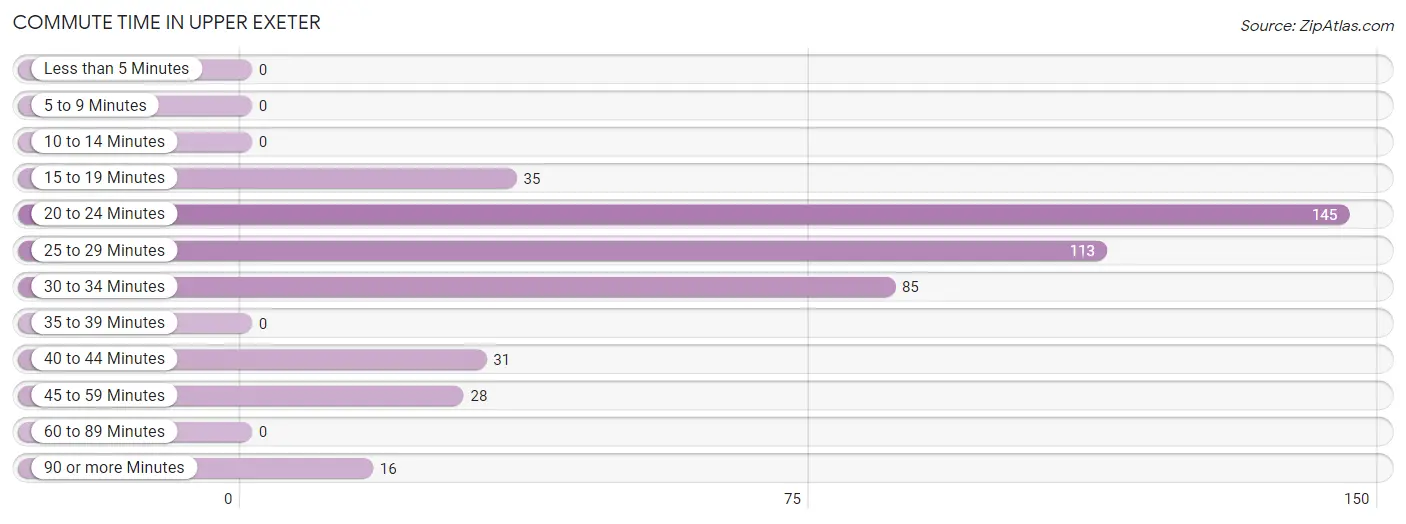
| Commute Time | # Commuters | % Commuters |
| Less than 5 Minutes | 0 | 0.0% |
| 5 to 9 Minutes | 0 | 0.0% |
| 10 to 14 Minutes | 0 | 0.0% |
| 15 to 19 Minutes | 35 | 7.7% |
| 20 to 24 Minutes | 145 | 32.0% |
| 25 to 29 Minutes | 113 | 24.9% |
| 30 to 34 Minutes | 85 | 18.8% |
| 35 to 39 Minutes | 0 | 0.0% |
| 40 to 44 Minutes | 31 | 6.8% |
| 45 to 59 Minutes | 28 | 6.2% |
| 60 to 89 Minutes | 0 | 0.0% |
| 90 or more Minutes | 16 | 3.5% |
Commute Time by Sex in Upper Exeter
The most common commute times in Upper Exeter are 25 to 29 minutes (113 commuters, 51.8%) for males and 20 to 24 minutes (136 commuters, 57.9%) for females.
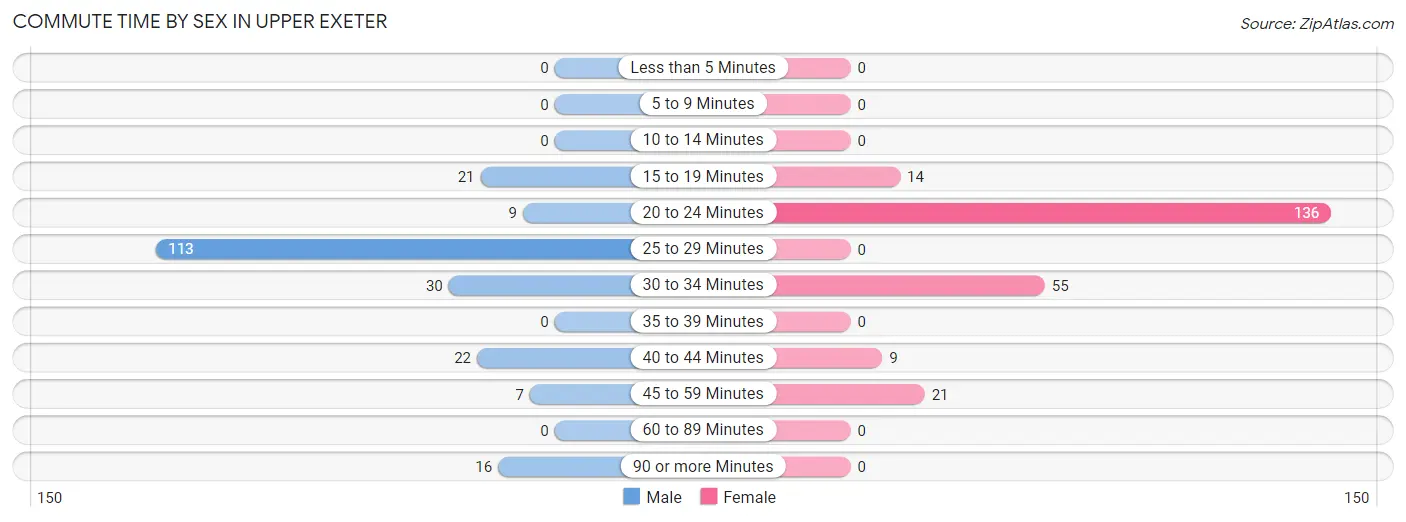
| Commute Time | Male | Female |
| Less than 5 Minutes | 0 (0.0%) | 0 (0.0%) |
| 5 to 9 Minutes | 0 (0.0%) | 0 (0.0%) |
| 10 to 14 Minutes | 0 (0.0%) | 0 (0.0%) |
| 15 to 19 Minutes | 21 (9.6%) | 14 (6.0%) |
| 20 to 24 Minutes | 9 (4.1%) | 136 (57.9%) |
| 25 to 29 Minutes | 113 (51.8%) | 0 (0.0%) |
| 30 to 34 Minutes | 30 (13.8%) | 55 (23.4%) |
| 35 to 39 Minutes | 0 (0.0%) | 0 (0.0%) |
| 40 to 44 Minutes | 22 (10.1%) | 9 (3.8%) |
| 45 to 59 Minutes | 7 (3.2%) | 21 (8.9%) |
| 60 to 89 Minutes | 0 (0.0%) | 0 (0.0%) |
| 90 or more Minutes | 16 (7.3%) | 0 (0.0%) |
Time of Departure to Work by Sex in Upper Exeter
The most frequent times of departure to work in Upper Exeter are 12:00 PM to 3:59 PM (106, 48.6%) for males and 11:00 AM to 11:59 AM (128, 54.5%) for females.
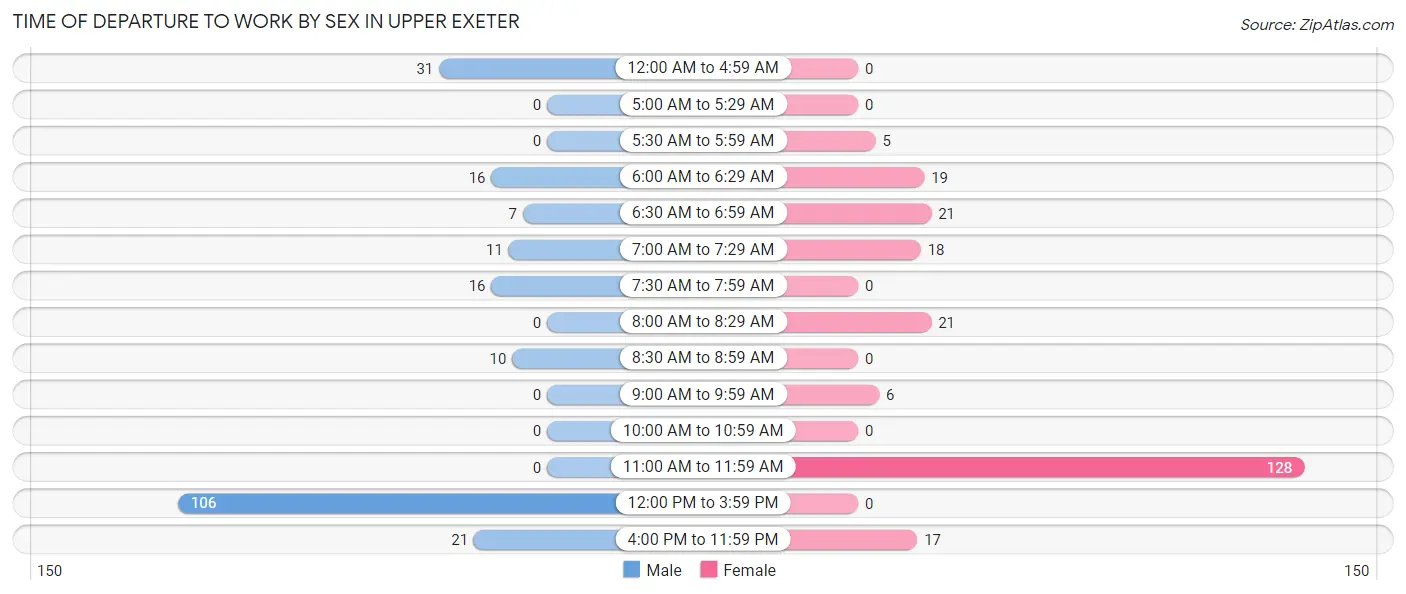
| Time of Departure | Male | Female |
| 12:00 AM to 4:59 AM | 31 (14.2%) | 0 (0.0%) |
| 5:00 AM to 5:29 AM | 0 (0.0%) | 0 (0.0%) |
| 5:30 AM to 5:59 AM | 0 (0.0%) | 5 (2.1%) |
| 6:00 AM to 6:29 AM | 16 (7.3%) | 19 (8.1%) |
| 6:30 AM to 6:59 AM | 7 (3.2%) | 21 (8.9%) |
| 7:00 AM to 7:29 AM | 11 (5.1%) | 18 (7.7%) |
| 7:30 AM to 7:59 AM | 16 (7.3%) | 0 (0.0%) |
| 8:00 AM to 8:29 AM | 0 (0.0%) | 21 (8.9%) |
| 8:30 AM to 8:59 AM | 10 (4.6%) | 0 (0.0%) |
| 9:00 AM to 9:59 AM | 0 (0.0%) | 6 (2.5%) |
| 10:00 AM to 10:59 AM | 0 (0.0%) | 0 (0.0%) |
| 11:00 AM to 11:59 AM | 0 (0.0%) | 128 (54.5%) |
| 12:00 PM to 3:59 PM | 106 (48.6%) | 0 (0.0%) |
| 4:00 PM to 11:59 PM | 21 (9.6%) | 17 (7.2%) |
| Total | 218 (100.0%) | 235 (100.0%) |
Housing Occupancy in Upper Exeter
Occupancy by Ownership in Upper Exeter
Of the total 379 dwellings in Upper Exeter, owner-occupied units account for 331 (87.3%), while renter-occupied units make up 48 (12.7%).
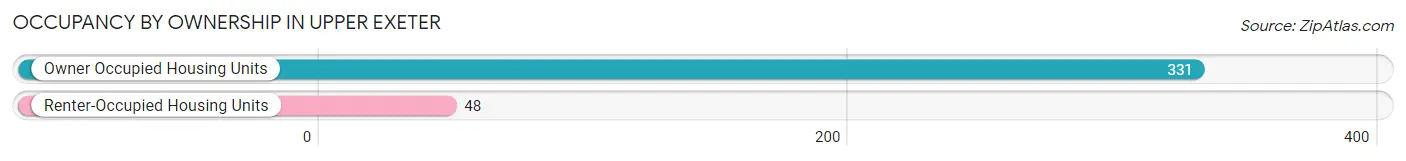
| Occupancy | # Housing Units | % Housing Units |
| Owner Occupied Housing Units | 331 | 87.3% |
| Renter-Occupied Housing Units | 48 | 12.7% |
| Total Occupied Housing Units | 379 | 100.0% |
Occupancy by Household Size in Upper Exeter
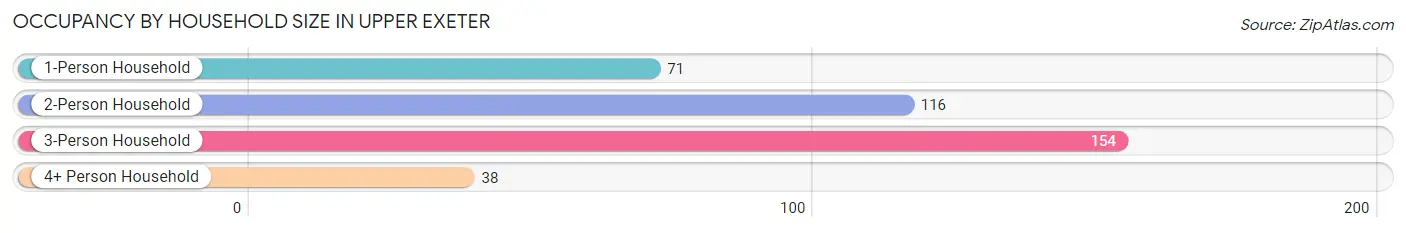
| Household Size | # Housing Units | % Housing Units |
| 1-Person Household | 71 | 18.7% |
| 2-Person Household | 116 | 30.6% |
| 3-Person Household | 154 | 40.6% |
| 4+ Person Household | 38 | 10.0% |
| Total Housing Units | 379 | 100.0% |
Occupancy by Ownership by Household Size in Upper Exeter
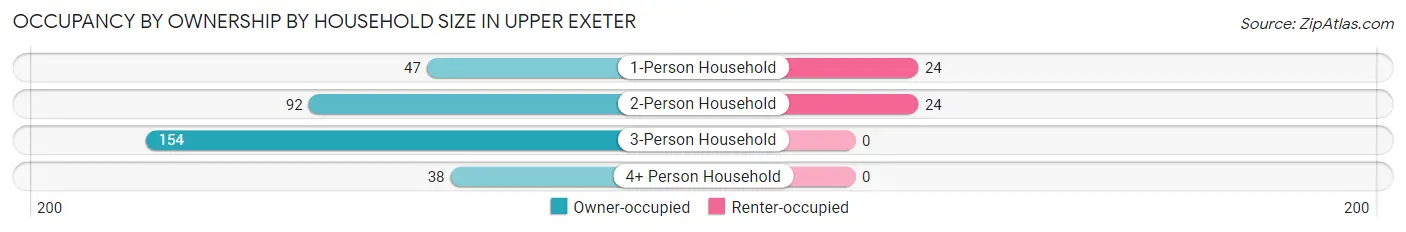
| Household Size | Owner-occupied | Renter-occupied |
| 1-Person Household | 47 (66.2%) | 24 (33.8%) |
| 2-Person Household | 92 (79.3%) | 24 (20.7%) |
| 3-Person Household | 154 (100.0%) | 0 (0.0%) |
| 4+ Person Household | 38 (100.0%) | 0 (0.0%) |
| Total Housing Units | 331 (87.3%) | 48 (12.7%) |
Occupancy by Educational Attainment in Upper Exeter
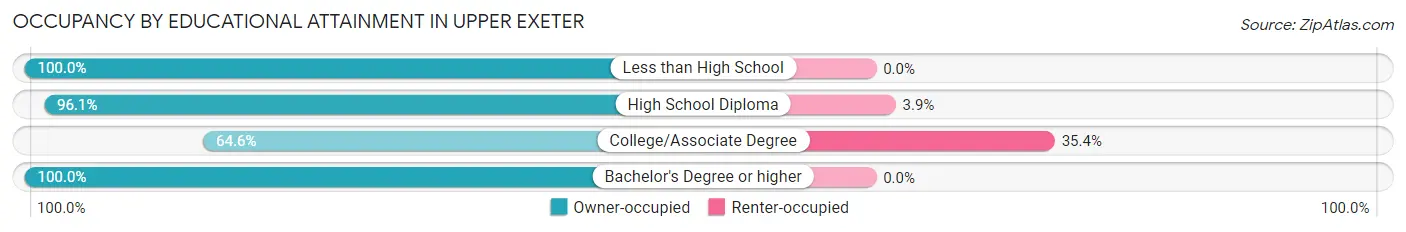
| Household Size | Owner-occupied | Renter-occupied |
| Less than High School | 2 (100.0%) | 0 (0.0%) |
| High School Diploma | 199 (96.1%) | 8 (3.9%) |
| College/Associate Degree | 73 (64.6%) | 40 (35.4%) |
| Bachelor's Degree or higher | 57 (100.0%) | 0 (0.0%) |
Occupancy by Age of Householder in Upper Exeter
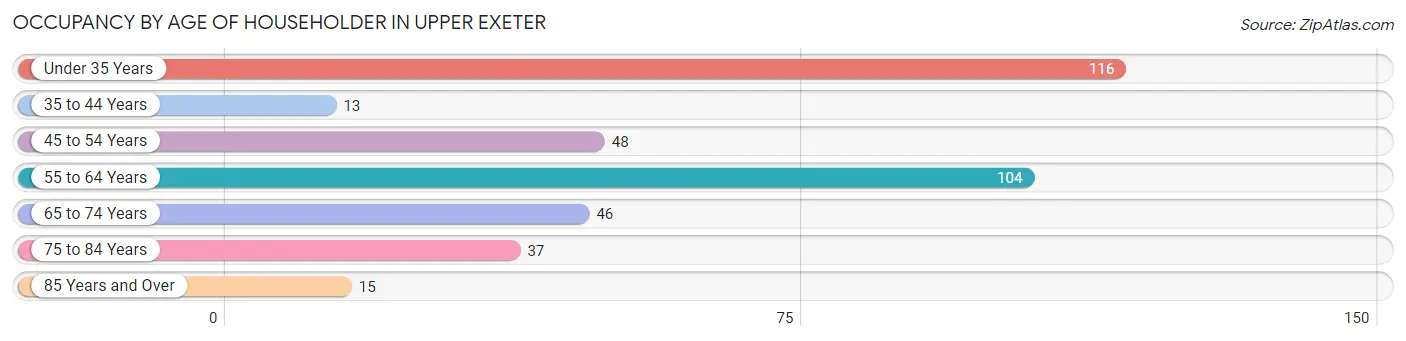
| Age Bracket | # Households | % Households |
| Under 35 Years | 116 | 30.6% |
| 35 to 44 Years | 13 | 3.4% |
| 45 to 54 Years | 48 | 12.7% |
| 55 to 64 Years | 104 | 27.4% |
| 65 to 74 Years | 46 | 12.1% |
| 75 to 84 Years | 37 | 9.8% |
| 85 Years and Over | 15 | 4.0% |
| Total | 379 | 100.0% |
Housing Finances in Upper Exeter
Median Income by Occupancy in Upper Exeter
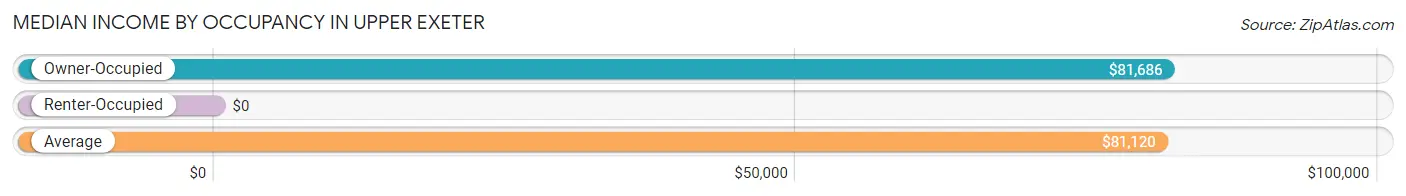
| Occupancy Type | # Households | Median Income |
| Owner-Occupied | 331 (87.3%) | $81,686 |
| Renter-Occupied | 48 (12.7%) | $0 |
| Average | 379 (100.0%) | $81,120 |
Occupancy by Householder Income Bracket in Upper Exeter
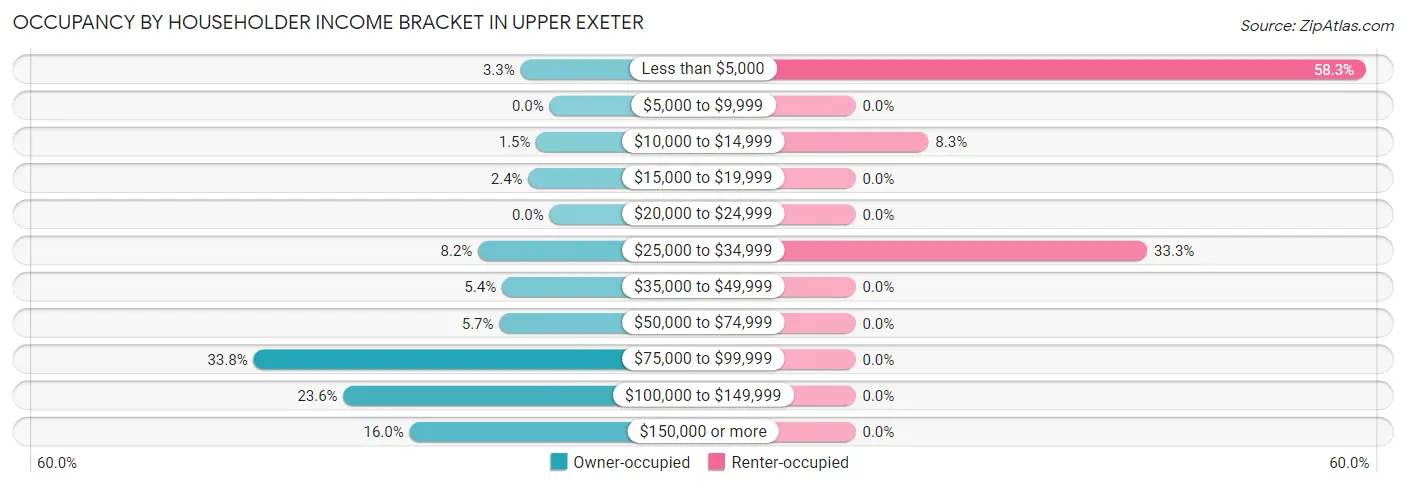
| Income Bracket | Owner-occupied | Renter-occupied |
| Less than $5,000 | 11 (3.3%) | 28 (58.3%) |
| $5,000 to $9,999 | 0 (0.0%) | 0 (0.0%) |
| $10,000 to $14,999 | 5 (1.5%) | 4 (8.3%) |
| $15,000 to $19,999 | 8 (2.4%) | 0 (0.0%) |
| $20,000 to $24,999 | 0 (0.0%) | 0 (0.0%) |
| $25,000 to $34,999 | 27 (8.2%) | 16 (33.3%) |
| $35,000 to $49,999 | 18 (5.4%) | 0 (0.0%) |
| $50,000 to $74,999 | 19 (5.7%) | 0 (0.0%) |
| $75,000 to $99,999 | 112 (33.8%) | 0 (0.0%) |
| $100,000 to $149,999 | 78 (23.6%) | 0 (0.0%) |
| $150,000 or more | 53 (16.0%) | 0 (0.0%) |
| Total | 331 (100.0%) | 48 (100.0%) |
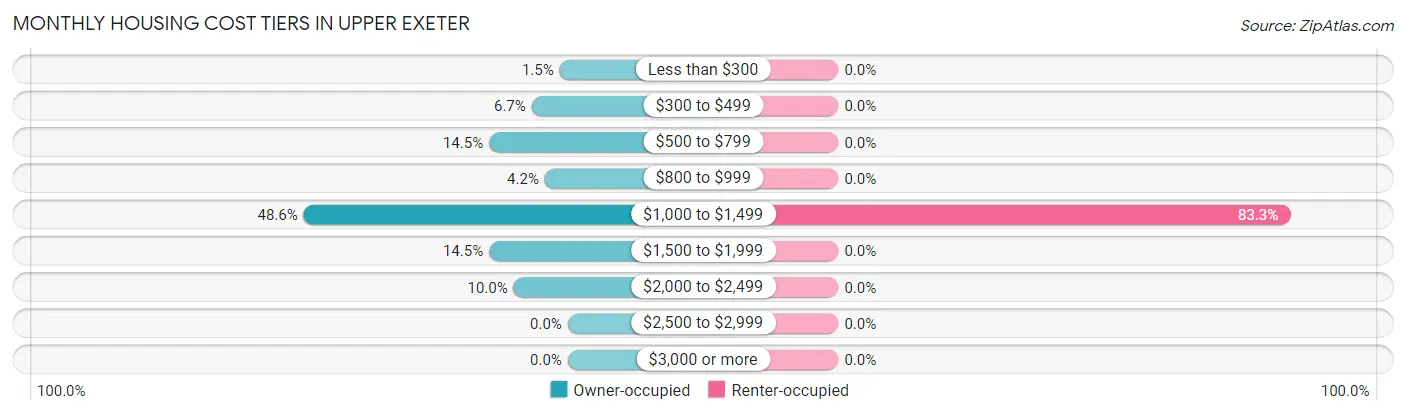
Monthly Housing Cost Tiers in Upper Exeter
| Monthly Cost | Owner-occupied | Renter-occupied |
| Less than $300 | 5 (1.5%) | 0 (0.0%) |
| $300 to $499 | 22 (6.7%) | 0 (0.0%) |
| $500 to $799 | 48 (14.5%) | 0 (0.0%) |
| $800 to $999 | 14 (4.2%) | 0 (0.0%) |
| $1,000 to $1,499 | 161 (48.6%) | 40 (83.3%) |
| $1,500 to $1,999 | 48 (14.5%) | 0 (0.0%) |
| $2,000 to $2,499 | 33 (10.0%) | 0 (0.0%) |
| $2,500 to $2,999 | 0 (0.0%) | 0 (0.0%) |
| $3,000 or more | 0 (0.0%) | 0 (0.0%) |
| Total | 331 (100.0%) | 48 (100.0%) |
Physical Housing Characteristics in Upper Exeter
Housing Structures in Upper Exeter
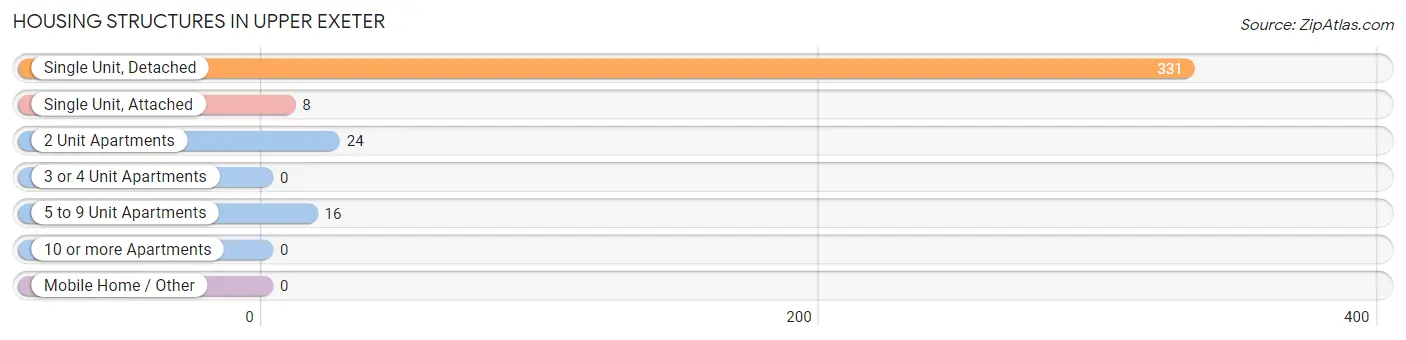
| Structure Type | # Housing Units | % Housing Units |
| Single Unit, Detached | 331 | 87.3% |
| Single Unit, Attached | 8 | 2.1% |
| 2 Unit Apartments | 24 | 6.3% |
| 3 or 4 Unit Apartments | 0 | 0.0% |
| 5 to 9 Unit Apartments | 16 | 4.2% |
| 10 or more Apartments | 0 | 0.0% |
| Mobile Home / Other | 0 | 0.0% |
| Total | 379 | 100.0% |
Housing Structures by Occupancy in Upper Exeter
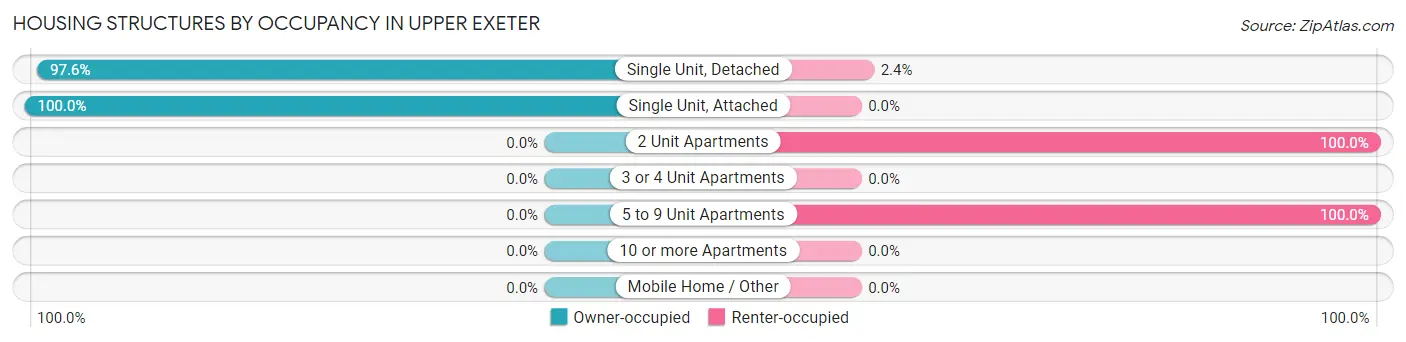
| Structure Type | Owner-occupied | Renter-occupied |
| Single Unit, Detached | 323 (97.6%) | 8 (2.4%) |
| Single Unit, Attached | 8 (100.0%) | 0 (0.0%) |
| 2 Unit Apartments | 0 (0.0%) | 24 (100.0%) |
| 3 or 4 Unit Apartments | 0 (0.0%) | 0 (0.0%) |
| 5 to 9 Unit Apartments | 0 (0.0%) | 16 (100.0%) |
| 10 or more Apartments | 0 (0.0%) | 0 (0.0%) |
| Mobile Home / Other | 0 (0.0%) | 0 (0.0%) |
| Total | 331 (87.3%) | 48 (12.7%) |
Housing Structures by Number of Rooms in Upper Exeter
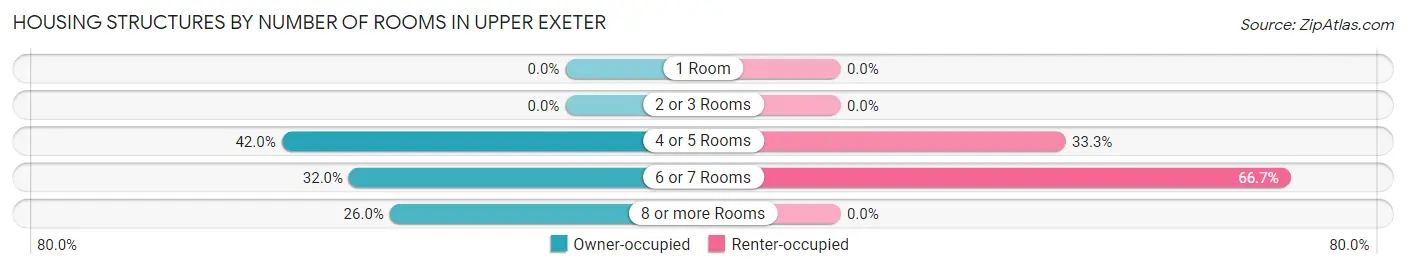
| Number of Rooms | Owner-occupied | Renter-occupied |
| 1 Room | 0 (0.0%) | 0 (0.0%) |
| 2 or 3 Rooms | 0 (0.0%) | 0 (0.0%) |
| 4 or 5 Rooms | 139 (42.0%) | 16 (33.3%) |
| 6 or 7 Rooms | 106 (32.0%) | 32 (66.7%) |
| 8 or more Rooms | 86 (26.0%) | 0 (0.0%) |
| Total | 331 (100.0%) | 48 (100.0%) |
Housing Structure by Heating Type in Upper Exeter
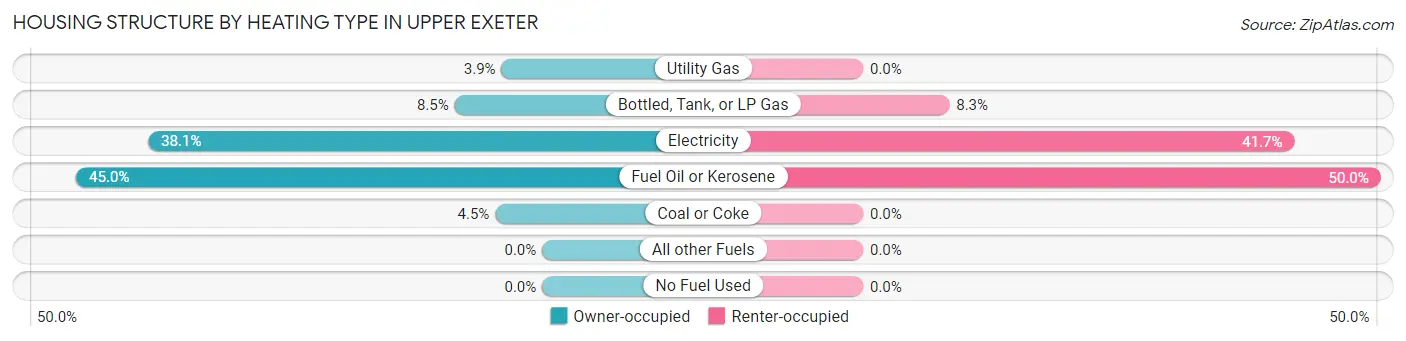
| Heating Type | Owner-occupied | Renter-occupied |
| Utility Gas | 13 (3.9%) | 0 (0.0%) |
| Bottled, Tank, or LP Gas | 28 (8.5%) | 4 (8.3%) |
| Electricity | 126 (38.1%) | 20 (41.7%) |
| Fuel Oil or Kerosene | 149 (45.0%) | 24 (50.0%) |
| Coal or Coke | 15 (4.5%) | 0 (0.0%) |
| All other Fuels | 0 (0.0%) | 0 (0.0%) |
| No Fuel Used | 0 (0.0%) | 0 (0.0%) |
| Total | 331 (100.0%) | 48 (100.0%) |
Household Vehicle Usage in Upper Exeter
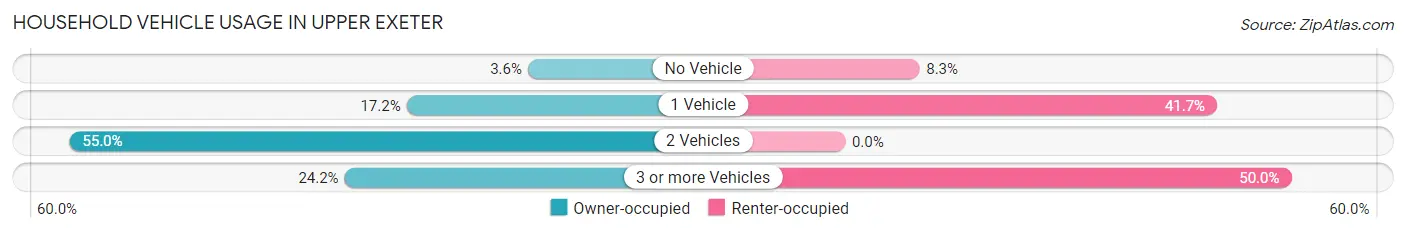
| Vehicles per Household | Owner-occupied | Renter-occupied |
| No Vehicle | 12 (3.6%) | 4 (8.3%) |
| 1 Vehicle | 57 (17.2%) | 20 (41.7%) |
| 2 Vehicles | 182 (55.0%) | 0 (0.0%) |
| 3 or more Vehicles | 80 (24.2%) | 24 (50.0%) |
| Total | 331 (100.0%) | 48 (100.0%) |
Real Estate & Mortgages in Upper Exeter
Real Estate and Mortgage Overview in Upper Exeter
| Characteristic | Without Mortgage | With Mortgage |
| Housing Units | 89 | 242 |
| Median Property Value | $197,500 | $219,200 |
| Median Household Income | - | - |
| Monthly Housing Costs | $636 | $0 |
| Real Estate Taxes | $2,828 | $6 |
Property Value by Mortgage Status in Upper Exeter
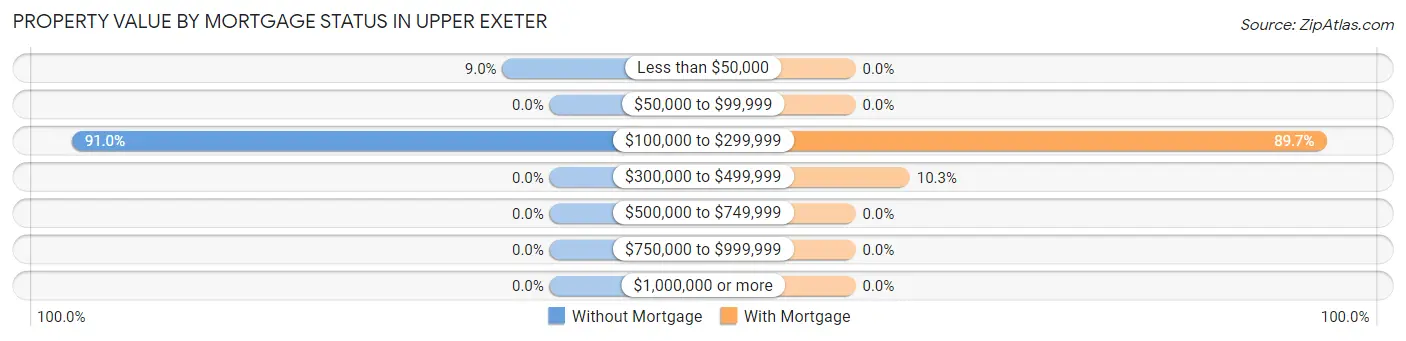
| Property Value | Without Mortgage | With Mortgage |
| Less than $50,000 | 8 (9.0%) | 0 (0.0%) |
| $50,000 to $99,999 | 0 (0.0%) | 0 (0.0%) |
| $100,000 to $299,999 | 81 (91.0%) | 217 (89.7%) |
| $300,000 to $499,999 | 0 (0.0%) | 25 (10.3%) |
| $500,000 to $749,999 | 0 (0.0%) | 0 (0.0%) |
| $750,000 to $999,999 | 0 (0.0%) | 0 (0.0%) |
| $1,000,000 or more | 0 (0.0%) | 0 (0.0%) |
| Total | 89 (100.0%) | 242 (100.0%) |
Household Income by Mortgage Status in Upper Exeter
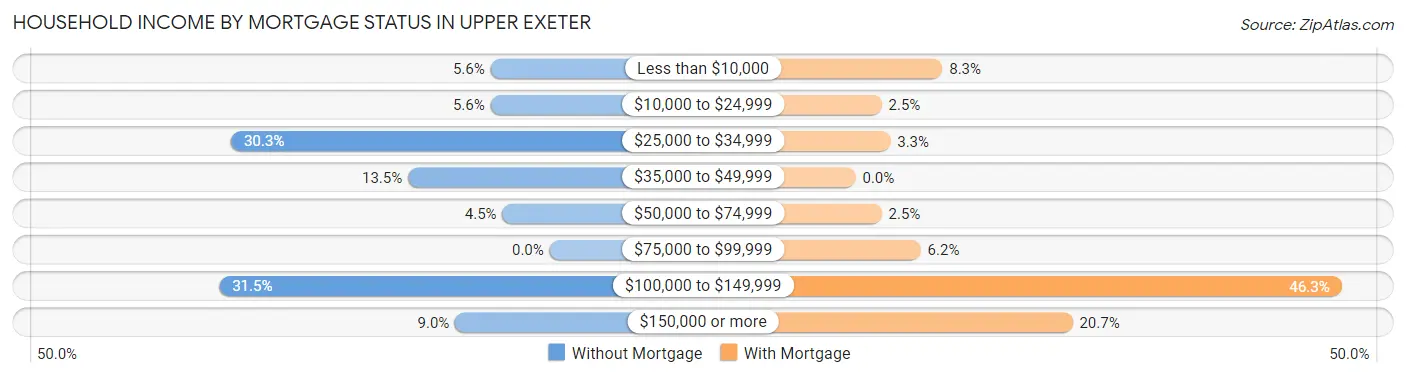
| Household Income | Without Mortgage | With Mortgage |
| Less than $10,000 | 5 (5.6%) | 20 (8.3%) |
| $10,000 to $24,999 | 5 (5.6%) | 6 (2.5%) |
| $25,000 to $34,999 | 27 (30.3%) | 8 (3.3%) |
| $35,000 to $49,999 | 12 (13.5%) | 0 (0.0%) |
| $50,000 to $74,999 | 4 (4.5%) | 6 (2.5%) |
| $75,000 to $99,999 | 0 (0.0%) | 15 (6.2%) |
| $100,000 to $149,999 | 28 (31.5%) | 112 (46.3%) |
| $150,000 or more | 8 (9.0%) | 50 (20.7%) |
| Total | 89 (100.0%) | 242 (100.0%) |
Property Value to Household Income Ratio in Upper Exeter
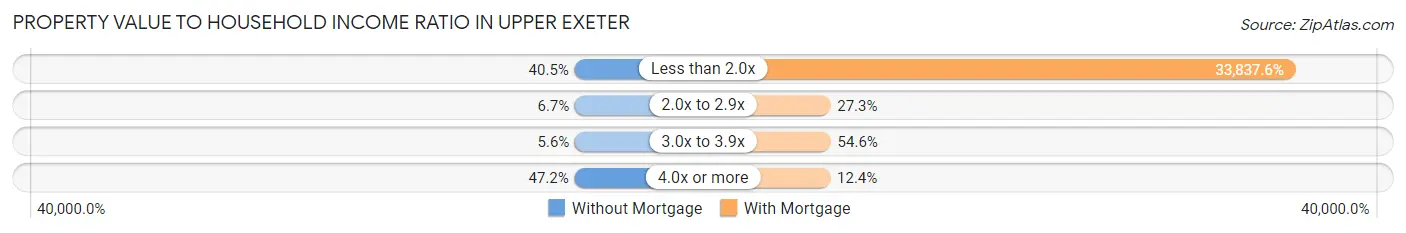
| Value-to-Income Ratio | Without Mortgage | With Mortgage |
| Less than 2.0x | 36 (40.5%) | 81,887 (33,837.6%) |
| 2.0x to 2.9x | 6 (6.7%) | 66 (27.3%) |
| 3.0x to 3.9x | 5 (5.6%) | 132 (54.5%) |
| 4.0x or more | 42 (47.2%) | 30 (12.4%) |
| Total | 89 (100.0%) | 242 (100.0%) |
Real Estate Taxes by Mortgage Status in Upper Exeter
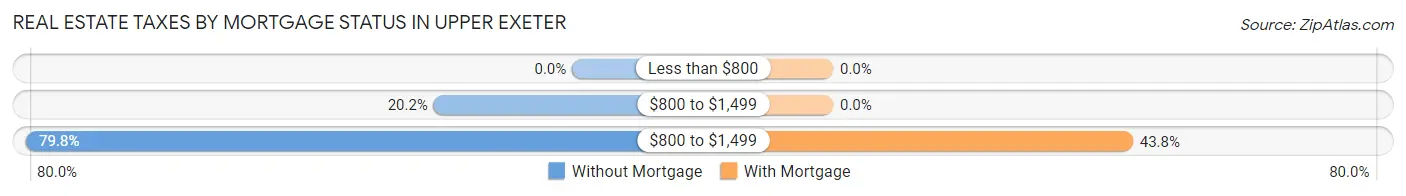
| Property Taxes | Without Mortgage | With Mortgage |
| Less than $800 | 0 (0.0%) | 0 (0.0%) |
| $800 to $1,499 | 18 (20.2%) | 0 (0.0%) |
| $800 to $1,499 | 71 (79.8%) | 106 (43.8%) |
| Total | 89 (100.0%) | 242 (100.0%) |
Health & Disability in Upper Exeter
Health Insurance Coverage by Age in Upper Exeter
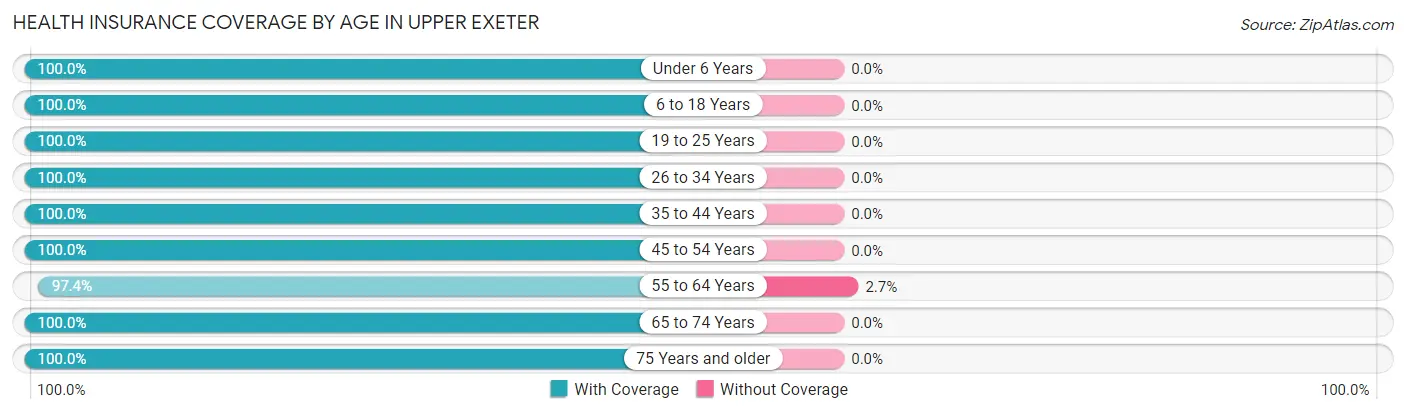
| Age Bracket | With Coverage | Without Coverage |
| Under 6 Years | 83 (100.0%) | 0 (0.0%) |
| 6 to 18 Years | 93 (100.0%) | 0 (0.0%) |
| 19 to 25 Years | 53 (100.0%) | 0 (0.0%) |
| 26 to 34 Years | 283 (100.0%) | 0 (0.0%) |
| 35 to 44 Years | 48 (100.0%) | 0 (0.0%) |
| 45 to 54 Years | 113 (100.0%) | 0 (0.0%) |
| 55 to 64 Years | 147 (97.4%) | 4 (2.6%) |
| 65 to 74 Years | 73 (100.0%) | 0 (0.0%) |
| 75 Years and older | 74 (100.0%) | 0 (0.0%) |
| Total | 967 (99.6%) | 4 (0.4%) |
Health Insurance Coverage by Citizenship Status in Upper Exeter
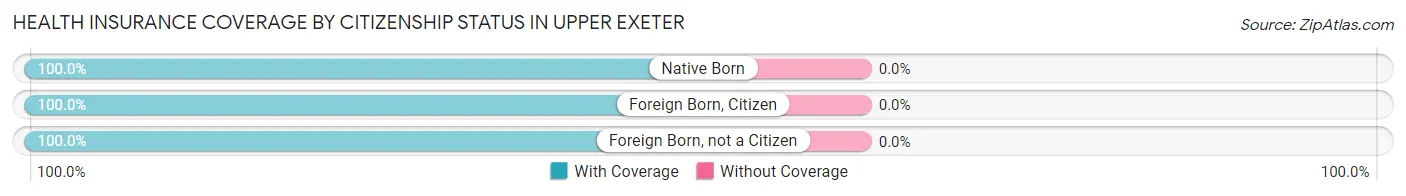
| Citizenship Status | With Coverage | Without Coverage |
| Native Born | 83 (100.0%) | 0 (0.0%) |
| Foreign Born, Citizen | 93 (100.0%) | 0 (0.0%) |
| Foreign Born, not a Citizen | 53 (100.0%) | 0 (0.0%) |
Health Insurance Coverage by Household Income in Upper Exeter
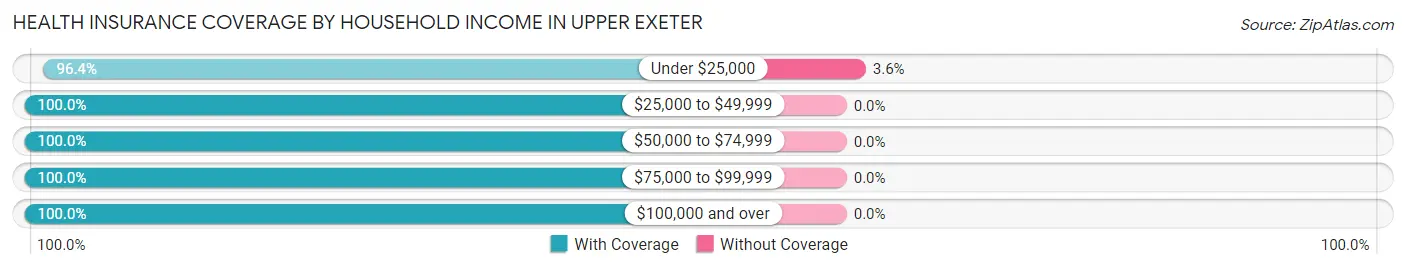
| Household Income | With Coverage | Without Coverage |
| Under $25,000 | 108 (96.4%) | 4 (3.6%) |
| $25,000 to $49,999 | 88 (100.0%) | 0 (0.0%) |
| $50,000 to $74,999 | 37 (100.0%) | 0 (0.0%) |
| $75,000 to $99,999 | 318 (100.0%) | 0 (0.0%) |
| $100,000 and over | 416 (100.0%) | 0 (0.0%) |
Public vs Private Health Insurance Coverage by Age in Upper Exeter
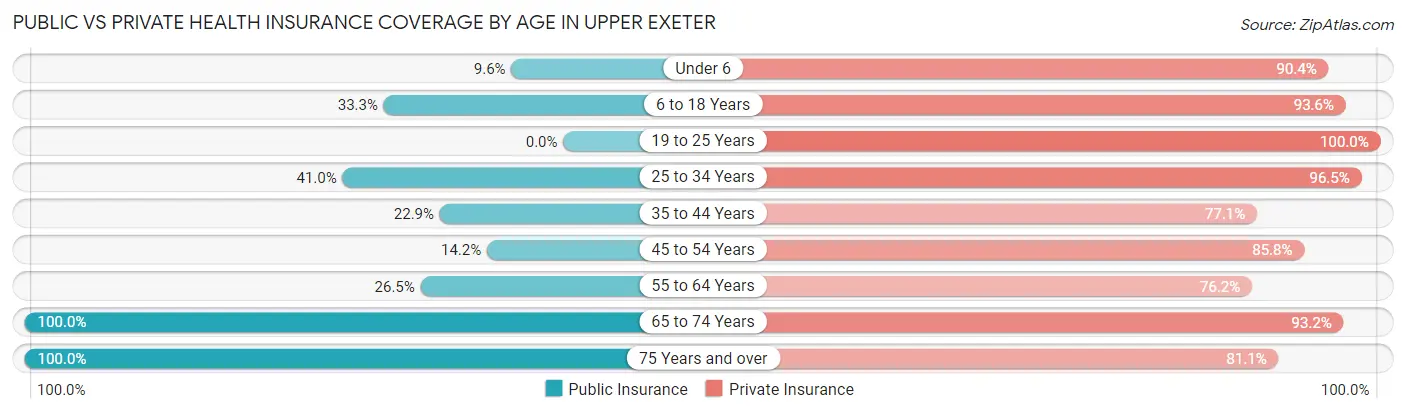
| Age Bracket | Public Insurance | Private Insurance |
| Under 6 | 8 (9.6%) | 75 (90.4%) |
| 6 to 18 Years | 31 (33.3%) | 87 (93.5%) |
| 19 to 25 Years | 0 (0.0%) | 53 (100.0%) |
| 25 to 34 Years | 116 (41.0%) | 273 (96.5%) |
| 35 to 44 Years | 11 (22.9%) | 37 (77.1%) |
| 45 to 54 Years | 16 (14.2%) | 97 (85.8%) |
| 55 to 64 Years | 40 (26.5%) | 115 (76.2%) |
| 65 to 74 Years | 73 (100.0%) | 68 (93.1%) |
| 75 Years and over | 74 (100.0%) | 60 (81.1%) |
| Total | 369 (38.0%) | 865 (89.1%) |
Disability Status by Sex by Age in Upper Exeter
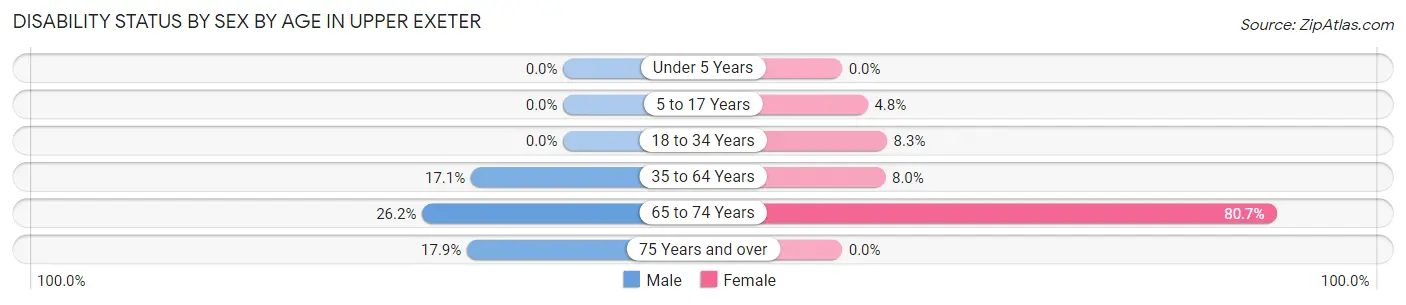
| Age Bracket | Male | Female |
| Under 5 Years | 0 (0.0%) | 0 (0.0%) |
| 5 to 17 Years | 0 (0.0%) | 2 (4.8%) |
| 18 to 34 Years | 0 (0.0%) | 14 (8.3%) |
| 35 to 64 Years | 30 (17.1%) | 11 (8.0%) |
| 65 to 74 Years | 11 (26.2%) | 25 (80.6%) |
| 75 Years and over | 5 (17.9%) | 0 (0.0%) |
Disability Class by Sex by Age in Upper Exeter
Disability Class: Hearing Difficulty
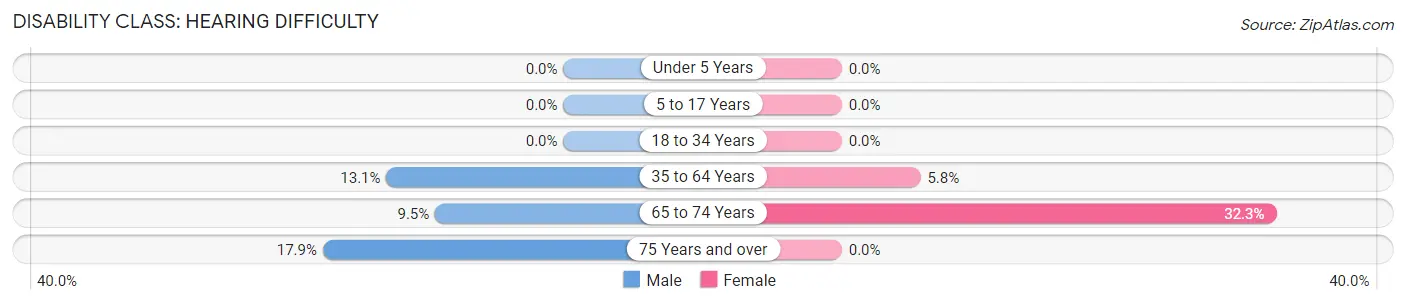
| Age Bracket | Male | Female |
| Under 5 Years | 0 (0.0%) | 0 (0.0%) |
| 5 to 17 Years | 0 (0.0%) | 0 (0.0%) |
| 18 to 34 Years | 0 (0.0%) | 0 (0.0%) |
| 35 to 64 Years | 23 (13.1%) | 8 (5.8%) |
| 65 to 74 Years | 4 (9.5%) | 10 (32.3%) |
| 75 Years and over | 5 (17.9%) | 0 (0.0%) |
Disability Class: Vision Difficulty
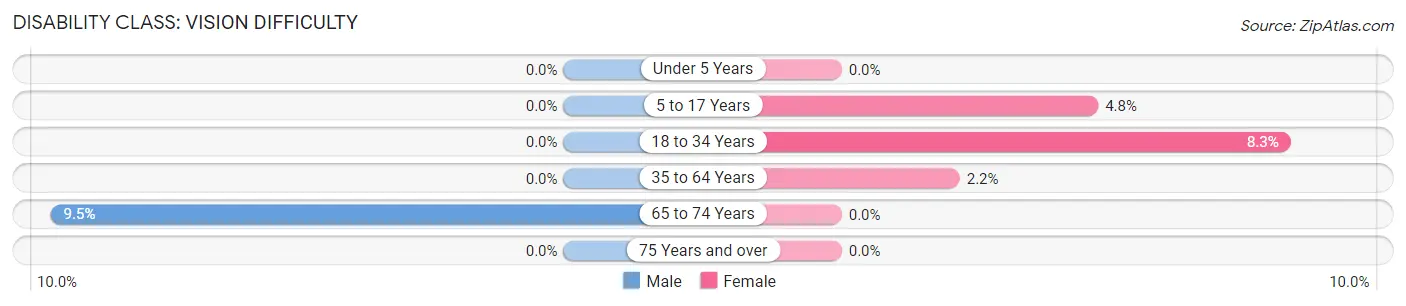
| Age Bracket | Male | Female |
| Under 5 Years | 0 (0.0%) | 0 (0.0%) |
| 5 to 17 Years | 0 (0.0%) | 2 (4.8%) |
| 18 to 34 Years | 0 (0.0%) | 14 (8.3%) |
| 35 to 64 Years | 0 (0.0%) | 3 (2.2%) |
| 65 to 74 Years | 4 (9.5%) | 0 (0.0%) |
| 75 Years and over | 0 (0.0%) | 0 (0.0%) |
Disability Class: Cognitive Difficulty
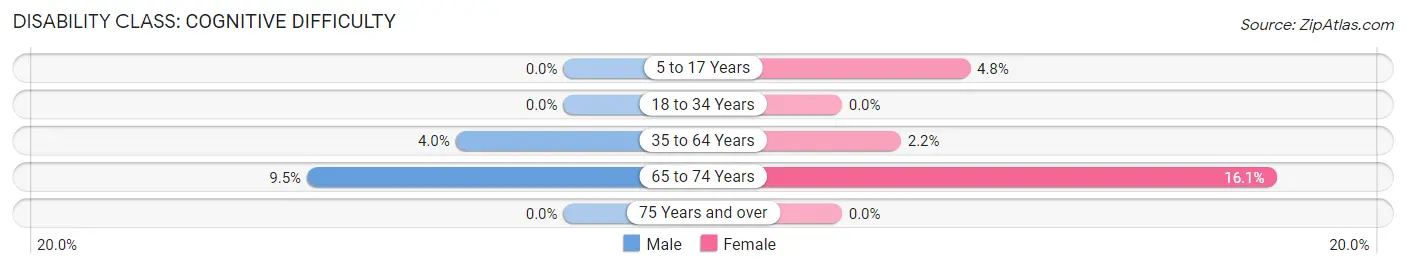
| Age Bracket | Male | Female |
| 5 to 17 Years | 0 (0.0%) | 2 (4.8%) |
| 18 to 34 Years | 0 (0.0%) | 0 (0.0%) |
| 35 to 64 Years | 7 (4.0%) | 3 (2.2%) |
| 65 to 74 Years | 4 (9.5%) | 5 (16.1%) |
| 75 Years and over | 0 (0.0%) | 0 (0.0%) |
Disability Class: Ambulatory Difficulty
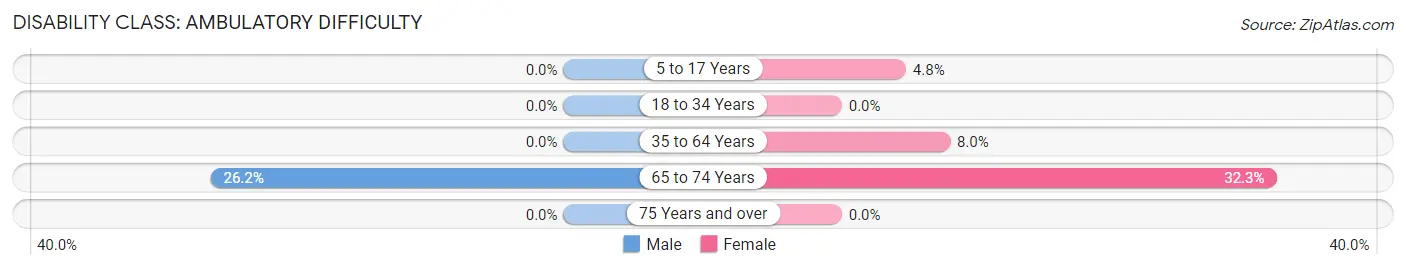
| Age Bracket | Male | Female |
| 5 to 17 Years | 0 (0.0%) | 2 (4.8%) |
| 18 to 34 Years | 0 (0.0%) | 0 (0.0%) |
| 35 to 64 Years | 0 (0.0%) | 11 (8.0%) |
| 65 to 74 Years | 11 (26.2%) | 10 (32.3%) |
| 75 Years and over | 0 (0.0%) | 0 (0.0%) |
Disability Class: Self-Care Difficulty
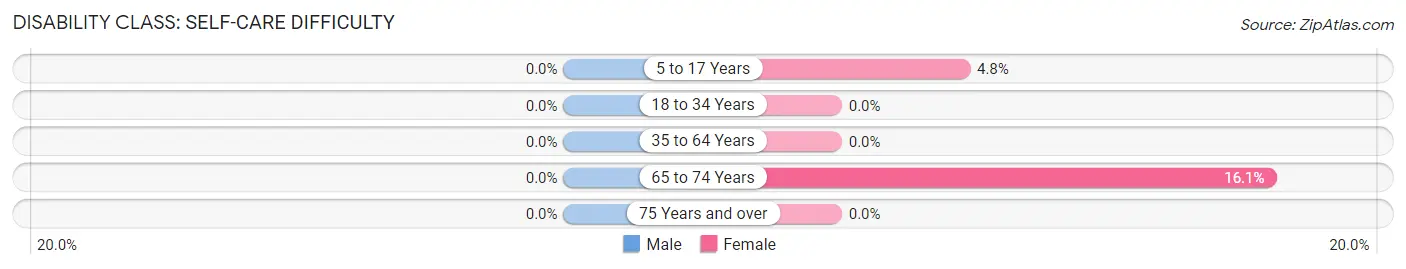
| Age Bracket | Male | Female |
| 5 to 17 Years | 0 (0.0%) | 2 (4.8%) |
| 18 to 34 Years | 0 (0.0%) | 0 (0.0%) |
| 35 to 64 Years | 0 (0.0%) | 0 (0.0%) |
| 65 to 74 Years | 0 (0.0%) | 5 (16.1%) |
| 75 Years and over | 0 (0.0%) | 0 (0.0%) |
Technology Access in Upper Exeter
Computing Device Access in Upper Exeter
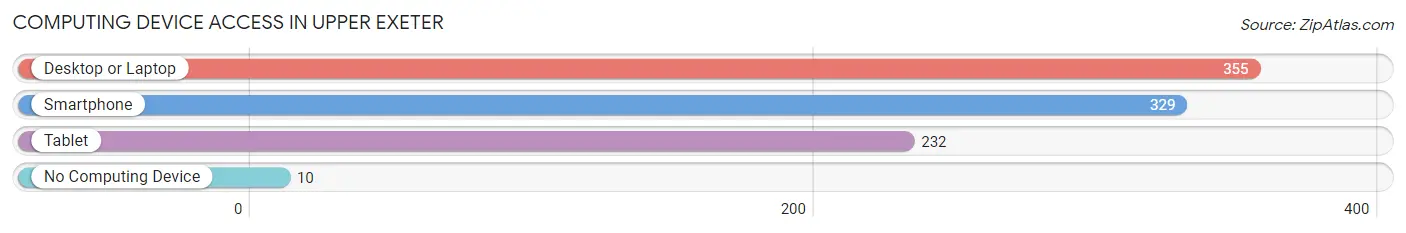
| Device Type | # Households | % Households |
| Desktop or Laptop | 355 | 93.7% |
| Smartphone | 329 | 86.8% |
| Tablet | 232 | 61.2% |
| No Computing Device | 10 | 2.6% |
| Total | 379 | 100.0% |
Internet Access in Upper Exeter
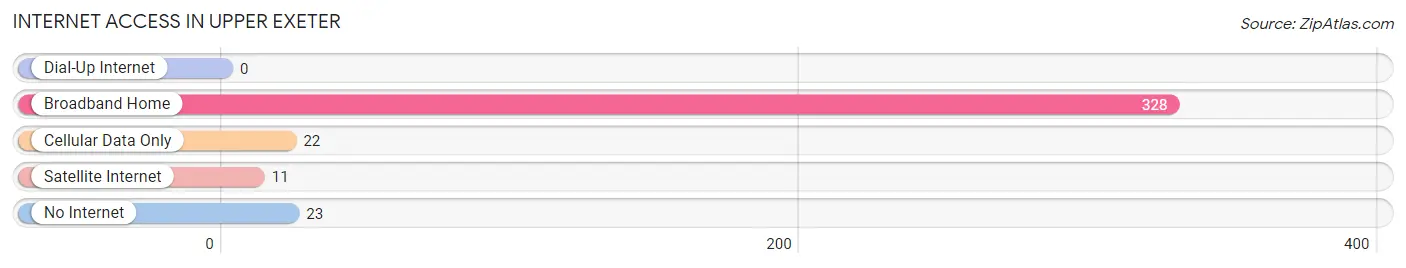
| Internet Type | # Households | % Households |
| Dial-Up Internet | 0 | 0.0% |
| Broadband Home | 328 | 86.5% |
| Cellular Data Only | 22 | 5.8% |
| Satellite Internet | 11 | 2.9% |
| No Internet | 23 | 6.1% |
| Total | 379 | 100.0% |
Upper Exeter Summary
Upper Exeter is a small borough located in Berks County, Pennsylvania. It is situated in the southeastern corner of the county, approximately 10 miles from the city of Reading. The borough is bordered by Exeter Township to the north, Birdsboro to the east, and Amity Township to the south and west. According to the 2010 census, the population of Upper Exeter was 1,845.
History
Upper Exeter was originally part of Exeter Township, which was established in 1741. In 1845, the borough was incorporated as a separate municipality. The name “Upper Exeter” was chosen to distinguish it from the neighboring borough of Exeter, which was incorporated in 1848.
The borough was originally a farming community, but in the late 19th century, it began to develop into a small industrial center. The first industry to locate in Upper Exeter was the Exeter Iron Works, which was established in 1876. The iron works was followed by several other factories, including a paper mill, a brickyard, and a tannery.
Geography
Upper Exeter is located in southeastern Berks County, approximately 10 miles from the city of Reading. The borough is situated in the Schuylkill River Valley, and is bordered by Exeter Township to the north, Birdsboro to the east, and Amity Township to the south and west.
The borough covers an area of 1.2 square miles, and is mostly flat, with some rolling hills. The terrain is mostly wooded, with some open fields. The Schuylkill River forms the western boundary of the borough.
Economy
Upper Exeter’s economy is largely based on manufacturing. The borough is home to several factories, including a paper mill, a brickyard, and a tannery. The borough also has several small businesses, including restaurants, retail stores, and service providers.
The borough is also home to several large employers, including Exeter Iron Works, which employs over 500 people. The borough also has several small businesses, including restaurants, retail stores, and service providers.
Demographics
According to the 2010 census, the population of Upper Exeter was 1,845. The population is predominantly white (94.3%), with small percentages of African American (2.2%), Asian (1.2%), and Hispanic (1.2%) residents. The median household income is $45,000, and the median age is 43.
The borough is served by the Exeter Area School District, which includes two elementary schools, one middle school, and one high school. The borough also has several churches, including the Exeter United Methodist Church, the Exeter Presbyterian Church, and the Exeter Baptist Church.
Common Questions
What is Per Capita Income in Upper Exeter?
Per Capita income in Upper Exeter is $41,957.
What is the Median Family Income in Upper Exeter?
Median Family Income in Upper Exeter is $81,686.
What is the Median Household income in Upper Exeter?
Median Household Income in Upper Exeter is $81,120.
What is Inequality or Gini Index in Upper Exeter?
Inequality or Gini Index in Upper Exeter is 0.45.
What is the Total Population of Upper Exeter?
Total Population of Upper Exeter is 971.
What is the Total Male Population of Upper Exeter?
Total Male Population of Upper Exeter is 539.
What is the Total Female Population of Upper Exeter?
Total Female Population of Upper Exeter is 432.
What is the Ratio of Males per 100 Females in Upper Exeter?
There are 124.77 Males per 100 Females in Upper Exeter.
What is the Ratio of Females per 100 Males in Upper Exeter?
There are 80.15 Females per 100 Males in Upper Exeter.
What is the Median Population Age in Upper Exeter?
Median Population Age in Upper Exeter is 30.0 Years.
What is the Average Family Size in Upper Exeter
Average Family Size in Upper Exeter is 2.8 People.
What is the Average Household Size in Upper Exeter
Average Household Size in Upper Exeter is 2.6 People.
How Large is the Labor Force in Upper Exeter?
There are 533 People in the Labor Forcein in Upper Exeter.
What is the Percentage of People in the Labor Force in Upper Exeter?
63.3% of People are in the Labor Force in Upper Exeter.
What is the Unemployment Rate in Upper Exeter?
Unemployment Rate in Upper Exeter is 1.9%.