Baumstown, PA Map & Demographics
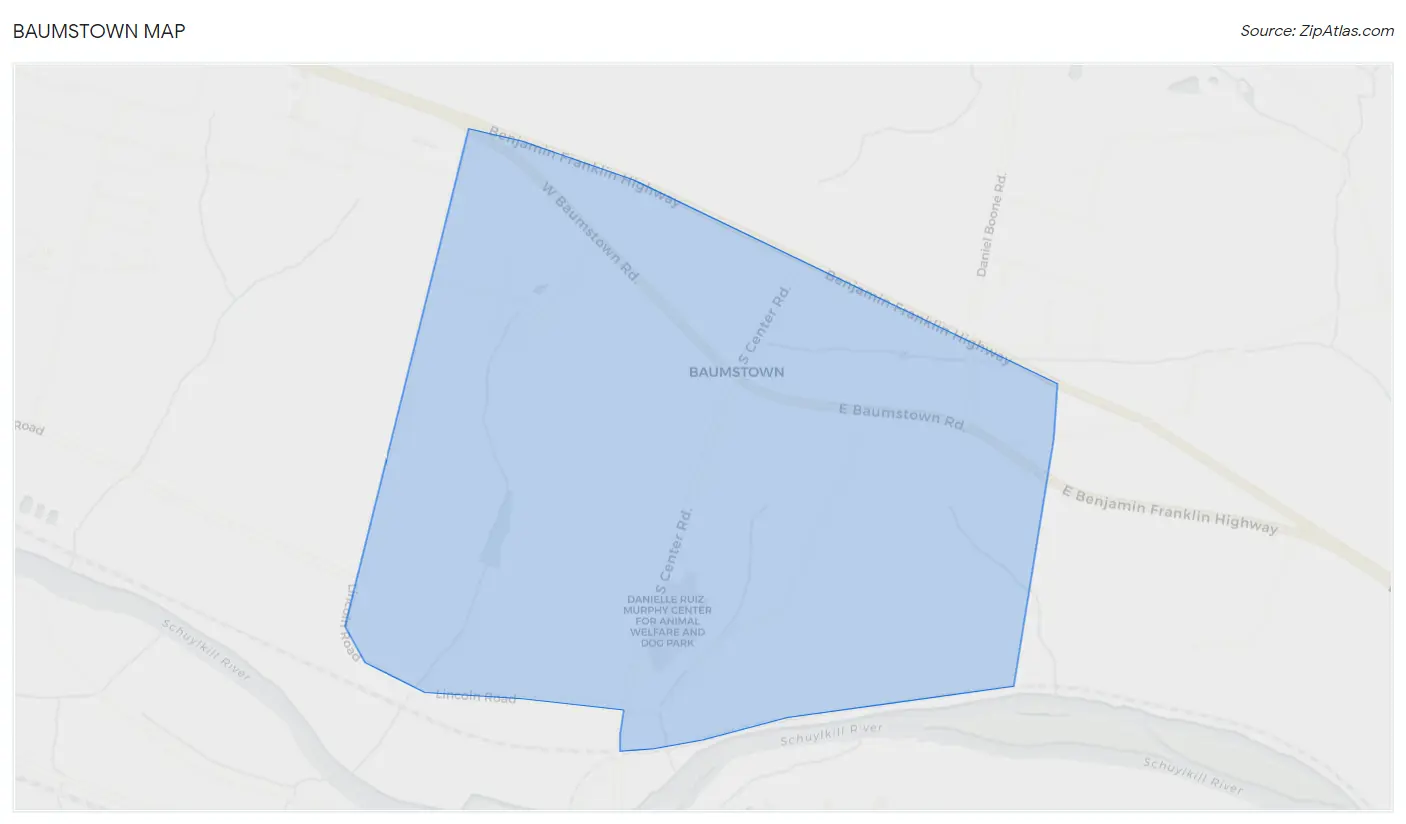
Baumstown Map
Baumstown Overview
$36,654
PER CAPITA INCOME
$90,568
AVG FAMILY INCOME
$46,500
AVG HOUSEHOLD INCOME
0.32
INEQUALITY / GINI INDEX
168
TOTAL POPULATION
67
MALE POPULATION
101
FEMALE POPULATION
66.34
MALES / 100 FEMALES
150.75
FEMALES / 100 MALES
56.3
MEDIAN AGE
2.2
AVG FAMILY SIZE
1.6
AVG HOUSEHOLD SIZE
118
LABOR FORCE [ PEOPLE ]
77.6%
PERCENT IN LABOR FORCE
Income in Baumstown
Income Overview in Baumstown
Per Capita Income in Baumstown is $36,654, while median incomes of families and households are $90,568 and $46,500 respectively.
| Characteristic | Number | Measure |
| Per Capita Income | 168 | $36,654 |
| Median Family Income | 55 | $90,568 |
| Mean Family Income | 55 | $81,104 |
| Median Household Income | 102 | $46,500 |
| Mean Household Income | 102 | $59,861 |
| Income Deficit | 55 | $0 |
| Wage / Income Gap (%) | 168 | 0.00% |
| Wage / Income Gap ($) | 168 | 100.00¢ per $1 |
| Gini / Inequality Index | 168 | 0.32 |
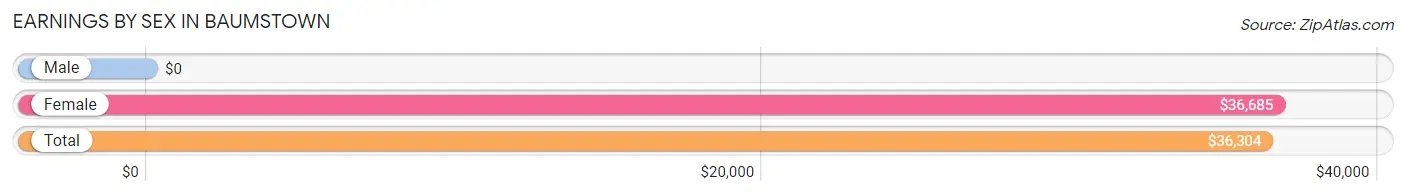
Earnings by Sex in Baumstown
| Sex | Number | Average Earnings |
| Male | 67 (54.9%) | $0 |
| Female | 55 (45.1%) | $36,685 |
| Total | 122 (100.0%) | $36,304 |
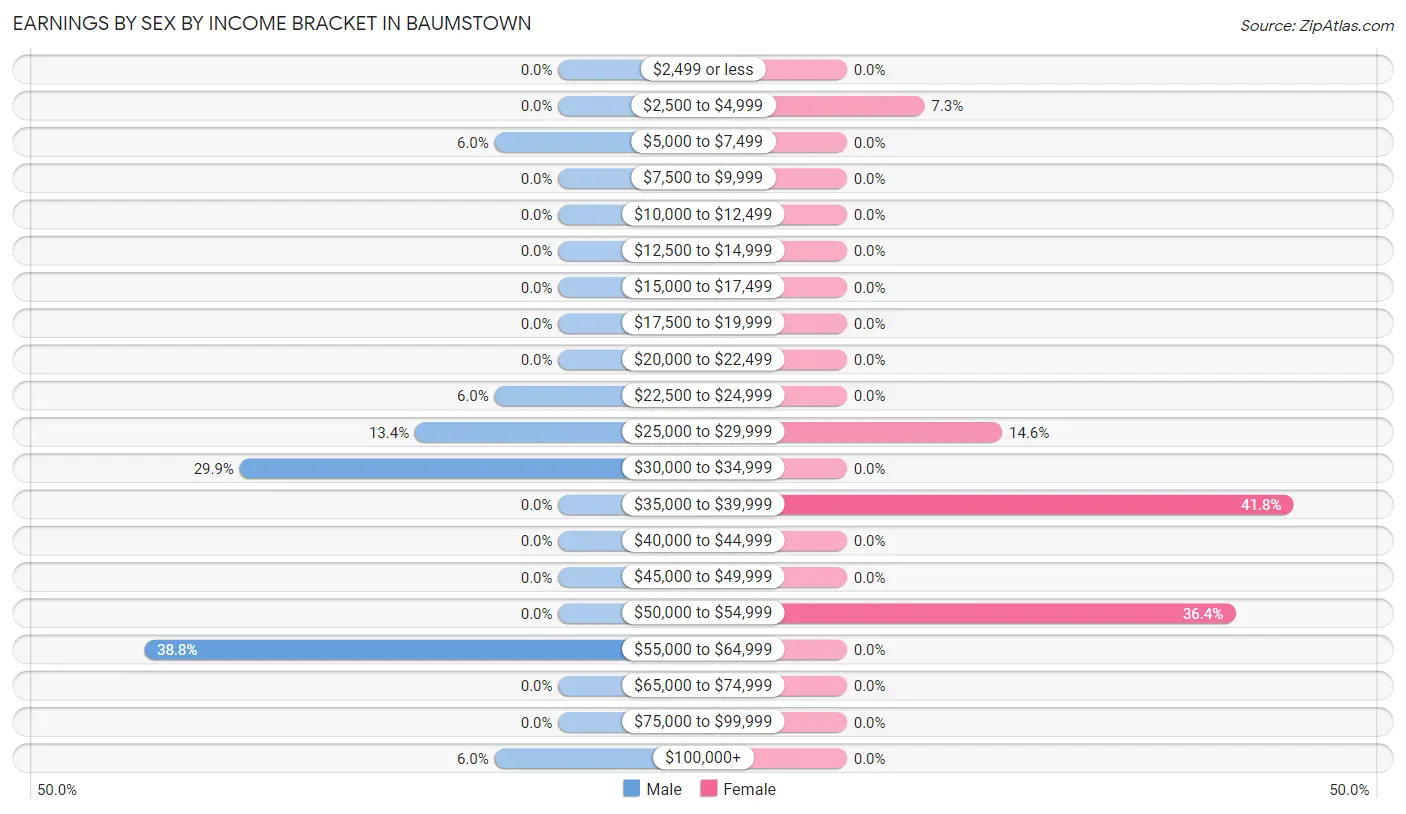
Earnings by Sex by Income Bracket in Baumstown
The most common earnings brackets in Baumstown are $55,000 to $64,999 for men (26 | 38.8%) and $35,000 to $39,999 for women (23 | 41.8%).
| Income | Male | Female |
| $2,499 or less | 0 (0.0%) | 0 (0.0%) |
| $2,500 to $4,999 | 0 (0.0%) | 4 (7.3%) |
| $5,000 to $7,499 | 4 (6.0%) | 0 (0.0%) |
| $7,500 to $9,999 | 0 (0.0%) | 0 (0.0%) |
| $10,000 to $12,499 | 0 (0.0%) | 0 (0.0%) |
| $12,500 to $14,999 | 0 (0.0%) | 0 (0.0%) |
| $15,000 to $17,499 | 0 (0.0%) | 0 (0.0%) |
| $17,500 to $19,999 | 0 (0.0%) | 0 (0.0%) |
| $20,000 to $22,499 | 0 (0.0%) | 0 (0.0%) |
| $22,500 to $24,999 | 4 (6.0%) | 0 (0.0%) |
| $25,000 to $29,999 | 9 (13.4%) | 8 (14.5%) |
| $30,000 to $34,999 | 20 (29.8%) | 0 (0.0%) |
| $35,000 to $39,999 | 0 (0.0%) | 23 (41.8%) |
| $40,000 to $44,999 | 0 (0.0%) | 0 (0.0%) |
| $45,000 to $49,999 | 0 (0.0%) | 0 (0.0%) |
| $50,000 to $54,999 | 0 (0.0%) | 20 (36.4%) |
| $55,000 to $64,999 | 26 (38.8%) | 0 (0.0%) |
| $65,000 to $74,999 | 0 (0.0%) | 0 (0.0%) |
| $75,000 to $99,999 | 0 (0.0%) | 0 (0.0%) |
| $100,000+ | 4 (6.0%) | 0 (0.0%) |
| Total | 67 (100.0%) | 55 (100.0%) |
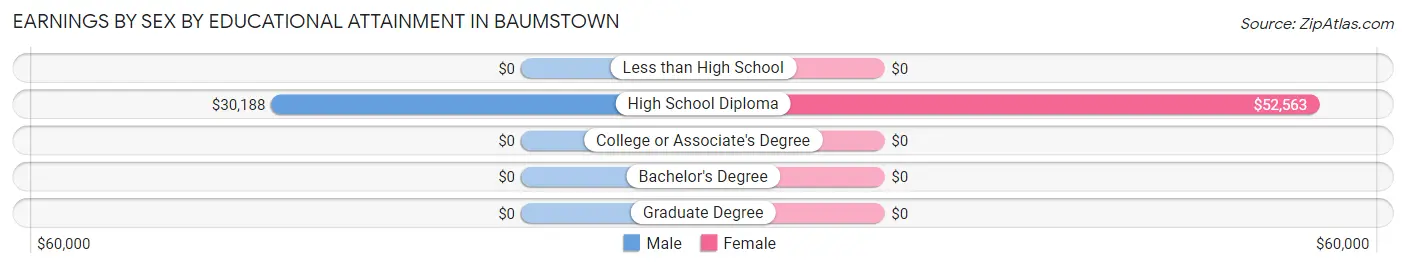
Earnings by Sex by Educational Attainment in Baumstown
| Educational Attainment | Male Income | Female Income |
| Less than High School | - | - |
| High School Diploma | $30,188 | $52,563 |
| College or Associate's Degree | - | - |
| Bachelor's Degree | - | - |
| Graduate Degree | - | - |
| Total | - | - |
Family Income in Baumstown
Family Income Brackets in Baumstown
According to the Baumstown family income data, there are 26 families falling into the $75,000 to $99,999 income range, which is the most common income bracket and makes up 47.3% of all families.
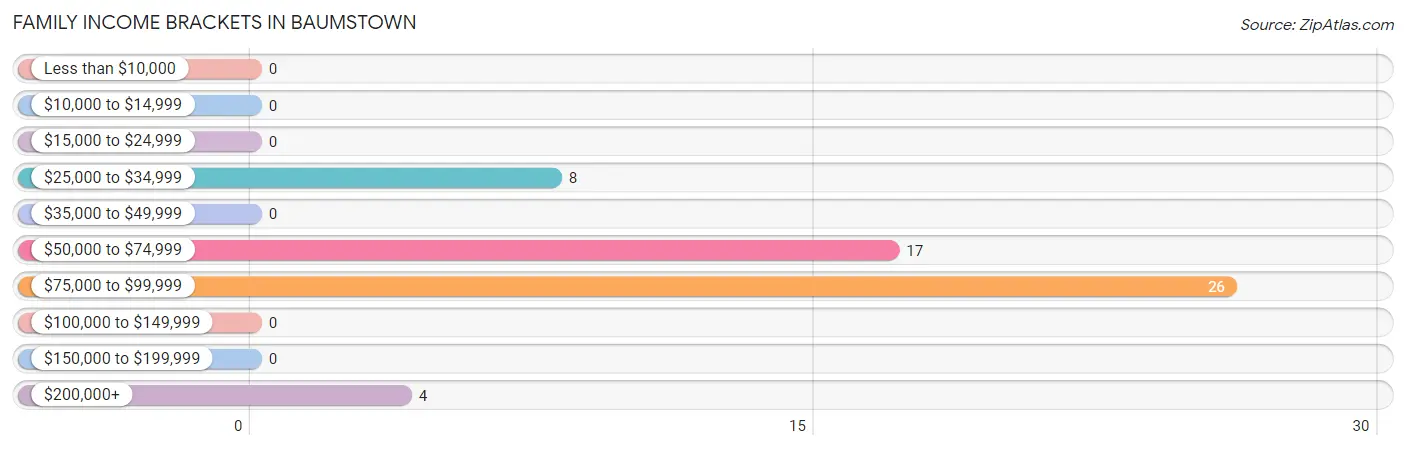
| Income Bracket | # Families | % Families |
| Less than $10,000 | 0 | 0.0% |
| $10,000 to $14,999 | 0 | 0.0% |
| $15,000 to $24,999 | 0 | 0.0% |
| $25,000 to $34,999 | 8 | 14.5% |
| $35,000 to $49,999 | 0 | 0.0% |
| $50,000 to $74,999 | 17 | 30.9% |
| $75,000 to $99,999 | 26 | 47.3% |
| $100,000 to $149,999 | 0 | 0.0% |
| $150,000 to $199,999 | 0 | 0.0% |
| $200,000+ | 4 | 7.3% |
Family Income by Famaliy Size in Baumstown
2-person families (40 | 72.7%) account for the highest median family income in Baumstown with $54,265 per family, while 2-person families (40 | 72.7%) have the highest median income of $27,132 per family member.
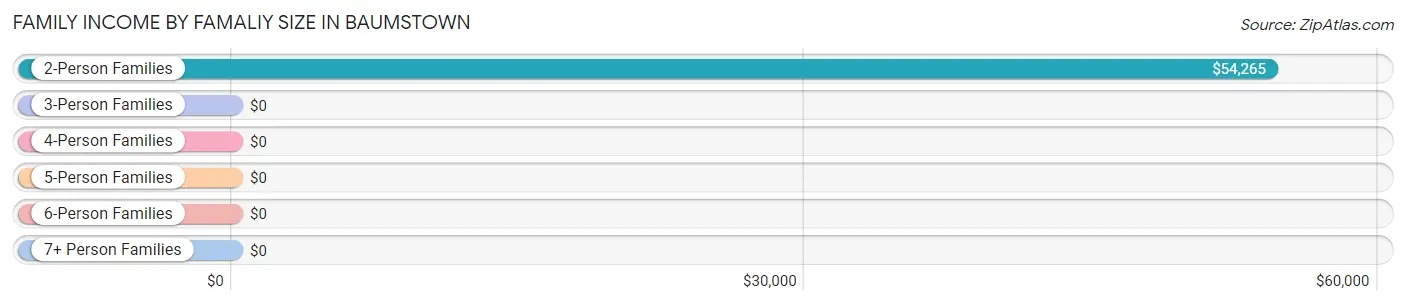
| Income Bracket | # Families | Median Income |
| 2-Person Families | 40 (72.7%) | $54,265 |
| 3-Person Families | 15 (27.3%) | $0 |
| 4-Person Families | 0 (0.0%) | $0 |
| 5-Person Families | 0 (0.0%) | $0 |
| 6-Person Families | 0 (0.0%) | $0 |
| 7+ Person Families | 0 (0.0%) | $0 |
| Total | 55 (100.0%) | $90,568 |
Family Income by Number of Earners in Baumstown
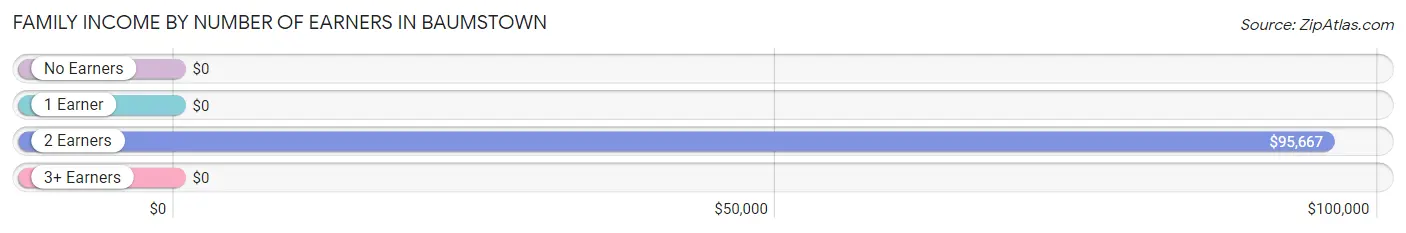
| Number of Earners | # Families | Median Income |
| No Earners | 0 (0.0%) | $0 |
| 1 Earner | 25 (45.5%) | $0 |
| 2 Earners | 30 (54.5%) | $95,667 |
| 3+ Earners | 0 (0.0%) | $0 |
| Total | 55 (100.0%) | $90,568 |
Household Income in Baumstown
Household Income Brackets in Baumstown
With 32 households falling in the category, the $25,000 to $34,999 income range is the most frequent in Baumstown, accounting for 31.4% of all households.
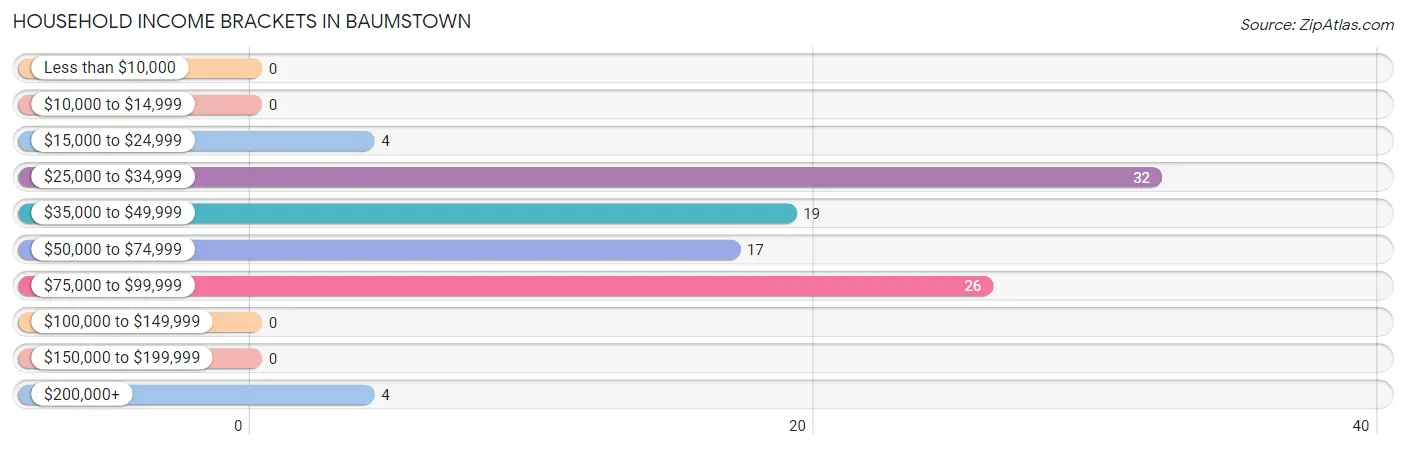
| Income Bracket | # Households | % Households |
| Less than $10,000 | 0 | 0.0% |
| $10,000 to $14,999 | 0 | 0.0% |
| $15,000 to $24,999 | 4 | 3.9% |
| $25,000 to $34,999 | 32 | 31.4% |
| $35,000 to $49,999 | 19 | 18.6% |
| $50,000 to $74,999 | 17 | 16.7% |
| $75,000 to $99,999 | 26 | 25.5% |
| $100,000 to $149,999 | 0 | 0.0% |
| $150,000 to $199,999 | 0 | 0.0% |
| $200,000+ | 4 | 3.9% |
Household Income by Householder Age in Baumstown
The median household income in Baumstown is $46,500, with the highest median household income of $95,917 found in the 45 to 64 years age bracket for the primary householder. A total of 27 households (26.5%) fall into this category.
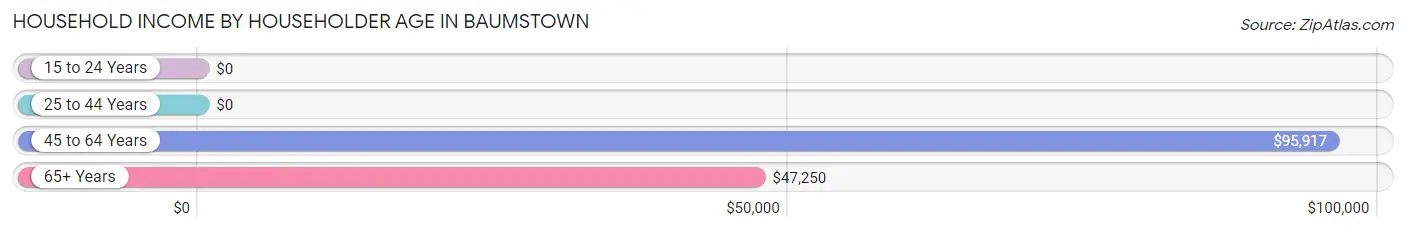
| Income Bracket | # Households | Median Income |
| 15 to 24 Years | 0 (0.0%) | $0 |
| 25 to 44 Years | 39 (38.2%) | $0 |
| 45 to 64 Years | 27 (26.5%) | $95,917 |
| 65+ Years | 36 (35.3%) | $47,250 |
| Total | 102 (100.0%) | $46,500 |
Poverty in Baumstown
Income Below Poverty by Sex and Age in Baumstown
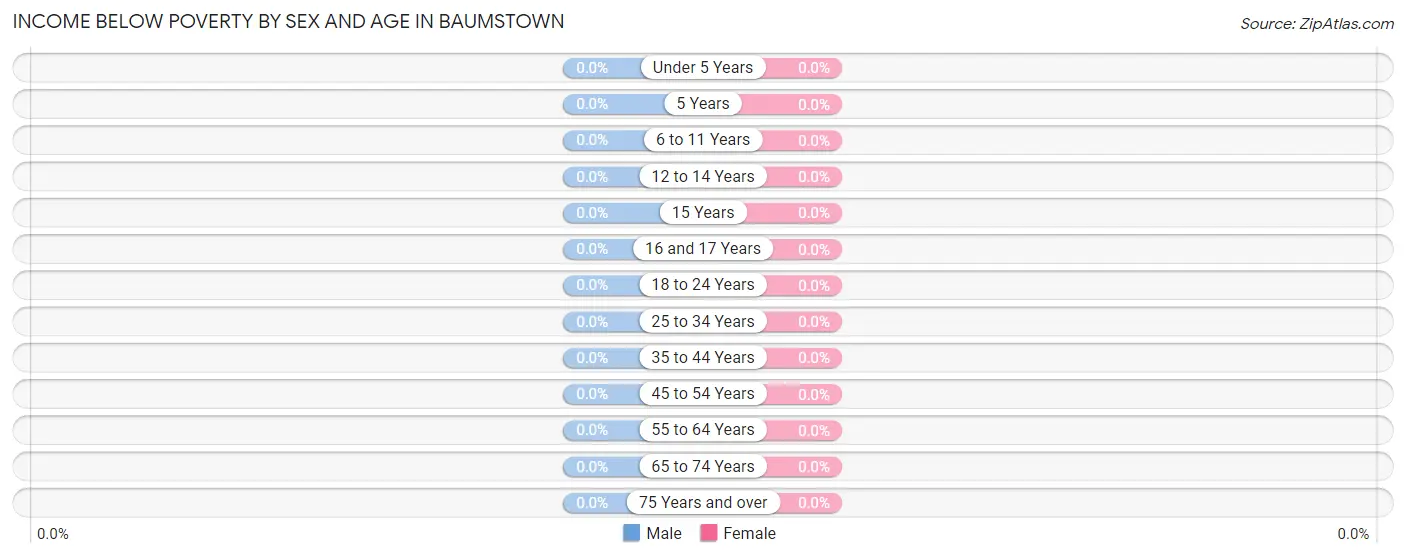
| Age Bracket | Male | Female |
| Under 5 Years | 0 (0.0%) | 0 (0.0%) |
| 5 Years | 0 (0.0%) | 0 (0.0%) |
| 6 to 11 Years | 0 (0.0%) | 0 (0.0%) |
| 12 to 14 Years | 0 (0.0%) | 0 (0.0%) |
| 15 Years | 0 (0.0%) | 0 (0.0%) |
| 16 and 17 Years | 0 (0.0%) | 0 (0.0%) |
| 18 to 24 Years | 0 (0.0%) | 0 (0.0%) |
| 25 to 34 Years | 0 (0.0%) | 0 (0.0%) |
| 35 to 44 Years | 0 (0.0%) | 0 (0.0%) |
| 45 to 54 Years | 0 (0.0%) | 0 (0.0%) |
| 55 to 64 Years | 0 (0.0%) | 0 (0.0%) |
| 65 to 74 Years | 0 (0.0%) | 0 (0.0%) |
| 75 Years and over | 0 (0.0%) | 0 (0.0%) |
| Total | 0 (0.0%) | 0 (0.0%) |
Income Above Poverty by Sex and Age in Baumstown
According to the poverty statistics in Baumstown, males aged 25 to 34 years and females aged under 5 years are the age groups that are most secure financially, with 100.0% of males and 100.0% of females in these age groups living above the poverty line.
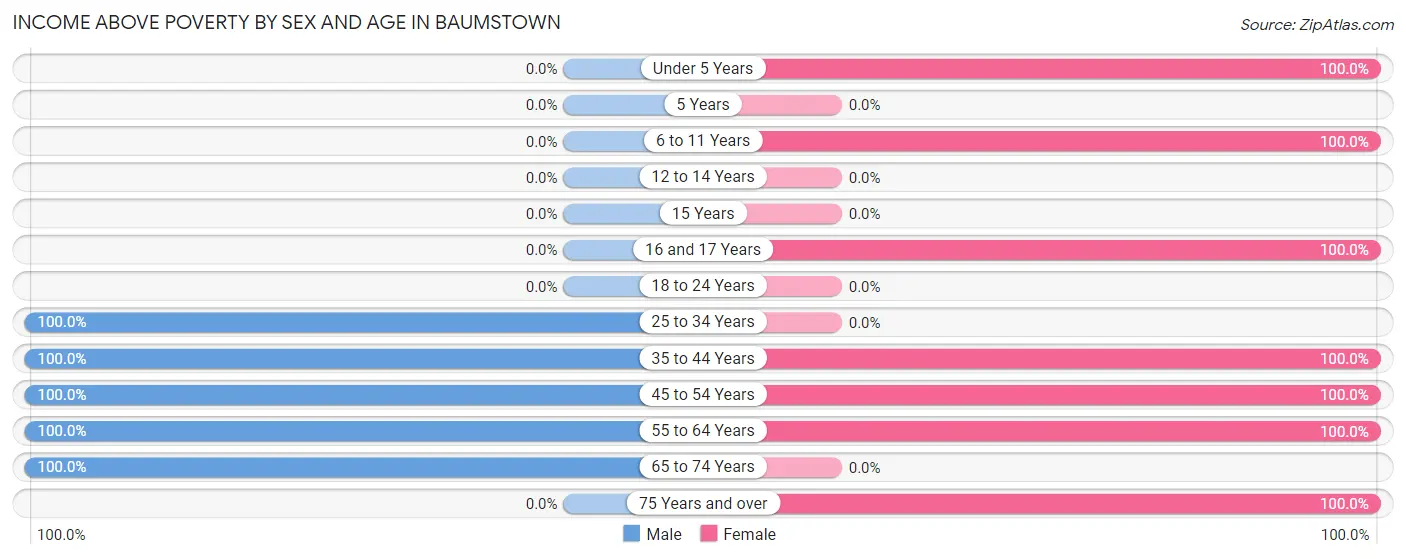
| Age Bracket | Male | Female |
| Under 5 Years | 0 (0.0%) | 12 (100.0%) |
| 5 Years | 0 (0.0%) | 0 (0.0%) |
| 6 to 11 Years | 0 (0.0%) | 4 (100.0%) |
| 12 to 14 Years | 0 (0.0%) | 0 (0.0%) |
| 15 Years | 0 (0.0%) | 0 (0.0%) |
| 16 and 17 Years | 0 (0.0%) | 4 (100.0%) |
| 18 to 24 Years | 0 (0.0%) | 0 (0.0%) |
| 25 to 34 Years | 20 (100.0%) | 0 (0.0%) |
| 35 to 44 Years | 11 (100.0%) | 19 (100.0%) |
| 45 to 54 Years | 4 (100.0%) | 3 (100.0%) |
| 55 to 64 Years | 23 (100.0%) | 32 (100.0%) |
| 65 to 74 Years | 9 (100.0%) | 0 (0.0%) |
| 75 Years and over | 0 (0.0%) | 27 (100.0%) |
| Total | 67 (100.0%) | 101 (100.0%) |
Income Below Poverty Among Married-Couple Families in Baumstown
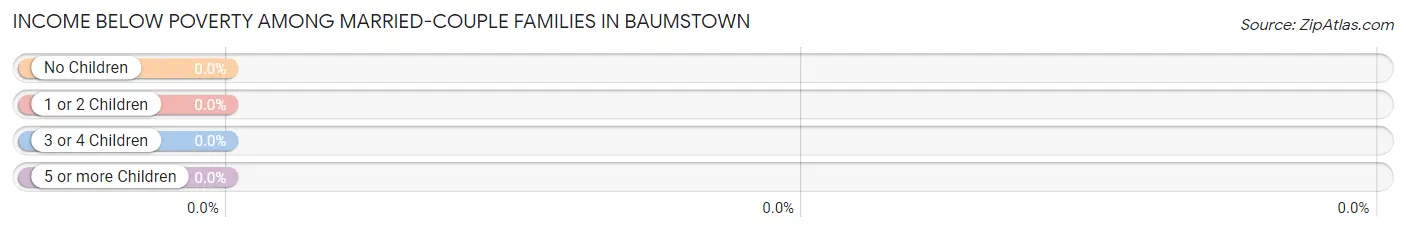
| Children | Above Poverty | Below Poverty |
| No Children | 15 (100.0%) | 0 (0.0%) |
| 1 or 2 Children | 15 (100.0%) | 0 (0.0%) |
| 3 or 4 Children | 0 (0.0%) | 0 (0.0%) |
| 5 or more Children | 0 (0.0%) | 0 (0.0%) |
| Total | 30 (100.0%) | 0 (0.0%) |
Income Below Poverty Among Single-Parent Households in Baumstown
| Children | Single Father | Single Mother |
| No Children | 0 (0.0%) | 0 (0.0%) |
| 1 or 2 Children | 0 (0.0%) | 0 (0.0%) |
| 3 or 4 Children | 0 (0.0%) | 0 (0.0%) |
| 5 or more Children | 0 (0.0%) | 0 (0.0%) |
| Total | 0 (0.0%) | 0 (0.0%) |
Income Below Poverty Among Married-Couple vs Single-Parent Households in Baumstown
| Children | Married-Couple Families | Single-Parent Households |
| No Children | 0 (0.0%) | 0 (0.0%) |
| 1 or 2 Children | 0 (0.0%) | 0 (0.0%) |
| 3 or 4 Children | 0 (0.0%) | 0 (0.0%) |
| 5 or more Children | 0 (0.0%) | 0 (0.0%) |
| Total | 0 (0.0%) | 0 (0.0%) |
Race in Baumstown
The most populous races in Baumstown are White / Caucasian (141 | 83.9%), and Black / African American (27 | 16.1%).
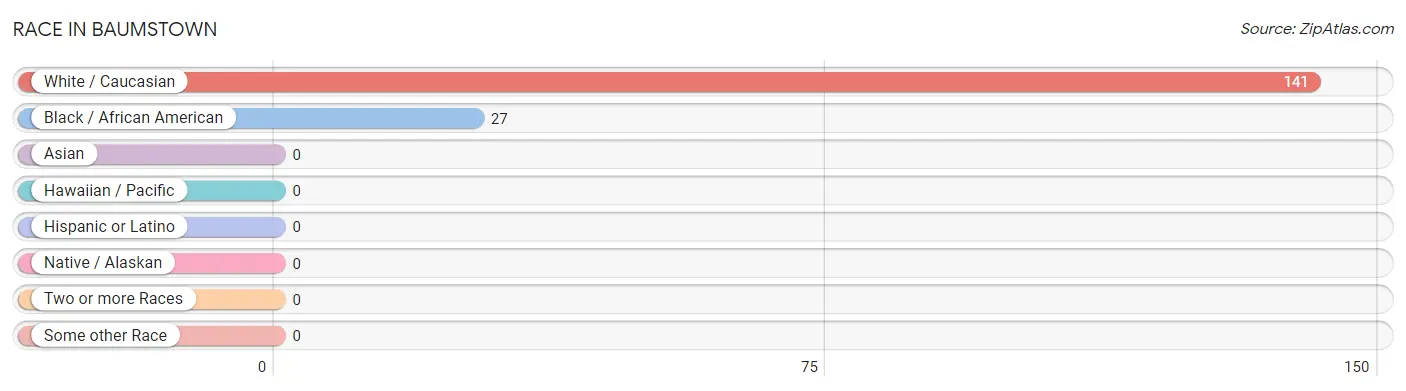
| Race | # Population | % Population |
| Asian | 0 | 0.0% |
| Black / African American | 27 | 16.1% |
| Hawaiian / Pacific | 0 | 0.0% |
| Hispanic or Latino | 0 | 0.0% |
| Native / Alaskan | 0 | 0.0% |
| White / Caucasian | 141 | 83.9% |
| Two or more Races | 0 | 0.0% |
| Some other Race | 0 | 0.0% |
| Total | 168 | 100.0% |
Ancestry in Baumstown
The most populous ancestries reported in Baumstown are American (46 | 27.4%), Polish (35 | 20.8%), German (31 | 18.4%), French (17 | 10.1%), and Irish (12 | 7.1%), together accounting for 83.9% of all Baumstown residents.
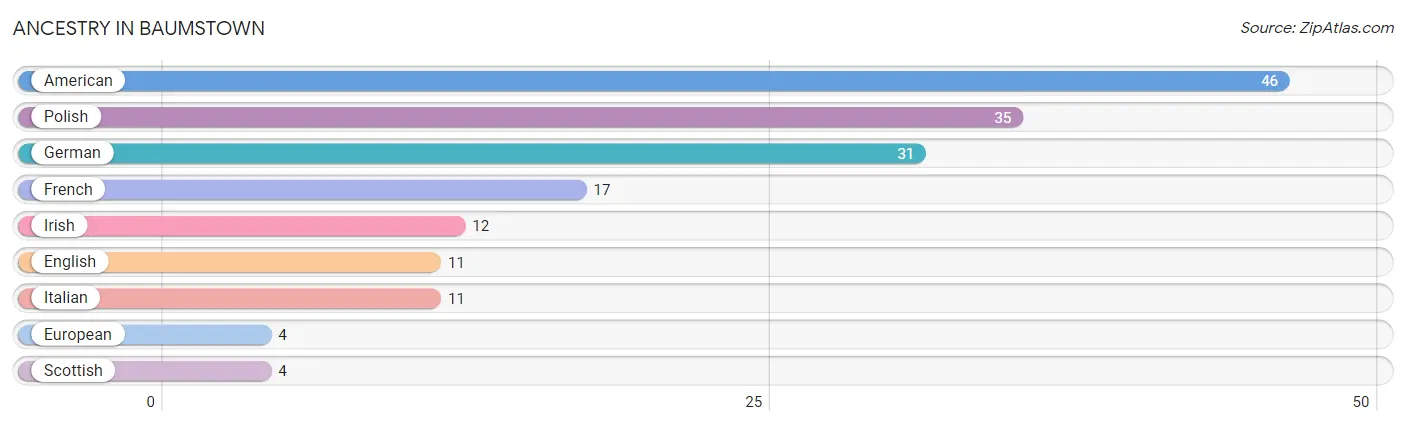
| Ancestry | # Population | % Population |
| American | 46 | 27.4% |
| English | 11 | 6.6% |
| European | 4 | 2.4% |
| French | 17 | 10.1% |
| German | 31 | 18.4% |
| Irish | 12 | 7.1% |
| Italian | 11 | 6.6% |
| Polish | 35 | 20.8% |
| Scottish | 4 | 2.4% | View All 9 Rows |
Immigrants in Baumstown

| Immigration Origin | # Population | % Population | View All 0 Rows |
Sex and Age in Baumstown
Sex and Age in Baumstown
The most populous age groups in Baumstown are 55 to 59 Years (23 | 34.3%) for men and 55 to 59 Years (32 | 31.7%) for women.
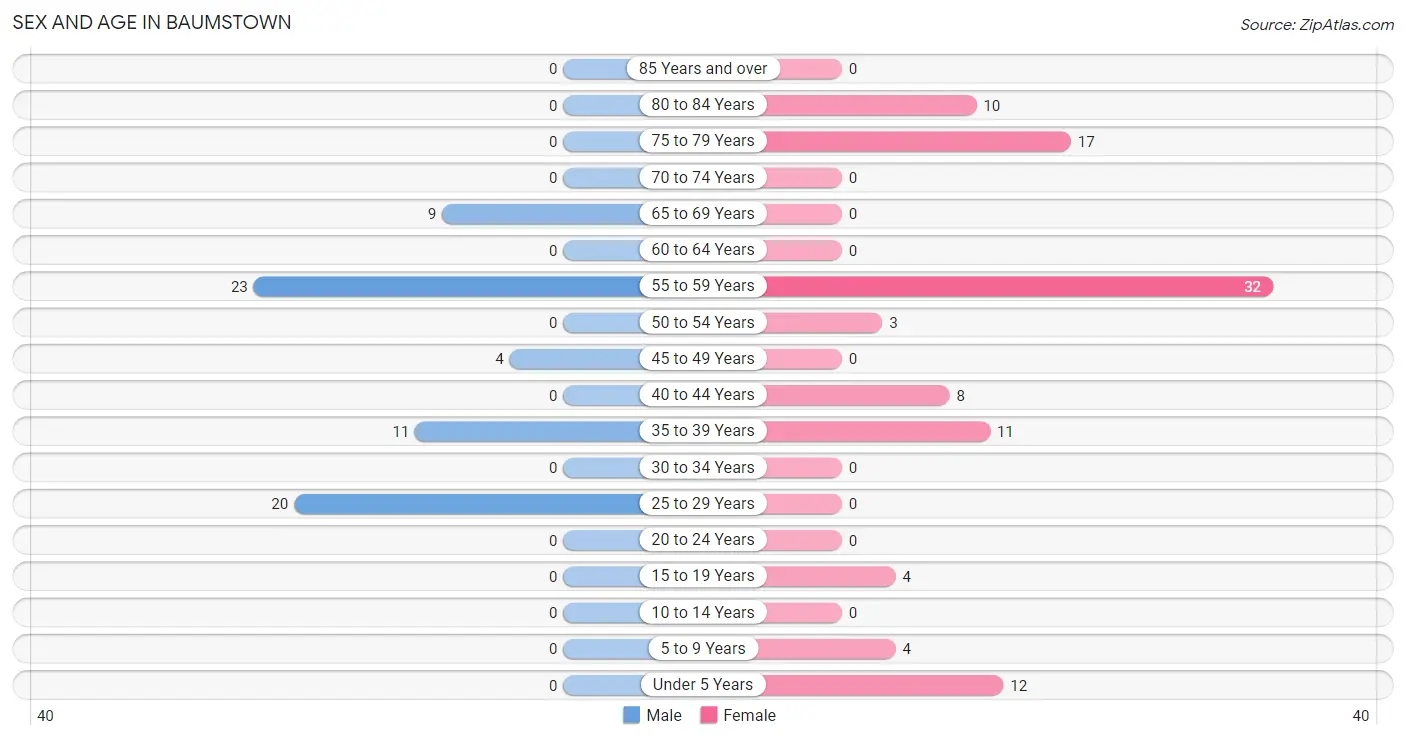
| Age Bracket | Male | Female |
| Under 5 Years | 0 (0.0%) | 12 (11.9%) |
| 5 to 9 Years | 0 (0.0%) | 4 (4.0%) |
| 10 to 14 Years | 0 (0.0%) | 0 (0.0%) |
| 15 to 19 Years | 0 (0.0%) | 4 (4.0%) |
| 20 to 24 Years | 0 (0.0%) | 0 (0.0%) |
| 25 to 29 Years | 20 (29.8%) | 0 (0.0%) |
| 30 to 34 Years | 0 (0.0%) | 0 (0.0%) |
| 35 to 39 Years | 11 (16.4%) | 11 (10.9%) |
| 40 to 44 Years | 0 (0.0%) | 8 (7.9%) |
| 45 to 49 Years | 4 (6.0%) | 0 (0.0%) |
| 50 to 54 Years | 0 (0.0%) | 3 (3.0%) |
| 55 to 59 Years | 23 (34.3%) | 32 (31.7%) |
| 60 to 64 Years | 0 (0.0%) | 0 (0.0%) |
| 65 to 69 Years | 9 (13.4%) | 0 (0.0%) |
| 70 to 74 Years | 0 (0.0%) | 0 (0.0%) |
| 75 to 79 Years | 0 (0.0%) | 17 (16.8%) |
| 80 to 84 Years | 0 (0.0%) | 10 (9.9%) |
| 85 Years and over | 0 (0.0%) | 0 (0.0%) |
| Total | 67 (100.0%) | 101 (100.0%) |
Families and Households in Baumstown
Median Family Size in Baumstown
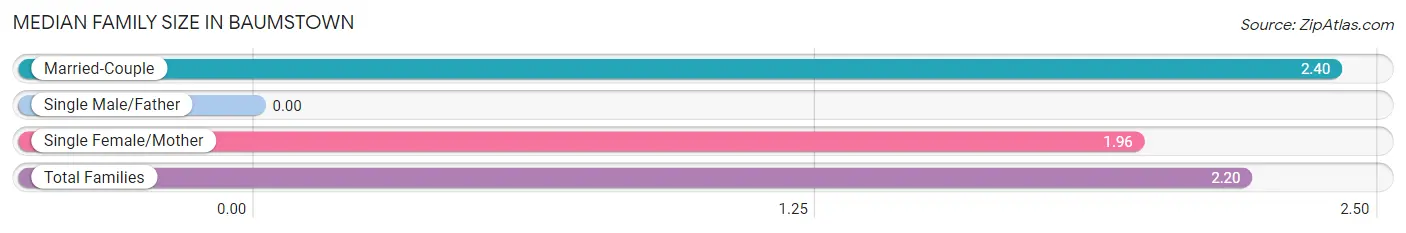
| Family Type | # Families | Family Size |
| Married-Couple | 30 (54.5%) | 2.40 |
| Single Male/Father | 0 (0.0%) | - |
| Single Female/Mother | 25 (45.5%) | 1.96 |
| Total Families | 55 (100.0%) | 2.20 |
Median Household Size in Baumstown
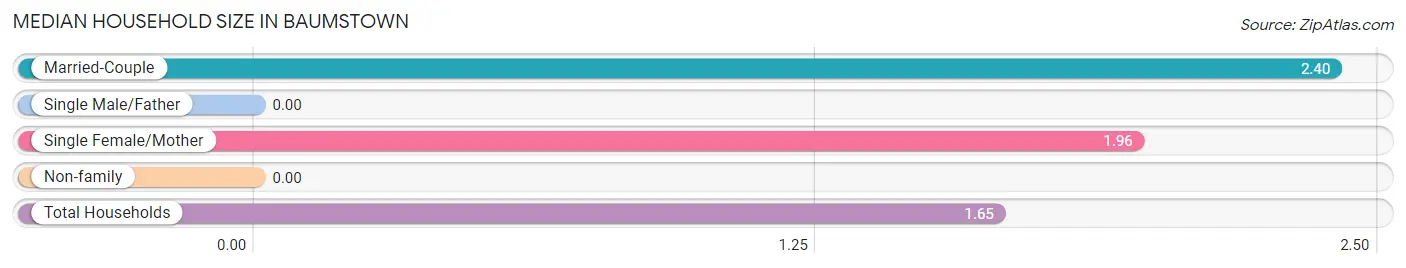
| Household Type | # Households | Household Size |
| Married-Couple | 30 (29.4%) | 2.40 |
| Single Male/Father | 0 (0.0%) | - |
| Single Female/Mother | 25 (24.5%) | 1.96 |
| Non-family | 47 (46.1%) | - |
| Total Households | 102 (100.0%) | 1.65 |
Household Size by Marriage Status in Baumstown
Out of a total of 102 households in Baumstown, 55 (53.9%) are family households, while 47 (46.1%) are nonfamily households. The most numerous type of family households are 2-person households, comprising 40, and the most common type of nonfamily households are 1-person households, comprising 47.
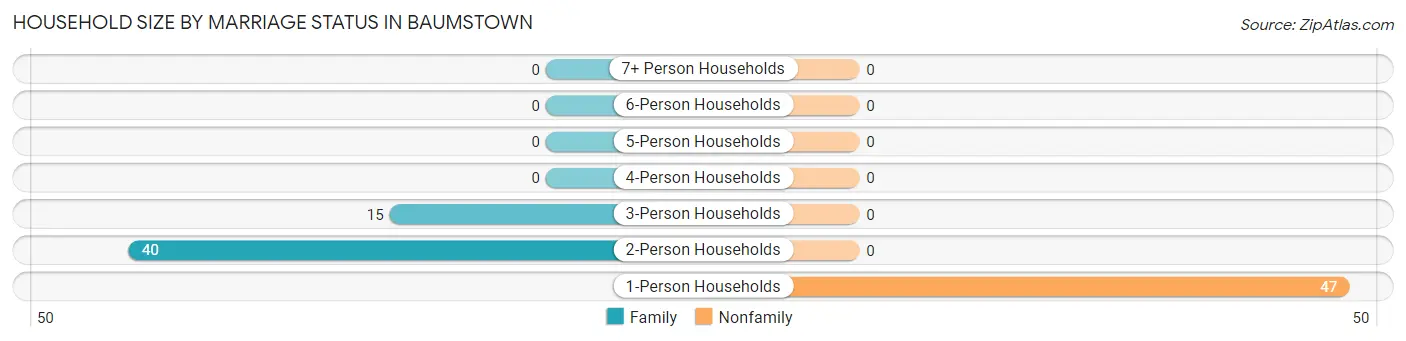
| Household Size | Family Households | Nonfamily Households |
| 1-Person Households | - | 47 (46.1%) |
| 2-Person Households | 40 (39.2%) | 0 (0.0%) |
| 3-Person Households | 15 (14.7%) | 0 (0.0%) |
| 4-Person Households | 0 (0.0%) | 0 (0.0%) |
| 5-Person Households | 0 (0.0%) | 0 (0.0%) |
| 6-Person Households | 0 (0.0%) | 0 (0.0%) |
| 7+ Person Households | 0 (0.0%) | 0 (0.0%) |
| Total | 55 (53.9%) | 47 (46.1%) |
Female Fertility in Baumstown
Fertility by Age in Baumstown
| Age Bracket | Women with Births | Births / 1,000 Women |
| 15 to 19 years | 0 (0.0%) | 0.0 |
| 20 to 34 years | 0 (0.0%) | 0.0 |
| 35 to 50 years | 0 (0.0%) | 0.0 |
| Total | 0 (0.0%) | 0.0 |
Fertility by Age by Marriage Status in Baumstown
| Age Bracket | Married | Unmarried |
| 15 to 19 years | 0 (0.0%) | 0 (0.0%) |
| 20 to 34 years | 0 (0.0%) | 0 (0.0%) |
| 35 to 50 years | 0 (0.0%) | 0 (0.0%) |
| Total | 0 (0.0%) | 0 (0.0%) |
Fertility by Education in Baumstown
| Educational Attainment | Women with Births | Births / 1,000 Women |
| Less than High School | 0 (0.0%) | 0.0 |
| High School Diploma | 0 (0.0%) | 0.0 |
| College or Associate's Degree | 0 (0.0%) | 0.0 |
| Bachelor's Degree | 0 (0.0%) | 0.0 |
| Graduate Degree | 0 (0.0%) | 0.0 |
| Total | 0 (0.0%) | 0.0 |
Fertility by Education by Marriage Status in Baumstown
| Educational Attainment | Married | Unmarried |
| Less than High School | 0 (0.0%) | 0 (0.0%) |
| High School Diploma | 0 (0.0%) | 0 (0.0%) |
| College or Associate's Degree | 0 (0.0%) | 0 (0.0%) |
| Bachelor's Degree | 0 (0.0%) | 0 (0.0%) |
| Graduate Degree | 0 (0.0%) | 0 (0.0%) |
| Total | 0 (0.0%) | 0 (0.0%) |
Employment Characteristics in Baumstown
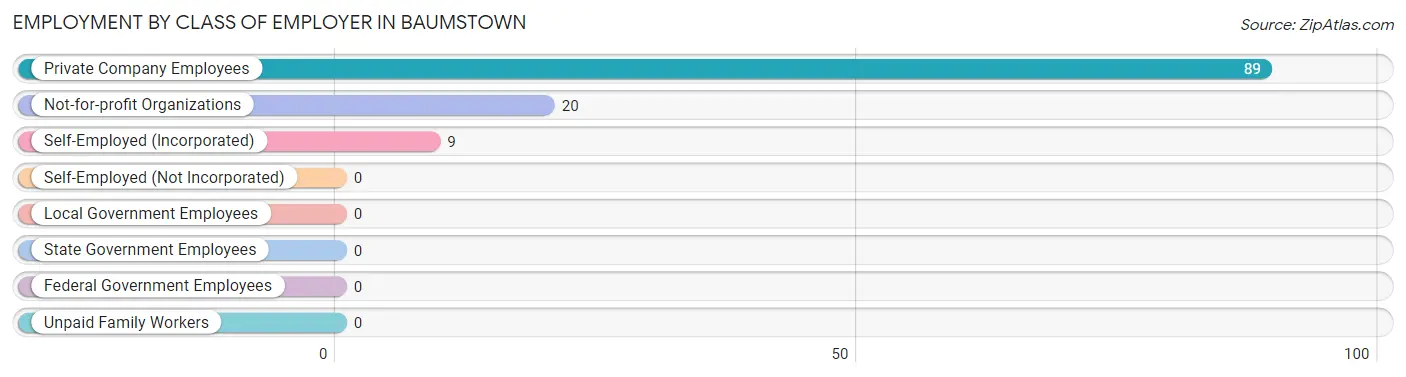
Employment by Class of Employer in Baumstown
Among the 118 employed individuals in Baumstown, private company employees (89 | 75.4%), not-for-profit organizations (20 | 17.0%), and self-employed (incorporated) (9 | 7.6%) make up the most common classes of employment.
| Employer Class | # Employees | % Employees |
| Private Company Employees | 89 | 75.4% |
| Self-Employed (Incorporated) | 9 | 7.6% |
| Self-Employed (Not Incorporated) | 0 | 0.0% |
| Not-for-profit Organizations | 20 | 17.0% |
| Local Government Employees | 0 | 0.0% |
| State Government Employees | 0 | 0.0% |
| Federal Government Employees | 0 | 0.0% |
| Unpaid Family Workers | 0 | 0.0% |
| Total | 118 | 100.0% |
Employment Status by Age in Baumstown
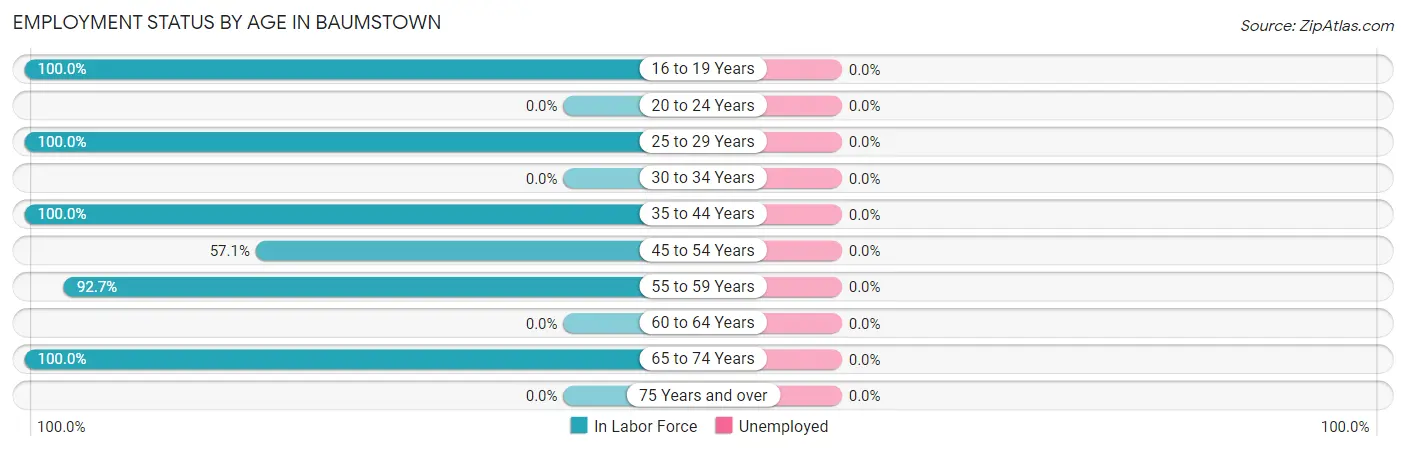
| Age Bracket | In Labor Force | Unemployed |
| 16 to 19 Years | 4 (100.0%) | 0 (0.0%) |
| 20 to 24 Years | 0 (0.0%) | 0 (0.0%) |
| 25 to 29 Years | 20 (100.0%) | 0 (0.0%) |
| 30 to 34 Years | 0 (0.0%) | 0 (0.0%) |
| 35 to 44 Years | 30 (100.0%) | 0 (0.0%) |
| 45 to 54 Years | 4 (57.1%) | 0 (0.0%) |
| 55 to 59 Years | 51 (92.7%) | 0 (0.0%) |
| 60 to 64 Years | 0 (0.0%) | 0 (0.0%) |
| 65 to 74 Years | 9 (100.0%) | 0 (0.0%) |
| 75 Years and over | 0 (0.0%) | 0 (0.0%) |
| Total | 118 (77.6%) | 0 (0.0%) |
Employment Status by Educational Attainment in Baumstown
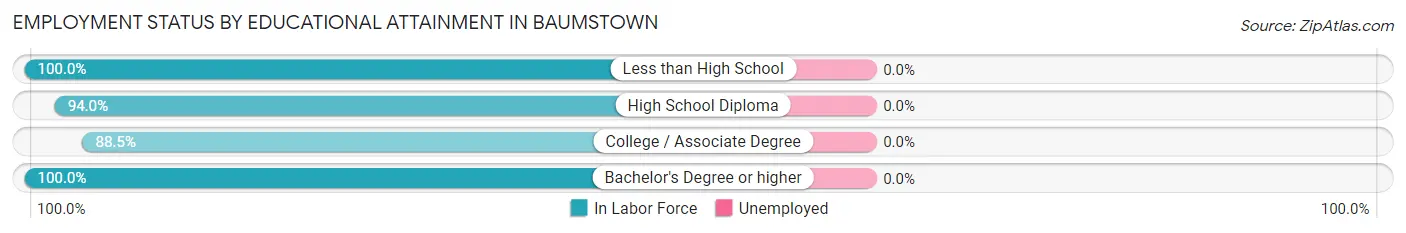
| Educational Attainment | In Labor Force | Unemployed |
| Less than High School | 15 (100.0%) | 0 (0.0%) |
| High School Diploma | 63 (94.0%) | 0 (0.0%) |
| College / Associate Degree | 23 (88.5%) | 0 (0.0%) |
| Bachelor's Degree or higher | 4 (100.0%) | 0 (0.0%) |
| Total | 105 (93.8%) | 0 (0.0%) |
Employment Occupations by Sex in Baumstown
Management, Business, Science and Arts Occupations
The most common Management, Business, Science and Arts occupations in Baumstown are Computers, Engineering & Science (4 | 3.4%), and Computers & Mathematics (4 | 3.4%).
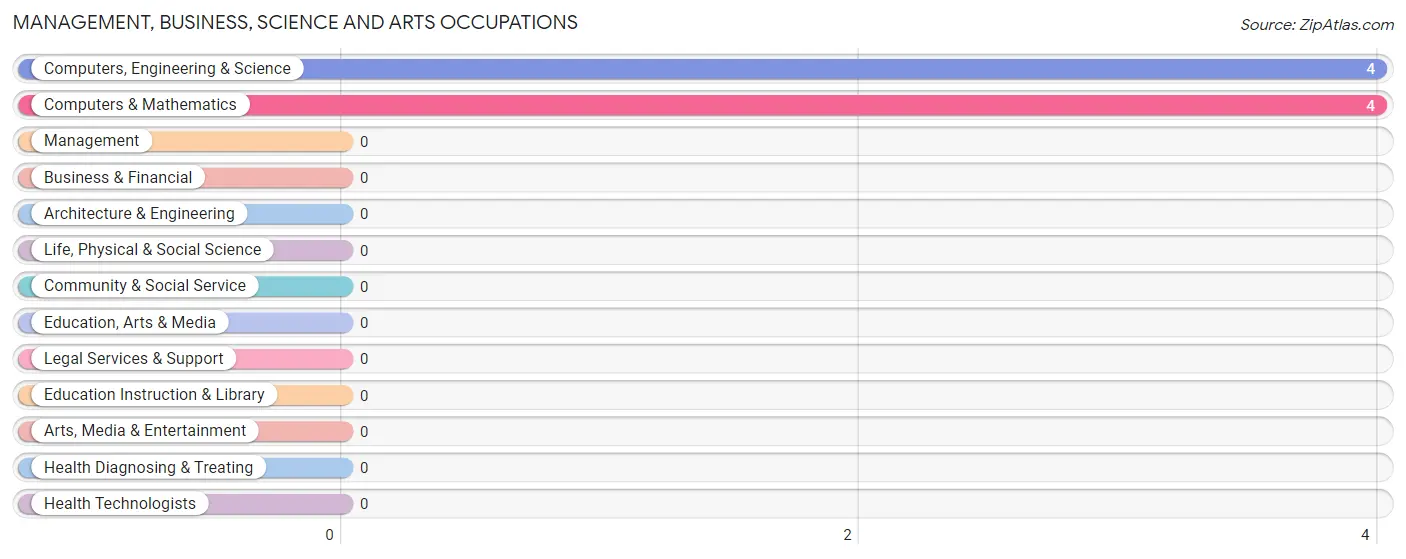
Management, Business, Science and Arts Occupations by Sex
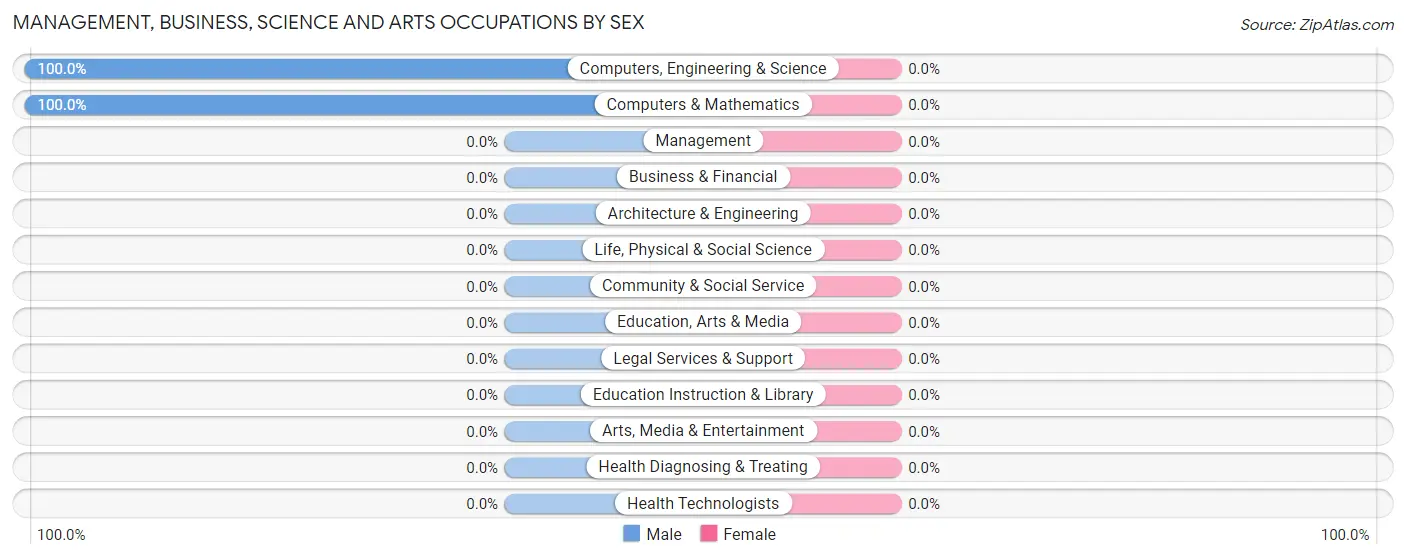
| Occupation | Male | Female |
| Management | 0 (0.0%) | 0 (0.0%) |
| Business & Financial | 0 (0.0%) | 0 (0.0%) |
| Computers, Engineering & Science | 4 (100.0%) | 0 (0.0%) |
| Computers & Mathematics | 4 (100.0%) | 0 (0.0%) |
| Architecture & Engineering | 0 (0.0%) | 0 (0.0%) |
| Life, Physical & Social Science | 0 (0.0%) | 0 (0.0%) |
| Community & Social Service | 0 (0.0%) | 0 (0.0%) |
| Education, Arts & Media | 0 (0.0%) | 0 (0.0%) |
| Legal Services & Support | 0 (0.0%) | 0 (0.0%) |
| Education Instruction & Library | 0 (0.0%) | 0 (0.0%) |
| Arts, Media & Entertainment | 0 (0.0%) | 0 (0.0%) |
| Health Diagnosing & Treating | 0 (0.0%) | 0 (0.0%) |
| Health Technologists | 0 (0.0%) | 0 (0.0%) |
| Total (Category) | 4 (100.0%) | 0 (0.0%) |
| Total (Overall) | 63 (53.4%) | 55 (46.6%) |
Services Occupations
The most common Services occupations in Baumstown are Personal Care & Service (11 | 9.3%), and Food Preparation & Serving (8 | 6.8%).
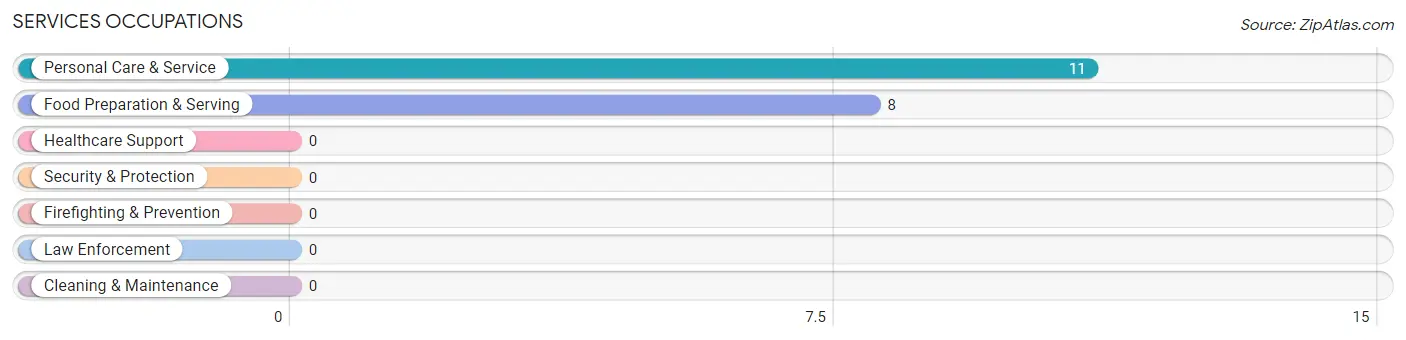
Services Occupations by Sex
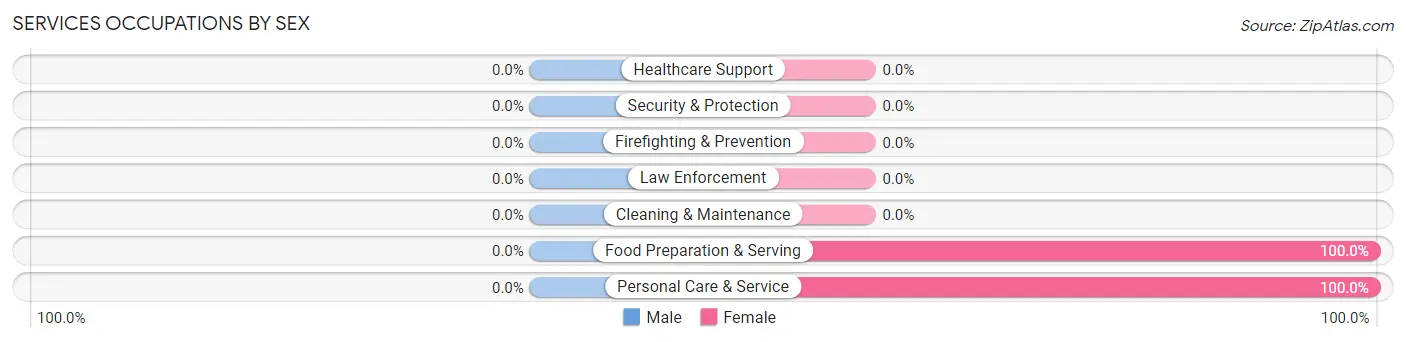
| Occupation | Male | Female |
| Healthcare Support | 0 (0.0%) | 0 (0.0%) |
| Security & Protection | 0 (0.0%) | 0 (0.0%) |
| Firefighting & Prevention | 0 (0.0%) | 0 (0.0%) |
| Law Enforcement | 0 (0.0%) | 0 (0.0%) |
| Food Preparation & Serving | 0 (0.0%) | 8 (100.0%) |
| Cleaning & Maintenance | 0 (0.0%) | 0 (0.0%) |
| Personal Care & Service | 0 (0.0%) | 11 (100.0%) |
| Total (Category) | 0 (0.0%) | 19 (100.0%) |
| Total (Overall) | 63 (53.4%) | 55 (46.6%) |
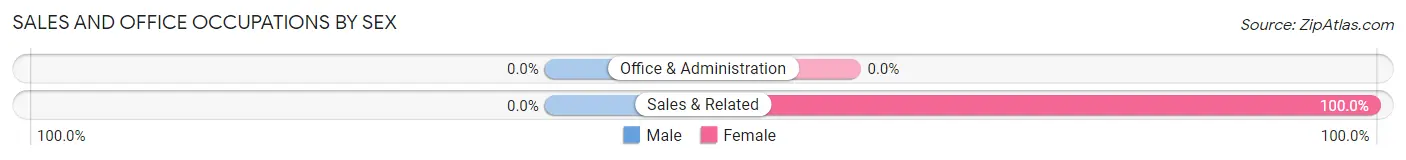
Sales and Office Occupations
The most common Sales and Office occupations in Baumstown are , and Sales & Related (4 | 3.4%).
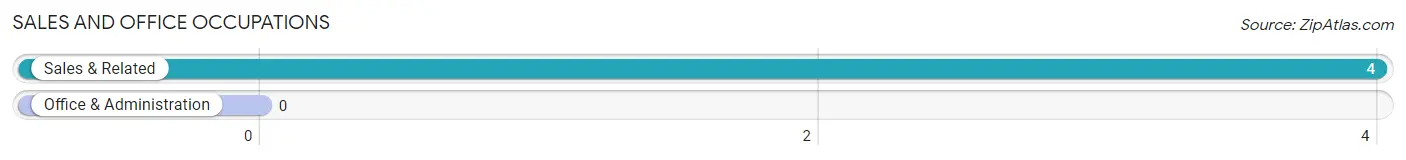
Sales and Office Occupations by Sex
| Occupation | Male | Female |
| Sales & Related | 0 (0.0%) | 4 (100.0%) |
| Office & Administration | 0 (0.0%) | 0 (0.0%) |
| Total (Category) | 0 (0.0%) | 4 (100.0%) |
| Total (Overall) | 63 (53.4%) | 55 (46.6%) |
Natural Resources, Construction and Maintenance Occupations
The most common Natural Resources, Construction and Maintenance occupations in Baumstown are , and Construction & Extraction (11 | 9.3%).
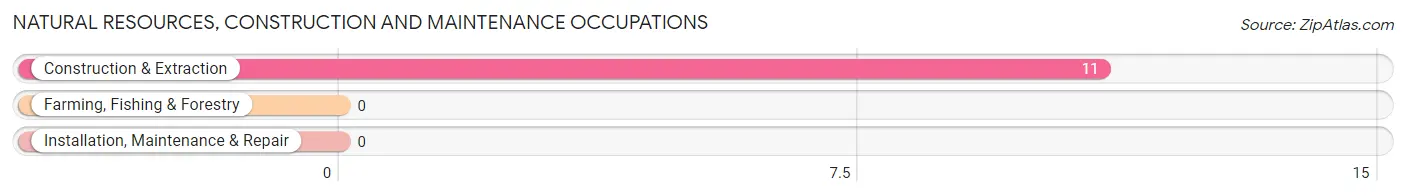
Natural Resources, Construction and Maintenance Occupations by Sex
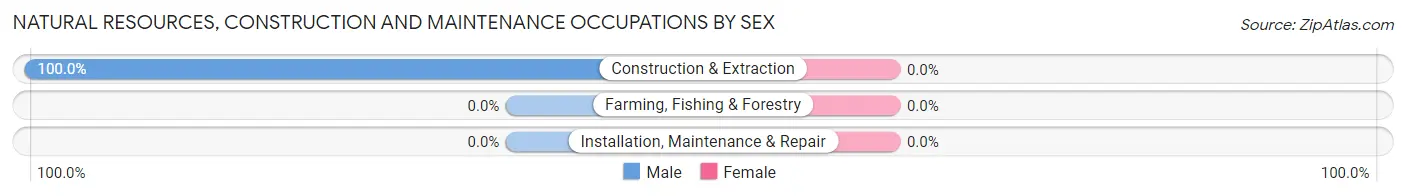
| Occupation | Male | Female |
| Farming, Fishing & Forestry | 0 (0.0%) | 0 (0.0%) |
| Construction & Extraction | 11 (100.0%) | 0 (0.0%) |
| Installation, Maintenance & Repair | 0 (0.0%) | 0 (0.0%) |
| Total (Category) | 11 (100.0%) | 0 (0.0%) |
| Total (Overall) | 63 (53.4%) | 55 (46.6%) |
Production, Transportation and Moving Occupations
The most common Production, Transportation and Moving occupations in Baumstown are Production (41 | 34.7%), Material Moving (24 | 20.3%), and Transportation (15 | 12.7%).
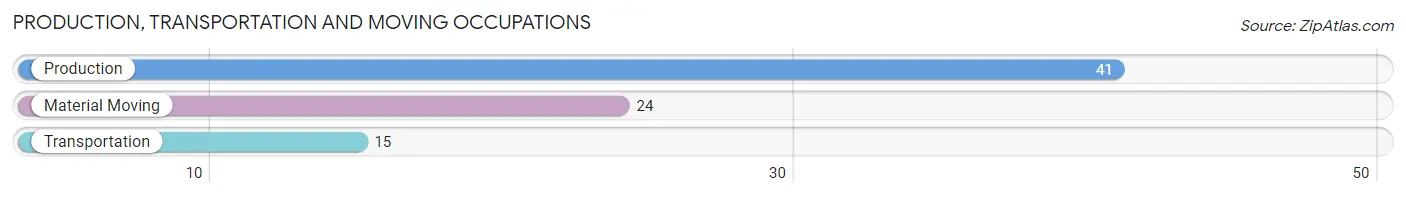
Production, Transportation and Moving Occupations by Sex
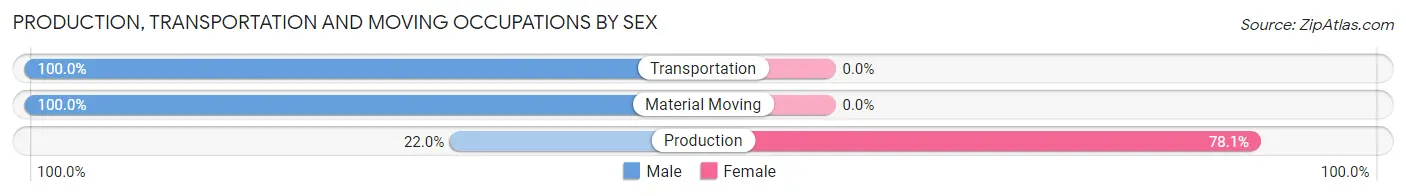
| Occupation | Male | Female |
| Production | 9 (22.0%) | 32 (78.0%) |
| Transportation | 15 (100.0%) | 0 (0.0%) |
| Material Moving | 24 (100.0%) | 0 (0.0%) |
| Total (Category) | 48 (60.0%) | 32 (40.0%) |
| Total (Overall) | 63 (53.4%) | 55 (46.6%) |
Employment Industries by Sex in Baumstown
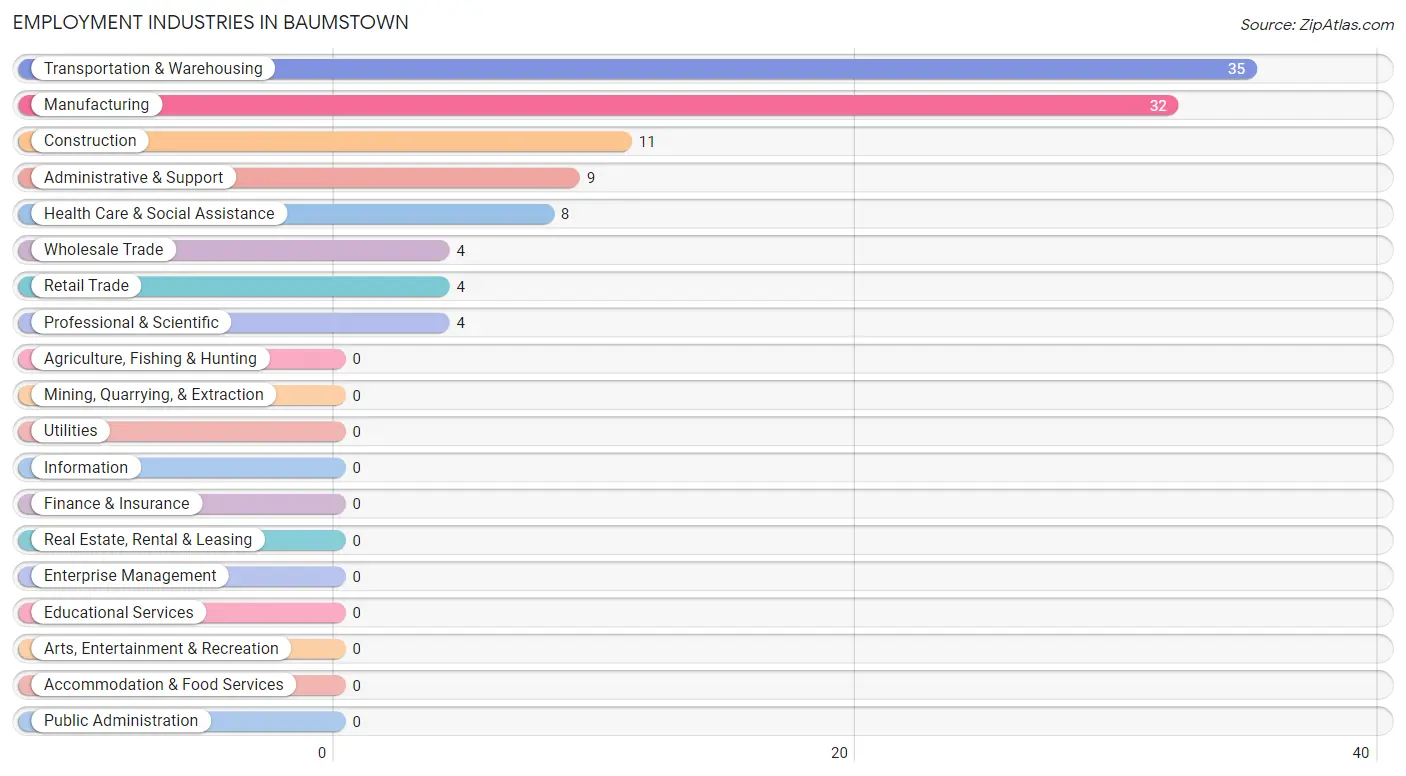
Employment Industries in Baumstown
The major employment industries in Baumstown include Transportation & Warehousing (35 | 29.7%), Manufacturing (32 | 27.1%), Construction (11 | 9.3%), Administrative & Support (9 | 7.6%), and Health Care & Social Assistance (8 | 6.8%).
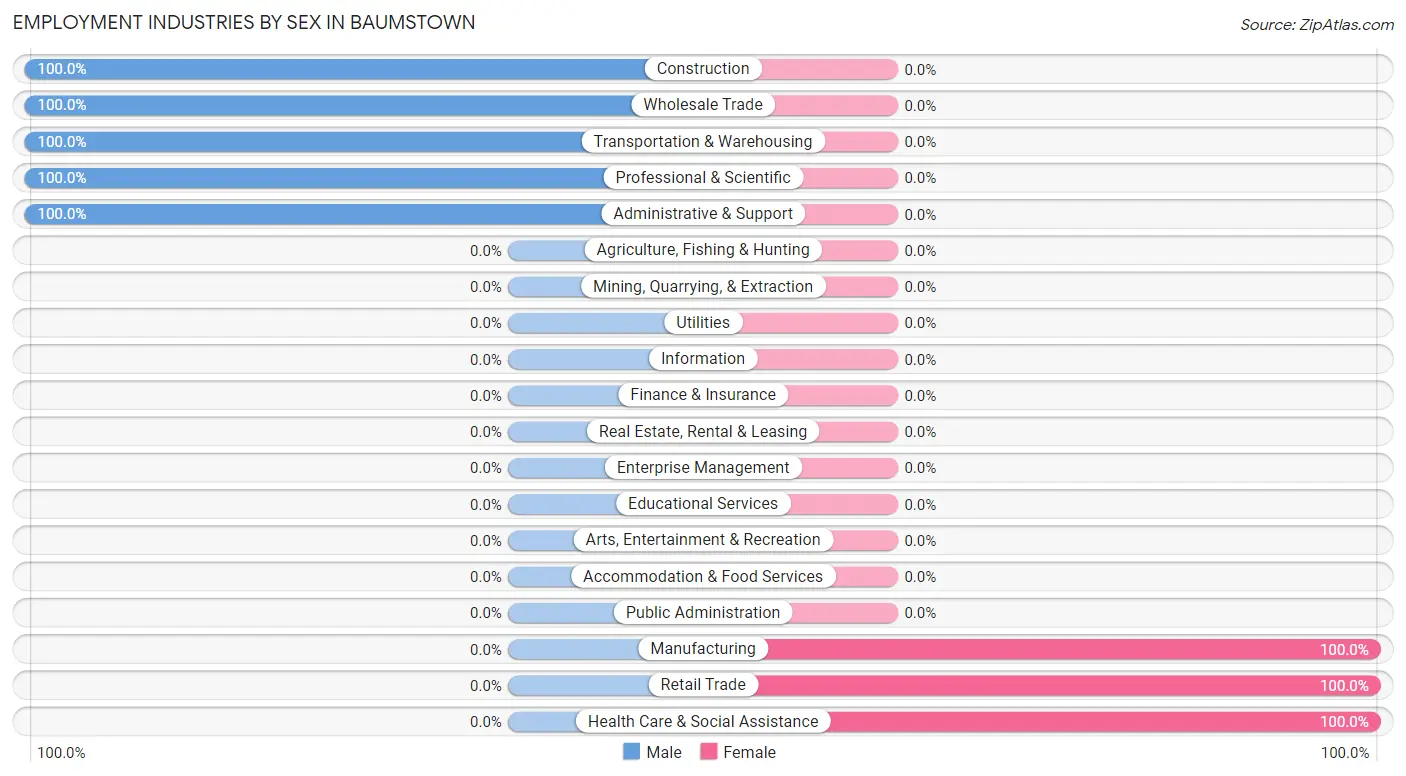
Employment Industries by Sex in Baumstown
The Baumstown industries that see more men than women are Construction (100.0%), Wholesale Trade (100.0%), and Transportation & Warehousing (100.0%), whereas the industries that tend to have a higher number of women are Manufacturing (100.0%), Retail Trade (100.0%), and Health Care & Social Assistance (100.0%).
| Industry | Male | Female |
| Agriculture, Fishing & Hunting | 0 (0.0%) | 0 (0.0%) |
| Mining, Quarrying, & Extraction | 0 (0.0%) | 0 (0.0%) |
| Construction | 11 (100.0%) | 0 (0.0%) |
| Manufacturing | 0 (0.0%) | 32 (100.0%) |
| Wholesale Trade | 4 (100.0%) | 0 (0.0%) |
| Retail Trade | 0 (0.0%) | 4 (100.0%) |
| Transportation & Warehousing | 35 (100.0%) | 0 (0.0%) |
| Utilities | 0 (0.0%) | 0 (0.0%) |
| Information | 0 (0.0%) | 0 (0.0%) |
| Finance & Insurance | 0 (0.0%) | 0 (0.0%) |
| Real Estate, Rental & Leasing | 0 (0.0%) | 0 (0.0%) |
| Professional & Scientific | 4 (100.0%) | 0 (0.0%) |
| Enterprise Management | 0 (0.0%) | 0 (0.0%) |
| Administrative & Support | 9 (100.0%) | 0 (0.0%) |
| Educational Services | 0 (0.0%) | 0 (0.0%) |
| Health Care & Social Assistance | 0 (0.0%) | 8 (100.0%) |
| Arts, Entertainment & Recreation | 0 (0.0%) | 0 (0.0%) |
| Accommodation & Food Services | 0 (0.0%) | 0 (0.0%) |
| Public Administration | 0 (0.0%) | 0 (0.0%) |
| Total | 63 (53.4%) | 55 (46.6%) |
Education in Baumstown
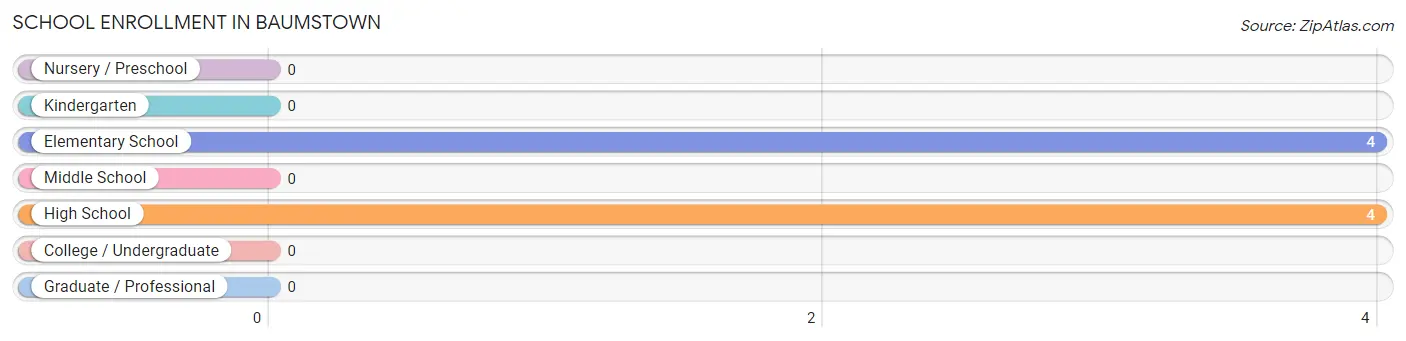
School Enrollment in Baumstown
The most common levels of schooling among the 8 students in Baumstown are elementary school (4 | 50.0%), and high school (4 | 50.0%).
| School Level | # Students | % Students |
| Nursery / Preschool | 0 | 0.0% |
| Kindergarten | 0 | 0.0% |
| Elementary School | 4 | 50.0% |
| Middle School | 0 | 0.0% |
| High School | 4 | 50.0% |
| College / Undergraduate | 0 | 0.0% |
| Graduate / Professional | 0 | 0.0% |
| Total | 8 | 100.0% |
School Enrollment by Age by Funding Source in Baumstown
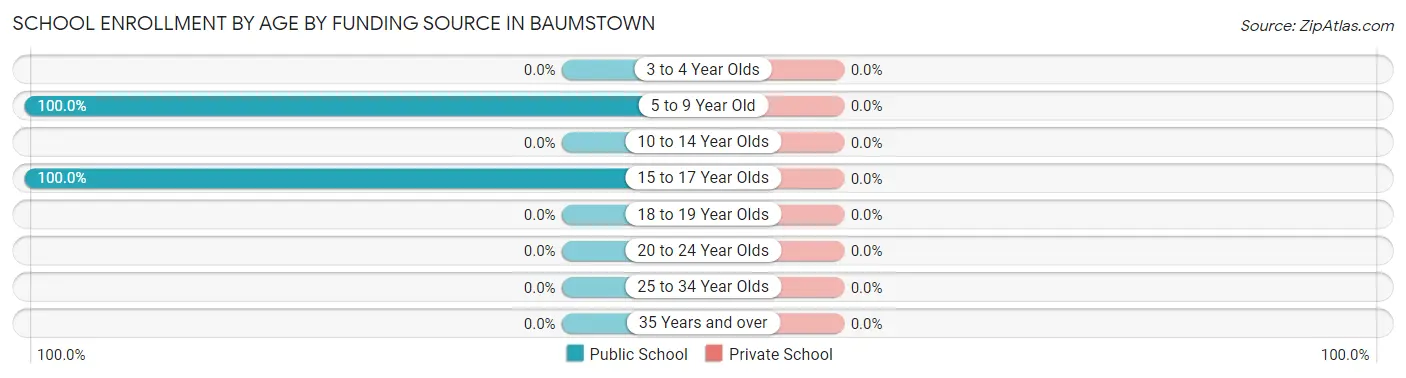
| Age Bracket | Public School | Private School |
| 3 to 4 Year Olds | 0 (0.0%) | 0 (0.0%) |
| 5 to 9 Year Old | 4 (100.0%) | 0 (0.0%) |
| 10 to 14 Year Olds | 0 (0.0%) | 0 (0.0%) |
| 15 to 17 Year Olds | 4 (100.0%) | 0 (0.0%) |
| 18 to 19 Year Olds | 0 (0.0%) | 0 (0.0%) |
| 20 to 24 Year Olds | 0 (0.0%) | 0 (0.0%) |
| 25 to 34 Year Olds | 0 (0.0%) | 0 (0.0%) |
| 35 Years and over | 0 (0.0%) | 0 (0.0%) |
| Total | 8 (100.0%) | 0 (0.0%) |
Educational Attainment by Field of Study in Baumstown
, and science & technology (4 | 100.0%) are the most common fields of study among 4 individuals in Baumstown who have obtained a bachelor's degree or higher.
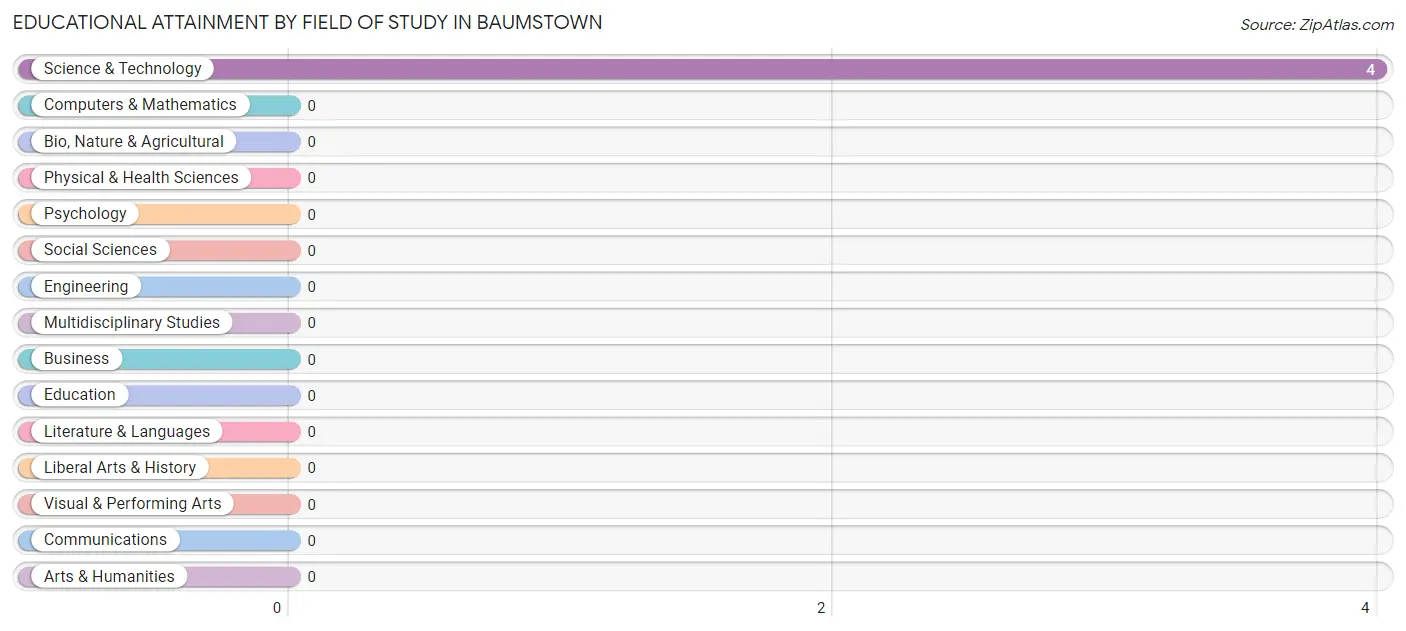
| Field of Study | # Graduates | % Graduates |
| Computers & Mathematics | 0 | 0.0% |
| Bio, Nature & Agricultural | 0 | 0.0% |
| Physical & Health Sciences | 0 | 0.0% |
| Psychology | 0 | 0.0% |
| Social Sciences | 0 | 0.0% |
| Engineering | 0 | 0.0% |
| Multidisciplinary Studies | 0 | 0.0% |
| Science & Technology | 4 | 100.0% |
| Business | 0 | 0.0% |
| Education | 0 | 0.0% |
| Literature & Languages | 0 | 0.0% |
| Liberal Arts & History | 0 | 0.0% |
| Visual & Performing Arts | 0 | 0.0% |
| Communications | 0 | 0.0% |
| Arts & Humanities | 0 | 0.0% |
| Total | 4 | 100.0% |
Transportation & Commute in Baumstown
Vehicle Availability by Sex in Baumstown
The most prevalent vehicle ownership categories in Baumstown are males with no vehicle (20, accounting for 31.8%) and females with no vehicle (0, making up 36.4%).
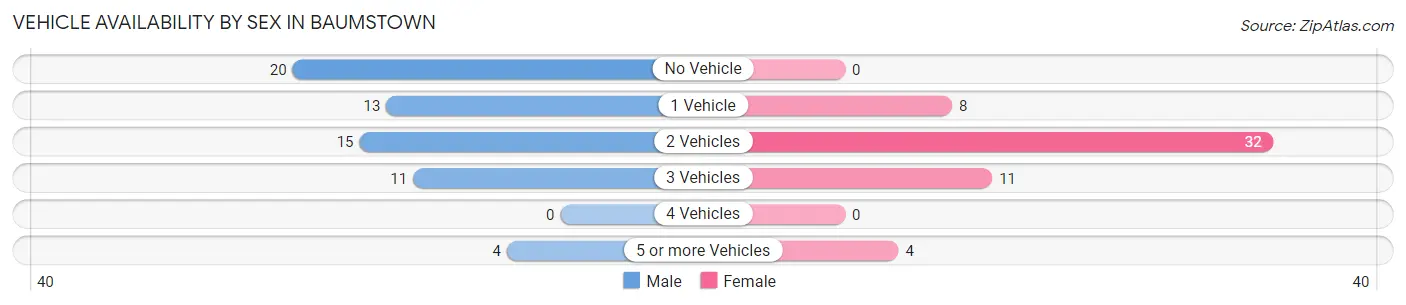
| Vehicles Available | Male | Female |
| No Vehicle | 20 (31.8%) | 0 (0.0%) |
| 1 Vehicle | 13 (20.6%) | 8 (14.5%) |
| 2 Vehicles | 15 (23.8%) | 32 (58.2%) |
| 3 Vehicles | 11 (17.5%) | 11 (20.0%) |
| 4 Vehicles | 0 (0.0%) | 0 (0.0%) |
| 5 or more Vehicles | 4 (6.4%) | 4 (7.3%) |
| Total | 63 (100.0%) | 55 (100.0%) |
Commute Time in Baumstown
The most frequently occuring commute durations in Baumstown are 20 to 24 minutes (36 commuters, 31.6%), 25 to 29 minutes (28 commuters, 24.6%), and 10 to 14 minutes (15 commuters, 13.2%).
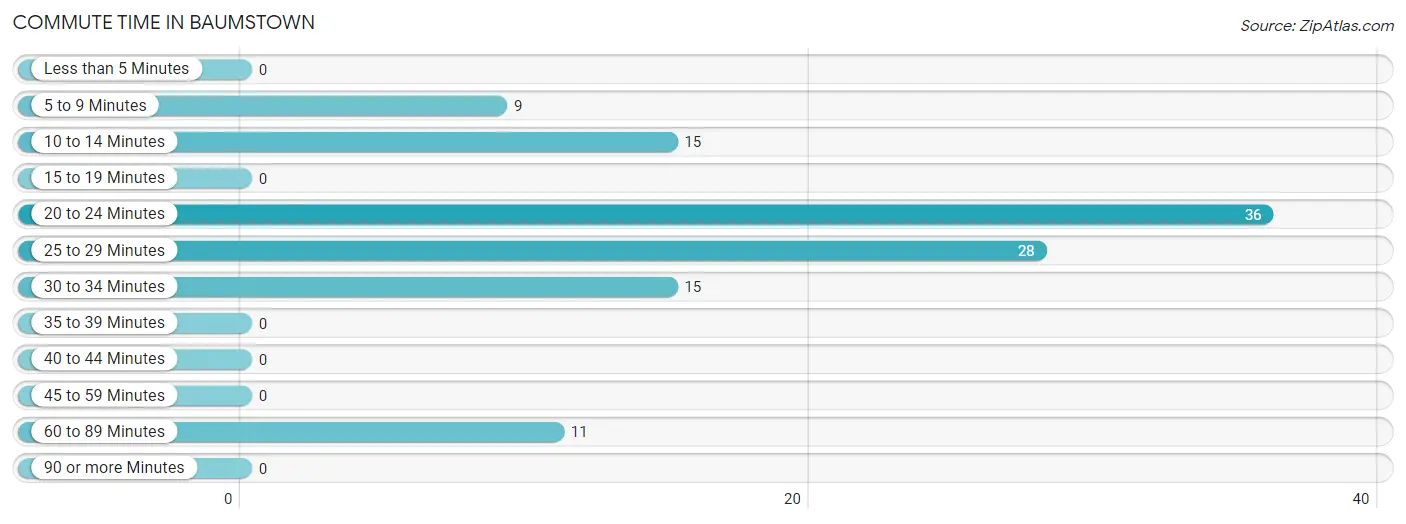
| Commute Time | # Commuters | % Commuters |
| Less than 5 Minutes | 0 | 0.0% |
| 5 to 9 Minutes | 9 | 7.9% |
| 10 to 14 Minutes | 15 | 13.2% |
| 15 to 19 Minutes | 0 | 0.0% |
| 20 to 24 Minutes | 36 | 31.6% |
| 25 to 29 Minutes | 28 | 24.6% |
| 30 to 34 Minutes | 15 | 13.2% |
| 35 to 39 Minutes | 0 | 0.0% |
| 40 to 44 Minutes | 0 | 0.0% |
| 45 to 59 Minutes | 0 | 0.0% |
| 60 to 89 Minutes | 11 | 9.7% |
| 90 or more Minutes | 0 | 0.0% |
Commute Time by Sex in Baumstown
The most common commute times in Baumstown are 25 to 29 minutes (20 commuters, 33.9%) for males and 20 to 24 minutes (32 commuters, 58.2%) for females.
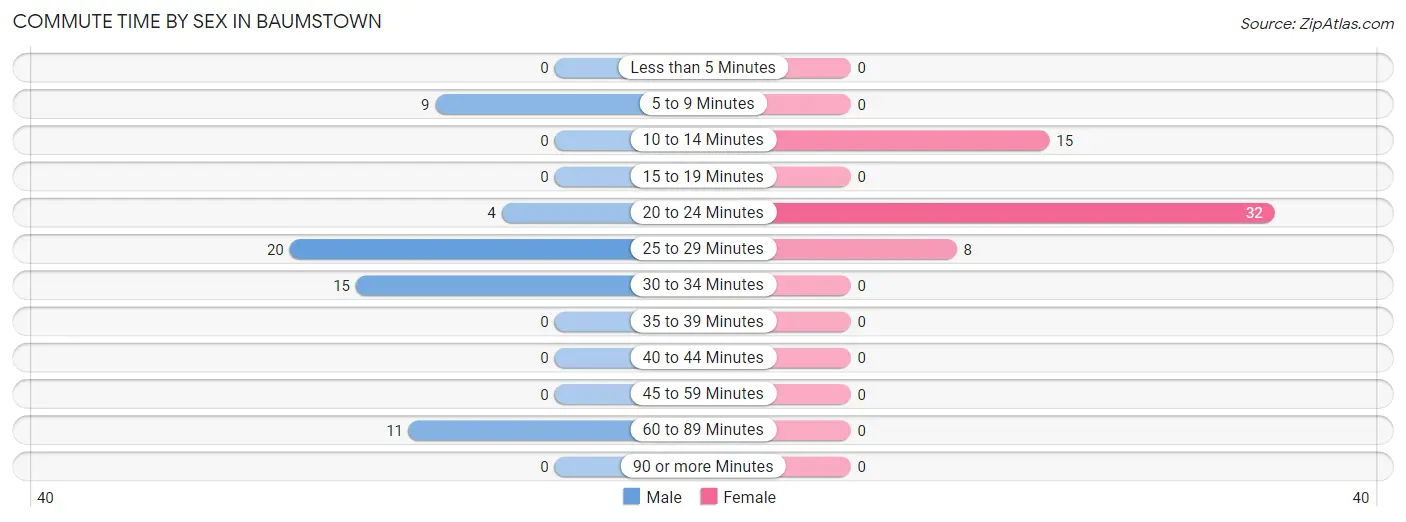
| Commute Time | Male | Female |
| Less than 5 Minutes | 0 (0.0%) | 0 (0.0%) |
| 5 to 9 Minutes | 9 (15.2%) | 0 (0.0%) |
| 10 to 14 Minutes | 0 (0.0%) | 15 (27.3%) |
| 15 to 19 Minutes | 0 (0.0%) | 0 (0.0%) |
| 20 to 24 Minutes | 4 (6.8%) | 32 (58.2%) |
| 25 to 29 Minutes | 20 (33.9%) | 8 (14.5%) |
| 30 to 34 Minutes | 15 (25.4%) | 0 (0.0%) |
| 35 to 39 Minutes | 0 (0.0%) | 0 (0.0%) |
| 40 to 44 Minutes | 0 (0.0%) | 0 (0.0%) |
| 45 to 59 Minutes | 0 (0.0%) | 0 (0.0%) |
| 60 to 89 Minutes | 11 (18.6%) | 0 (0.0%) |
| 90 or more Minutes | 0 (0.0%) | 0 (0.0%) |
Time of Departure to Work by Sex in Baumstown
The most frequent times of departure to work in Baumstown are 5:00 AM to 5:29 AM (20, 33.9%) for males and 12:00 AM to 4:59 AM (20, 36.4%) for females.
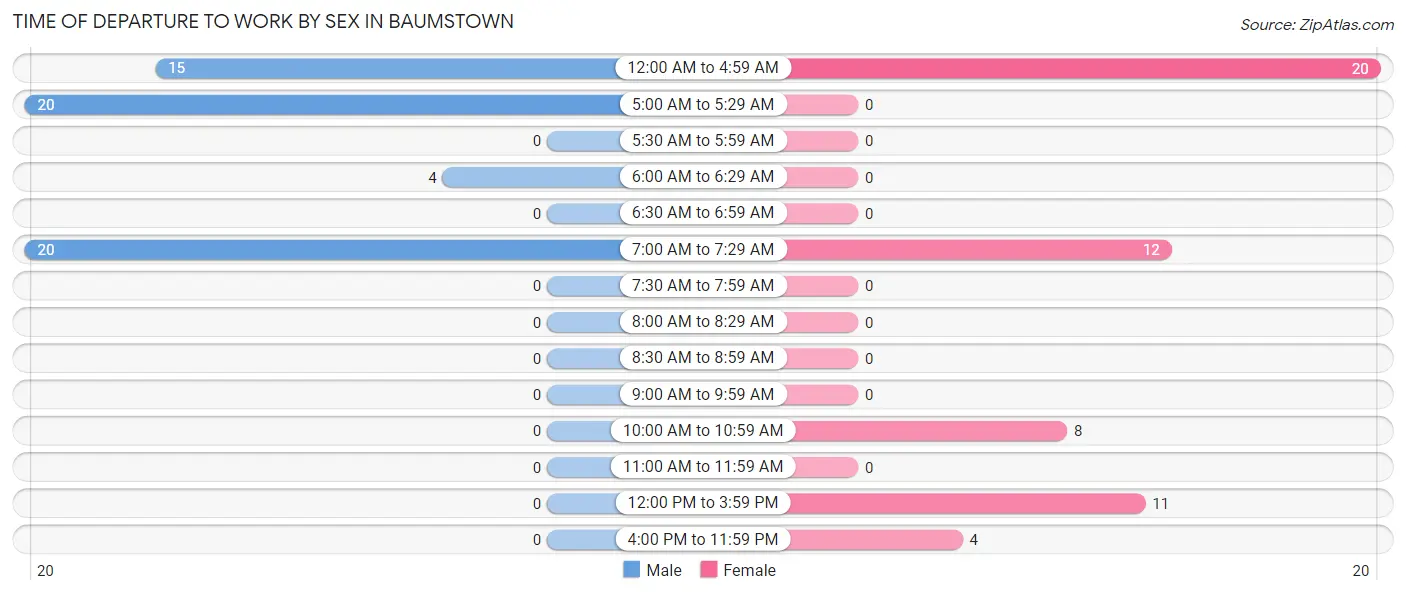
| Time of Departure | Male | Female |
| 12:00 AM to 4:59 AM | 15 (25.4%) | 20 (36.4%) |
| 5:00 AM to 5:29 AM | 20 (33.9%) | 0 (0.0%) |
| 5:30 AM to 5:59 AM | 0 (0.0%) | 0 (0.0%) |
| 6:00 AM to 6:29 AM | 4 (6.8%) | 0 (0.0%) |
| 6:30 AM to 6:59 AM | 0 (0.0%) | 0 (0.0%) |
| 7:00 AM to 7:29 AM | 20 (33.9%) | 12 (21.8%) |
| 7:30 AM to 7:59 AM | 0 (0.0%) | 0 (0.0%) |
| 8:00 AM to 8:29 AM | 0 (0.0%) | 0 (0.0%) |
| 8:30 AM to 8:59 AM | 0 (0.0%) | 0 (0.0%) |
| 9:00 AM to 9:59 AM | 0 (0.0%) | 0 (0.0%) |
| 10:00 AM to 10:59 AM | 0 (0.0%) | 8 (14.5%) |
| 11:00 AM to 11:59 AM | 0 (0.0%) | 0 (0.0%) |
| 12:00 PM to 3:59 PM | 0 (0.0%) | 11 (20.0%) |
| 4:00 PM to 11:59 PM | 0 (0.0%) | 4 (7.3%) |
| Total | 59 (100.0%) | 55 (100.0%) |
Housing Occupancy in Baumstown
Occupancy by Ownership in Baumstown
Of the total 102 dwellings in Baumstown, owner-occupied units account for 60 (58.8%), while renter-occupied units make up 42 (41.2%).
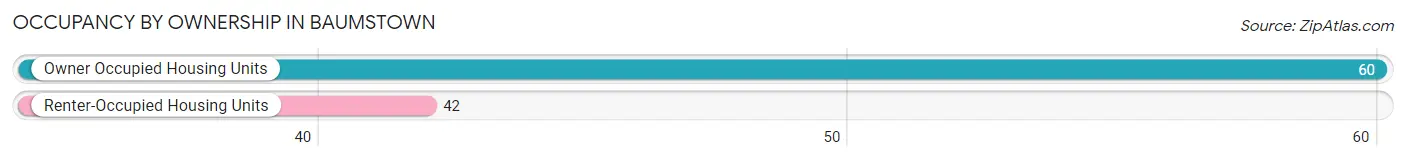
| Occupancy | # Housing Units | % Housing Units |
| Owner Occupied Housing Units | 60 | 58.8% |
| Renter-Occupied Housing Units | 42 | 41.2% |
| Total Occupied Housing Units | 102 | 100.0% |
Occupancy by Household Size in Baumstown
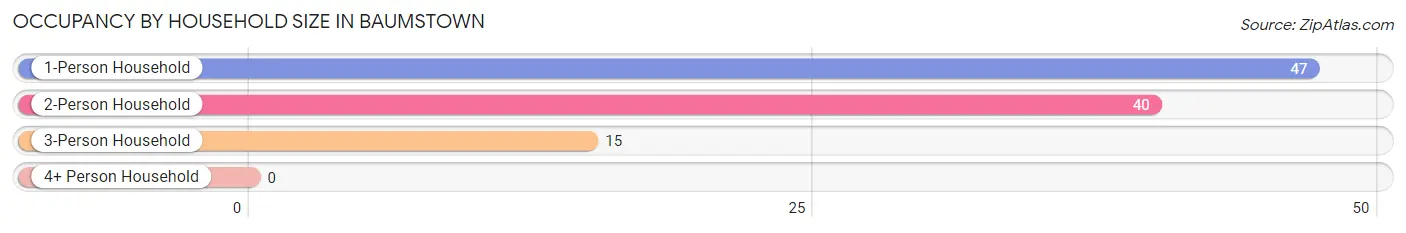
| Household Size | # Housing Units | % Housing Units |
| 1-Person Household | 47 | 46.1% |
| 2-Person Household | 40 | 39.2% |
| 3-Person Household | 15 | 14.7% |
| 4+ Person Household | 0 | 0.0% |
| Total Housing Units | 102 | 100.0% |
Occupancy by Ownership by Household Size in Baumstown
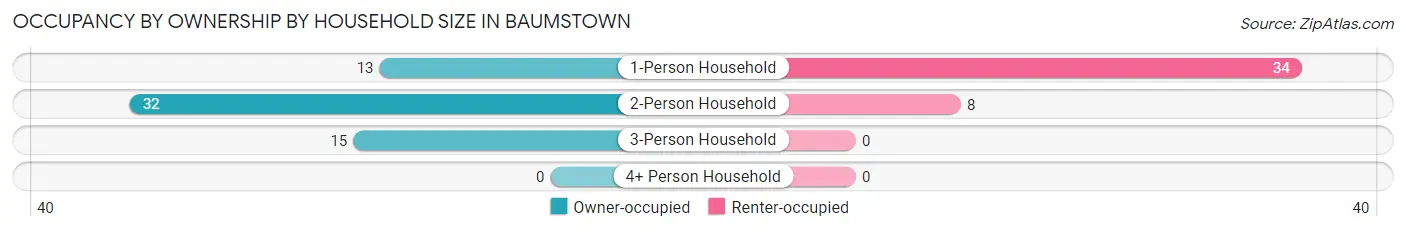
| Household Size | Owner-occupied | Renter-occupied |
| 1-Person Household | 13 (27.7%) | 34 (72.3%) |
| 2-Person Household | 32 (80.0%) | 8 (20.0%) |
| 3-Person Household | 15 (100.0%) | 0 (0.0%) |
| 4+ Person Household | 0 (0.0%) | 0 (0.0%) |
| Total Housing Units | 60 (58.8%) | 42 (41.2%) |
Occupancy by Educational Attainment in Baumstown
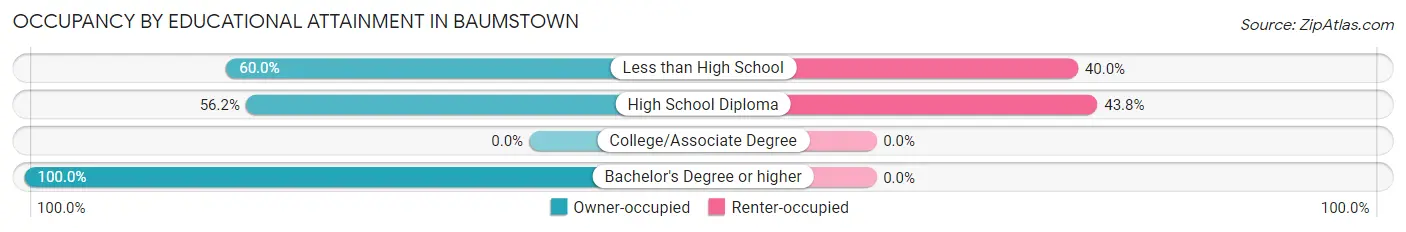
| Household Size | Owner-occupied | Renter-occupied |
| Less than High School | 15 (60.0%) | 10 (40.0%) |
| High School Diploma | 41 (56.2%) | 32 (43.8%) |
| College/Associate Degree | 0 (0.0%) | 0 (0.0%) |
| Bachelor's Degree or higher | 4 (100.0%) | 0 (0.0%) |
Occupancy by Age of Householder in Baumstown
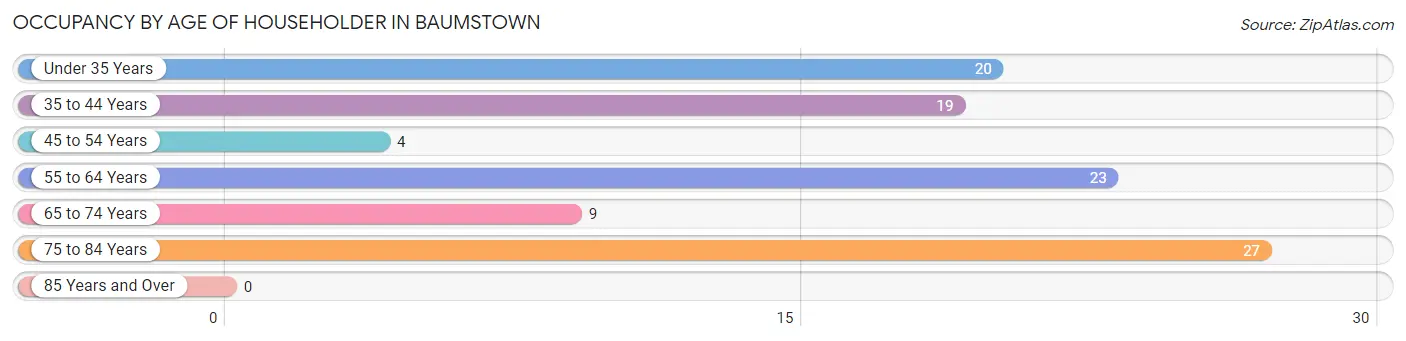
| Age Bracket | # Households | % Households |
| Under 35 Years | 20 | 19.6% |
| 35 to 44 Years | 19 | 18.6% |
| 45 to 54 Years | 4 | 3.9% |
| 55 to 64 Years | 23 | 22.6% |
| 65 to 74 Years | 9 | 8.8% |
| 75 to 84 Years | 27 | 26.5% |
| 85 Years and Over | 0 | 0.0% |
| Total | 102 | 100.0% |
Housing Finances in Baumstown
Median Income by Occupancy in Baumstown
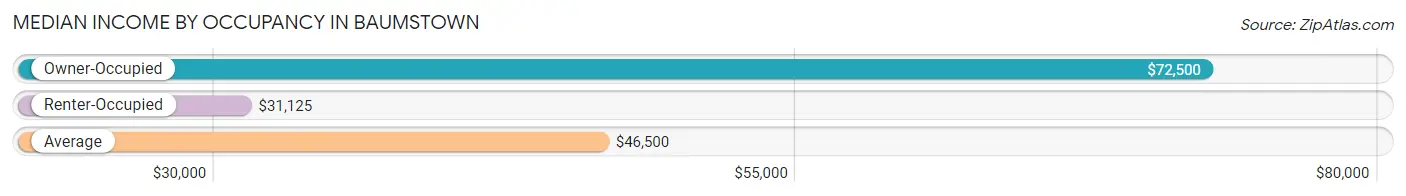
| Occupancy Type | # Households | Median Income |
| Owner-Occupied | 60 (58.8%) | $72,500 |
| Renter-Occupied | 42 (41.2%) | $31,125 |
| Average | 102 (100.0%) | $46,500 |
Occupancy by Householder Income Bracket in Baumstown
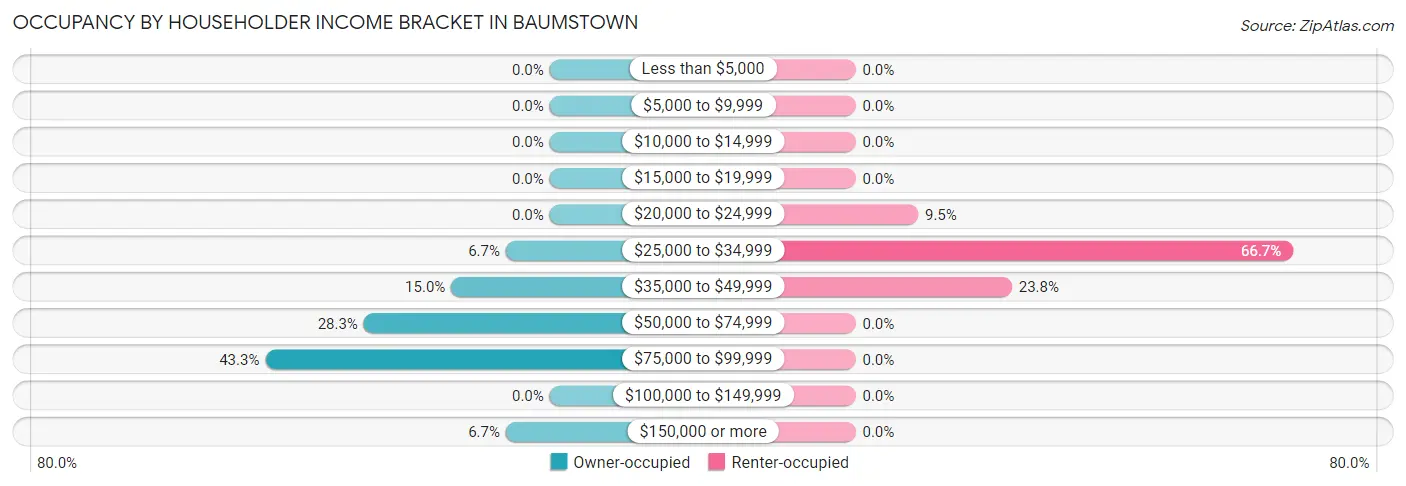
| Income Bracket | Owner-occupied | Renter-occupied |
| Less than $5,000 | 0 (0.0%) | 0 (0.0%) |
| $5,000 to $9,999 | 0 (0.0%) | 0 (0.0%) |
| $10,000 to $14,999 | 0 (0.0%) | 0 (0.0%) |
| $15,000 to $19,999 | 0 (0.0%) | 0 (0.0%) |
| $20,000 to $24,999 | 0 (0.0%) | 4 (9.5%) |
| $25,000 to $34,999 | 4 (6.7%) | 28 (66.7%) |
| $35,000 to $49,999 | 9 (15.0%) | 10 (23.8%) |
| $50,000 to $74,999 | 17 (28.3%) | 0 (0.0%) |
| $75,000 to $99,999 | 26 (43.3%) | 0 (0.0%) |
| $100,000 to $149,999 | 0 (0.0%) | 0 (0.0%) |
| $150,000 or more | 4 (6.7%) | 0 (0.0%) |
| Total | 60 (100.0%) | 42 (100.0%) |
Monthly Housing Cost Tiers in Baumstown
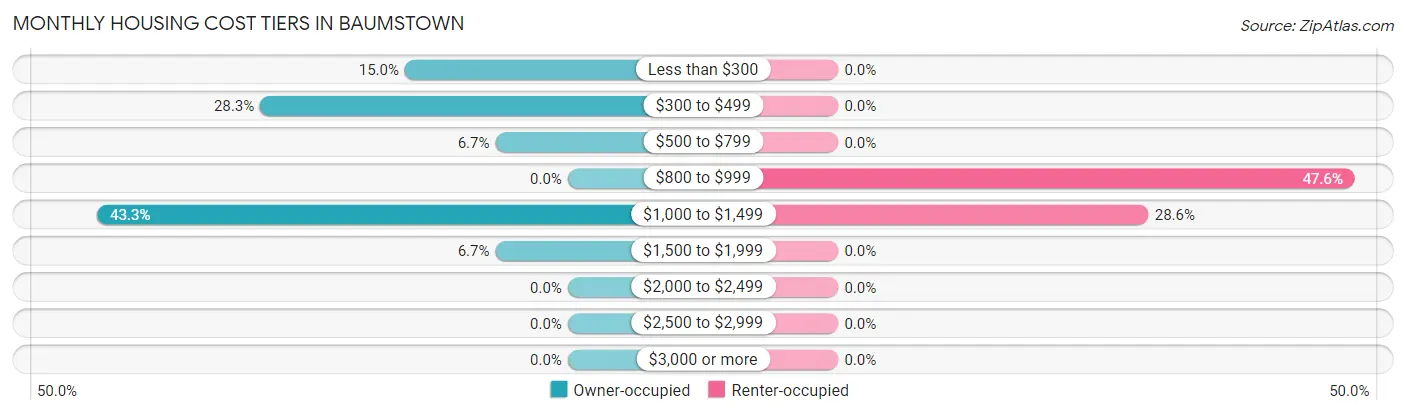
| Monthly Cost | Owner-occupied | Renter-occupied |
| Less than $300 | 9 (15.0%) | 0 (0.0%) |
| $300 to $499 | 17 (28.3%) | 0 (0.0%) |
| $500 to $799 | 4 (6.7%) | 0 (0.0%) |
| $800 to $999 | 0 (0.0%) | 20 (47.6%) |
| $1,000 to $1,499 | 26 (43.3%) | 12 (28.6%) |
| $1,500 to $1,999 | 4 (6.7%) | 0 (0.0%) |
| $2,000 to $2,499 | 0 (0.0%) | 0 (0.0%) |
| $2,500 to $2,999 | 0 (0.0%) | 0 (0.0%) |
| $3,000 or more | 0 (0.0%) | 0 (0.0%) |
| Total | 60 (100.0%) | 42 (100.0%) |
Physical Housing Characteristics in Baumstown
Housing Structures in Baumstown
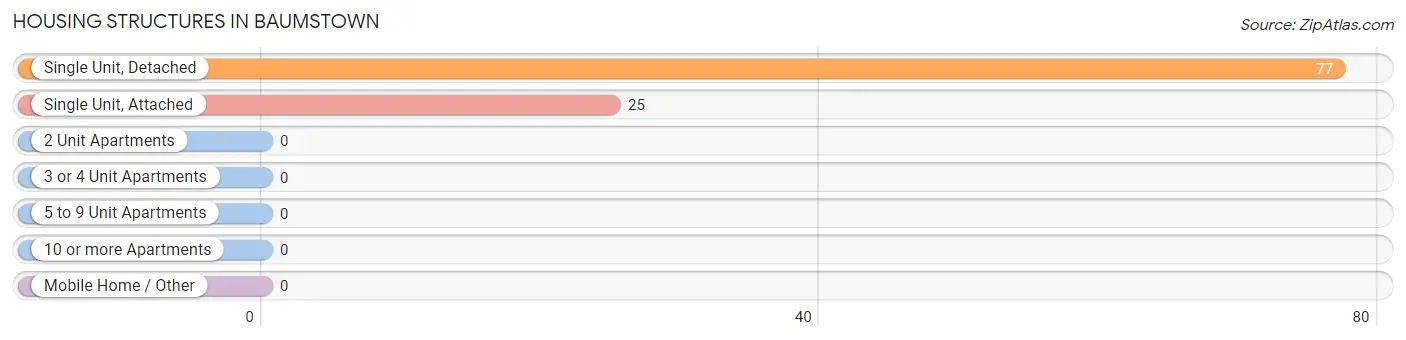
| Structure Type | # Housing Units | % Housing Units |
| Single Unit, Detached | 77 | 75.5% |
| Single Unit, Attached | 25 | 24.5% |
| 2 Unit Apartments | 0 | 0.0% |
| 3 or 4 Unit Apartments | 0 | 0.0% |
| 5 to 9 Unit Apartments | 0 | 0.0% |
| 10 or more Apartments | 0 | 0.0% |
| Mobile Home / Other | 0 | 0.0% |
| Total | 102 | 100.0% |
Housing Structures by Occupancy in Baumstown
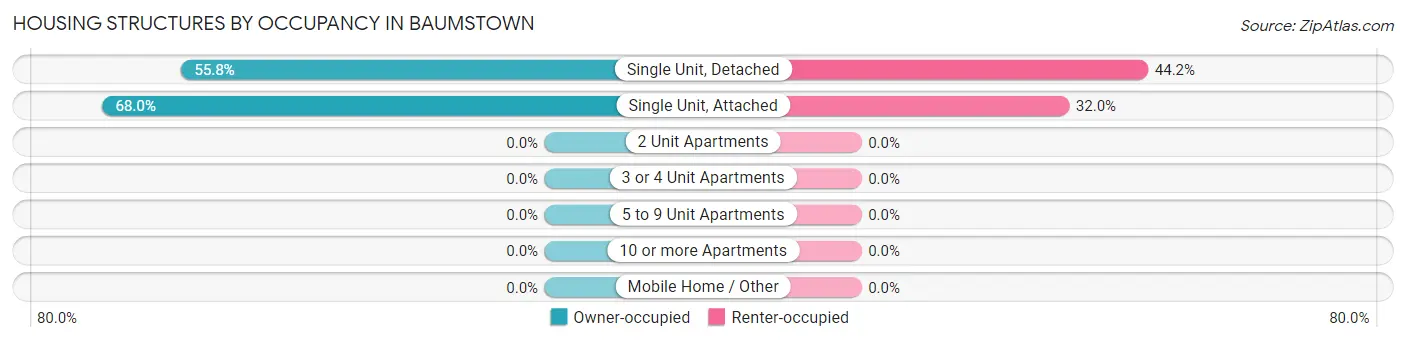
| Structure Type | Owner-occupied | Renter-occupied |
| Single Unit, Detached | 43 (55.8%) | 34 (44.2%) |
| Single Unit, Attached | 17 (68.0%) | 8 (32.0%) |
| 2 Unit Apartments | 0 (0.0%) | 0 (0.0%) |
| 3 or 4 Unit Apartments | 0 (0.0%) | 0 (0.0%) |
| 5 to 9 Unit Apartments | 0 (0.0%) | 0 (0.0%) |
| 10 or more Apartments | 0 (0.0%) | 0 (0.0%) |
| Mobile Home / Other | 0 (0.0%) | 0 (0.0%) |
| Total | 60 (58.8%) | 42 (41.2%) |
Housing Structures by Number of Rooms in Baumstown
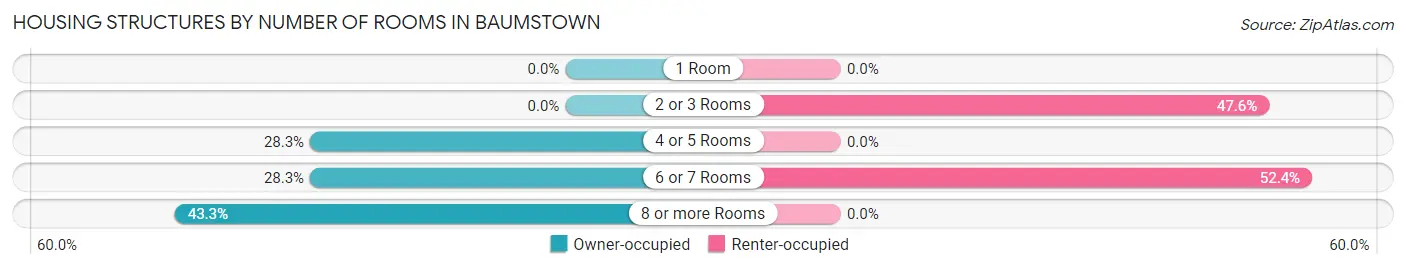
| Number of Rooms | Owner-occupied | Renter-occupied |
| 1 Room | 0 (0.0%) | 0 (0.0%) |
| 2 or 3 Rooms | 0 (0.0%) | 20 (47.6%) |
| 4 or 5 Rooms | 17 (28.3%) | 0 (0.0%) |
| 6 or 7 Rooms | 17 (28.3%) | 22 (52.4%) |
| 8 or more Rooms | 26 (43.3%) | 0 (0.0%) |
| Total | 60 (100.0%) | 42 (100.0%) |
Housing Structure by Heating Type in Baumstown
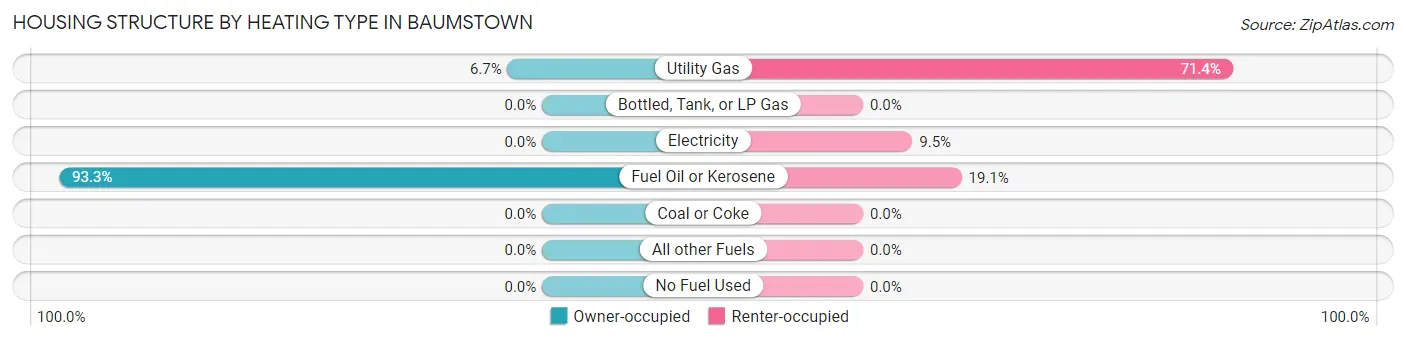
| Heating Type | Owner-occupied | Renter-occupied |
| Utility Gas | 4 (6.7%) | 30 (71.4%) |
| Bottled, Tank, or LP Gas | 0 (0.0%) | 0 (0.0%) |
| Electricity | 0 (0.0%) | 4 (9.5%) |
| Fuel Oil or Kerosene | 56 (93.3%) | 8 (19.1%) |
| Coal or Coke | 0 (0.0%) | 0 (0.0%) |
| All other Fuels | 0 (0.0%) | 0 (0.0%) |
| No Fuel Used | 0 (0.0%) | 0 (0.0%) |
| Total | 60 (100.0%) | 42 (100.0%) |
Household Vehicle Usage in Baumstown

| Vehicles per Household | Owner-occupied | Renter-occupied |
| No Vehicle | 0 (0.0%) | 20 (47.6%) |
| 1 Vehicle | 9 (15.0%) | 22 (52.4%) |
| 2 Vehicles | 32 (53.3%) | 0 (0.0%) |
| 3 or more Vehicles | 19 (31.7%) | 0 (0.0%) |
| Total | 60 (100.0%) | 42 (100.0%) |
Real Estate & Mortgages in Baumstown
Real Estate and Mortgage Overview in Baumstown
| Characteristic | Without Mortgage | With Mortgage |
| Housing Units | 30 | 30 |
| Median Property Value | $73,500 | $187,500 |
| Median Household Income | $53,382 | $0 |
| Monthly Housing Costs | $435 | $0 |
| Real Estate Taxes | $2,353 | $0 |
Property Value by Mortgage Status in Baumstown
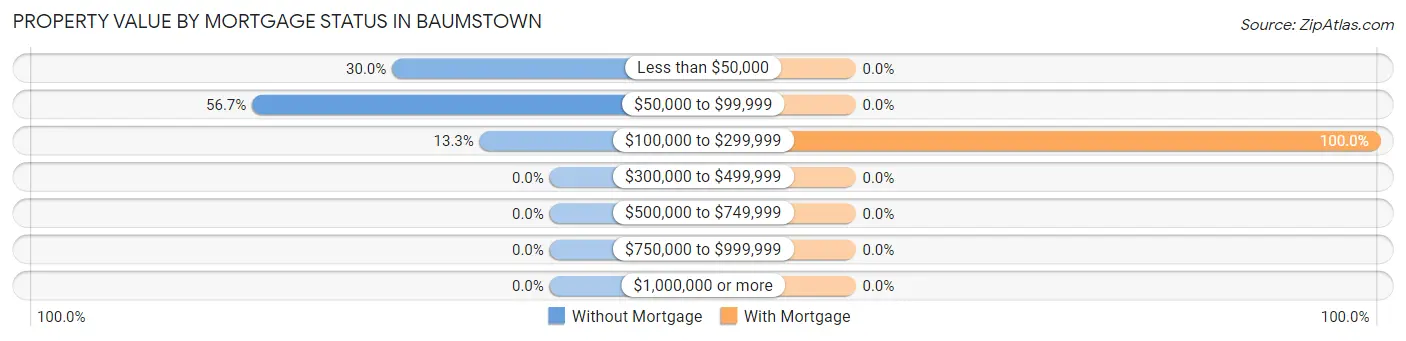
| Property Value | Without Mortgage | With Mortgage |
| Less than $50,000 | 9 (30.0%) | 0 (0.0%) |
| $50,000 to $99,999 | 17 (56.7%) | 0 (0.0%) |
| $100,000 to $299,999 | 4 (13.3%) | 30 (100.0%) |
| $300,000 to $499,999 | 0 (0.0%) | 0 (0.0%) |
| $500,000 to $749,999 | 0 (0.0%) | 0 (0.0%) |
| $750,000 to $999,999 | 0 (0.0%) | 0 (0.0%) |
| $1,000,000 or more | 0 (0.0%) | 0 (0.0%) |
| Total | 30 (100.0%) | 30 (100.0%) |
Household Income by Mortgage Status in Baumstown
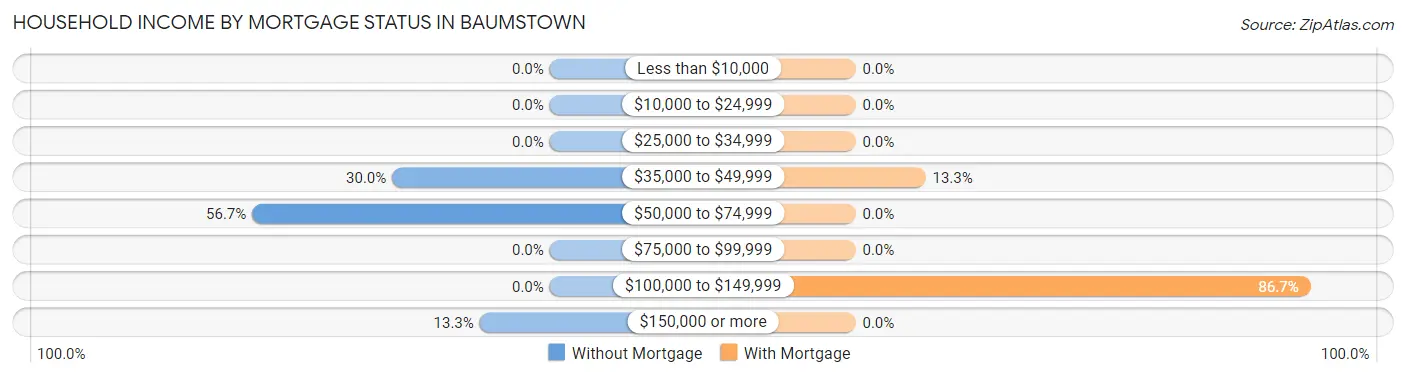
| Household Income | Without Mortgage | With Mortgage |
| Less than $10,000 | 0 (0.0%) | 0 (0.0%) |
| $10,000 to $24,999 | 0 (0.0%) | 0 (0.0%) |
| $25,000 to $34,999 | 0 (0.0%) | 0 (0.0%) |
| $35,000 to $49,999 | 9 (30.0%) | 4 (13.3%) |
| $50,000 to $74,999 | 17 (56.7%) | 0 (0.0%) |
| $75,000 to $99,999 | 0 (0.0%) | 0 (0.0%) |
| $100,000 to $149,999 | 0 (0.0%) | 26 (86.7%) |
| $150,000 or more | 4 (13.3%) | 0 (0.0%) |
| Total | 30 (100.0%) | 30 (100.0%) |
Property Value to Household Income Ratio in Baumstown
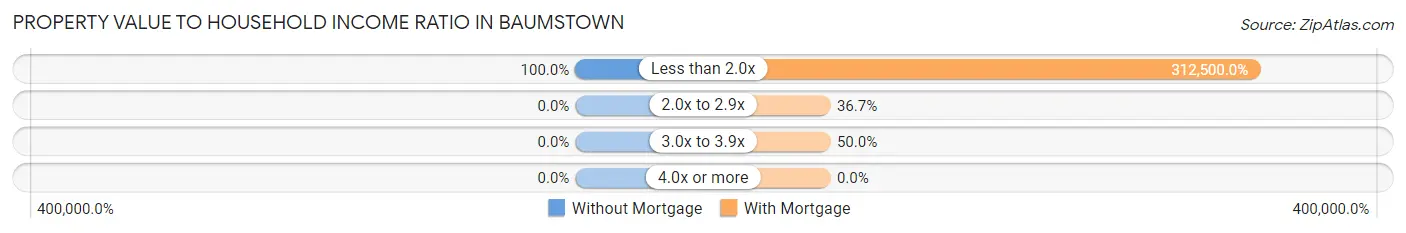
| Value-to-Income Ratio | Without Mortgage | With Mortgage |
| Less than 2.0x | 30 (100.0%) | 93,750 (312,500.0%) |
| 2.0x to 2.9x | 0 (0.0%) | 11 (36.7%) |
| 3.0x to 3.9x | 0 (0.0%) | 15 (50.0%) |
| 4.0x or more | 0 (0.0%) | 0 (0.0%) |
| Total | 30 (100.0%) | 30 (100.0%) |
Real Estate Taxes by Mortgage Status in Baumstown
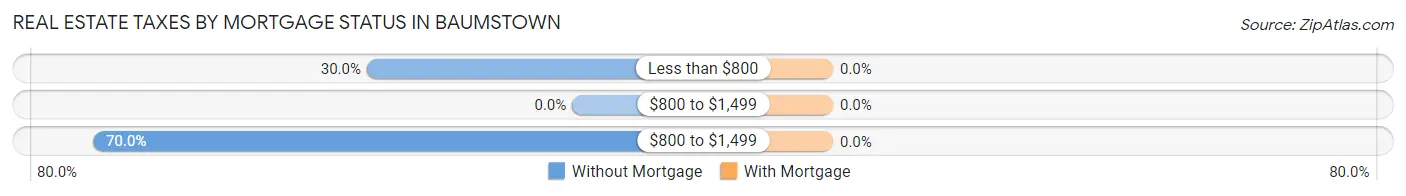
| Property Taxes | Without Mortgage | With Mortgage |
| Less than $800 | 9 (30.0%) | 0 (0.0%) |
| $800 to $1,499 | 0 (0.0%) | 0 (0.0%) |
| $800 to $1,499 | 21 (70.0%) | 0 (0.0%) |
| Total | 30 (100.0%) | 30 (100.0%) |
Health & Disability in Baumstown
Health Insurance Coverage by Age in Baumstown
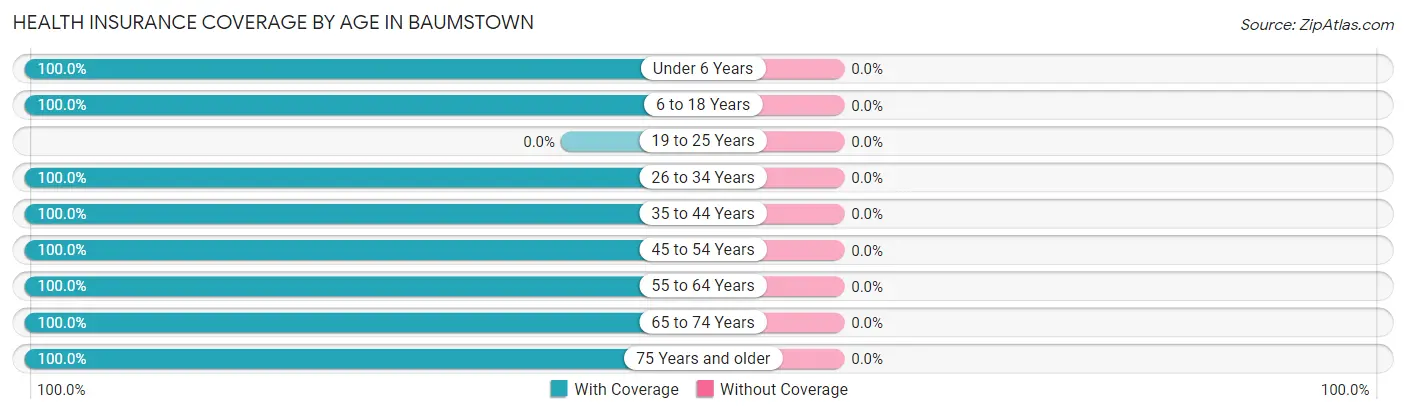
| Age Bracket | With Coverage | Without Coverage |
| Under 6 Years | 12 (100.0%) | 0 (0.0%) |
| 6 to 18 Years | 8 (100.0%) | 0 (0.0%) |
| 19 to 25 Years | 0 (0.0%) | 0 (0.0%) |
| 26 to 34 Years | 20 (100.0%) | 0 (0.0%) |
| 35 to 44 Years | 30 (100.0%) | 0 (0.0%) |
| 45 to 54 Years | 7 (100.0%) | 0 (0.0%) |
| 55 to 64 Years | 55 (100.0%) | 0 (0.0%) |
| 65 to 74 Years | 9 (100.0%) | 0 (0.0%) |
| 75 Years and older | 27 (100.0%) | 0 (0.0%) |
| Total | 168 (100.0%) | 0 (0.0%) |
Health Insurance Coverage by Citizenship Status in Baumstown
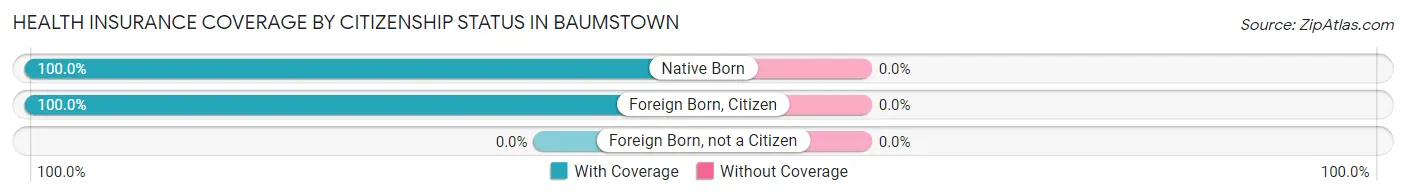
| Citizenship Status | With Coverage | Without Coverage |
| Native Born | 12 (100.0%) | 0 (0.0%) |
| Foreign Born, Citizen | 8 (100.0%) | 0 (0.0%) |
| Foreign Born, not a Citizen | 0 (0.0%) | 0 (0.0%) |
Health Insurance Coverage by Household Income in Baumstown
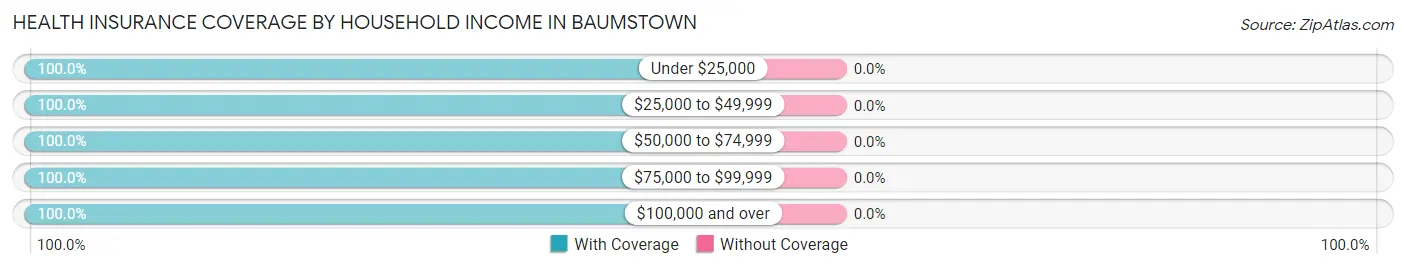
| Household Income | With Coverage | Without Coverage |
| Under $25,000 | 4 (100.0%) | 0 (0.0%) |
| $25,000 to $49,999 | 55 (100.0%) | 0 (0.0%) |
| $50,000 to $74,999 | 37 (100.0%) | 0 (0.0%) |
| $75,000 to $99,999 | 61 (100.0%) | 0 (0.0%) |
| $100,000 and over | 11 (100.0%) | 0 (0.0%) |
Public vs Private Health Insurance Coverage by Age in Baumstown
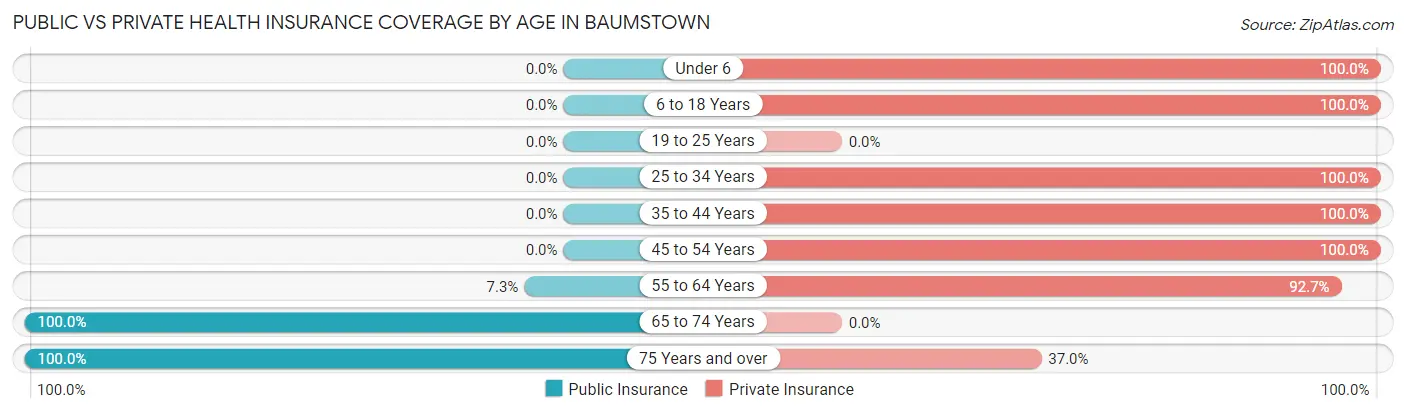
| Age Bracket | Public Insurance | Private Insurance |
| Under 6 | 0 (0.0%) | 12 (100.0%) |
| 6 to 18 Years | 0 (0.0%) | 8 (100.0%) |
| 19 to 25 Years | 0 (0.0%) | 0 (0.0%) |
| 25 to 34 Years | 0 (0.0%) | 20 (100.0%) |
| 35 to 44 Years | 0 (0.0%) | 30 (100.0%) |
| 45 to 54 Years | 0 (0.0%) | 7 (100.0%) |
| 55 to 64 Years | 4 (7.3%) | 51 (92.7%) |
| 65 to 74 Years | 9 (100.0%) | 0 (0.0%) |
| 75 Years and over | 27 (100.0%) | 10 (37.0%) |
| Total | 40 (23.8%) | 138 (82.1%) |
Disability Status by Sex by Age in Baumstown
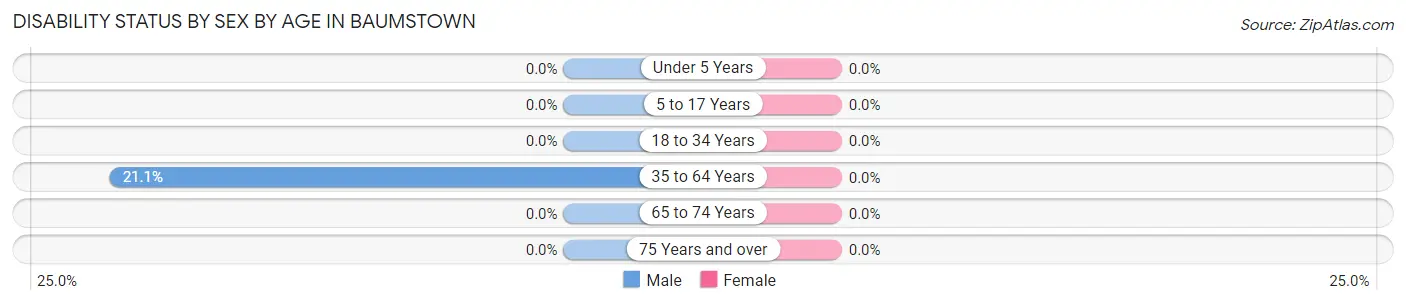
| Age Bracket | Male | Female |
| Under 5 Years | 0 (0.0%) | 0 (0.0%) |
| 5 to 17 Years | 0 (0.0%) | 0 (0.0%) |
| 18 to 34 Years | 0 (0.0%) | 0 (0.0%) |
| 35 to 64 Years | 8 (21.0%) | 0 (0.0%) |
| 65 to 74 Years | 0 (0.0%) | 0 (0.0%) |
| 75 Years and over | 0 (0.0%) | 0 (0.0%) |
Disability Class by Sex by Age in Baumstown
Disability Class: Hearing Difficulty
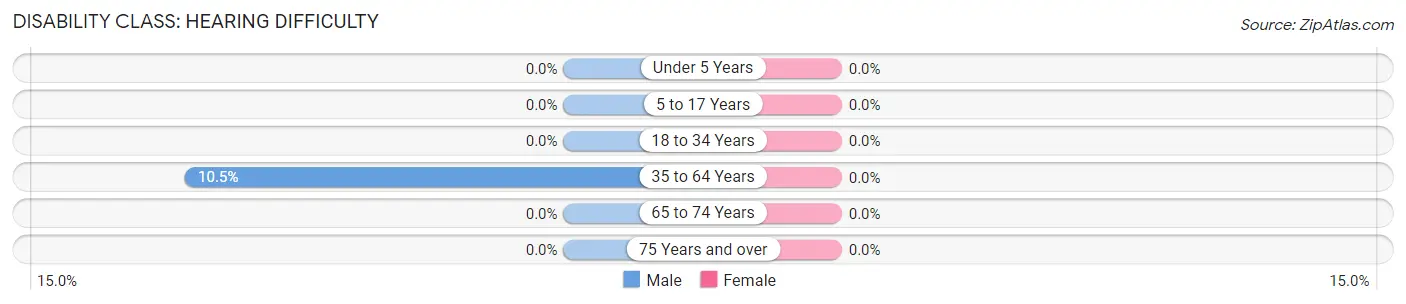
| Age Bracket | Male | Female |
| Under 5 Years | 0 (0.0%) | 0 (0.0%) |
| 5 to 17 Years | 0 (0.0%) | 0 (0.0%) |
| 18 to 34 Years | 0 (0.0%) | 0 (0.0%) |
| 35 to 64 Years | 4 (10.5%) | 0 (0.0%) |
| 65 to 74 Years | 0 (0.0%) | 0 (0.0%) |
| 75 Years and over | 0 (0.0%) | 0 (0.0%) |
Disability Class: Vision Difficulty
| Age Bracket | Male | Female |
| Under 5 Years | 0 (0.0%) | 0 (0.0%) |
| 5 to 17 Years | 0 (0.0%) | 0 (0.0%) |
| 18 to 34 Years | 0 (0.0%) | 0 (0.0%) |
| 35 to 64 Years | 0 (0.0%) | 0 (0.0%) |
| 65 to 74 Years | 0 (0.0%) | 0 (0.0%) |
| 75 Years and over | 0 (0.0%) | 0 (0.0%) |
Disability Class: Cognitive Difficulty
| Age Bracket | Male | Female |
| 5 to 17 Years | 0 (0.0%) | 0 (0.0%) |
| 18 to 34 Years | 0 (0.0%) | 0 (0.0%) |
| 35 to 64 Years | 0 (0.0%) | 0 (0.0%) |
| 65 to 74 Years | 0 (0.0%) | 0 (0.0%) |
| 75 Years and over | 0 (0.0%) | 0 (0.0%) |
Disability Class: Ambulatory Difficulty
| Age Bracket | Male | Female |
| 5 to 17 Years | 0 (0.0%) | 0 (0.0%) |
| 18 to 34 Years | 0 (0.0%) | 0 (0.0%) |
| 35 to 64 Years | 4 (10.5%) | 0 (0.0%) |
| 65 to 74 Years | 0 (0.0%) | 0 (0.0%) |
| 75 Years and over | 0 (0.0%) | 0 (0.0%) |
Disability Class: Self-Care Difficulty
| Age Bracket | Male | Female |
| 5 to 17 Years | 0 (0.0%) | 0 (0.0%) |
| 18 to 34 Years | 0 (0.0%) | 0 (0.0%) |
| 35 to 64 Years | 4 (10.5%) | 0 (0.0%) |
| 65 to 74 Years | 0 (0.0%) | 0 (0.0%) |
| 75 Years and over | 0 (0.0%) | 0 (0.0%) |
Technology Access in Baumstown
Computing Device Access in Baumstown
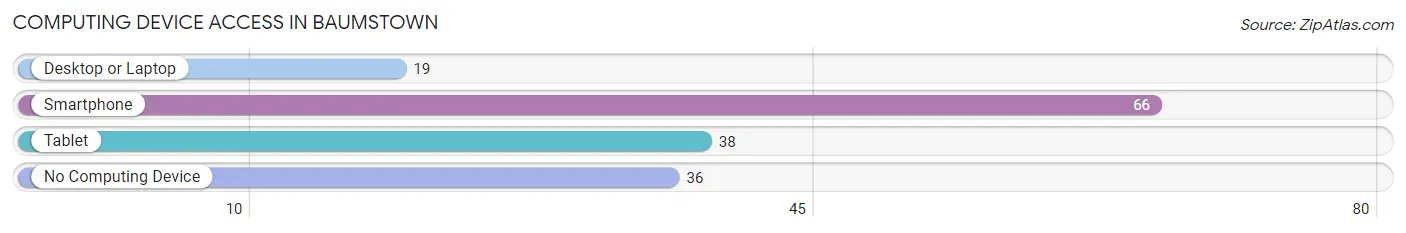
| Device Type | # Households | % Households |
| Desktop or Laptop | 19 | 18.6% |
| Smartphone | 66 | 64.7% |
| Tablet | 38 | 37.2% |
| No Computing Device | 36 | 35.3% |
| Total | 102 | 100.0% |
Internet Access in Baumstown
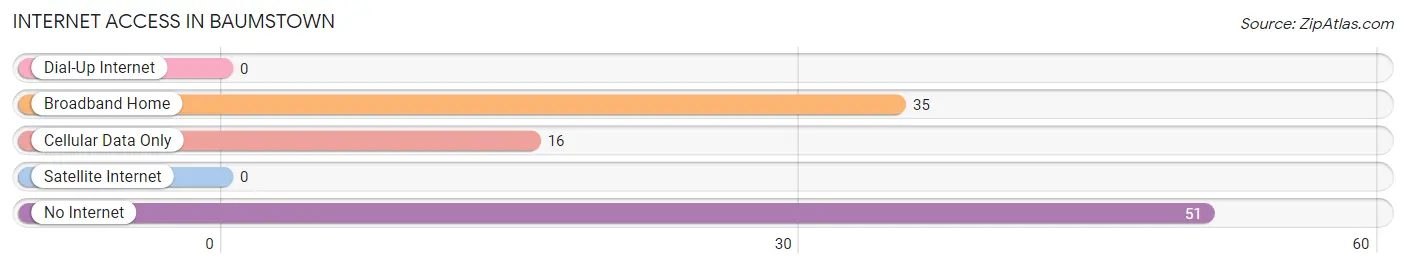
| Internet Type | # Households | % Households |
| Dial-Up Internet | 0 | 0.0% |
| Broadband Home | 35 | 34.3% |
| Cellular Data Only | 16 | 15.7% |
| Satellite Internet | 0 | 0.0% |
| No Internet | 51 | 50.0% |
| Total | 102 | 100.0% |
Baumstown Summary
Baumstown is a small borough located in Berks County, Pennsylvania. It is situated in the southeastern part of the state, about 25 miles northwest of Philadelphia. The population of Baumstown was 1,845 at the 2010 census.
History
Baumstown was founded in 1737 by John Baum, a German immigrant. The town was originally known as Baum's Town, but the name was changed to Baumstown in 1845. The town was incorporated in 1851.
In the 19th century, Baumstown was a thriving agricultural community. The town was home to several mills, including a grist mill, a saw mill, and a paper mill. The paper mill was the largest employer in the area, and it provided jobs for many of the town's residents.
In the early 20th century, Baumstown began to decline. The paper mill closed in the 1920s, and the other mills followed suit. The town's population began to decline as well, and by the 1950s, Baumstown had become a small, rural community.
Geography
Baumstown is located at 40°25'N 75°45'W. It is situated in the southeastern part of Berks County, about 25 miles northwest of Philadelphia. The borough is bordered by Pike Township to the north, Upper Bern Township to the east, and Lower Heidelberg Township to the south and west.
The terrain of Baumstown is mostly flat, with some rolling hills. The borough is located in the Schuylkill River watershed. The Schuylkill River forms the western boundary of the borough.
Economy
Baumstown's economy is largely based on agriculture. The town is home to several farms, which produce a variety of crops, including corn, soybeans, and hay. The town also has several small businesses, including a hardware store, a grocery store, and a restaurant.
Demographics
As of the 2010 census, the population of Baumstown was 1,845. The racial makeup of the borough was 97.3% White, 0.9% African American, 0.2% Native American, 0.3% Asian, and 1.3% from other races. Hispanic or Latino of any race were 1.3% of the population.
The median household income in Baumstown was $50,938, and the median family income was $60,625. The per capita income was $22,945. About 6.3% of families and 8.2% of the population were below the poverty line.
Baumstown is served by the Boyertown Area School District. The borough is home to one elementary school, one middle school, and one high school. The town also has several churches, including the Baumstown United Methodist Church and the Baumstown Lutheran Church.
Common Questions
What is Per Capita Income in Baumstown?
Per Capita income in Baumstown is $36,654.
What is the Median Family Income in Baumstown?
Median Family Income in Baumstown is $90,568.
What is the Median Household income in Baumstown?
Median Household Income in Baumstown is $46,500.
What is Inequality or Gini Index in Baumstown?
Inequality or Gini Index in Baumstown is 0.32.
What is the Total Population of Baumstown?
Total Population of Baumstown is 168.
What is the Total Male Population of Baumstown?
Total Male Population of Baumstown is 67.
What is the Total Female Population of Baumstown?
Total Female Population of Baumstown is 101.
What is the Ratio of Males per 100 Females in Baumstown?
There are 66.34 Males per 100 Females in Baumstown.
What is the Ratio of Females per 100 Males in Baumstown?
There are 150.75 Females per 100 Males in Baumstown.
What is the Median Population Age in Baumstown?
Median Population Age in Baumstown is 56.3 Years.
What is the Average Family Size in Baumstown
Average Family Size in Baumstown is 2.2 People.
What is the Average Household Size in Baumstown
Average Household Size in Baumstown is 1.6 People.
How Large is the Labor Force in Baumstown?
There are 118 People in the Labor Forcein in Baumstown.
What is the Percentage of People in the Labor Force in Baumstown?
77.6% of People are in the Labor Force in Baumstown.