Pymatuning Central, PA Map & Demographics
Pymatuning Central Map
Pymatuning Central Overview
$31,996
PER CAPITA INCOME
$71,417
AVG FAMILY INCOME
$58,068
AVG HOUSEHOLD INCOME
33.2%
WAGE / INCOME GAP [ % ]
66.8¢/ $1
WAGE / INCOME GAP [ $ ]
$6,324
FAMILY INCOME DEFICIT
0.37
INEQUALITY / GINI INDEX
2,325
TOTAL POPULATION
1,291
MALE POPULATION
1,034
FEMALE POPULATION
124.85
MALES / 100 FEMALES
80.09
FEMALES / 100 MALES
58.1
MEDIAN AGE
2.6
AVG FAMILY SIZE
2.1
AVG HOUSEHOLD SIZE
851
LABOR FORCE [ PEOPLE ]
41.3%
PERCENT IN LABOR FORCE
4.1%
UNEMPLOYMENT RATE
Income in Pymatuning Central
Income Overview in Pymatuning Central
Per Capita Income in Pymatuning Central is $31,996, while median incomes of families and households are $71,417 and $58,068 respectively.
| Characteristic | Number | Measure |
| Per Capita Income | 2,325 | $31,996 |
| Median Family Income | 709 | $71,417 |
| Mean Family Income | 709 | $79,338 |
| Median Household Income | 1,082 | $58,068 |
| Mean Household Income | 1,082 | $70,059 |
| Income Deficit | 709 | $6,324 |
| Wage / Income Gap (%) | 2,325 | 33.19% |
| Wage / Income Gap ($) | 2,325 | 66.81¢ per $1 |
| Gini / Inequality Index | 2,325 | 0.37 |
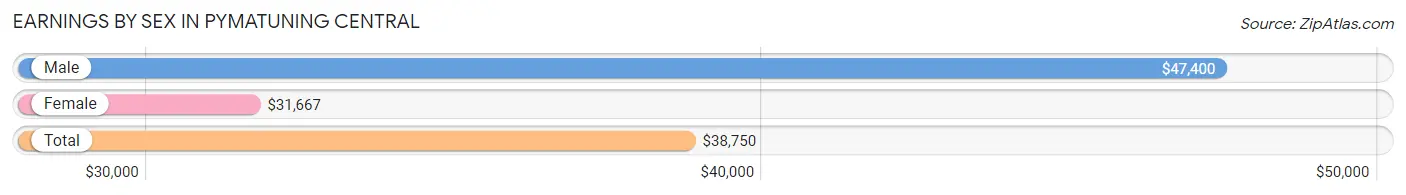
Earnings by Sex in Pymatuning Central
Average Earnings in Pymatuning Central are $38,750, $47,400 for men and $31,667 for women, a difference of 33.2%.
| Sex | Number | Average Earnings |
| Male | 512 (57.3%) | $47,400 |
| Female | 382 (42.7%) | $31,667 |
| Total | 894 (100.0%) | $38,750 |
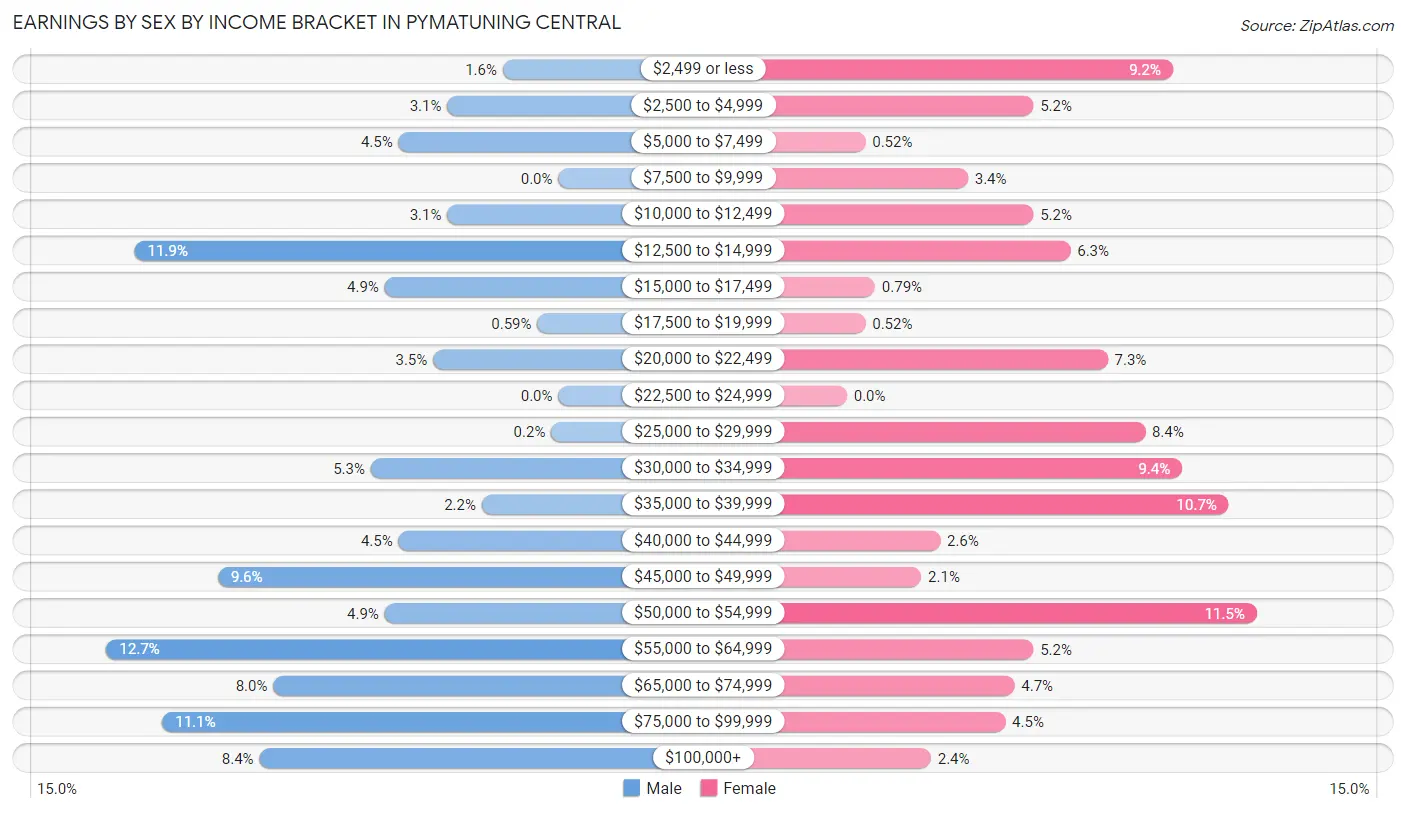
Earnings by Sex by Income Bracket in Pymatuning Central
The most common earnings brackets in Pymatuning Central are $55,000 to $64,999 for men (65 | 12.7%) and $50,000 to $54,999 for women (44 | 11.5%).
| Income | Male | Female |
| $2,499 or less | 8 (1.6%) | 35 (9.2%) |
| $2,500 to $4,999 | 16 (3.1%) | 20 (5.2%) |
| $5,000 to $7,499 | 23 (4.5%) | 2 (0.5%) |
| $7,500 to $9,999 | 0 (0.0%) | 13 (3.4%) |
| $10,000 to $12,499 | 16 (3.1%) | 20 (5.2%) |
| $12,500 to $14,999 | 61 (11.9%) | 24 (6.3%) |
| $15,000 to $17,499 | 25 (4.9%) | 3 (0.8%) |
| $17,500 to $19,999 | 3 (0.6%) | 2 (0.5%) |
| $20,000 to $22,499 | 18 (3.5%) | 28 (7.3%) |
| $22,500 to $24,999 | 0 (0.0%) | 0 (0.0%) |
| $25,000 to $29,999 | 1 (0.2%) | 32 (8.4%) |
| $30,000 to $34,999 | 27 (5.3%) | 36 (9.4%) |
| $35,000 to $39,999 | 11 (2.1%) | 41 (10.7%) |
| $40,000 to $44,999 | 23 (4.5%) | 10 (2.6%) |
| $45,000 to $49,999 | 49 (9.6%) | 8 (2.1%) |
| $50,000 to $54,999 | 25 (4.9%) | 44 (11.5%) |
| $55,000 to $64,999 | 65 (12.7%) | 20 (5.2%) |
| $65,000 to $74,999 | 41 (8.0%) | 18 (4.7%) |
| $75,000 to $99,999 | 57 (11.1%) | 17 (4.4%) |
| $100,000+ | 43 (8.4%) | 9 (2.4%) |
| Total | 512 (100.0%) | 382 (100.0%) |
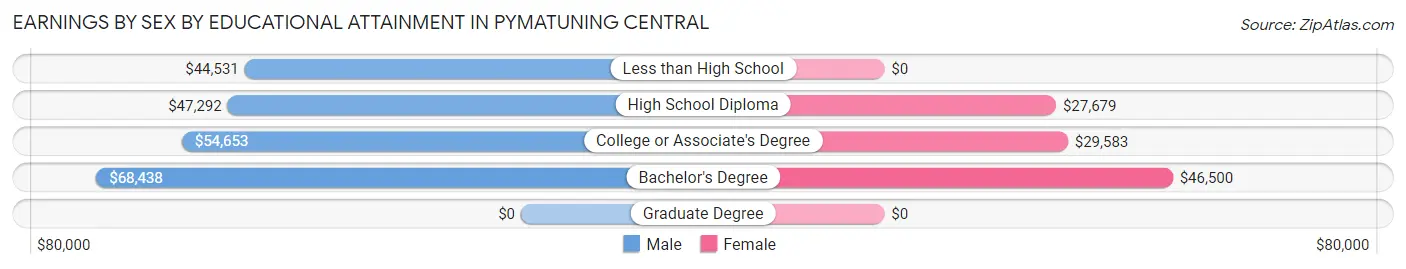
Earnings by Sex by Educational Attainment in Pymatuning Central
Average earnings in Pymatuning Central are $53,056 for men and $32,639 for women, a difference of 38.5%. Men with an educational attainment of bachelor's degree enjoy the highest average annual earnings of $68,438, while those with less than high school education earn the least with $44,531. Women with an educational attainment of bachelor's degree earn the most with the average annual earnings of $46,500, while those with high school diploma education have the smallest earnings of $27,679.
| Educational Attainment | Male Income | Female Income |
| Less than High School | $44,531 | $0 |
| High School Diploma | $47,292 | $27,679 |
| College or Associate's Degree | $54,653 | $29,583 |
| Bachelor's Degree | $68,438 | $46,500 |
| Graduate Degree | - | - |
| Total | $53,056 | $32,639 |
Family Income in Pymatuning Central
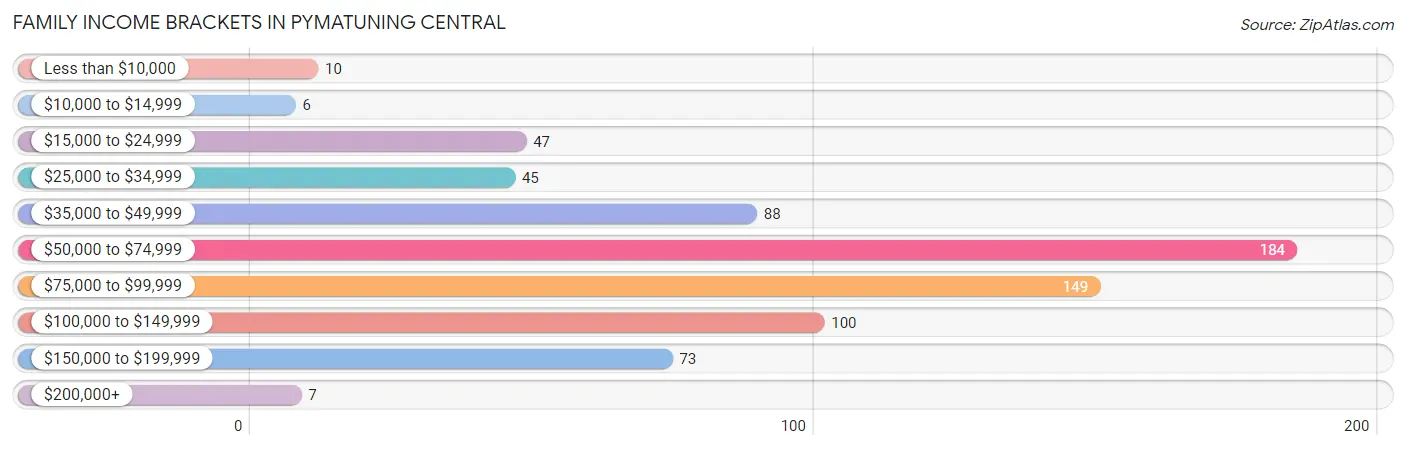
Family Income Brackets in Pymatuning Central
According to the Pymatuning Central family income data, there are 184 families falling into the $50,000 to $74,999 income range, which is the most common income bracket and makes up 26.0% of all families. Conversely, the $10,000 to $14,999 income bracket is the least frequent group with only 6 families (0.9%) belonging to this category.
| Income Bracket | # Families | % Families |
| Less than $10,000 | 10 | 1.4% |
| $10,000 to $14,999 | 6 | 0.8% |
| $15,000 to $24,999 | 47 | 6.6% |
| $25,000 to $34,999 | 45 | 6.3% |
| $35,000 to $49,999 | 88 | 12.4% |
| $50,000 to $74,999 | 184 | 26.0% |
| $75,000 to $99,999 | 149 | 21.0% |
| $100,000 to $149,999 | 100 | 14.1% |
| $150,000 to $199,999 | 73 | 10.3% |
| $200,000+ | 7 | 1.0% |
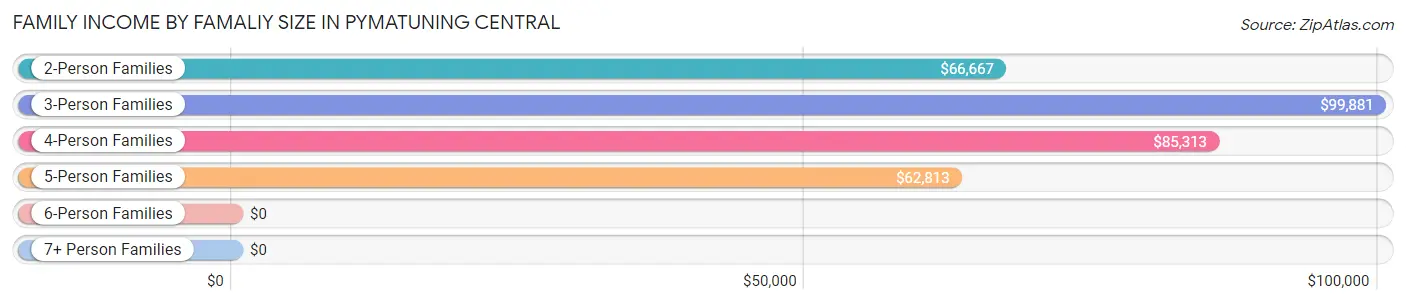
Family Income by Famaliy Size in Pymatuning Central
3-person families (144 | 20.3%) account for the highest median family income in Pymatuning Central with $99,881 per family, while 2-person families (462 | 65.2%) have the highest median income of $33,334 per family member.
| Income Bracket | # Families | Median Income |
| 2-Person Families | 462 (65.2%) | $66,667 |
| 3-Person Families | 144 (20.3%) | $99,881 |
| 4-Person Families | 33 (4.6%) | $85,313 |
| 5-Person Families | 14 (2.0%) | $62,813 |
| 6-Person Families | 0 (0.0%) | $0 |
| 7+ Person Families | 56 (7.9%) | $0 |
| Total | 709 (100.0%) | $71,417 |
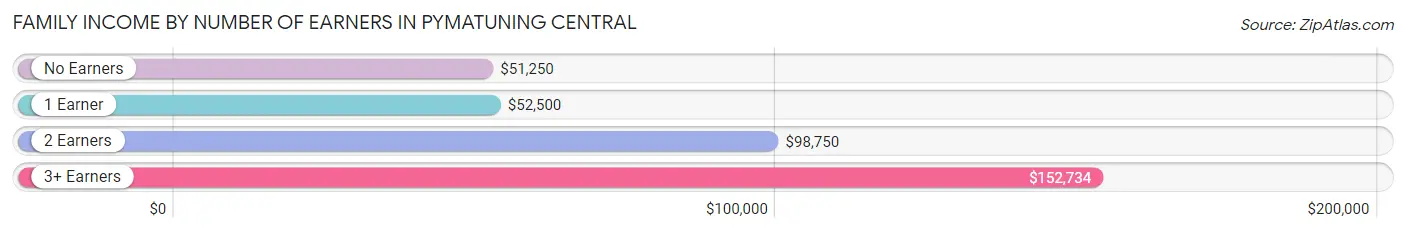
Family Income by Number of Earners in Pymatuning Central
The median family income in Pymatuning Central is $71,417, with families comprising 3+ earners (37) having the highest median family income of $152,734, while families with no earners (221) have the lowest median family income of $51,250, accounting for 5.2% and 31.2% of families, respectively.
| Number of Earners | # Families | Median Income |
| No Earners | 221 (31.2%) | $51,250 |
| 1 Earner | 288 (40.6%) | $52,500 |
| 2 Earners | 163 (23.0%) | $98,750 |
| 3+ Earners | 37 (5.2%) | $152,734 |
| Total | 709 (100.0%) | $71,417 |
Household Income in Pymatuning Central
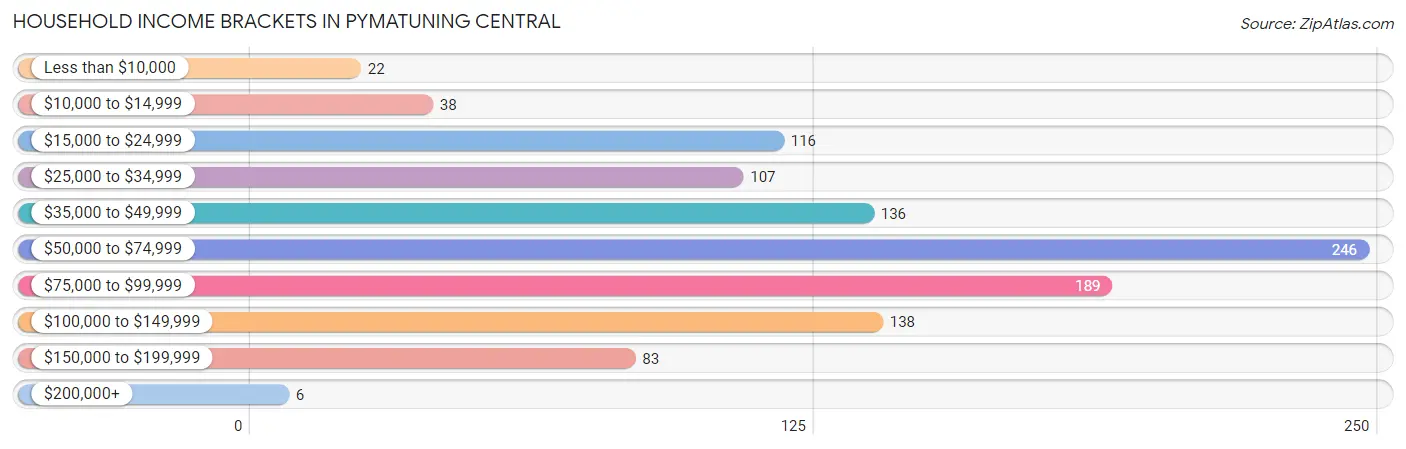
Household Income Brackets in Pymatuning Central
With 246 households falling in the category, the $50,000 to $74,999 income range is the most frequent in Pymatuning Central, accounting for 22.7% of all households. In contrast, only 6 households (0.5%) fall into the $200,000+ income bracket, making it the least populous group.
| Income Bracket | # Households | % Households |
| Less than $10,000 | 22 | 2.0% |
| $10,000 to $14,999 | 38 | 3.5% |
| $15,000 to $24,999 | 116 | 10.7% |
| $25,000 to $34,999 | 107 | 9.9% |
| $35,000 to $49,999 | 136 | 12.6% |
| $50,000 to $74,999 | 246 | 22.7% |
| $75,000 to $99,999 | 189 | 17.5% |
| $100,000 to $149,999 | 138 | 12.8% |
| $150,000 to $199,999 | 83 | 7.7% |
| $200,000+ | 6 | 0.6% |
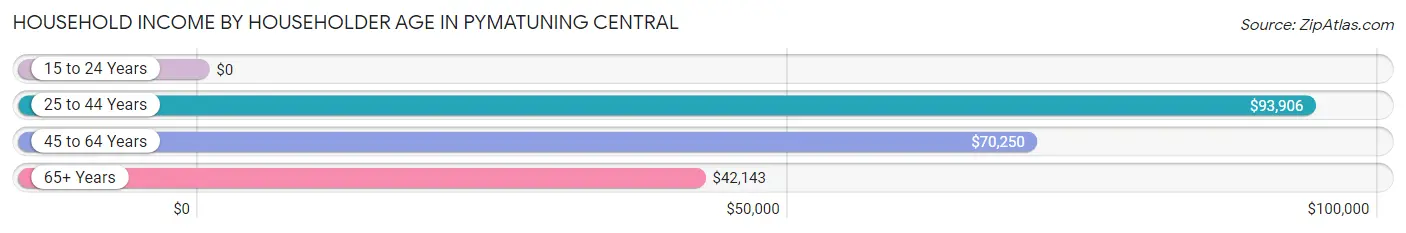
Household Income by Householder Age in Pymatuning Central
The median household income in Pymatuning Central is $58,068, with the highest median household income of $93,906 found in the 25 to 44 years age bracket for the primary householder. A total of 135 households (12.5%) fall into this category.
| Income Bracket | # Households | Median Income |
| 15 to 24 Years | 0 (0.0%) | $0 |
| 25 to 44 Years | 135 (12.5%) | $93,906 |
| 45 to 64 Years | 443 (40.9%) | $70,250 |
| 65+ Years | 504 (46.6%) | $42,143 |
| Total | 1,082 (100.0%) | $58,068 |
Poverty in Pymatuning Central
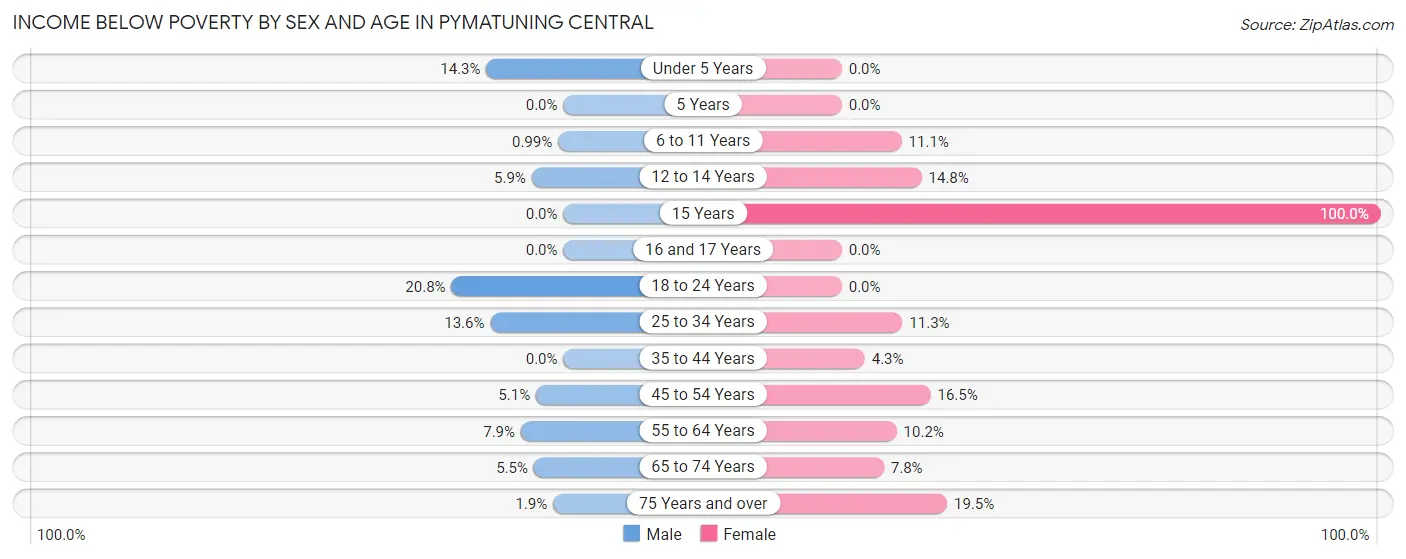
Income Below Poverty by Sex and Age in Pymatuning Central
With 6.2% poverty level for males and 9.9% for females among the residents of Pymatuning Central, 18 to 24 year old males and 15 year old females are the most vulnerable to poverty, with 16 males (20.8%) and 4 females (100.0%) in their respective age groups living below the poverty level.
| Age Bracket | Male | Female |
| Under 5 Years | 4 (14.3%) | 0 (0.0%) |
| 5 Years | 0 (0.0%) | 0 (0.0%) |
| 6 to 11 Years | 1 (1.0%) | 1 (11.1%) |
| 12 to 14 Years | 1 (5.9%) | 4 (14.8%) |
| 15 Years | 0 (0.0%) | 4 (100.0%) |
| 16 and 17 Years | 0 (0.0%) | 0 (0.0%) |
| 18 to 24 Years | 16 (20.8%) | 0 (0.0%) |
| 25 to 34 Years | 8 (13.6%) | 9 (11.3%) |
| 35 to 44 Years | 0 (0.0%) | 5 (4.3%) |
| 45 to 54 Years | 9 (5.1%) | 15 (16.5%) |
| 55 to 64 Years | 21 (7.9%) | 23 (10.2%) |
| 65 to 74 Years | 16 (5.5%) | 16 (7.8%) |
| 75 Years and over | 3 (1.9%) | 25 (19.5%) |
| Total | 79 (6.2%) | 102 (9.9%) |
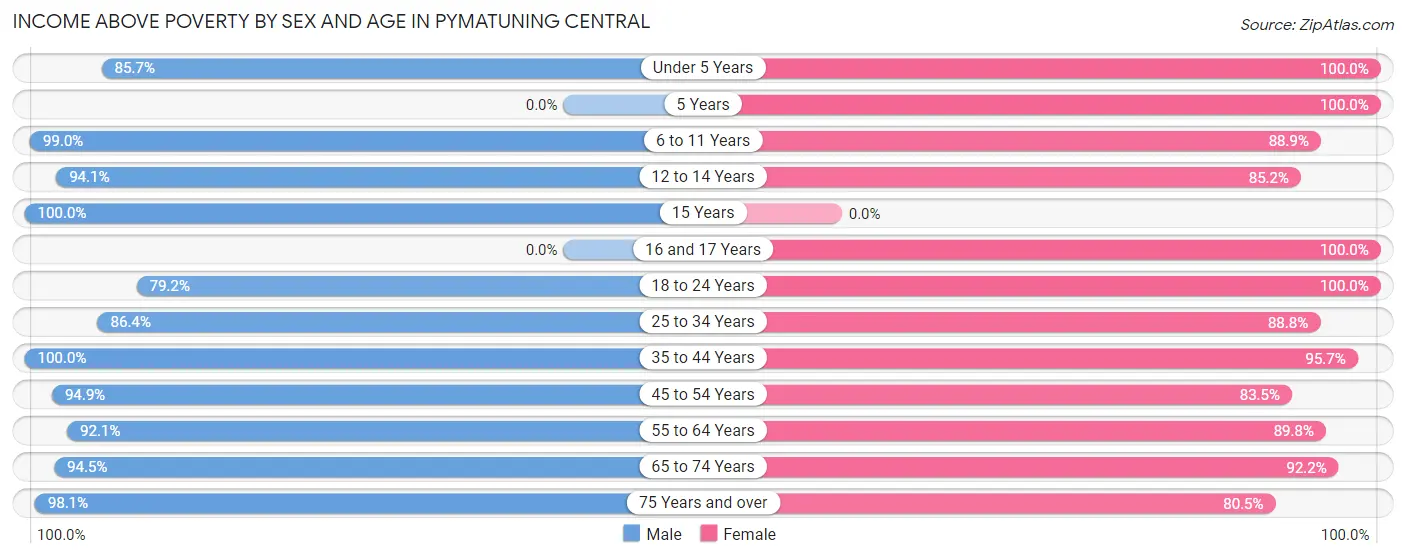
Income Above Poverty by Sex and Age in Pymatuning Central
According to the poverty statistics in Pymatuning Central, males aged 15 years and females aged under 5 years are the age groups that are most secure financially, with 100.0% of males and 100.0% of females in these age groups living above the poverty line.
| Age Bracket | Male | Female |
| Under 5 Years | 24 (85.7%) | 33 (100.0%) |
| 5 Years | 0 (0.0%) | 31 (100.0%) |
| 6 to 11 Years | 100 (99.0%) | 8 (88.9%) |
| 12 to 14 Years | 16 (94.1%) | 23 (85.2%) |
| 15 Years | 11 (100.0%) | 0 (0.0%) |
| 16 and 17 Years | 0 (0.0%) | 33 (100.0%) |
| 18 to 24 Years | 61 (79.2%) | 50 (100.0%) |
| 25 to 34 Years | 51 (86.4%) | 71 (88.7%) |
| 35 to 44 Years | 81 (100.0%) | 112 (95.7%) |
| 45 to 54 Years | 168 (94.9%) | 76 (83.5%) |
| 55 to 64 Years | 245 (92.1%) | 203 (89.8%) |
| 65 to 74 Years | 276 (94.5%) | 189 (92.2%) |
| 75 Years and over | 154 (98.1%) | 103 (80.5%) |
| Total | 1,187 (93.8%) | 932 (90.1%) |
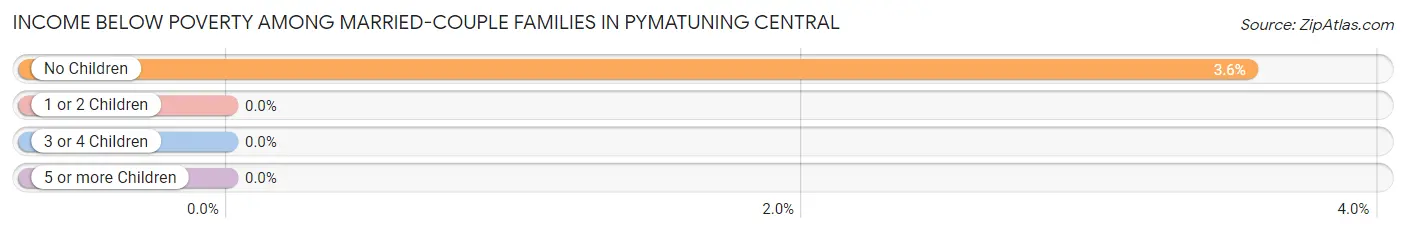
Income Below Poverty Among Married-Couple Families in Pymatuning Central
The poverty statistics for married-couple families in Pymatuning Central show that 3.0% or 15 of the total 505 families live below the poverty line. Families with no children have the highest poverty rate of 3.5%, comprising of 15 families. On the other hand, families with 1 or 2 children have the lowest poverty rate of 0.0%, which includes 0 families.
| Children | Above Poverty | Below Poverty |
| No Children | 407 (96.5%) | 15 (3.5%) |
| 1 or 2 Children | 75 (100.0%) | 0 (0.0%) |
| 3 or 4 Children | 8 (100.0%) | 0 (0.0%) |
| 5 or more Children | 0 (0.0%) | 0 (0.0%) |
| Total | 490 (97.0%) | 15 (3.0%) |
Income Below Poverty Among Single-Parent Households in Pymatuning Central
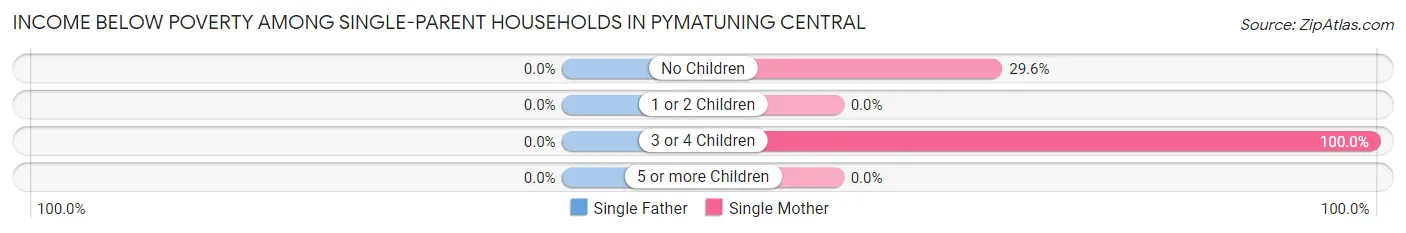
| Children | Single Father | Single Mother |
| No Children | 0 (0.0%) | 13 (29.5%) |
| 1 or 2 Children | 0 (0.0%) | 0 (0.0%) |
| 3 or 4 Children | 0 (0.0%) | 5 (100.0%) |
| 5 or more Children | 0 (0.0%) | 0 (0.0%) |
| Total | 0 (0.0%) | 18 (30.5%) |
Income Below Poverty Among Married-Couple vs Single-Parent Households in Pymatuning Central
The poverty data for Pymatuning Central shows that 15 of the married-couple family households (3.0%) and 18 of the single-parent households (8.8%) are living below the poverty level. Within the married-couple family households, those with no children have the highest poverty rate, with 15 households (3.5%) falling below the poverty line. Among the single-parent households, those with no children have the highest poverty rate, with 13 household (12.9%) living below poverty.
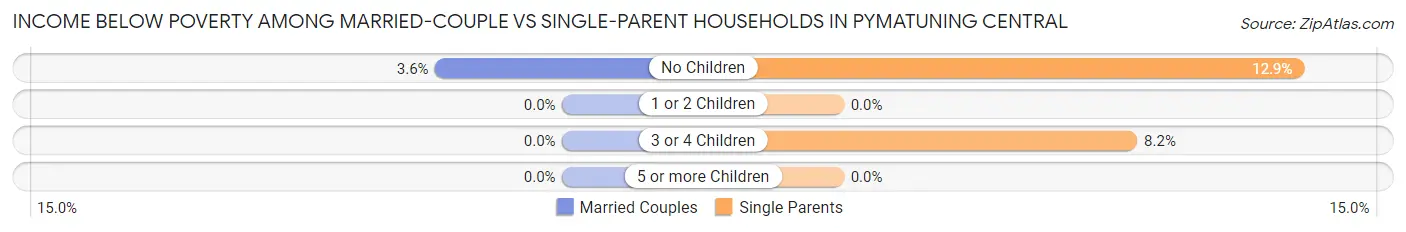
| Children | Married-Couple Families | Single-Parent Households |
| No Children | 15 (3.5%) | 13 (12.9%) |
| 1 or 2 Children | 0 (0.0%) | 0 (0.0%) |
| 3 or 4 Children | 0 (0.0%) | 5 (8.2%) |
| 5 or more Children | 0 (0.0%) | 0 (0.0%) |
| Total | 15 (3.0%) | 18 (8.8%) |
Race in Pymatuning Central
The most populous races in Pymatuning Central are White / Caucasian (2,267 | 97.5%), Hispanic or Latino (39 | 1.7%), and Some other Race (35 | 1.5%).
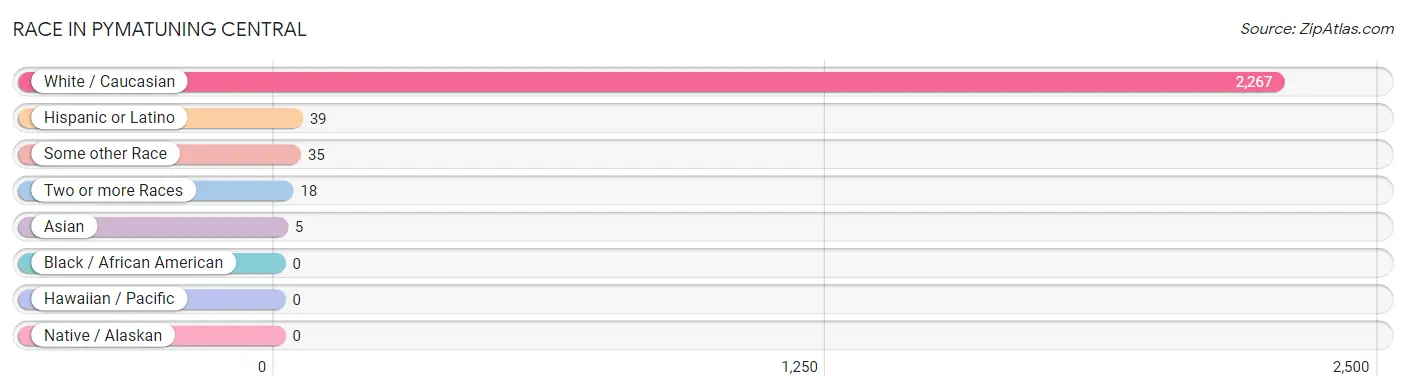
| Race | # Population | % Population |
| Asian | 5 | 0.2% |
| Black / African American | 0 | 0.0% |
| Hawaiian / Pacific | 0 | 0.0% |
| Hispanic or Latino | 39 | 1.7% |
| Native / Alaskan | 0 | 0.0% |
| White / Caucasian | 2,267 | 97.5% |
| Two or more Races | 18 | 0.8% |
| Some other Race | 35 | 1.5% |
| Total | 2,325 | 100.0% |
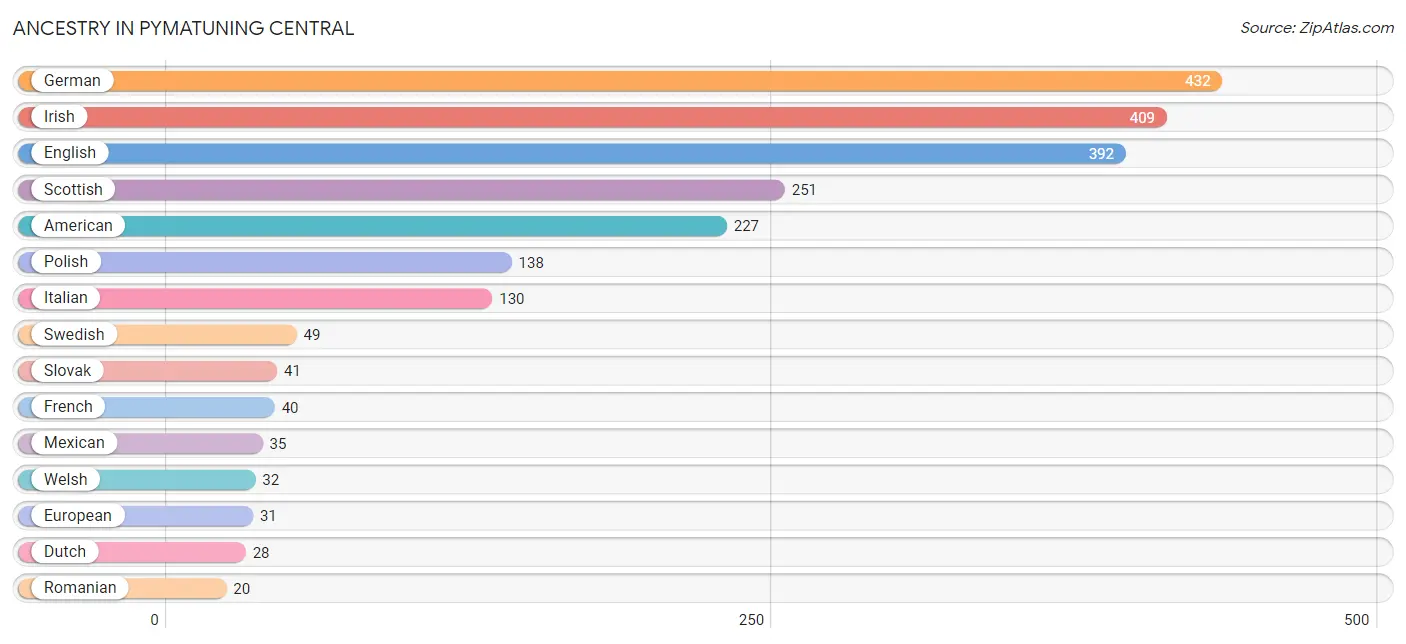
Ancestry in Pymatuning Central
The most populous ancestries reported in Pymatuning Central are German (432 | 18.6%), Irish (409 | 17.6%), English (392 | 16.9%), Scottish (251 | 10.8%), and American (227 | 9.8%), together accounting for 73.6% of all Pymatuning Central residents.
| Ancestry | # Population | % Population |
| American | 227 | 9.8% |
| Arab | 3 | 0.1% |
| Austrian | 3 | 0.1% |
| Belgian | 5 | 0.2% |
| Burmese | 5 | 0.2% |
| Croatian | 8 | 0.3% |
| Czech | 11 | 0.5% |
| Dutch | 28 | 1.2% |
| English | 392 | 16.9% |
| European | 31 | 1.3% |
| Finnish | 4 | 0.2% |
| French | 40 | 1.7% |
| French Canadian | 8 | 0.3% |
| German | 432 | 18.6% |
| Greek | 17 | 0.7% |
| Hungarian | 9 | 0.4% |
| Irish | 409 | 17.6% |
| Italian | 130 | 5.6% |
| Korean | 1 | 0.0% |
| Lebanese | 3 | 0.1% |
| Mexican | 35 | 1.5% |
| Northern European | 5 | 0.2% |
| Norwegian | 6 | 0.3% |
| Pennsylvania German | 5 | 0.2% |
| Polish | 138 | 5.9% |
| Puerto Rican | 4 | 0.2% |
| Romanian | 20 | 0.9% |
| Russian | 19 | 0.8% |
| Scandinavian | 2 | 0.1% |
| Scotch-Irish | 19 | 0.8% |
| Scottish | 251 | 10.8% |
| Slovak | 41 | 1.8% |
| Slovene | 3 | 0.1% |
| Swedish | 49 | 2.1% |
| Swiss | 4 | 0.2% |
| Ukrainian | 9 | 0.4% |
| Welsh | 32 | 1.4% |
| Yugoslavian | 12 | 0.5% | View All 38 Rows |
Immigrants in Pymatuning Central
The most numerous immigrant groups reported in Pymatuning Central came from Europe (12 | 0.5%), Asia (5 | 0.2%), Eastern Asia (5 | 0.2%), England (5 | 0.2%), and Korea (5 | 0.2%), together accounting for 1.4% of all Pymatuning Central residents.
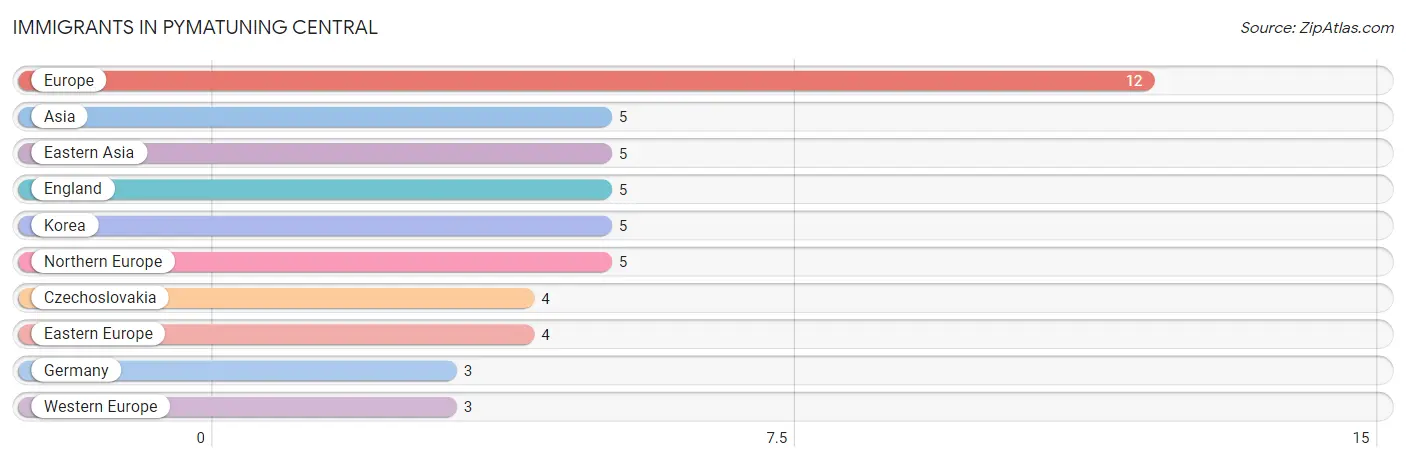
| Immigration Origin | # Population | % Population |
| Asia | 5 | 0.2% |
| Czechoslovakia | 4 | 0.2% |
| Eastern Asia | 5 | 0.2% |
| Eastern Europe | 4 | 0.2% |
| England | 5 | 0.2% |
| Europe | 12 | 0.5% |
| Germany | 3 | 0.1% |
| Korea | 5 | 0.2% |
| Northern Europe | 5 | 0.2% |
| Western Europe | 3 | 0.1% | View All 10 Rows |
Sex and Age in Pymatuning Central
Sex and Age in Pymatuning Central
The most populous age groups in Pymatuning Central are 60 to 64 Years (166 | 12.9%) for men and 60 to 64 Years (155 | 15.0%) for women.
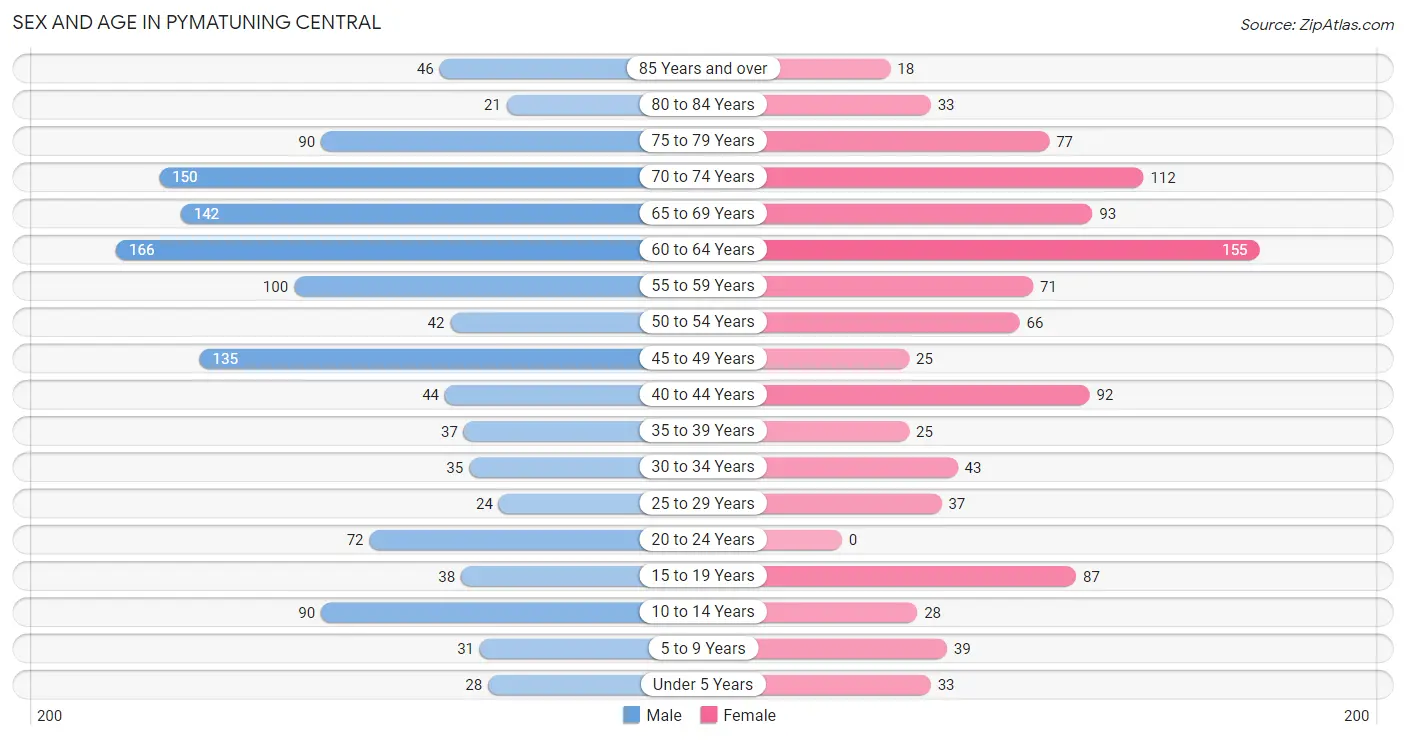
| Age Bracket | Male | Female |
| Under 5 Years | 28 (2.2%) | 33 (3.2%) |
| 5 to 9 Years | 31 (2.4%) | 39 (3.8%) |
| 10 to 14 Years | 90 (7.0%) | 28 (2.7%) |
| 15 to 19 Years | 38 (2.9%) | 87 (8.4%) |
| 20 to 24 Years | 72 (5.6%) | 0 (0.0%) |
| 25 to 29 Years | 24 (1.9%) | 37 (3.6%) |
| 30 to 34 Years | 35 (2.7%) | 43 (4.2%) |
| 35 to 39 Years | 37 (2.9%) | 25 (2.4%) |
| 40 to 44 Years | 44 (3.4%) | 92 (8.9%) |
| 45 to 49 Years | 135 (10.5%) | 25 (2.4%) |
| 50 to 54 Years | 42 (3.3%) | 66 (6.4%) |
| 55 to 59 Years | 100 (7.7%) | 71 (6.9%) |
| 60 to 64 Years | 166 (12.9%) | 155 (15.0%) |
| 65 to 69 Years | 142 (11.0%) | 93 (9.0%) |
| 70 to 74 Years | 150 (11.6%) | 112 (10.8%) |
| 75 to 79 Years | 90 (7.0%) | 77 (7.4%) |
| 80 to 84 Years | 21 (1.6%) | 33 (3.2%) |
| 85 Years and over | 46 (3.6%) | 18 (1.7%) |
| Total | 1,291 (100.0%) | 1,034 (100.0%) |
Families and Households in Pymatuning Central
Median Family Size in Pymatuning Central
The median family size in Pymatuning Central is 2.56 persons per family, with single male/father families (145 | 20.4%) accounting for the largest median family size of 3.32 persons per family. On the other hand, single female/mother families (59 | 8.3%) represent the smallest median family size with 2.17 persons per family.
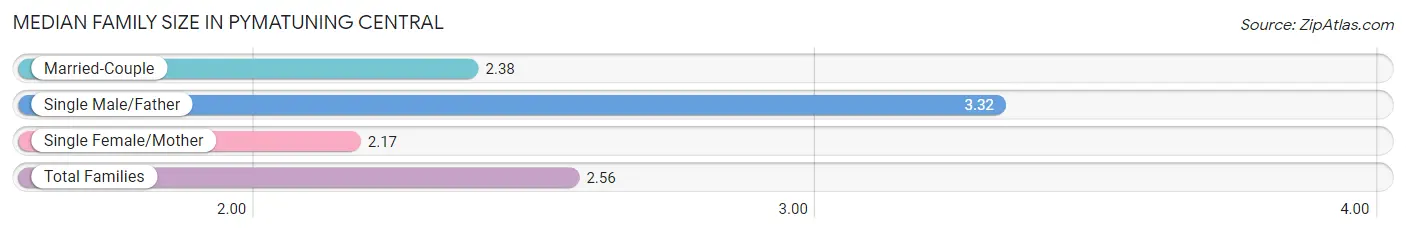
| Family Type | # Families | Family Size |
| Married-Couple | 505 (71.2%) | 2.38 |
| Single Male/Father | 145 (20.4%) | 3.32 |
| Single Female/Mother | 59 (8.3%) | 2.17 |
| Total Families | 709 (100.0%) | 2.56 |
Median Household Size in Pymatuning Central
The median household size in Pymatuning Central is 2.13 persons per household, with single male/father households (145 | 13.4%) accounting for the largest median household size of 3.43 persons per household. non-family households (373 | 34.5%) represent the smallest median household size with 1.24 persons per household.
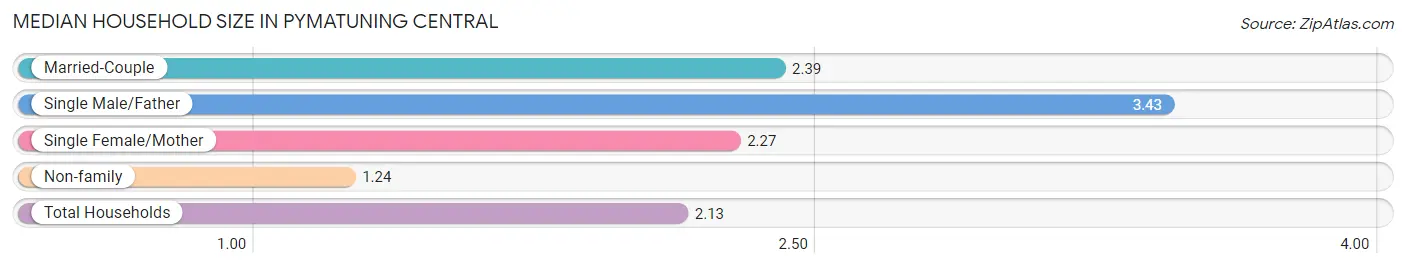
| Household Type | # Households | Household Size |
| Married-Couple | 505 (46.7%) | 2.39 |
| Single Male/Father | 145 (13.4%) | 3.43 |
| Single Female/Mother | 59 (5.4%) | 2.27 |
| Non-family | 373 (34.5%) | 1.24 |
| Total Households | 1,082 (100.0%) | 2.13 |
Household Size by Marriage Status in Pymatuning Central
Out of a total of 1,082 households in Pymatuning Central, 709 (65.5%) are family households, while 373 (34.5%) are nonfamily households. The most numerous type of family households are 2-person households, comprising 439, and the most common type of nonfamily households are 1-person households, comprising 286.
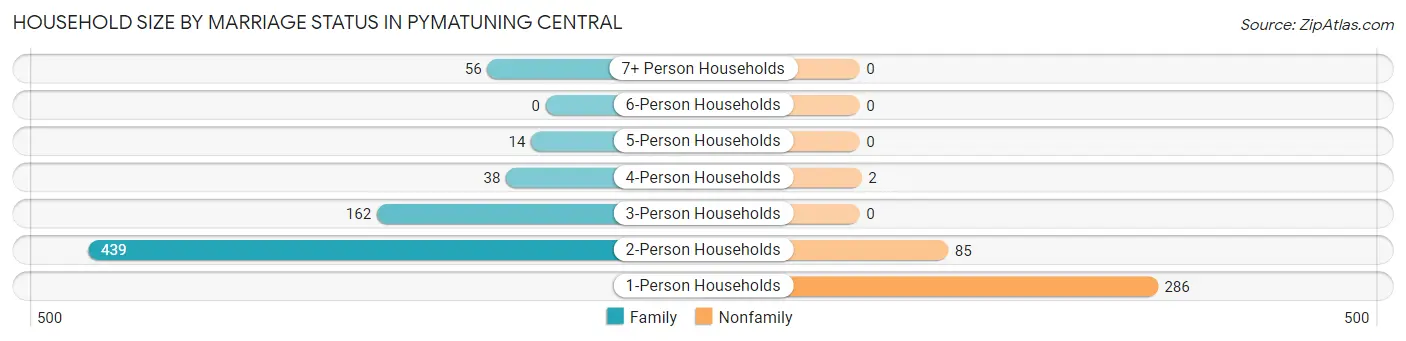
| Household Size | Family Households | Nonfamily Households |
| 1-Person Households | - | 286 (26.4%) |
| 2-Person Households | 439 (40.6%) | 85 (7.9%) |
| 3-Person Households | 162 (15.0%) | 0 (0.0%) |
| 4-Person Households | 38 (3.5%) | 2 (0.2%) |
| 5-Person Households | 14 (1.3%) | 0 (0.0%) |
| 6-Person Households | 0 (0.0%) | 0 (0.0%) |
| 7+ Person Households | 56 (5.2%) | 0 (0.0%) |
| Total | 709 (65.5%) | 373 (34.5%) |
Female Fertility in Pymatuning Central
Fertility by Age in Pymatuning Central
Average fertility rate in Pymatuning Central is 71.0 births per 1,000 women. Women in the age bracket of 20 to 34 years have the highest fertility rate with 125.0 births per 1,000 women. Women in the age bracket of 35 to 50 years acount for 56.5% of all women with births.
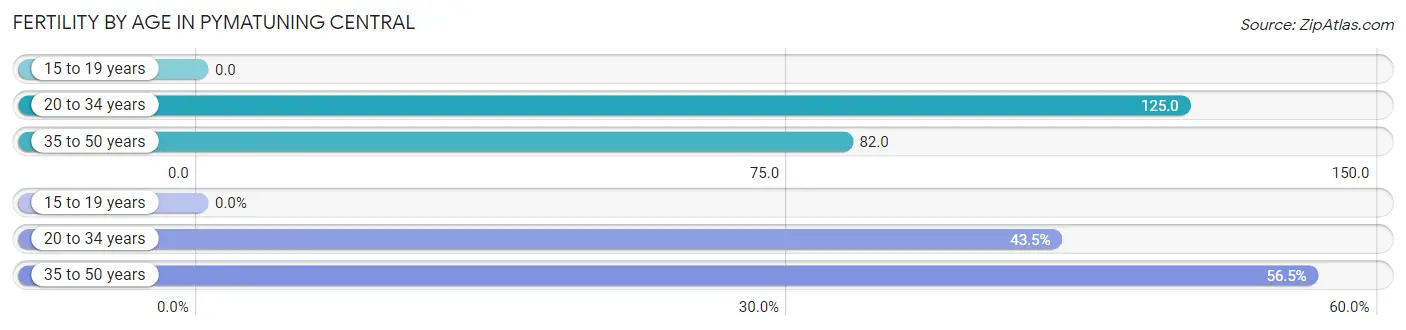
| Age Bracket | Women with Births | Births / 1,000 Women |
| 15 to 19 years | 0 (0.0%) | 0.0 |
| 20 to 34 years | 10 (43.5%) | 125.0 |
| 35 to 50 years | 13 (56.5%) | 82.0 |
| Total | 23 (100.0%) | 71.0 |
Fertility by Age by Marriage Status in Pymatuning Central
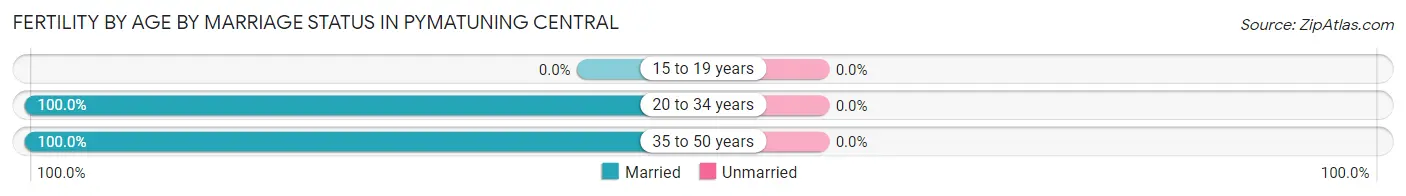
| Age Bracket | Married | Unmarried |
| 15 to 19 years | 0 (0.0%) | 0 (0.0%) |
| 20 to 34 years | 10 (100.0%) | 0 (0.0%) |
| 35 to 50 years | 13 (100.0%) | 0 (0.0%) |
| Total | 23 (100.0%) | 0 (0.0%) |
Fertility by Education in Pymatuning Central
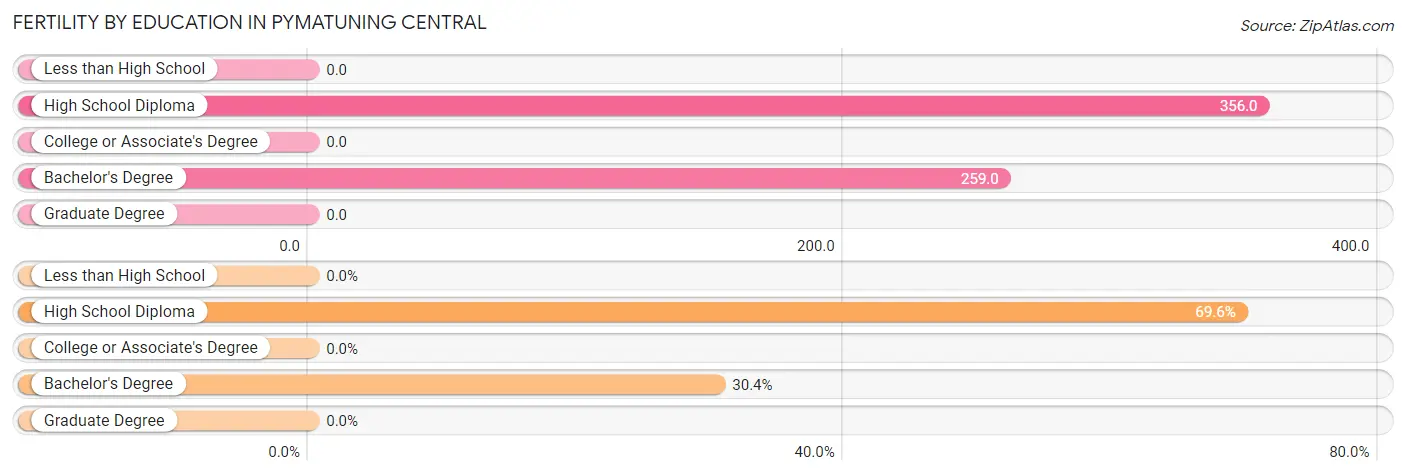
| Educational Attainment | Women with Births | Births / 1,000 Women |
| Less than High School | 0 (0.0%) | 0.0 |
| High School Diploma | 16 (69.6%) | 356.0 |
| College or Associate's Degree | 0 (0.0%) | 0.0 |
| Bachelor's Degree | 7 (30.4%) | 259.0 |
| Graduate Degree | 0 (0.0%) | 0.0 |
| Total | 23 (100.0%) | 71.0 |
Fertility by Education by Marriage Status in Pymatuning Central
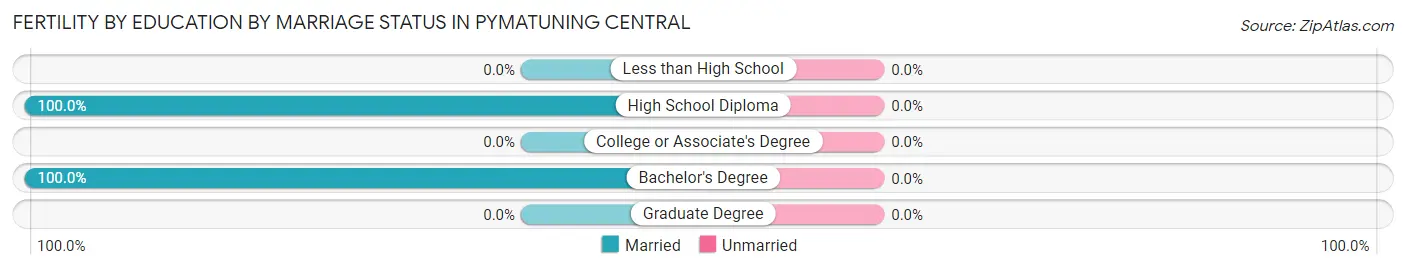
| Educational Attainment | Married | Unmarried |
| Less than High School | 0 (0.0%) | 0 (0.0%) |
| High School Diploma | 16 (100.0%) | 0 (0.0%) |
| College or Associate's Degree | 0 (0.0%) | 0 (0.0%) |
| Bachelor's Degree | 7 (100.0%) | 0 (0.0%) |
| Graduate Degree | 0 (0.0%) | 0 (0.0%) |
| Total | 23 (100.0%) | 0 (0.0%) |
Employment Characteristics in Pymatuning Central
Employment by Class of Employer in Pymatuning Central
Among the 794 employed individuals in Pymatuning Central, private company employees (493 | 62.1%), self-employed (incorporated) (102 | 12.9%), and not-for-profit organizations (86 | 10.8%) make up the most common classes of employment.
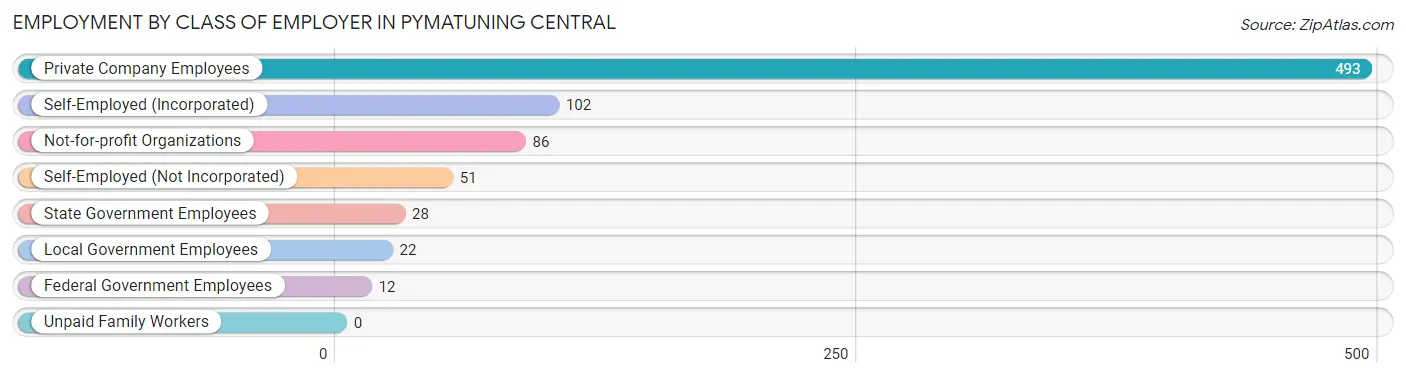
| Employer Class | # Employees | % Employees |
| Private Company Employees | 493 | 62.1% |
| Self-Employed (Incorporated) | 102 | 12.9% |
| Self-Employed (Not Incorporated) | 51 | 6.4% |
| Not-for-profit Organizations | 86 | 10.8% |
| Local Government Employees | 22 | 2.8% |
| State Government Employees | 28 | 3.5% |
| Federal Government Employees | 12 | 1.5% |
| Unpaid Family Workers | 0 | 0.0% |
| Total | 794 | 100.0% |
Employment Status by Age in Pymatuning Central
According to the labor force statistics for Pymatuning Central, out of the total population over 16 years of age (2,061), 41.3% or 851 individuals are in the labor force, with 4.1% or 35 of them unemployed. The age group with the highest labor force participation rate is 30 to 34 years, with 97.4% or 76 individuals in the labor force. Within the labor force, the 30 to 34 years age range has the highest percentage of unemployed individuals, with 11.8% or 9 of them being unemployed.
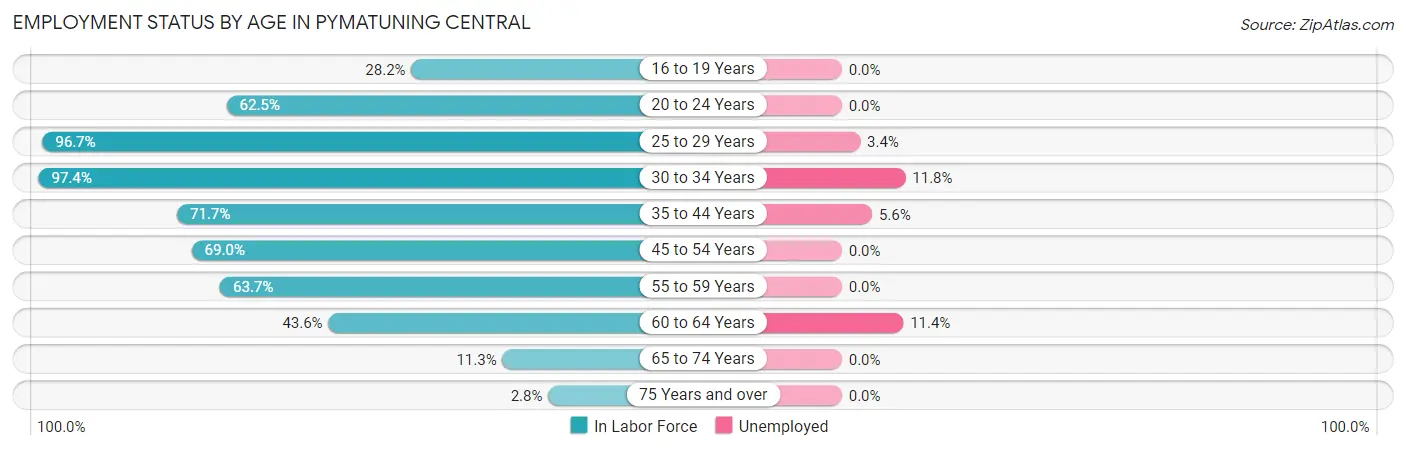
| Age Bracket | In Labor Force | Unemployed |
| 16 to 19 Years | 31 (28.2%) | 0 (0.0%) |
| 20 to 24 Years | 45 (62.5%) | 0 (0.0%) |
| 25 to 29 Years | 59 (96.7%) | 2 (3.4%) |
| 30 to 34 Years | 76 (97.4%) | 9 (11.8%) |
| 35 to 44 Years | 142 (71.7%) | 8 (5.6%) |
| 45 to 54 Years | 185 (69.0%) | 0 (0.0%) |
| 55 to 59 Years | 109 (63.7%) | 0 (0.0%) |
| 60 to 64 Years | 140 (43.6%) | 16 (11.4%) |
| 65 to 74 Years | 56 (11.3%) | 0 (0.0%) |
| 75 Years and over | 8 (2.8%) | 0 (0.0%) |
| Total | 851 (41.3%) | 35 (4.1%) |
Employment Status by Educational Attainment in Pymatuning Central
According to labor force statistics for Pymatuning Central, 64.8% of individuals (711) out of the total population between 25 and 64 years of age (1,097) are in the labor force, with 4.9% or 35 of them being unemployed. The group with the highest labor force participation rate are those with the educational attainment of college / associate degree, with 72.1% or 305 individuals in the labor force. Within the labor force, individuals with high school diploma education have the highest percentage of unemployment, with 9.5% or 27 of them being unemployed.
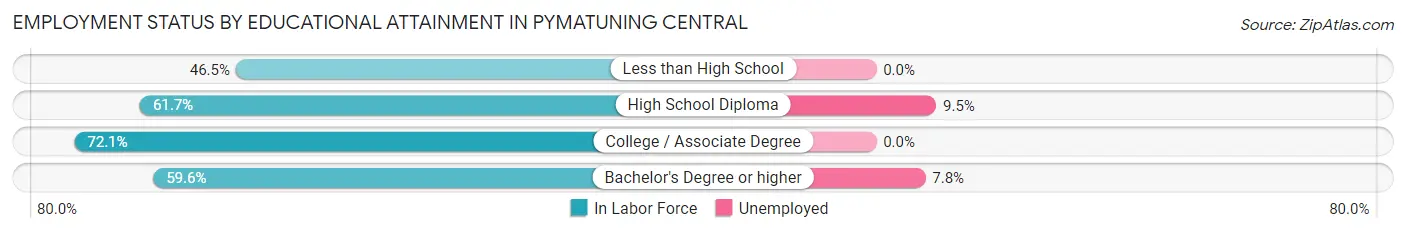
| Educational Attainment | In Labor Force | Unemployed |
| Less than High School | 20 (46.5%) | 0 (0.0%) |
| High School Diploma | 284 (61.7%) | 44 (9.5%) |
| College / Associate Degree | 305 (72.1%) | 0 (0.0%) |
| Bachelor's Degree or higher | 102 (59.6%) | 13 (7.8%) |
| Total | 711 (64.8%) | 54 (4.9%) |
Employment Occupations by Sex in Pymatuning Central
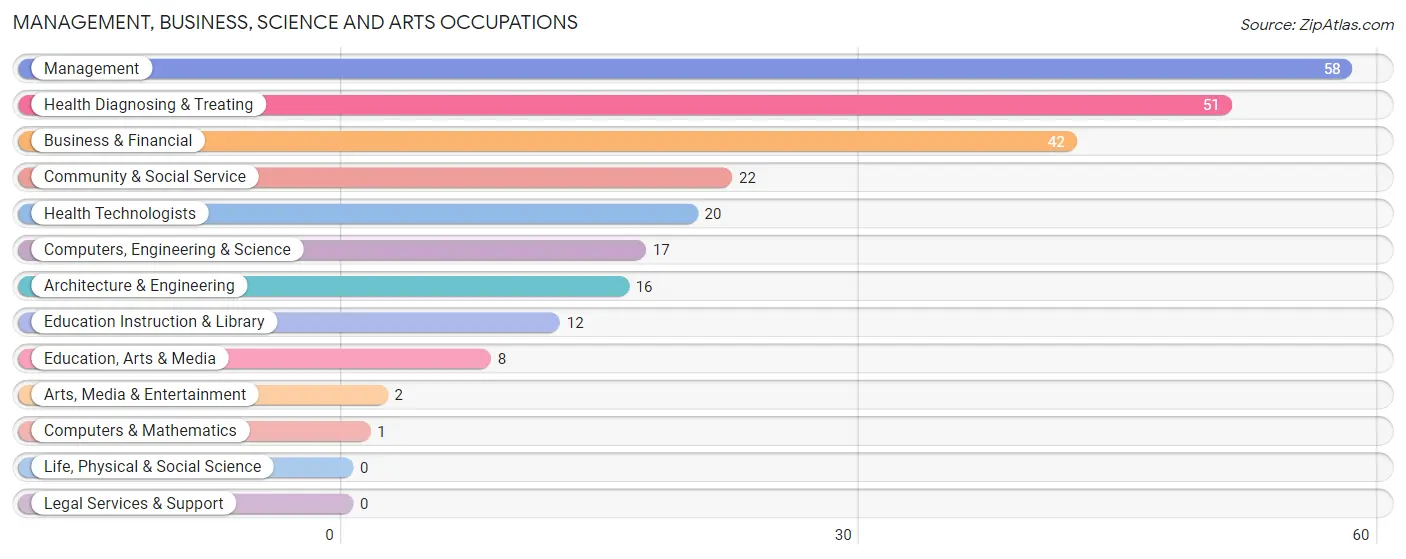
Management, Business, Science and Arts Occupations
The most common Management, Business, Science and Arts occupations in Pymatuning Central are Management (58 | 7.1%), Health Diagnosing & Treating (51 | 6.2%), Business & Financial (42 | 5.1%), Community & Social Service (22 | 2.7%), and Health Technologists (20 | 2.5%).
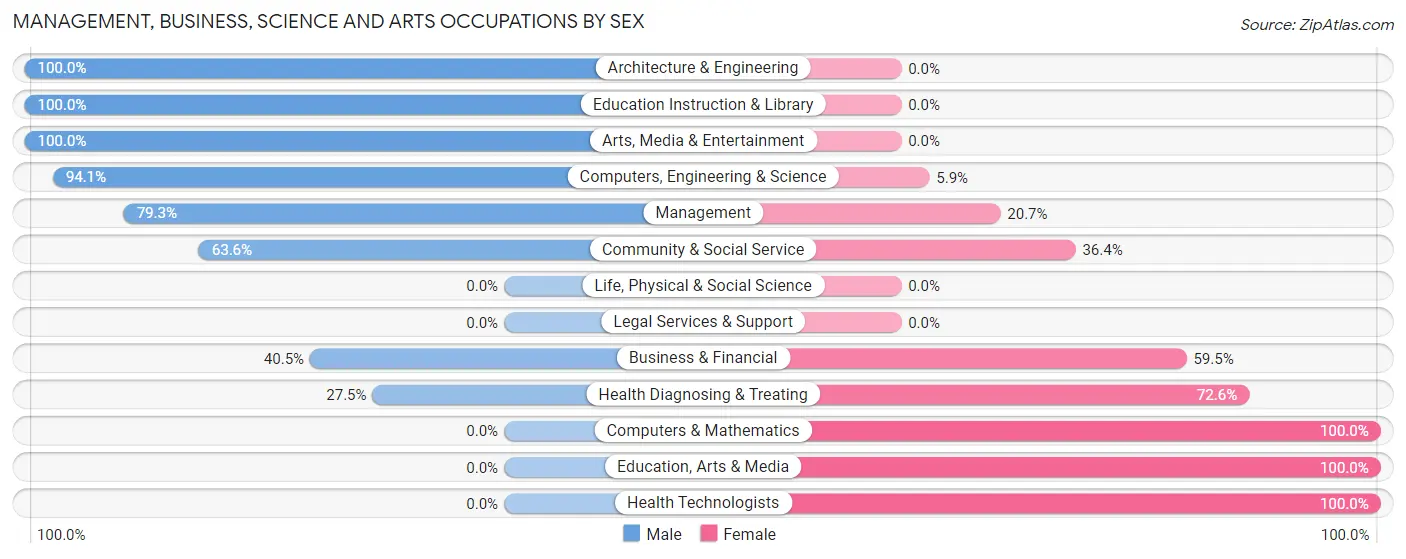
Management, Business, Science and Arts Occupations by Sex
Within the Management, Business, Science and Arts occupations in Pymatuning Central, the most male-oriented occupations are Architecture & Engineering (100.0%), Education Instruction & Library (100.0%), and Arts, Media & Entertainment (100.0%), while the most female-oriented occupations are Computers & Mathematics (100.0%), Education, Arts & Media (100.0%), and Health Technologists (100.0%).
| Occupation | Male | Female |
| Management | 46 (79.3%) | 12 (20.7%) |
| Business & Financial | 17 (40.5%) | 25 (59.5%) |
| Computers, Engineering & Science | 16 (94.1%) | 1 (5.9%) |
| Computers & Mathematics | 0 (0.0%) | 1 (100.0%) |
| Architecture & Engineering | 16 (100.0%) | 0 (0.0%) |
| Life, Physical & Social Science | 0 (0.0%) | 0 (0.0%) |
| Community & Social Service | 14 (63.6%) | 8 (36.4%) |
| Education, Arts & Media | 0 (0.0%) | 8 (100.0%) |
| Legal Services & Support | 0 (0.0%) | 0 (0.0%) |
| Education Instruction & Library | 12 (100.0%) | 0 (0.0%) |
| Arts, Media & Entertainment | 2 (100.0%) | 0 (0.0%) |
| Health Diagnosing & Treating | 14 (27.5%) | 37 (72.6%) |
| Health Technologists | 0 (0.0%) | 20 (100.0%) |
| Total (Category) | 107 (56.3%) | 83 (43.7%) |
| Total (Overall) | 475 (58.2%) | 341 (41.8%) |
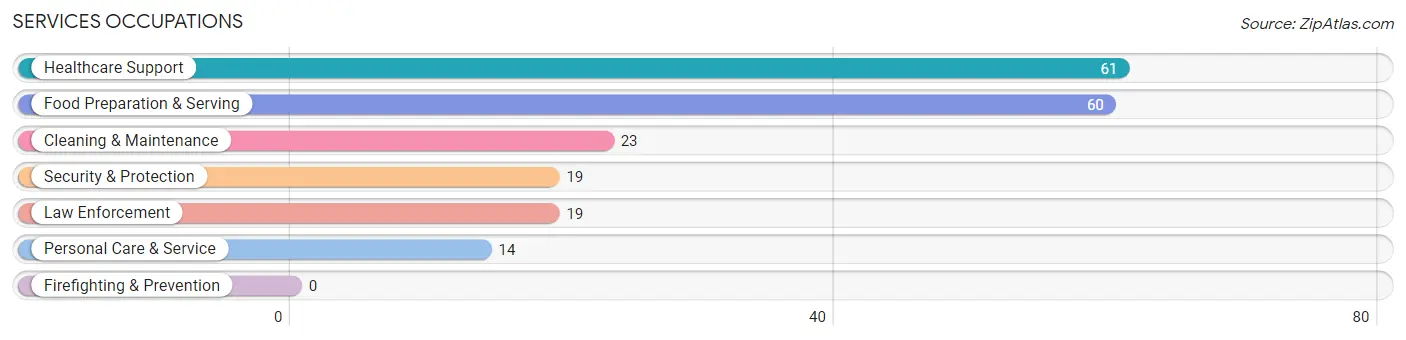
Services Occupations
The most common Services occupations in Pymatuning Central are Healthcare Support (61 | 7.5%), Food Preparation & Serving (60 | 7.3%), Cleaning & Maintenance (23 | 2.8%), Security & Protection (19 | 2.3%), and Law Enforcement (19 | 2.3%).
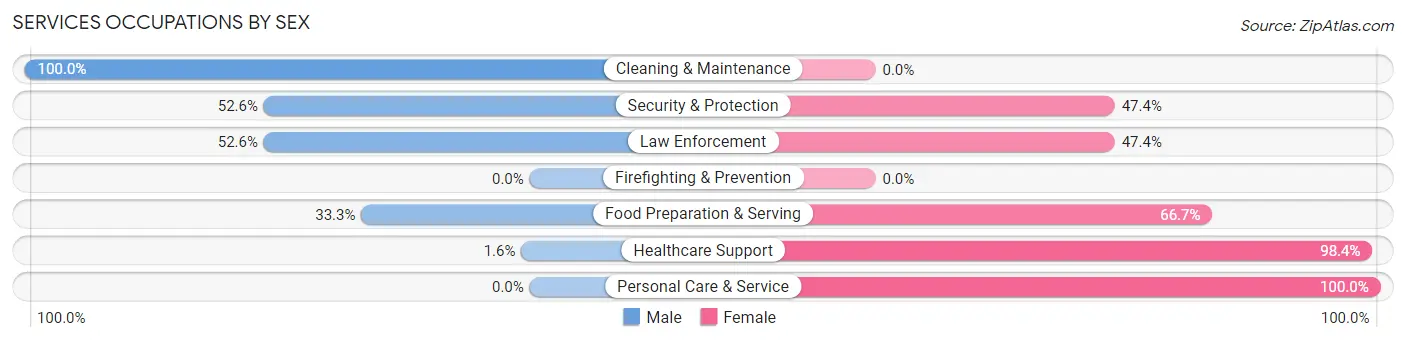
Services Occupations by Sex
Within the Services occupations in Pymatuning Central, the most male-oriented occupations are Cleaning & Maintenance (100.0%), Security & Protection (52.6%), and Law Enforcement (52.6%), while the most female-oriented occupations are Personal Care & Service (100.0%), Healthcare Support (98.4%), and Food Preparation & Serving (66.7%).
| Occupation | Male | Female |
| Healthcare Support | 1 (1.6%) | 60 (98.4%) |
| Security & Protection | 10 (52.6%) | 9 (47.4%) |
| Firefighting & Prevention | 0 (0.0%) | 0 (0.0%) |
| Law Enforcement | 10 (52.6%) | 9 (47.4%) |
| Food Preparation & Serving | 20 (33.3%) | 40 (66.7%) |
| Cleaning & Maintenance | 23 (100.0%) | 0 (0.0%) |
| Personal Care & Service | 0 (0.0%) | 14 (100.0%) |
| Total (Category) | 54 (30.5%) | 123 (69.5%) |
| Total (Overall) | 475 (58.2%) | 341 (41.8%) |
Sales and Office Occupations
The most common Sales and Office occupations in Pymatuning Central are Office & Administration (76 | 9.3%), and Sales & Related (40 | 4.9%).

Sales and Office Occupations by Sex
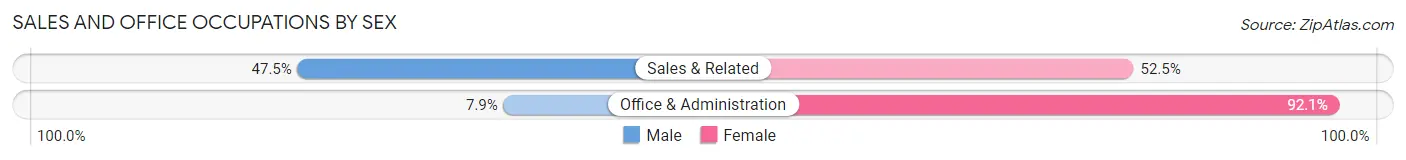
| Occupation | Male | Female |
| Sales & Related | 19 (47.5%) | 21 (52.5%) |
| Office & Administration | 6 (7.9%) | 70 (92.1%) |
| Total (Category) | 25 (21.5%) | 91 (78.4%) |
| Total (Overall) | 475 (58.2%) | 341 (41.8%) |
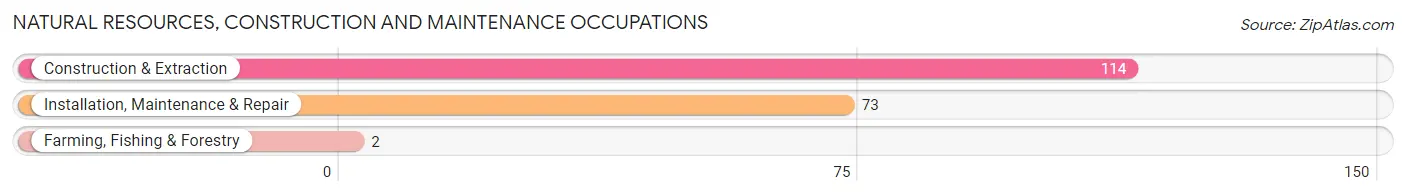
Natural Resources, Construction and Maintenance Occupations
The most common Natural Resources, Construction and Maintenance occupations in Pymatuning Central are Construction & Extraction (114 | 14.0%), Installation, Maintenance & Repair (73 | 8.9%), and Farming, Fishing & Forestry (2 | 0.3%).
Natural Resources, Construction and Maintenance Occupations by Sex
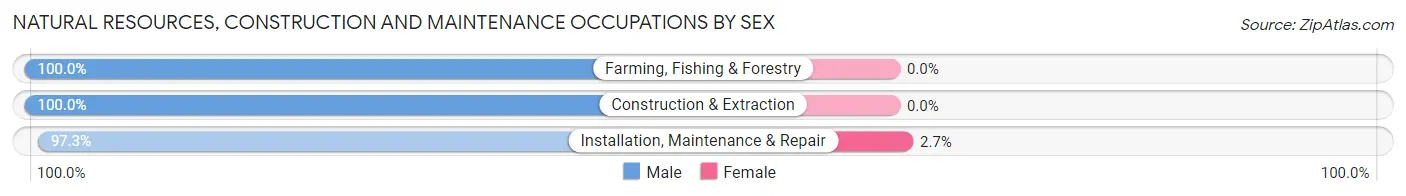
| Occupation | Male | Female |
| Farming, Fishing & Forestry | 2 (100.0%) | 0 (0.0%) |
| Construction & Extraction | 114 (100.0%) | 0 (0.0%) |
| Installation, Maintenance & Repair | 71 (97.3%) | 2 (2.7%) |
| Total (Category) | 187 (98.9%) | 2 (1.1%) |
| Total (Overall) | 475 (58.2%) | 341 (41.8%) |
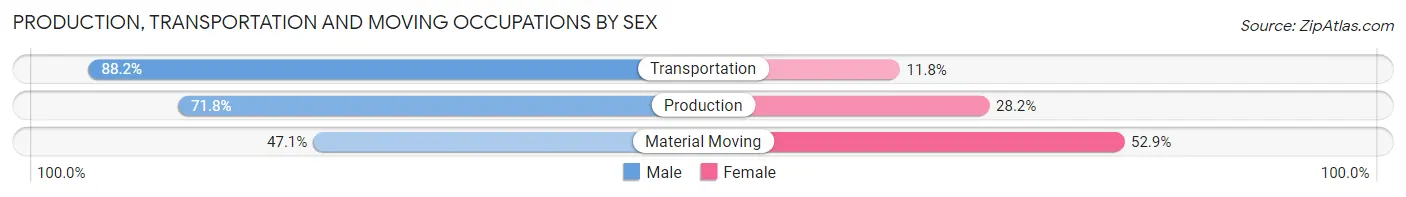
Production, Transportation and Moving Occupations
The most common Production, Transportation and Moving occupations in Pymatuning Central are Production (110 | 13.5%), Transportation (17 | 2.1%), and Material Moving (17 | 2.1%).
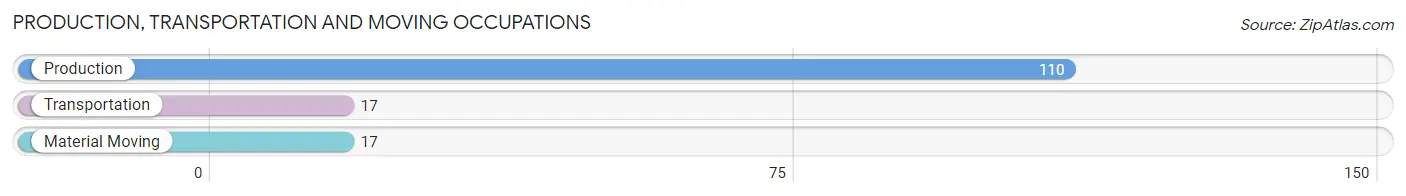
Production, Transportation and Moving Occupations by Sex
| Occupation | Male | Female |
| Production | 79 (71.8%) | 31 (28.2%) |
| Transportation | 15 (88.2%) | 2 (11.8%) |
| Material Moving | 8 (47.1%) | 9 (52.9%) |
| Total (Category) | 102 (70.8%) | 42 (29.2%) |
| Total (Overall) | 475 (58.2%) | 341 (41.8%) |
Employment Industries by Sex in Pymatuning Central
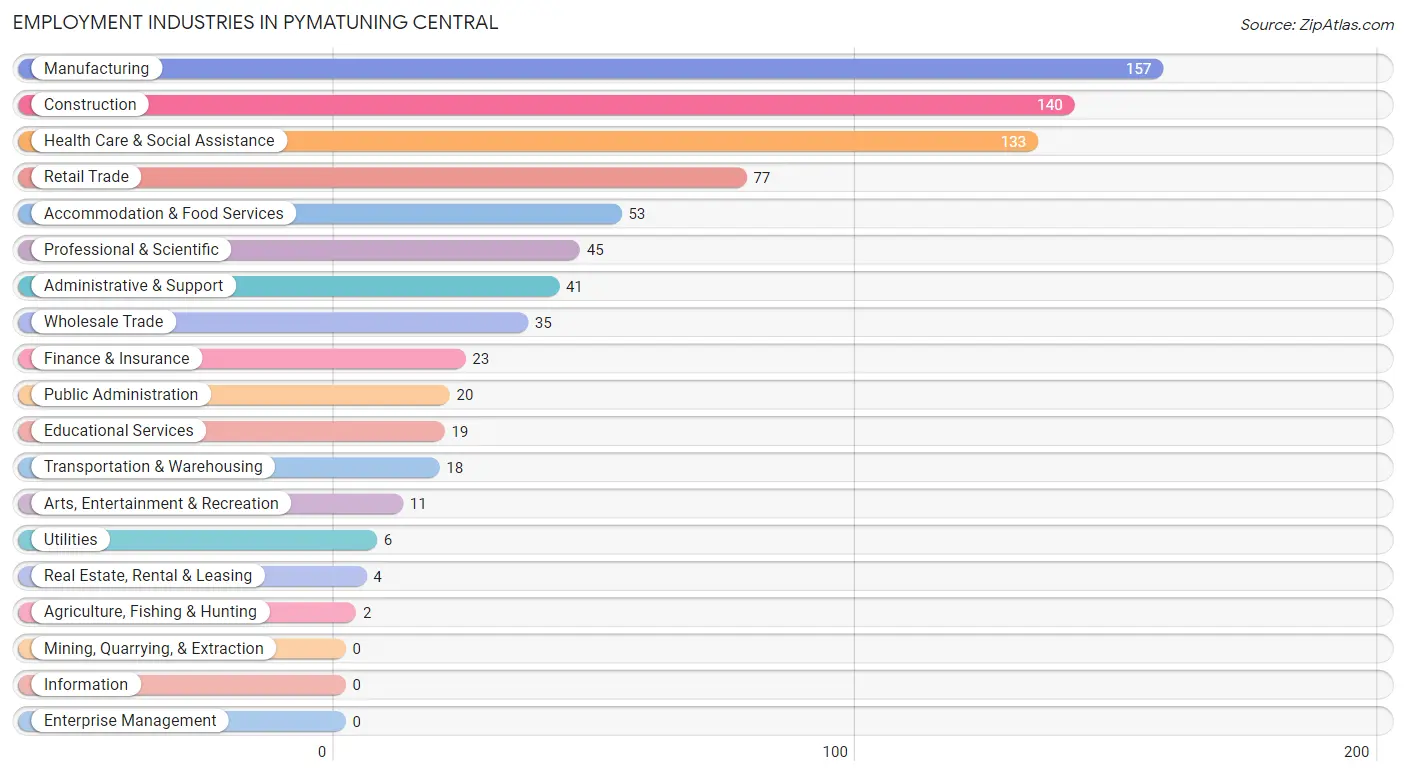
Employment Industries in Pymatuning Central
The major employment industries in Pymatuning Central include Manufacturing (157 | 19.2%), Construction (140 | 17.2%), Health Care & Social Assistance (133 | 16.3%), Retail Trade (77 | 9.4%), and Accommodation & Food Services (53 | 6.5%).
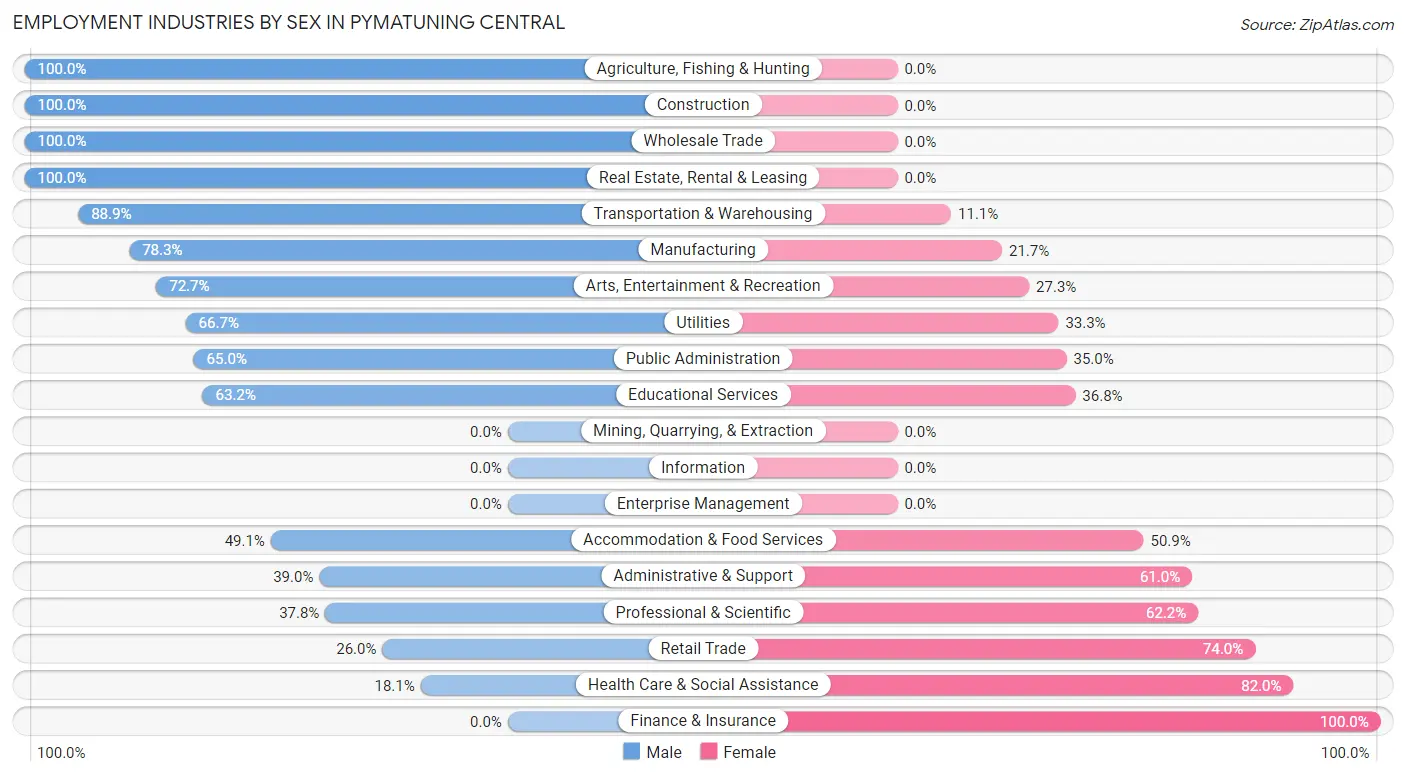
Employment Industries by Sex in Pymatuning Central
The Pymatuning Central industries that see more men than women are Agriculture, Fishing & Hunting (100.0%), Construction (100.0%), and Wholesale Trade (100.0%), whereas the industries that tend to have a higher number of women are Finance & Insurance (100.0%), Health Care & Social Assistance (82.0%), and Retail Trade (74.0%).
| Industry | Male | Female |
| Agriculture, Fishing & Hunting | 2 (100.0%) | 0 (0.0%) |
| Mining, Quarrying, & Extraction | 0 (0.0%) | 0 (0.0%) |
| Construction | 140 (100.0%) | 0 (0.0%) |
| Manufacturing | 123 (78.3%) | 34 (21.7%) |
| Wholesale Trade | 35 (100.0%) | 0 (0.0%) |
| Retail Trade | 20 (26.0%) | 57 (74.0%) |
| Transportation & Warehousing | 16 (88.9%) | 2 (11.1%) |
| Utilities | 4 (66.7%) | 2 (33.3%) |
| Information | 0 (0.0%) | 0 (0.0%) |
| Finance & Insurance | 0 (0.0%) | 23 (100.0%) |
| Real Estate, Rental & Leasing | 4 (100.0%) | 0 (0.0%) |
| Professional & Scientific | 17 (37.8%) | 28 (62.2%) |
| Enterprise Management | 0 (0.0%) | 0 (0.0%) |
| Administrative & Support | 16 (39.0%) | 25 (61.0%) |
| Educational Services | 12 (63.2%) | 7 (36.8%) |
| Health Care & Social Assistance | 24 (18.0%) | 109 (82.0%) |
| Arts, Entertainment & Recreation | 8 (72.7%) | 3 (27.3%) |
| Accommodation & Food Services | 26 (49.1%) | 27 (50.9%) |
| Public Administration | 13 (65.0%) | 7 (35.0%) |
| Total | 475 (58.2%) | 341 (41.8%) |
Education in Pymatuning Central
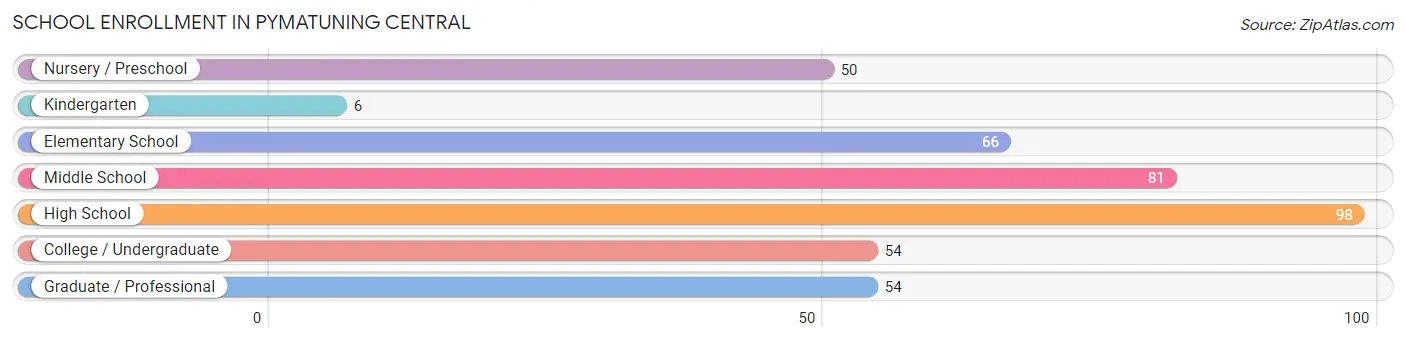
School Enrollment in Pymatuning Central
The most common levels of schooling among the 409 students in Pymatuning Central are high school (98 | 24.0%), middle school (81 | 19.8%), and elementary school (66 | 16.1%).
| School Level | # Students | % Students |
| Nursery / Preschool | 50 | 12.2% |
| Kindergarten | 6 | 1.5% |
| Elementary School | 66 | 16.1% |
| Middle School | 81 | 19.8% |
| High School | 98 | 24.0% |
| College / Undergraduate | 54 | 13.2% |
| Graduate / Professional | 54 | 13.2% |
| Total | 409 | 100.0% |
School Enrollment by Age by Funding Source in Pymatuning Central
Out of a total of 409 students who are enrolled in schools in Pymatuning Central, 52 (12.7%) attend a private institution, while the remaining 357 (87.3%) are enrolled in public schools. The age group of 20 to 24 year olds has the highest likelihood of being enrolled in private schools, with 27 (84.4% in the age bracket) enrolled. Conversely, the age group of 5 to 9 year old has the lowest likelihood of being enrolled in a private school, with 70 (100.0% in the age bracket) attending a public institution.
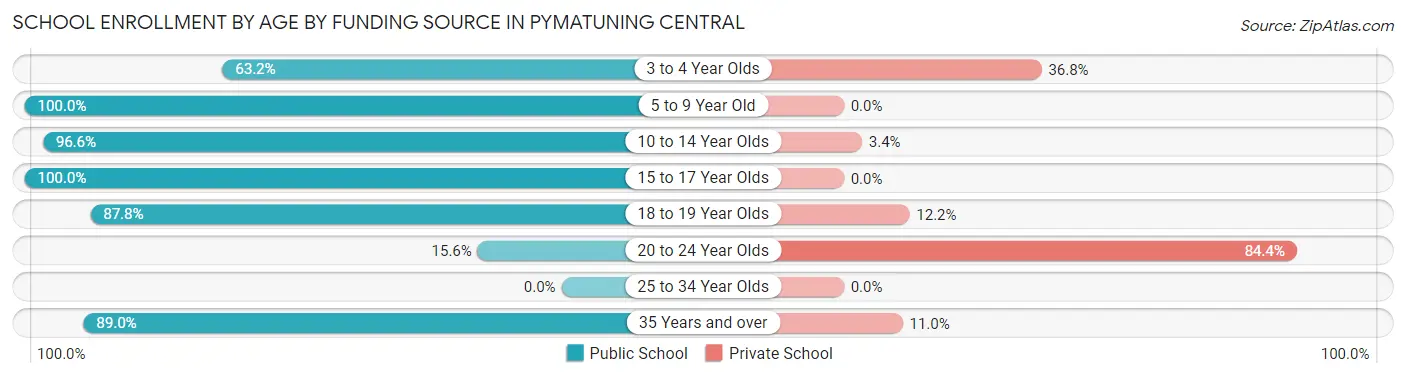
| Age Bracket | Public School | Private School |
| 3 to 4 Year Olds | 12 (63.2%) | 7 (36.8%) |
| 5 to 9 Year Old | 70 (100.0%) | 0 (0.0%) |
| 10 to 14 Year Olds | 114 (96.6%) | 4 (3.4%) |
| 15 to 17 Year Olds | 48 (100.0%) | 0 (0.0%) |
| 18 to 19 Year Olds | 43 (87.8%) | 6 (12.2%) |
| 20 to 24 Year Olds | 5 (15.6%) | 27 (84.4%) |
| 25 to 34 Year Olds | 0 (0.0%) | 0 (0.0%) |
| 35 Years and over | 65 (89.0%) | 8 (11.0%) |
| Total | 357 (87.3%) | 52 (12.7%) |
Educational Attainment by Field of Study in Pymatuning Central
Science & technology (112 | 32.8%), education (75 | 21.9%), business (47 | 13.7%), bio, nature & agricultural (33 | 9.7%), and computers & mathematics (21 | 6.1%) are the most common fields of study among 342 individuals in Pymatuning Central who have obtained a bachelor's degree or higher.
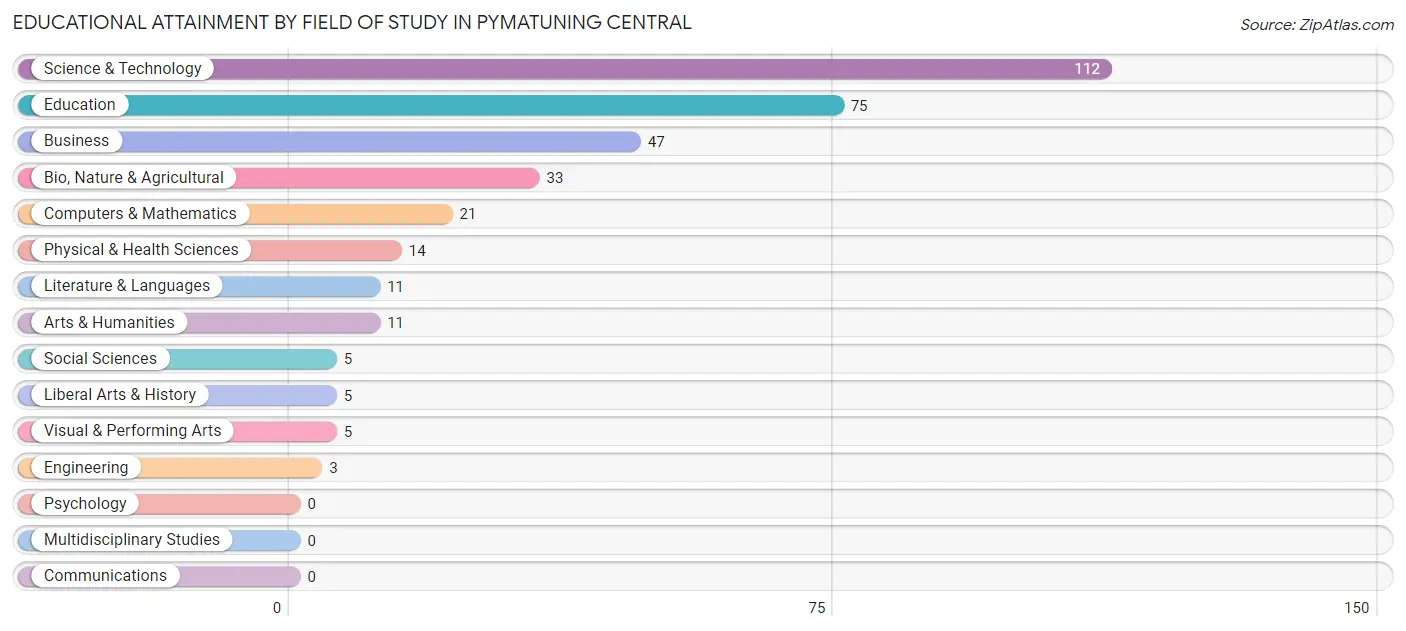
| Field of Study | # Graduates | % Graduates |
| Computers & Mathematics | 21 | 6.1% |
| Bio, Nature & Agricultural | 33 | 9.7% |
| Physical & Health Sciences | 14 | 4.1% |
| Psychology | 0 | 0.0% |
| Social Sciences | 5 | 1.5% |
| Engineering | 3 | 0.9% |
| Multidisciplinary Studies | 0 | 0.0% |
| Science & Technology | 112 | 32.8% |
| Business | 47 | 13.7% |
| Education | 75 | 21.9% |
| Literature & Languages | 11 | 3.2% |
| Liberal Arts & History | 5 | 1.5% |
| Visual & Performing Arts | 5 | 1.5% |
| Communications | 0 | 0.0% |
| Arts & Humanities | 11 | 3.2% |
| Total | 342 | 100.0% |
Transportation & Commute in Pymatuning Central
Vehicle Availability by Sex in Pymatuning Central
The most prevalent vehicle ownership categories in Pymatuning Central are males with 2 vehicles (219, accounting for 46.4%) and females with 2 vehicles (161, making up 68.0%).
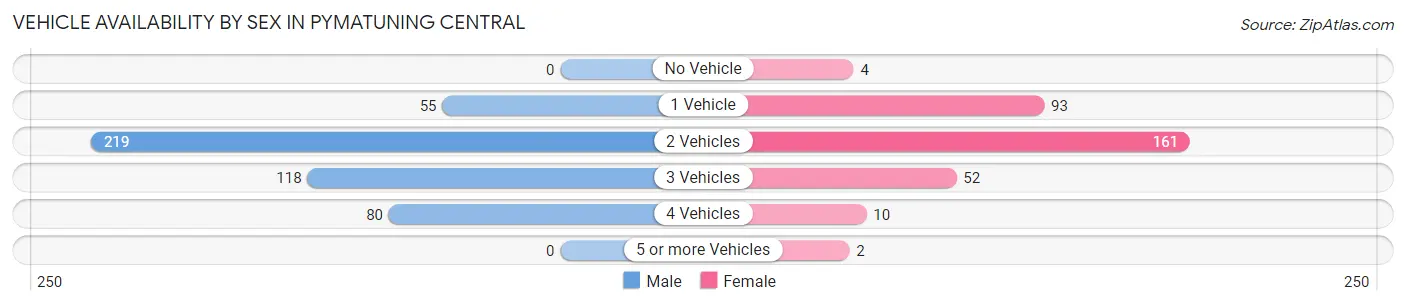
| Vehicles Available | Male | Female |
| No Vehicle | 0 (0.0%) | 4 (1.2%) |
| 1 Vehicle | 55 (11.7%) | 93 (28.9%) |
| 2 Vehicles | 219 (46.4%) | 161 (50.0%) |
| 3 Vehicles | 118 (25.0%) | 52 (16.2%) |
| 4 Vehicles | 80 (17.0%) | 10 (3.1%) |
| 5 or more Vehicles | 0 (0.0%) | 2 (0.6%) |
| Total | 472 (100.0%) | 322 (100.0%) |
Commute Time in Pymatuning Central
The most frequently occuring commute durations in Pymatuning Central are 30 to 34 minutes (116 commuters, 16.0%), 60 to 89 minutes (91 commuters, 12.6%), and 45 to 59 minutes (90 commuters, 12.4%).
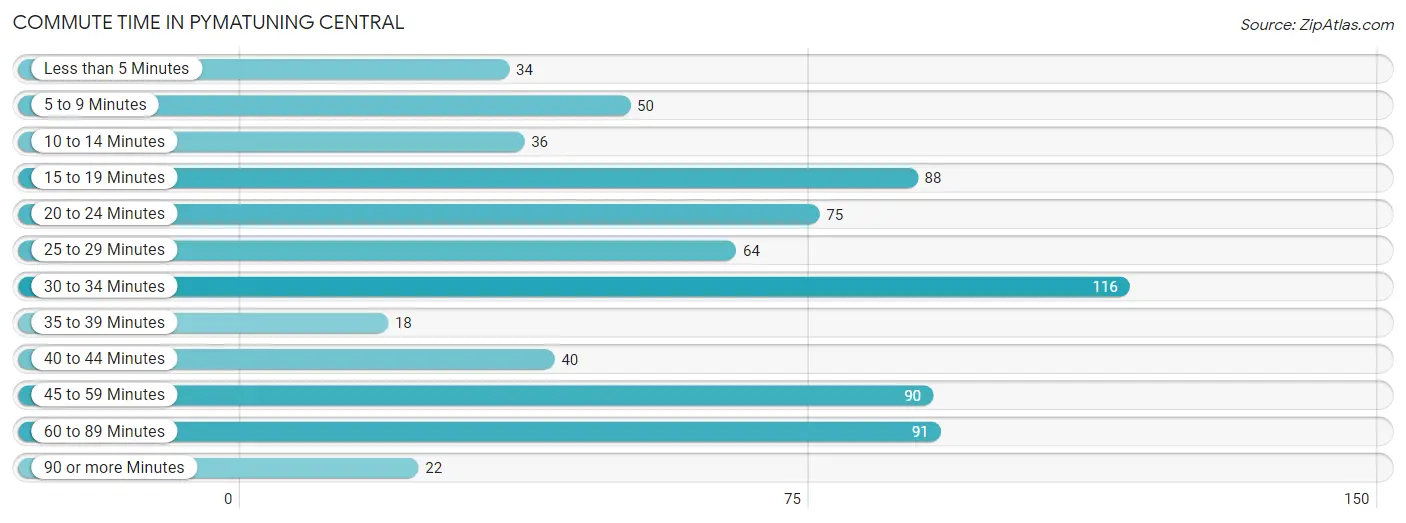
| Commute Time | # Commuters | % Commuters |
| Less than 5 Minutes | 34 | 4.7% |
| 5 to 9 Minutes | 50 | 6.9% |
| 10 to 14 Minutes | 36 | 5.0% |
| 15 to 19 Minutes | 88 | 12.1% |
| 20 to 24 Minutes | 75 | 10.4% |
| 25 to 29 Minutes | 64 | 8.8% |
| 30 to 34 Minutes | 116 | 16.0% |
| 35 to 39 Minutes | 18 | 2.5% |
| 40 to 44 Minutes | 40 | 5.5% |
| 45 to 59 Minutes | 90 | 12.4% |
| 60 to 89 Minutes | 91 | 12.6% |
| 90 or more Minutes | 22 | 3.0% |
Commute Time by Sex in Pymatuning Central
The most common commute times in Pymatuning Central are 60 to 89 minutes (78 commuters, 19.3%) for males and 30 to 34 minutes (62 commuters, 19.4%) for females.
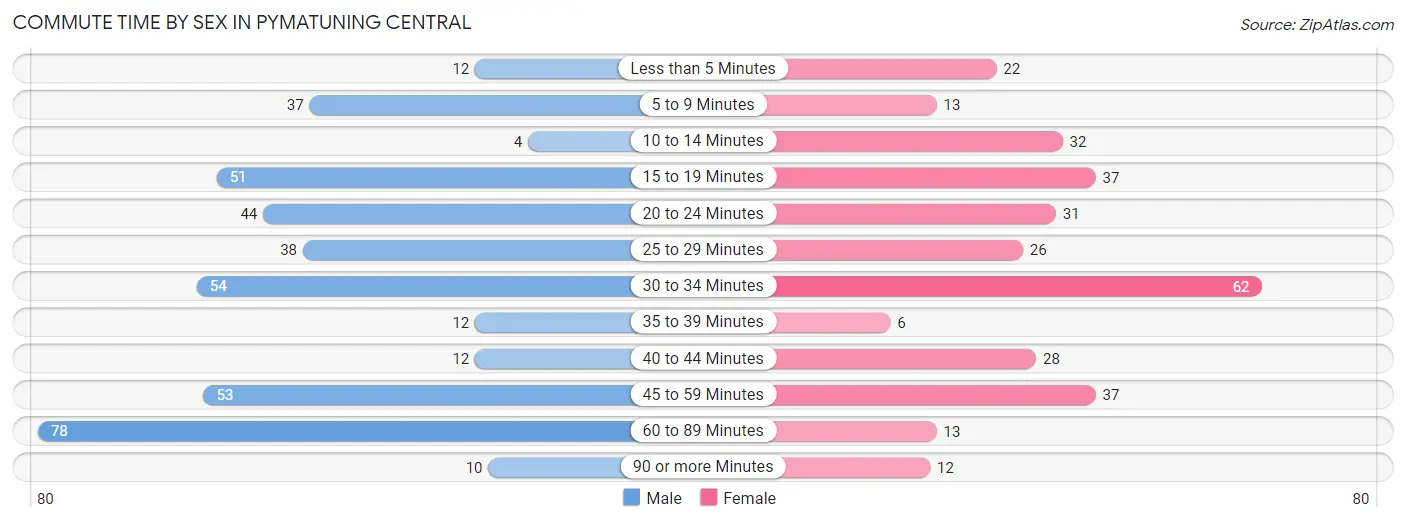
| Commute Time | Male | Female |
| Less than 5 Minutes | 12 (3.0%) | 22 (6.9%) |
| 5 to 9 Minutes | 37 (9.1%) | 13 (4.1%) |
| 10 to 14 Minutes | 4 (1.0%) | 32 (10.0%) |
| 15 to 19 Minutes | 51 (12.6%) | 37 (11.6%) |
| 20 to 24 Minutes | 44 (10.9%) | 31 (9.7%) |
| 25 to 29 Minutes | 38 (9.4%) | 26 (8.2%) |
| 30 to 34 Minutes | 54 (13.3%) | 62 (19.4%) |
| 35 to 39 Minutes | 12 (3.0%) | 6 (1.9%) |
| 40 to 44 Minutes | 12 (3.0%) | 28 (8.8%) |
| 45 to 59 Minutes | 53 (13.1%) | 37 (11.6%) |
| 60 to 89 Minutes | 78 (19.3%) | 13 (4.1%) |
| 90 or more Minutes | 10 (2.5%) | 12 (3.8%) |
Time of Departure to Work by Sex in Pymatuning Central
The most frequent times of departure to work in Pymatuning Central are 6:00 AM to 6:29 AM (78, 19.3%) for males and 7:30 AM to 7:59 AM (50, 15.7%) for females.
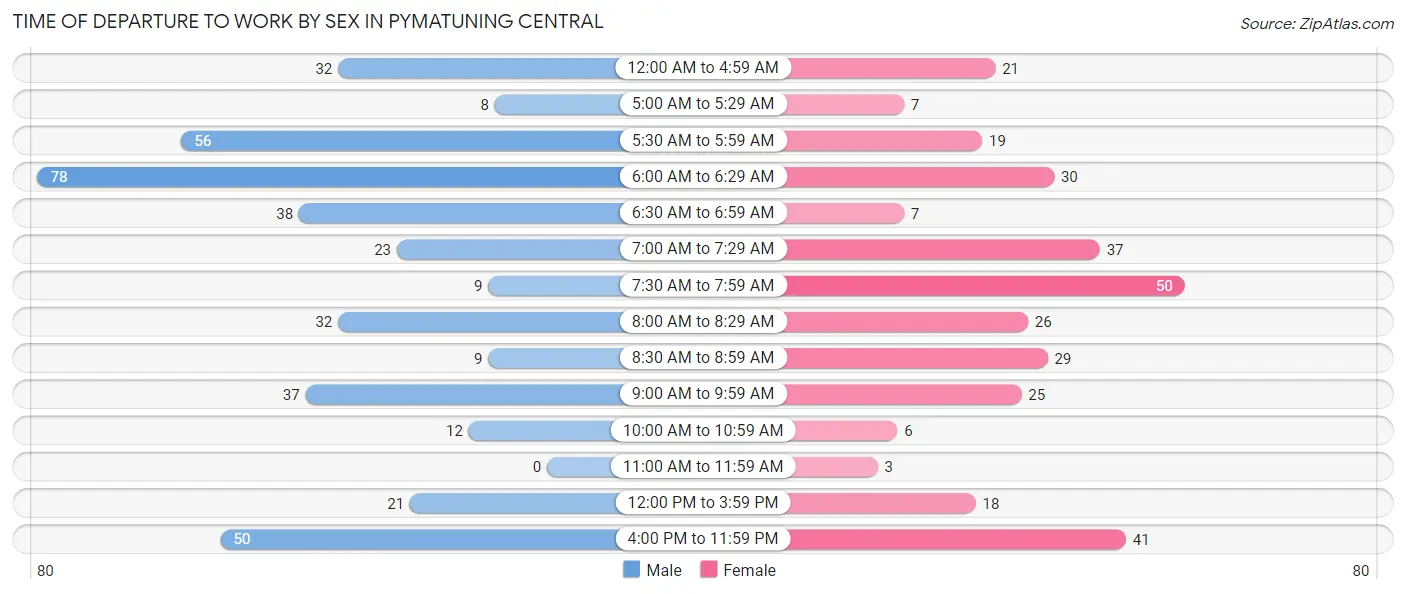
| Time of Departure | Male | Female |
| 12:00 AM to 4:59 AM | 32 (7.9%) | 21 (6.6%) |
| 5:00 AM to 5:29 AM | 8 (2.0%) | 7 (2.2%) |
| 5:30 AM to 5:59 AM | 56 (13.8%) | 19 (6.0%) |
| 6:00 AM to 6:29 AM | 78 (19.3%) | 30 (9.4%) |
| 6:30 AM to 6:59 AM | 38 (9.4%) | 7 (2.2%) |
| 7:00 AM to 7:29 AM | 23 (5.7%) | 37 (11.6%) |
| 7:30 AM to 7:59 AM | 9 (2.2%) | 50 (15.7%) |
| 8:00 AM to 8:29 AM | 32 (7.9%) | 26 (8.2%) |
| 8:30 AM to 8:59 AM | 9 (2.2%) | 29 (9.1%) |
| 9:00 AM to 9:59 AM | 37 (9.1%) | 25 (7.8%) |
| 10:00 AM to 10:59 AM | 12 (3.0%) | 6 (1.9%) |
| 11:00 AM to 11:59 AM | 0 (0.0%) | 3 (0.9%) |
| 12:00 PM to 3:59 PM | 21 (5.2%) | 18 (5.6%) |
| 4:00 PM to 11:59 PM | 50 (12.3%) | 41 (12.9%) |
| Total | 405 (100.0%) | 319 (100.0%) |
Housing Occupancy in Pymatuning Central
Occupancy by Ownership in Pymatuning Central
Of the total 1,082 dwellings in Pymatuning Central, owner-occupied units account for 985 (91.0%), while renter-occupied units make up 97 (9.0%).
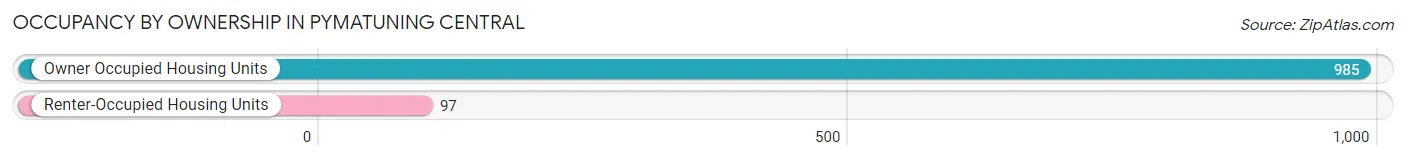
| Occupancy | # Housing Units | % Housing Units |
| Owner Occupied Housing Units | 985 | 91.0% |
| Renter-Occupied Housing Units | 97 | 9.0% |
| Total Occupied Housing Units | 1,082 | 100.0% |
Occupancy by Household Size in Pymatuning Central
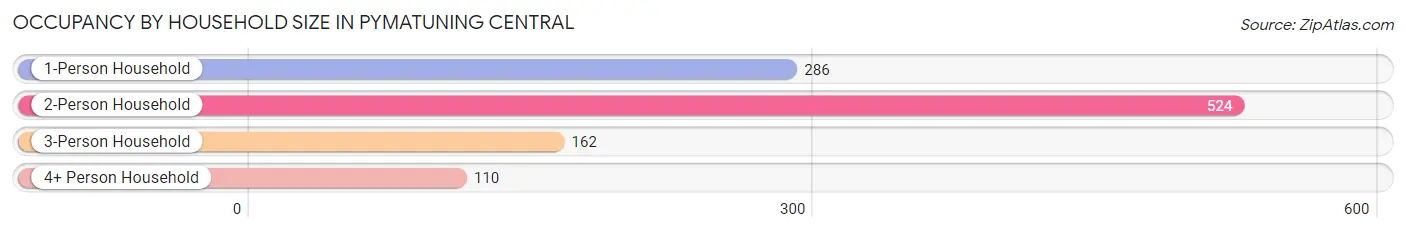
| Household Size | # Housing Units | % Housing Units |
| 1-Person Household | 286 | 26.4% |
| 2-Person Household | 524 | 48.4% |
| 3-Person Household | 162 | 15.0% |
| 4+ Person Household | 110 | 10.2% |
| Total Housing Units | 1,082 | 100.0% |
Occupancy by Ownership by Household Size in Pymatuning Central
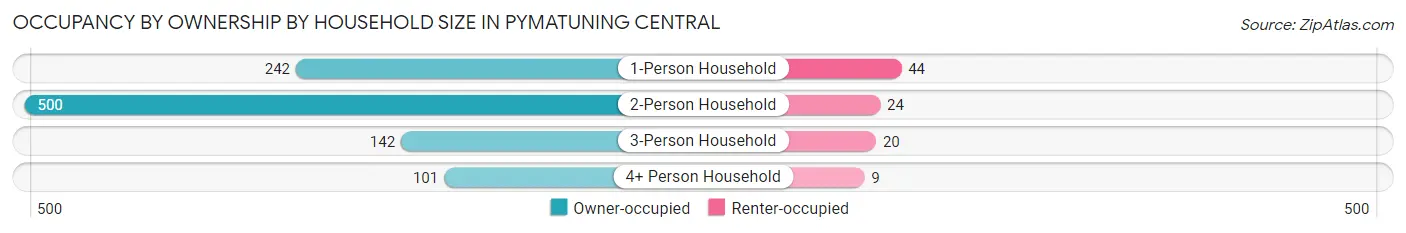
| Household Size | Owner-occupied | Renter-occupied |
| 1-Person Household | 242 (84.6%) | 44 (15.4%) |
| 2-Person Household | 500 (95.4%) | 24 (4.6%) |
| 3-Person Household | 142 (87.6%) | 20 (12.3%) |
| 4+ Person Household | 101 (91.8%) | 9 (8.2%) |
| Total Housing Units | 985 (91.0%) | 97 (9.0%) |
Occupancy by Educational Attainment in Pymatuning Central
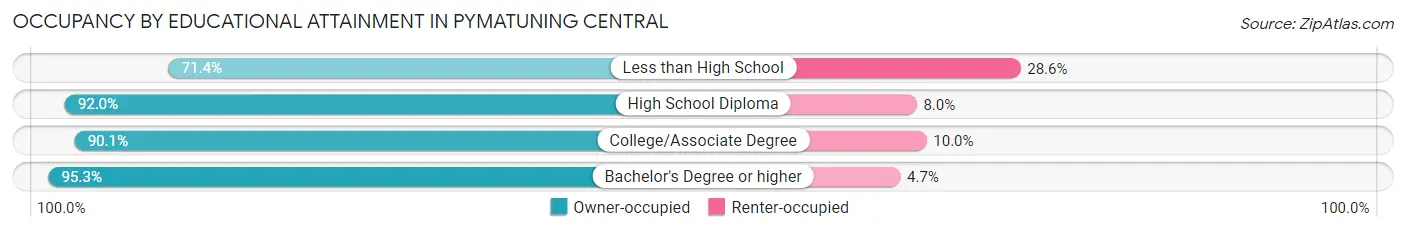
| Household Size | Owner-occupied | Renter-occupied |
| Less than High School | 30 (71.4%) | 12 (28.6%) |
| High School Diploma | 403 (92.0%) | 35 (8.0%) |
| College/Associate Degree | 371 (90.0%) | 41 (10.0%) |
| Bachelor's Degree or higher | 181 (95.3%) | 9 (4.7%) |
Occupancy by Age of Householder in Pymatuning Central
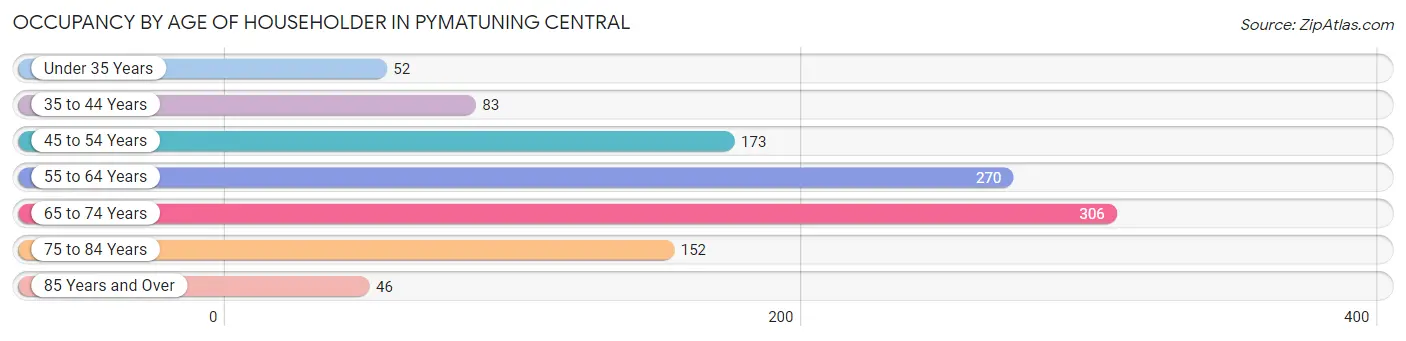
| Age Bracket | # Households | % Households |
| Under 35 Years | 52 | 4.8% |
| 35 to 44 Years | 83 | 7.7% |
| 45 to 54 Years | 173 | 16.0% |
| 55 to 64 Years | 270 | 24.9% |
| 65 to 74 Years | 306 | 28.3% |
| 75 to 84 Years | 152 | 14.1% |
| 85 Years and Over | 46 | 4.3% |
| Total | 1,082 | 100.0% |
Housing Finances in Pymatuning Central
Median Income by Occupancy in Pymatuning Central
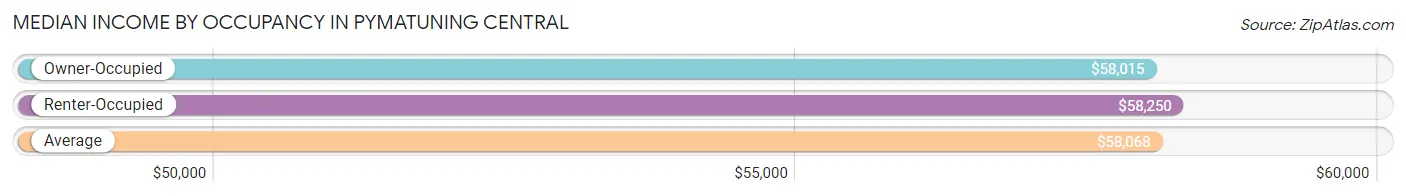
| Occupancy Type | # Households | Median Income |
| Owner-Occupied | 985 (91.0%) | $58,015 |
| Renter-Occupied | 97 (9.0%) | $58,250 |
| Average | 1,082 (100.0%) | $58,068 |
Occupancy by Householder Income Bracket in Pymatuning Central
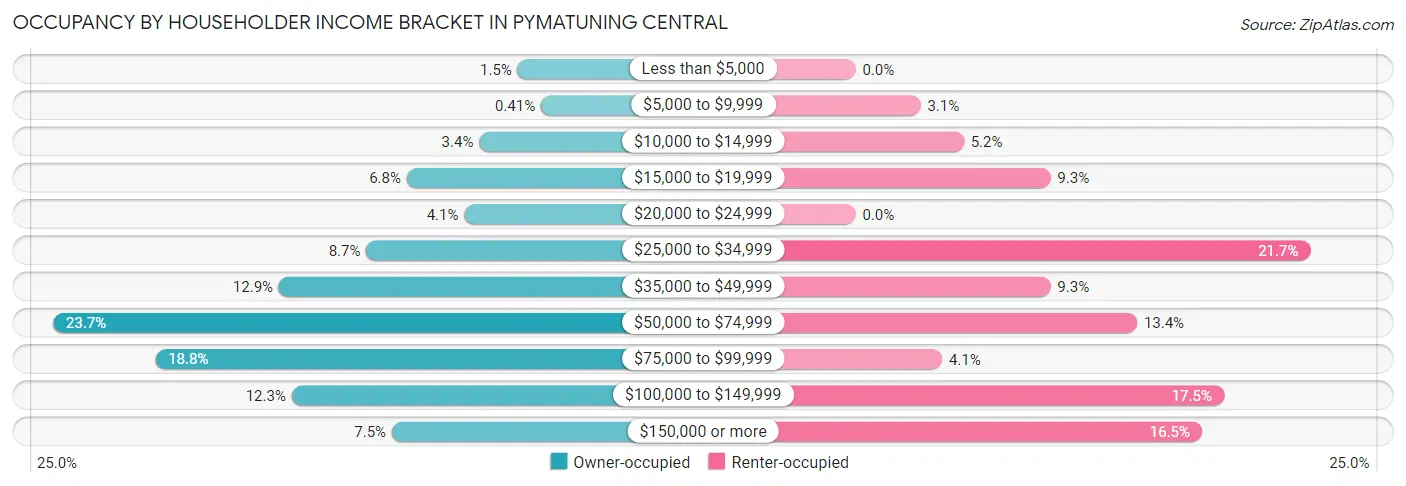
| Income Bracket | Owner-occupied | Renter-occupied |
| Less than $5,000 | 15 (1.5%) | 0 (0.0%) |
| $5,000 to $9,999 | 4 (0.4%) | 3 (3.1%) |
| $10,000 to $14,999 | 33 (3.4%) | 5 (5.1%) |
| $15,000 to $19,999 | 67 (6.8%) | 9 (9.3%) |
| $20,000 to $24,999 | 40 (4.1%) | 0 (0.0%) |
| $25,000 to $34,999 | 86 (8.7%) | 21 (21.6%) |
| $35,000 to $49,999 | 127 (12.9%) | 9 (9.3%) |
| $50,000 to $74,999 | 233 (23.6%) | 13 (13.4%) |
| $75,000 to $99,999 | 185 (18.8%) | 4 (4.1%) |
| $100,000 to $149,999 | 121 (12.3%) | 17 (17.5%) |
| $150,000 or more | 74 (7.5%) | 16 (16.5%) |
| Total | 985 (100.0%) | 97 (100.0%) |
Monthly Housing Cost Tiers in Pymatuning Central
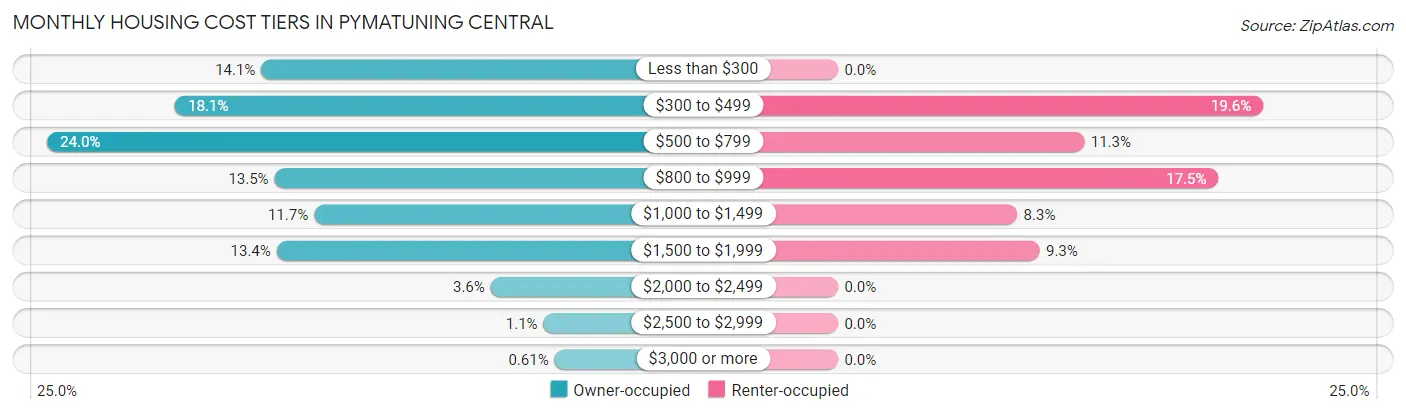
| Monthly Cost | Owner-occupied | Renter-occupied |
| Less than $300 | 139 (14.1%) | 0 (0.0%) |
| $300 to $499 | 178 (18.1%) | 19 (19.6%) |
| $500 to $799 | 236 (24.0%) | 11 (11.3%) |
| $800 to $999 | 133 (13.5%) | 17 (17.5%) |
| $1,000 to $1,499 | 115 (11.7%) | 8 (8.3%) |
| $1,500 to $1,999 | 132 (13.4%) | 9 (9.3%) |
| $2,000 to $2,499 | 35 (3.5%) | 0 (0.0%) |
| $2,500 to $2,999 | 11 (1.1%) | 0 (0.0%) |
| $3,000 or more | 6 (0.6%) | 0 (0.0%) |
| Total | 985 (100.0%) | 97 (100.0%) |
Physical Housing Characteristics in Pymatuning Central
Housing Structures in Pymatuning Central
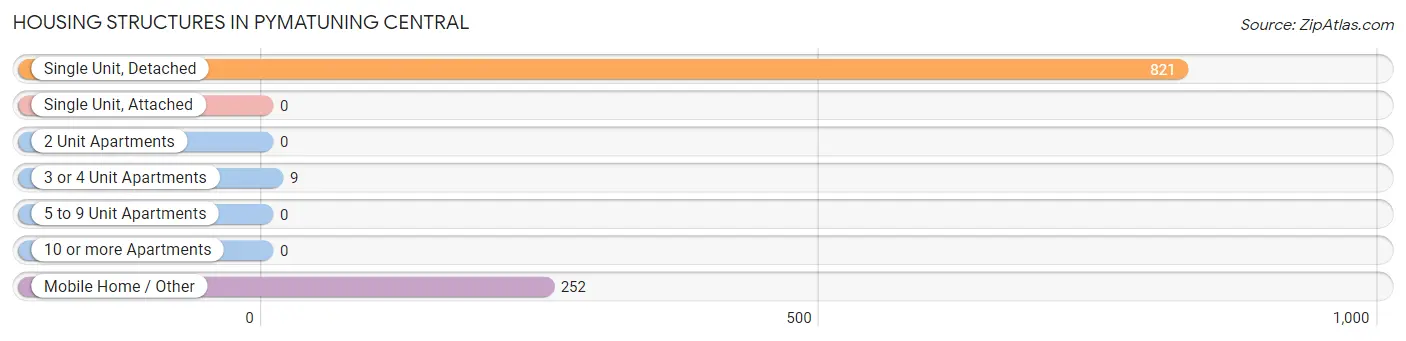
| Structure Type | # Housing Units | % Housing Units |
| Single Unit, Detached | 821 | 75.9% |
| Single Unit, Attached | 0 | 0.0% |
| 2 Unit Apartments | 0 | 0.0% |
| 3 or 4 Unit Apartments | 9 | 0.8% |
| 5 to 9 Unit Apartments | 0 | 0.0% |
| 10 or more Apartments | 0 | 0.0% |
| Mobile Home / Other | 252 | 23.3% |
| Total | 1,082 | 100.0% |
Housing Structures by Occupancy in Pymatuning Central
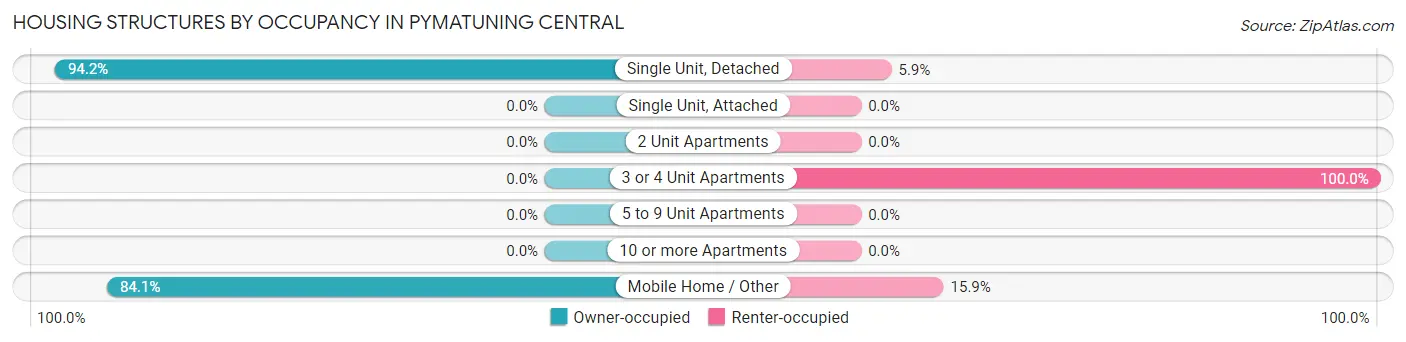
| Structure Type | Owner-occupied | Renter-occupied |
| Single Unit, Detached | 773 (94.2%) | 48 (5.9%) |
| Single Unit, Attached | 0 (0.0%) | 0 (0.0%) |
| 2 Unit Apartments | 0 (0.0%) | 0 (0.0%) |
| 3 or 4 Unit Apartments | 0 (0.0%) | 9 (100.0%) |
| 5 to 9 Unit Apartments | 0 (0.0%) | 0 (0.0%) |
| 10 or more Apartments | 0 (0.0%) | 0 (0.0%) |
| Mobile Home / Other | 212 (84.1%) | 40 (15.9%) |
| Total | 985 (91.0%) | 97 (9.0%) |
Housing Structures by Number of Rooms in Pymatuning Central
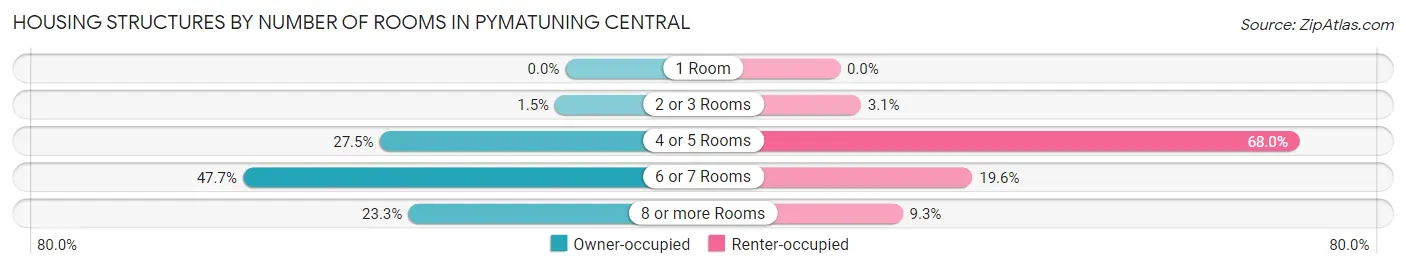
| Number of Rooms | Owner-occupied | Renter-occupied |
| 1 Room | 0 (0.0%) | 0 (0.0%) |
| 2 or 3 Rooms | 15 (1.5%) | 3 (3.1%) |
| 4 or 5 Rooms | 271 (27.5%) | 66 (68.0%) |
| 6 or 7 Rooms | 470 (47.7%) | 19 (19.6%) |
| 8 or more Rooms | 229 (23.3%) | 9 (9.3%) |
| Total | 985 (100.0%) | 97 (100.0%) |
Housing Structure by Heating Type in Pymatuning Central
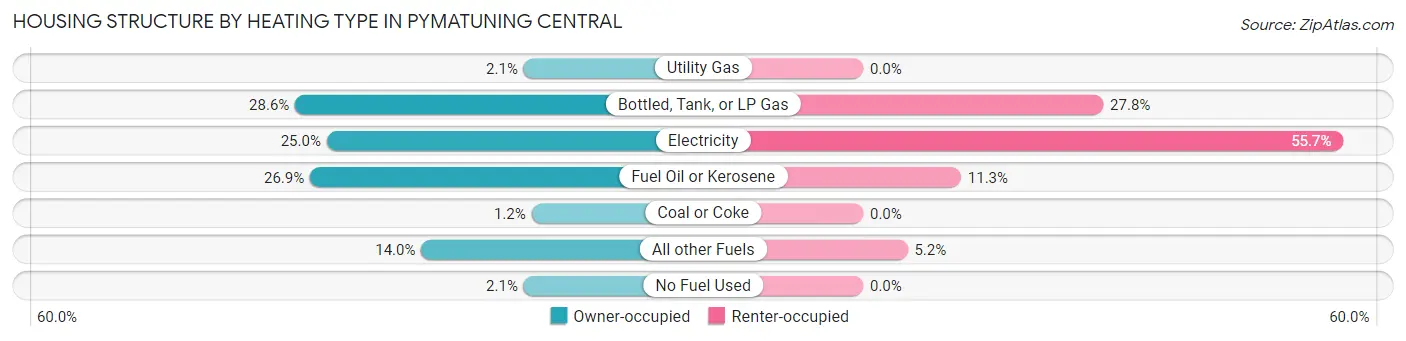
| Heating Type | Owner-occupied | Renter-occupied |
| Utility Gas | 21 (2.1%) | 0 (0.0%) |
| Bottled, Tank, or LP Gas | 282 (28.6%) | 27 (27.8%) |
| Electricity | 246 (25.0%) | 54 (55.7%) |
| Fuel Oil or Kerosene | 265 (26.9%) | 11 (11.3%) |
| Coal or Coke | 12 (1.2%) | 0 (0.0%) |
| All other Fuels | 138 (14.0%) | 5 (5.1%) |
| No Fuel Used | 21 (2.1%) | 0 (0.0%) |
| Total | 985 (100.0%) | 97 (100.0%) |
Household Vehicle Usage in Pymatuning Central
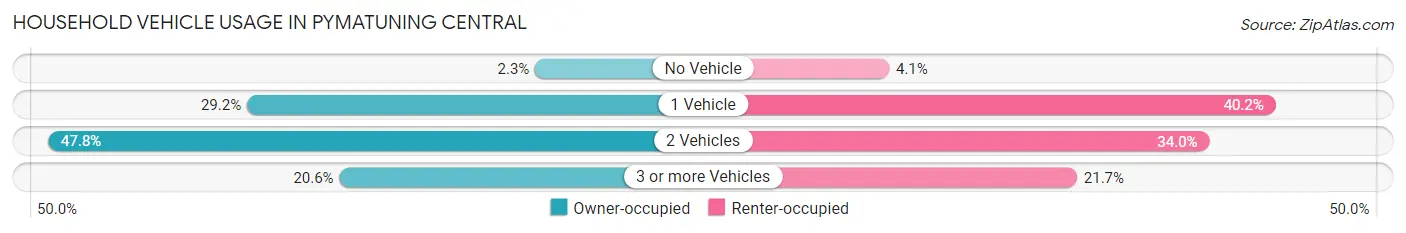
| Vehicles per Household | Owner-occupied | Renter-occupied |
| No Vehicle | 23 (2.3%) | 4 (4.1%) |
| 1 Vehicle | 288 (29.2%) | 39 (40.2%) |
| 2 Vehicles | 471 (47.8%) | 33 (34.0%) |
| 3 or more Vehicles | 203 (20.6%) | 21 (21.6%) |
| Total | 985 (100.0%) | 97 (100.0%) |
Real Estate & Mortgages in Pymatuning Central
Real Estate and Mortgage Overview in Pymatuning Central
| Characteristic | Without Mortgage | With Mortgage |
| Housing Units | 505 | 480 |
| Median Property Value | $106,600 | $123,200 |
| Median Household Income | $44,414 | $58 |
| Monthly Housing Costs | $413 | $6 |
| Real Estate Taxes | $1,447 | $5 |
Property Value by Mortgage Status in Pymatuning Central
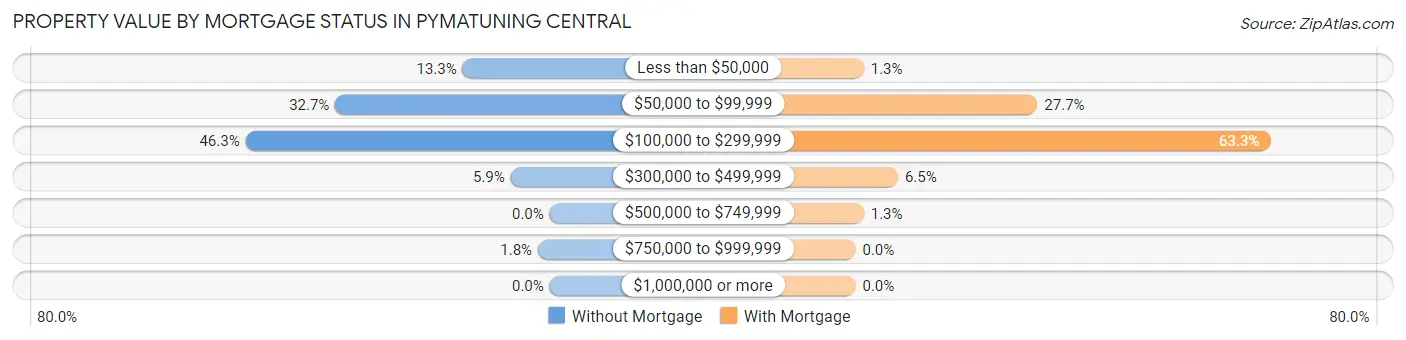
| Property Value | Without Mortgage | With Mortgage |
| Less than $50,000 | 67 (13.3%) | 6 (1.3%) |
| $50,000 to $99,999 | 165 (32.7%) | 133 (27.7%) |
| $100,000 to $299,999 | 234 (46.3%) | 304 (63.3%) |
| $300,000 to $499,999 | 30 (5.9%) | 31 (6.5%) |
| $500,000 to $749,999 | 0 (0.0%) | 6 (1.3%) |
| $750,000 to $999,999 | 9 (1.8%) | 0 (0.0%) |
| $1,000,000 or more | 0 (0.0%) | 0 (0.0%) |
| Total | 505 (100.0%) | 480 (100.0%) |
Household Income by Mortgage Status in Pymatuning Central
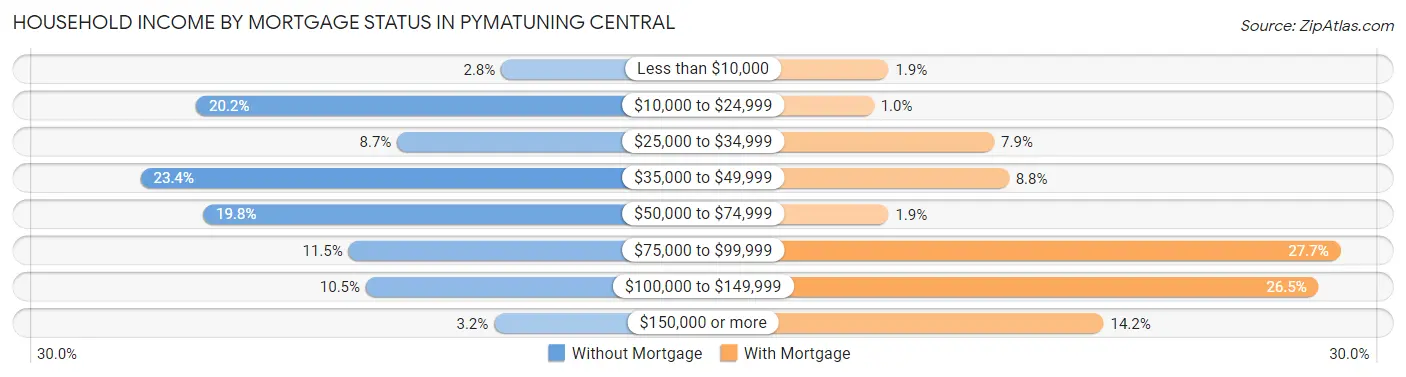
| Household Income | Without Mortgage | With Mortgage |
| Less than $10,000 | 14 (2.8%) | 9 (1.9%) |
| $10,000 to $24,999 | 102 (20.2%) | 5 (1.0%) |
| $25,000 to $34,999 | 44 (8.7%) | 38 (7.9%) |
| $35,000 to $49,999 | 118 (23.4%) | 42 (8.7%) |
| $50,000 to $74,999 | 100 (19.8%) | 9 (1.9%) |
| $75,000 to $99,999 | 58 (11.5%) | 133 (27.7%) |
| $100,000 to $149,999 | 53 (10.5%) | 127 (26.5%) |
| $150,000 or more | 16 (3.2%) | 68 (14.2%) |
| Total | 505 (100.0%) | 480 (100.0%) |
Property Value to Household Income Ratio in Pymatuning Central
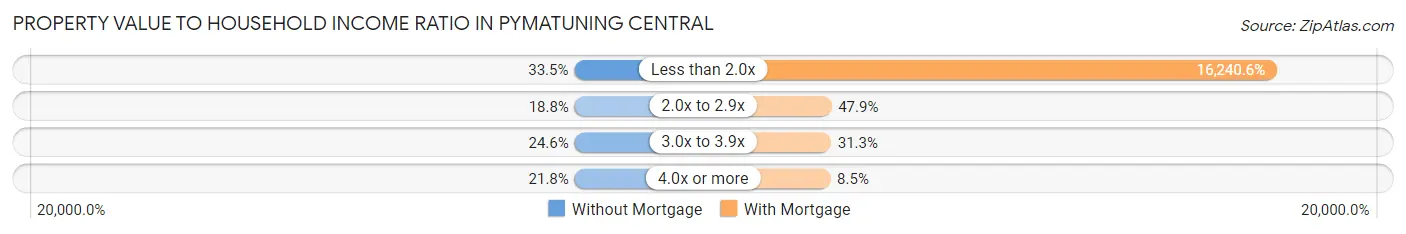
| Value-to-Income Ratio | Without Mortgage | With Mortgage |
| Less than 2.0x | 169 (33.5%) | 77,955 (16,240.6%) |
| 2.0x to 2.9x | 95 (18.8%) | 230 (47.9%) |
| 3.0x to 3.9x | 124 (24.5%) | 150 (31.2%) |
| 4.0x or more | 110 (21.8%) | 41 (8.5%) |
| Total | 505 (100.0%) | 480 (100.0%) |
Real Estate Taxes by Mortgage Status in Pymatuning Central
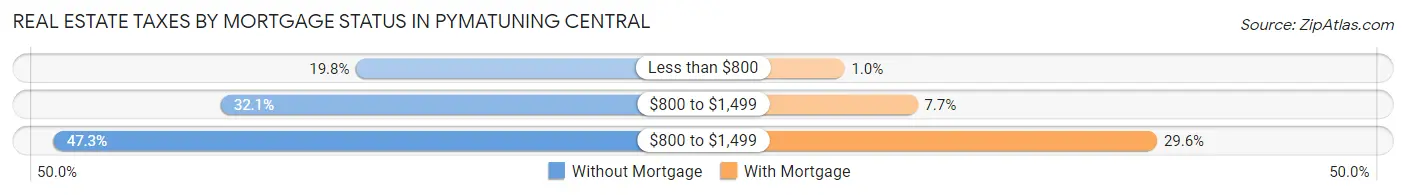
| Property Taxes | Without Mortgage | With Mortgage |
| Less than $800 | 100 (19.8%) | 5 (1.0%) |
| $800 to $1,499 | 162 (32.1%) | 37 (7.7%) |
| $800 to $1,499 | 239 (47.3%) | 142 (29.6%) |
| Total | 505 (100.0%) | 480 (100.0%) |
Health & Disability in Pymatuning Central
Health Insurance Coverage by Age in Pymatuning Central
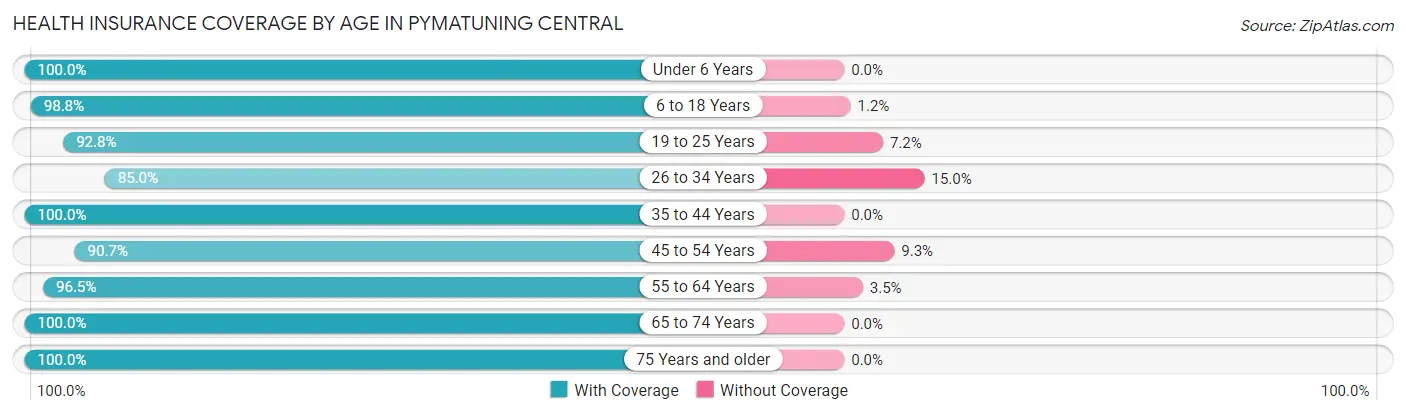
| Age Bracket | With Coverage | Without Coverage |
| Under 6 Years | 92 (100.0%) | 0 (0.0%) |
| 6 to 18 Years | 252 (98.8%) | 3 (1.2%) |
| 19 to 25 Years | 103 (92.8%) | 8 (7.2%) |
| 26 to 34 Years | 108 (85.0%) | 19 (15.0%) |
| 35 to 44 Years | 198 (100.0%) | 0 (0.0%) |
| 45 to 54 Years | 243 (90.7%) | 25 (9.3%) |
| 55 to 64 Years | 475 (96.5%) | 17 (3.5%) |
| 65 to 74 Years | 497 (100.0%) | 0 (0.0%) |
| 75 Years and older | 285 (100.0%) | 0 (0.0%) |
| Total | 2,253 (96.9%) | 72 (3.1%) |
Health Insurance Coverage by Citizenship Status in Pymatuning Central
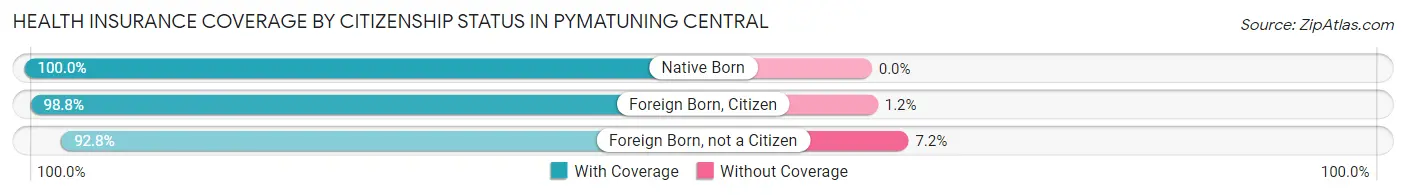
| Citizenship Status | With Coverage | Without Coverage |
| Native Born | 92 (100.0%) | 0 (0.0%) |
| Foreign Born, Citizen | 252 (98.8%) | 3 (1.2%) |
| Foreign Born, not a Citizen | 103 (92.8%) | 8 (7.2%) |
Health Insurance Coverage by Household Income in Pymatuning Central
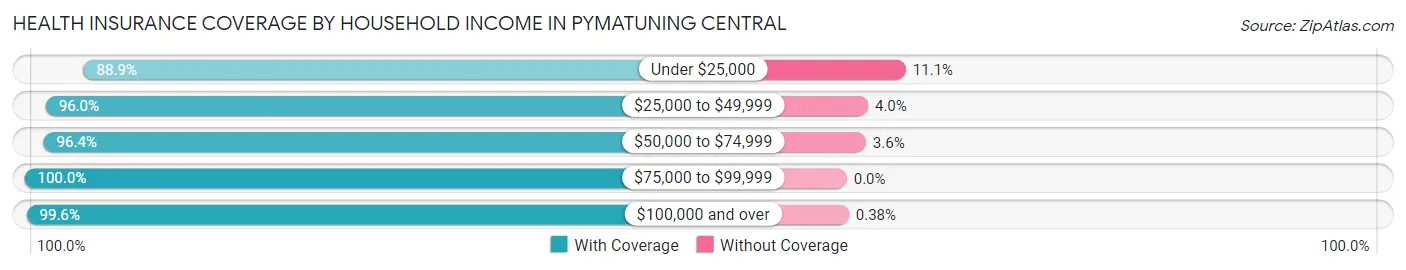
| Household Income | With Coverage | Without Coverage |
| Under $25,000 | 249 (88.9%) | 31 (11.1%) |
| $25,000 to $49,999 | 410 (96.0%) | 17 (4.0%) |
| $50,000 to $74,999 | 593 (96.4%) | 22 (3.6%) |
| $75,000 to $99,999 | 453 (100.0%) | 0 (0.0%) |
| $100,000 and over | 526 (99.6%) | 2 (0.4%) |
Public vs Private Health Insurance Coverage by Age in Pymatuning Central
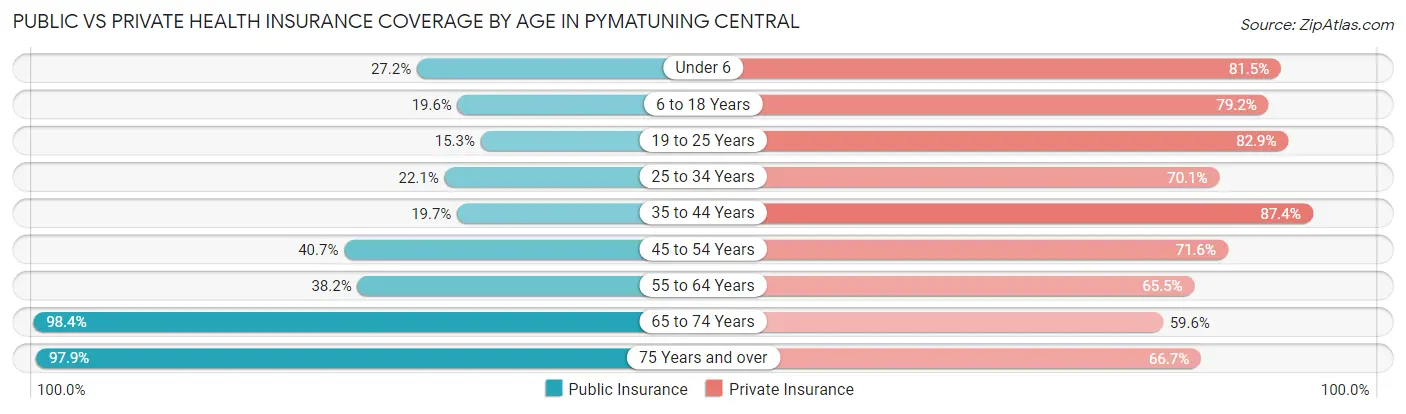
| Age Bracket | Public Insurance | Private Insurance |
| Under 6 | 25 (27.2%) | 75 (81.5%) |
| 6 to 18 Years | 50 (19.6%) | 202 (79.2%) |
| 19 to 25 Years | 17 (15.3%) | 92 (82.9%) |
| 25 to 34 Years | 28 (22.1%) | 89 (70.1%) |
| 35 to 44 Years | 39 (19.7%) | 173 (87.4%) |
| 45 to 54 Years | 109 (40.7%) | 192 (71.6%) |
| 55 to 64 Years | 188 (38.2%) | 322 (65.4%) |
| 65 to 74 Years | 489 (98.4%) | 296 (59.6%) |
| 75 Years and over | 279 (97.9%) | 190 (66.7%) |
| Total | 1,224 (52.6%) | 1,631 (70.2%) |
Disability Status by Sex by Age in Pymatuning Central
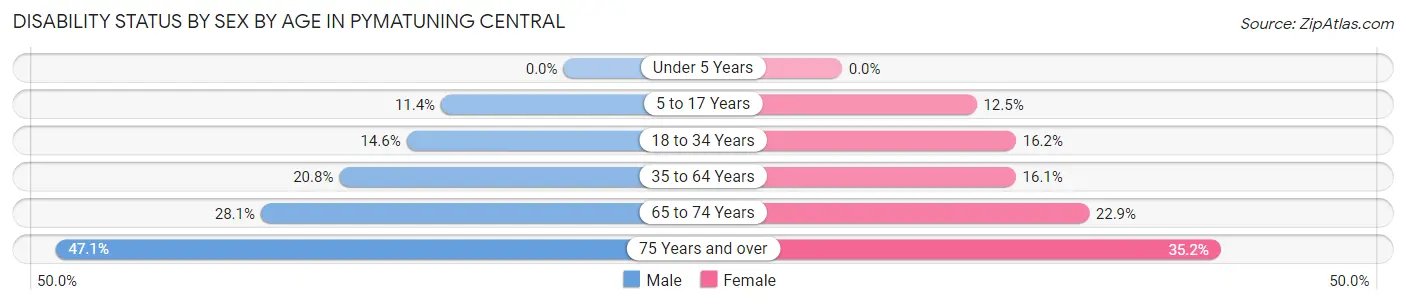
| Age Bracket | Male | Female |
| Under 5 Years | 0 (0.0%) | 0 (0.0%) |
| 5 to 17 Years | 15 (11.4%) | 13 (12.5%) |
| 18 to 34 Years | 23 (14.6%) | 21 (16.2%) |
| 35 to 64 Years | 109 (20.8%) | 70 (16.1%) |
| 65 to 74 Years | 82 (28.1%) | 47 (22.9%) |
| 75 Years and over | 74 (47.1%) | 45 (35.2%) |
Disability Class by Sex by Age in Pymatuning Central
Disability Class: Hearing Difficulty
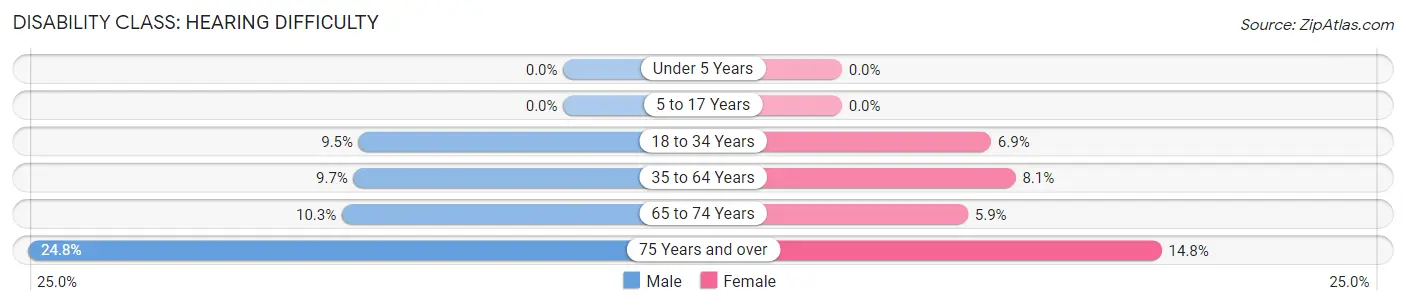
| Age Bracket | Male | Female |
| Under 5 Years | 0 (0.0%) | 0 (0.0%) |
| 5 to 17 Years | 0 (0.0%) | 0 (0.0%) |
| 18 to 34 Years | 15 (9.5%) | 9 (6.9%) |
| 35 to 64 Years | 51 (9.7%) | 35 (8.1%) |
| 65 to 74 Years | 30 (10.3%) | 12 (5.9%) |
| 75 Years and over | 39 (24.8%) | 19 (14.8%) |
Disability Class: Vision Difficulty
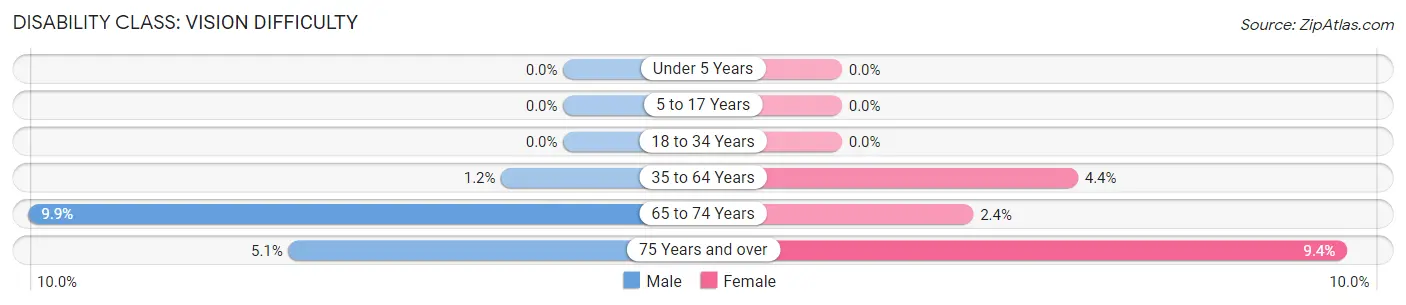
| Age Bracket | Male | Female |
| Under 5 Years | 0 (0.0%) | 0 (0.0%) |
| 5 to 17 Years | 0 (0.0%) | 0 (0.0%) |
| 18 to 34 Years | 0 (0.0%) | 0 (0.0%) |
| 35 to 64 Years | 6 (1.1%) | 19 (4.4%) |
| 65 to 74 Years | 29 (9.9%) | 5 (2.4%) |
| 75 Years and over | 8 (5.1%) | 12 (9.4%) |
Disability Class: Cognitive Difficulty
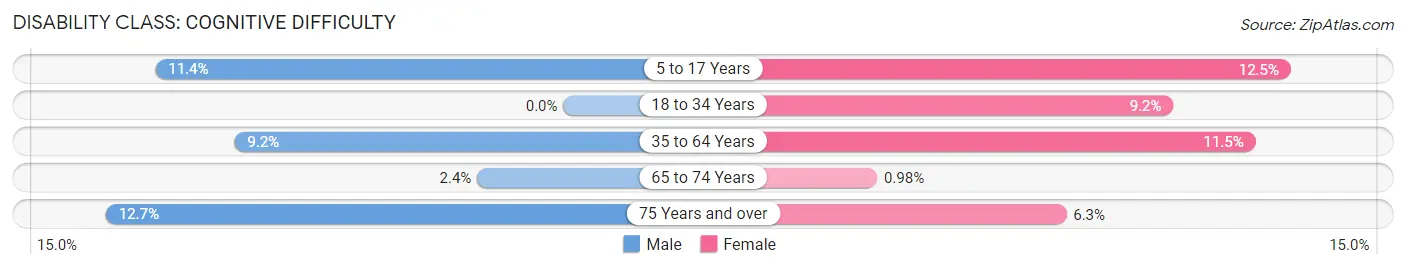
| Age Bracket | Male | Female |
| 5 to 17 Years | 15 (11.4%) | 13 (12.5%) |
| 18 to 34 Years | 0 (0.0%) | 12 (9.2%) |
| 35 to 64 Years | 48 (9.2%) | 50 (11.5%) |
| 65 to 74 Years | 7 (2.4%) | 2 (1.0%) |
| 75 Years and over | 20 (12.7%) | 8 (6.2%) |
Disability Class: Ambulatory Difficulty
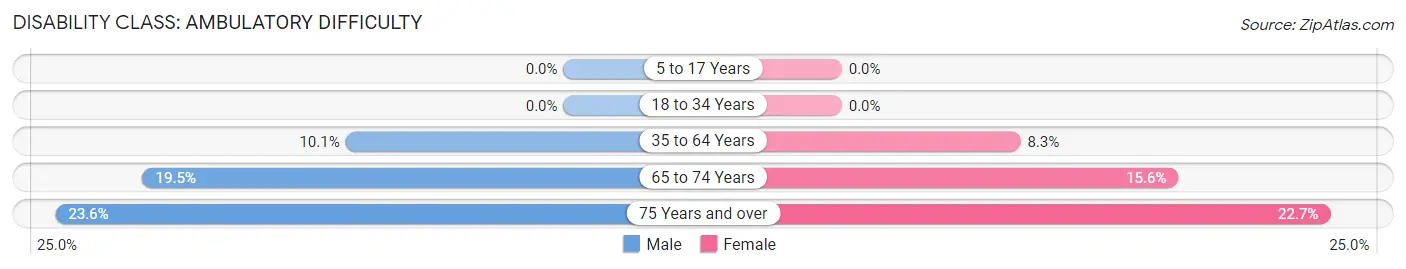
| Age Bracket | Male | Female |
| 5 to 17 Years | 0 (0.0%) | 0 (0.0%) |
| 18 to 34 Years | 0 (0.0%) | 0 (0.0%) |
| 35 to 64 Years | 53 (10.1%) | 36 (8.3%) |
| 65 to 74 Years | 57 (19.5%) | 32 (15.6%) |
| 75 Years and over | 37 (23.6%) | 29 (22.7%) |
Disability Class: Self-Care Difficulty
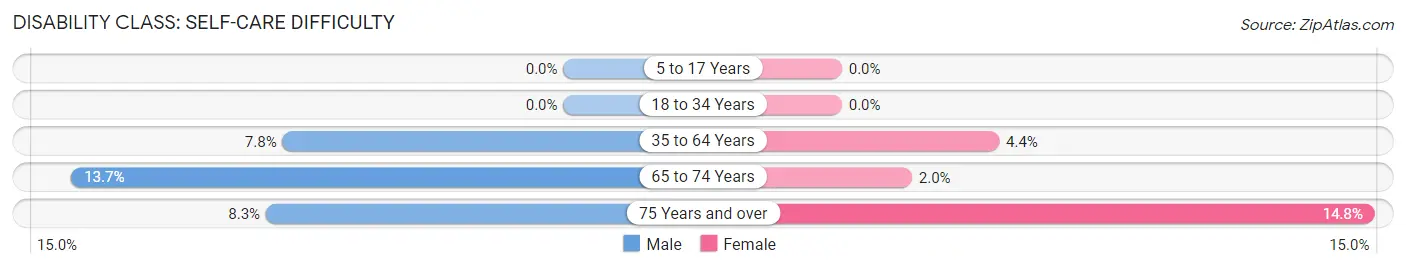
| Age Bracket | Male | Female |
| 5 to 17 Years | 0 (0.0%) | 0 (0.0%) |
| 18 to 34 Years | 0 (0.0%) | 0 (0.0%) |
| 35 to 64 Years | 41 (7.8%) | 19 (4.4%) |
| 65 to 74 Years | 40 (13.7%) | 4 (1.9%) |
| 75 Years and over | 13 (8.3%) | 19 (14.8%) |
Technology Access in Pymatuning Central
Computing Device Access in Pymatuning Central
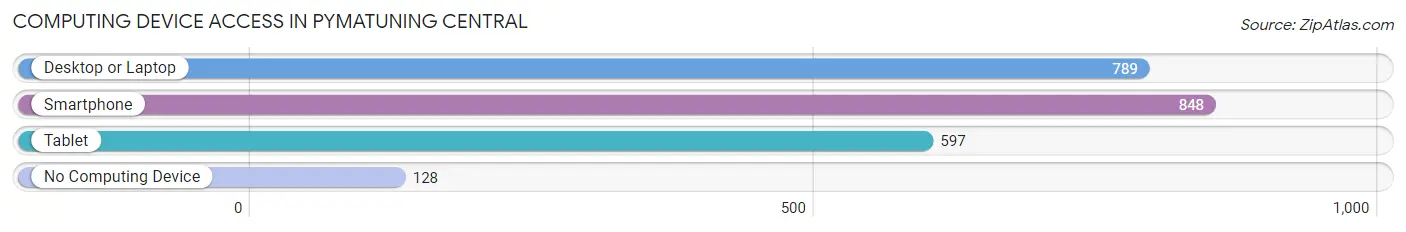
| Device Type | # Households | % Households |
| Desktop or Laptop | 789 | 72.9% |
| Smartphone | 848 | 78.4% |
| Tablet | 597 | 55.2% |
| No Computing Device | 128 | 11.8% |
| Total | 1,082 | 100.0% |
Internet Access in Pymatuning Central
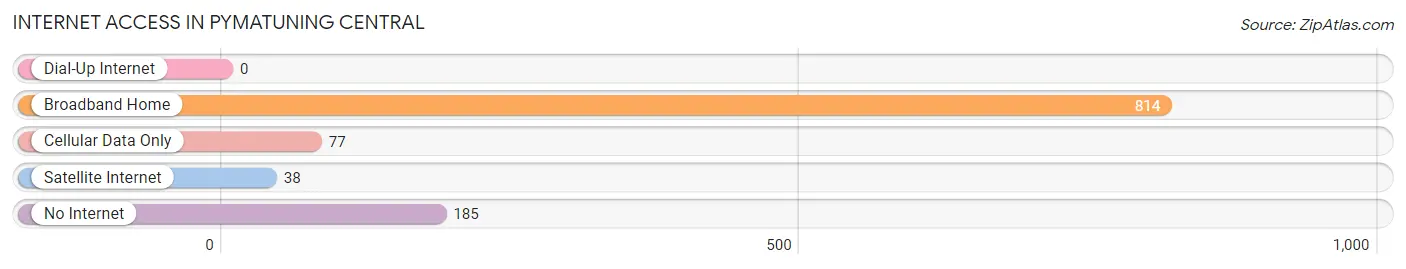
| Internet Type | # Households | % Households |
| Dial-Up Internet | 0 | 0.0% |
| Broadband Home | 814 | 75.2% |
| Cellular Data Only | 77 | 7.1% |
| Satellite Internet | 38 | 3.5% |
| No Internet | 185 | 17.1% |
| Total | 1,082 | 100.0% |
Pymatuning Central Summary
Pymatuning Central, Pennsylvania is a small rural community located in Mercer County, Pennsylvania. It is situated in the northwest corner of the state, just south of the Ohio border. The population of Pymatuning Central was 1,845 in the 2010 census.
History
Pymatuning Central was first settled in the late 1700s by a group of settlers from Connecticut. The town was originally known as “Pymatuning”, after the nearby Pymatuning Creek. The name was changed to “Pymatuning Central” in 1875 when the town was incorporated.
The town was an important stop on the Underground Railroad, with many of the town’s residents helping to hide and transport escaped slaves. The town was also a major stop on the Pennsylvania Canal, which connected the Ohio River to the Great Lakes.
Geography
Pymatuning Central is located in the northwest corner of Mercer County, Pennsylvania. It is situated on the western edge of the Appalachian Plateau, and is surrounded by rolling hills and forests. The town is located near the Pymatuning Reservoir, which is the largest lake in Pennsylvania.
The town is located approximately 30 miles from the cities of Pittsburgh and Cleveland. It is also close to the Pennsylvania Turnpike, which connects the town to the rest of the state.
Economy
The economy of Pymatuning Central is largely based on agriculture and tourism. The town is home to several farms, which produce a variety of crops, including corn, soybeans, and hay. The town is also home to several wineries, which produce a variety of wines.
The town is also a popular tourist destination, due to its proximity to the Pymatuning Reservoir. The reservoir is a popular spot for fishing, boating, and other outdoor activities. The town also hosts several festivals throughout the year, including the Pymatuning Central Festival of the Arts and the Pymatuning Central Music Festival.
Demographics
As of the 2010 census, the population of Pymatuning Central was 1,845. The racial makeup of the town was 97.3% White, 0.7% African American, 0.2% Native American, 0.2% Asian, 0.1% Pacific Islander, 0.3% from other races, and 1.3% from two or more races. Hispanic or Latino of any race were 1.2% of the population.
The median household income in Pymatuning Central was $41,250, and the median family income was $48,750. The per capita income for the town was $19,945. About 11.2% of families and 13.2% of the population were below the poverty line, including 17.2% of those under age 18 and 8.2% of those age 65 or over.
Pymatuning Central is a small rural community with a rich history and a strong agricultural and tourism-based economy. The town is home to a diverse population, and is a popular destination for outdoor activities and festivals. The town is also conveniently located near major cities, making it an ideal place to live and work.
Common Questions
What is Per Capita Income in Pymatuning Central?
Per Capita income in Pymatuning Central is $31,996.
What is the Median Family Income in Pymatuning Central?
Median Family Income in Pymatuning Central is $71,417.
What is the Median Household income in Pymatuning Central?
Median Household Income in Pymatuning Central is $58,068.
What is Income or Wage Gap in Pymatuning Central?
Income or Wage Gap in Pymatuning Central is 33.2%.
Women in Pymatuning Central earn 66.8 cents for every dollar earned by a man.
What is Family Income Deficit in Pymatuning Central?
Family Income Deficit in Pymatuning Central is $6,324.
Families that are below poverty line in Pymatuning Central earn $6,324 less on average than the poverty threshold level.
What is Inequality or Gini Index in Pymatuning Central?
Inequality or Gini Index in Pymatuning Central is 0.37.
What is the Total Population of Pymatuning Central?
Total Population of Pymatuning Central is 2,325.
What is the Total Male Population of Pymatuning Central?
Total Male Population of Pymatuning Central is 1,291.
What is the Total Female Population of Pymatuning Central?
Total Female Population of Pymatuning Central is 1,034.
What is the Ratio of Males per 100 Females in Pymatuning Central?
There are 124.85 Males per 100 Females in Pymatuning Central.
What is the Ratio of Females per 100 Males in Pymatuning Central?
There are 80.09 Females per 100 Males in Pymatuning Central.
What is the Median Population Age in Pymatuning Central?
Median Population Age in Pymatuning Central is 58.1 Years.
What is the Average Family Size in Pymatuning Central
Average Family Size in Pymatuning Central is 2.6 People.
What is the Average Household Size in Pymatuning Central
Average Household Size in Pymatuning Central is 2.1 People.
How Large is the Labor Force in Pymatuning Central?
There are 851 People in the Labor Forcein in Pymatuning Central.
What is the Percentage of People in the Labor Force in Pymatuning Central?
41.3% of People are in the Labor Force in Pymatuning Central.
What is the Unemployment Rate in Pymatuning Central?
Unemployment Rate in Pymatuning Central is 4.1%.