Orwin, PA Map & Demographics
Orwin Map
Orwin Overview
$29,915
PER CAPITA INCOME
$90,536
AVG FAMILY INCOME
$87,000
AVG HOUSEHOLD INCOME
0.27
INEQUALITY / GINI INDEX
255
TOTAL POPULATION
155
MALE POPULATION
100
FEMALE POPULATION
155.00
MALES / 100 FEMALES
64.52
FEMALES / 100 MALES
43.8
MEDIAN AGE
3.2
AVG FAMILY SIZE
3.1
AVG HOUSEHOLD SIZE
121
LABOR FORCE [ PEOPLE ]
57.1%
PERCENT IN LABOR FORCE
Income in Orwin
Income Overview in Orwin
Per Capita Income in Orwin is $29,915, while median incomes of families and households are $90,536 and $87,000 respectively.
| Characteristic | Number | Measure |
| Per Capita Income | 255 | $29,915 |
| Median Family Income | 77 | $90,536 |
| Mean Family Income | 77 | $94,671 |
| Median Household Income | 82 | $87,000 |
| Mean Household Income | 82 | $92,387 |
| Income Deficit | 77 | $0 |
| Wage / Income Gap (%) | 255 | 0.00% |
| Wage / Income Gap ($) | 255 | 100.00¢ per $1 |
| Gini / Inequality Index | 255 | 0.27 |
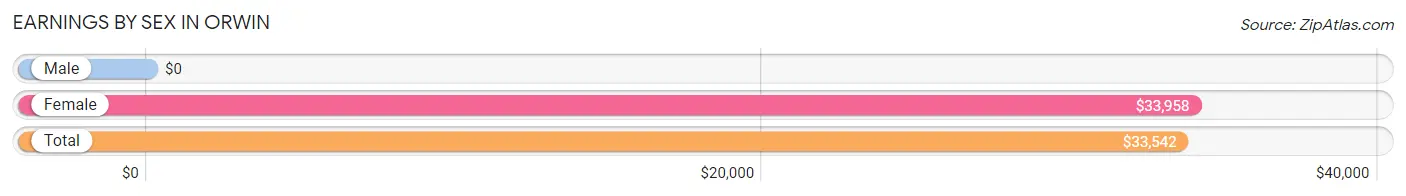
Earnings by Sex in Orwin
| Sex | Number | Average Earnings |
| Male | 94 (74.0%) | $0 |
| Female | 33 (26.0%) | $33,958 |
| Total | 127 (100.0%) | $33,542 |
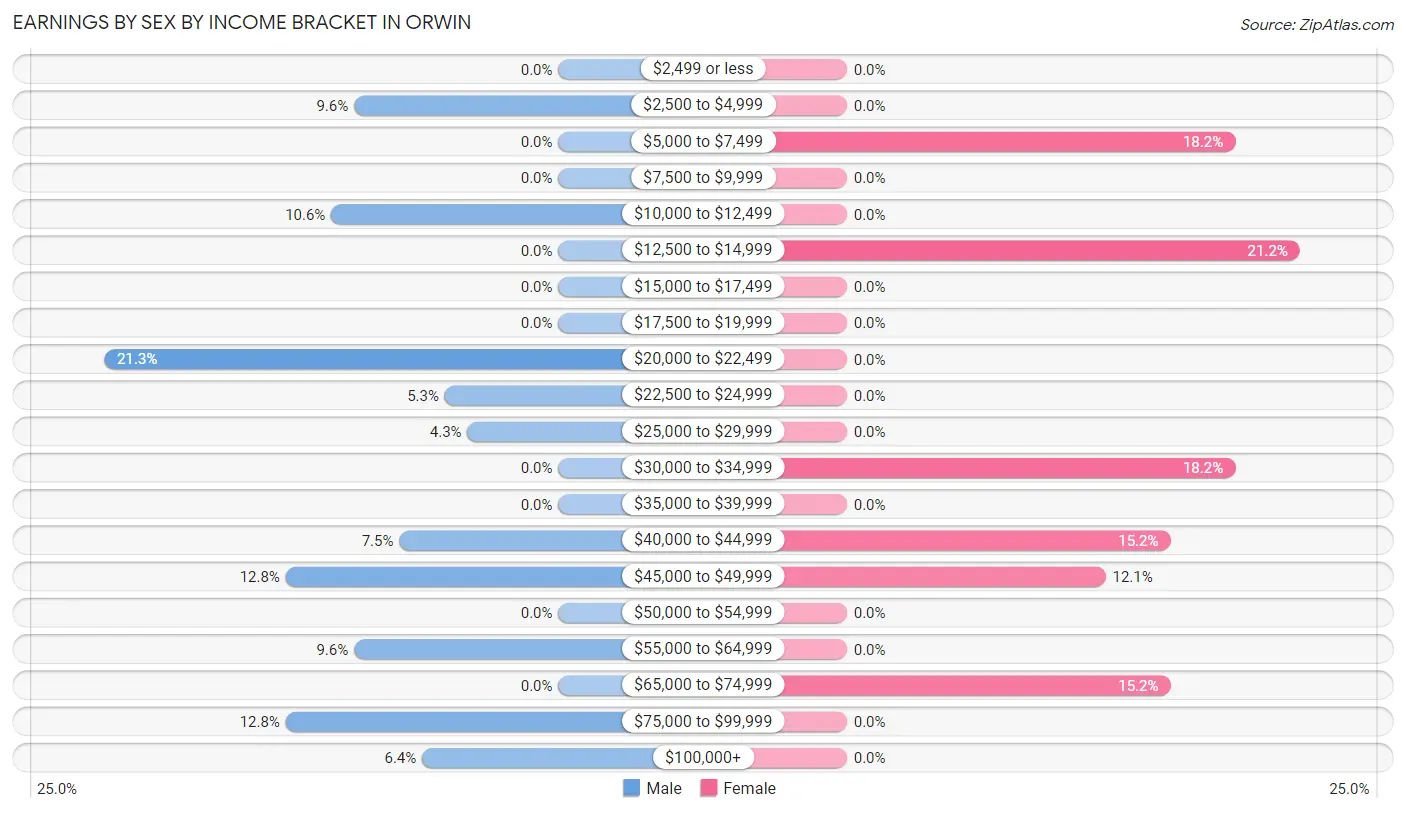
Earnings by Sex by Income Bracket in Orwin
The most common earnings brackets in Orwin are $20,000 to $22,499 for men (20 | 21.3%) and $12,500 to $14,999 for women (7 | 21.2%).
| Income | Male | Female |
| $2,499 or less | 0 (0.0%) | 0 (0.0%) |
| $2,500 to $4,999 | 9 (9.6%) | 0 (0.0%) |
| $5,000 to $7,499 | 0 (0.0%) | 6 (18.2%) |
| $7,500 to $9,999 | 0 (0.0%) | 0 (0.0%) |
| $10,000 to $12,499 | 10 (10.6%) | 0 (0.0%) |
| $12,500 to $14,999 | 0 (0.0%) | 7 (21.2%) |
| $15,000 to $17,499 | 0 (0.0%) | 0 (0.0%) |
| $17,500 to $19,999 | 0 (0.0%) | 0 (0.0%) |
| $20,000 to $22,499 | 20 (21.3%) | 0 (0.0%) |
| $22,500 to $24,999 | 5 (5.3%) | 0 (0.0%) |
| $25,000 to $29,999 | 4 (4.3%) | 0 (0.0%) |
| $30,000 to $34,999 | 0 (0.0%) | 6 (18.2%) |
| $35,000 to $39,999 | 0 (0.0%) | 0 (0.0%) |
| $40,000 to $44,999 | 7 (7.4%) | 5 (15.1%) |
| $45,000 to $49,999 | 12 (12.8%) | 4 (12.1%) |
| $50,000 to $54,999 | 0 (0.0%) | 0 (0.0%) |
| $55,000 to $64,999 | 9 (9.6%) | 0 (0.0%) |
| $65,000 to $74,999 | 0 (0.0%) | 5 (15.1%) |
| $75,000 to $99,999 | 12 (12.8%) | 0 (0.0%) |
| $100,000+ | 6 (6.4%) | 0 (0.0%) |
| Total | 94 (100.0%) | 33 (100.0%) |
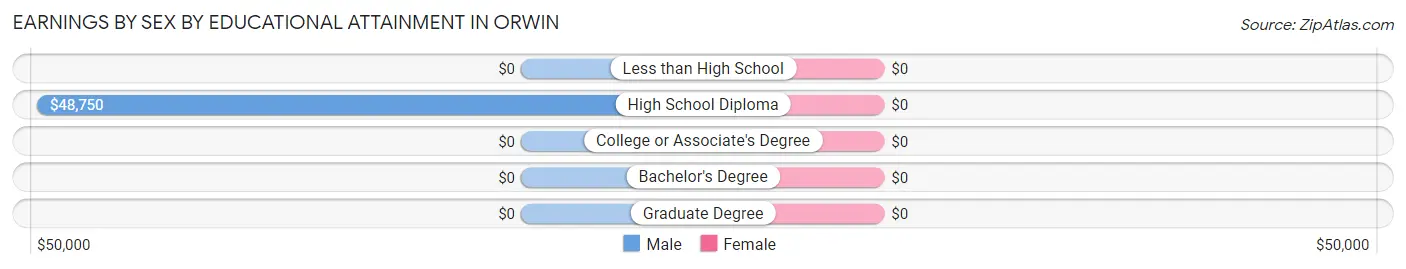
Earnings by Sex by Educational Attainment in Orwin
| Educational Attainment | Male Income | Female Income |
| Less than High School | - | - |
| High School Diploma | $48,750 | $0 |
| College or Associate's Degree | - | - |
| Bachelor's Degree | - | - |
| Graduate Degree | - | - |
| Total | $49,896 | $33,958 |
Family Income in Orwin
Family Income Brackets in Orwin
According to the Orwin family income data, there are 30 families falling into the $75,000 to $99,999 income range, which is the most common income bracket and makes up 39.0% of all families.
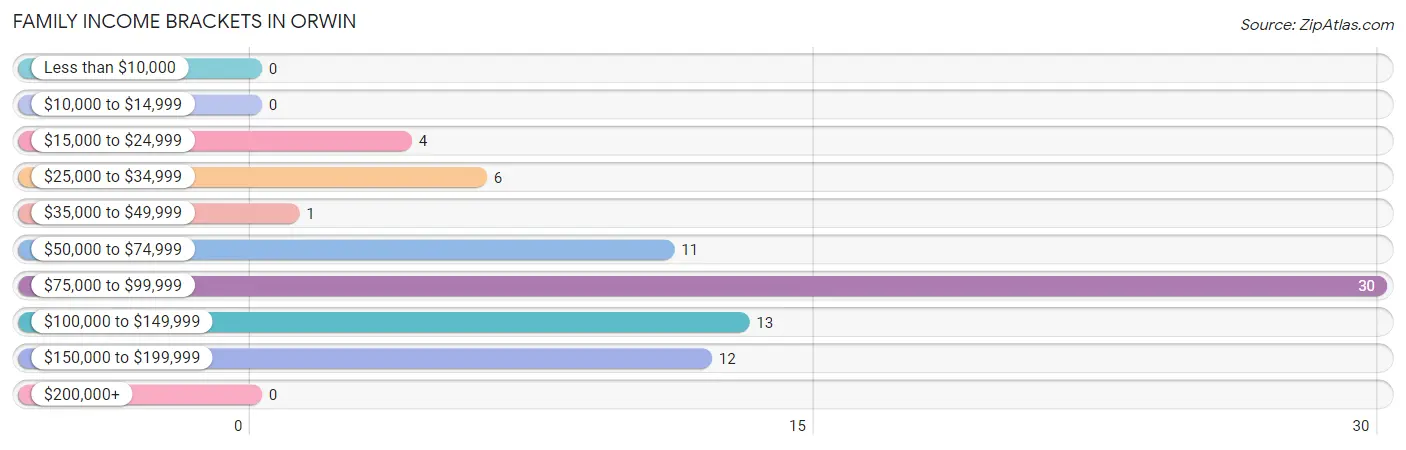
| Income Bracket | # Families | % Families |
| Less than $10,000 | 0 | 0.0% |
| $10,000 to $14,999 | 0 | 0.0% |
| $15,000 to $24,999 | 4 | 5.2% |
| $25,000 to $34,999 | 6 | 7.8% |
| $35,000 to $49,999 | 1 | 1.3% |
| $50,000 to $74,999 | 11 | 14.3% |
| $75,000 to $99,999 | 30 | 39.0% |
| $100,000 to $149,999 | 13 | 16.9% |
| $150,000 to $199,999 | 12 | 15.6% |
| $200,000+ | 0 | 0.0% |
Family Income by Famaliy Size in Orwin
2-person families (38 | 49.3%) account for the highest median family income in Orwin with $91,250 per family, while 2-person families (38 | 49.3%) have the highest median income of $45,625 per family member.
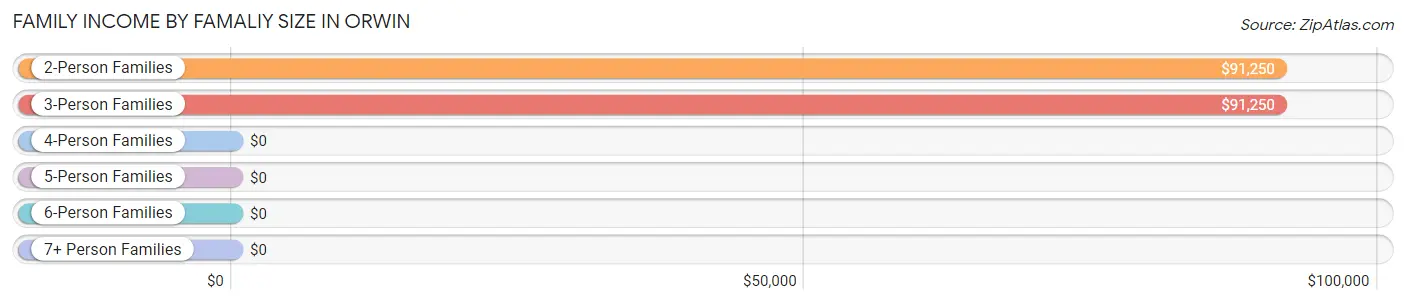
| Income Bracket | # Families | Median Income |
| 2-Person Families | 38 (49.3%) | $91,250 |
| 3-Person Families | 17 (22.1%) | $91,250 |
| 4-Person Families | 13 (16.9%) | $0 |
| 5-Person Families | 0 (0.0%) | $0 |
| 6-Person Families | 0 (0.0%) | $0 |
| 7+ Person Families | 9 (11.7%) | $0 |
| Total | 77 (100.0%) | $90,536 |
Family Income by Number of Earners in Orwin
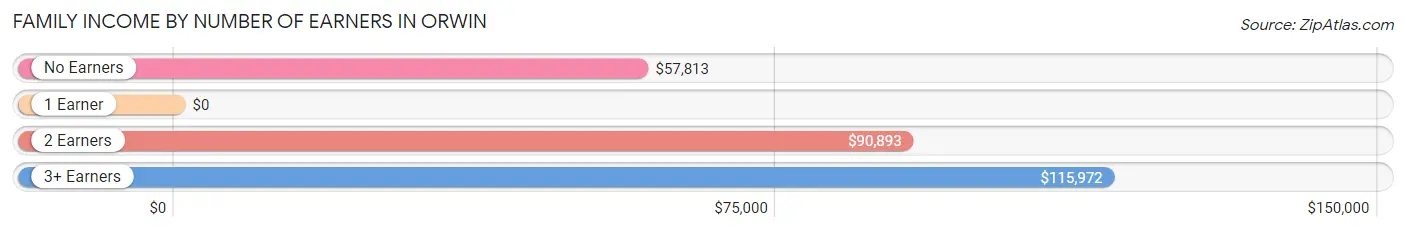
| Number of Earners | # Families | Median Income |
| No Earners | 23 (29.9%) | $57,813 |
| 1 Earner | 16 (20.8%) | $0 |
| 2 Earners | 17 (22.1%) | $90,893 |
| 3+ Earners | 21 (27.3%) | $115,972 |
| Total | 77 (100.0%) | $90,536 |
Household Income in Orwin
Household Income Brackets in Orwin
With 30 households falling in the category, the $75,000 to $99,999 income range is the most frequent in Orwin, accounting for 36.6% of all households.
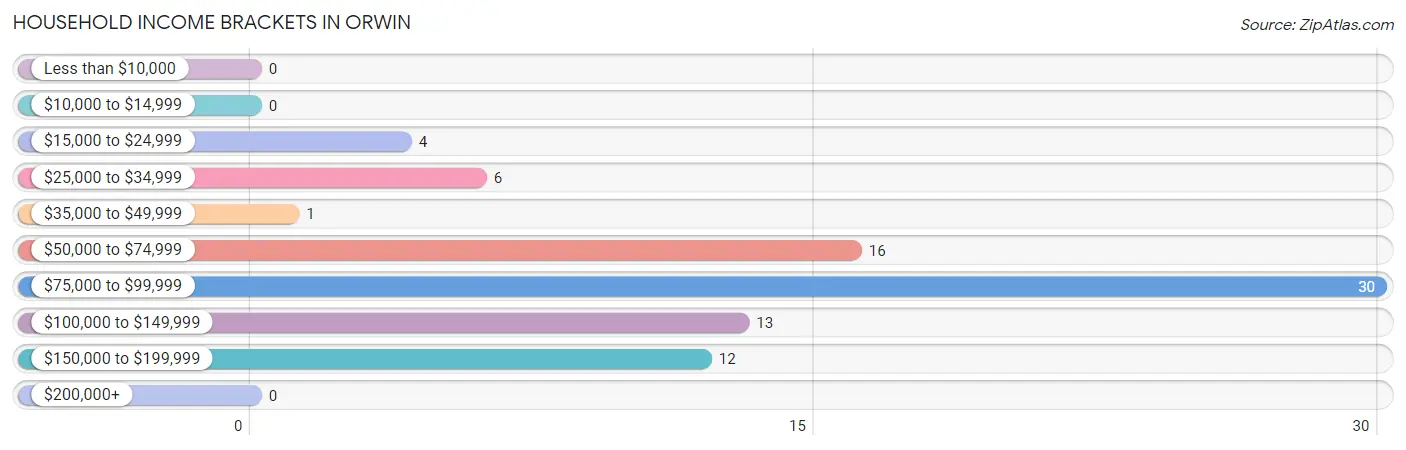
| Income Bracket | # Households | % Households |
| Less than $10,000 | 0 | 0.0% |
| $10,000 to $14,999 | 0 | 0.0% |
| $15,000 to $24,999 | 4 | 4.9% |
| $25,000 to $34,999 | 6 | 7.3% |
| $35,000 to $49,999 | 1 | 1.2% |
| $50,000 to $74,999 | 16 | 19.5% |
| $75,000 to $99,999 | 30 | 36.6% |
| $100,000 to $149,999 | 13 | 15.9% |
| $150,000 to $199,999 | 12 | 14.6% |
| $200,000+ | 0 | 0.0% |
Household Income by Householder Age in Orwin
The median household income in Orwin is $87,000, with the highest median household income of $80,833 found in the 45 to 64 years age bracket for the primary householder. A total of 26 households (31.7%) fall into this category.
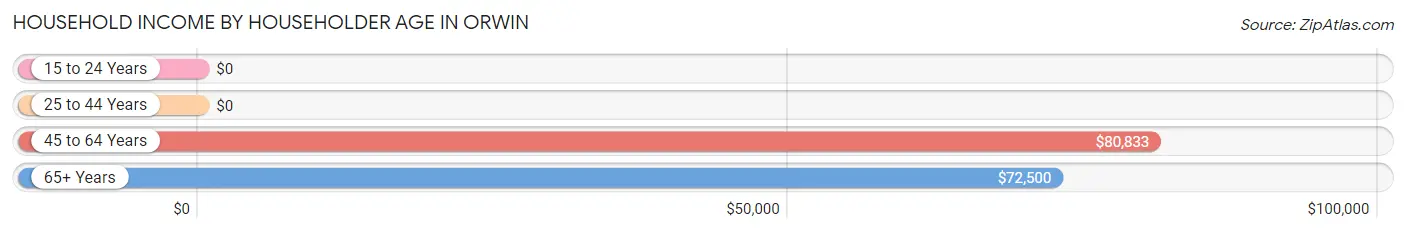
| Income Bracket | # Households | Median Income |
| 15 to 24 Years | 0 (0.0%) | $0 |
| 25 to 44 Years | 16 (19.5%) | $0 |
| 45 to 64 Years | 26 (31.7%) | $80,833 |
| 65+ Years | 40 (48.8%) | $72,500 |
| Total | 82 (100.0%) | $87,000 |
Poverty in Orwin
Income Below Poverty by Sex and Age in Orwin
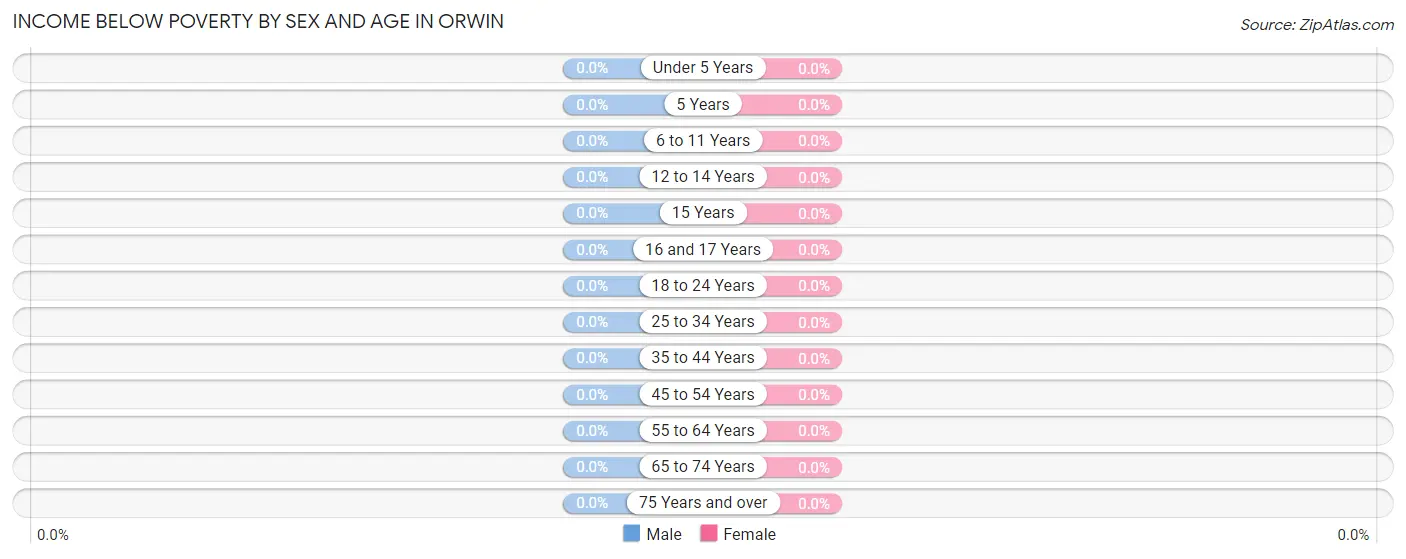
| Age Bracket | Male | Female |
| Under 5 Years | 0 (0.0%) | 0 (0.0%) |
| 5 Years | 0 (0.0%) | 0 (0.0%) |
| 6 to 11 Years | 0 (0.0%) | 0 (0.0%) |
| 12 to 14 Years | 0 (0.0%) | 0 (0.0%) |
| 15 Years | 0 (0.0%) | 0 (0.0%) |
| 16 and 17 Years | 0 (0.0%) | 0 (0.0%) |
| 18 to 24 Years | 0 (0.0%) | 0 (0.0%) |
| 25 to 34 Years | 0 (0.0%) | 0 (0.0%) |
| 35 to 44 Years | 0 (0.0%) | 0 (0.0%) |
| 45 to 54 Years | 0 (0.0%) | 0 (0.0%) |
| 55 to 64 Years | 0 (0.0%) | 0 (0.0%) |
| 65 to 74 Years | 0 (0.0%) | 0 (0.0%) |
| 75 Years and over | 0 (0.0%) | 0 (0.0%) |
| Total | 0 (0.0%) | 0 (0.0%) |
Income Above Poverty by Sex and Age in Orwin
According to the poverty statistics in Orwin, males aged 12 to 14 years and females aged 6 to 11 years are the age groups that are most secure financially, with 100.0% of males and 100.0% of females in these age groups living above the poverty line.
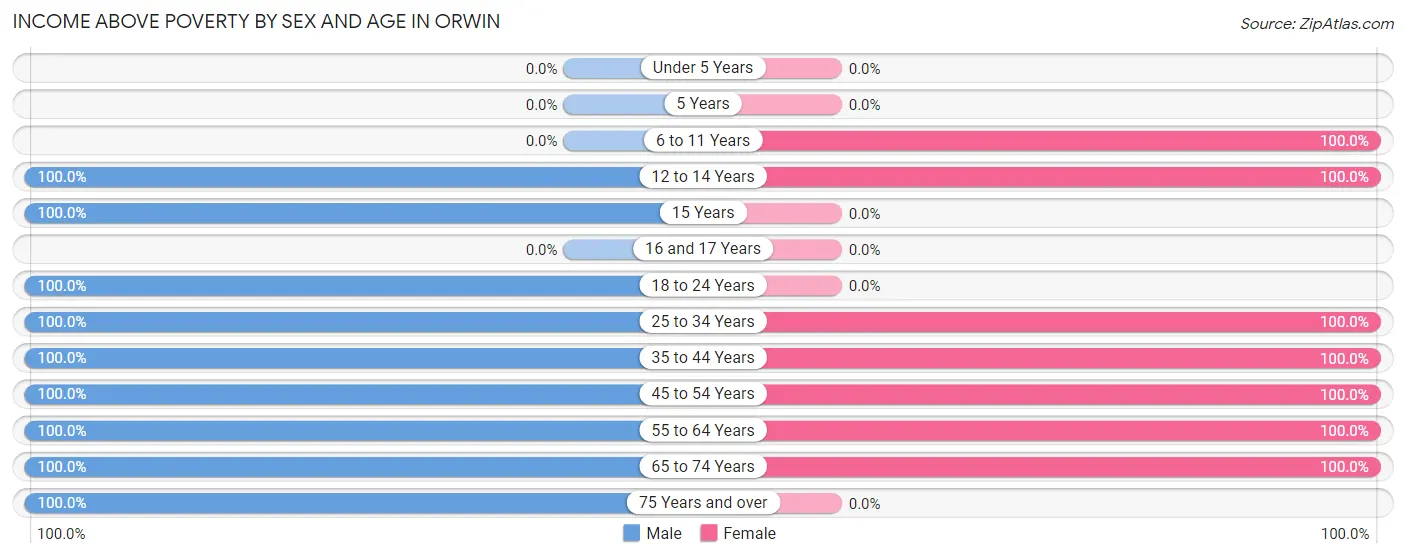
| Age Bracket | Male | Female |
| Under 5 Years | 0 (0.0%) | 0 (0.0%) |
| 5 Years | 0 (0.0%) | 0 (0.0%) |
| 6 to 11 Years | 0 (0.0%) | 7 (100.0%) |
| 12 to 14 Years | 5 (100.0%) | 17 (100.0%) |
| 15 Years | 14 (100.0%) | 0 (0.0%) |
| 16 and 17 Years | 0 (0.0%) | 0 (0.0%) |
| 18 to 24 Years | 39 (100.0%) | 0 (0.0%) |
| 25 to 34 Years | 7 (100.0%) | 11 (100.0%) |
| 35 to 44 Years | 16 (100.0%) | 15 (100.0%) |
| 45 to 54 Years | 19 (100.0%) | 11 (100.0%) |
| 55 to 64 Years | 20 (100.0%) | 9 (100.0%) |
| 65 to 74 Years | 19 (100.0%) | 30 (100.0%) |
| 75 Years and over | 16 (100.0%) | 0 (0.0%) |
| Total | 155 (100.0%) | 100 (100.0%) |
Income Below Poverty Among Married-Couple Families in Orwin
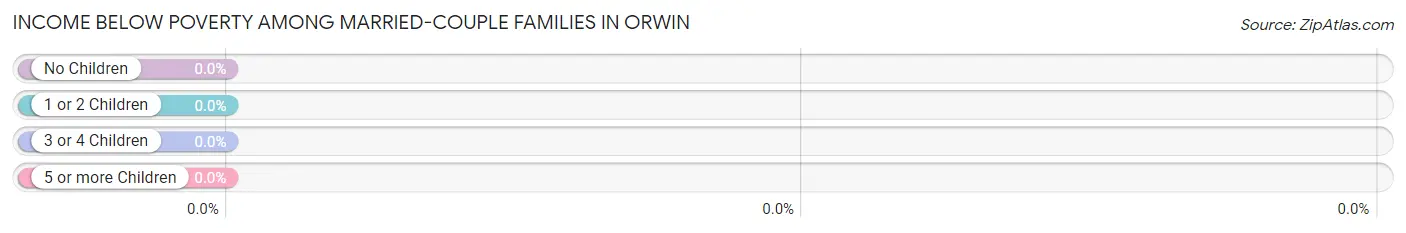
| Children | Above Poverty | Below Poverty |
| No Children | 41 (100.0%) | 0 (0.0%) |
| 1 or 2 Children | 29 (100.0%) | 0 (0.0%) |
| 3 or 4 Children | 0 (0.0%) | 0 (0.0%) |
| 5 or more Children | 0 (0.0%) | 0 (0.0%) |
| Total | 70 (100.0%) | 0 (0.0%) |
Income Below Poverty Among Single-Parent Households in Orwin
| Children | Single Father | Single Mother |
| No Children | 0 (0.0%) | 0 (0.0%) |
| 1 or 2 Children | 0 (0.0%) | 0 (0.0%) |
| 3 or 4 Children | 0 (0.0%) | 0 (0.0%) |
| 5 or more Children | 0 (0.0%) | 0 (0.0%) |
| Total | 0 (0.0%) | 0 (0.0%) |
Income Below Poverty Among Married-Couple vs Single-Parent Households in Orwin
| Children | Married-Couple Families | Single-Parent Households |
| No Children | 0 (0.0%) | 0 (0.0%) |
| 1 or 2 Children | 0 (0.0%) | 0 (0.0%) |
| 3 or 4 Children | 0 (0.0%) | 0 (0.0%) |
| 5 or more Children | 0 (0.0%) | 0 (0.0%) |
| Total | 0 (0.0%) | 0 (0.0%) |
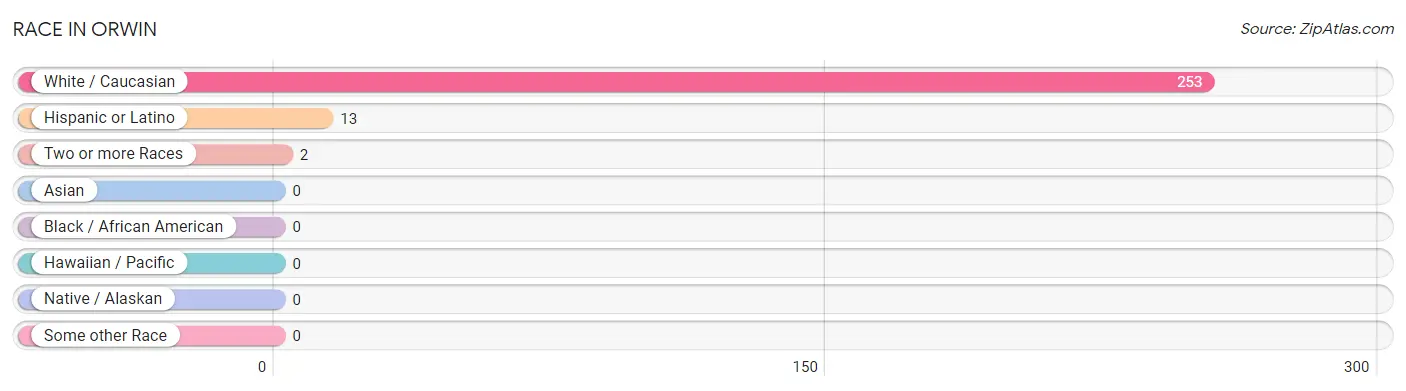
Race in Orwin
The most populous races in Orwin are White / Caucasian (253 | 99.2%), Hispanic or Latino (13 | 5.1%), and Two or more Races (2 | 0.8%).
| Race | # Population | % Population |
| Asian | 0 | 0.0% |
| Black / African American | 0 | 0.0% |
| Hawaiian / Pacific | 0 | 0.0% |
| Hispanic or Latino | 13 | 5.1% |
| Native / Alaskan | 0 | 0.0% |
| White / Caucasian | 253 | 99.2% |
| Two or more Races | 2 | 0.8% |
| Some other Race | 0 | 0.0% |
| Total | 255 | 100.0% |
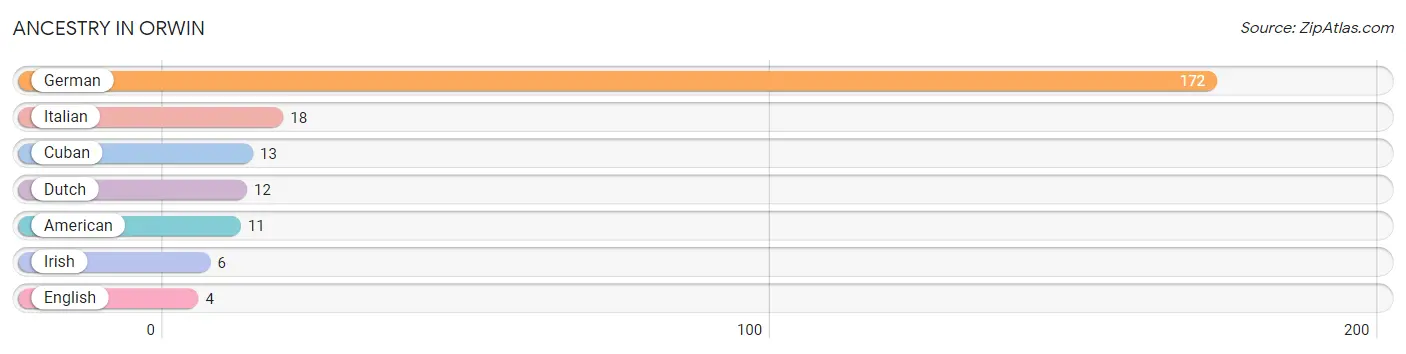
Ancestry in Orwin
The most populous ancestries reported in Orwin are German (172 | 67.4%), Italian (18 | 7.1%), Cuban (13 | 5.1%), Dutch (12 | 4.7%), and American (11 | 4.3%), together accounting for 88.6% of all Orwin residents.
| Ancestry | # Population | % Population |
| American | 11 | 4.3% |
| Cuban | 13 | 5.1% |
| Dutch | 12 | 4.7% |
| English | 4 | 1.6% |
| German | 172 | 67.4% |
| Irish | 6 | 2.4% |
| Italian | 18 | 7.1% | View All 7 Rows |
Immigrants in Orwin

| Immigration Origin | # Population | % Population | View All 0 Rows |
Sex and Age in Orwin
Sex and Age in Orwin
The most populous age groups in Orwin are 15 to 19 Years (43 | 27.7%) for men and 70 to 74 Years (21 | 21.0%) for women.
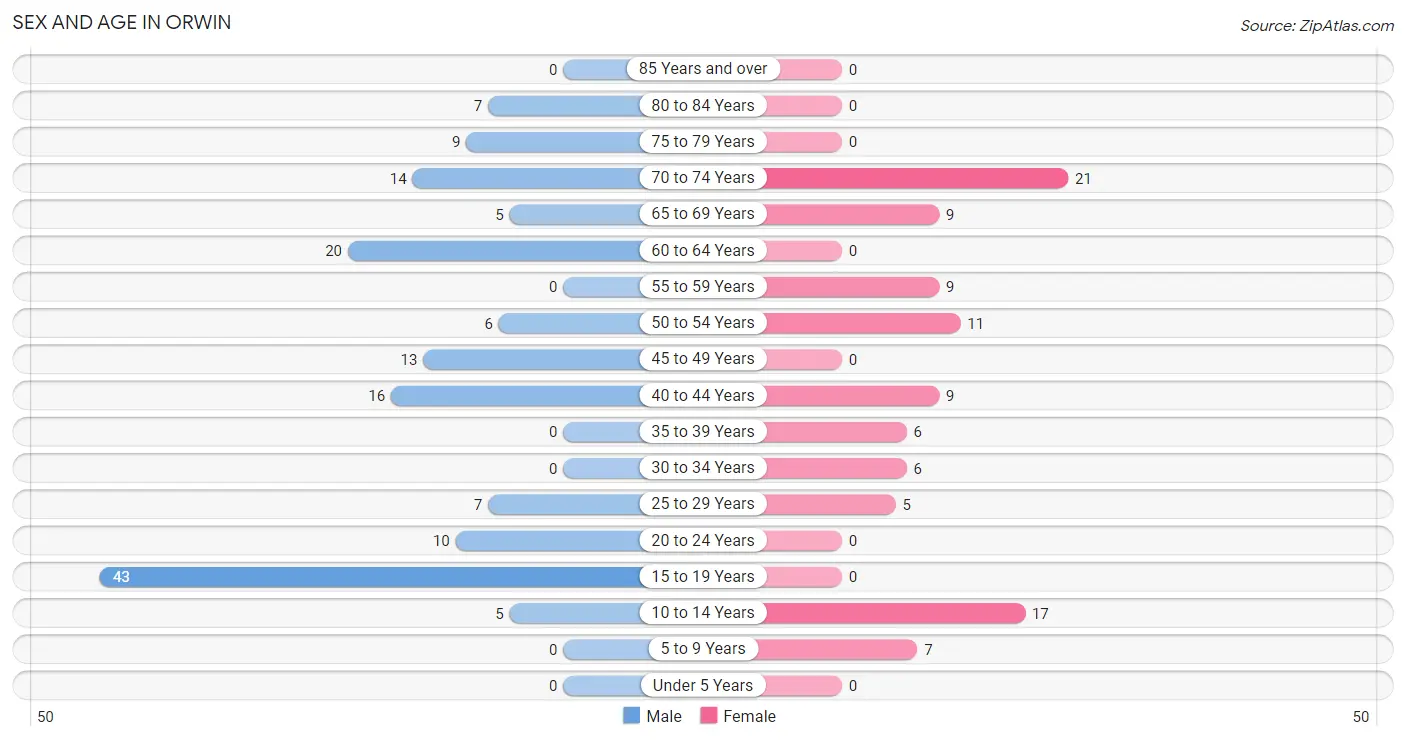
| Age Bracket | Male | Female |
| Under 5 Years | 0 (0.0%) | 0 (0.0%) |
| 5 to 9 Years | 0 (0.0%) | 7 (7.0%) |
| 10 to 14 Years | 5 (3.2%) | 17 (17.0%) |
| 15 to 19 Years | 43 (27.7%) | 0 (0.0%) |
| 20 to 24 Years | 10 (6.5%) | 0 (0.0%) |
| 25 to 29 Years | 7 (4.5%) | 5 (5.0%) |
| 30 to 34 Years | 0 (0.0%) | 6 (6.0%) |
| 35 to 39 Years | 0 (0.0%) | 6 (6.0%) |
| 40 to 44 Years | 16 (10.3%) | 9 (9.0%) |
| 45 to 49 Years | 13 (8.4%) | 0 (0.0%) |
| 50 to 54 Years | 6 (3.9%) | 11 (11.0%) |
| 55 to 59 Years | 0 (0.0%) | 9 (9.0%) |
| 60 to 64 Years | 20 (12.9%) | 0 (0.0%) |
| 65 to 69 Years | 5 (3.2%) | 9 (9.0%) |
| 70 to 74 Years | 14 (9.0%) | 21 (21.0%) |
| 75 to 79 Years | 9 (5.8%) | 0 (0.0%) |
| 80 to 84 Years | 7 (4.5%) | 0 (0.0%) |
| 85 Years and over | 0 (0.0%) | 0 (0.0%) |
| Total | 155 (100.0%) | 100 (100.0%) |
Families and Households in Orwin
Median Family Size in Orwin
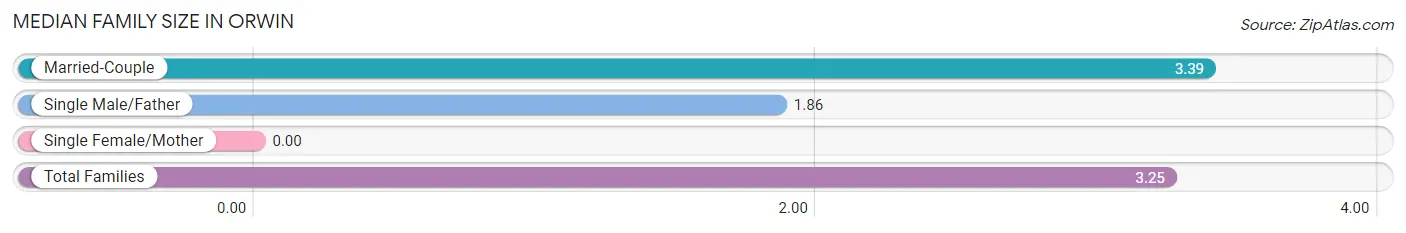
| Family Type | # Families | Family Size |
| Married-Couple | 70 (90.9%) | 3.39 |
| Single Male/Father | 7 (9.1%) | 1.86 |
| Single Female/Mother | 0 (0.0%) | - |
| Total Families | 77 (100.0%) | 3.25 |
Median Household Size in Orwin
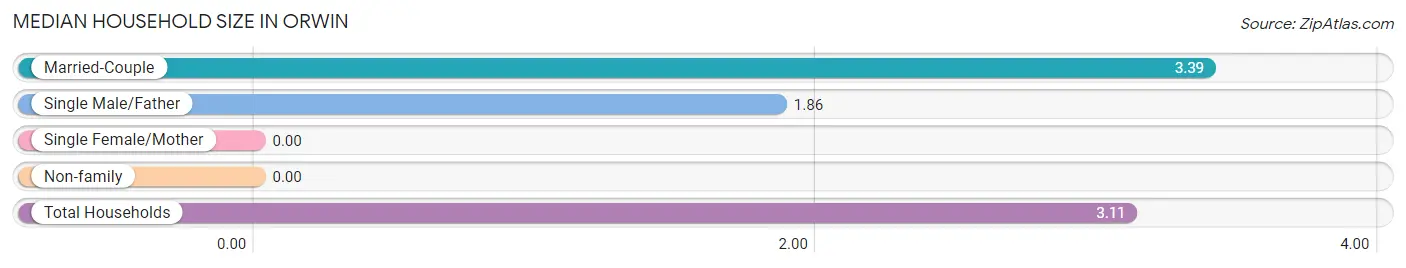
| Household Type | # Households | Household Size |
| Married-Couple | 70 (85.4%) | 3.39 |
| Single Male/Father | 7 (8.5%) | 1.86 |
| Single Female/Mother | 0 (0.0%) | - |
| Non-family | 5 (6.1%) | - |
| Total Households | 82 (100.0%) | 3.11 |
Household Size by Marriage Status in Orwin
Out of a total of 82 households in Orwin, 77 (93.9%) are family households, while 5 (6.1%) are nonfamily households. The most numerous type of family households are 2-person households, comprising 38, and the most common type of nonfamily households are 1-person households, comprising 5.
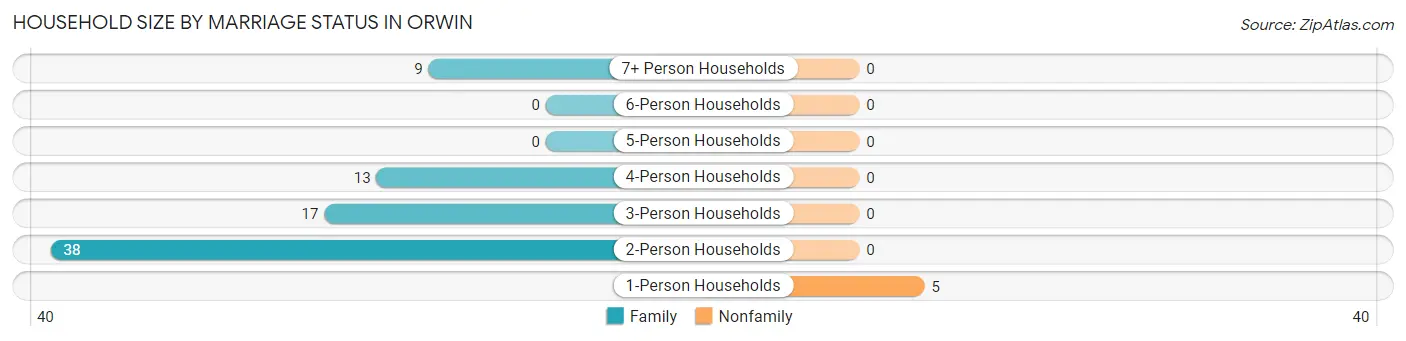
| Household Size | Family Households | Nonfamily Households |
| 1-Person Households | - | 5 (6.1%) |
| 2-Person Households | 38 (46.3%) | 0 (0.0%) |
| 3-Person Households | 17 (20.7%) | 0 (0.0%) |
| 4-Person Households | 13 (15.9%) | 0 (0.0%) |
| 5-Person Households | 0 (0.0%) | 0 (0.0%) |
| 6-Person Households | 0 (0.0%) | 0 (0.0%) |
| 7+ Person Households | 9 (11.0%) | 0 (0.0%) |
| Total | 77 (93.9%) | 5 (6.1%) |
Female Fertility in Orwin
Fertility by Age in Orwin
| Age Bracket | Women with Births | Births / 1,000 Women |
| 15 to 19 years | 0 (0.0%) | 0.0 |
| 20 to 34 years | 0 (0.0%) | 0.0 |
| 35 to 50 years | 0 (0.0%) | 0.0 |
| Total | 0 (0.0%) | 0.0 |
Fertility by Age by Marriage Status in Orwin
| Age Bracket | Married | Unmarried |
| 15 to 19 years | 0 (0.0%) | 0 (0.0%) |
| 20 to 34 years | 0 (0.0%) | 0 (0.0%) |
| 35 to 50 years | 0 (0.0%) | 0 (0.0%) |
| Total | 0 (0.0%) | 0 (0.0%) |
Fertility by Education in Orwin
| Educational Attainment | Women with Births | Births / 1,000 Women |
| Less than High School | 0 (0.0%) | 0.0 |
| High School Diploma | 0 (0.0%) | 0.0 |
| College or Associate's Degree | 0 (0.0%) | 0.0 |
| Bachelor's Degree | 0 (0.0%) | 0.0 |
| Graduate Degree | 0 (0.0%) | 0.0 |
| Total | 0 (0.0%) | 0.0 |
Fertility by Education by Marriage Status in Orwin
| Educational Attainment | Married | Unmarried |
| Less than High School | 0 (0.0%) | 0 (0.0%) |
| High School Diploma | 0 (0.0%) | 0 (0.0%) |
| College or Associate's Degree | 0 (0.0%) | 0 (0.0%) |
| Bachelor's Degree | 0 (0.0%) | 0 (0.0%) |
| Graduate Degree | 0 (0.0%) | 0 (0.0%) |
| Total | 0 (0.0%) | 0 (0.0%) |
Employment Characteristics in Orwin
Employment by Class of Employer in Orwin
Among the 121 employed individuals in Orwin, private company employees (97 | 80.2%), not-for-profit organizations (10 | 8.3%), and self-employed (not incorporated) (9 | 7.4%) make up the most common classes of employment.
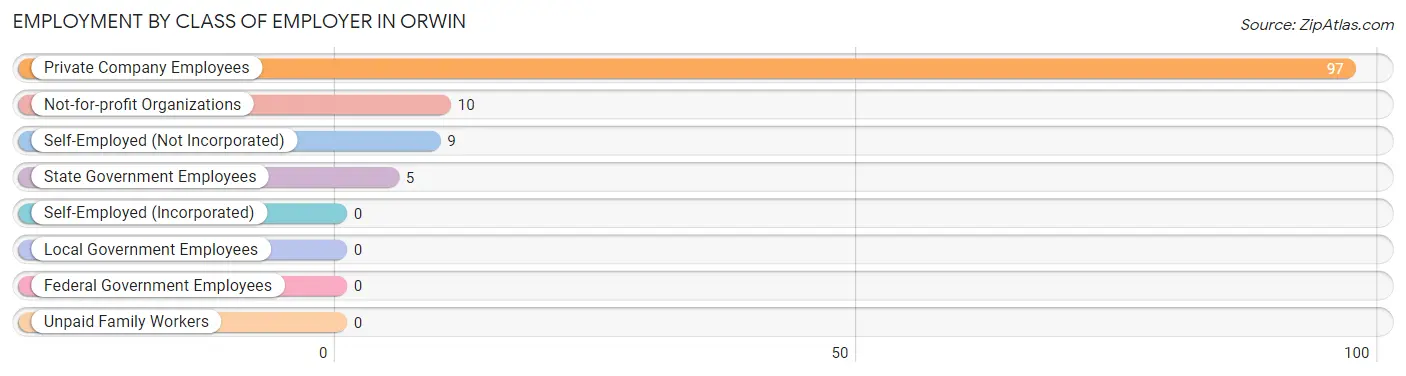
| Employer Class | # Employees | % Employees |
| Private Company Employees | 97 | 80.2% |
| Self-Employed (Incorporated) | 0 | 0.0% |
| Self-Employed (Not Incorporated) | 9 | 7.4% |
| Not-for-profit Organizations | 10 | 8.3% |
| Local Government Employees | 0 | 0.0% |
| State Government Employees | 5 | 4.1% |
| Federal Government Employees | 0 | 0.0% |
| Unpaid Family Workers | 0 | 0.0% |
| Total | 121 | 100.0% |
Employment Status by Age in Orwin
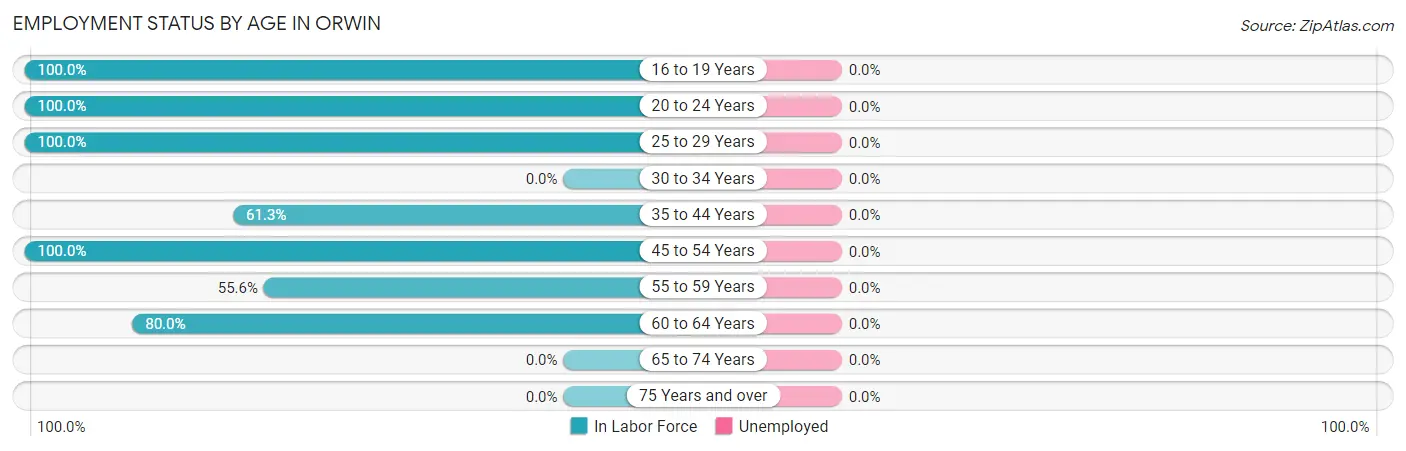
| Age Bracket | In Labor Force | Unemployed |
| 16 to 19 Years | 29 (100.0%) | 0 (0.0%) |
| 20 to 24 Years | 10 (100.0%) | 0 (0.0%) |
| 25 to 29 Years | 12 (100.0%) | 0 (0.0%) |
| 30 to 34 Years | 0 (0.0%) | 0 (0.0%) |
| 35 to 44 Years | 19 (61.3%) | 0 (0.0%) |
| 45 to 54 Years | 30 (100.0%) | 0 (0.0%) |
| 55 to 59 Years | 5 (55.6%) | 0 (0.0%) |
| 60 to 64 Years | 16 (80.0%) | 0 (0.0%) |
| 65 to 74 Years | 0 (0.0%) | 0 (0.0%) |
| 75 Years and over | 0 (0.0%) | 0 (0.0%) |
| Total | 121 (57.1%) | 0 (0.0%) |
Employment Status by Educational Attainment in Orwin
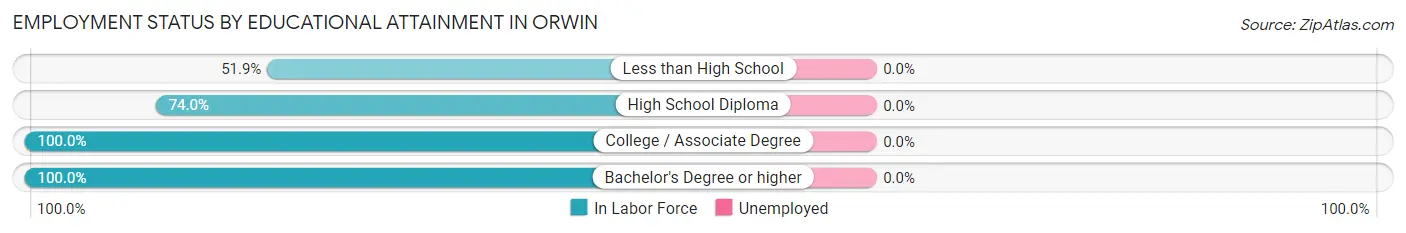
| Educational Attainment | In Labor Force | Unemployed |
| Less than High School | 14 (51.9%) | 0 (0.0%) |
| High School Diploma | 37 (74.0%) | 0 (0.0%) |
| College / Associate Degree | 22 (100.0%) | 0 (0.0%) |
| Bachelor's Degree or higher | 9 (100.0%) | 0 (0.0%) |
| Total | 82 (75.9%) | 0 (0.0%) |
Employment Occupations by Sex in Orwin
Management, Business, Science and Arts Occupations
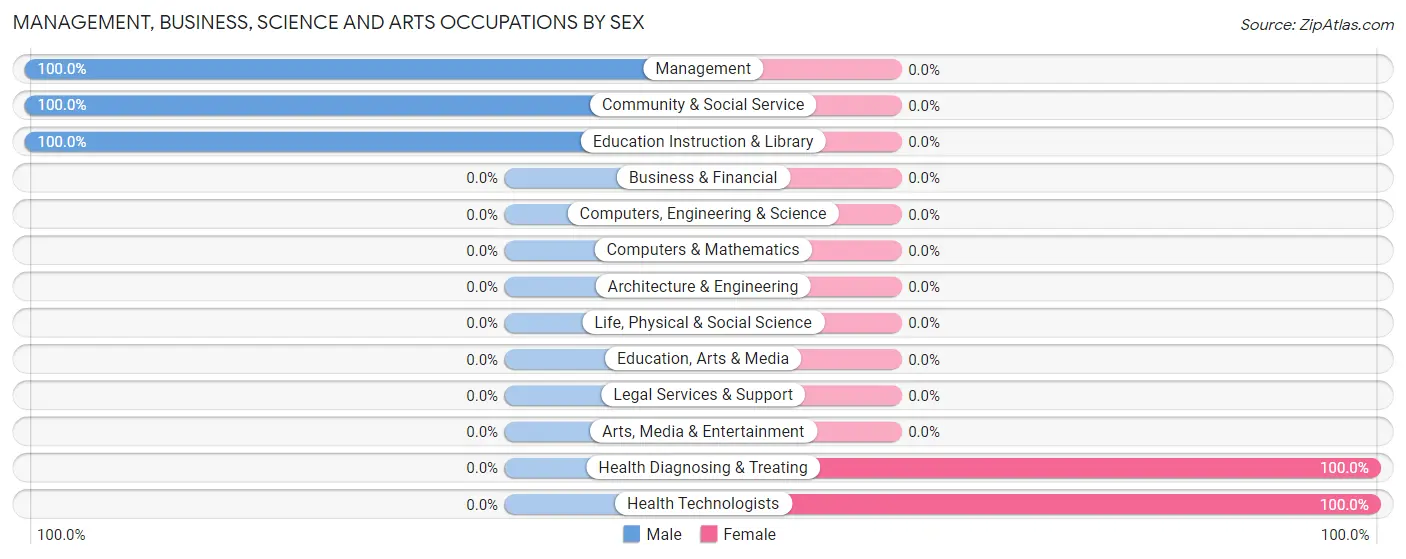
The most common Management, Business, Science and Arts occupations in Orwin are Management (10 | 8.3%), Community & Social Service (10 | 8.3%), Education Instruction & Library (10 | 8.3%), Health Diagnosing & Treating (5 | 4.1%), and Health Technologists (5 | 4.1%).
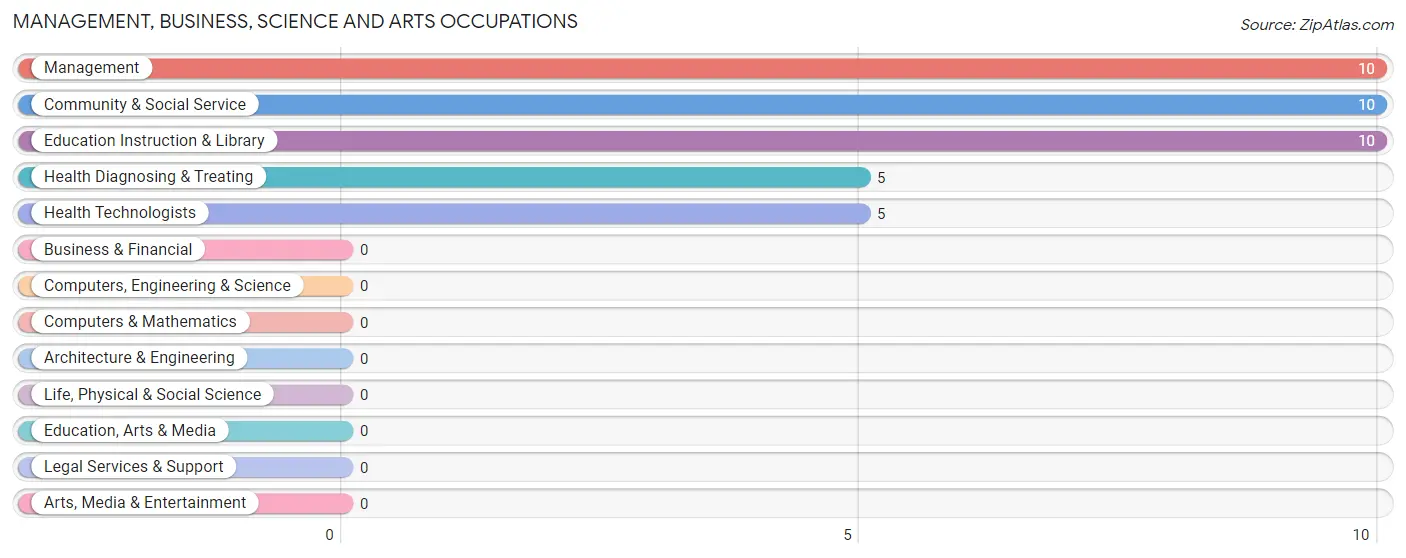
Management, Business, Science and Arts Occupations by Sex
Within the Management, Business, Science and Arts occupations in Orwin, the most male-oriented occupations are Management (100.0%), Community & Social Service (100.0%), and Education Instruction & Library (100.0%), while the most female-oriented occupations are Health Diagnosing & Treating (100.0%), and Health Technologists (100.0%).
| Occupation | Male | Female |
| Management | 10 (100.0%) | 0 (0.0%) |
| Business & Financial | 0 (0.0%) | 0 (0.0%) |
| Computers, Engineering & Science | 0 (0.0%) | 0 (0.0%) |
| Computers & Mathematics | 0 (0.0%) | 0 (0.0%) |
| Architecture & Engineering | 0 (0.0%) | 0 (0.0%) |
| Life, Physical & Social Science | 0 (0.0%) | 0 (0.0%) |
| Community & Social Service | 10 (100.0%) | 0 (0.0%) |
| Education, Arts & Media | 0 (0.0%) | 0 (0.0%) |
| Legal Services & Support | 0 (0.0%) | 0 (0.0%) |
| Education Instruction & Library | 10 (100.0%) | 0 (0.0%) |
| Arts, Media & Entertainment | 0 (0.0%) | 0 (0.0%) |
| Health Diagnosing & Treating | 0 (0.0%) | 5 (100.0%) |
| Health Technologists | 0 (0.0%) | 5 (100.0%) |
| Total (Category) | 20 (80.0%) | 5 (20.0%) |
| Total (Overall) | 94 (77.7%) | 27 (22.3%) |
Services Occupations
Services Occupations by Sex
| Occupation | Male | Female |
| Healthcare Support | 0 (0.0%) | 0 (0.0%) |
| Security & Protection | 0 (0.0%) | 0 (0.0%) |
| Firefighting & Prevention | 0 (0.0%) | 0 (0.0%) |
| Law Enforcement | 0 (0.0%) | 0 (0.0%) |
| Food Preparation & Serving | 0 (0.0%) | 0 (0.0%) |
| Cleaning & Maintenance | 0 (0.0%) | 0 (0.0%) |
| Personal Care & Service | 0 (0.0%) | 0 (0.0%) |
| Total (Category) | 0 (0.0%) | 0 (0.0%) |
| Total (Overall) | 94 (77.7%) | 27 (22.3%) |
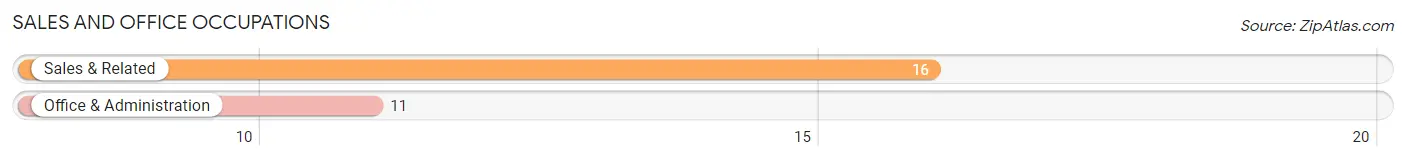
Sales and Office Occupations
The most common Sales and Office occupations in Orwin are Sales & Related (16 | 13.2%), and Office & Administration (11 | 9.1%).
Sales and Office Occupations by Sex

| Occupation | Male | Female |
| Sales & Related | 9 (56.2%) | 7 (43.8%) |
| Office & Administration | 0 (0.0%) | 11 (100.0%) |
| Total (Category) | 9 (33.3%) | 18 (66.7%) |
| Total (Overall) | 94 (77.7%) | 27 (22.3%) |
Natural Resources, Construction and Maintenance Occupations
The most common Natural Resources, Construction and Maintenance occupations in Orwin are Installation, Maintenance & Repair (12 | 9.9%), and Construction & Extraction (10 | 8.3%).
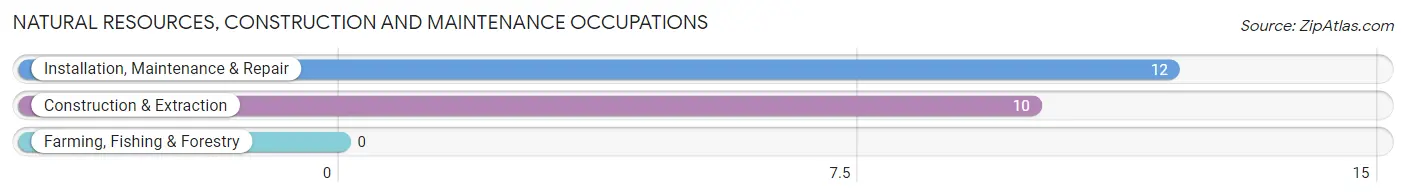
Natural Resources, Construction and Maintenance Occupations by Sex
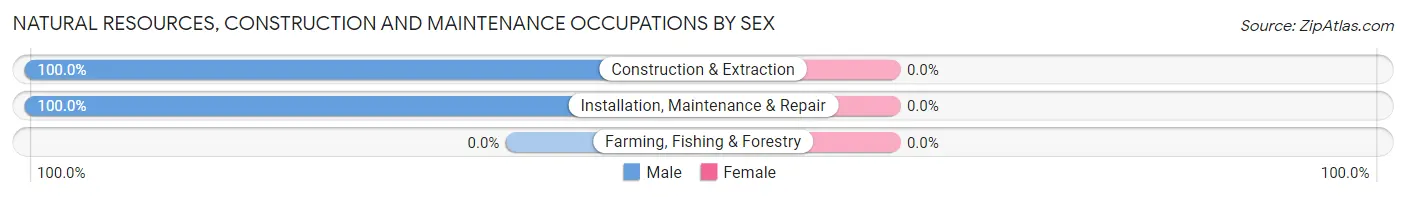
| Occupation | Male | Female |
| Farming, Fishing & Forestry | 0 (0.0%) | 0 (0.0%) |
| Construction & Extraction | 10 (100.0%) | 0 (0.0%) |
| Installation, Maintenance & Repair | 12 (100.0%) | 0 (0.0%) |
| Total (Category) | 22 (100.0%) | 0 (0.0%) |
| Total (Overall) | 94 (77.7%) | 27 (22.3%) |
Production, Transportation and Moving Occupations
The most common Production, Transportation and Moving occupations in Orwin are , and Production (47 | 38.8%).
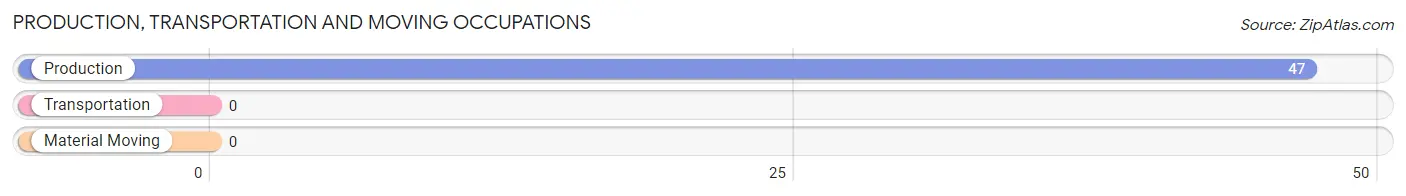
Production, Transportation and Moving Occupations by Sex
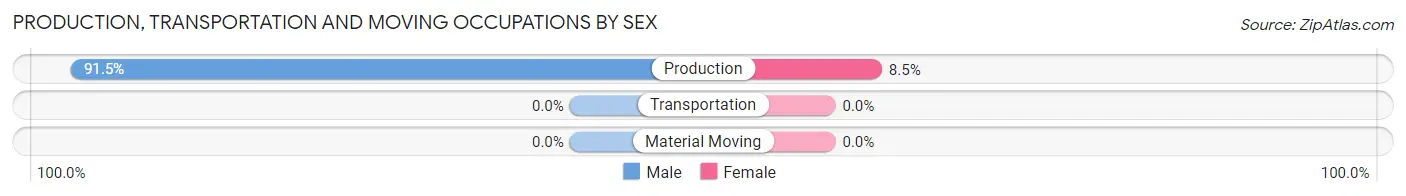
| Occupation | Male | Female |
| Production | 43 (91.5%) | 4 (8.5%) |
| Transportation | 0 (0.0%) | 0 (0.0%) |
| Material Moving | 0 (0.0%) | 0 (0.0%) |
| Total (Category) | 43 (91.5%) | 4 (8.5%) |
| Total (Overall) | 94 (77.7%) | 27 (22.3%) |
Employment Industries by Sex in Orwin
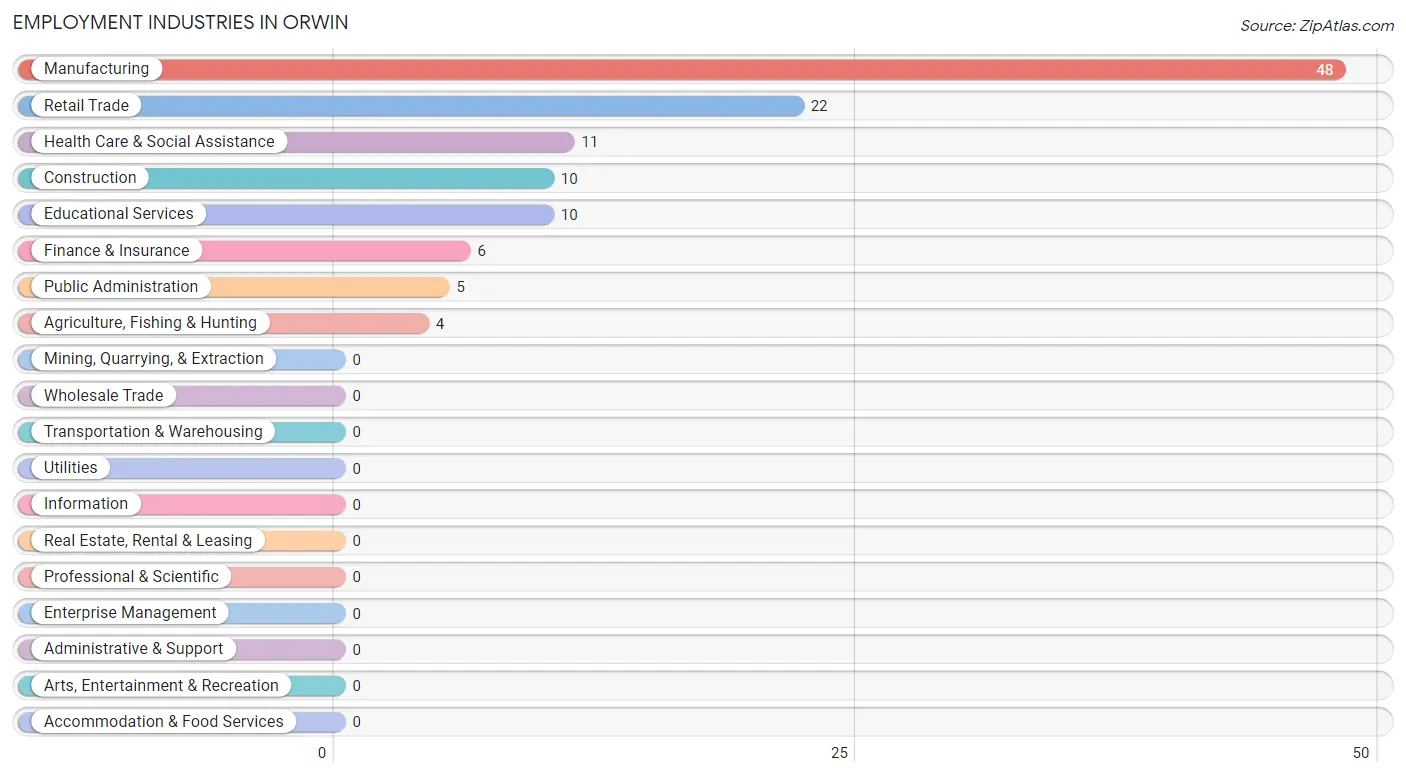
Employment Industries in Orwin
The major employment industries in Orwin include Manufacturing (48 | 39.7%), Retail Trade (22 | 18.2%), Health Care & Social Assistance (11 | 9.1%), Construction (10 | 8.3%), and Educational Services (10 | 8.3%).
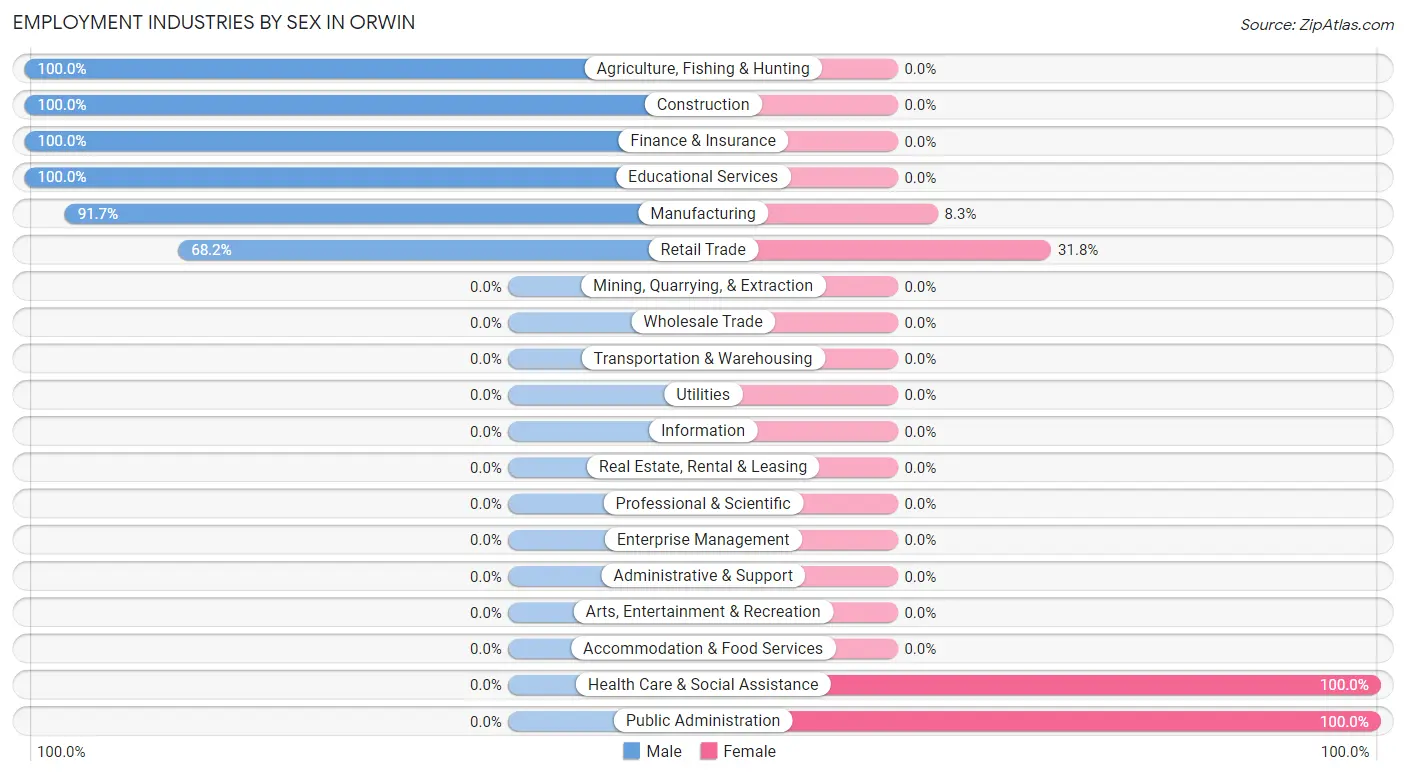
Employment Industries by Sex in Orwin
The Orwin industries that see more men than women are Agriculture, Fishing & Hunting (100.0%), Construction (100.0%), and Finance & Insurance (100.0%), whereas the industries that tend to have a higher number of women are Health Care & Social Assistance (100.0%), Public Administration (100.0%), and Retail Trade (31.8%).
| Industry | Male | Female |
| Agriculture, Fishing & Hunting | 4 (100.0%) | 0 (0.0%) |
| Mining, Quarrying, & Extraction | 0 (0.0%) | 0 (0.0%) |
| Construction | 10 (100.0%) | 0 (0.0%) |
| Manufacturing | 44 (91.7%) | 4 (8.3%) |
| Wholesale Trade | 0 (0.0%) | 0 (0.0%) |
| Retail Trade | 15 (68.2%) | 7 (31.8%) |
| Transportation & Warehousing | 0 (0.0%) | 0 (0.0%) |
| Utilities | 0 (0.0%) | 0 (0.0%) |
| Information | 0 (0.0%) | 0 (0.0%) |
| Finance & Insurance | 6 (100.0%) | 0 (0.0%) |
| Real Estate, Rental & Leasing | 0 (0.0%) | 0 (0.0%) |
| Professional & Scientific | 0 (0.0%) | 0 (0.0%) |
| Enterprise Management | 0 (0.0%) | 0 (0.0%) |
| Administrative & Support | 0 (0.0%) | 0 (0.0%) |
| Educational Services | 10 (100.0%) | 0 (0.0%) |
| Health Care & Social Assistance | 0 (0.0%) | 11 (100.0%) |
| Arts, Entertainment & Recreation | 0 (0.0%) | 0 (0.0%) |
| Accommodation & Food Services | 0 (0.0%) | 0 (0.0%) |
| Public Administration | 0 (0.0%) | 5 (100.0%) |
| Total | 94 (77.7%) | 27 (22.3%) |
Education in Orwin
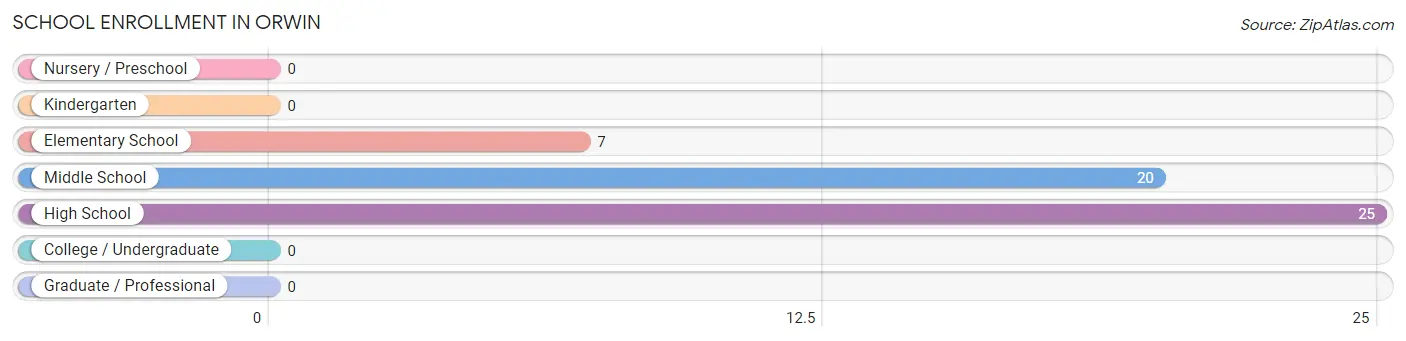
School Enrollment in Orwin
The most common levels of schooling among the 52 students in Orwin are high school (25 | 48.1%), middle school (20 | 38.5%), and elementary school (7 | 13.5%).
| School Level | # Students | % Students |
| Nursery / Preschool | 0 | 0.0% |
| Kindergarten | 0 | 0.0% |
| Elementary School | 7 | 13.5% |
| Middle School | 20 | 38.5% |
| High School | 25 | 48.1% |
| College / Undergraduate | 0 | 0.0% |
| Graduate / Professional | 0 | 0.0% |
| Total | 52 | 100.0% |
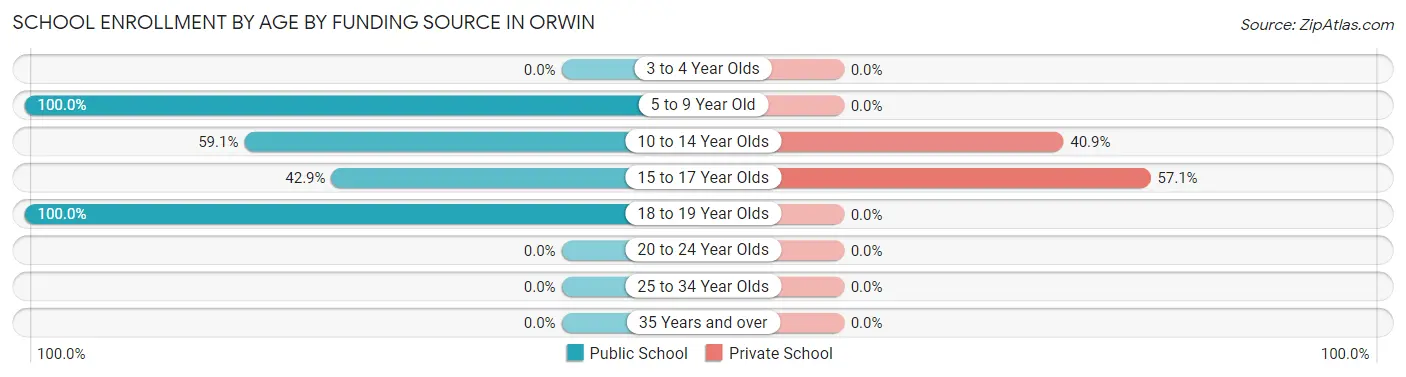
School Enrollment by Age by Funding Source in Orwin
Out of a total of 52 students who are enrolled in schools in Orwin, 17 (32.7%) attend a private institution, while the remaining 35 (67.3%) are enrolled in public schools. The age group of 15 to 17 year olds has the highest likelihood of being enrolled in private schools, with 8 (57.1% in the age bracket) enrolled. Conversely, the age group of 5 to 9 year old has the lowest likelihood of being enrolled in a private school, with 7 (100.0% in the age bracket) attending a public institution.
| Age Bracket | Public School | Private School |
| 3 to 4 Year Olds | 0 (0.0%) | 0 (0.0%) |
| 5 to 9 Year Old | 7 (100.0%) | 0 (0.0%) |
| 10 to 14 Year Olds | 13 (59.1%) | 9 (40.9%) |
| 15 to 17 Year Olds | 6 (42.9%) | 8 (57.1%) |
| 18 to 19 Year Olds | 9 (100.0%) | 0 (0.0%) |
| 20 to 24 Year Olds | 0 (0.0%) | 0 (0.0%) |
| 25 to 34 Year Olds | 0 (0.0%) | 0 (0.0%) |
| 35 Years and over | 0 (0.0%) | 0 (0.0%) |
| Total | 35 (67.3%) | 17 (32.7%) |
Educational Attainment by Field of Study in Orwin
Physical & health sciences (8 | 47.1%), science & technology (5 | 29.4%), and arts & humanities (4 | 23.5%) are the most common fields of study among 17 individuals in Orwin who have obtained a bachelor's degree or higher.
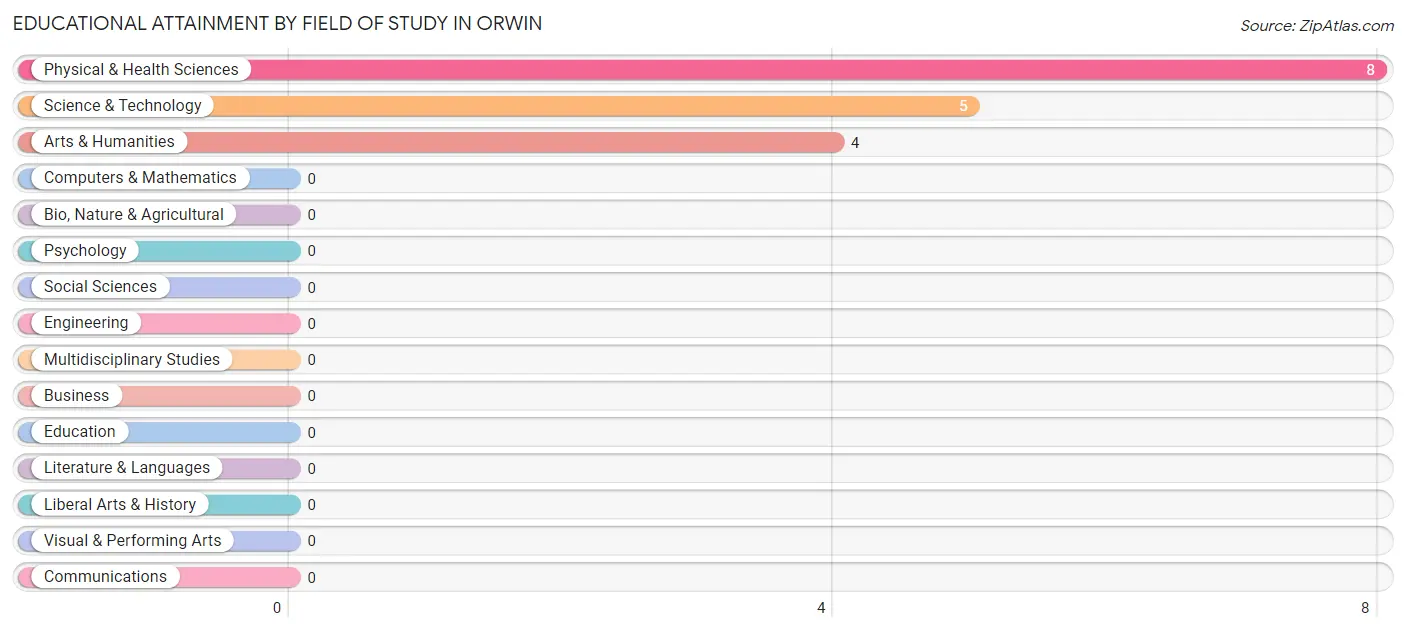
| Field of Study | # Graduates | % Graduates |
| Computers & Mathematics | 0 | 0.0% |
| Bio, Nature & Agricultural | 0 | 0.0% |
| Physical & Health Sciences | 8 | 47.1% |
| Psychology | 0 | 0.0% |
| Social Sciences | 0 | 0.0% |
| Engineering | 0 | 0.0% |
| Multidisciplinary Studies | 0 | 0.0% |
| Science & Technology | 5 | 29.4% |
| Business | 0 | 0.0% |
| Education | 0 | 0.0% |
| Literature & Languages | 0 | 0.0% |
| Liberal Arts & History | 0 | 0.0% |
| Visual & Performing Arts | 0 | 0.0% |
| Communications | 0 | 0.0% |
| Arts & Humanities | 4 | 23.5% |
| Total | 17 | 100.0% |
Transportation & Commute in Orwin
Vehicle Availability by Sex in Orwin
The most prevalent vehicle ownership categories in Orwin are males with 5 or more vehicles (55, accounting for 58.5%) and females with 5 or more vehicles (7, making up 203.7%).
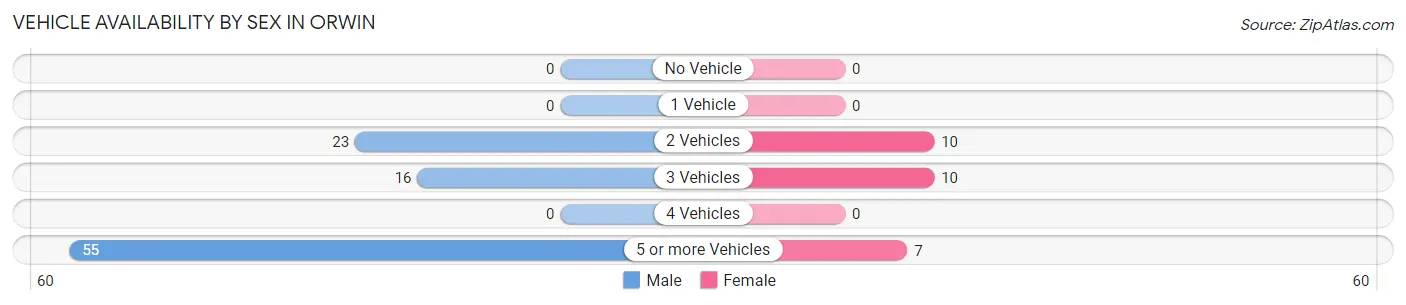
| Vehicles Available | Male | Female |
| No Vehicle | 0 (0.0%) | 0 (0.0%) |
| 1 Vehicle | 0 (0.0%) | 0 (0.0%) |
| 2 Vehicles | 23 (24.5%) | 10 (37.0%) |
| 3 Vehicles | 16 (17.0%) | 10 (37.0%) |
| 4 Vehicles | 0 (0.0%) | 0 (0.0%) |
| 5 or more Vehicles | 55 (58.5%) | 7 (25.9%) |
| Total | 94 (100.0%) | 27 (100.0%) |
Commute Time in Orwin
The most frequently occuring commute durations in Orwin are 25 to 29 minutes (37 commuters, 30.6%), 20 to 24 minutes (23 commuters, 19.0%), and less than 5 minutes (19 commuters, 15.7%).
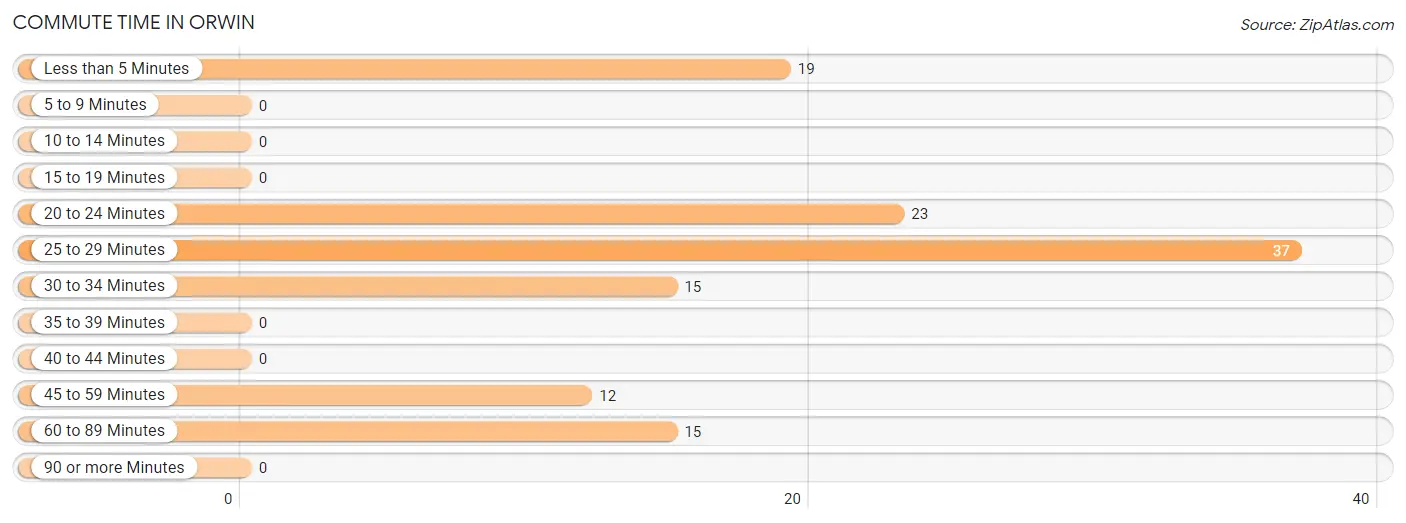
| Commute Time | # Commuters | % Commuters |
| Less than 5 Minutes | 19 | 15.7% |
| 5 to 9 Minutes | 0 | 0.0% |
| 10 to 14 Minutes | 0 | 0.0% |
| 15 to 19 Minutes | 0 | 0.0% |
| 20 to 24 Minutes | 23 | 19.0% |
| 25 to 29 Minutes | 37 | 30.6% |
| 30 to 34 Minutes | 15 | 12.4% |
| 35 to 39 Minutes | 0 | 0.0% |
| 40 to 44 Minutes | 0 | 0.0% |
| 45 to 59 Minutes | 12 | 9.9% |
| 60 to 89 Minutes | 15 | 12.4% |
| 90 or more Minutes | 0 | 0.0% |
Commute Time by Sex in Orwin
The most common commute times in Orwin are 25 to 29 minutes (24 commuters, 25.5%) for males and 25 to 29 minutes (13 commuters, 48.1%) for females.
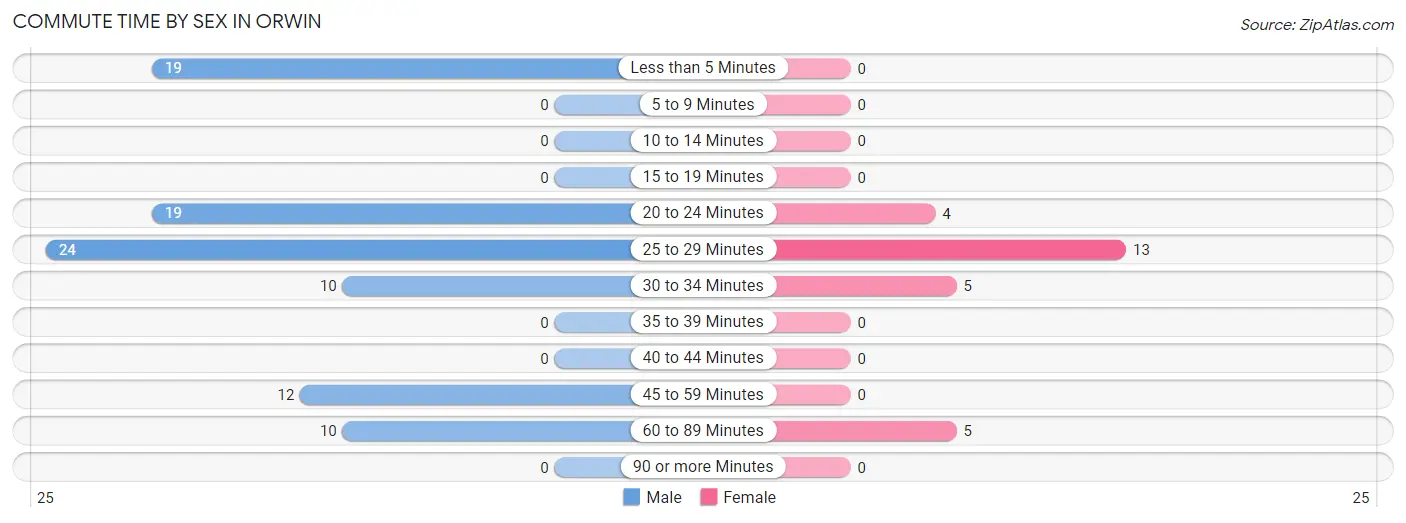
| Commute Time | Male | Female |
| Less than 5 Minutes | 19 (20.2%) | 0 (0.0%) |
| 5 to 9 Minutes | 0 (0.0%) | 0 (0.0%) |
| 10 to 14 Minutes | 0 (0.0%) | 0 (0.0%) |
| 15 to 19 Minutes | 0 (0.0%) | 0 (0.0%) |
| 20 to 24 Minutes | 19 (20.2%) | 4 (14.8%) |
| 25 to 29 Minutes | 24 (25.5%) | 13 (48.1%) |
| 30 to 34 Minutes | 10 (10.6%) | 5 (18.5%) |
| 35 to 39 Minutes | 0 (0.0%) | 0 (0.0%) |
| 40 to 44 Minutes | 0 (0.0%) | 0 (0.0%) |
| 45 to 59 Minutes | 12 (12.8%) | 0 (0.0%) |
| 60 to 89 Minutes | 10 (10.6%) | 5 (18.5%) |
| 90 or more Minutes | 0 (0.0%) | 0 (0.0%) |
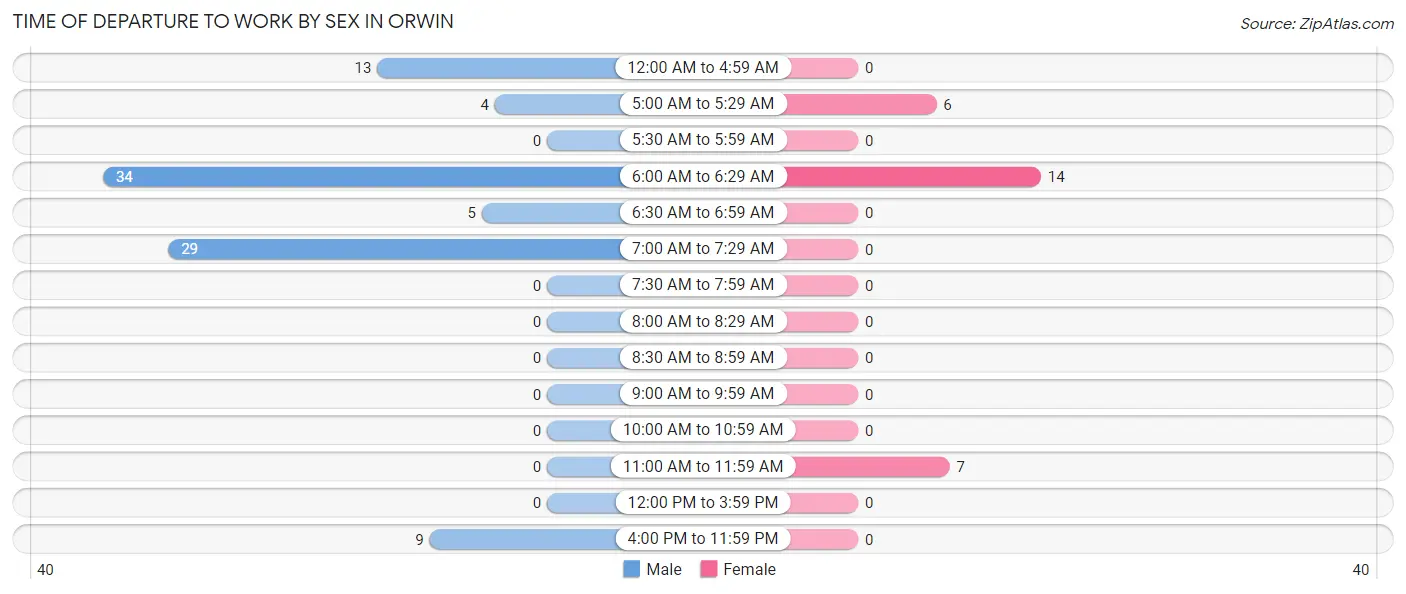
Time of Departure to Work by Sex in Orwin
The most frequent times of departure to work in Orwin are 6:00 AM to 6:29 AM (34, 36.2%) for males and 6:00 AM to 6:29 AM (14, 51.8%) for females.
| Time of Departure | Male | Female |
| 12:00 AM to 4:59 AM | 13 (13.8%) | 0 (0.0%) |
| 5:00 AM to 5:29 AM | 4 (4.3%) | 6 (22.2%) |
| 5:30 AM to 5:59 AM | 0 (0.0%) | 0 (0.0%) |
| 6:00 AM to 6:29 AM | 34 (36.2%) | 14 (51.8%) |
| 6:30 AM to 6:59 AM | 5 (5.3%) | 0 (0.0%) |
| 7:00 AM to 7:29 AM | 29 (30.8%) | 0 (0.0%) |
| 7:30 AM to 7:59 AM | 0 (0.0%) | 0 (0.0%) |
| 8:00 AM to 8:29 AM | 0 (0.0%) | 0 (0.0%) |
| 8:30 AM to 8:59 AM | 0 (0.0%) | 0 (0.0%) |
| 9:00 AM to 9:59 AM | 0 (0.0%) | 0 (0.0%) |
| 10:00 AM to 10:59 AM | 0 (0.0%) | 0 (0.0%) |
| 11:00 AM to 11:59 AM | 0 (0.0%) | 7 (25.9%) |
| 12:00 PM to 3:59 PM | 0 (0.0%) | 0 (0.0%) |
| 4:00 PM to 11:59 PM | 9 (9.6%) | 0 (0.0%) |
| Total | 94 (100.0%) | 27 (100.0%) |
Housing Occupancy in Orwin
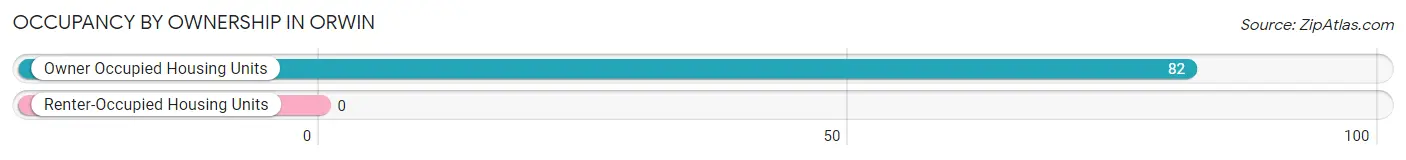
Occupancy by Ownership in Orwin
Of the total 82 dwellings in Orwin, owner-occupied units account for 82 (100.0%), while renter-occupied units make up 0 (0.0%).
| Occupancy | # Housing Units | % Housing Units |
| Owner Occupied Housing Units | 82 | 100.0% |
| Renter-Occupied Housing Units | 0 | 0.0% |
| Total Occupied Housing Units | 82 | 100.0% |
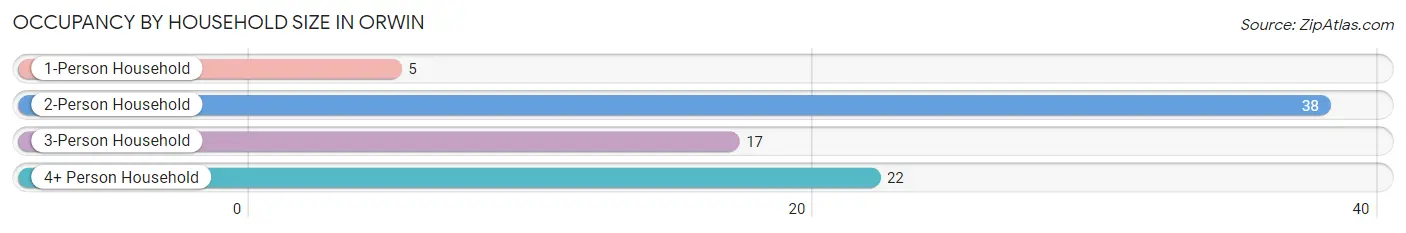
Occupancy by Household Size in Orwin
| Household Size | # Housing Units | % Housing Units |
| 1-Person Household | 5 | 6.1% |
| 2-Person Household | 38 | 46.3% |
| 3-Person Household | 17 | 20.7% |
| 4+ Person Household | 22 | 26.8% |
| Total Housing Units | 82 | 100.0% |
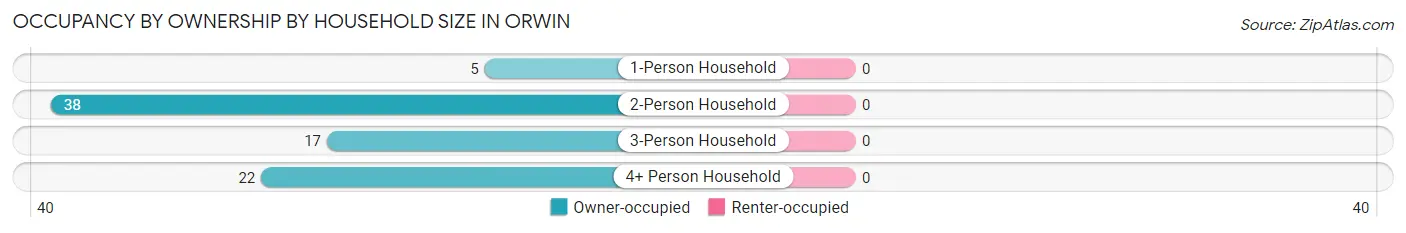
Occupancy by Ownership by Household Size in Orwin
| Household Size | Owner-occupied | Renter-occupied |
| 1-Person Household | 5 (100.0%) | 0 (0.0%) |
| 2-Person Household | 38 (100.0%) | 0 (0.0%) |
| 3-Person Household | 17 (100.0%) | 0 (0.0%) |
| 4+ Person Household | 22 (100.0%) | 0 (0.0%) |
| Total Housing Units | 82 (100.0%) | 0 (0.0%) |
Occupancy by Educational Attainment in Orwin
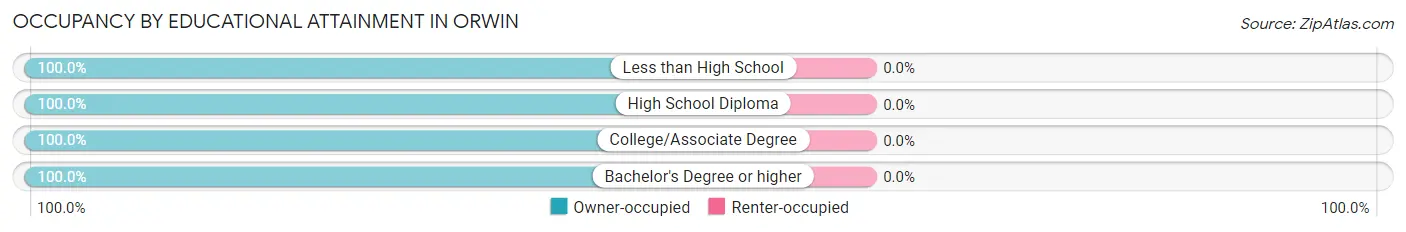
| Household Size | Owner-occupied | Renter-occupied |
| Less than High School | 16 (100.0%) | 0 (0.0%) |
| High School Diploma | 52 (100.0%) | 0 (0.0%) |
| College/Associate Degree | 10 (100.0%) | 0 (0.0%) |
| Bachelor's Degree or higher | 4 (100.0%) | 0 (0.0%) |
Occupancy by Age of Householder in Orwin
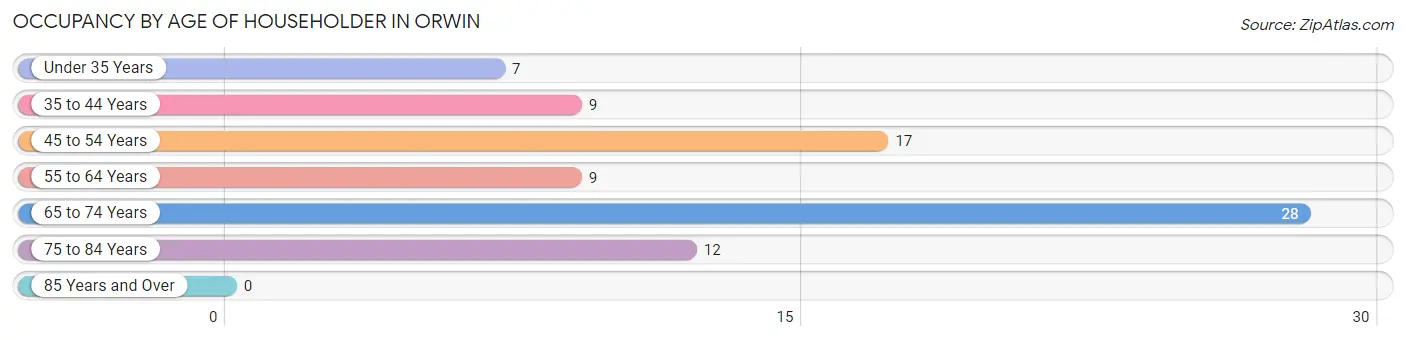
| Age Bracket | # Households | % Households |
| Under 35 Years | 7 | 8.5% |
| 35 to 44 Years | 9 | 11.0% |
| 45 to 54 Years | 17 | 20.7% |
| 55 to 64 Years | 9 | 11.0% |
| 65 to 74 Years | 28 | 34.2% |
| 75 to 84 Years | 12 | 14.6% |
| 85 Years and Over | 0 | 0.0% |
| Total | 82 | 100.0% |
Housing Finances in Orwin
Median Income by Occupancy in Orwin
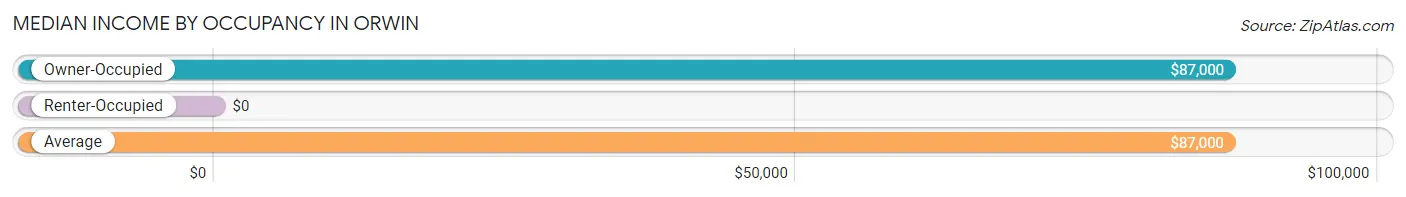
| Occupancy Type | # Households | Median Income |
| Owner-Occupied | 82 (100.0%) | $87,000 |
| Renter-Occupied | 0 (0.0%) | $0 |
| Average | 82 (100.0%) | $87,000 |
Occupancy by Householder Income Bracket in Orwin
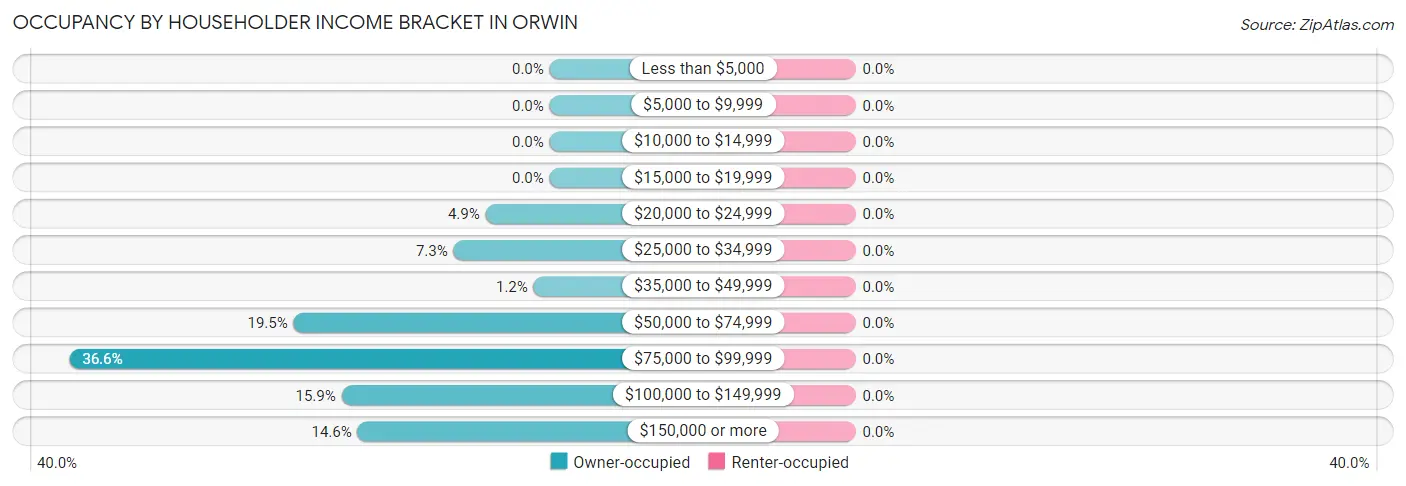
| Income Bracket | Owner-occupied | Renter-occupied |
| Less than $5,000 | 0 (0.0%) | 0 (0.0%) |
| $5,000 to $9,999 | 0 (0.0%) | 0 (0.0%) |
| $10,000 to $14,999 | 0 (0.0%) | 0 (0.0%) |
| $15,000 to $19,999 | 0 (0.0%) | 0 (0.0%) |
| $20,000 to $24,999 | 4 (4.9%) | 0 (0.0%) |
| $25,000 to $34,999 | 6 (7.3%) | 0 (0.0%) |
| $35,000 to $49,999 | 1 (1.2%) | 0 (0.0%) |
| $50,000 to $74,999 | 16 (19.5%) | 0 (0.0%) |
| $75,000 to $99,999 | 30 (36.6%) | 0 (0.0%) |
| $100,000 to $149,999 | 13 (15.9%) | 0 (0.0%) |
| $150,000 or more | 12 (14.6%) | 0 (0.0%) |
| Total | 82 (100.0%) | 0 (0.0%) |
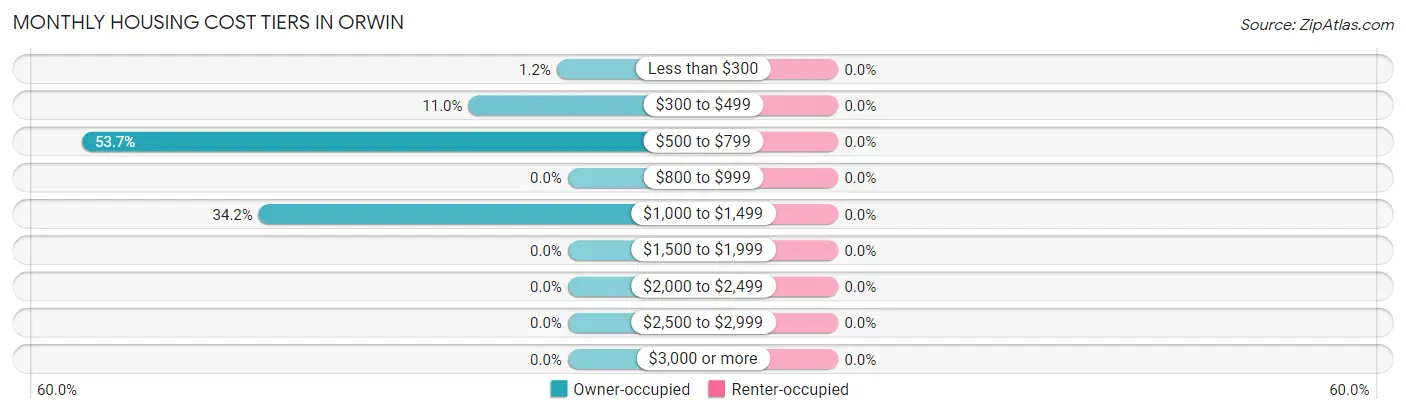
Monthly Housing Cost Tiers in Orwin
| Monthly Cost | Owner-occupied | Renter-occupied |
| Less than $300 | 1 (1.2%) | 0 (0.0%) |
| $300 to $499 | 9 (11.0%) | 0 (0.0%) |
| $500 to $799 | 44 (53.7%) | 0 (0.0%) |
| $800 to $999 | 0 (0.0%) | 0 (0.0%) |
| $1,000 to $1,499 | 28 (34.2%) | 0 (0.0%) |
| $1,500 to $1,999 | 0 (0.0%) | 0 (0.0%) |
| $2,000 to $2,499 | 0 (0.0%) | 0 (0.0%) |
| $2,500 to $2,999 | 0 (0.0%) | 0 (0.0%) |
| $3,000 or more | 0 (0.0%) | 0 (0.0%) |
| Total | 82 (100.0%) | 0 (0.0%) |
Physical Housing Characteristics in Orwin
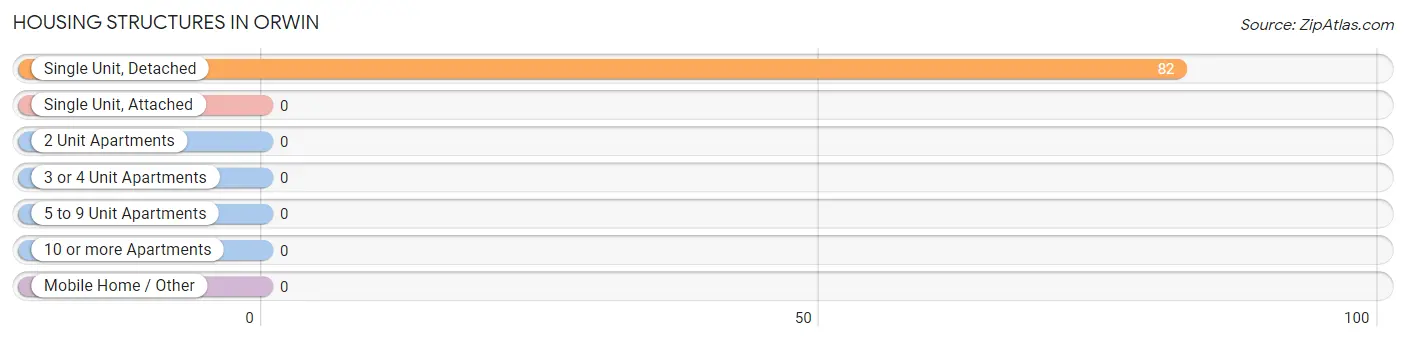
Housing Structures in Orwin
| Structure Type | # Housing Units | % Housing Units |
| Single Unit, Detached | 82 | 100.0% |
| Single Unit, Attached | 0 | 0.0% |
| 2 Unit Apartments | 0 | 0.0% |
| 3 or 4 Unit Apartments | 0 | 0.0% |
| 5 to 9 Unit Apartments | 0 | 0.0% |
| 10 or more Apartments | 0 | 0.0% |
| Mobile Home / Other | 0 | 0.0% |
| Total | 82 | 100.0% |
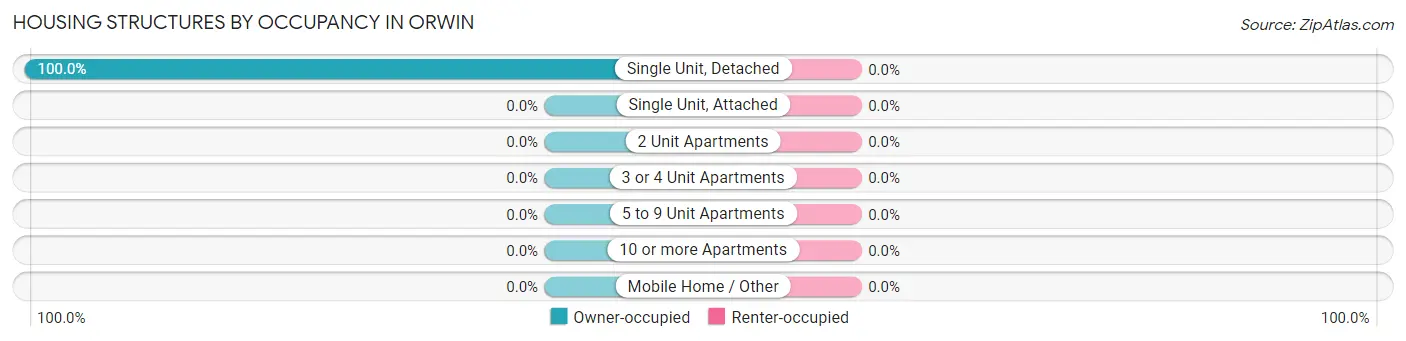
Housing Structures by Occupancy in Orwin
| Structure Type | Owner-occupied | Renter-occupied |
| Single Unit, Detached | 82 (100.0%) | 0 (0.0%) |
| Single Unit, Attached | 0 (0.0%) | 0 (0.0%) |
| 2 Unit Apartments | 0 (0.0%) | 0 (0.0%) |
| 3 or 4 Unit Apartments | 0 (0.0%) | 0 (0.0%) |
| 5 to 9 Unit Apartments | 0 (0.0%) | 0 (0.0%) |
| 10 or more Apartments | 0 (0.0%) | 0 (0.0%) |
| Mobile Home / Other | 0 (0.0%) | 0 (0.0%) |
| Total | 82 (100.0%) | 0 (0.0%) |
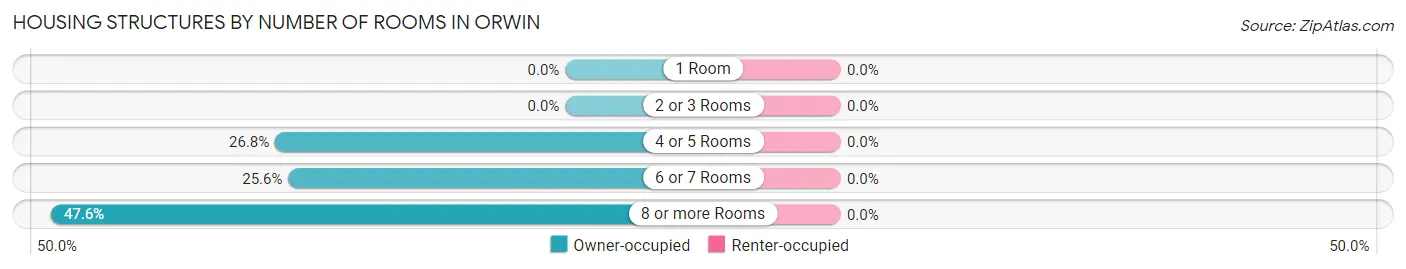
Housing Structures by Number of Rooms in Orwin
| Number of Rooms | Owner-occupied | Renter-occupied |
| 1 Room | 0 (0.0%) | 0 (0.0%) |
| 2 or 3 Rooms | 0 (0.0%) | 0 (0.0%) |
| 4 or 5 Rooms | 22 (26.8%) | 0 (0.0%) |
| 6 or 7 Rooms | 21 (25.6%) | 0 (0.0%) |
| 8 or more Rooms | 39 (47.6%) | 0 (0.0%) |
| Total | 82 (100.0%) | 0 (0.0%) |
Housing Structure by Heating Type in Orwin
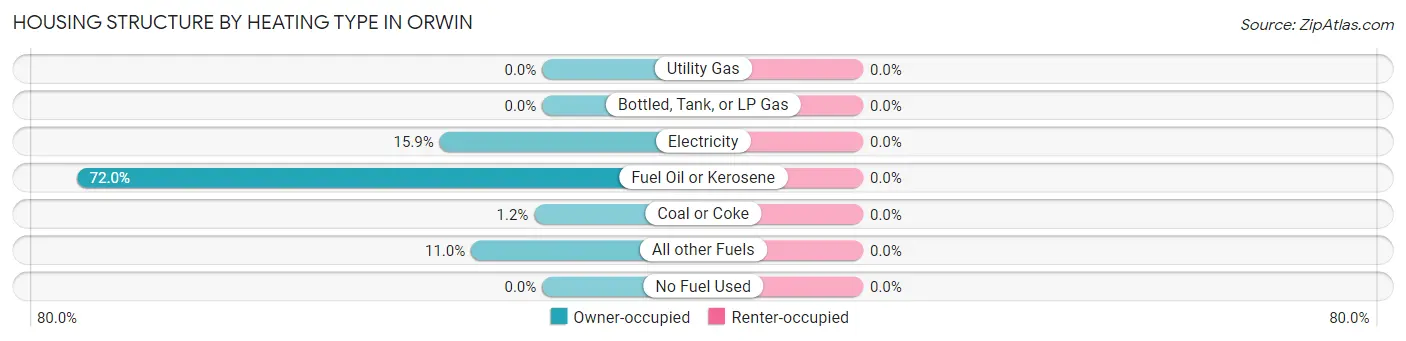
| Heating Type | Owner-occupied | Renter-occupied |
| Utility Gas | 0 (0.0%) | 0 (0.0%) |
| Bottled, Tank, or LP Gas | 0 (0.0%) | 0 (0.0%) |
| Electricity | 13 (15.9%) | 0 (0.0%) |
| Fuel Oil or Kerosene | 59 (72.0%) | 0 (0.0%) |
| Coal or Coke | 1 (1.2%) | 0 (0.0%) |
| All other Fuels | 9 (11.0%) | 0 (0.0%) |
| No Fuel Used | 0 (0.0%) | 0 (0.0%) |
| Total | 82 (100.0%) | 0 (0.0%) |
Household Vehicle Usage in Orwin
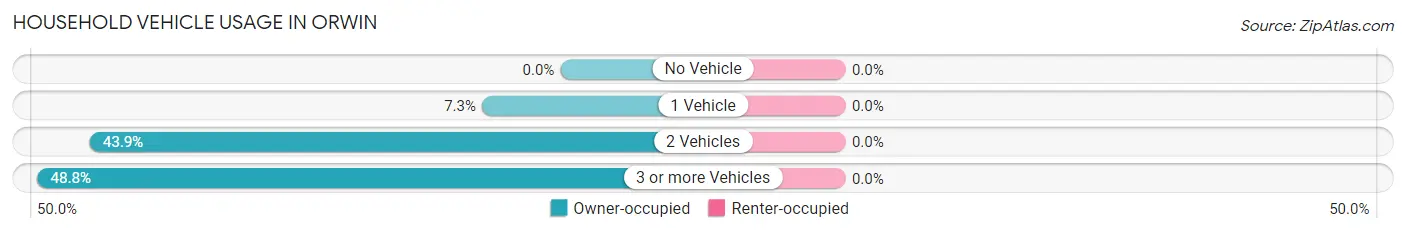
| Vehicles per Household | Owner-occupied | Renter-occupied |
| No Vehicle | 0 (0.0%) | 0 (0.0%) |
| 1 Vehicle | 6 (7.3%) | 0 (0.0%) |
| 2 Vehicles | 36 (43.9%) | 0 (0.0%) |
| 3 or more Vehicles | 40 (48.8%) | 0 (0.0%) |
| Total | 82 (100.0%) | 0 (0.0%) |
Real Estate & Mortgages in Orwin
Real Estate and Mortgage Overview in Orwin
| Characteristic | Without Mortgage | With Mortgage |
| Housing Units | 36 | 46 |
| Median Property Value | $166,700 | $91,400 |
| Median Household Income | $96,250 | $0 |
| Monthly Housing Costs | $610 | $0 |
| Real Estate Taxes | $1,700 | $0 |
Property Value by Mortgage Status in Orwin
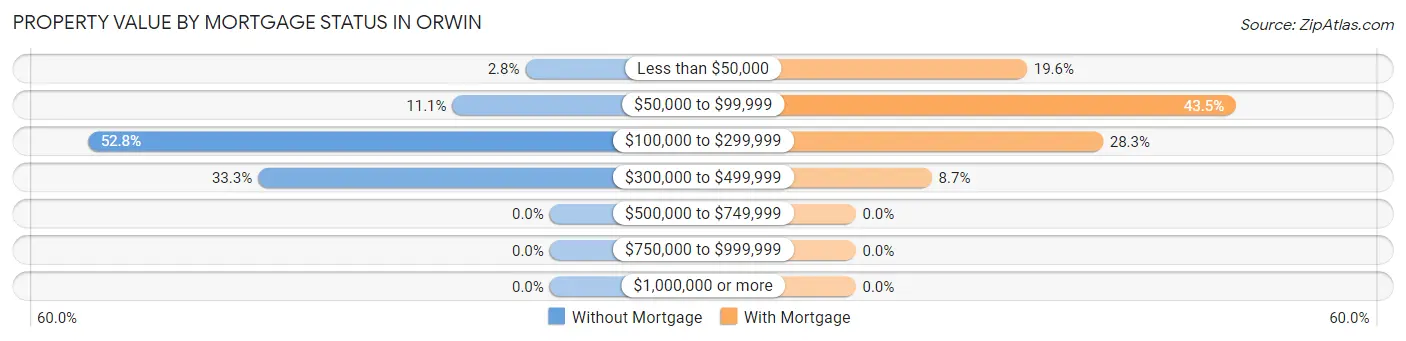
| Property Value | Without Mortgage | With Mortgage |
| Less than $50,000 | 1 (2.8%) | 9 (19.6%) |
| $50,000 to $99,999 | 4 (11.1%) | 20 (43.5%) |
| $100,000 to $299,999 | 19 (52.8%) | 13 (28.3%) |
| $300,000 to $499,999 | 12 (33.3%) | 4 (8.7%) |
| $500,000 to $749,999 | 0 (0.0%) | 0 (0.0%) |
| $750,000 to $999,999 | 0 (0.0%) | 0 (0.0%) |
| $1,000,000 or more | 0 (0.0%) | 0 (0.0%) |
| Total | 36 (100.0%) | 46 (100.0%) |
Household Income by Mortgage Status in Orwin
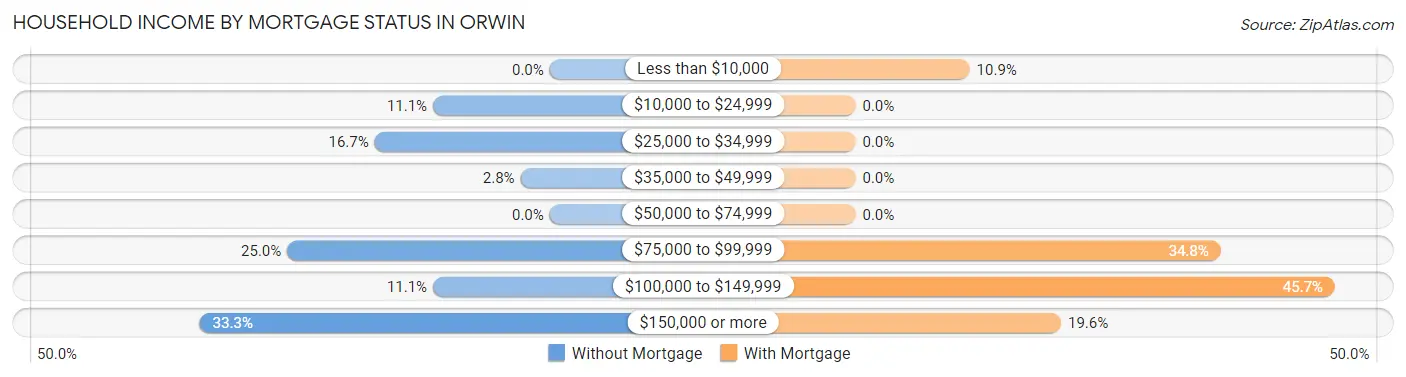
| Household Income | Without Mortgage | With Mortgage |
| Less than $10,000 | 0 (0.0%) | 5 (10.9%) |
| $10,000 to $24,999 | 4 (11.1%) | 0 (0.0%) |
| $25,000 to $34,999 | 6 (16.7%) | 0 (0.0%) |
| $35,000 to $49,999 | 1 (2.8%) | 0 (0.0%) |
| $50,000 to $74,999 | 0 (0.0%) | 0 (0.0%) |
| $75,000 to $99,999 | 9 (25.0%) | 16 (34.8%) |
| $100,000 to $149,999 | 4 (11.1%) | 21 (45.7%) |
| $150,000 or more | 12 (33.3%) | 9 (19.6%) |
| Total | 36 (100.0%) | 46 (100.0%) |
Property Value to Household Income Ratio in Orwin
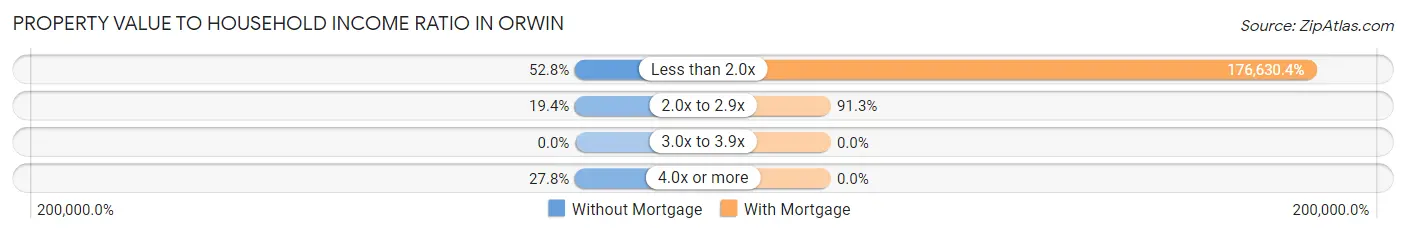
| Value-to-Income Ratio | Without Mortgage | With Mortgage |
| Less than 2.0x | 19 (52.8%) | 81,250 (176,630.4%) |
| 2.0x to 2.9x | 7 (19.4%) | 42 (91.3%) |
| 3.0x to 3.9x | 0 (0.0%) | 0 (0.0%) |
| 4.0x or more | 10 (27.8%) | 0 (0.0%) |
| Total | 36 (100.0%) | 46 (100.0%) |
Real Estate Taxes by Mortgage Status in Orwin
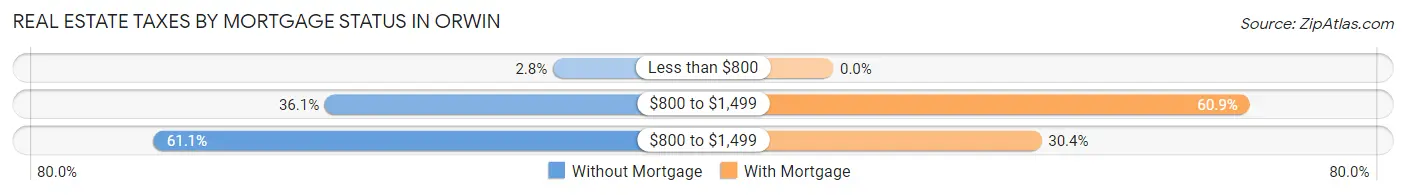
| Property Taxes | Without Mortgage | With Mortgage |
| Less than $800 | 1 (2.8%) | 0 (0.0%) |
| $800 to $1,499 | 13 (36.1%) | 28 (60.9%) |
| $800 to $1,499 | 22 (61.1%) | 14 (30.4%) |
| Total | 36 (100.0%) | 46 (100.0%) |
Health & Disability in Orwin
Health Insurance Coverage by Age in Orwin
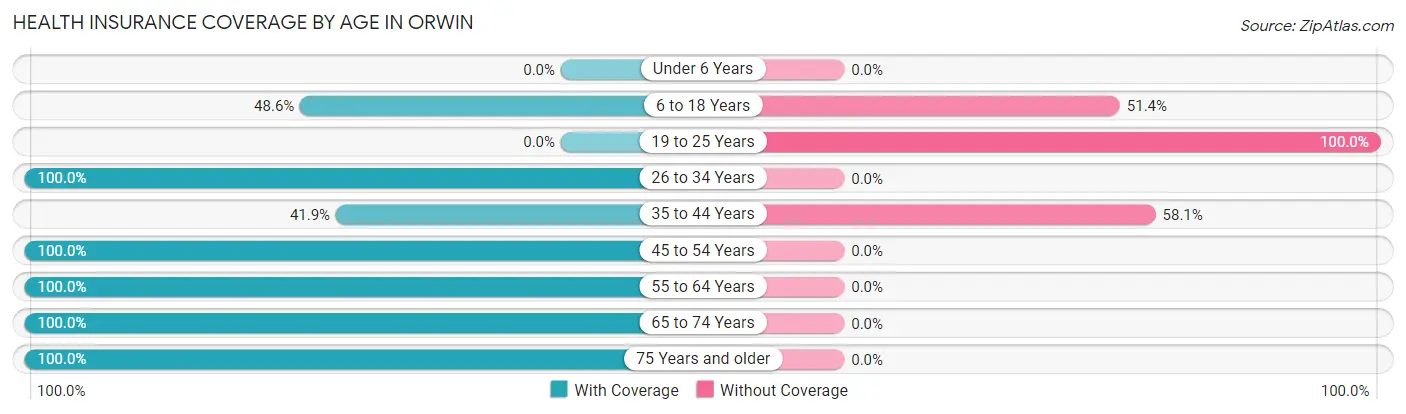
| Age Bracket | With Coverage | Without Coverage |
| Under 6 Years | 0 (0.0%) | 0 (0.0%) |
| 6 to 18 Years | 35 (48.6%) | 37 (51.4%) |
| 19 to 25 Years | 0 (0.0%) | 10 (100.0%) |
| 26 to 34 Years | 18 (100.0%) | 0 (0.0%) |
| 35 to 44 Years | 13 (41.9%) | 18 (58.1%) |
| 45 to 54 Years | 30 (100.0%) | 0 (0.0%) |
| 55 to 64 Years | 29 (100.0%) | 0 (0.0%) |
| 65 to 74 Years | 49 (100.0%) | 0 (0.0%) |
| 75 Years and older | 16 (100.0%) | 0 (0.0%) |
| Total | 190 (74.5%) | 65 (25.5%) |
Health Insurance Coverage by Citizenship Status in Orwin
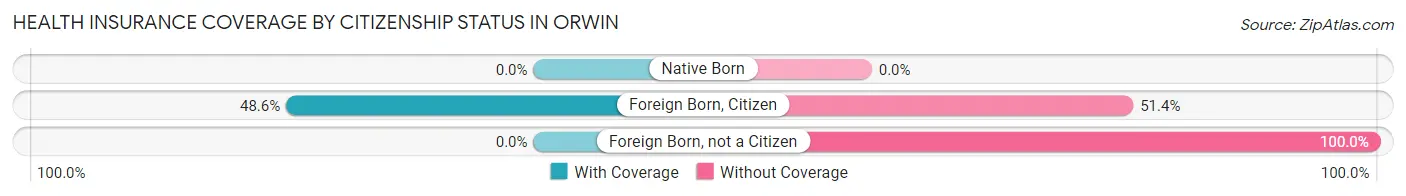
| Citizenship Status | With Coverage | Without Coverage |
| Native Born | 0 (0.0%) | 0 (0.0%) |
| Foreign Born, Citizen | 35 (48.6%) | 37 (51.4%) |
| Foreign Born, not a Citizen | 0 (0.0%) | 10 (100.0%) |
Health Insurance Coverage by Household Income in Orwin
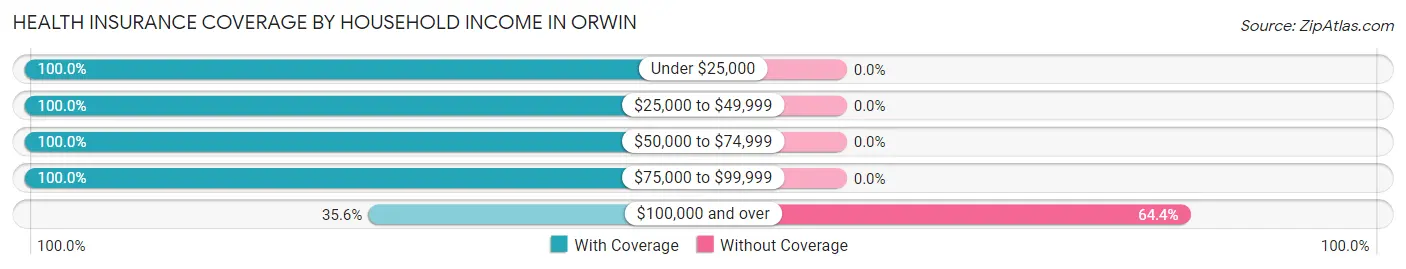
| Household Income | With Coverage | Without Coverage |
| Under $25,000 | 8 (100.0%) | 0 (0.0%) |
| $25,000 to $49,999 | 20 (100.0%) | 0 (0.0%) |
| $50,000 to $74,999 | 44 (100.0%) | 0 (0.0%) |
| $75,000 to $99,999 | 82 (100.0%) | 0 (0.0%) |
| $100,000 and over | 36 (35.6%) | 65 (64.4%) |
Public vs Private Health Insurance Coverage by Age in Orwin
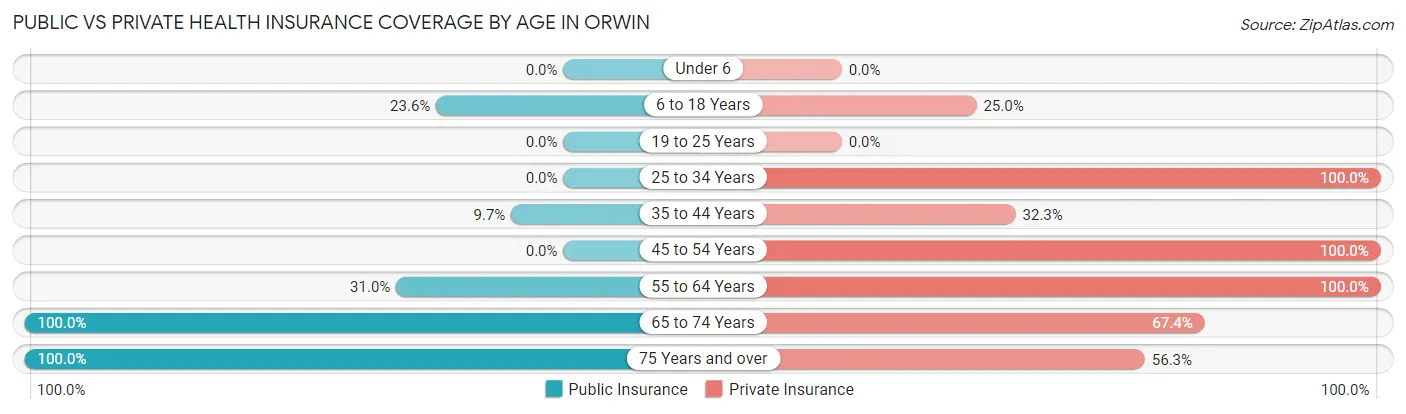
| Age Bracket | Public Insurance | Private Insurance |
| Under 6 | 0 (0.0%) | 0 (0.0%) |
| 6 to 18 Years | 17 (23.6%) | 18 (25.0%) |
| 19 to 25 Years | 0 (0.0%) | 0 (0.0%) |
| 25 to 34 Years | 0 (0.0%) | 18 (100.0%) |
| 35 to 44 Years | 3 (9.7%) | 10 (32.3%) |
| 45 to 54 Years | 0 (0.0%) | 30 (100.0%) |
| 55 to 64 Years | 9 (31.0%) | 29 (100.0%) |
| 65 to 74 Years | 49 (100.0%) | 33 (67.3%) |
| 75 Years and over | 16 (100.0%) | 9 (56.2%) |
| Total | 94 (36.9%) | 147 (57.7%) |
Disability Status by Sex by Age in Orwin
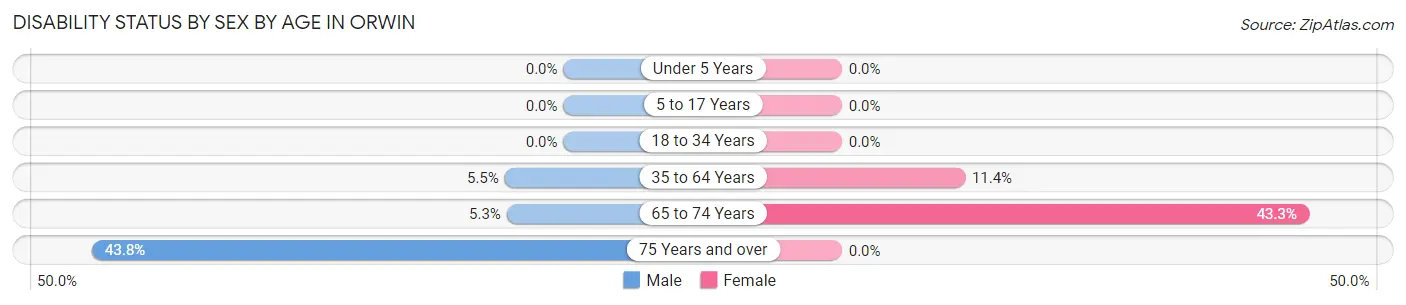
| Age Bracket | Male | Female |
| Under 5 Years | 0 (0.0%) | 0 (0.0%) |
| 5 to 17 Years | 0 (0.0%) | 0 (0.0%) |
| 18 to 34 Years | 0 (0.0%) | 0 (0.0%) |
| 35 to 64 Years | 3 (5.4%) | 4 (11.4%) |
| 65 to 74 Years | 1 (5.3%) | 13 (43.3%) |
| 75 Years and over | 7 (43.8%) | 0 (0.0%) |
Disability Class by Sex by Age in Orwin
Disability Class: Hearing Difficulty
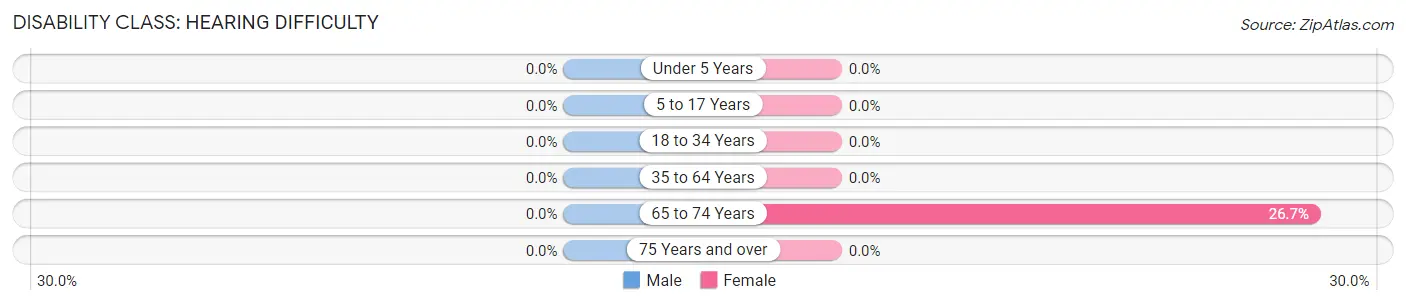
| Age Bracket | Male | Female |
| Under 5 Years | 0 (0.0%) | 0 (0.0%) |
| 5 to 17 Years | 0 (0.0%) | 0 (0.0%) |
| 18 to 34 Years | 0 (0.0%) | 0 (0.0%) |
| 35 to 64 Years | 0 (0.0%) | 0 (0.0%) |
| 65 to 74 Years | 0 (0.0%) | 8 (26.7%) |
| 75 Years and over | 0 (0.0%) | 0 (0.0%) |
Disability Class: Vision Difficulty
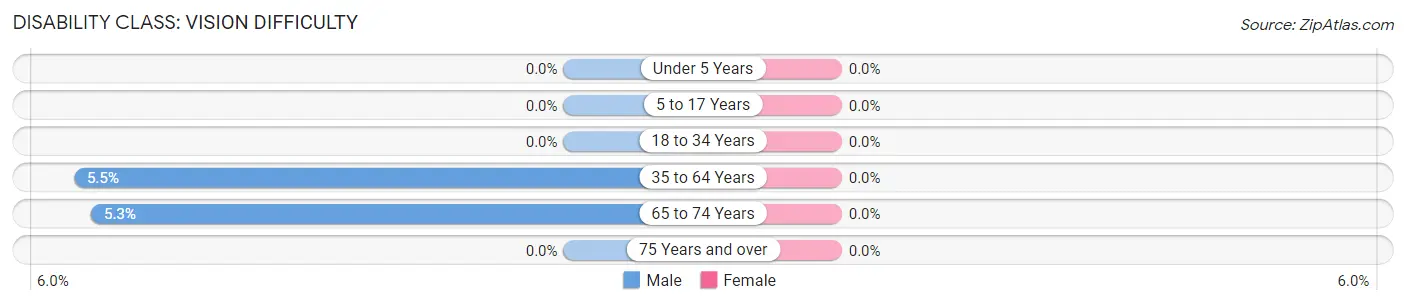
| Age Bracket | Male | Female |
| Under 5 Years | 0 (0.0%) | 0 (0.0%) |
| 5 to 17 Years | 0 (0.0%) | 0 (0.0%) |
| 18 to 34 Years | 0 (0.0%) | 0 (0.0%) |
| 35 to 64 Years | 3 (5.4%) | 0 (0.0%) |
| 65 to 74 Years | 1 (5.3%) | 0 (0.0%) |
| 75 Years and over | 0 (0.0%) | 0 (0.0%) |
Disability Class: Cognitive Difficulty
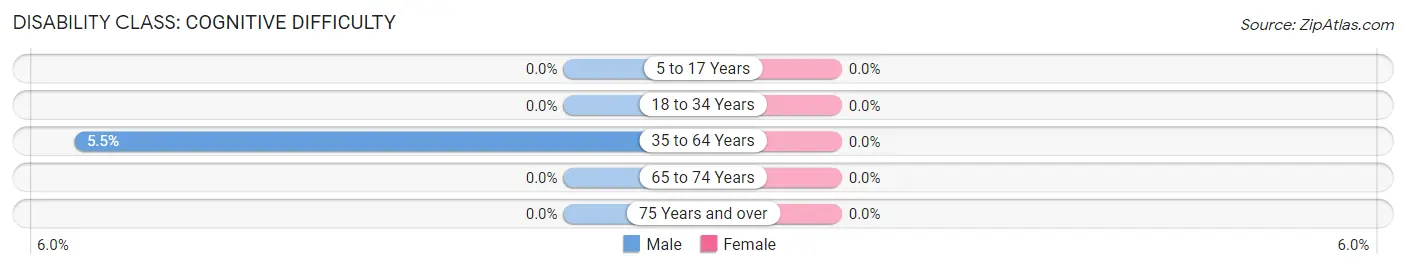
| Age Bracket | Male | Female |
| 5 to 17 Years | 0 (0.0%) | 0 (0.0%) |
| 18 to 34 Years | 0 (0.0%) | 0 (0.0%) |
| 35 to 64 Years | 3 (5.4%) | 0 (0.0%) |
| 65 to 74 Years | 0 (0.0%) | 0 (0.0%) |
| 75 Years and over | 0 (0.0%) | 0 (0.0%) |
Disability Class: Ambulatory Difficulty
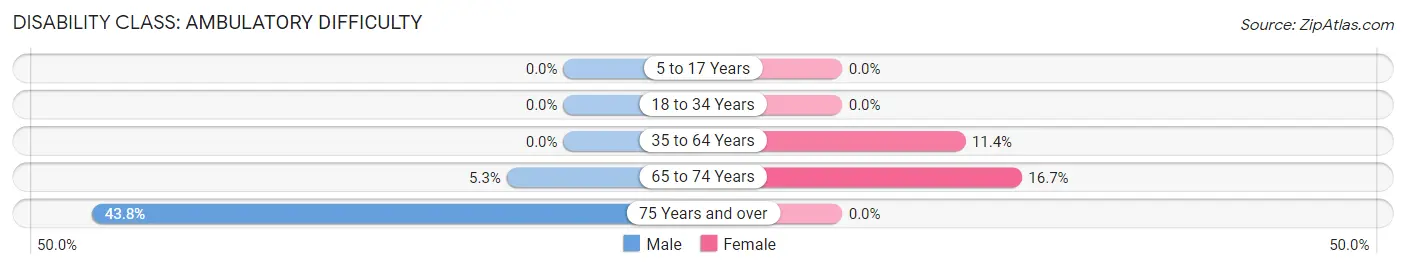
| Age Bracket | Male | Female |
| 5 to 17 Years | 0 (0.0%) | 0 (0.0%) |
| 18 to 34 Years | 0 (0.0%) | 0 (0.0%) |
| 35 to 64 Years | 0 (0.0%) | 4 (11.4%) |
| 65 to 74 Years | 1 (5.3%) | 5 (16.7%) |
| 75 Years and over | 7 (43.8%) | 0 (0.0%) |
Disability Class: Self-Care Difficulty
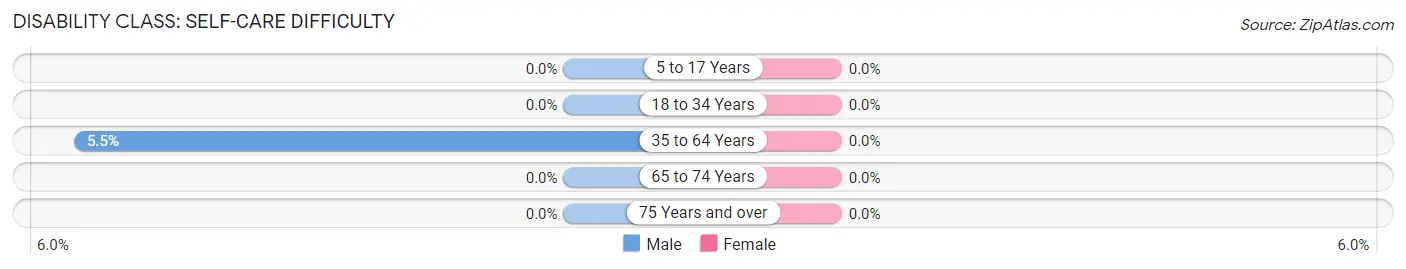
| Age Bracket | Male | Female |
| 5 to 17 Years | 0 (0.0%) | 0 (0.0%) |
| 18 to 34 Years | 0 (0.0%) | 0 (0.0%) |
| 35 to 64 Years | 3 (5.4%) | 0 (0.0%) |
| 65 to 74 Years | 0 (0.0%) | 0 (0.0%) |
| 75 Years and over | 0 (0.0%) | 0 (0.0%) |
Technology Access in Orwin
Computing Device Access in Orwin
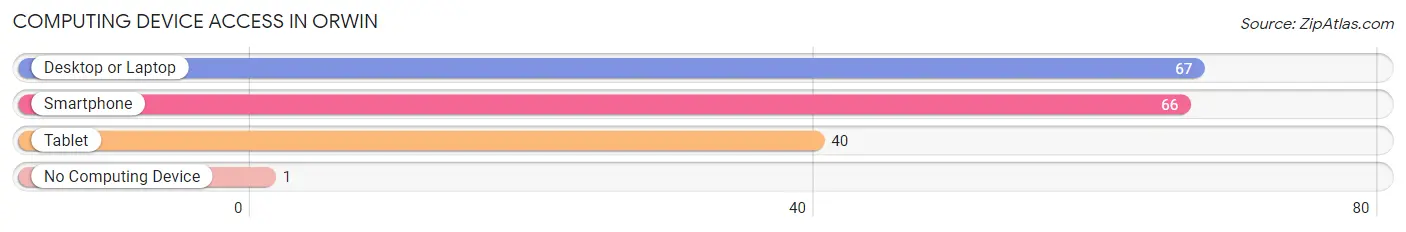
| Device Type | # Households | % Households |
| Desktop or Laptop | 67 | 81.7% |
| Smartphone | 66 | 80.5% |
| Tablet | 40 | 48.8% |
| No Computing Device | 1 | 1.2% |
| Total | 82 | 100.0% |
Internet Access in Orwin
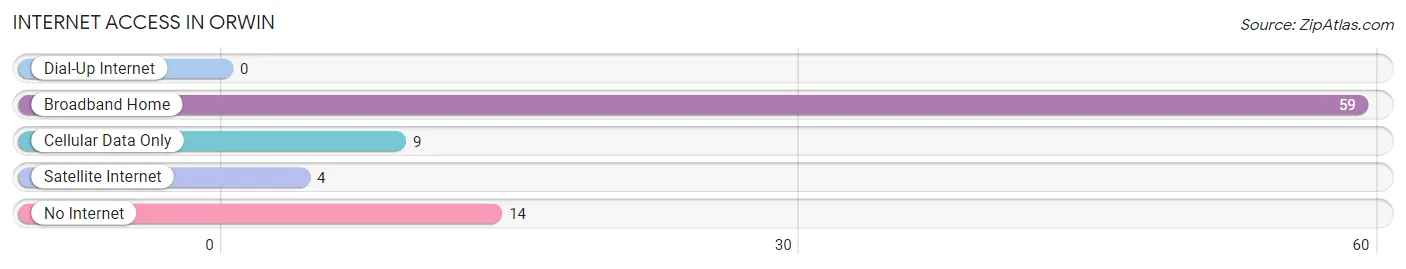
| Internet Type | # Households | % Households |
| Dial-Up Internet | 0 | 0.0% |
| Broadband Home | 59 | 72.0% |
| Cellular Data Only | 9 | 11.0% |
| Satellite Internet | 4 | 4.9% |
| No Internet | 14 | 17.1% |
| Total | 82 | 100.0% |
Orwin Summary
Orwin is a small borough located in Schuylkill County, Pennsylvania. It is situated in the southern part of the county, approximately five miles south of Pottsville. The population of Orwin was 545 at the 2010 census.
History
The area that is now Orwin was first settled in the late 1700s by German immigrants. The town was originally known as “Gross’s Corner” after the first settler, John Gross. In 1845, the town was renamed Orwin after the Orwin family, who had purchased a large tract of land in the area.
The town was officially incorporated in 1876. At the time, the town was primarily an agricultural community, with the main crops being wheat, oats, and potatoes. The town also had several small businesses, including a general store, a blacksmith shop, and a sawmill.
In the late 1800s, the town began to grow and develop. The first school was built in 1887, and the first post office was established in 1889. The town also had a hotel, a bank, and several churches.
Geography
Orwin is located in southern Schuylkill County at 40°41'17" North, 76°14'45" West (40.6879, -76.2458). It is in the Mahanoy Creek watershed and is surrounded by the townships of East Brunswick, West Brunswick, and North Manheim.
According to the United States Census Bureau, the borough has a total area of 0.3 square miles (0.8 km2), all of it land.
Economy
The economy of Orwin is largely based on agriculture. The town is home to several farms, which produce a variety of crops, including wheat, oats, and potatoes. The town also has several small businesses, including a general store, a hardware store, and a restaurant.
Demographics
As of the 2010 census, there were 545 people, 213 households, and 149 families residing in the borough. The population density was 1,817.3 people per square mile (700.3/km2). There were 229 housing units at an average density of 763.3 per square mile (294.3/km2). The racial makeup of the borough was 98.9% White, 0.2% African American, 0.2% Native American, 0.2% Asian, and 0.5% from two or more races.
The median income for a household in the borough was $41,250, and the median income for a family was $50,000. Males had a median income of $37,500 versus $25,000 for females. The per capita income for the borough was $18,945. About 8.3% of families and 10.2% of the population were below the poverty line, including 14.3% of those under age 18 and 8.3% of those age 65 or over.
Common Questions
What is Per Capita Income in Orwin?
Per Capita income in Orwin is $29,915.
What is the Median Family Income in Orwin?
Median Family Income in Orwin is $90,536.
What is the Median Household income in Orwin?
Median Household Income in Orwin is $87,000.
What is Inequality or Gini Index in Orwin?
Inequality or Gini Index in Orwin is 0.27.
What is the Total Population of Orwin?
Total Population of Orwin is 255.
What is the Total Male Population of Orwin?
Total Male Population of Orwin is 155.
What is the Total Female Population of Orwin?
Total Female Population of Orwin is 100.
What is the Ratio of Males per 100 Females in Orwin?
There are 155.00 Males per 100 Females in Orwin.
What is the Ratio of Females per 100 Males in Orwin?
There are 64.52 Females per 100 Males in Orwin.
What is the Median Population Age in Orwin?
Median Population Age in Orwin is 43.8 Years.
What is the Average Family Size in Orwin
Average Family Size in Orwin is 3.2 People.
What is the Average Household Size in Orwin
Average Household Size in Orwin is 3.1 People.
How Large is the Labor Force in Orwin?
There are 121 People in the Labor Forcein in Orwin.
What is the Percentage of People in the Labor Force in Orwin?
57.1% of People are in the Labor Force in Orwin.