East Vandergrift borough, PA Map & Demographics
East Vandergrift borough Overview
$26,528
PER CAPITA INCOME
$56,776
AVG FAMILY INCOME
$53,650
AVG HOUSEHOLD INCOME
30.2%
WAGE / INCOME GAP [ % ]
69.8¢/ $1
WAGE / INCOME GAP [ $ ]
0.34
INEQUALITY / GINI INDEX
701
TOTAL POPULATION
378
MALE POPULATION
323
FEMALE POPULATION
117.03
MALES / 100 FEMALES
85.45
FEMALES / 100 MALES
45.6
MEDIAN AGE
2.8
AVG FAMILY SIZE
2.2
AVG HOUSEHOLD SIZE
399
LABOR FORCE [ PEOPLE ]
68.1%
PERCENT IN LABOR FORCE
3.5%
UNEMPLOYMENT RATE
Income in East Vandergrift borough
Income Overview in East Vandergrift borough
Per Capita Income in East Vandergrift borough is $26,528, while median incomes of families and households are $56,776 and $53,650 respectively.
| Characteristic | Number | Measure |
| Per Capita Income | 701 | $26,528 |
| Median Family Income | 191 | $56,776 |
| Mean Family Income | 191 | $64,735 |
| Median Household Income | 321 | $53,650 |
| Mean Household Income | 321 | $56,520 |
| Income Deficit | 191 | $0 |
| Wage / Income Gap (%) | 701 | 30.16% |
| Wage / Income Gap ($) | 701 | 69.84¢ per $1 |
| Gini / Inequality Index | 701 | 0.34 |
Earnings by Sex in East Vandergrift borough
Average Earnings in East Vandergrift borough are $30,060, $38,036 for men and $26,563 for women, a difference of 30.2%.
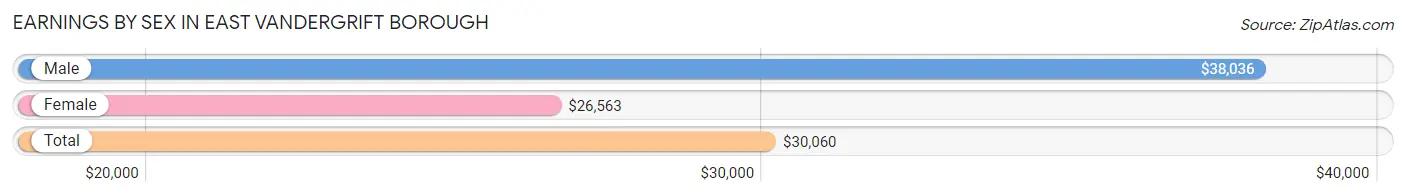
| Sex | Number | Average Earnings |
| Male | 215 (53.6%) | $38,036 |
| Female | 186 (46.4%) | $26,563 |
| Total | 401 (100.0%) | $30,060 |
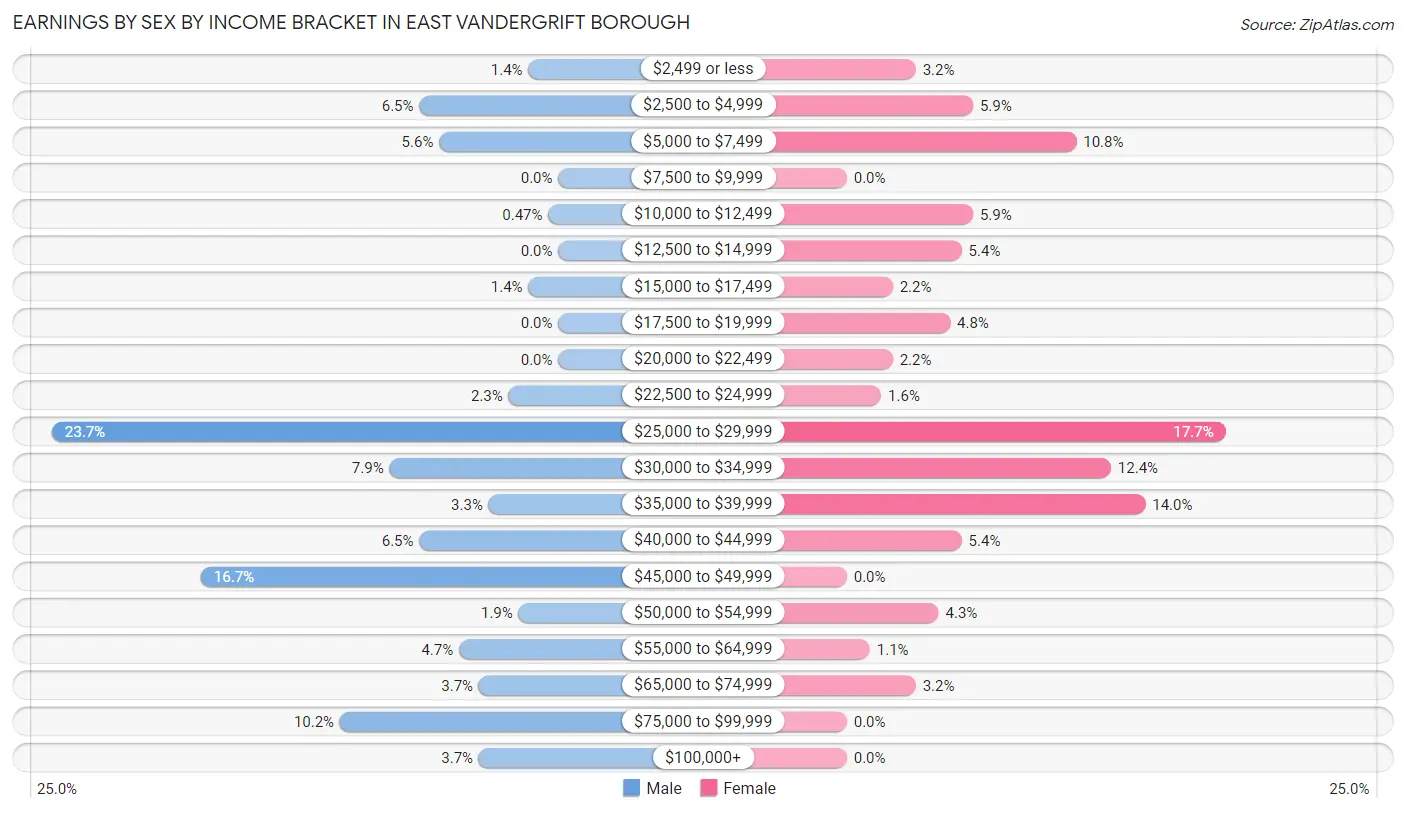
Earnings by Sex by Income Bracket in East Vandergrift borough
The most common earnings brackets in East Vandergrift borough are $25,000 to $29,999 for men (51 | 23.7%) and $25,000 to $29,999 for women (33 | 17.7%).
| Income | Male | Female |
| $2,499 or less | 3 (1.4%) | 6 (3.2%) |
| $2,500 to $4,999 | 14 (6.5%) | 11 (5.9%) |
| $5,000 to $7,499 | 12 (5.6%) | 20 (10.7%) |
| $7,500 to $9,999 | 0 (0.0%) | 0 (0.0%) |
| $10,000 to $12,499 | 1 (0.5%) | 11 (5.9%) |
| $12,500 to $14,999 | 0 (0.0%) | 10 (5.4%) |
| $15,000 to $17,499 | 3 (1.4%) | 4 (2.1%) |
| $17,500 to $19,999 | 0 (0.0%) | 9 (4.8%) |
| $20,000 to $22,499 | 0 (0.0%) | 4 (2.1%) |
| $22,500 to $24,999 | 5 (2.3%) | 3 (1.6%) |
| $25,000 to $29,999 | 51 (23.7%) | 33 (17.7%) |
| $30,000 to $34,999 | 17 (7.9%) | 23 (12.4%) |
| $35,000 to $39,999 | 7 (3.3%) | 26 (14.0%) |
| $40,000 to $44,999 | 14 (6.5%) | 10 (5.4%) |
| $45,000 to $49,999 | 36 (16.7%) | 0 (0.0%) |
| $50,000 to $54,999 | 4 (1.9%) | 8 (4.3%) |
| $55,000 to $64,999 | 10 (4.6%) | 2 (1.1%) |
| $65,000 to $74,999 | 8 (3.7%) | 6 (3.2%) |
| $75,000 to $99,999 | 22 (10.2%) | 0 (0.0%) |
| $100,000+ | 8 (3.7%) | 0 (0.0%) |
| Total | 215 (100.0%) | 186 (100.0%) |
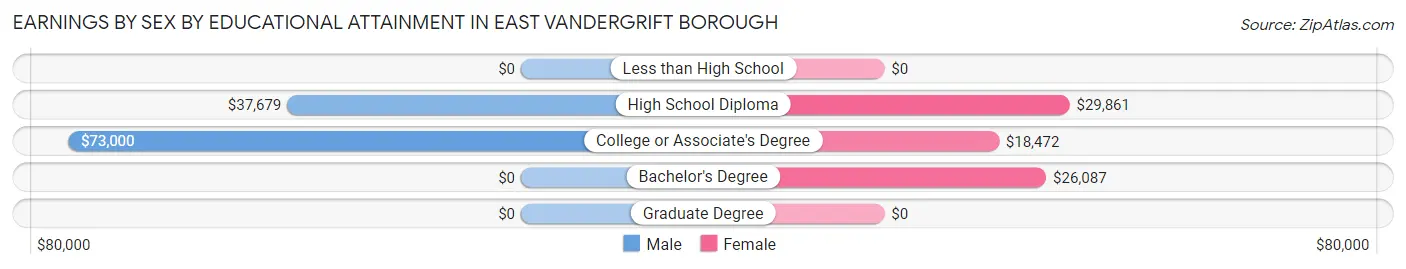
Earnings by Sex by Educational Attainment in East Vandergrift borough
Average earnings in East Vandergrift borough are $43,929 for men and $27,240 for women, a difference of 38.0%. Men with an educational attainment of college or associate's degree enjoy the highest average annual earnings of $73,000, while those with high school diploma education earn the least with $37,679. Women with an educational attainment of high school diploma earn the most with the average annual earnings of $29,861, while those with college or associate's degree education have the smallest earnings of $18,472.
| Educational Attainment | Male Income | Female Income |
| Less than High School | - | - |
| High School Diploma | $37,679 | $29,861 |
| College or Associate's Degree | $73,000 | $18,472 |
| Bachelor's Degree | - | - |
| Graduate Degree | - | - |
| Total | $43,929 | $27,240 |
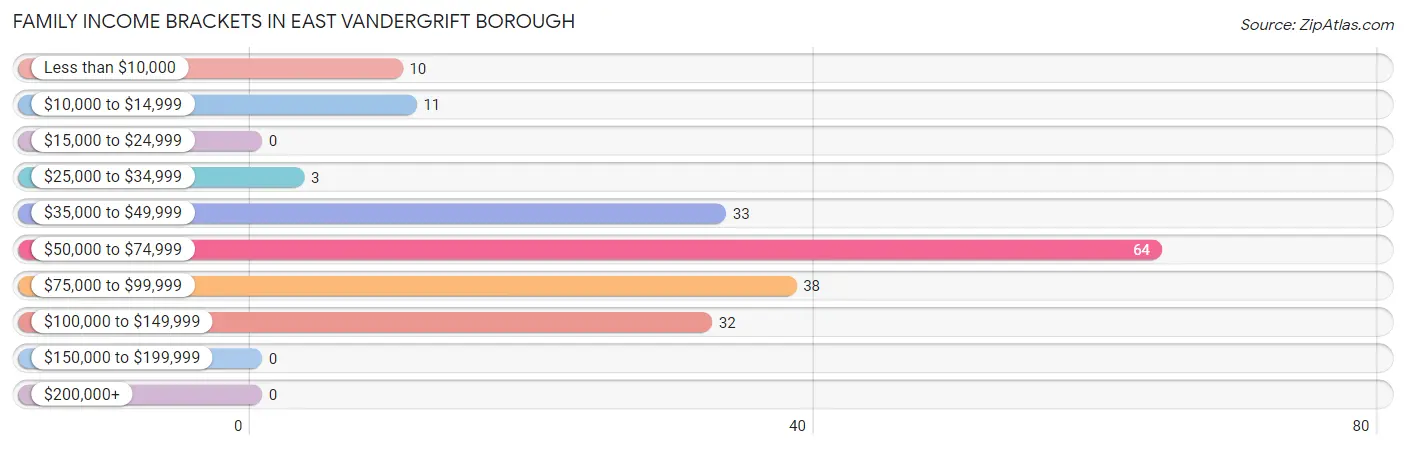
Family Income in East Vandergrift borough
Family Income Brackets in East Vandergrift borough
According to the East Vandergrift borough family income data, there are 64 families falling into the $50,000 to $74,999 income range, which is the most common income bracket and makes up 33.5% of all families.
| Income Bracket | # Families | % Families |
| Less than $10,000 | 10 | 5.2% |
| $10,000 to $14,999 | 11 | 5.8% |
| $15,000 to $24,999 | 0 | 0.0% |
| $25,000 to $34,999 | 3 | 1.6% |
| $35,000 to $49,999 | 33 | 17.3% |
| $50,000 to $74,999 | 64 | 33.5% |
| $75,000 to $99,999 | 38 | 19.9% |
| $100,000 to $149,999 | 32 | 16.8% |
| $150,000 to $199,999 | 0 | 0.0% |
| $200,000+ | 0 | 0.0% |
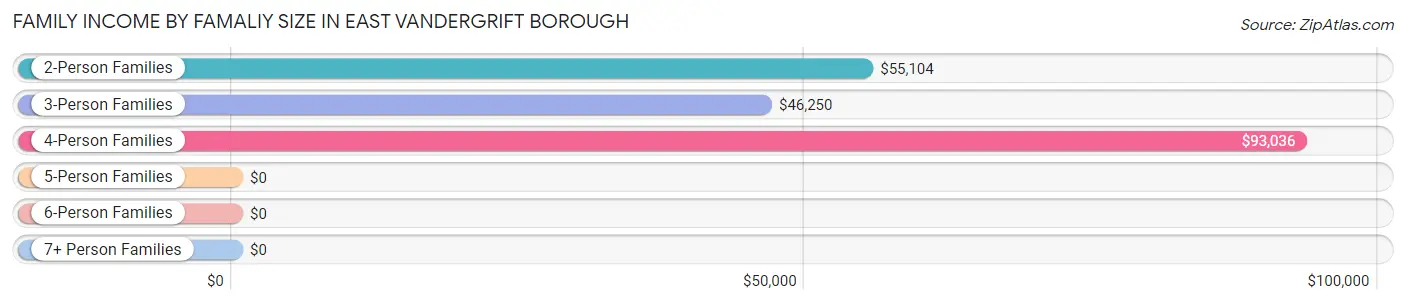
Family Income by Famaliy Size in East Vandergrift borough
4-person families (29 | 15.2%) account for the highest median family income in East Vandergrift borough with $93,036 per family, while 2-person families (129 | 67.5%) have the highest median income of $27,552 per family member.
| Income Bracket | # Families | Median Income |
| 2-Person Families | 129 (67.5%) | $55,104 |
| 3-Person Families | 15 (7.9%) | $46,250 |
| 4-Person Families | 29 (15.2%) | $93,036 |
| 5-Person Families | 11 (5.8%) | $0 |
| 6-Person Families | 0 (0.0%) | $0 |
| 7+ Person Families | 7 (3.7%) | $0 |
| Total | 191 (100.0%) | $56,776 |
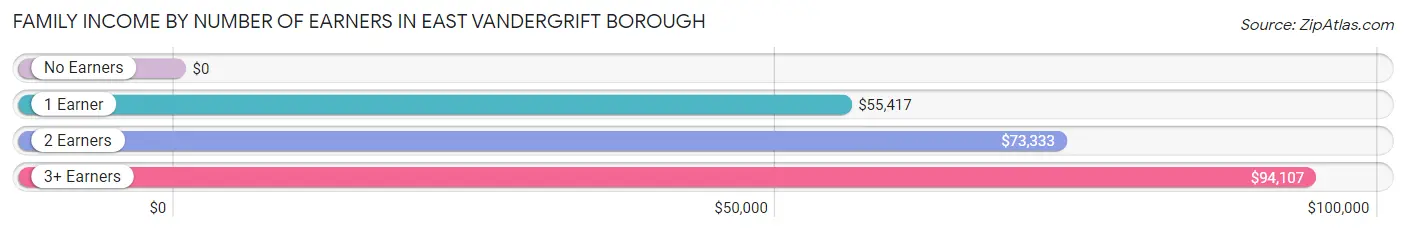
Family Income by Number of Earners in East Vandergrift borough
| Number of Earners | # Families | Median Income |
| No Earners | 28 (14.7%) | $0 |
| 1 Earner | 78 (40.8%) | $55,417 |
| 2 Earners | 62 (32.5%) | $73,333 |
| 3+ Earners | 23 (12.0%) | $94,107 |
| Total | 191 (100.0%) | $56,776 |
Household Income in East Vandergrift borough
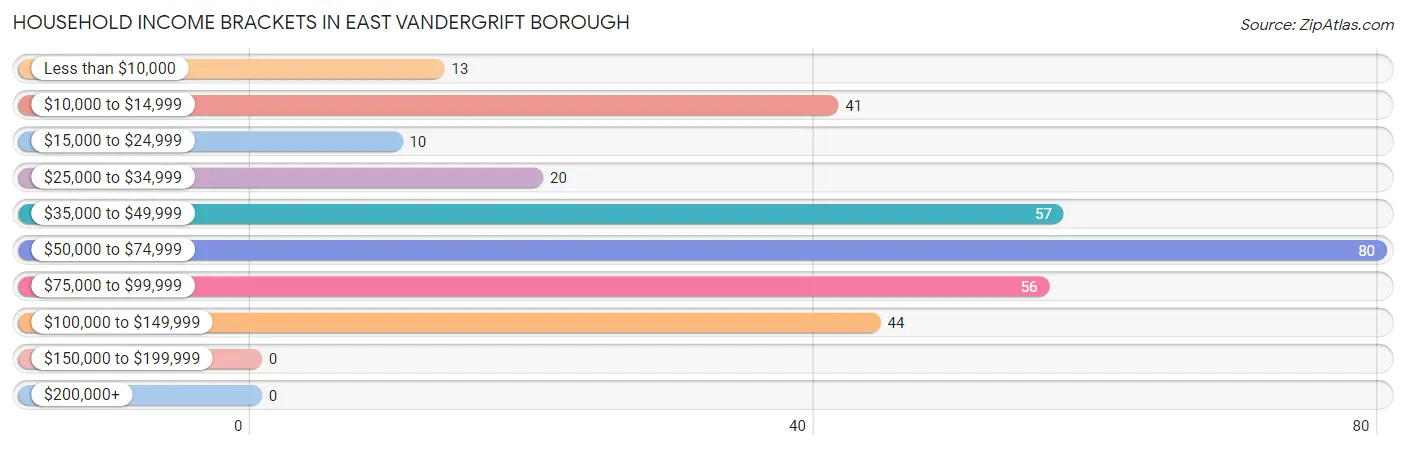
Household Income Brackets in East Vandergrift borough
With 80 households falling in the category, the $50,000 to $74,999 income range is the most frequent in East Vandergrift borough, accounting for 24.9% of all households.
| Income Bracket | # Households | % Households |
| Less than $10,000 | 13 | 4.0% |
| $10,000 to $14,999 | 41 | 12.8% |
| $15,000 to $24,999 | 10 | 3.1% |
| $25,000 to $34,999 | 20 | 6.2% |
| $35,000 to $49,999 | 57 | 17.8% |
| $50,000 to $74,999 | 80 | 24.9% |
| $75,000 to $99,999 | 56 | 17.4% |
| $100,000 to $149,999 | 44 | 13.7% |
| $150,000 to $199,999 | 0 | 0.0% |
| $200,000+ | 0 | 0.0% |
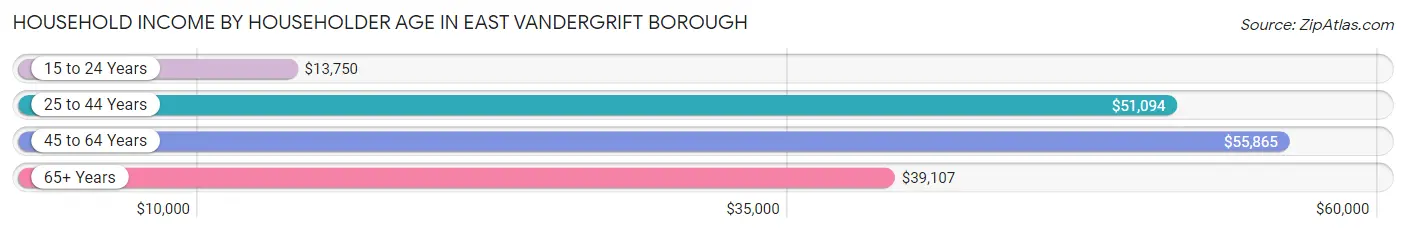
Household Income by Householder Age in East Vandergrift borough
The median household income in East Vandergrift borough is $53,650, with the highest median household income of $55,865 found in the 45 to 64 years age bracket for the primary householder. A total of 173 households (53.9%) fall into this category. Meanwhile, the 15 to 24 years age bracket for the primary householder has the lowest median household income of $13,750, with 12 households (3.7%) in this group.
| Income Bracket | # Households | Median Income |
| 15 to 24 Years | 12 (3.7%) | $13,750 |
| 25 to 44 Years | 81 (25.2%) | $51,094 |
| 45 to 64 Years | 173 (53.9%) | $55,865 |
| 65+ Years | 55 (17.1%) | $39,107 |
| Total | 321 (100.0%) | $53,650 |
Poverty in East Vandergrift borough
Income Below Poverty by Sex and Age in East Vandergrift borough
With 20.4% poverty level for males and 20.4% for females among the residents of East Vandergrift borough, 6 to 11 year old males and under 5 year old females are the most vulnerable to poverty, with 13 males (86.7%) and 17 females (100.0%) in their respective age groups living below the poverty level.
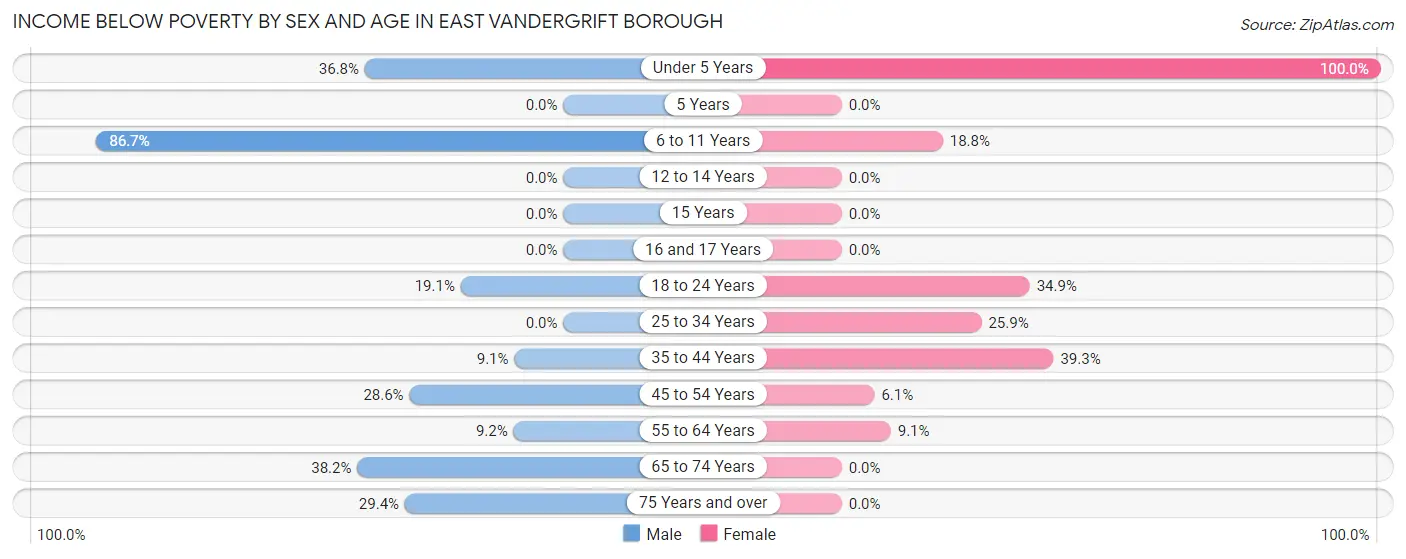
| Age Bracket | Male | Female |
| Under 5 Years | 14 (36.8%) | 17 (100.0%) |
| 5 Years | 0 (0.0%) | 0 (0.0%) |
| 6 to 11 Years | 13 (86.7%) | 6 (18.8%) |
| 12 to 14 Years | 0 (0.0%) | 0 (0.0%) |
| 15 Years | 0 (0.0%) | 0 (0.0%) |
| 16 and 17 Years | 0 (0.0%) | 0 (0.0%) |
| 18 to 24 Years | 8 (19.1%) | 15 (34.9%) |
| 25 to 34 Years | 0 (0.0%) | 7 (25.9%) |
| 35 to 44 Years | 3 (9.1%) | 11 (39.3%) |
| 45 to 54 Years | 10 (28.6%) | 2 (6.1%) |
| 55 to 64 Years | 11 (9.2%) | 8 (9.1%) |
| 65 to 74 Years | 13 (38.2%) | 0 (0.0%) |
| 75 Years and over | 5 (29.4%) | 0 (0.0%) |
| Total | 77 (20.4%) | 66 (20.4%) |
Income Above Poverty by Sex and Age in East Vandergrift borough
According to the poverty statistics in East Vandergrift borough, males aged 16 and 17 years and females aged 5 years are the age groups that are most secure financially, with 100.0% of males and 100.0% of females in these age groups living above the poverty line.
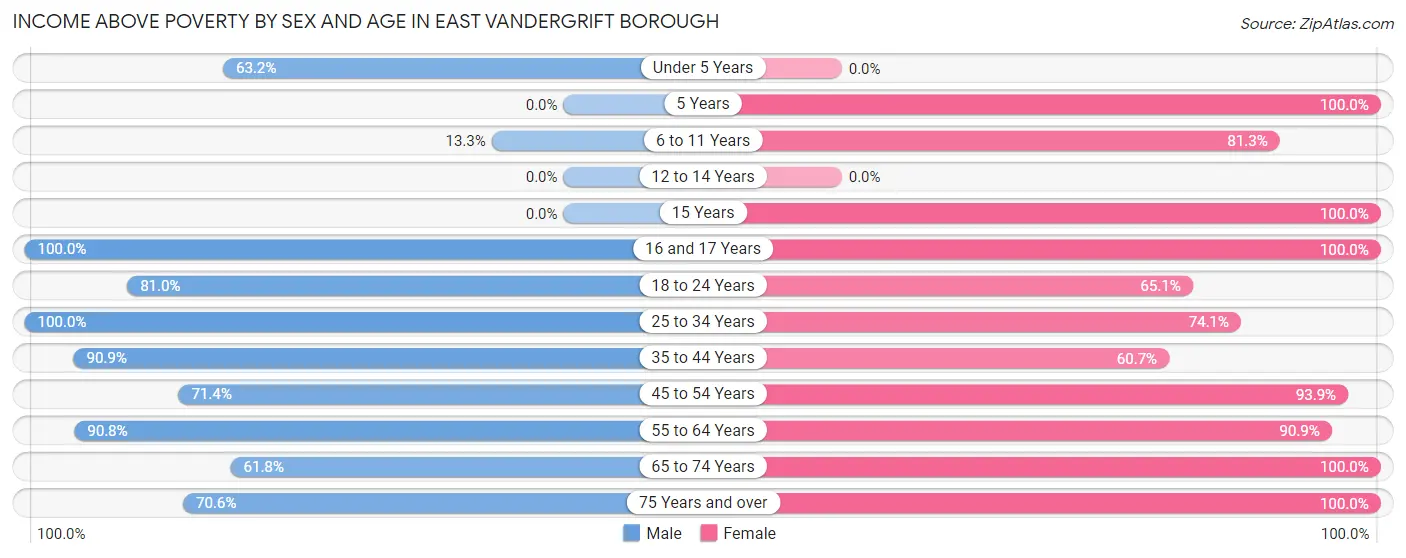
| Age Bracket | Male | Female |
| Under 5 Years | 24 (63.2%) | 0 (0.0%) |
| 5 Years | 0 (0.0%) | 10 (100.0%) |
| 6 to 11 Years | 2 (13.3%) | 26 (81.2%) |
| 12 to 14 Years | 0 (0.0%) | 0 (0.0%) |
| 15 Years | 0 (0.0%) | 3 (100.0%) |
| 16 and 17 Years | 3 (100.0%) | 13 (100.0%) |
| 18 to 24 Years | 34 (80.9%) | 28 (65.1%) |
| 25 to 34 Years | 42 (100.0%) | 20 (74.1%) |
| 35 to 44 Years | 30 (90.9%) | 17 (60.7%) |
| 45 to 54 Years | 25 (71.4%) | 31 (93.9%) |
| 55 to 64 Years | 108 (90.8%) | 80 (90.9%) |
| 65 to 74 Years | 21 (61.8%) | 10 (100.0%) |
| 75 Years and over | 12 (70.6%) | 19 (100.0%) |
| Total | 301 (79.6%) | 257 (79.6%) |
Income Below Poverty Among Married-Couple Families in East Vandergrift borough
The poverty statistics for married-couple families in East Vandergrift borough show that 3.7% or 4 of the total 109 families live below the poverty line. Families with 1 or 2 children have the highest poverty rate of 23.5%, comprising of 4 families. On the other hand, families with no children have the lowest poverty rate of 0.0%, which includes 0 families.
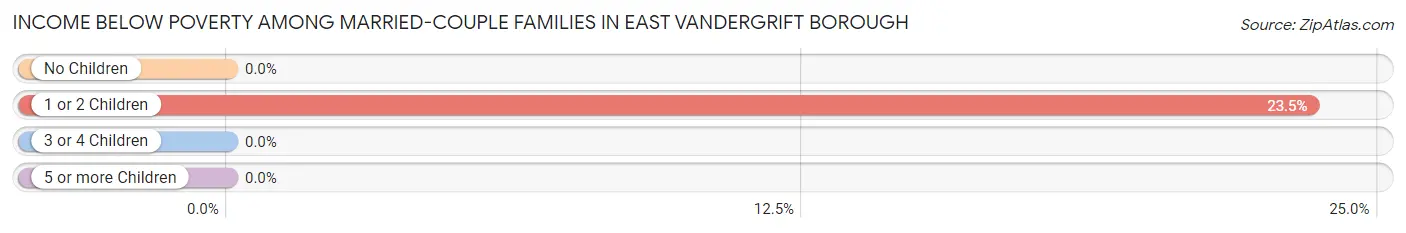
| Children | Above Poverty | Below Poverty |
| No Children | 81 (100.0%) | 0 (0.0%) |
| 1 or 2 Children | 13 (76.5%) | 4 (23.5%) |
| 3 or 4 Children | 11 (100.0%) | 0 (0.0%) |
| 5 or more Children | 0 (0.0%) | 0 (0.0%) |
| Total | 105 (96.3%) | 4 (3.7%) |
Income Below Poverty Among Single-Parent Households in East Vandergrift borough
According to the poverty data in East Vandergrift borough, 13.0% or 6 single-father households and 30.6% or 11 single-mother households are living below the poverty line. Among single-father households, those with 1 or 2 children have the highest poverty rate, with 6 households (20.7%) experiencing poverty. Likewise, among single-mother households, those with 5 or more children have the highest poverty rate, with 7 households (100.0%) falling below the poverty line.
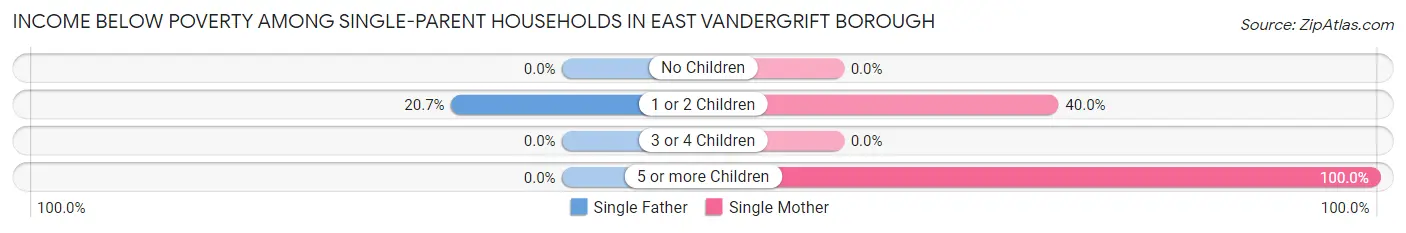
| Children | Single Father | Single Mother |
| No Children | 0 (0.0%) | 0 (0.0%) |
| 1 or 2 Children | 6 (20.7%) | 4 (40.0%) |
| 3 or 4 Children | 0 (0.0%) | 0 (0.0%) |
| 5 or more Children | 0 (0.0%) | 7 (100.0%) |
| Total | 6 (13.0%) | 11 (30.6%) |
Income Below Poverty Among Married-Couple vs Single-Parent Households in East Vandergrift borough
The poverty data for East Vandergrift borough shows that 4 of the married-couple family households (3.7%) and 17 of the single-parent households (20.7%) are living below the poverty level. Within the married-couple family households, those with 1 or 2 children have the highest poverty rate, with 4 households (23.5%) falling below the poverty line. Among the single-parent households, those with 5 or more children have the highest poverty rate, with 7 household (100.0%) living below poverty.
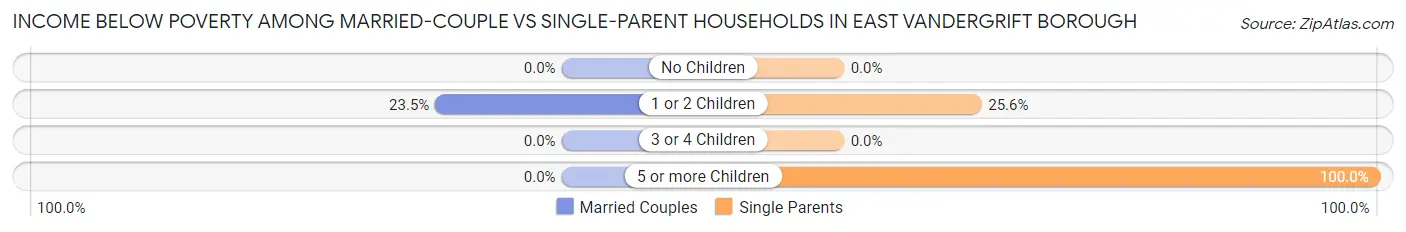
| Children | Married-Couple Families | Single-Parent Households |
| No Children | 0 (0.0%) | 0 (0.0%) |
| 1 or 2 Children | 4 (23.5%) | 10 (25.6%) |
| 3 or 4 Children | 0 (0.0%) | 0 (0.0%) |
| 5 or more Children | 0 (0.0%) | 7 (100.0%) |
| Total | 4 (3.7%) | 17 (20.7%) |
Race in East Vandergrift borough
The most populous races in East Vandergrift borough are White / Caucasian (681 | 97.2%), Asian (18 | 2.6%), and Hispanic or Latino (2 | 0.3%).
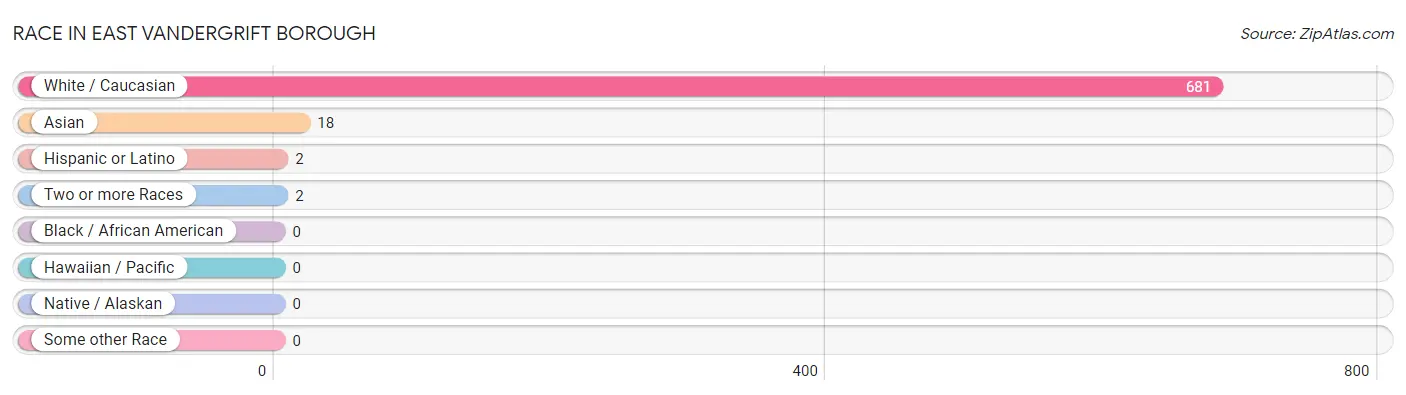
| Race | # Population | % Population |
| Asian | 18 | 2.6% |
| Black / African American | 0 | 0.0% |
| Hawaiian / Pacific | 0 | 0.0% |
| Hispanic or Latino | 2 | 0.3% |
| Native / Alaskan | 0 | 0.0% |
| White / Caucasian | 681 | 97.2% |
| Two or more Races | 2 | 0.3% |
| Some other Race | 0 | 0.0% |
| Total | 701 | 100.0% |
Ancestry in East Vandergrift borough
The most populous ancestries reported in East Vandergrift borough are Irish (111 | 15.8%), German (107 | 15.3%), Italian (102 | 14.5%), Slovak (102 | 14.5%), and Polish (90 | 12.8%), together accounting for 73.0% of all East Vandergrift borough residents.
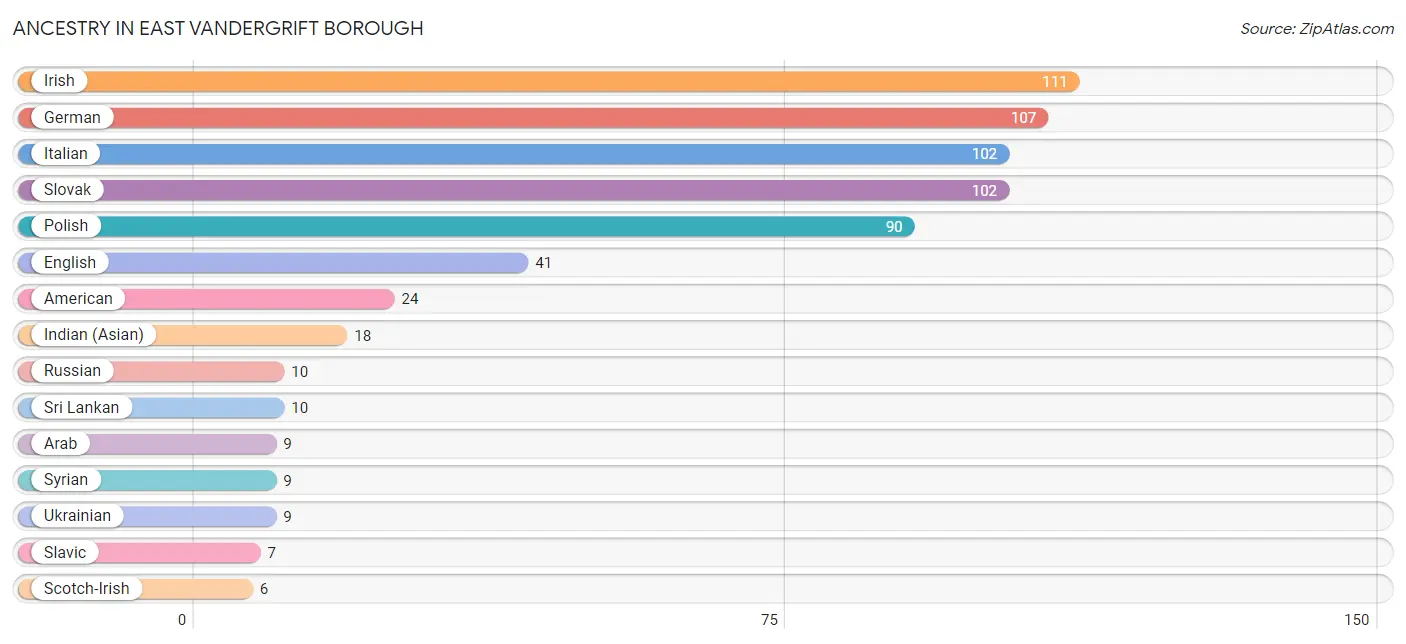
| Ancestry | # Population | % Population |
| American | 24 | 3.4% |
| Arab | 9 | 1.3% |
| Canadian | 2 | 0.3% |
| Czech | 5 | 0.7% |
| Eastern European | 3 | 0.4% |
| English | 41 | 5.9% |
| German | 107 | 15.3% |
| Indian (Asian) | 18 | 2.6% |
| Irish | 111 | 15.8% |
| Italian | 102 | 14.5% |
| Lithuanian | 2 | 0.3% |
| Polish | 90 | 12.8% |
| Puerto Rican | 2 | 0.3% |
| Russian | 10 | 1.4% |
| Scotch-Irish | 6 | 0.9% |
| Slavic | 7 | 1.0% |
| Slovak | 102 | 14.5% |
| Sri Lankan | 10 | 1.4% |
| Syrian | 9 | 1.3% |
| Ukrainian | 9 | 1.3% | View All 20 Rows |
Immigrants in East Vandergrift borough
The most numerous immigrant groups reported in East Vandergrift borough came from Asia (8 | 1.1%), South Eastern Asia (8 | 1.1%), and Vietnam (8 | 1.1%), together accounting for 3.4% of all East Vandergrift borough residents.
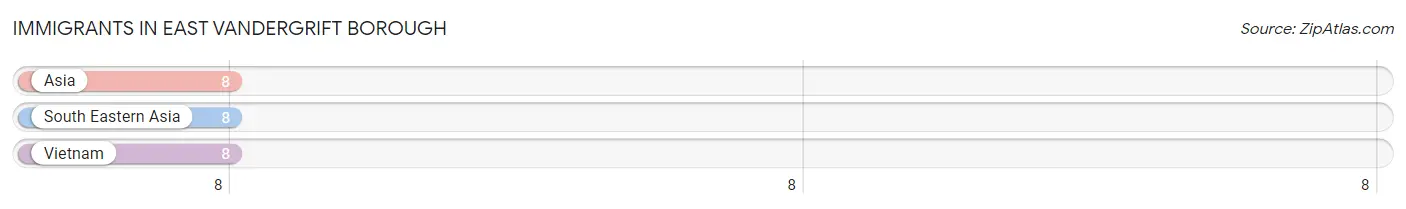
| Immigration Origin | # Population | % Population |
| Asia | 8 | 1.1% |
| South Eastern Asia | 8 | 1.1% |
| Vietnam | 8 | 1.1% | View All 3 Rows |
Sex and Age in East Vandergrift borough
Sex and Age in East Vandergrift borough
The most populous age groups in East Vandergrift borough are 60 to 64 Years (73 | 19.3%) for men and 60 to 64 Years (74 | 22.9%) for women.
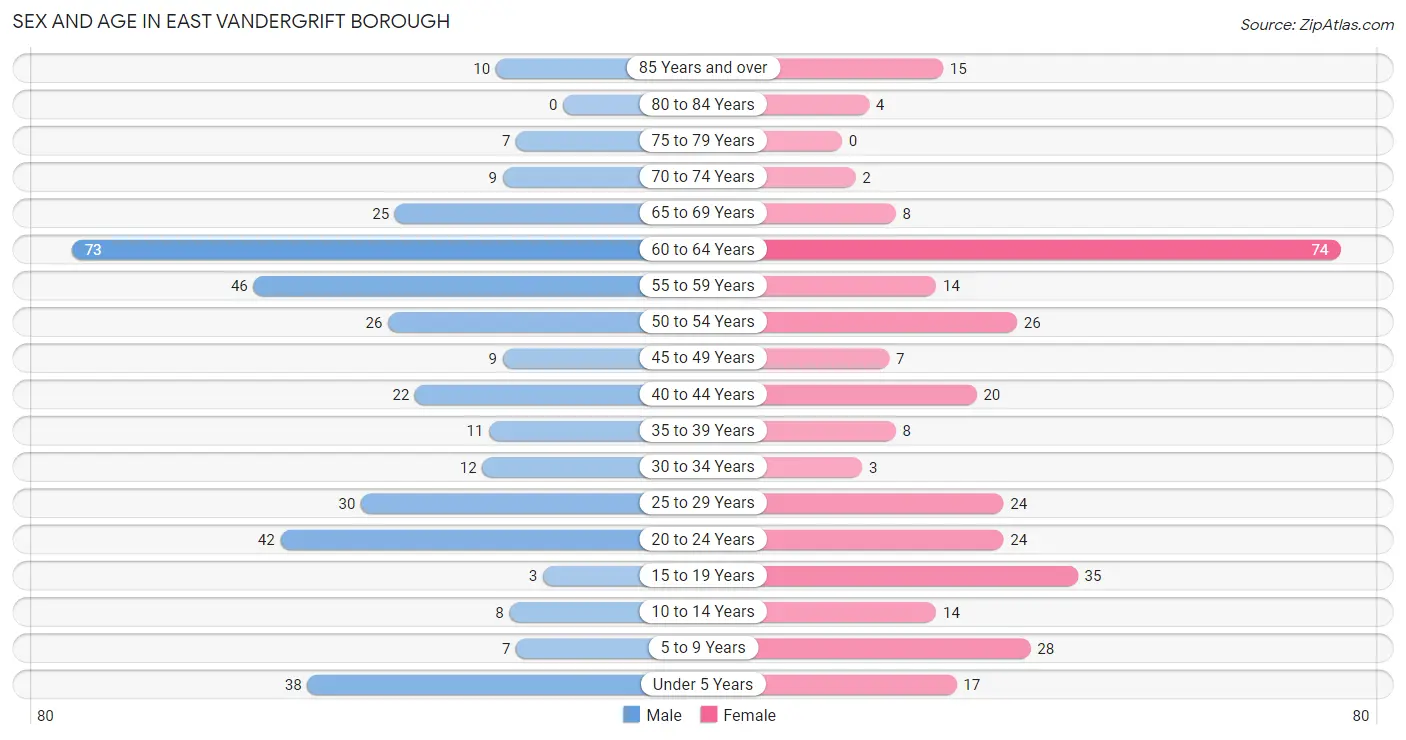
| Age Bracket | Male | Female |
| Under 5 Years | 38 (10.1%) | 17 (5.3%) |
| 5 to 9 Years | 7 (1.8%) | 28 (8.7%) |
| 10 to 14 Years | 8 (2.1%) | 14 (4.3%) |
| 15 to 19 Years | 3 (0.8%) | 35 (10.8%) |
| 20 to 24 Years | 42 (11.1%) | 24 (7.4%) |
| 25 to 29 Years | 30 (7.9%) | 24 (7.4%) |
| 30 to 34 Years | 12 (3.2%) | 3 (0.9%) |
| 35 to 39 Years | 11 (2.9%) | 8 (2.5%) |
| 40 to 44 Years | 22 (5.8%) | 20 (6.2%) |
| 45 to 49 Years | 9 (2.4%) | 7 (2.2%) |
| 50 to 54 Years | 26 (6.9%) | 26 (8.1%) |
| 55 to 59 Years | 46 (12.2%) | 14 (4.3%) |
| 60 to 64 Years | 73 (19.3%) | 74 (22.9%) |
| 65 to 69 Years | 25 (6.6%) | 8 (2.5%) |
| 70 to 74 Years | 9 (2.4%) | 2 (0.6%) |
| 75 to 79 Years | 7 (1.8%) | 0 (0.0%) |
| 80 to 84 Years | 0 (0.0%) | 4 (1.2%) |
| 85 Years and over | 10 (2.6%) | 15 (4.6%) |
| Total | 378 (100.0%) | 323 (100.0%) |
Families and Households in East Vandergrift borough
Median Family Size in East Vandergrift borough
The median family size in East Vandergrift borough is 2.75 persons per family, with married-couple families (109 | 57.1%) accounting for the largest median family size of 2.94 persons per family. On the other hand, single male/father families (46 | 24.1%) represent the smallest median family size with 2.22 persons per family.
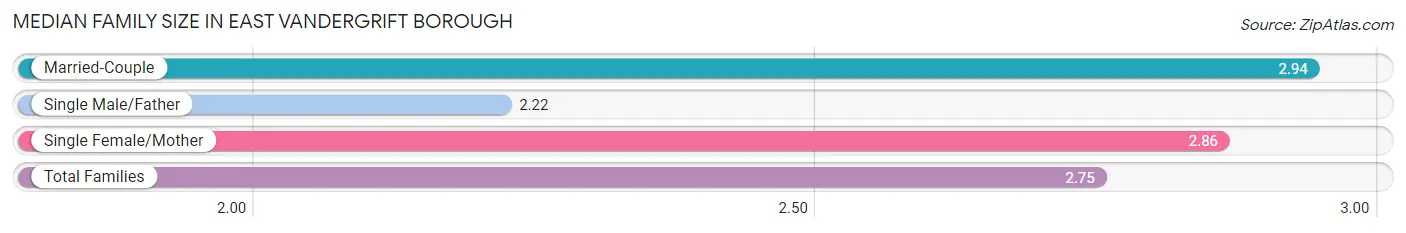
| Family Type | # Families | Family Size |
| Married-Couple | 109 (57.1%) | 2.94 |
| Single Male/Father | 46 (24.1%) | 2.22 |
| Single Female/Mother | 36 (18.9%) | 2.86 |
| Total Families | 191 (100.0%) | 2.75 |
Median Household Size in East Vandergrift borough
The median household size in East Vandergrift borough is 2.18 persons per household, with single female/mother households (36 | 11.2%) accounting for the largest median household size of 2.97 persons per household. non-family households (130 | 40.5%) represent the smallest median household size with 1.18 persons per household.
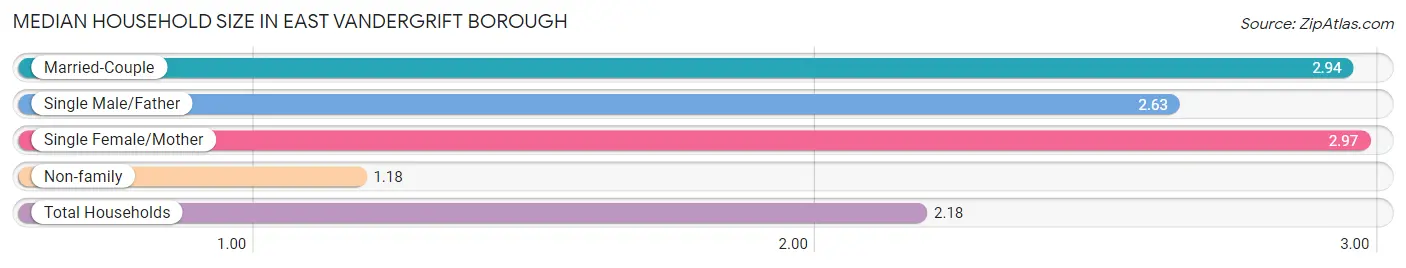
| Household Type | # Households | Household Size |
| Married-Couple | 109 (34.0%) | 2.94 |
| Single Male/Father | 46 (14.3%) | 2.63 |
| Single Female/Mother | 36 (11.2%) | 2.97 |
| Non-family | 130 (40.5%) | 1.18 |
| Total Households | 321 (100.0%) | 2.18 |
Household Size by Marriage Status in East Vandergrift borough
Out of a total of 321 households in East Vandergrift borough, 191 (59.5%) are family households, while 130 (40.5%) are nonfamily households. The most numerous type of family households are 2-person households, comprising 117, and the most common type of nonfamily households are 1-person households, comprising 109.
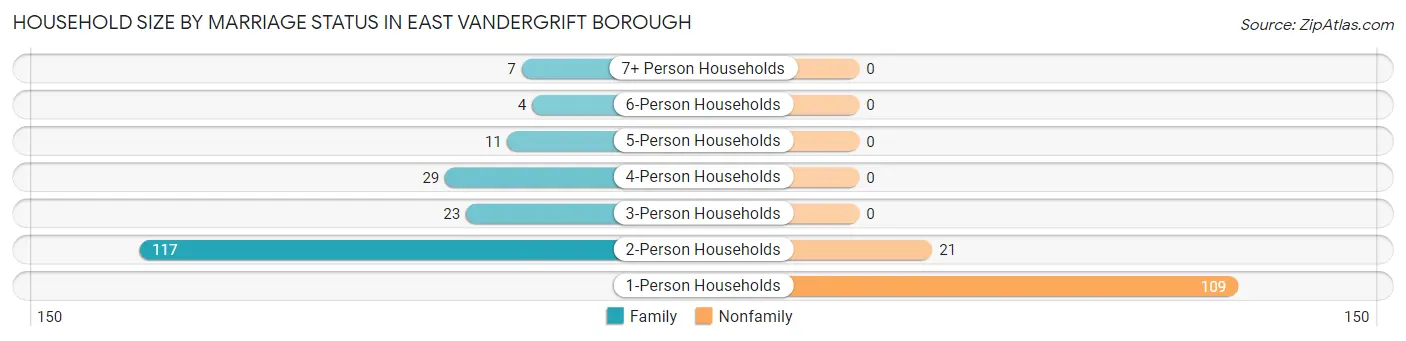
| Household Size | Family Households | Nonfamily Households |
| 1-Person Households | - | 109 (34.0%) |
| 2-Person Households | 117 (36.4%) | 21 (6.5%) |
| 3-Person Households | 23 (7.2%) | 0 (0.0%) |
| 4-Person Households | 29 (9.0%) | 0 (0.0%) |
| 5-Person Households | 11 (3.4%) | 0 (0.0%) |
| 6-Person Households | 4 (1.3%) | 0 (0.0%) |
| 7+ Person Households | 7 (2.2%) | 0 (0.0%) |
| Total | 191 (59.5%) | 130 (40.5%) |
Female Fertility in East Vandergrift borough
Fertility by Age in East Vandergrift borough
Average fertility rate in East Vandergrift borough is 83.0 births per 1,000 women. Women in the age bracket of 20 to 34 years have the highest fertility rate with 137.0 births per 1,000 women. Women in the age bracket of 20 to 34 years acount for 70.0% of all women with births.
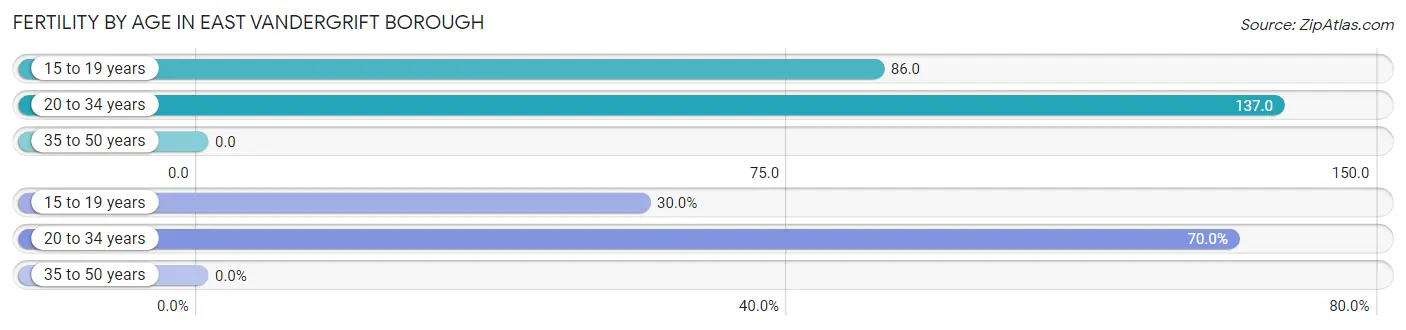
| Age Bracket | Women with Births | Births / 1,000 Women |
| 15 to 19 years | 3 (30.0%) | 86.0 |
| 20 to 34 years | 7 (70.0%) | 137.0 |
| 35 to 50 years | 0 (0.0%) | 0.0 |
| Total | 10 (100.0%) | 83.0 |
Fertility by Age by Marriage Status in East Vandergrift borough
30.0% of women with births (10) in East Vandergrift borough are married. The highest percentage of unmarried women with births falls into 20 to 34 years age bracket with 100.0% of them unmarried at the time of birth, while the lowest percentage of unmarried women with births belong to 15 to 19 years age bracket with 0.0% of them unmarried.
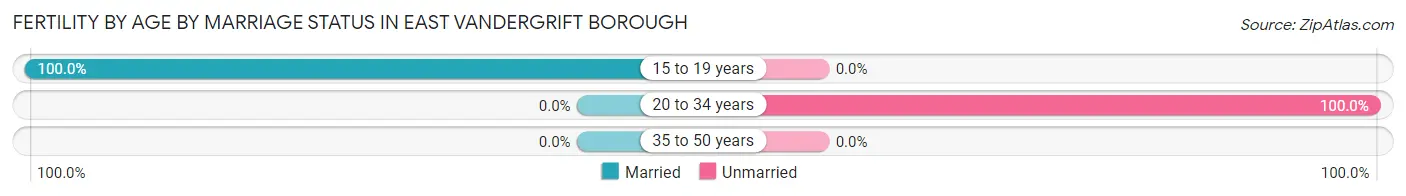
| Age Bracket | Married | Unmarried |
| 15 to 19 years | 3 (100.0%) | 0 (0.0%) |
| 20 to 34 years | 0 (0.0%) | 7 (100.0%) |
| 35 to 50 years | 0 (0.0%) | 0 (0.0%) |
| Total | 3 (30.0%) | 7 (70.0%) |
Fertility by Education in East Vandergrift borough
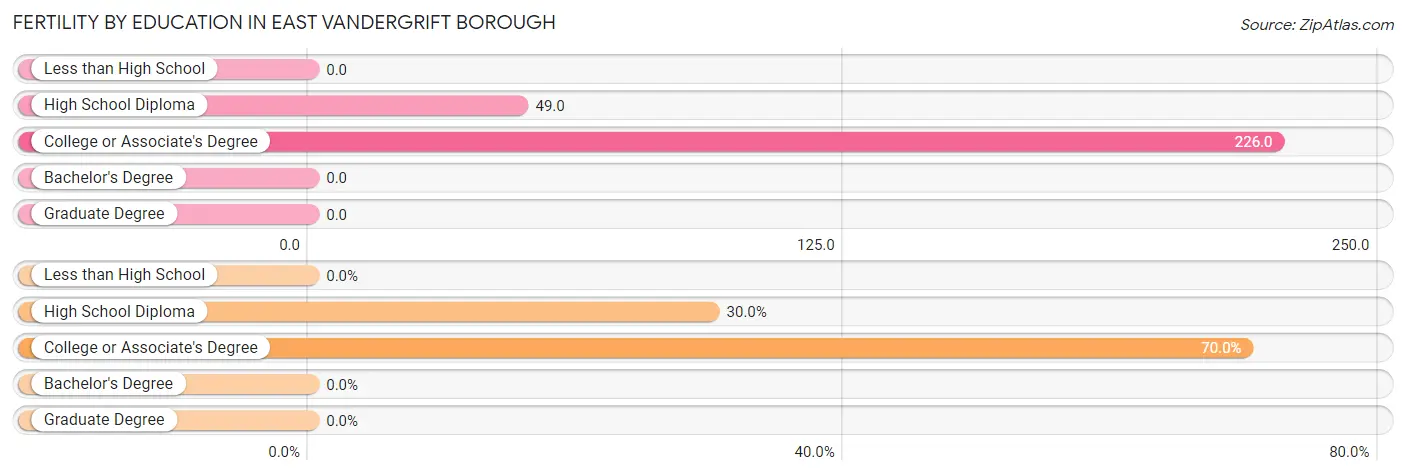
| Educational Attainment | Women with Births | Births / 1,000 Women |
| Less than High School | 0 (0.0%) | 0.0 |
| High School Diploma | 3 (30.0%) | 49.0 |
| College or Associate's Degree | 7 (70.0%) | 226.0 |
| Bachelor's Degree | 0 (0.0%) | 0.0 |
| Graduate Degree | 0 (0.0%) | 0.0 |
| Total | 10 (100.0%) | 83.0 |
Fertility by Education by Marriage Status in East Vandergrift borough
70.0% of women with births in East Vandergrift borough are unmarried. Women with the educational attainment of high school diploma are most likely to be married with 100.0% of them married at childbirth, while women with the educational attainment of college or associate's degree are least likely to be married with 100.0% of them unmarried at childbirth.
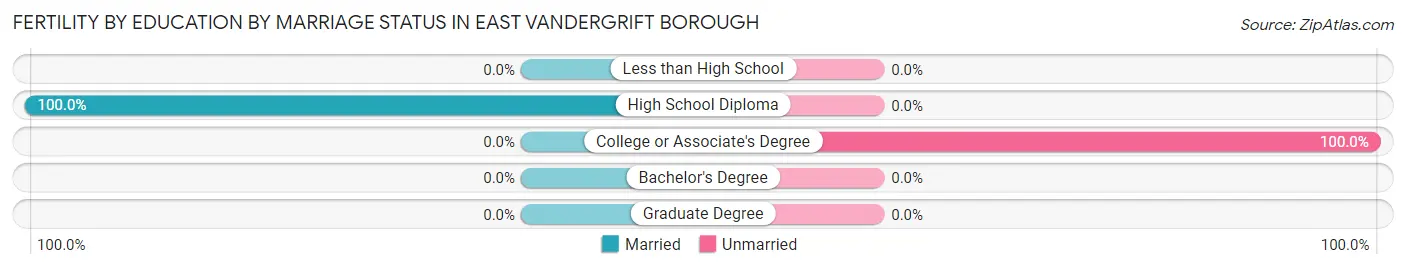
| Educational Attainment | Married | Unmarried |
| Less than High School | 0 (0.0%) | 0 (0.0%) |
| High School Diploma | 3 (100.0%) | 0 (0.0%) |
| College or Associate's Degree | 0 (0.0%) | 7 (100.0%) |
| Bachelor's Degree | 0 (0.0%) | 0 (0.0%) |
| Graduate Degree | 0 (0.0%) | 0 (0.0%) |
| Total | 3 (30.0%) | 7 (70.0%) |
Employment Characteristics in East Vandergrift borough
Employment by Class of Employer in East Vandergrift borough
Among the 378 employed individuals in East Vandergrift borough, private company employees (253 | 66.9%), self-employed (not incorporated) (52 | 13.8%), and not-for-profit organizations (27 | 7.1%) make up the most common classes of employment.
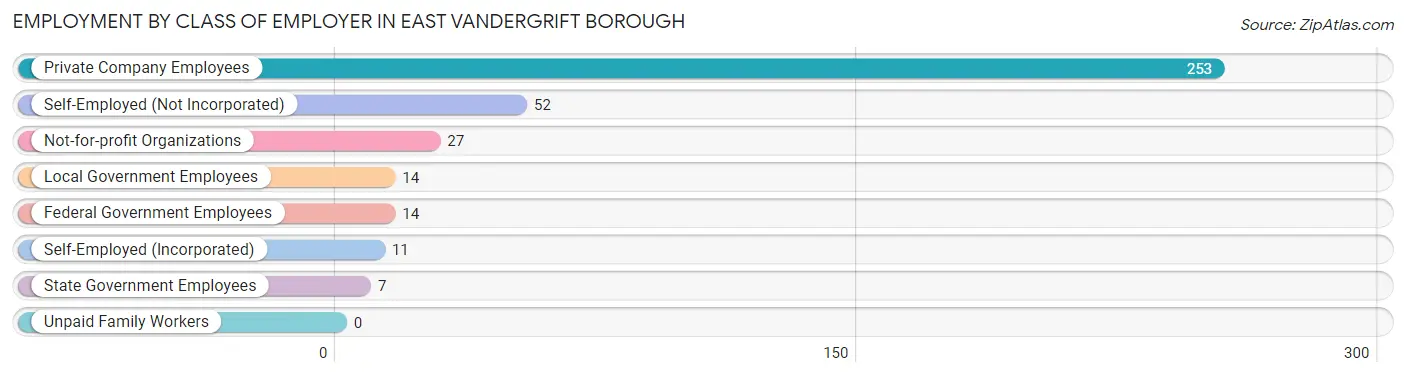
| Employer Class | # Employees | % Employees |
| Private Company Employees | 253 | 66.9% |
| Self-Employed (Incorporated) | 11 | 2.9% |
| Self-Employed (Not Incorporated) | 52 | 13.8% |
| Not-for-profit Organizations | 27 | 7.1% |
| Local Government Employees | 14 | 3.7% |
| State Government Employees | 7 | 1.8% |
| Federal Government Employees | 14 | 3.7% |
| Unpaid Family Workers | 0 | 0.0% |
| Total | 378 | 100.0% |
Employment Status by Age in East Vandergrift borough
According to the labor force statistics for East Vandergrift borough, out of the total population over 16 years of age (586), 68.1% or 399 individuals are in the labor force, with 3.5% or 14 of them unemployed. The age group with the highest labor force participation rate is 30 to 34 years, with 100.0% or 15 individuals in the labor force. Within the labor force, the 16 to 19 years age range has the highest percentage of unemployed individuals, with 21.4% or 3 of them being unemployed.
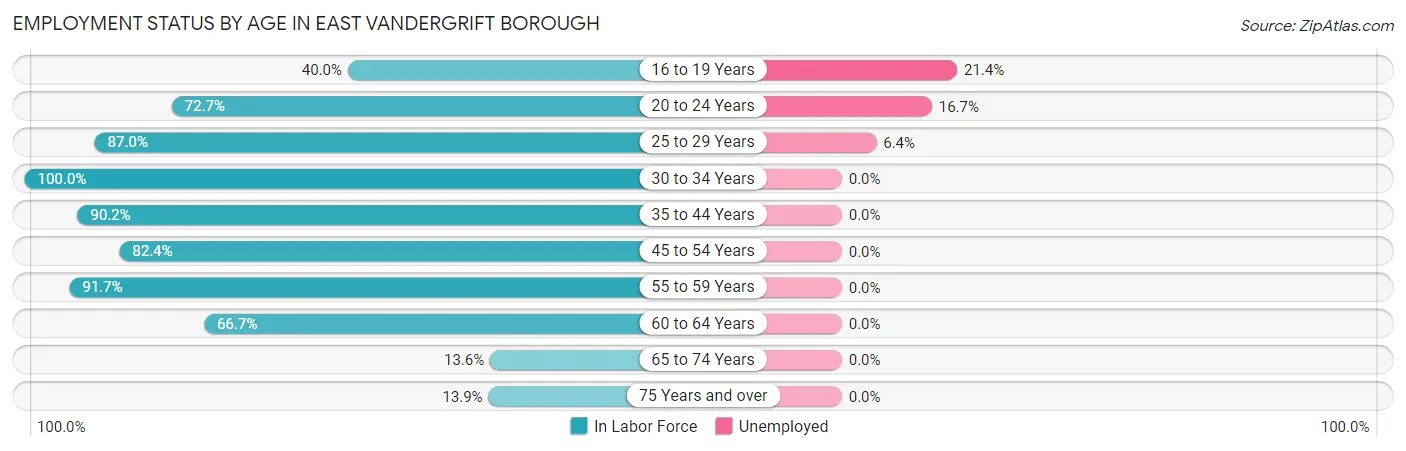
| Age Bracket | In Labor Force | Unemployed |
| 16 to 19 Years | 14 (40.0%) | 3 (21.4%) |
| 20 to 24 Years | 48 (72.7%) | 8 (16.7%) |
| 25 to 29 Years | 47 (87.0%) | 3 (6.4%) |
| 30 to 34 Years | 15 (100.0%) | 0 (0.0%) |
| 35 to 44 Years | 55 (90.2%) | 0 (0.0%) |
| 45 to 54 Years | 56 (82.4%) | 0 (0.0%) |
| 55 to 59 Years | 55 (91.7%) | 0 (0.0%) |
| 60 to 64 Years | 98 (66.7%) | 0 (0.0%) |
| 65 to 74 Years | 6 (13.6%) | 0 (0.0%) |
| 75 Years and over | 5 (13.9%) | 0 (0.0%) |
| Total | 399 (68.1%) | 14 (3.5%) |
Employment Status by Educational Attainment in East Vandergrift borough
According to labor force statistics for East Vandergrift borough, 80.5% of individuals (326) out of the total population between 25 and 64 years of age (405) are in the labor force, with 0.9% or 3 of them being unemployed. The group with the highest labor force participation rate are those with the educational attainment of less than high school, with 91.3% or 21 individuals in the labor force. Within the labor force, individuals with high school diploma education have the highest percentage of unemployment, with 1.5% or 3 of them being unemployed.
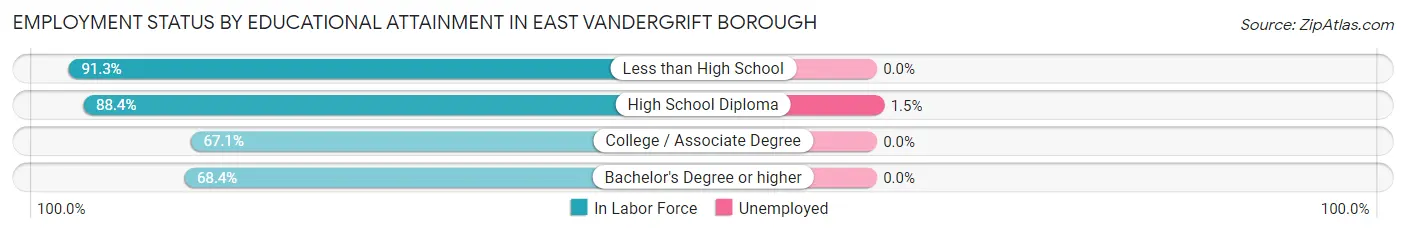
| Educational Attainment | In Labor Force | Unemployed |
| Less than High School | 21 (91.3%) | 0 (0.0%) |
| High School Diploma | 198 (88.4%) | 3 (1.5%) |
| College / Associate Degree | 53 (67.1%) | 0 (0.0%) |
| Bachelor's Degree or higher | 54 (68.4%) | 0 (0.0%) |
| Total | 326 (80.5%) | 4 (0.9%) |
Employment Occupations by Sex in East Vandergrift borough
Management, Business, Science and Arts Occupations
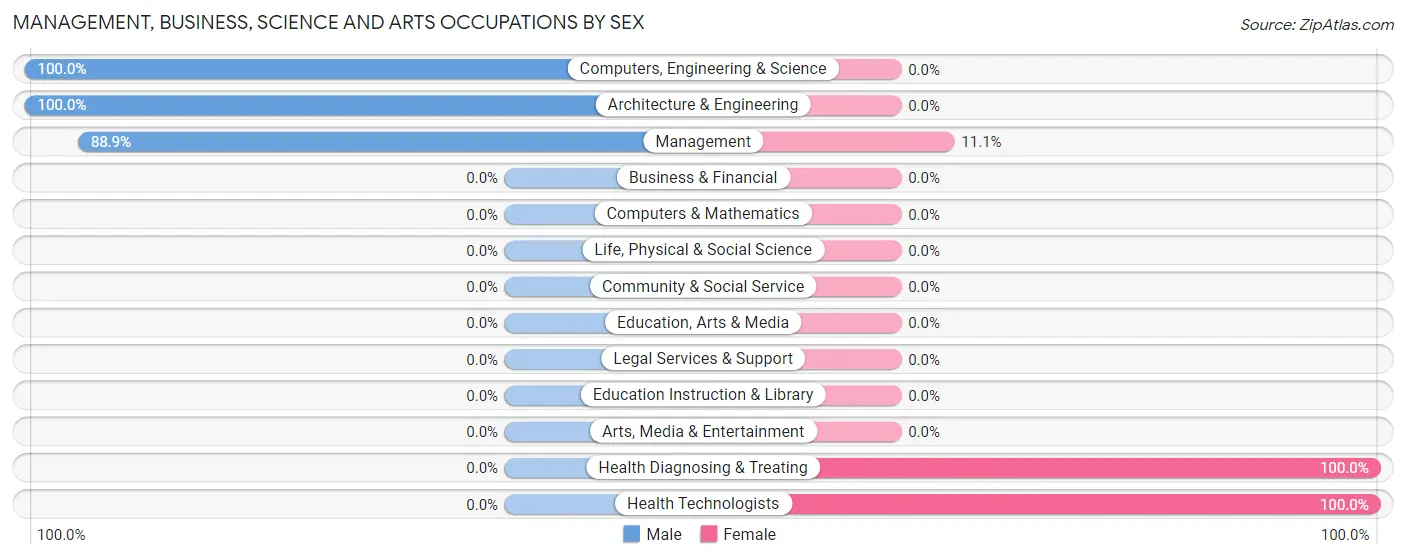
The most common Management, Business, Science and Arts occupations in East Vandergrift borough are Management (18 | 4.7%), Computers, Engineering & Science (9 | 2.3%), Architecture & Engineering (9 | 2.3%), Health Diagnosing & Treating (3 | 0.8%), and Health Technologists (3 | 0.8%).
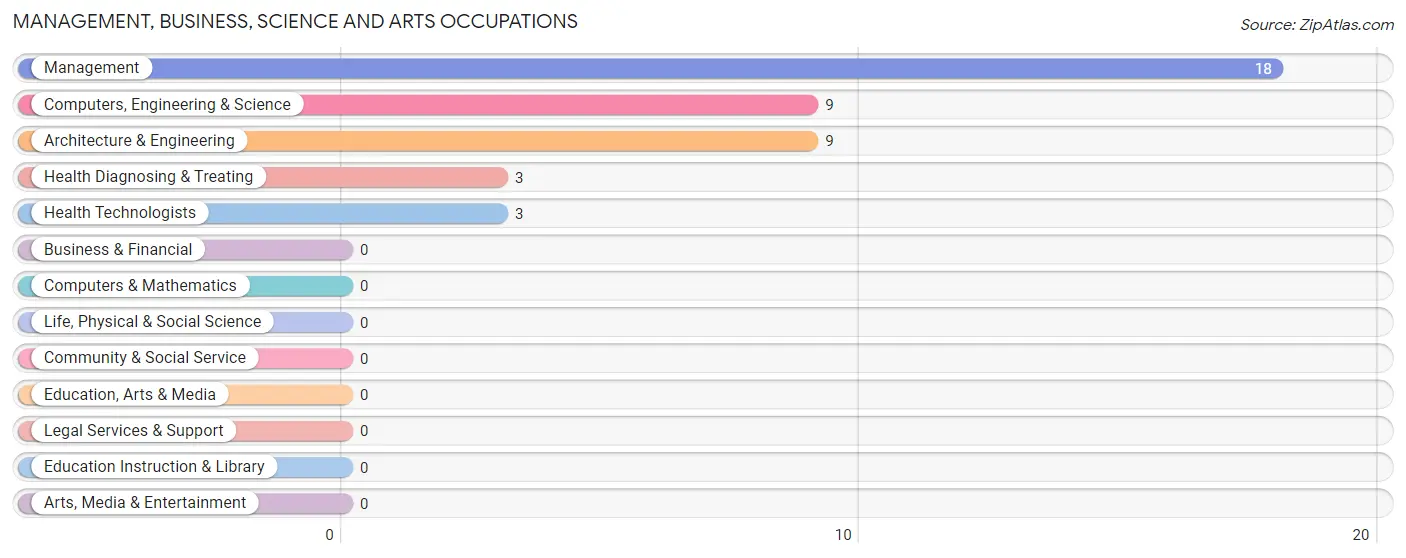
Management, Business, Science and Arts Occupations by Sex
Within the Management, Business, Science and Arts occupations in East Vandergrift borough, the most male-oriented occupations are Computers, Engineering & Science (100.0%), Architecture & Engineering (100.0%), and Management (88.9%), while the most female-oriented occupations are Health Diagnosing & Treating (100.0%), Health Technologists (100.0%), and Management (11.1%).
| Occupation | Male | Female |
| Management | 16 (88.9%) | 2 (11.1%) |
| Business & Financial | 0 (0.0%) | 0 (0.0%) |
| Computers, Engineering & Science | 9 (100.0%) | 0 (0.0%) |
| Computers & Mathematics | 0 (0.0%) | 0 (0.0%) |
| Architecture & Engineering | 9 (100.0%) | 0 (0.0%) |
| Life, Physical & Social Science | 0 (0.0%) | 0 (0.0%) |
| Community & Social Service | 0 (0.0%) | 0 (0.0%) |
| Education, Arts & Media | 0 (0.0%) | 0 (0.0%) |
| Legal Services & Support | 0 (0.0%) | 0 (0.0%) |
| Education Instruction & Library | 0 (0.0%) | 0 (0.0%) |
| Arts, Media & Entertainment | 0 (0.0%) | 0 (0.0%) |
| Health Diagnosing & Treating | 0 (0.0%) | 3 (100.0%) |
| Health Technologists | 0 (0.0%) | 3 (100.0%) |
| Total (Category) | 25 (83.3%) | 5 (16.7%) |
| Total (Overall) | 199 (51.7%) | 186 (48.3%) |
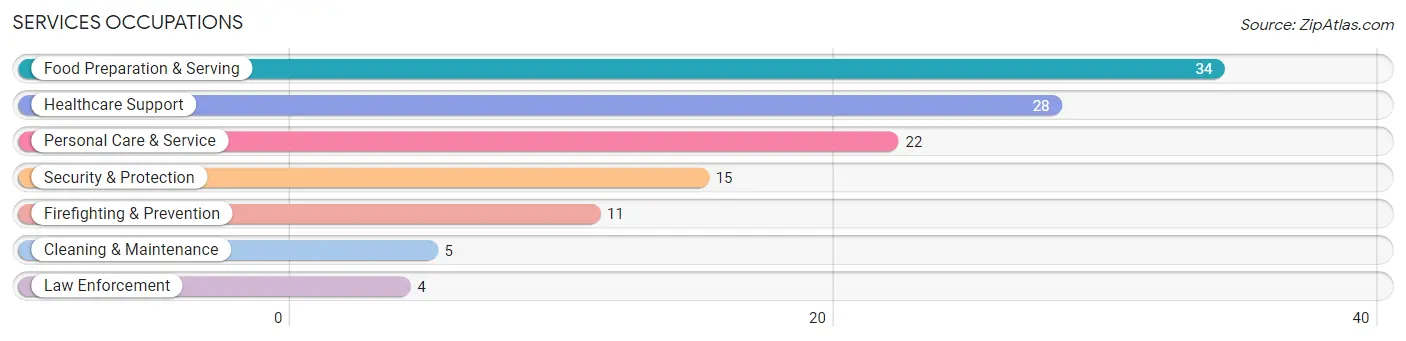
Services Occupations
The most common Services occupations in East Vandergrift borough are Food Preparation & Serving (34 | 8.8%), Healthcare Support (28 | 7.3%), Personal Care & Service (22 | 5.7%), Security & Protection (15 | 3.9%), and Firefighting & Prevention (11 | 2.9%).
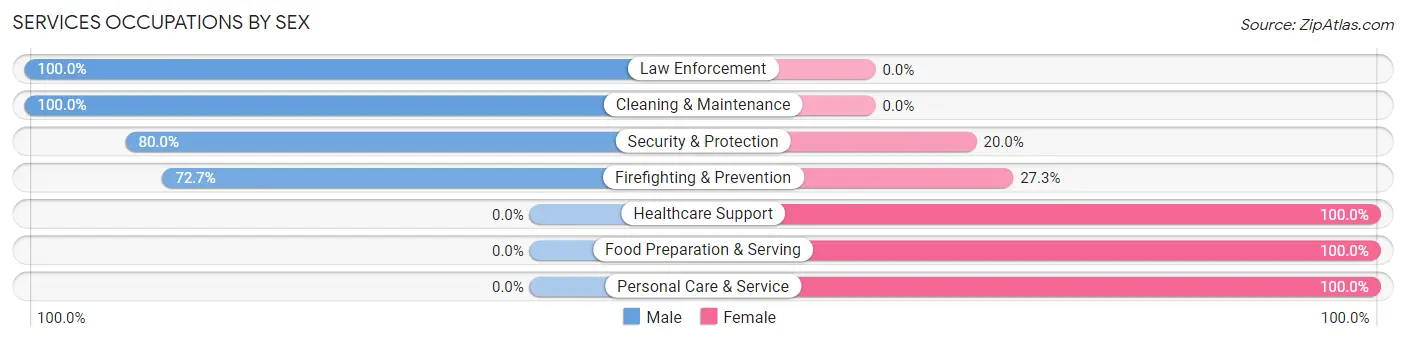
Services Occupations by Sex
Within the Services occupations in East Vandergrift borough, the most male-oriented occupations are Law Enforcement (100.0%), Cleaning & Maintenance (100.0%), and Security & Protection (80.0%), while the most female-oriented occupations are Healthcare Support (100.0%), Food Preparation & Serving (100.0%), and Personal Care & Service (100.0%).
| Occupation | Male | Female |
| Healthcare Support | 0 (0.0%) | 28 (100.0%) |
| Security & Protection | 12 (80.0%) | 3 (20.0%) |
| Firefighting & Prevention | 8 (72.7%) | 3 (27.3%) |
| Law Enforcement | 4 (100.0%) | 0 (0.0%) |
| Food Preparation & Serving | 0 (0.0%) | 34 (100.0%) |
| Cleaning & Maintenance | 5 (100.0%) | 0 (0.0%) |
| Personal Care & Service | 0 (0.0%) | 22 (100.0%) |
| Total (Category) | 17 (16.4%) | 87 (83.7%) |
| Total (Overall) | 199 (51.7%) | 186 (48.3%) |
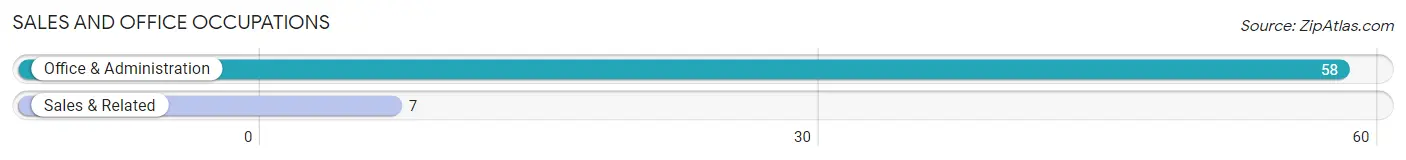
Sales and Office Occupations
The most common Sales and Office occupations in East Vandergrift borough are Office & Administration (58 | 15.1%), and Sales & Related (7 | 1.8%).
Sales and Office Occupations by Sex

| Occupation | Male | Female |
| Sales & Related | 0 (0.0%) | 7 (100.0%) |
| Office & Administration | 18 (31.0%) | 40 (69.0%) |
| Total (Category) | 18 (27.7%) | 47 (72.3%) |
| Total (Overall) | 199 (51.7%) | 186 (48.3%) |
Natural Resources, Construction and Maintenance Occupations
The most common Natural Resources, Construction and Maintenance occupations in East Vandergrift borough are Construction & Extraction (66 | 17.1%), and Installation, Maintenance & Repair (14 | 3.6%).
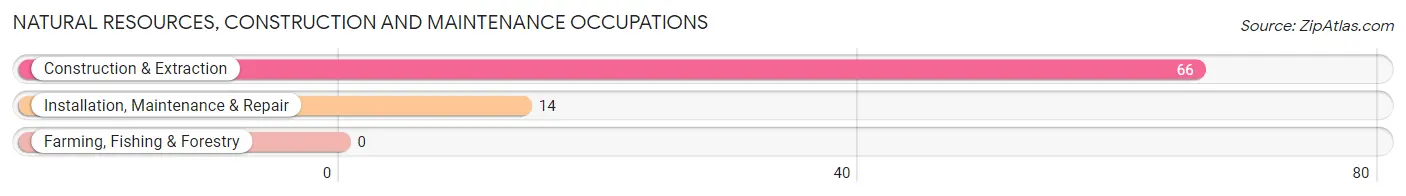
Natural Resources, Construction and Maintenance Occupations by Sex

| Occupation | Male | Female |
| Farming, Fishing & Forestry | 0 (0.0%) | 0 (0.0%) |
| Construction & Extraction | 66 (100.0%) | 0 (0.0%) |
| Installation, Maintenance & Repair | 14 (100.0%) | 0 (0.0%) |
| Total (Category) | 80 (100.0%) | 0 (0.0%) |
| Total (Overall) | 199 (51.7%) | 186 (48.3%) |
Production, Transportation and Moving Occupations
The most common Production, Transportation and Moving occupations in East Vandergrift borough are Production (69 | 17.9%), Material Moving (31 | 8.1%), and Transportation (6 | 1.6%).
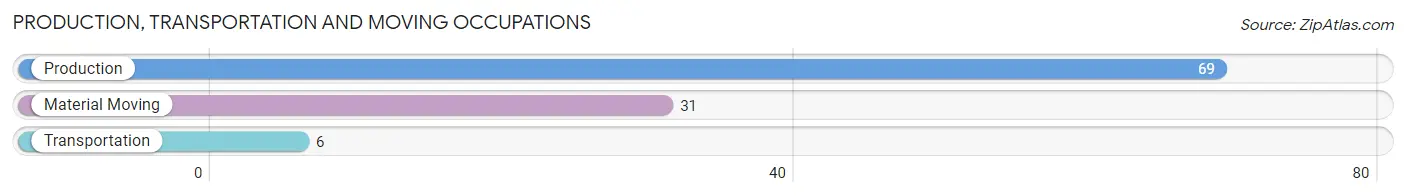
Production, Transportation and Moving Occupations by Sex
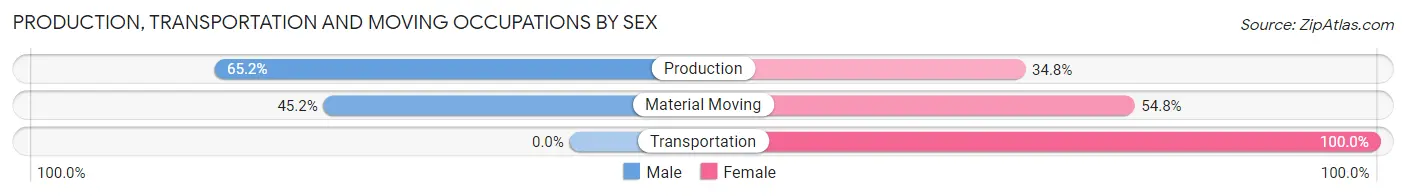
| Occupation | Male | Female |
| Production | 45 (65.2%) | 24 (34.8%) |
| Transportation | 0 (0.0%) | 6 (100.0%) |
| Material Moving | 14 (45.2%) | 17 (54.8%) |
| Total (Category) | 59 (55.7%) | 47 (44.3%) |
| Total (Overall) | 199 (51.7%) | 186 (48.3%) |
Employment Industries by Sex in East Vandergrift borough
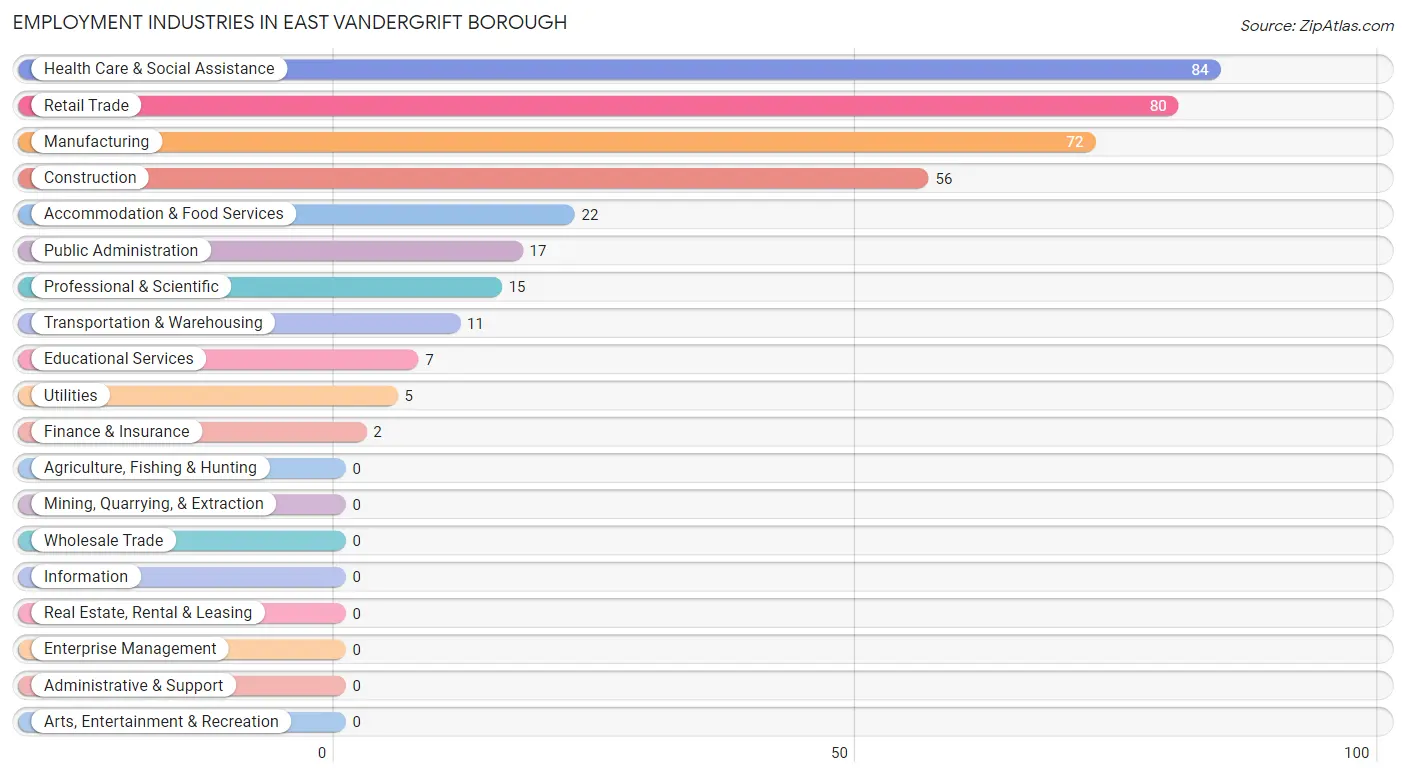
Employment Industries in East Vandergrift borough
The major employment industries in East Vandergrift borough include Health Care & Social Assistance (84 | 21.8%), Retail Trade (80 | 20.8%), Manufacturing (72 | 18.7%), Construction (56 | 14.5%), and Accommodation & Food Services (22 | 5.7%).
Employment Industries by Sex in East Vandergrift borough
The East Vandergrift borough industries that see more men than women are Construction (100.0%), Transportation & Warehousing (100.0%), and Utilities (100.0%), whereas the industries that tend to have a higher number of women are Finance & Insurance (100.0%), Educational Services (100.0%), and Accommodation & Food Services (100.0%).
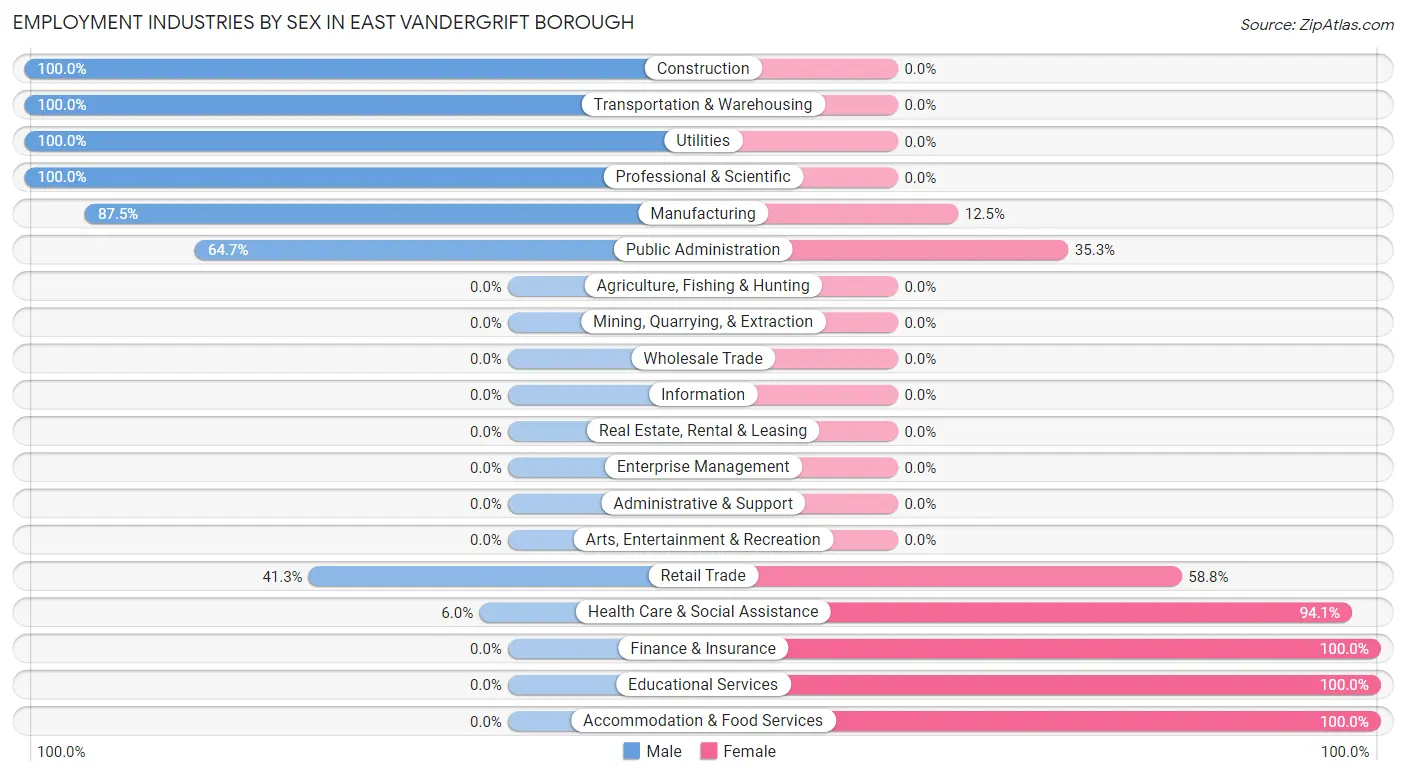
| Industry | Male | Female |
| Agriculture, Fishing & Hunting | 0 (0.0%) | 0 (0.0%) |
| Mining, Quarrying, & Extraction | 0 (0.0%) | 0 (0.0%) |
| Construction | 56 (100.0%) | 0 (0.0%) |
| Manufacturing | 63 (87.5%) | 9 (12.5%) |
| Wholesale Trade | 0 (0.0%) | 0 (0.0%) |
| Retail Trade | 33 (41.2%) | 47 (58.8%) |
| Transportation & Warehousing | 11 (100.0%) | 0 (0.0%) |
| Utilities | 5 (100.0%) | 0 (0.0%) |
| Information | 0 (0.0%) | 0 (0.0%) |
| Finance & Insurance | 0 (0.0%) | 2 (100.0%) |
| Real Estate, Rental & Leasing | 0 (0.0%) | 0 (0.0%) |
| Professional & Scientific | 15 (100.0%) | 0 (0.0%) |
| Enterprise Management | 0 (0.0%) | 0 (0.0%) |
| Administrative & Support | 0 (0.0%) | 0 (0.0%) |
| Educational Services | 0 (0.0%) | 7 (100.0%) |
| Health Care & Social Assistance | 5 (5.9%) | 79 (94.1%) |
| Arts, Entertainment & Recreation | 0 (0.0%) | 0 (0.0%) |
| Accommodation & Food Services | 0 (0.0%) | 22 (100.0%) |
| Public Administration | 11 (64.7%) | 6 (35.3%) |
| Total | 199 (51.7%) | 186 (48.3%) |
Education in East Vandergrift borough
School Enrollment in East Vandergrift borough
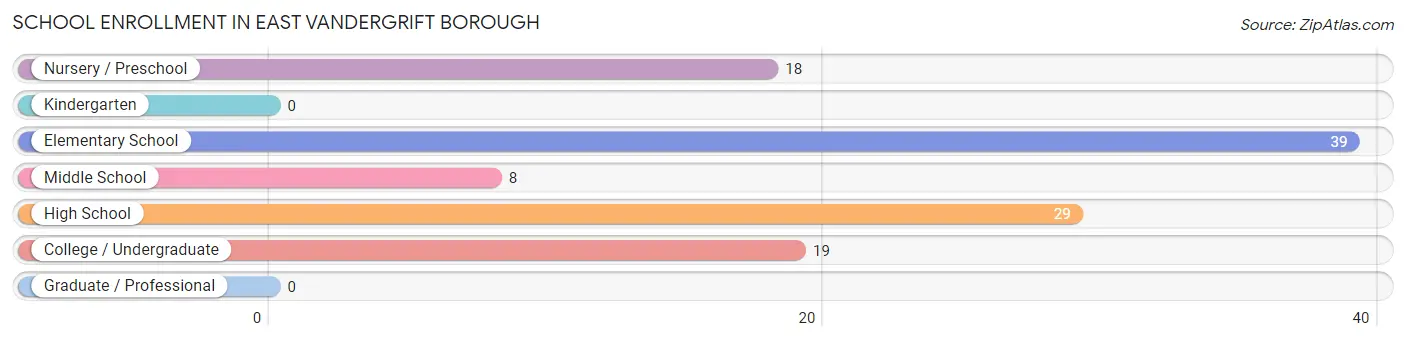
The most common levels of schooling among the 113 students in East Vandergrift borough are elementary school (39 | 34.5%), high school (29 | 25.7%), and college / undergraduate (19 | 16.8%).
| School Level | # Students | % Students |
| Nursery / Preschool | 18 | 15.9% |
| Kindergarten | 0 | 0.0% |
| Elementary School | 39 | 34.5% |
| Middle School | 8 | 7.1% |
| High School | 29 | 25.7% |
| College / Undergraduate | 19 | 16.8% |
| Graduate / Professional | 0 | 0.0% |
| Total | 113 | 100.0% |
School Enrollment by Age by Funding Source in East Vandergrift borough
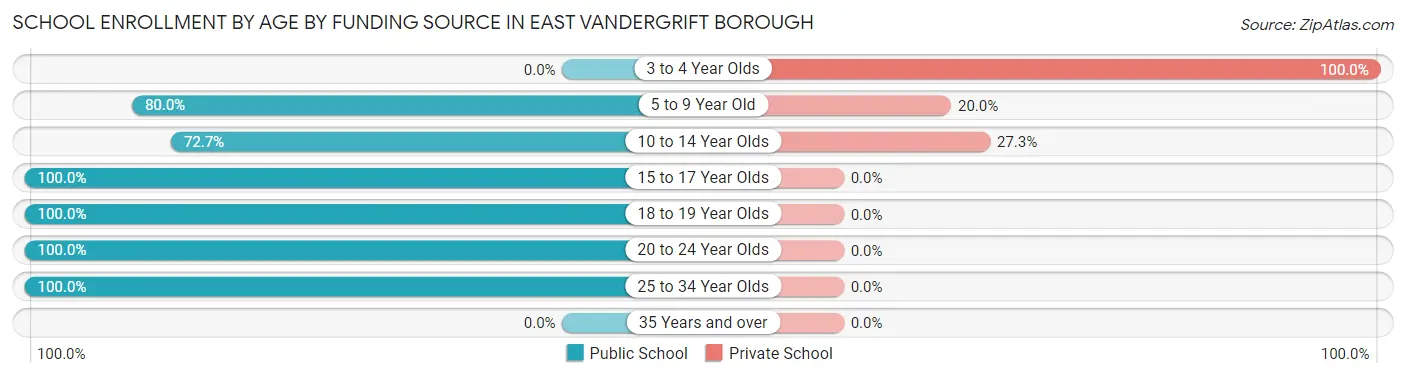
Out of a total of 113 students who are enrolled in schools in East Vandergrift borough, 21 (18.6%) attend a private institution, while the remaining 92 (81.4%) are enrolled in public schools. The age group of 3 to 4 year olds has the highest likelihood of being enrolled in private schools, with 8 (100.0% in the age bracket) enrolled. Conversely, the age group of 15 to 17 year olds has the lowest likelihood of being enrolled in a private school, with 19 (100.0% in the age bracket) attending a public institution.
| Age Bracket | Public School | Private School |
| 3 to 4 Year Olds | 0 (0.0%) | 8 (100.0%) |
| 5 to 9 Year Old | 28 (80.0%) | 7 (20.0%) |
| 10 to 14 Year Olds | 16 (72.7%) | 6 (27.3%) |
| 15 to 17 Year Olds | 19 (100.0%) | 0 (0.0%) |
| 18 to 19 Year Olds | 10 (100.0%) | 0 (0.0%) |
| 20 to 24 Year Olds | 12 (100.0%) | 0 (0.0%) |
| 25 to 34 Year Olds | 7 (100.0%) | 0 (0.0%) |
| 35 Years and over | 0 (0.0%) | 0 (0.0%) |
| Total | 92 (81.4%) | 21 (18.6%) |
Educational Attainment by Field of Study in East Vandergrift borough
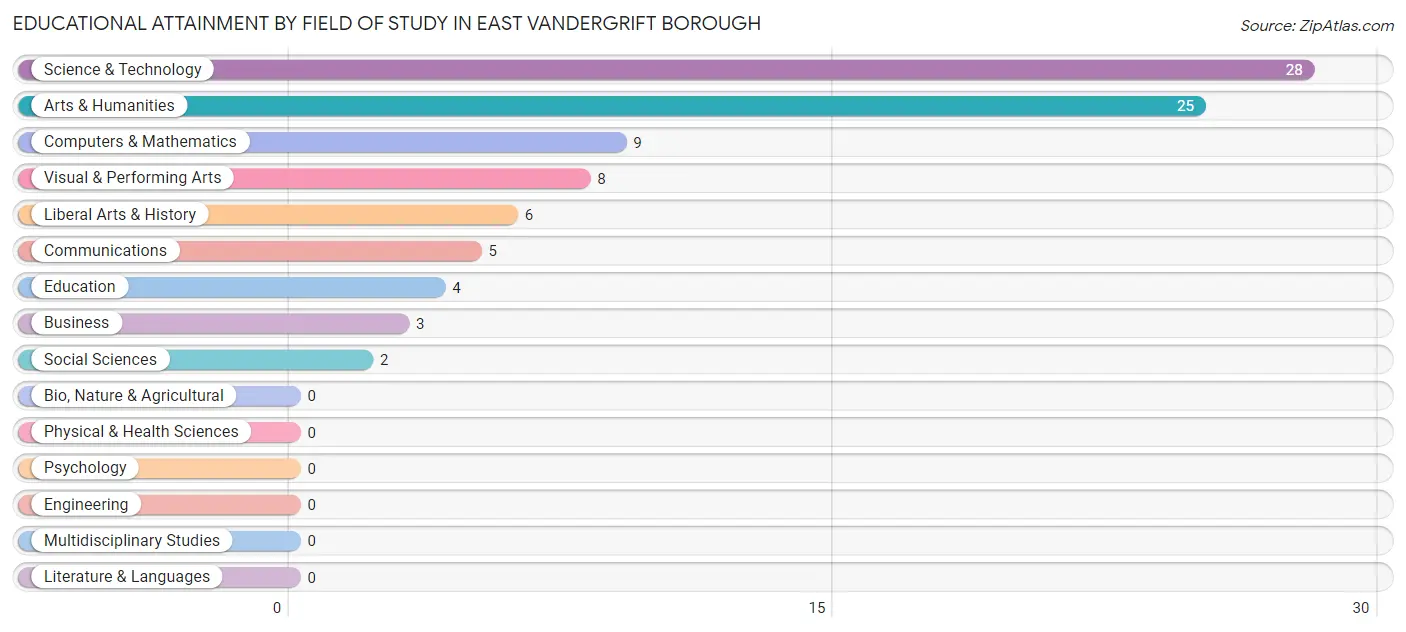
Science & technology (28 | 31.1%), arts & humanities (25 | 27.8%), computers & mathematics (9 | 10.0%), visual & performing arts (8 | 8.9%), and liberal arts & history (6 | 6.7%) are the most common fields of study among 90 individuals in East Vandergrift borough who have obtained a bachelor's degree or higher.
| Field of Study | # Graduates | % Graduates |
| Computers & Mathematics | 9 | 10.0% |
| Bio, Nature & Agricultural | 0 | 0.0% |
| Physical & Health Sciences | 0 | 0.0% |
| Psychology | 0 | 0.0% |
| Social Sciences | 2 | 2.2% |
| Engineering | 0 | 0.0% |
| Multidisciplinary Studies | 0 | 0.0% |
| Science & Technology | 28 | 31.1% |
| Business | 3 | 3.3% |
| Education | 4 | 4.4% |
| Literature & Languages | 0 | 0.0% |
| Liberal Arts & History | 6 | 6.7% |
| Visual & Performing Arts | 8 | 8.9% |
| Communications | 5 | 5.6% |
| Arts & Humanities | 25 | 27.8% |
| Total | 90 | 100.0% |
Transportation & Commute in East Vandergrift borough
Vehicle Availability by Sex in East Vandergrift borough
The most prevalent vehicle ownership categories in East Vandergrift borough are males with 3 vehicles (64, accounting for 33.3%) and females with 3 vehicles (20, making up 34.4%).
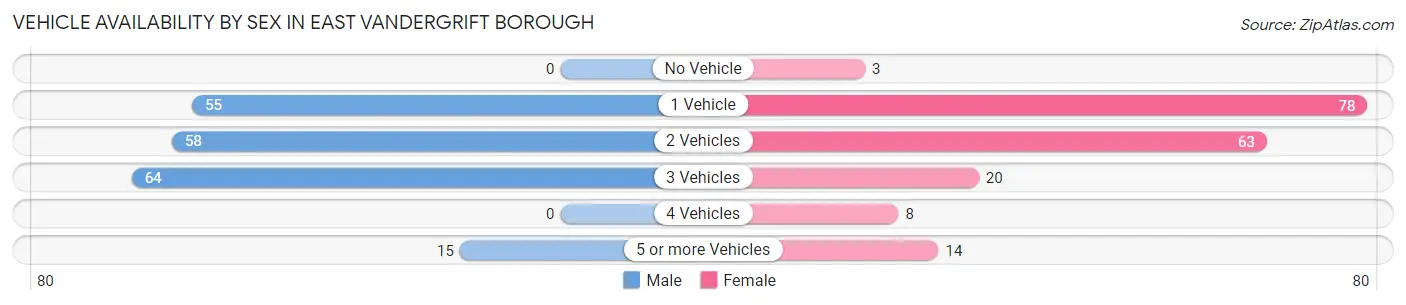
| Vehicles Available | Male | Female |
| No Vehicle | 0 (0.0%) | 3 (1.6%) |
| 1 Vehicle | 55 (28.6%) | 78 (41.9%) |
| 2 Vehicles | 58 (30.2%) | 63 (33.9%) |
| 3 Vehicles | 64 (33.3%) | 20 (10.7%) |
| 4 Vehicles | 0 (0.0%) | 8 (4.3%) |
| 5 or more Vehicles | 15 (7.8%) | 14 (7.5%) |
| Total | 192 (100.0%) | 186 (100.0%) |
Commute Time in East Vandergrift borough
The most frequently occuring commute durations in East Vandergrift borough are 15 to 19 minutes (76 commuters, 21.6%), 10 to 14 minutes (53 commuters, 15.1%), and 5 to 9 minutes (52 commuters, 14.8%).
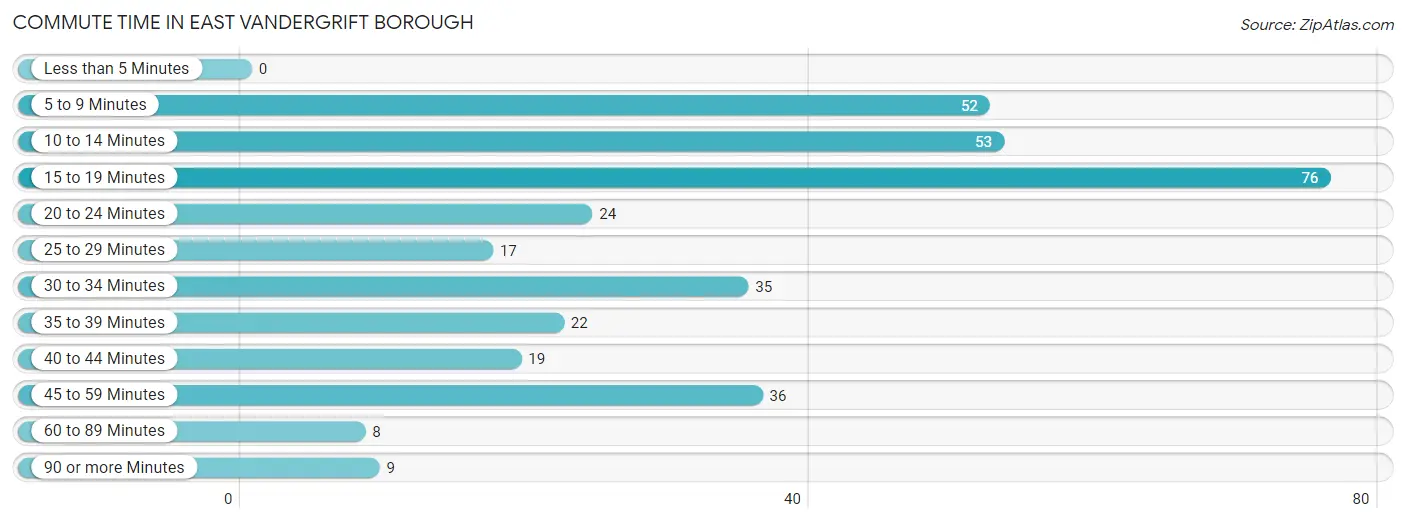
| Commute Time | # Commuters | % Commuters |
| Less than 5 Minutes | 0 | 0.0% |
| 5 to 9 Minutes | 52 | 14.8% |
| 10 to 14 Minutes | 53 | 15.1% |
| 15 to 19 Minutes | 76 | 21.6% |
| 20 to 24 Minutes | 24 | 6.8% |
| 25 to 29 Minutes | 17 | 4.8% |
| 30 to 34 Minutes | 35 | 10.0% |
| 35 to 39 Minutes | 22 | 6.3% |
| 40 to 44 Minutes | 19 | 5.4% |
| 45 to 59 Minutes | 36 | 10.3% |
| 60 to 89 Minutes | 8 | 2.3% |
| 90 or more Minutes | 9 | 2.6% |
Commute Time by Sex in East Vandergrift borough
The most common commute times in East Vandergrift borough are 10 to 14 minutes (48 commuters, 26.2%) for males and 15 to 19 minutes (46 commuters, 27.4%) for females.
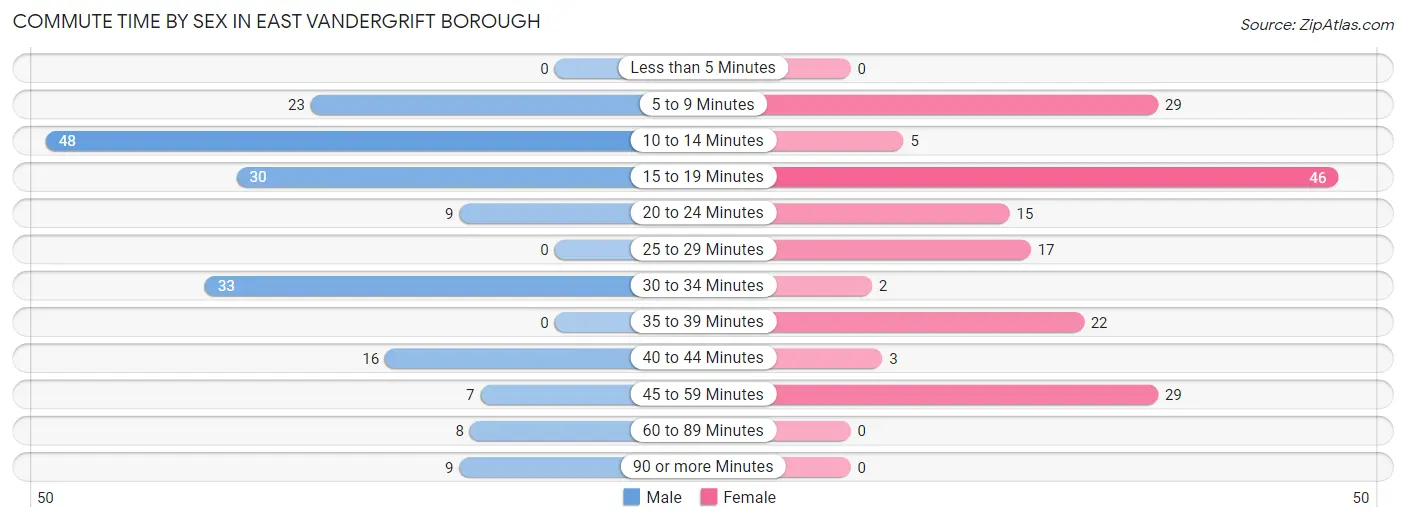
| Commute Time | Male | Female |
| Less than 5 Minutes | 0 (0.0%) | 0 (0.0%) |
| 5 to 9 Minutes | 23 (12.6%) | 29 (17.3%) |
| 10 to 14 Minutes | 48 (26.2%) | 5 (3.0%) |
| 15 to 19 Minutes | 30 (16.4%) | 46 (27.4%) |
| 20 to 24 Minutes | 9 (4.9%) | 15 (8.9%) |
| 25 to 29 Minutes | 0 (0.0%) | 17 (10.1%) |
| 30 to 34 Minutes | 33 (18.0%) | 2 (1.2%) |
| 35 to 39 Minutes | 0 (0.0%) | 22 (13.1%) |
| 40 to 44 Minutes | 16 (8.7%) | 3 (1.8%) |
| 45 to 59 Minutes | 7 (3.8%) | 29 (17.3%) |
| 60 to 89 Minutes | 8 (4.4%) | 0 (0.0%) |
| 90 or more Minutes | 9 (4.9%) | 0 (0.0%) |
Time of Departure to Work by Sex in East Vandergrift borough
The most frequent times of departure to work in East Vandergrift borough are 8:30 AM to 8:59 AM (57, 31.1%) for males and 12:00 PM to 3:59 PM (42, 25.0%) for females.
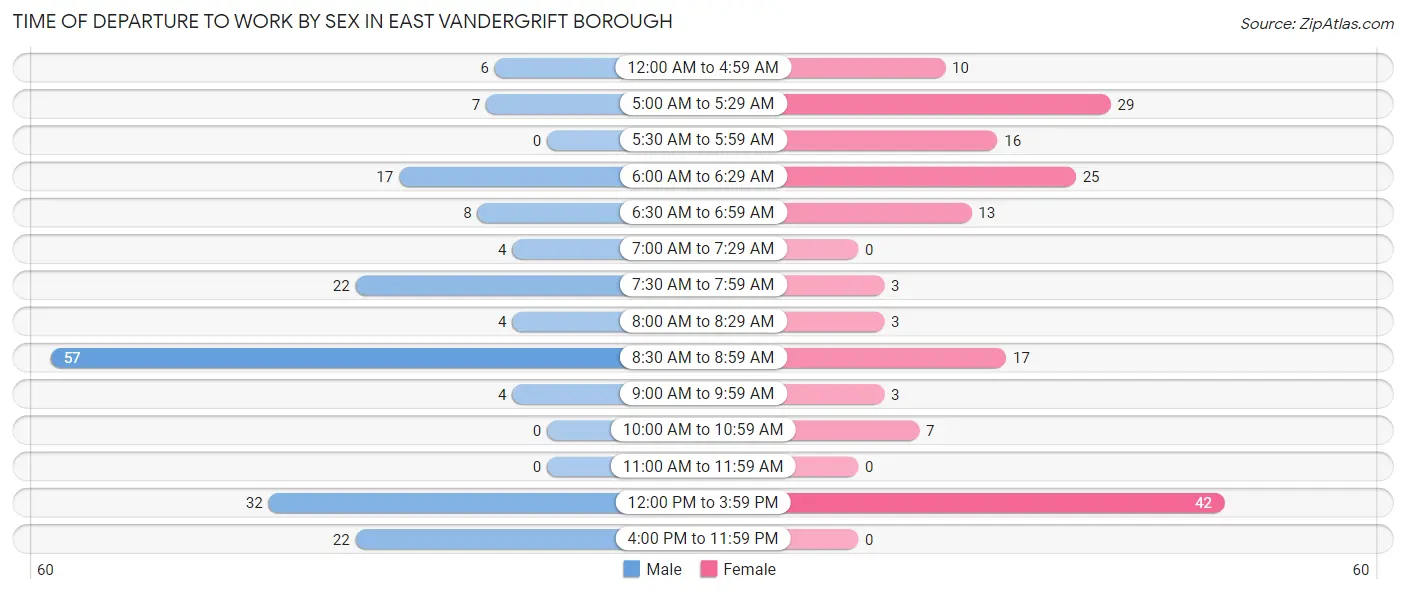
| Time of Departure | Male | Female |
| 12:00 AM to 4:59 AM | 6 (3.3%) | 10 (5.9%) |
| 5:00 AM to 5:29 AM | 7 (3.8%) | 29 (17.3%) |
| 5:30 AM to 5:59 AM | 0 (0.0%) | 16 (9.5%) |
| 6:00 AM to 6:29 AM | 17 (9.3%) | 25 (14.9%) |
| 6:30 AM to 6:59 AM | 8 (4.4%) | 13 (7.7%) |
| 7:00 AM to 7:29 AM | 4 (2.2%) | 0 (0.0%) |
| 7:30 AM to 7:59 AM | 22 (12.0%) | 3 (1.8%) |
| 8:00 AM to 8:29 AM | 4 (2.2%) | 3 (1.8%) |
| 8:30 AM to 8:59 AM | 57 (31.1%) | 17 (10.1%) |
| 9:00 AM to 9:59 AM | 4 (2.2%) | 3 (1.8%) |
| 10:00 AM to 10:59 AM | 0 (0.0%) | 7 (4.2%) |
| 11:00 AM to 11:59 AM | 0 (0.0%) | 0 (0.0%) |
| 12:00 PM to 3:59 PM | 32 (17.5%) | 42 (25.0%) |
| 4:00 PM to 11:59 PM | 22 (12.0%) | 0 (0.0%) |
| Total | 183 (100.0%) | 168 (100.0%) |
Housing Occupancy in East Vandergrift borough
Occupancy by Ownership in East Vandergrift borough
Of the total 321 dwellings in East Vandergrift borough, owner-occupied units account for 216 (67.3%), while renter-occupied units make up 105 (32.7%).
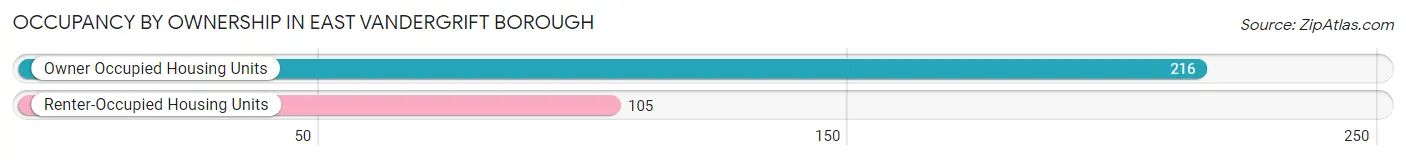
| Occupancy | # Housing Units | % Housing Units |
| Owner Occupied Housing Units | 216 | 67.3% |
| Renter-Occupied Housing Units | 105 | 32.7% |
| Total Occupied Housing Units | 321 | 100.0% |
Occupancy by Household Size in East Vandergrift borough
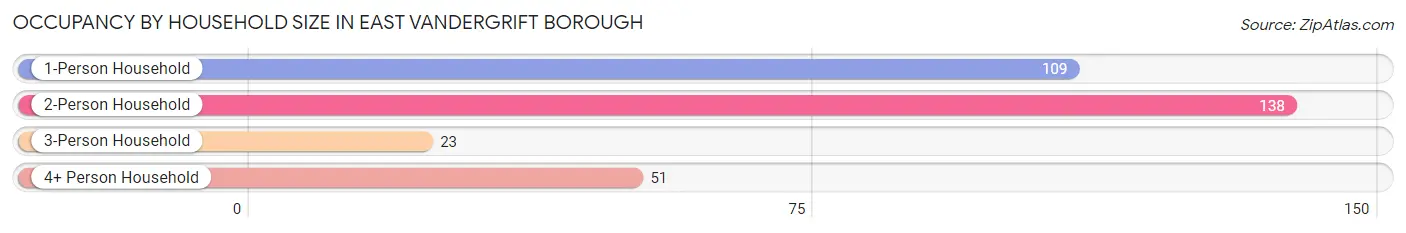
| Household Size | # Housing Units | % Housing Units |
| 1-Person Household | 109 | 34.0% |
| 2-Person Household | 138 | 43.0% |
| 3-Person Household | 23 | 7.2% |
| 4+ Person Household | 51 | 15.9% |
| Total Housing Units | 321 | 100.0% |
Occupancy by Ownership by Household Size in East Vandergrift borough
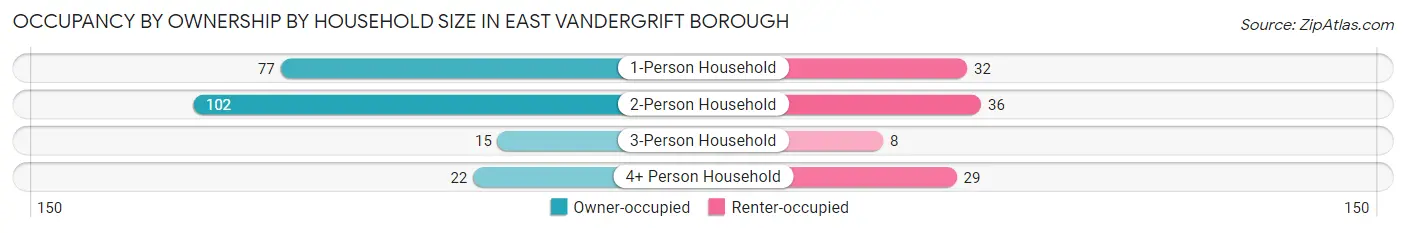
| Household Size | Owner-occupied | Renter-occupied |
| 1-Person Household | 77 (70.6%) | 32 (29.4%) |
| 2-Person Household | 102 (73.9%) | 36 (26.1%) |
| 3-Person Household | 15 (65.2%) | 8 (34.8%) |
| 4+ Person Household | 22 (43.1%) | 29 (56.9%) |
| Total Housing Units | 216 (67.3%) | 105 (32.7%) |
Occupancy by Educational Attainment in East Vandergrift borough
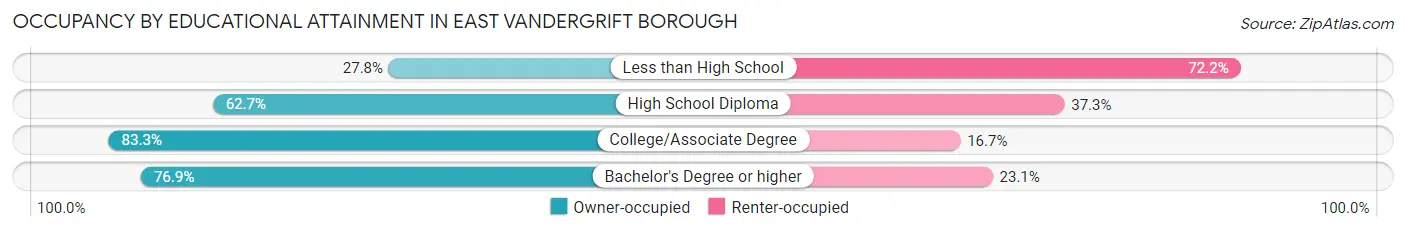
| Household Size | Owner-occupied | Renter-occupied |
| Less than High School | 5 (27.8%) | 13 (72.2%) |
| High School Diploma | 116 (62.7%) | 69 (37.3%) |
| College/Associate Degree | 55 (83.3%) | 11 (16.7%) |
| Bachelor's Degree or higher | 40 (76.9%) | 12 (23.1%) |
Occupancy by Age of Householder in East Vandergrift borough
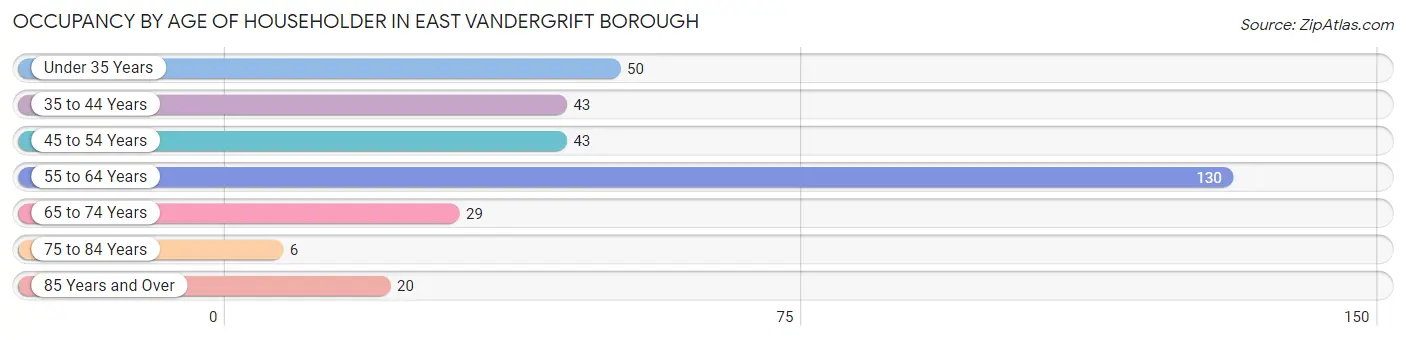
| Age Bracket | # Households | % Households |
| Under 35 Years | 50 | 15.6% |
| 35 to 44 Years | 43 | 13.4% |
| 45 to 54 Years | 43 | 13.4% |
| 55 to 64 Years | 130 | 40.5% |
| 65 to 74 Years | 29 | 9.0% |
| 75 to 84 Years | 6 | 1.9% |
| 85 Years and Over | 20 | 6.2% |
| Total | 321 | 100.0% |
Housing Finances in East Vandergrift borough
Median Income by Occupancy in East Vandergrift borough
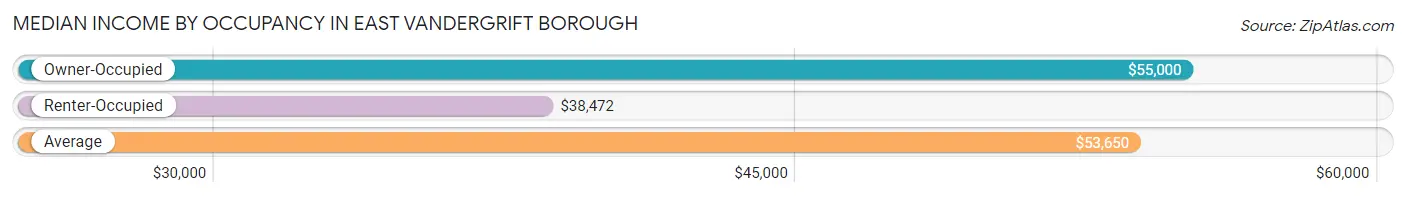
| Occupancy Type | # Households | Median Income |
| Owner-Occupied | 216 (67.3%) | $55,000 |
| Renter-Occupied | 105 (32.7%) | $38,472 |
| Average | 321 (100.0%) | $53,650 |
Occupancy by Householder Income Bracket in East Vandergrift borough
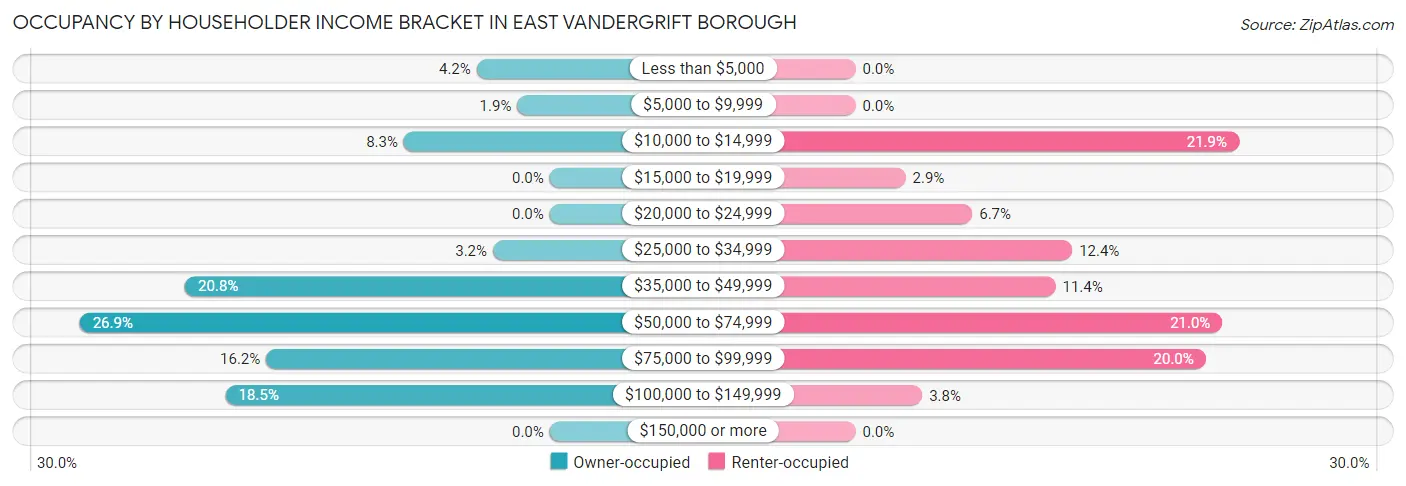
| Income Bracket | Owner-occupied | Renter-occupied |
| Less than $5,000 | 9 (4.2%) | 0 (0.0%) |
| $5,000 to $9,999 | 4 (1.8%) | 0 (0.0%) |
| $10,000 to $14,999 | 18 (8.3%) | 23 (21.9%) |
| $15,000 to $19,999 | 0 (0.0%) | 3 (2.9%) |
| $20,000 to $24,999 | 0 (0.0%) | 7 (6.7%) |
| $25,000 to $34,999 | 7 (3.2%) | 13 (12.4%) |
| $35,000 to $49,999 | 45 (20.8%) | 12 (11.4%) |
| $50,000 to $74,999 | 58 (26.9%) | 22 (20.9%) |
| $75,000 to $99,999 | 35 (16.2%) | 21 (20.0%) |
| $100,000 to $149,999 | 40 (18.5%) | 4 (3.8%) |
| $150,000 or more | 0 (0.0%) | 0 (0.0%) |
| Total | 216 (100.0%) | 105 (100.0%) |
Monthly Housing Cost Tiers in East Vandergrift borough
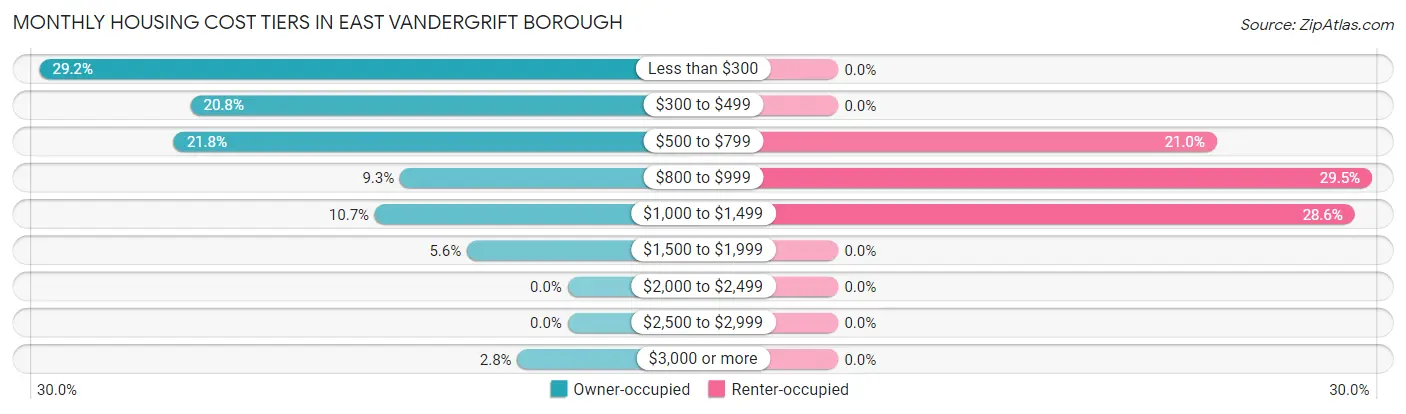
| Monthly Cost | Owner-occupied | Renter-occupied |
| Less than $300 | 63 (29.2%) | 0 (0.0%) |
| $300 to $499 | 45 (20.8%) | 0 (0.0%) |
| $500 to $799 | 47 (21.8%) | 22 (20.9%) |
| $800 to $999 | 20 (9.3%) | 31 (29.5%) |
| $1,000 to $1,499 | 23 (10.6%) | 30 (28.6%) |
| $1,500 to $1,999 | 12 (5.6%) | 0 (0.0%) |
| $2,000 to $2,499 | 0 (0.0%) | 0 (0.0%) |
| $2,500 to $2,999 | 0 (0.0%) | 0 (0.0%) |
| $3,000 or more | 6 (2.8%) | 0 (0.0%) |
| Total | 216 (100.0%) | 105 (100.0%) |
Physical Housing Characteristics in East Vandergrift borough
Housing Structures in East Vandergrift borough
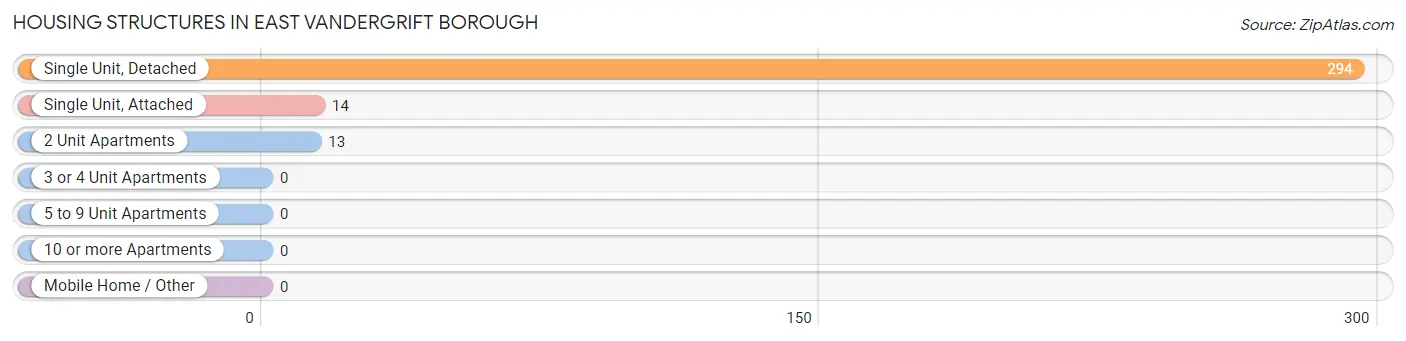
| Structure Type | # Housing Units | % Housing Units |
| Single Unit, Detached | 294 | 91.6% |
| Single Unit, Attached | 14 | 4.4% |
| 2 Unit Apartments | 13 | 4.1% |
| 3 or 4 Unit Apartments | 0 | 0.0% |
| 5 to 9 Unit Apartments | 0 | 0.0% |
| 10 or more Apartments | 0 | 0.0% |
| Mobile Home / Other | 0 | 0.0% |
| Total | 321 | 100.0% |
Housing Structures by Occupancy in East Vandergrift borough
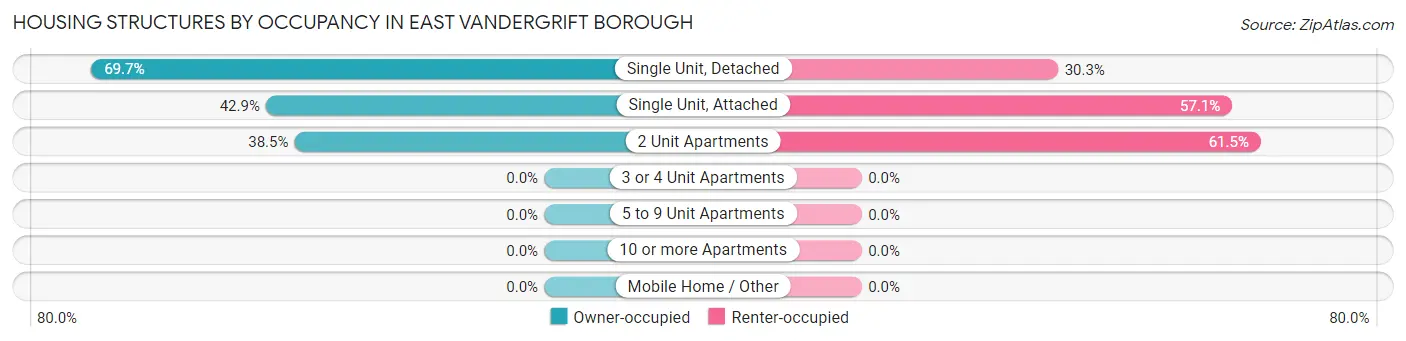
| Structure Type | Owner-occupied | Renter-occupied |
| Single Unit, Detached | 205 (69.7%) | 89 (30.3%) |
| Single Unit, Attached | 6 (42.9%) | 8 (57.1%) |
| 2 Unit Apartments | 5 (38.5%) | 8 (61.5%) |
| 3 or 4 Unit Apartments | 0 (0.0%) | 0 (0.0%) |
| 5 to 9 Unit Apartments | 0 (0.0%) | 0 (0.0%) |
| 10 or more Apartments | 0 (0.0%) | 0 (0.0%) |
| Mobile Home / Other | 0 (0.0%) | 0 (0.0%) |
| Total | 216 (67.3%) | 105 (32.7%) |
Housing Structures by Number of Rooms in East Vandergrift borough
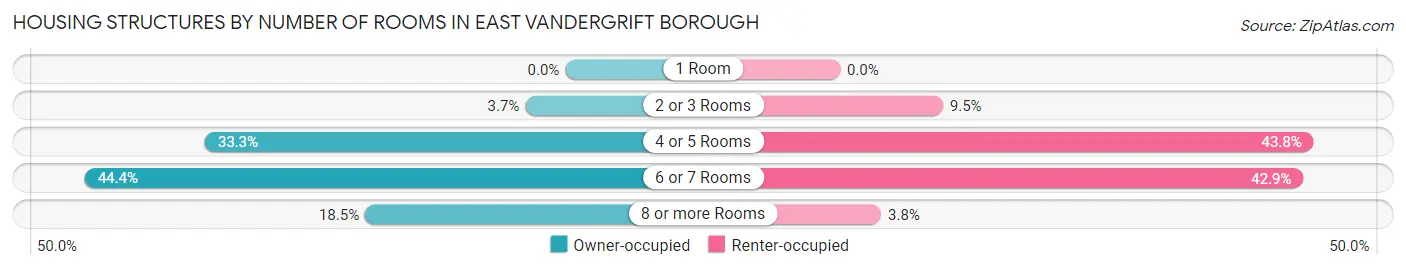
| Number of Rooms | Owner-occupied | Renter-occupied |
| 1 Room | 0 (0.0%) | 0 (0.0%) |
| 2 or 3 Rooms | 8 (3.7%) | 10 (9.5%) |
| 4 or 5 Rooms | 72 (33.3%) | 46 (43.8%) |
| 6 or 7 Rooms | 96 (44.4%) | 45 (42.9%) |
| 8 or more Rooms | 40 (18.5%) | 4 (3.8%) |
| Total | 216 (100.0%) | 105 (100.0%) |
Housing Structure by Heating Type in East Vandergrift borough
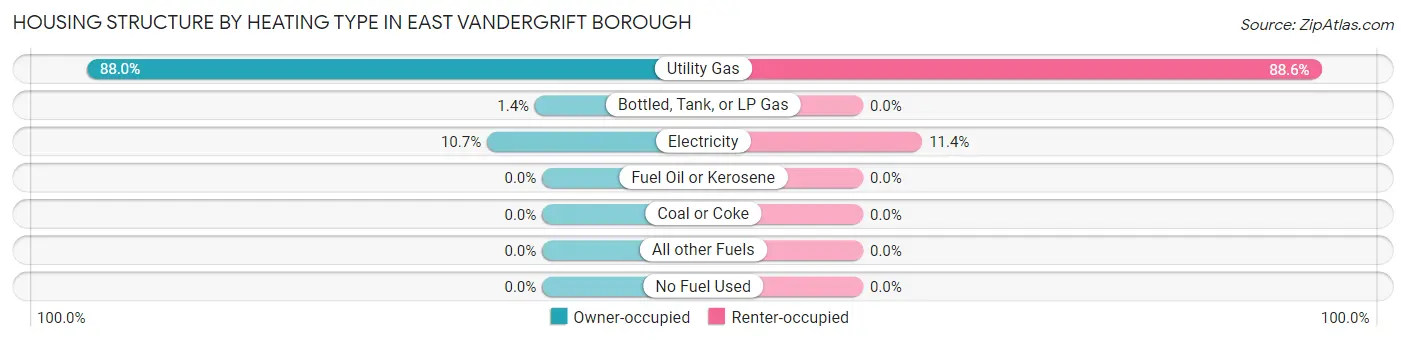
| Heating Type | Owner-occupied | Renter-occupied |
| Utility Gas | 190 (88.0%) | 93 (88.6%) |
| Bottled, Tank, or LP Gas | 3 (1.4%) | 0 (0.0%) |
| Electricity | 23 (10.6%) | 12 (11.4%) |
| Fuel Oil or Kerosene | 0 (0.0%) | 0 (0.0%) |
| Coal or Coke | 0 (0.0%) | 0 (0.0%) |
| All other Fuels | 0 (0.0%) | 0 (0.0%) |
| No Fuel Used | 0 (0.0%) | 0 (0.0%) |
| Total | 216 (100.0%) | 105 (100.0%) |
Household Vehicle Usage in East Vandergrift borough
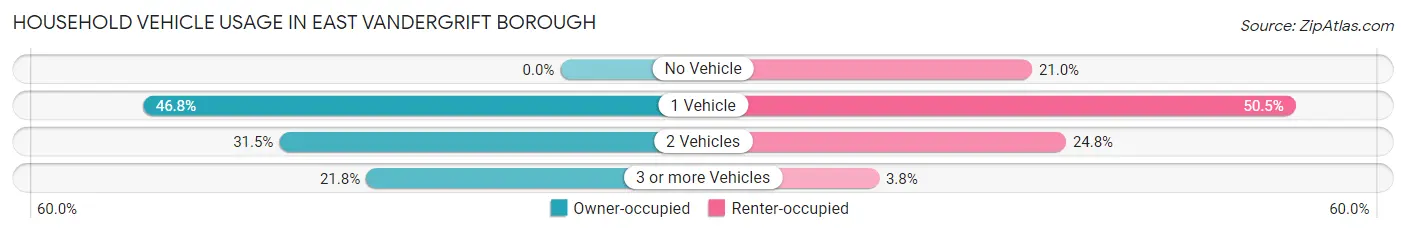
| Vehicles per Household | Owner-occupied | Renter-occupied |
| No Vehicle | 0 (0.0%) | 22 (20.9%) |
| 1 Vehicle | 101 (46.8%) | 53 (50.5%) |
| 2 Vehicles | 68 (31.5%) | 26 (24.8%) |
| 3 or more Vehicles | 47 (21.8%) | 4 (3.8%) |
| Total | 216 (100.0%) | 105 (100.0%) |
Real Estate & Mortgages in East Vandergrift borough
Real Estate and Mortgage Overview in East Vandergrift borough
| Characteristic | Without Mortgage | With Mortgage |
| Housing Units | 132 | 84 |
| Median Property Value | $49,600 | $0 |
| Median Household Income | $56,786 | $0 |
| Monthly Housing Costs | $313 | $0 |
| Real Estate Taxes | $650 | $0 |
Property Value by Mortgage Status in East Vandergrift borough
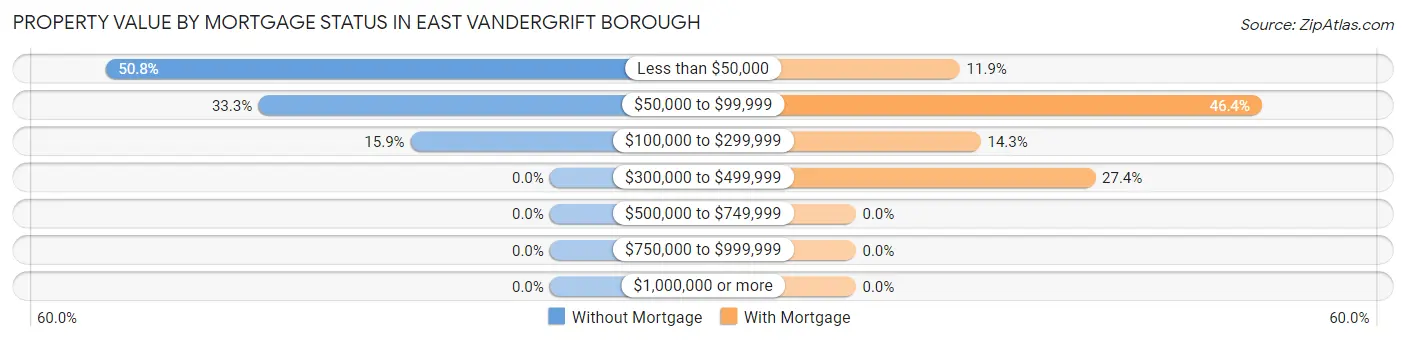
| Property Value | Without Mortgage | With Mortgage |
| Less than $50,000 | 67 (50.8%) | 10 (11.9%) |
| $50,000 to $99,999 | 44 (33.3%) | 39 (46.4%) |
| $100,000 to $299,999 | 21 (15.9%) | 12 (14.3%) |
| $300,000 to $499,999 | 0 (0.0%) | 23 (27.4%) |
| $500,000 to $749,999 | 0 (0.0%) | 0 (0.0%) |
| $750,000 to $999,999 | 0 (0.0%) | 0 (0.0%) |
| $1,000,000 or more | 0 (0.0%) | 0 (0.0%) |
| Total | 132 (100.0%) | 84 (100.0%) |
Household Income by Mortgage Status in East Vandergrift borough
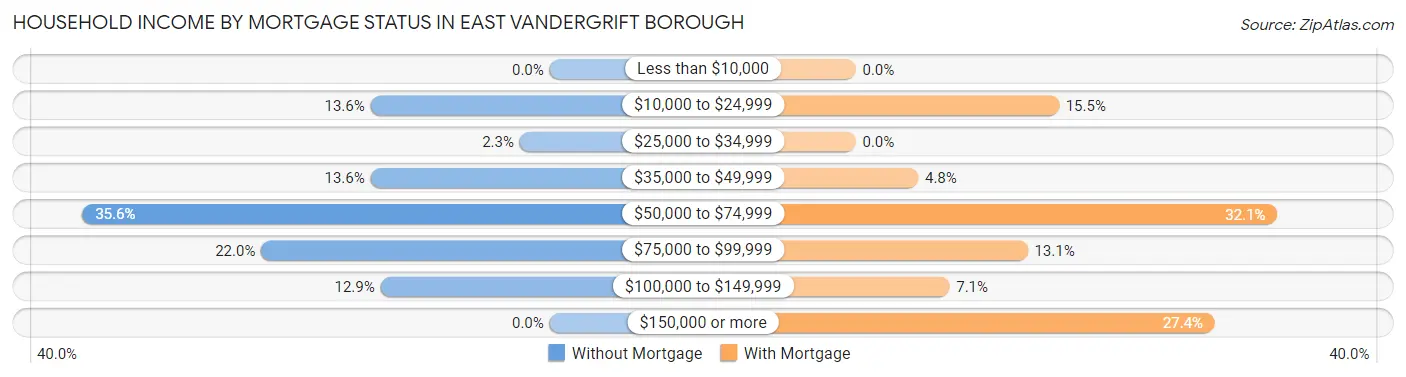
| Household Income | Without Mortgage | With Mortgage |
| Less than $10,000 | 0 (0.0%) | 0 (0.0%) |
| $10,000 to $24,999 | 18 (13.6%) | 13 (15.5%) |
| $25,000 to $34,999 | 3 (2.3%) | 0 (0.0%) |
| $35,000 to $49,999 | 18 (13.6%) | 4 (4.8%) |
| $50,000 to $74,999 | 47 (35.6%) | 27 (32.1%) |
| $75,000 to $99,999 | 29 (22.0%) | 11 (13.1%) |
| $100,000 to $149,999 | 17 (12.9%) | 6 (7.1%) |
| $150,000 or more | 0 (0.0%) | 23 (27.4%) |
| Total | 132 (100.0%) | 84 (100.0%) |
Property Value to Household Income Ratio in East Vandergrift borough
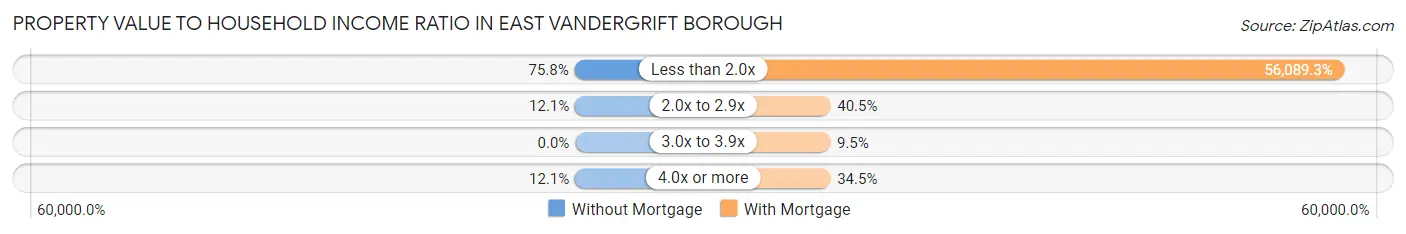
| Value-to-Income Ratio | Without Mortgage | With Mortgage |
| Less than 2.0x | 100 (75.8%) | 47,115 (56,089.3%) |
| 2.0x to 2.9x | 16 (12.1%) | 34 (40.5%) |
| 3.0x to 3.9x | 0 (0.0%) | 8 (9.5%) |
| 4.0x or more | 16 (12.1%) | 29 (34.5%) |
| Total | 132 (100.0%) | 84 (100.0%) |
Real Estate Taxes by Mortgage Status in East Vandergrift borough
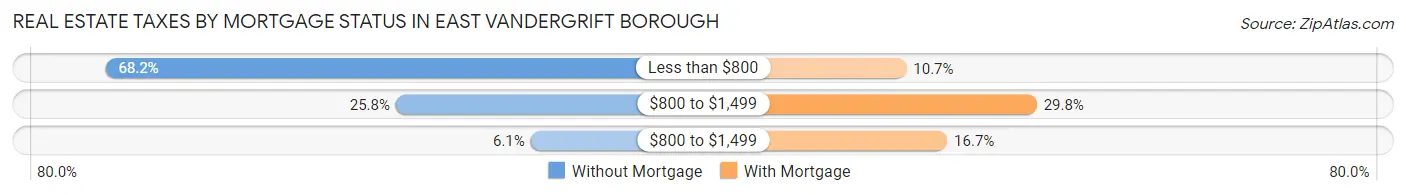
| Property Taxes | Without Mortgage | With Mortgage |
| Less than $800 | 90 (68.2%) | 9 (10.7%) |
| $800 to $1,499 | 34 (25.8%) | 25 (29.8%) |
| $800 to $1,499 | 8 (6.1%) | 14 (16.7%) |
| Total | 132 (100.0%) | 84 (100.0%) |
Health & Disability in East Vandergrift borough
Health Insurance Coverage by Age in East Vandergrift borough
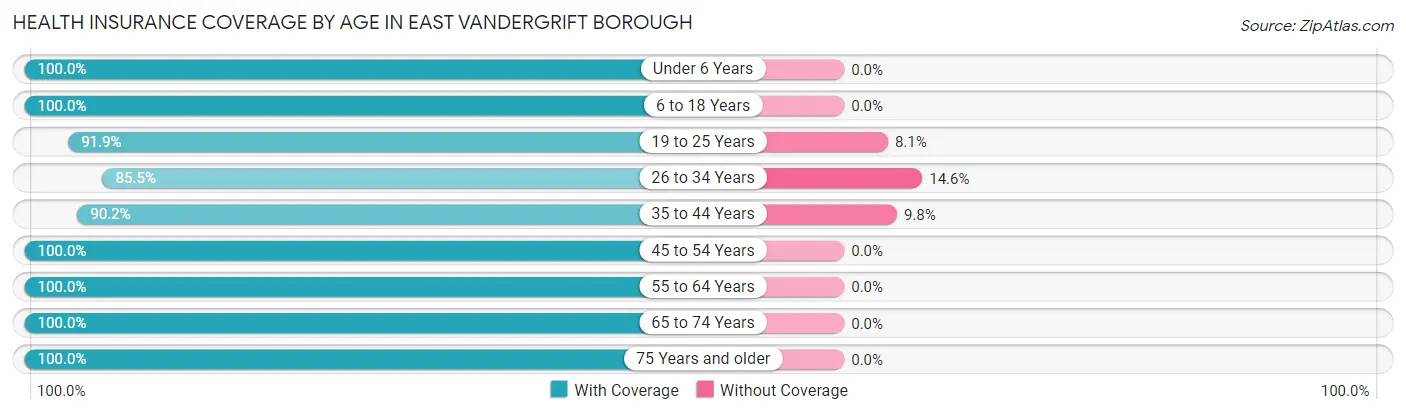
| Age Bracket | With Coverage | Without Coverage |
| Under 6 Years | 65 (100.0%) | 0 (0.0%) |
| 6 to 18 Years | 79 (100.0%) | 0 (0.0%) |
| 19 to 25 Years | 79 (91.9%) | 7 (8.1%) |
| 26 to 34 Years | 47 (85.5%) | 8 (14.5%) |
| 35 to 44 Years | 55 (90.2%) | 6 (9.8%) |
| 45 to 54 Years | 68 (100.0%) | 0 (0.0%) |
| 55 to 64 Years | 207 (100.0%) | 0 (0.0%) |
| 65 to 74 Years | 44 (100.0%) | 0 (0.0%) |
| 75 Years and older | 36 (100.0%) | 0 (0.0%) |
| Total | 680 (97.0%) | 21 (3.0%) |
Health Insurance Coverage by Citizenship Status in East Vandergrift borough
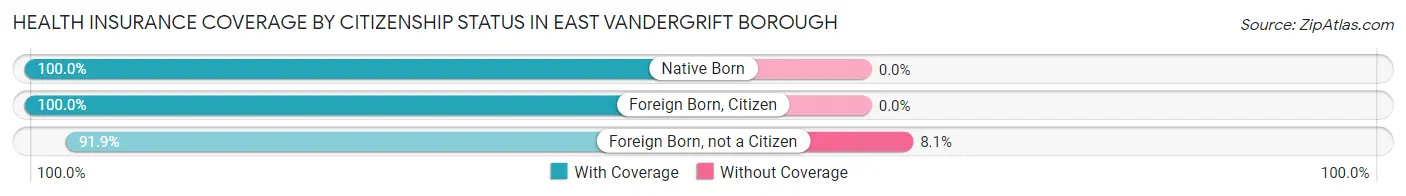
| Citizenship Status | With Coverage | Without Coverage |
| Native Born | 65 (100.0%) | 0 (0.0%) |
| Foreign Born, Citizen | 79 (100.0%) | 0 (0.0%) |
| Foreign Born, not a Citizen | 79 (91.9%) | 7 (8.1%) |
Health Insurance Coverage by Household Income in East Vandergrift borough
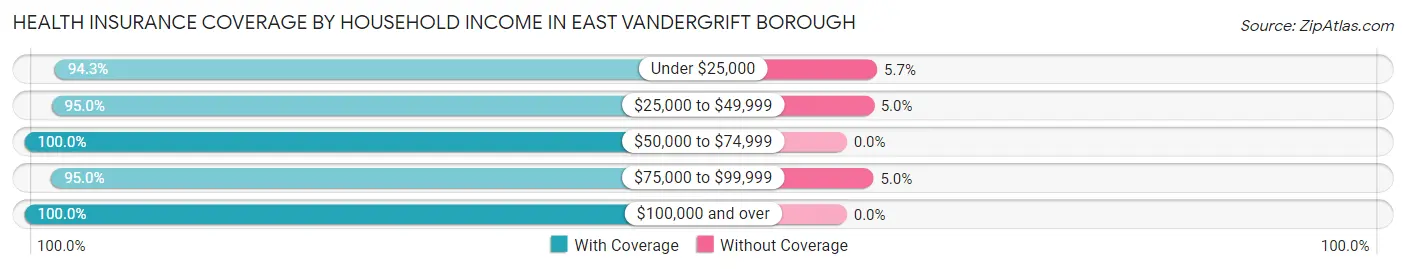
| Household Income | With Coverage | Without Coverage |
| Under $25,000 | 116 (94.3%) | 7 (5.7%) |
| $25,000 to $49,999 | 113 (95.0%) | 6 (5.0%) |
| $50,000 to $74,999 | 181 (100.0%) | 0 (0.0%) |
| $75,000 to $99,999 | 152 (95.0%) | 8 (5.0%) |
| $100,000 and over | 118 (100.0%) | 0 (0.0%) |
Public vs Private Health Insurance Coverage by Age in East Vandergrift borough
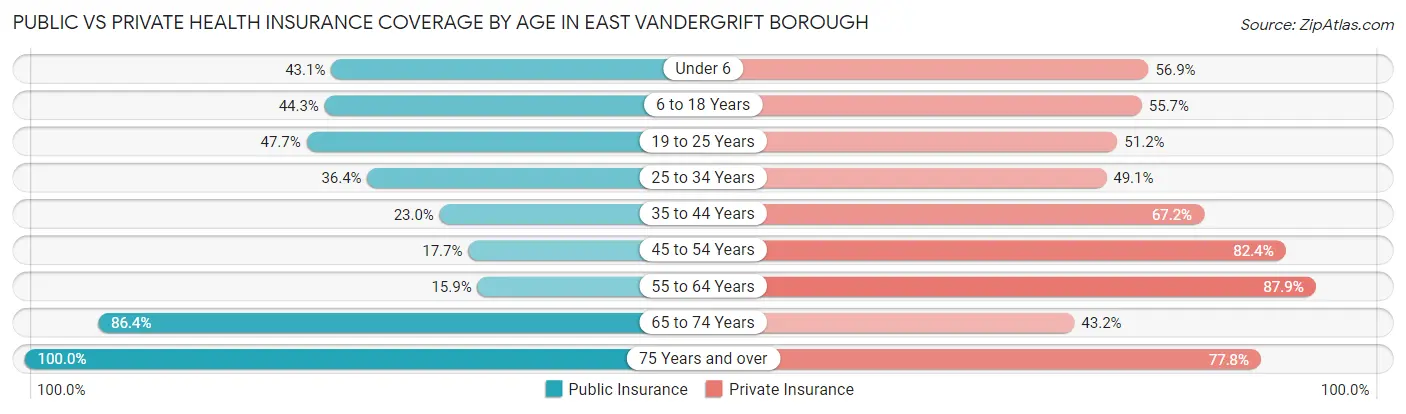
| Age Bracket | Public Insurance | Private Insurance |
| Under 6 | 28 (43.1%) | 37 (56.9%) |
| 6 to 18 Years | 35 (44.3%) | 44 (55.7%) |
| 19 to 25 Years | 41 (47.7%) | 44 (51.2%) |
| 25 to 34 Years | 20 (36.4%) | 27 (49.1%) |
| 35 to 44 Years | 14 (23.0%) | 41 (67.2%) |
| 45 to 54 Years | 12 (17.6%) | 56 (82.4%) |
| 55 to 64 Years | 33 (15.9%) | 182 (87.9%) |
| 65 to 74 Years | 38 (86.4%) | 19 (43.2%) |
| 75 Years and over | 36 (100.0%) | 28 (77.8%) |
| Total | 257 (36.7%) | 478 (68.2%) |
Disability Status by Sex by Age in East Vandergrift borough
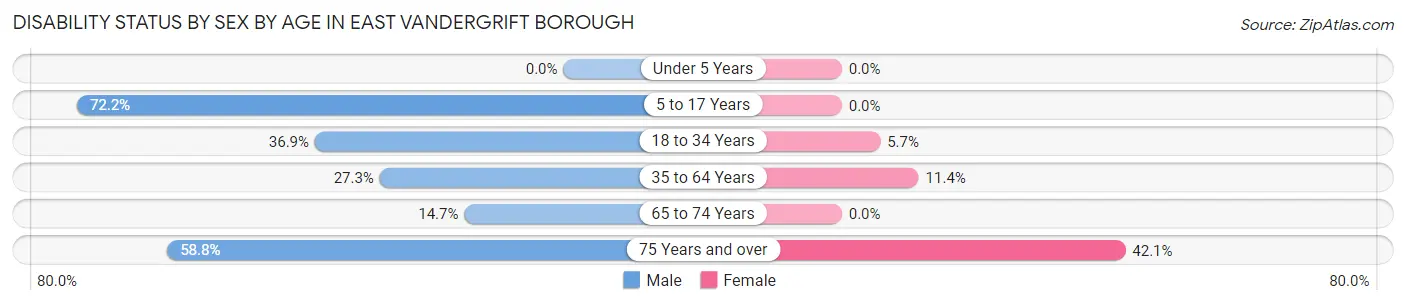
| Age Bracket | Male | Female |
| Under 5 Years | 0 (0.0%) | 0 (0.0%) |
| 5 to 17 Years | 13 (72.2%) | 0 (0.0%) |
| 18 to 34 Years | 31 (36.9%) | 4 (5.7%) |
| 35 to 64 Years | 51 (27.3%) | 17 (11.4%) |
| 65 to 74 Years | 5 (14.7%) | 0 (0.0%) |
| 75 Years and over | 10 (58.8%) | 8 (42.1%) |
Disability Class by Sex by Age in East Vandergrift borough
Disability Class: Hearing Difficulty
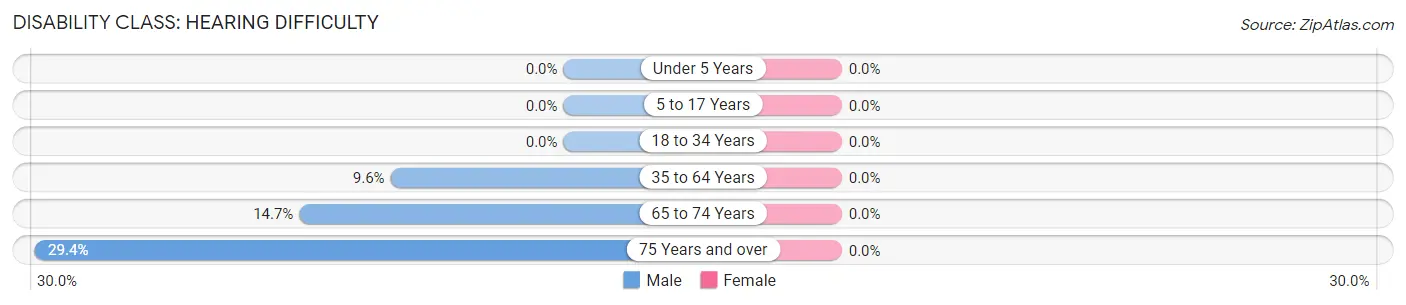
| Age Bracket | Male | Female |
| Under 5 Years | 0 (0.0%) | 0 (0.0%) |
| 5 to 17 Years | 0 (0.0%) | 0 (0.0%) |
| 18 to 34 Years | 0 (0.0%) | 0 (0.0%) |
| 35 to 64 Years | 18 (9.6%) | 0 (0.0%) |
| 65 to 74 Years | 5 (14.7%) | 0 (0.0%) |
| 75 Years and over | 5 (29.4%) | 0 (0.0%) |
Disability Class: Vision Difficulty
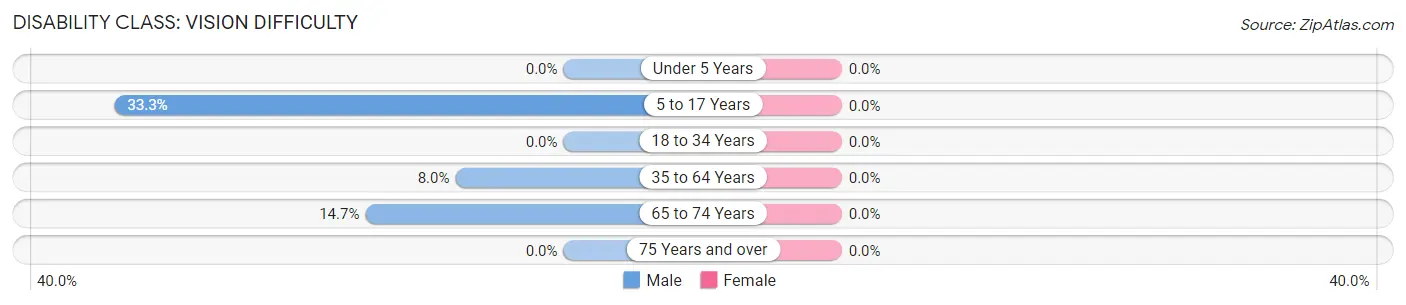
| Age Bracket | Male | Female |
| Under 5 Years | 0 (0.0%) | 0 (0.0%) |
| 5 to 17 Years | 6 (33.3%) | 0 (0.0%) |
| 18 to 34 Years | 0 (0.0%) | 0 (0.0%) |
| 35 to 64 Years | 15 (8.0%) | 0 (0.0%) |
| 65 to 74 Years | 5 (14.7%) | 0 (0.0%) |
| 75 Years and over | 0 (0.0%) | 0 (0.0%) |
Disability Class: Cognitive Difficulty
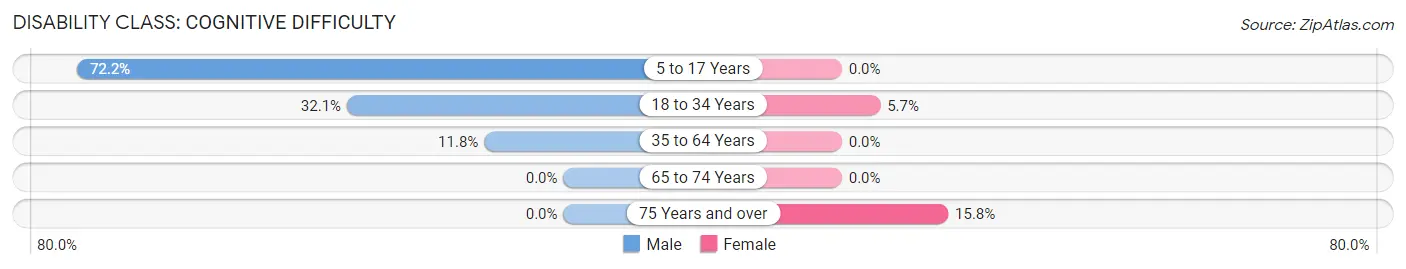
| Age Bracket | Male | Female |
| 5 to 17 Years | 13 (72.2%) | 0 (0.0%) |
| 18 to 34 Years | 27 (32.1%) | 4 (5.7%) |
| 35 to 64 Years | 22 (11.8%) | 0 (0.0%) |
| 65 to 74 Years | 0 (0.0%) | 0 (0.0%) |
| 75 Years and over | 0 (0.0%) | 3 (15.8%) |
Disability Class: Ambulatory Difficulty
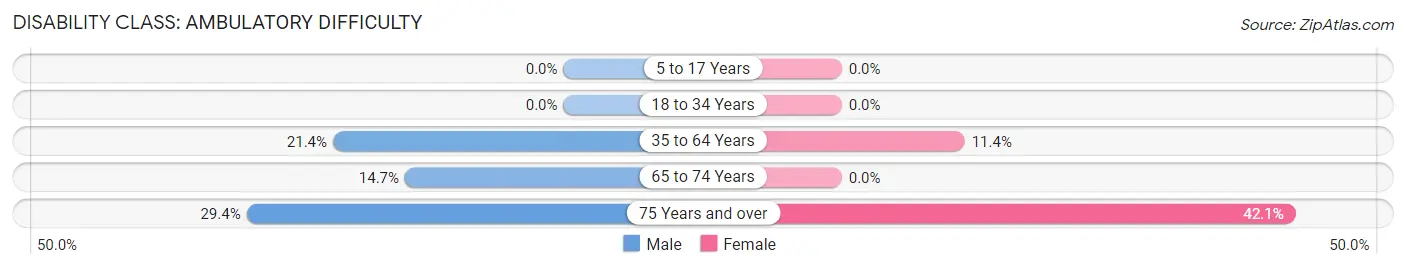
| Age Bracket | Male | Female |
| 5 to 17 Years | 0 (0.0%) | 0 (0.0%) |
| 18 to 34 Years | 0 (0.0%) | 0 (0.0%) |
| 35 to 64 Years | 40 (21.4%) | 17 (11.4%) |
| 65 to 74 Years | 5 (14.7%) | 0 (0.0%) |
| 75 Years and over | 5 (29.4%) | 8 (42.1%) |
Disability Class: Self-Care Difficulty
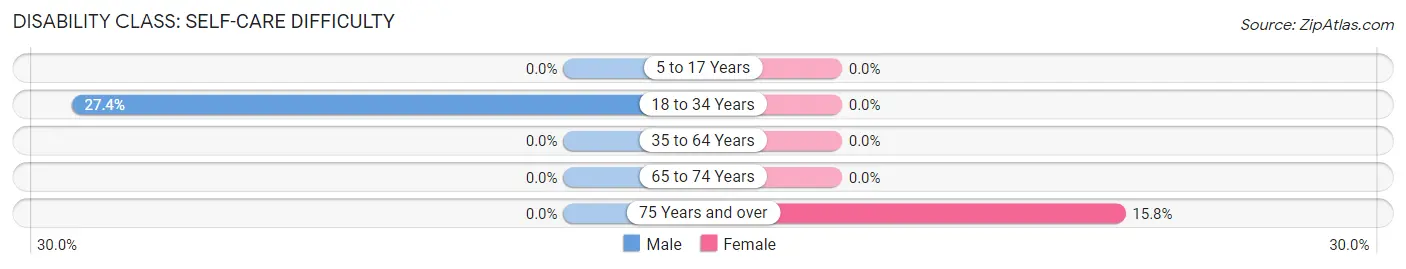
| Age Bracket | Male | Female |
| 5 to 17 Years | 0 (0.0%) | 0 (0.0%) |
| 18 to 34 Years | 23 (27.4%) | 0 (0.0%) |
| 35 to 64 Years | 0 (0.0%) | 0 (0.0%) |
| 65 to 74 Years | 0 (0.0%) | 0 (0.0%) |
| 75 Years and over | 0 (0.0%) | 3 (15.8%) |
Technology Access in East Vandergrift borough
Computing Device Access in East Vandergrift borough
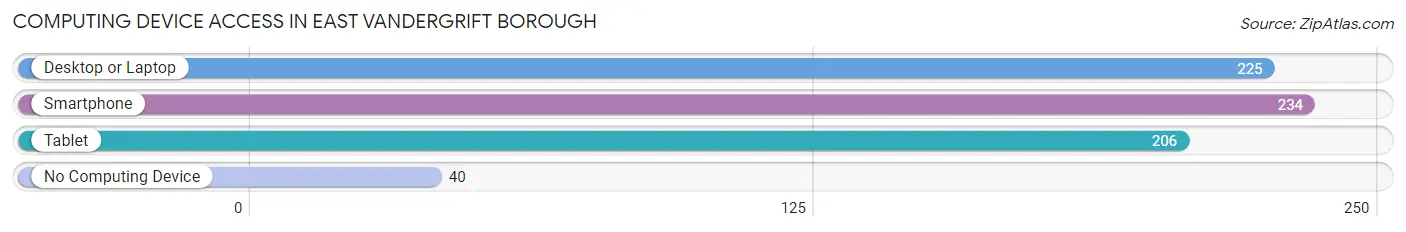
| Device Type | # Households | % Households |
| Desktop or Laptop | 225 | 70.1% |
| Smartphone | 234 | 72.9% |
| Tablet | 206 | 64.2% |
| No Computing Device | 40 | 12.5% |
| Total | 321 | 100.0% |
Internet Access in East Vandergrift borough
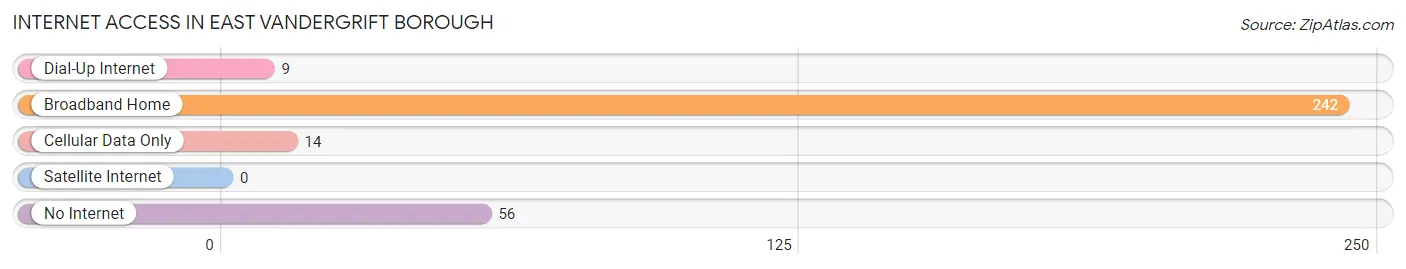
| Internet Type | # Households | % Households |
| Dial-Up Internet | 9 | 2.8% |
| Broadband Home | 242 | 75.4% |
| Cellular Data Only | 14 | 4.4% |
| Satellite Internet | 0 | 0.0% |
| No Internet | 56 | 17.4% |
| Total | 321 | 100.0% |
East Vandergrift borough Summary
History
East Vandergrift Borough is a small borough located in Westmoreland County, Pennsylvania. It is situated in the Allegheny Valley, approximately 25 miles northeast of Pittsburgh. The borough was founded in 1891 and incorporated in 1895. It was named after the Vandergrift family, who were early settlers in the area.
The borough was originally a farming community, but in the early 1900s, the area began to industrialize. The first industry to move into the area was the Pittsburgh Plate Glass Company, which opened a plant in East Vandergrift in 1902. This was followed by the opening of the American Sheet and Tin Plate Company in 1906. The two companies provided employment for many of the residents of the borough.
In the 1920s, the borough experienced a population boom as people moved to the area to take advantage of the new industrial jobs. The population peaked in 1930 at 4,845.
The borough experienced a decline in population in the 1950s and 1960s as the industrial jobs began to disappear. The population dropped to 3,845 in 1970.
In the late 1970s, the borough began to experience a resurgence as new businesses moved into the area. The population has been steadily increasing since then and is now estimated to be around 4,500.
Geography
East Vandergrift Borough is located in Westmoreland County, Pennsylvania. It is situated in the Allegheny Valley, approximately 25 miles northeast of Pittsburgh. The borough is bordered by the boroughs of Hyde Park, Apollo, and Vandergrift, as well as the townships of Washington and East Huntingdon.
The borough covers an area of 1.2 square miles and is located at an elevation of 1,000 feet. The terrain is mostly flat, with some rolling hills. The borough is located in the humid continental climate zone, with hot summers and cold winters.
Economy
The economy of East Vandergrift Borough is largely based on manufacturing and retail. The borough is home to several manufacturing companies, including the Pittsburgh Plate Glass Company, the American Sheet and Tin Plate Company, and the East Vandergrift Foundry.
The borough also has a number of retail businesses, including grocery stores, restaurants, and clothing stores. The borough is also home to a number of small businesses, including auto repair shops, beauty salons, and florists.
Demographics
As of the 2010 census, the population of East Vandergrift Borough was 4,541. The racial makeup of the borough was 97.3% White, 0.7% African American, 0.2% Native American, 0.3% Asian, 0.1% Pacific Islander, 0.4% from other races, and 1.0% from two or more races. Hispanic or Latino of any race were 1.2% of the population.
The median household income in the borough was $37,917, and the median family income was $45,938. The per capita income was $19,945. About 11.3% of families and 14.2% of the population were below the poverty line, including 22.2% of those under age 18 and 8.2% of those age 65 or over.
Common Questions
What is Per Capita Income in East Vandergrift borough?
Per Capita income in East Vandergrift borough is $26,528.
What is the Median Family Income in East Vandergrift borough?
Median Family Income in East Vandergrift borough is $56,776.
What is the Median Household income in East Vandergrift borough?
Median Household Income in East Vandergrift borough is $53,650.
What is Income or Wage Gap in East Vandergrift borough?
Income or Wage Gap in East Vandergrift borough is 30.2%.
Women in East Vandergrift borough earn 69.8 cents for every dollar earned by a man.
What is Inequality or Gini Index in East Vandergrift borough?
Inequality or Gini Index in East Vandergrift borough is 0.34.
What is the Total Population of East Vandergrift borough?
Total Population of East Vandergrift borough is 701.
What is the Total Male Population of East Vandergrift borough?
Total Male Population of East Vandergrift borough is 378.
What is the Total Female Population of East Vandergrift borough?
Total Female Population of East Vandergrift borough is 323.
What is the Ratio of Males per 100 Females in East Vandergrift borough?
There are 117.03 Males per 100 Females in East Vandergrift borough.
What is the Ratio of Females per 100 Males in East Vandergrift borough?
There are 85.45 Females per 100 Males in East Vandergrift borough.
What is the Median Population Age in East Vandergrift borough?
Median Population Age in East Vandergrift borough is 45.6 Years.
What is the Average Family Size in East Vandergrift borough
Average Family Size in East Vandergrift borough is 2.8 People.
What is the Average Household Size in East Vandergrift borough
Average Household Size in East Vandergrift borough is 2.2 People.
How Large is the Labor Force in East Vandergrift borough?
There are 399 People in the Labor Forcein in East Vandergrift borough.
What is the Percentage of People in the Labor Force in East Vandergrift borough?
68.1% of People are in the Labor Force in East Vandergrift borough.
What is the Unemployment Rate in East Vandergrift borough?
Unemployment Rate in East Vandergrift borough is 3.5%.