Zip Codes with the Highest Percentage of Population with a Degree in Science and Engineering in Butler, PA
RELATED REPORTS & OPTIONS
Science and Engineering
Butler
Compare Zip Codes
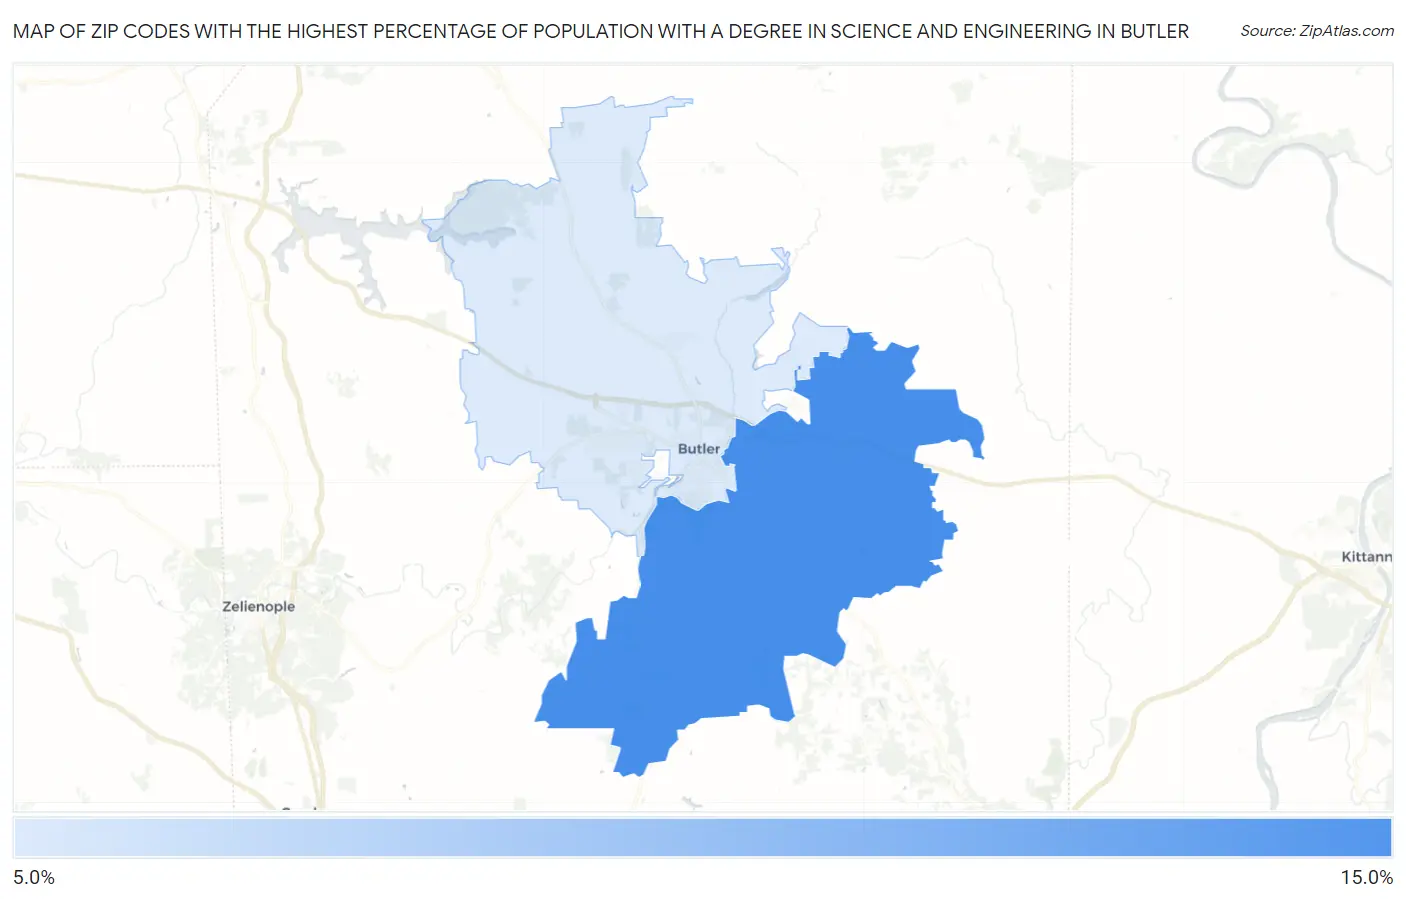
Map of Zip Codes with the Highest Percentage of Population with a Degree in Science and Engineering in Butler
12.3%
13.5%
Zip Codes with the Highest Percentage of Population with a Degree in Science and Engineering in Butler, PA
| Zip Code | % Graduates | vs State | vs National | |
| 1. | 16002 | 13.5% | 10.9%(+2.63)#609 | 9.8%(+3.71)#8,507 |
| 2. | 16001 | 12.3% | 10.9%(+1.47)#708 | 9.8%(+2.55)#10,301 |
1
Common Questions
What are the Top Zip Codes with the Highest Percentage of Population with a Degree in Science and Engineering in Butler, PA?
Top Zip Codes with the Highest Percentage of Population with a Degree in Science and Engineering in Butler, PA are:
What zip code has the Highest Percentage of Population with a Degree in Science and Engineering in Butler, PA?
16002 has the Highest Percentage of Population with a Degree in Science and Engineering in Butler, PA with 13.5%.
What is the Percentage of Population with a Degree in Science and Engineering in Butler, PA?
Percentage of Population with a Degree in Science and Engineering in Butler is 9.0%.
What is the Percentage of Population with a Degree in Science and Engineering in Pennsylvania?
Percentage of Population with a Degree in Science and Engineering in Pennsylvania is 10.9%.
What is the Percentage of Population with a Degree in Science and Engineering in the United States?
Percentage of Population with a Degree in Science and Engineering in the United States is 9.8%.