Buck Run, PA Map & Demographics
Buck Run Map
Buck Run Overview
$32,947
PER CAPITA INCOME
$57,500
AVG FAMILY INCOME
$57,167
AVG HOUSEHOLD INCOME
35.2%
WAGE / INCOME GAP [ % ]
64.8¢/ $1
WAGE / INCOME GAP [ $ ]
0.38
INEQUALITY / GINI INDEX
206
TOTAL POPULATION
96
MALE POPULATION
110
FEMALE POPULATION
87.27
MALES / 100 FEMALES
114.58
FEMALES / 100 MALES
42.3
MEDIAN AGE
3.1
AVG FAMILY SIZE
2.5
AVG HOUSEHOLD SIZE
76
LABOR FORCE [ PEOPLE ]
48.4%
PERCENT IN LABOR FORCE
11.8%
UNEMPLOYMENT RATE
Income in Buck Run
Income Overview in Buck Run
Per Capita Income in Buck Run is $32,947, while median incomes of families and households are $57,500 and $57,167 respectively.
| Characteristic | Number | Measure |
| Per Capita Income | 206 | $32,947 |
| Median Family Income | 56 | $57,500 |
| Mean Family Income | 56 | $96,329 |
| Median Household Income | 82 | $57,167 |
| Mean Household Income | 82 | $85,062 |
| Income Deficit | 56 | $0 |
| Wage / Income Gap (%) | 206 | 35.17% |
| Wage / Income Gap ($) | 206 | 64.83¢ per $1 |
| Gini / Inequality Index | 206 | 0.38 |
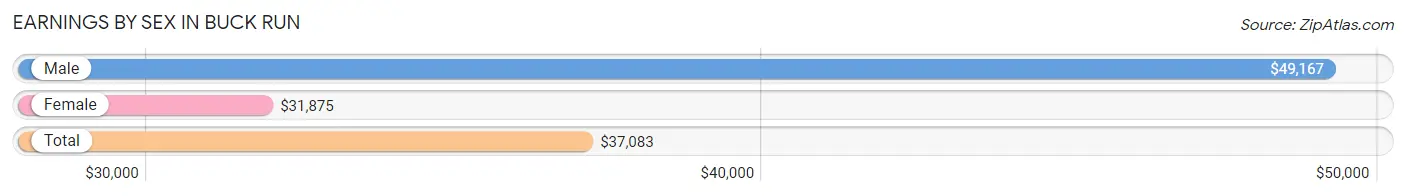
Earnings by Sex in Buck Run
Average Earnings in Buck Run are $37,083, $49,167 for men and $31,875 for women, a difference of 35.2%.
| Sex | Number | Average Earnings |
| Male | 36 (45.6%) | $49,167 |
| Female | 43 (54.4%) | $31,875 |
| Total | 79 (100.0%) | $37,083 |
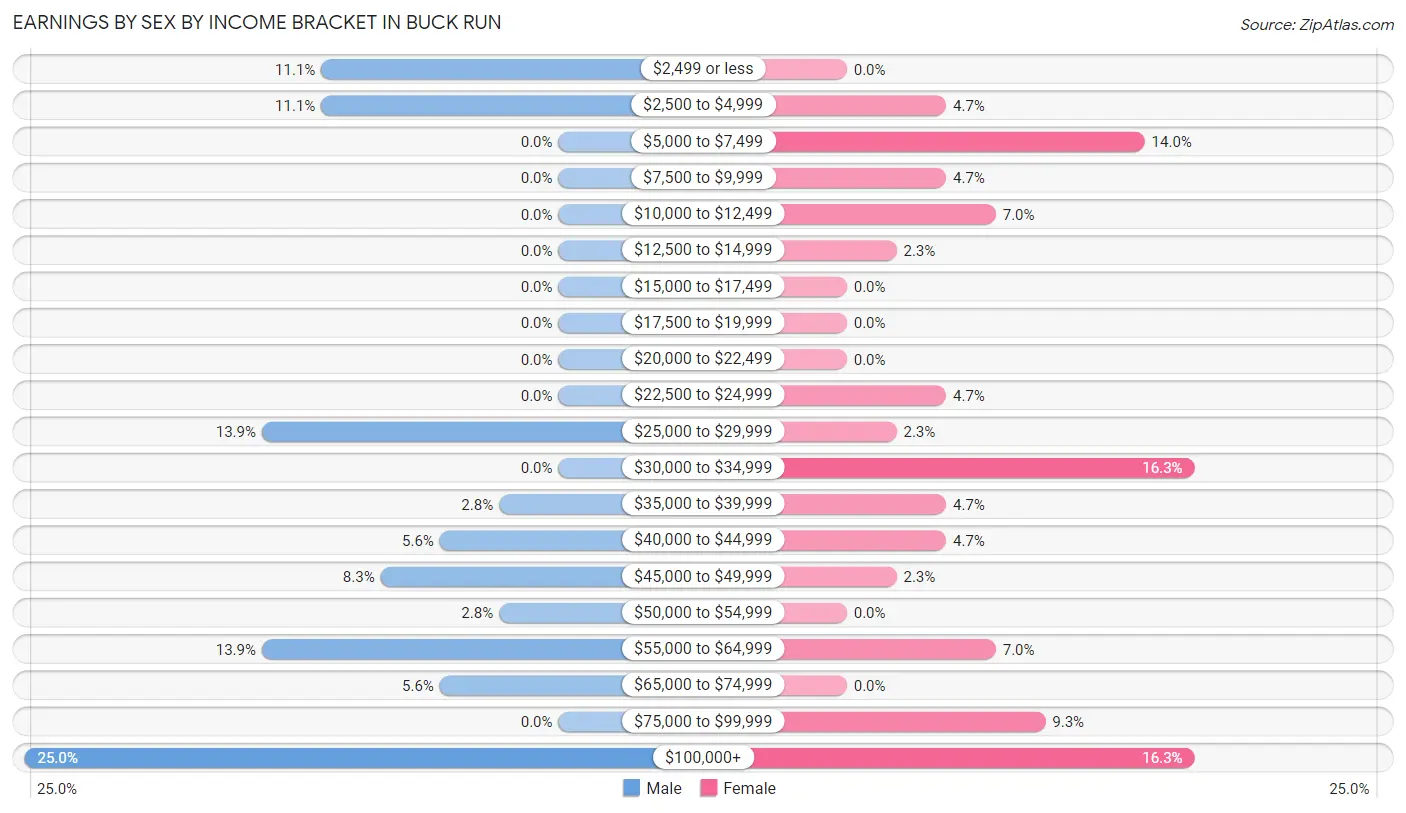
Earnings by Sex by Income Bracket in Buck Run
The most common earnings brackets in Buck Run are $100,000+ for men (9 | 25.0%) and $30,000 to $34,999 for women (7 | 16.3%).
| Income | Male | Female |
| $2,499 or less | 4 (11.1%) | 0 (0.0%) |
| $2,500 to $4,999 | 4 (11.1%) | 2 (4.6%) |
| $5,000 to $7,499 | 0 (0.0%) | 6 (14.0%) |
| $7,500 to $9,999 | 0 (0.0%) | 2 (4.6%) |
| $10,000 to $12,499 | 0 (0.0%) | 3 (7.0%) |
| $12,500 to $14,999 | 0 (0.0%) | 1 (2.3%) |
| $15,000 to $17,499 | 0 (0.0%) | 0 (0.0%) |
| $17,500 to $19,999 | 0 (0.0%) | 0 (0.0%) |
| $20,000 to $22,499 | 0 (0.0%) | 0 (0.0%) |
| $22,500 to $24,999 | 0 (0.0%) | 2 (4.6%) |
| $25,000 to $29,999 | 5 (13.9%) | 1 (2.3%) |
| $30,000 to $34,999 | 0 (0.0%) | 7 (16.3%) |
| $35,000 to $39,999 | 1 (2.8%) | 2 (4.6%) |
| $40,000 to $44,999 | 2 (5.6%) | 2 (4.6%) |
| $45,000 to $49,999 | 3 (8.3%) | 1 (2.3%) |
| $50,000 to $54,999 | 1 (2.8%) | 0 (0.0%) |
| $55,000 to $64,999 | 5 (13.9%) | 3 (7.0%) |
| $65,000 to $74,999 | 2 (5.6%) | 0 (0.0%) |
| $75,000 to $99,999 | 0 (0.0%) | 4 (9.3%) |
| $100,000+ | 9 (25.0%) | 7 (16.3%) |
| Total | 36 (100.0%) | 43 (100.0%) |
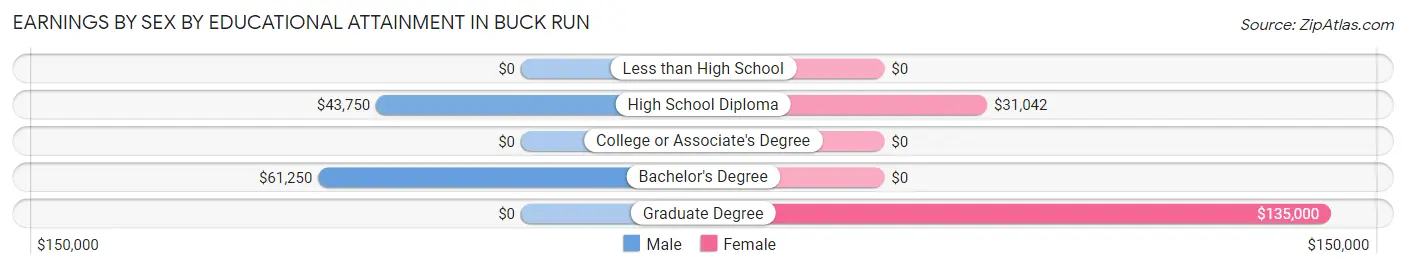
Earnings by Sex by Educational Attainment in Buck Run
Average earnings in Buck Run are $50,000 for men and $35,625 for women, a difference of 28.7%. Men with an educational attainment of bachelor's degree enjoy the highest average annual earnings of $61,250, while those with high school diploma education earn the least with $43,750. Women with an educational attainment of graduate degree earn the most with the average annual earnings of $135,000, while those with high school diploma education have the smallest earnings of $31,042.
| Educational Attainment | Male Income | Female Income |
| Less than High School | - | - |
| High School Diploma | $43,750 | $31,042 |
| College or Associate's Degree | - | - |
| Bachelor's Degree | $61,250 | $0 |
| Graduate Degree | - | - |
| Total | $50,000 | $35,625 |
Family Income in Buck Run
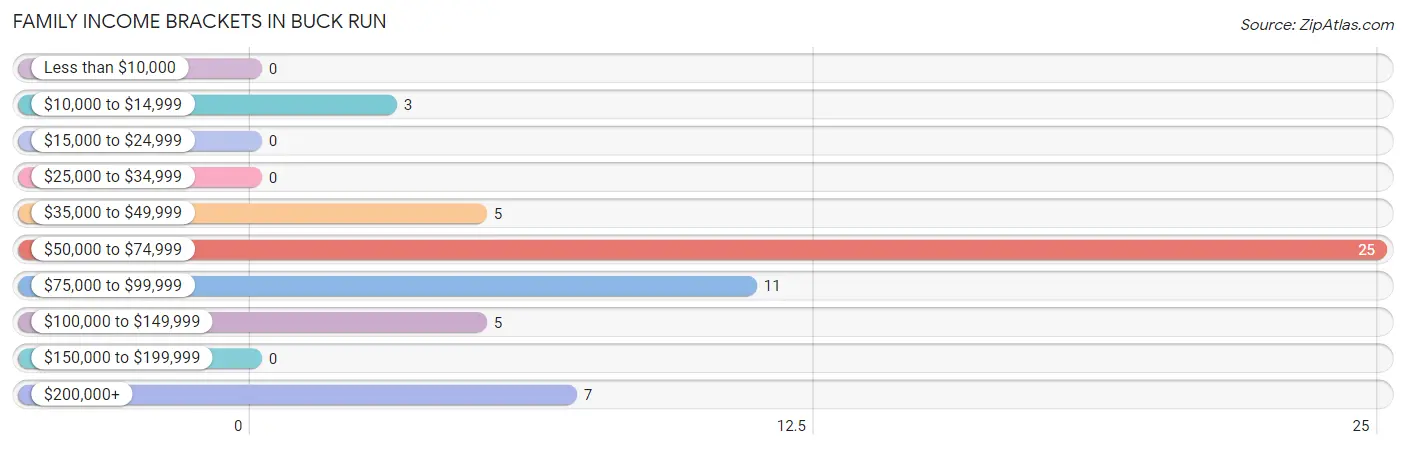
Family Income Brackets in Buck Run
According to the Buck Run family income data, there are 25 families falling into the $50,000 to $74,999 income range, which is the most common income bracket and makes up 44.6% of all families.
| Income Bracket | # Families | % Families |
| Less than $10,000 | 0 | 0.0% |
| $10,000 to $14,999 | 3 | 5.4% |
| $15,000 to $24,999 | 0 | 0.0% |
| $25,000 to $34,999 | 0 | 0.0% |
| $35,000 to $49,999 | 5 | 8.9% |
| $50,000 to $74,999 | 25 | 44.6% |
| $75,000 to $99,999 | 11 | 19.6% |
| $100,000 to $149,999 | 5 | 8.9% |
| $150,000 to $199,999 | 0 | 0.0% |
| $200,000+ | 7 | 12.5% |
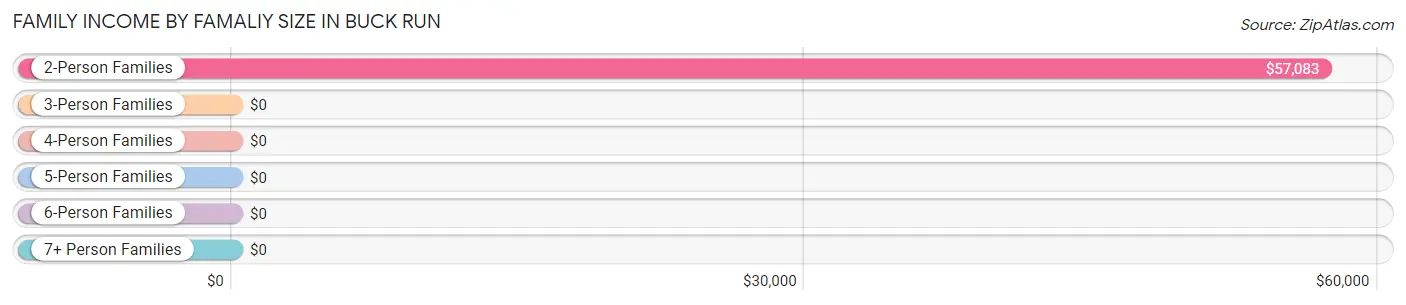
Family Income by Famaliy Size in Buck Run
2-person families (31 | 55.4%) account for the highest median family income in Buck Run with $57,083 per family, while 2-person families (31 | 55.4%) have the highest median income of $28,542 per family member.
| Income Bracket | # Families | Median Income |
| 2-Person Families | 31 (55.4%) | $57,083 |
| 3-Person Families | 8 (14.3%) | $0 |
| 4-Person Families | 8 (14.3%) | $0 |
| 5-Person Families | 7 (12.5%) | $0 |
| 6-Person Families | 0 (0.0%) | $0 |
| 7+ Person Families | 2 (3.6%) | $0 |
| Total | 56 (100.0%) | $57,500 |
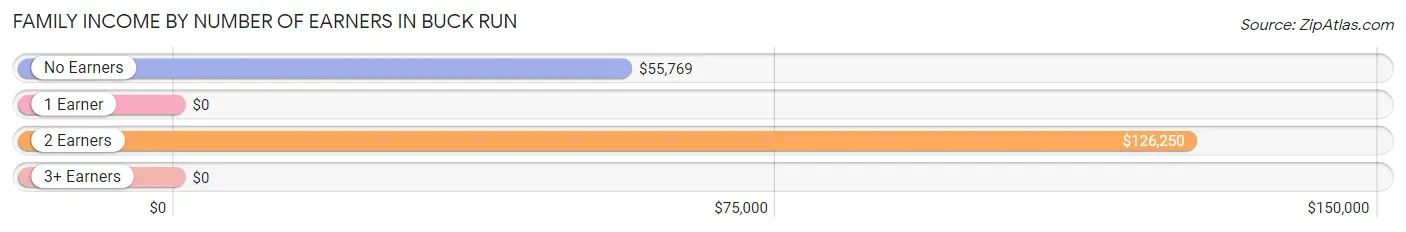
Family Income by Number of Earners in Buck Run
| Number of Earners | # Families | Median Income |
| No Earners | 22 (39.3%) | $55,769 |
| 1 Earner | 15 (26.8%) | $0 |
| 2 Earners | 15 (26.8%) | $126,250 |
| 3+ Earners | 4 (7.1%) | $0 |
| Total | 56 (100.0%) | $57,500 |
Household Income in Buck Run
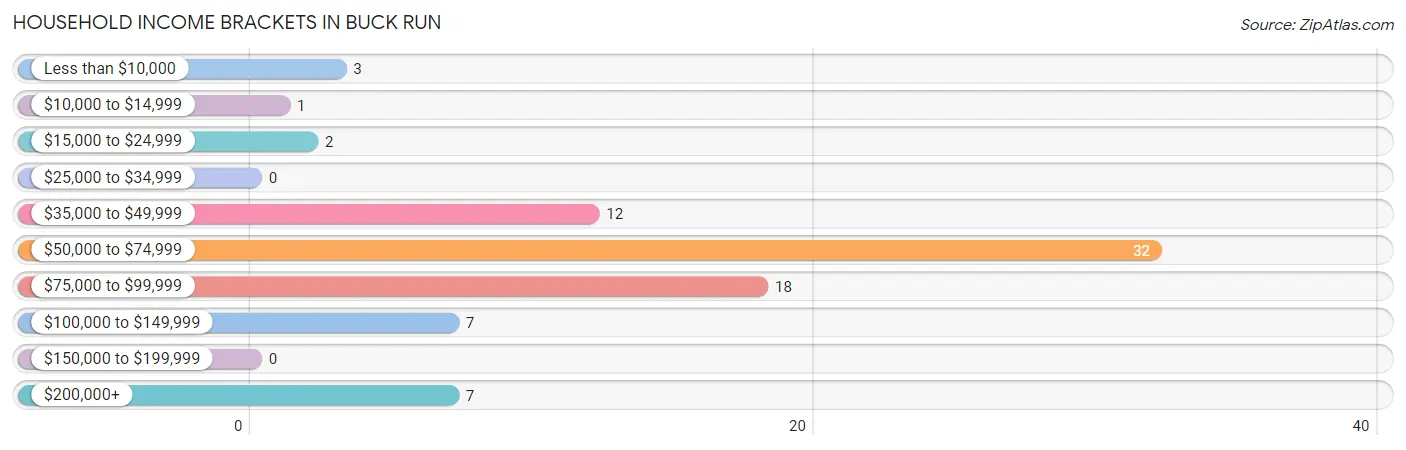
Household Income Brackets in Buck Run
With 32 households falling in the category, the $50,000 to $74,999 income range is the most frequent in Buck Run, accounting for 39.0% of all households.
| Income Bracket | # Households | % Households |
| Less than $10,000 | 3 | 3.7% |
| $10,000 to $14,999 | 1 | 1.2% |
| $15,000 to $24,999 | 2 | 2.4% |
| $25,000 to $34,999 | 0 | 0.0% |
| $35,000 to $49,999 | 12 | 14.6% |
| $50,000 to $74,999 | 32 | 39.0% |
| $75,000 to $99,999 | 18 | 22.0% |
| $100,000 to $149,999 | 7 | 8.5% |
| $150,000 to $199,999 | 0 | 0.0% |
| $200,000+ | 7 | 8.5% |
Household Income by Householder Age in Buck Run
The median household income in Buck Run is $57,167, with the highest median household income of $96,111 found in the 25 to 44 years age bracket for the primary householder. A total of 20 households (24.4%) fall into this category.
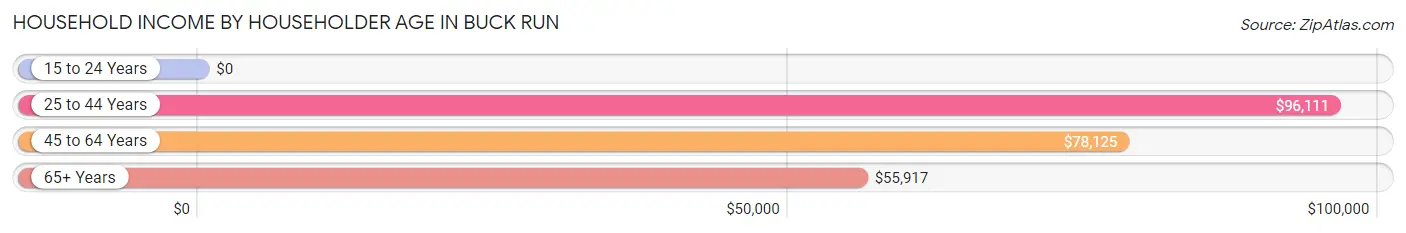
| Income Bracket | # Households | Median Income |
| 15 to 24 Years | 0 (0.0%) | $0 |
| 25 to 44 Years | 20 (24.4%) | $96,111 |
| 45 to 64 Years | 27 (32.9%) | $78,125 |
| 65+ Years | 35 (42.7%) | $55,917 |
| Total | 82 (100.0%) | $57,167 |
Poverty in Buck Run
Income Below Poverty by Sex and Age in Buck Run
With 5.2% poverty level for males and 11.8% for females among the residents of Buck Run, 5 year old males and 25 to 34 year old females are the most vulnerable to poverty, with 4 males (100.0%) and 4 females (80.0%) in their respective age groups living below the poverty level.
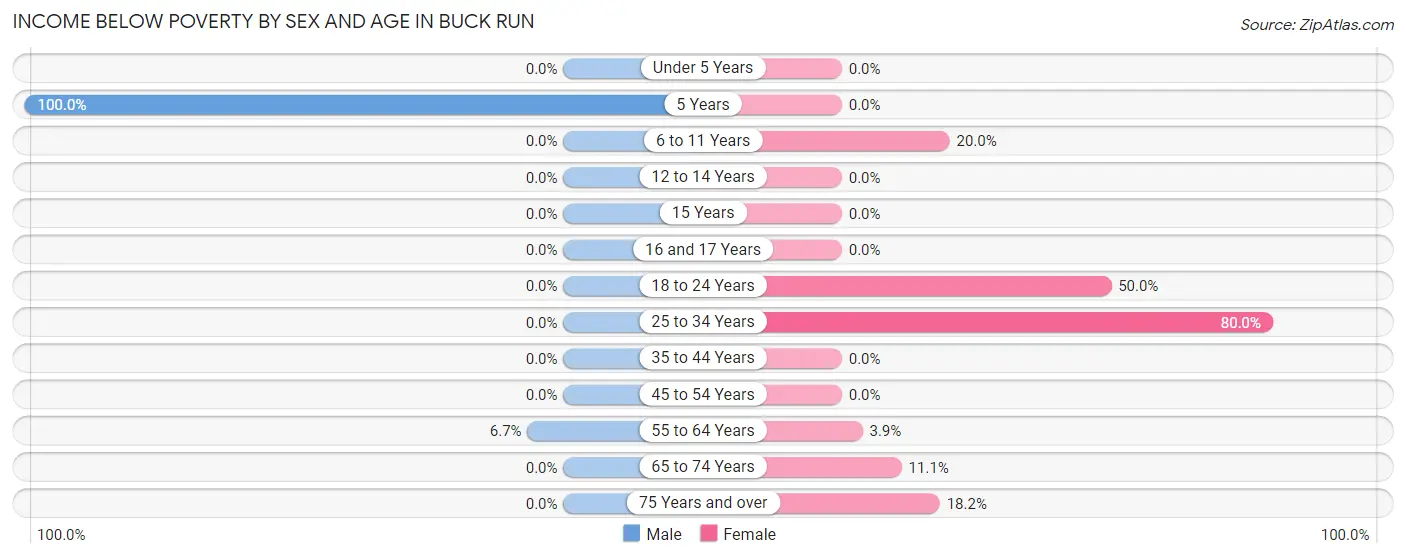
| Age Bracket | Male | Female |
| Under 5 Years | 0 (0.0%) | 0 (0.0%) |
| 5 Years | 4 (100.0%) | 0 (0.0%) |
| 6 to 11 Years | 0 (0.0%) | 3 (20.0%) |
| 12 to 14 Years | 0 (0.0%) | 0 (0.0%) |
| 15 Years | 0 (0.0%) | 0 (0.0%) |
| 16 and 17 Years | 0 (0.0%) | 0 (0.0%) |
| 18 to 24 Years | 0 (0.0%) | 2 (50.0%) |
| 25 to 34 Years | 0 (0.0%) | 4 (80.0%) |
| 35 to 44 Years | 0 (0.0%) | 0 (0.0%) |
| 45 to 54 Years | 0 (0.0%) | 0 (0.0%) |
| 55 to 64 Years | 1 (6.7%) | 1 (3.8%) |
| 65 to 74 Years | 0 (0.0%) | 1 (11.1%) |
| 75 Years and over | 0 (0.0%) | 2 (18.2%) |
| Total | 5 (5.2%) | 13 (11.8%) |
Income Above Poverty by Sex and Age in Buck Run
According to the poverty statistics in Buck Run, males aged under 5 years and females aged 12 to 14 years are the age groups that are most secure financially, with 100.0% of males and 100.0% of females in these age groups living above the poverty line.
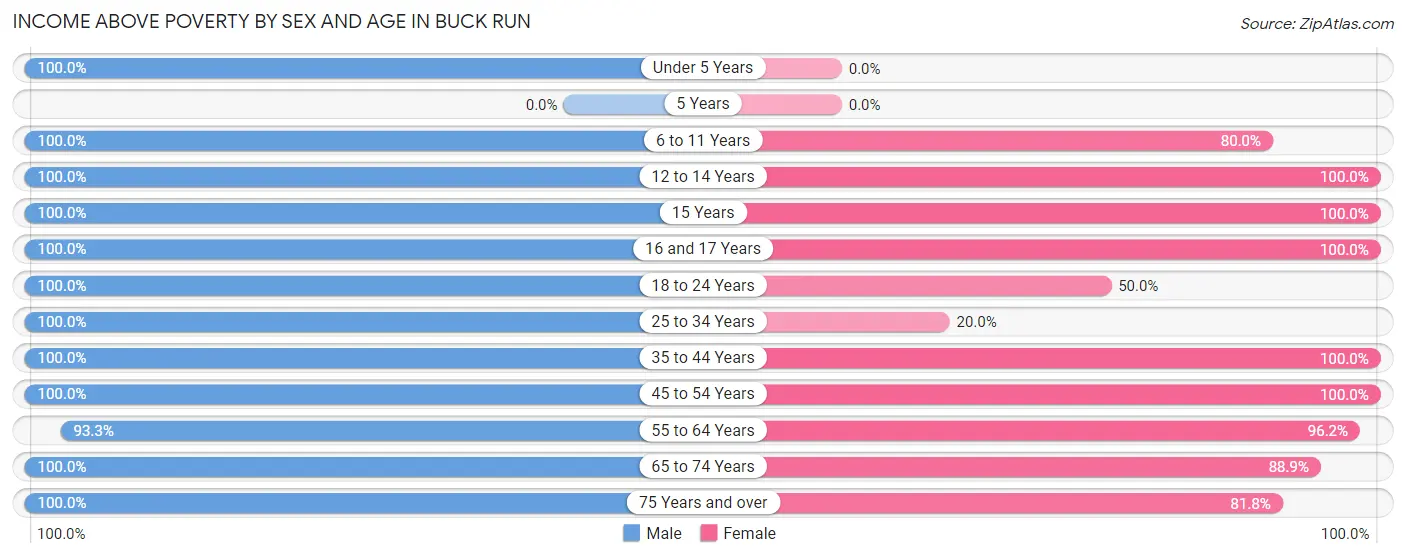
| Age Bracket | Male | Female |
| Under 5 Years | 5 (100.0%) | 0 (0.0%) |
| 5 Years | 0 (0.0%) | 0 (0.0%) |
| 6 to 11 Years | 8 (100.0%) | 12 (80.0%) |
| 12 to 14 Years | 3 (100.0%) | 10 (100.0%) |
| 15 Years | 2 (100.0%) | 2 (100.0%) |
| 16 and 17 Years | 3 (100.0%) | 2 (100.0%) |
| 18 to 24 Years | 5 (100.0%) | 2 (50.0%) |
| 25 to 34 Years | 10 (100.0%) | 1 (20.0%) |
| 35 to 44 Years | 12 (100.0%) | 17 (100.0%) |
| 45 to 54 Years | 3 (100.0%) | 9 (100.0%) |
| 55 to 64 Years | 14 (93.3%) | 25 (96.2%) |
| 65 to 74 Years | 23 (100.0%) | 8 (88.9%) |
| 75 Years and over | 3 (100.0%) | 9 (81.8%) |
| Total | 91 (94.8%) | 97 (88.2%) |
Income Below Poverty Among Married-Couple Families in Buck Run
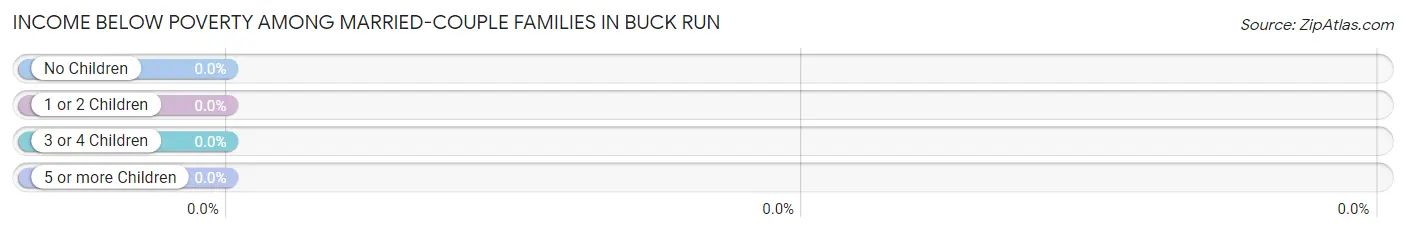
| Children | Above Poverty | Below Poverty |
| No Children | 28 (100.0%) | 0 (0.0%) |
| 1 or 2 Children | 10 (100.0%) | 0 (0.0%) |
| 3 or 4 Children | 7 (100.0%) | 0 (0.0%) |
| 5 or more Children | 0 (0.0%) | 0 (0.0%) |
| Total | 45 (100.0%) | 0 (0.0%) |
Income Below Poverty Among Single-Parent Households in Buck Run
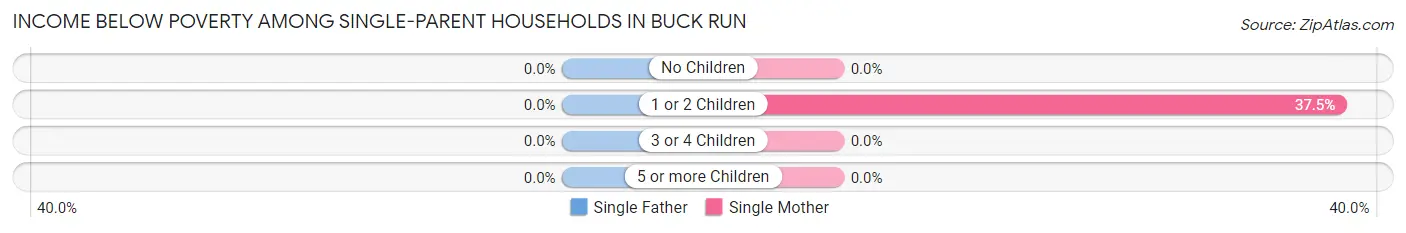
| Children | Single Father | Single Mother |
| No Children | 0 (0.0%) | 0 (0.0%) |
| 1 or 2 Children | 0 (0.0%) | 3 (37.5%) |
| 3 or 4 Children | 0 (0.0%) | 0 (0.0%) |
| 5 or more Children | 0 (0.0%) | 0 (0.0%) |
| Total | 0 (0.0%) | 3 (27.3%) |
Income Below Poverty Among Married-Couple vs Single-Parent Households in Buck Run
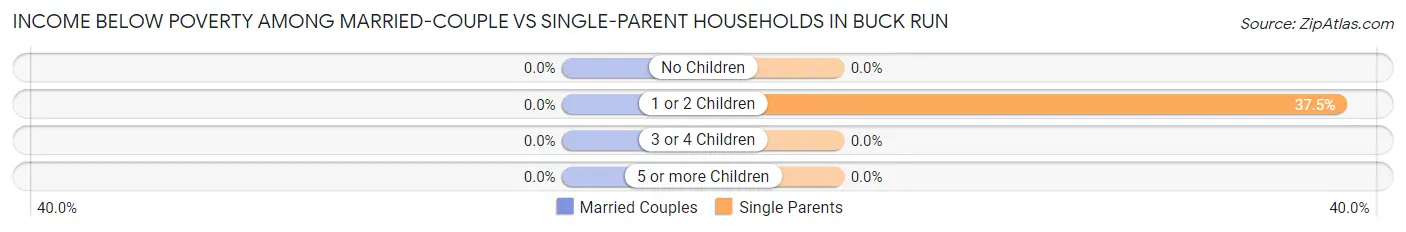
| Children | Married-Couple Families | Single-Parent Households |
| No Children | 0 (0.0%) | 0 (0.0%) |
| 1 or 2 Children | 0 (0.0%) | 3 (37.5%) |
| 3 or 4 Children | 0 (0.0%) | 0 (0.0%) |
| 5 or more Children | 0 (0.0%) | 0 (0.0%) |
| Total | 0 (0.0%) | 3 (27.3%) |
Race in Buck Run
The most populous races in Buck Run are White / Caucasian (203 | 98.5%), and Two or more Races (3 | 1.5%).
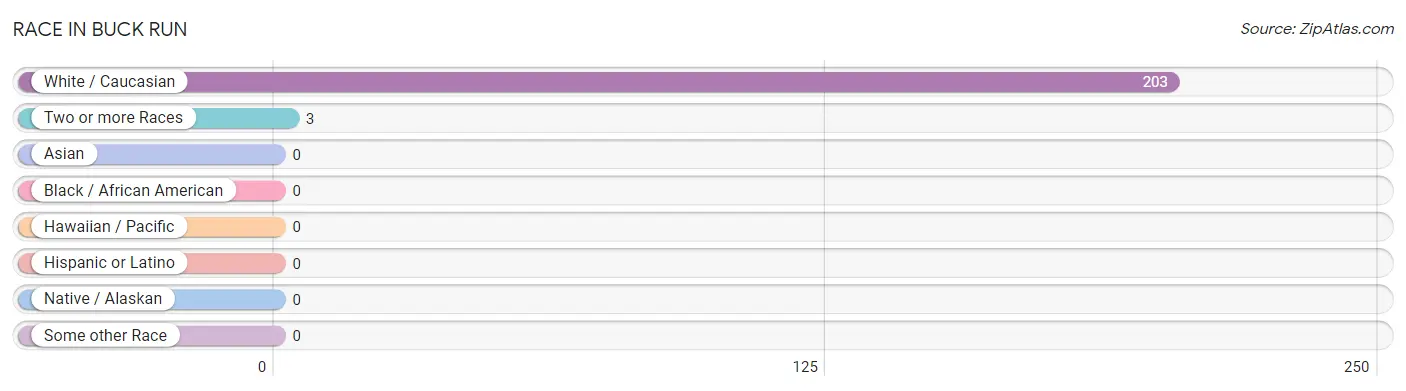
| Race | # Population | % Population |
| Asian | 0 | 0.0% |
| Black / African American | 0 | 0.0% |
| Hawaiian / Pacific | 0 | 0.0% |
| Hispanic or Latino | 0 | 0.0% |
| Native / Alaskan | 0 | 0.0% |
| White / Caucasian | 203 | 98.5% |
| Two or more Races | 3 | 1.5% |
| Some other Race | 0 | 0.0% |
| Total | 206 | 100.0% |
Ancestry in Buck Run
The most populous ancestries reported in Buck Run are Irish (64 | 31.1%), Polish (38 | 18.4%), German (32 | 15.5%), Italian (19 | 9.2%), and Dutch (18 | 8.7%), together accounting for 83.0% of all Buck Run residents.
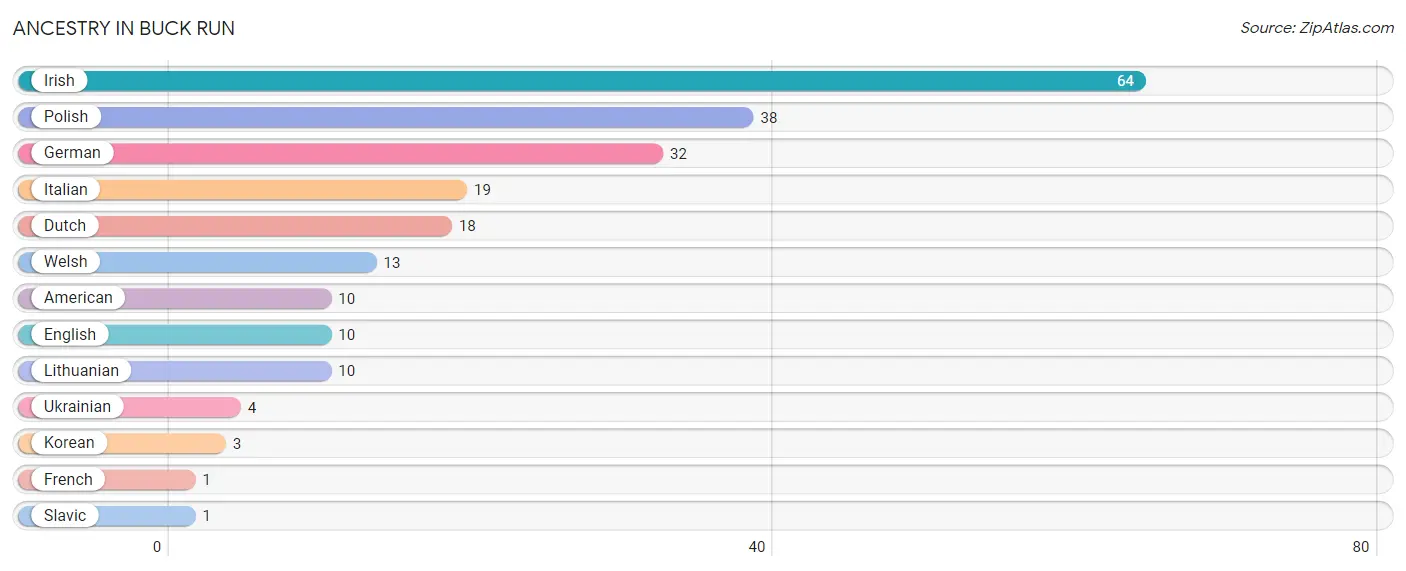
| Ancestry | # Population | % Population |
| American | 10 | 4.9% |
| Dutch | 18 | 8.7% |
| English | 10 | 4.9% |
| French | 1 | 0.5% |
| German | 32 | 15.5% |
| Irish | 64 | 31.1% |
| Italian | 19 | 9.2% |
| Korean | 3 | 1.5% |
| Lithuanian | 10 | 4.9% |
| Polish | 38 | 18.4% |
| Slavic | 1 | 0.5% |
| Ukrainian | 4 | 1.9% |
| Welsh | 13 | 6.3% | View All 13 Rows |
Immigrants in Buck Run
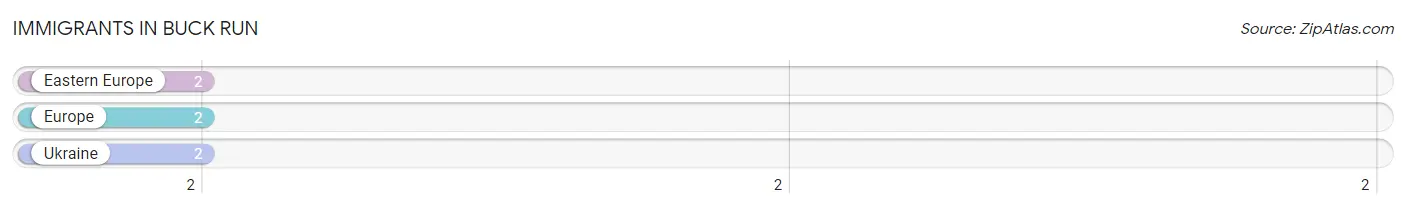
The most numerous immigrant groups reported in Buck Run came from Eastern Europe (2 | 1.0%), Europe (2 | 1.0%), and Ukraine (2 | 1.0%), together accounting for 2.9% of all Buck Run residents.
| Immigration Origin | # Population | % Population |
| Eastern Europe | 2 | 1.0% |
| Europe | 2 | 1.0% |
| Ukraine | 2 | 1.0% | View All 3 Rows |
Sex and Age in Buck Run
Sex and Age in Buck Run
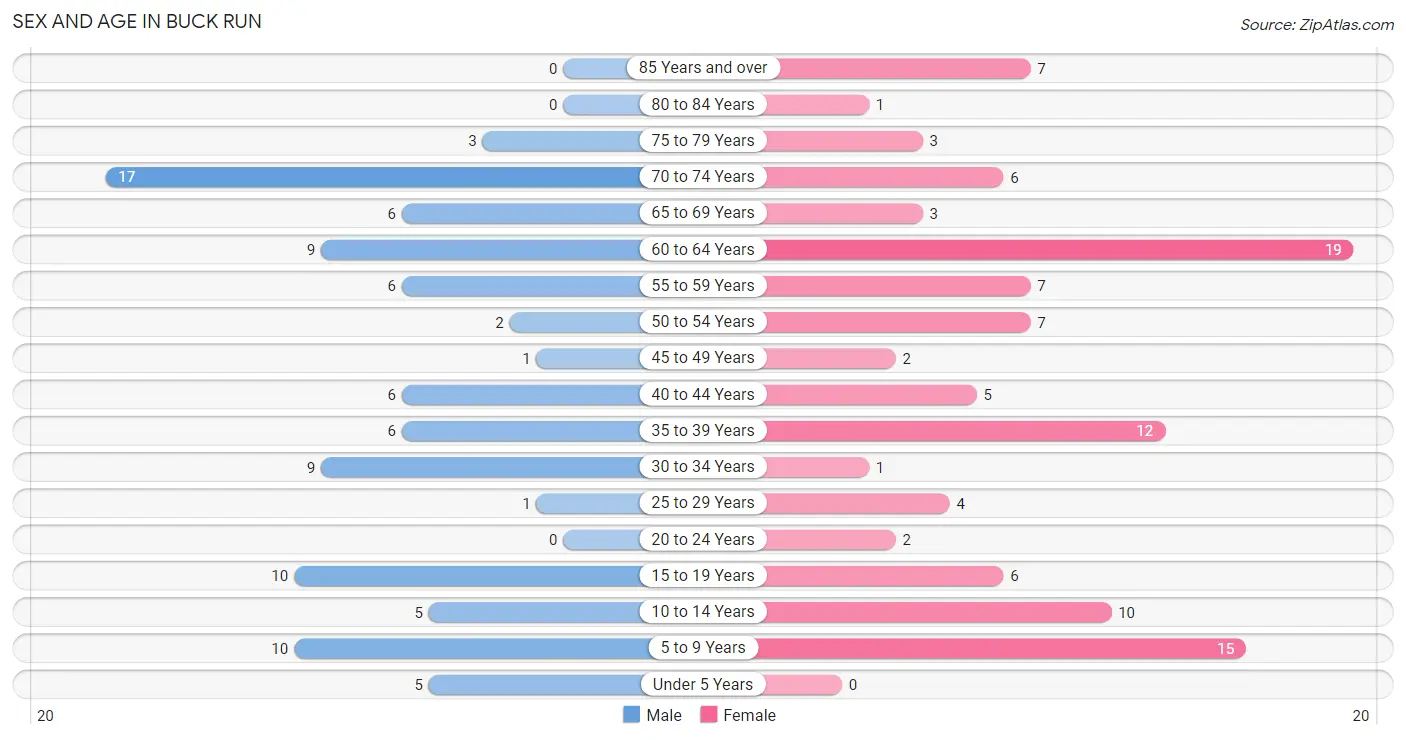
The most populous age groups in Buck Run are 70 to 74 Years (17 | 17.7%) for men and 60 to 64 Years (19 | 17.3%) for women.
| Age Bracket | Male | Female |
| Under 5 Years | 5 (5.2%) | 0 (0.0%) |
| 5 to 9 Years | 10 (10.4%) | 15 (13.6%) |
| 10 to 14 Years | 5 (5.2%) | 10 (9.1%) |
| 15 to 19 Years | 10 (10.4%) | 6 (5.4%) |
| 20 to 24 Years | 0 (0.0%) | 2 (1.8%) |
| 25 to 29 Years | 1 (1.0%) | 4 (3.6%) |
| 30 to 34 Years | 9 (9.4%) | 1 (0.9%) |
| 35 to 39 Years | 6 (6.2%) | 12 (10.9%) |
| 40 to 44 Years | 6 (6.2%) | 5 (4.5%) |
| 45 to 49 Years | 1 (1.0%) | 2 (1.8%) |
| 50 to 54 Years | 2 (2.1%) | 7 (6.4%) |
| 55 to 59 Years | 6 (6.2%) | 7 (6.4%) |
| 60 to 64 Years | 9 (9.4%) | 19 (17.3%) |
| 65 to 69 Years | 6 (6.2%) | 3 (2.7%) |
| 70 to 74 Years | 17 (17.7%) | 6 (5.4%) |
| 75 to 79 Years | 3 (3.1%) | 3 (2.7%) |
| 80 to 84 Years | 0 (0.0%) | 1 (0.9%) |
| 85 Years and over | 0 (0.0%) | 7 (6.4%) |
| Total | 96 (100.0%) | 110 (100.0%) |
Families and Households in Buck Run
Median Family Size in Buck Run
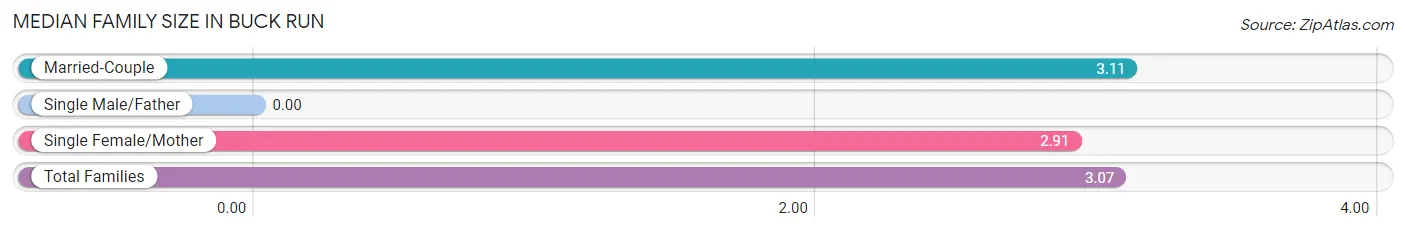
| Family Type | # Families | Family Size |
| Married-Couple | 45 (80.4%) | 3.11 |
| Single Male/Father | 0 (0.0%) | - |
| Single Female/Mother | 11 (19.6%) | 2.91 |
| Total Families | 56 (100.0%) | 3.07 |
Median Household Size in Buck Run
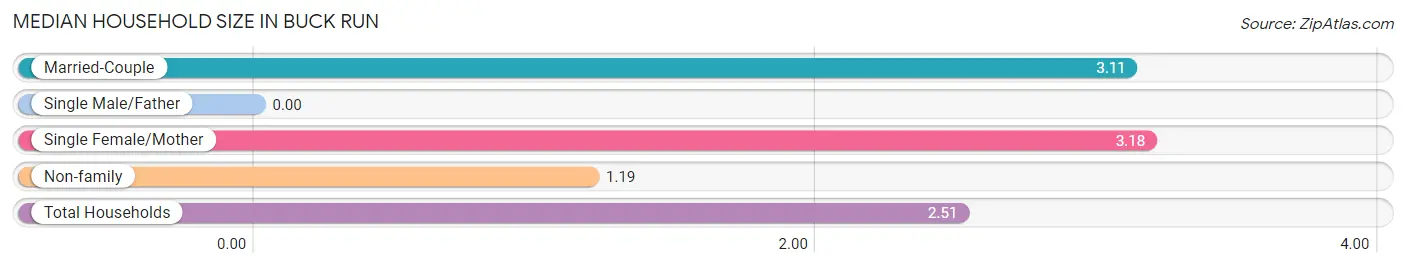
| Household Type | # Households | Household Size |
| Married-Couple | 45 (54.9%) | 3.11 |
| Single Male/Father | 0 (0.0%) | - |
| Single Female/Mother | 11 (13.4%) | 3.18 |
| Non-family | 26 (31.7%) | 1.19 |
| Total Households | 82 (100.0%) | 2.51 |
Household Size by Marriage Status in Buck Run
Out of a total of 82 households in Buck Run, 56 (68.3%) are family households, while 26 (31.7%) are nonfamily households. The most numerous type of family households are 2-person households, comprising 31, and the most common type of nonfamily households are 1-person households, comprising 21.
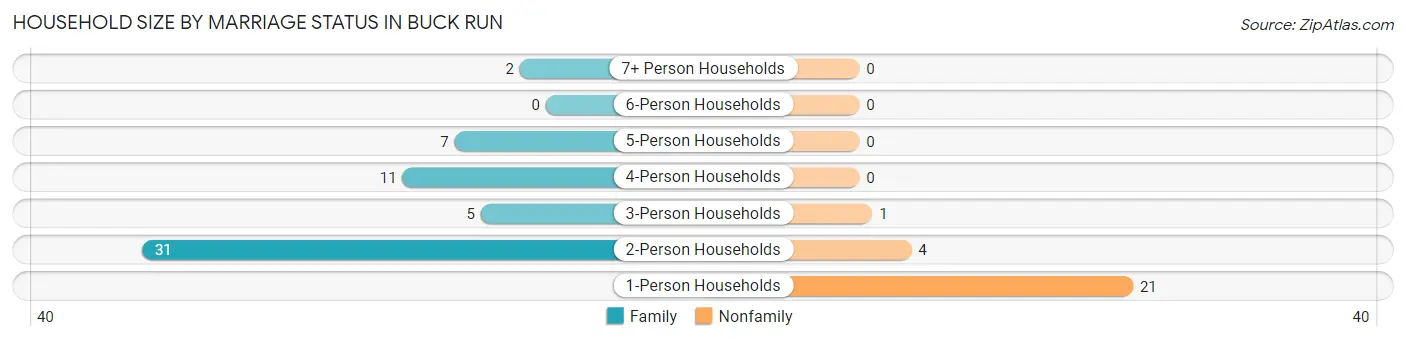
| Household Size | Family Households | Nonfamily Households |
| 1-Person Households | - | 21 (25.6%) |
| 2-Person Households | 31 (37.8%) | 4 (4.9%) |
| 3-Person Households | 5 (6.1%) | 1 (1.2%) |
| 4-Person Households | 11 (13.4%) | 0 (0.0%) |
| 5-Person Households | 7 (8.5%) | 0 (0.0%) |
| 6-Person Households | 0 (0.0%) | 0 (0.0%) |
| 7+ Person Households | 2 (2.4%) | 0 (0.0%) |
| Total | 56 (68.3%) | 26 (31.7%) |
Female Fertility in Buck Run
Fertility by Age in Buck Run
| Age Bracket | Women with Births | Births / 1,000 Women |
| 15 to 19 years | 0 (0.0%) | 0.0 |
| 20 to 34 years | 0 (0.0%) | 0.0 |
| 35 to 50 years | 0 (0.0%) | 0.0 |
| Total | 0 (0.0%) | 0.0 |
Fertility by Age by Marriage Status in Buck Run
| Age Bracket | Married | Unmarried |
| 15 to 19 years | 0 (0.0%) | 0 (0.0%) |
| 20 to 34 years | 0 (0.0%) | 0 (0.0%) |
| 35 to 50 years | 0 (0.0%) | 0 (0.0%) |
| Total | 0 (0.0%) | 0 (0.0%) |
Fertility by Education in Buck Run
| Educational Attainment | Women with Births | Births / 1,000 Women |
| Less than High School | 0 (0.0%) | 0.0 |
| High School Diploma | 0 (0.0%) | 0.0 |
| College or Associate's Degree | 0 (0.0%) | 0.0 |
| Bachelor's Degree | 0 (0.0%) | 0.0 |
| Graduate Degree | 0 (0.0%) | 0.0 |
| Total | 0 (0.0%) | 0.0 |
Fertility by Education by Marriage Status in Buck Run
| Educational Attainment | Married | Unmarried |
| Less than High School | 0 (0.0%) | 0 (0.0%) |
| High School Diploma | 0 (0.0%) | 0 (0.0%) |
| College or Associate's Degree | 0 (0.0%) | 0 (0.0%) |
| Bachelor's Degree | 0 (0.0%) | 0 (0.0%) |
| Graduate Degree | 0 (0.0%) | 0 (0.0%) |
| Total | 0 (0.0%) | 0 (0.0%) |
Employment Characteristics in Buck Run
Employment by Class of Employer in Buck Run
Among the 61 employed individuals in Buck Run, private company employees (28 | 45.9%), not-for-profit organizations (19 | 31.1%), and local government employees (5 | 8.2%) make up the most common classes of employment.
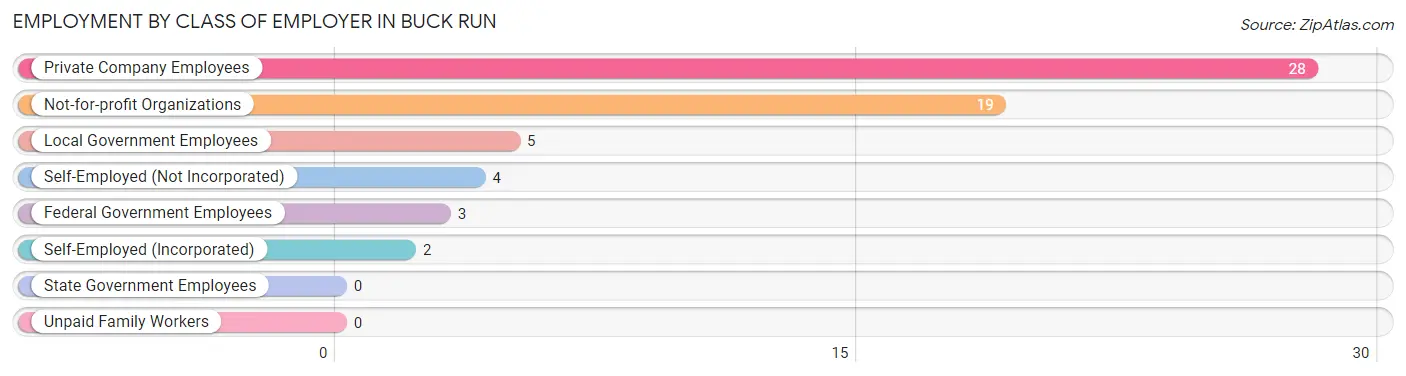
| Employer Class | # Employees | % Employees |
| Private Company Employees | 28 | 45.9% |
| Self-Employed (Incorporated) | 2 | 3.3% |
| Self-Employed (Not Incorporated) | 4 | 6.6% |
| Not-for-profit Organizations | 19 | 31.1% |
| Local Government Employees | 5 | 8.2% |
| State Government Employees | 0 | 0.0% |
| Federal Government Employees | 3 | 4.9% |
| Unpaid Family Workers | 0 | 0.0% |
| Total | 61 | 100.0% |
Employment Status by Age in Buck Run
According to the labor force statistics for Buck Run, out of the total population over 16 years of age (157), 48.4% or 76 individuals are in the labor force, with 11.8% or 9 of them unemployed. The age group with the highest labor force participation rate is 20 to 24 years, with 100.0% or 2 individuals in the labor force. Within the labor force, the 16 to 19 years age range has the highest percentage of unemployed individuals, with 50.0% or 2 of them being unemployed.
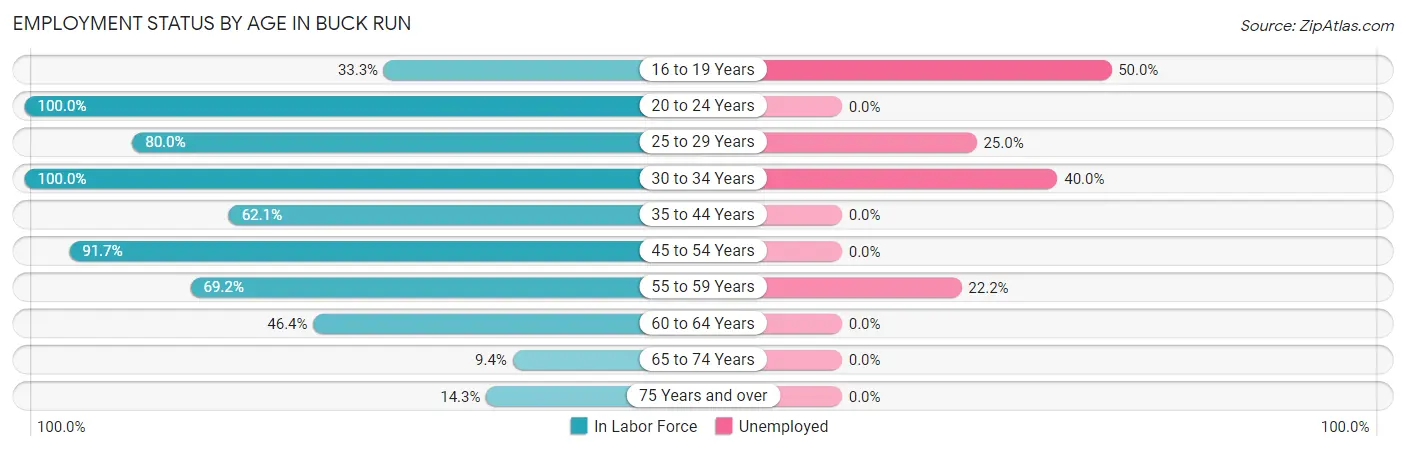
| Age Bracket | In Labor Force | Unemployed |
| 16 to 19 Years | 4 (33.3%) | 2 (50.0%) |
| 20 to 24 Years | 2 (100.0%) | 0 (0.0%) |
| 25 to 29 Years | 4 (80.0%) | 1 (25.0%) |
| 30 to 34 Years | 10 (100.0%) | 4 (40.0%) |
| 35 to 44 Years | 18 (62.1%) | 0 (0.0%) |
| 45 to 54 Years | 11 (91.7%) | 0 (0.0%) |
| 55 to 59 Years | 9 (69.2%) | 2 (22.2%) |
| 60 to 64 Years | 13 (46.4%) | 0 (0.0%) |
| 65 to 74 Years | 3 (9.4%) | 0 (0.0%) |
| 75 Years and over | 2 (14.3%) | 0 (0.0%) |
| Total | 76 (48.4%) | 9 (11.8%) |
Employment Status by Educational Attainment in Buck Run
According to labor force statistics for Buck Run, 67.0% of individuals (65) out of the total population between 25 and 64 years of age (97) are in the labor force, with 10.8% or 7 of them being unemployed. The group with the highest labor force participation rate are those with the educational attainment of bachelor's degree or higher, with 92.6% or 25 individuals in the labor force. Within the labor force, individuals with less than high school education have the highest percentage of unemployment, with 40.0% or 2 of them being unemployed.
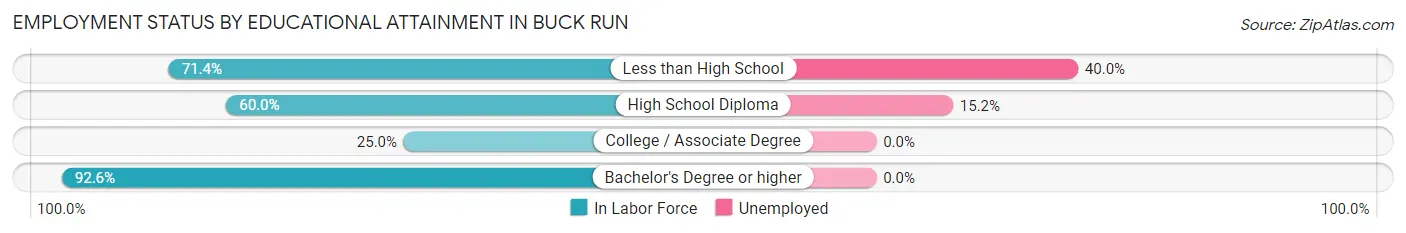
| Educational Attainment | In Labor Force | Unemployed |
| Less than High School | 5 (71.4%) | 3 (40.0%) |
| High School Diploma | 33 (60.0%) | 8 (15.2%) |
| College / Associate Degree | 2 (25.0%) | 0 (0.0%) |
| Bachelor's Degree or higher | 25 (92.6%) | 0 (0.0%) |
| Total | 65 (67.0%) | 10 (10.8%) |
Employment Occupations by Sex in Buck Run
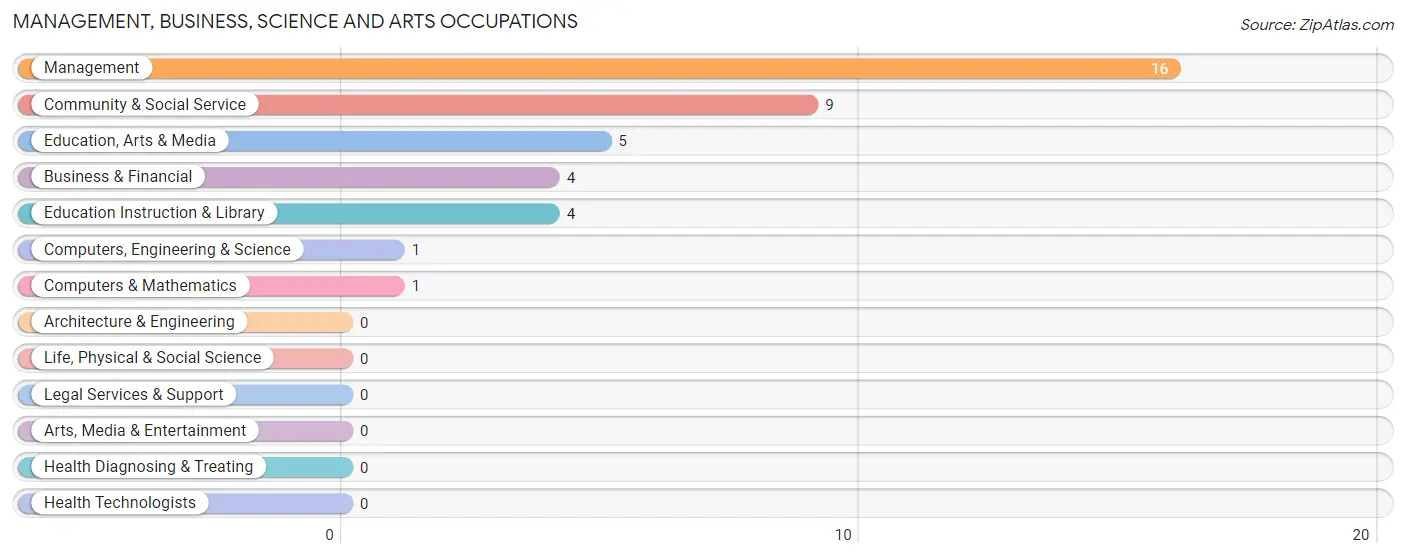
Management, Business, Science and Arts Occupations
The most common Management, Business, Science and Arts occupations in Buck Run are Management (16 | 23.9%), Community & Social Service (9 | 13.4%), Education, Arts & Media (5 | 7.5%), Business & Financial (4 | 6.0%), and Education Instruction & Library (4 | 6.0%).
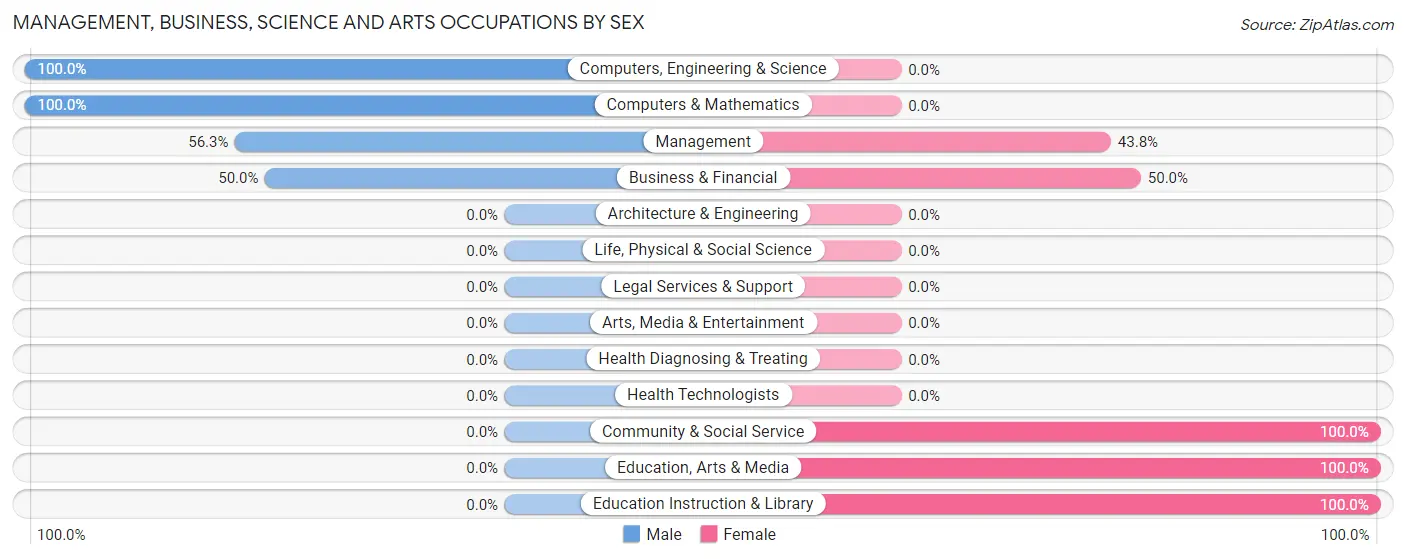
Management, Business, Science and Arts Occupations by Sex
Within the Management, Business, Science and Arts occupations in Buck Run, the most male-oriented occupations are Computers, Engineering & Science (100.0%), Computers & Mathematics (100.0%), and Management (56.2%), while the most female-oriented occupations are Community & Social Service (100.0%), Education, Arts & Media (100.0%), and Education Instruction & Library (100.0%).
| Occupation | Male | Female |
| Management | 9 (56.2%) | 7 (43.8%) |
| Business & Financial | 2 (50.0%) | 2 (50.0%) |
| Computers, Engineering & Science | 1 (100.0%) | 0 (0.0%) |
| Computers & Mathematics | 1 (100.0%) | 0 (0.0%) |
| Architecture & Engineering | 0 (0.0%) | 0 (0.0%) |
| Life, Physical & Social Science | 0 (0.0%) | 0 (0.0%) |
| Community & Social Service | 0 (0.0%) | 9 (100.0%) |
| Education, Arts & Media | 0 (0.0%) | 5 (100.0%) |
| Legal Services & Support | 0 (0.0%) | 0 (0.0%) |
| Education Instruction & Library | 0 (0.0%) | 4 (100.0%) |
| Arts, Media & Entertainment | 0 (0.0%) | 0 (0.0%) |
| Health Diagnosing & Treating | 0 (0.0%) | 0 (0.0%) |
| Health Technologists | 0 (0.0%) | 0 (0.0%) |
| Total (Category) | 12 (40.0%) | 18 (60.0%) |
| Total (Overall) | 26 (38.8%) | 41 (61.2%) |
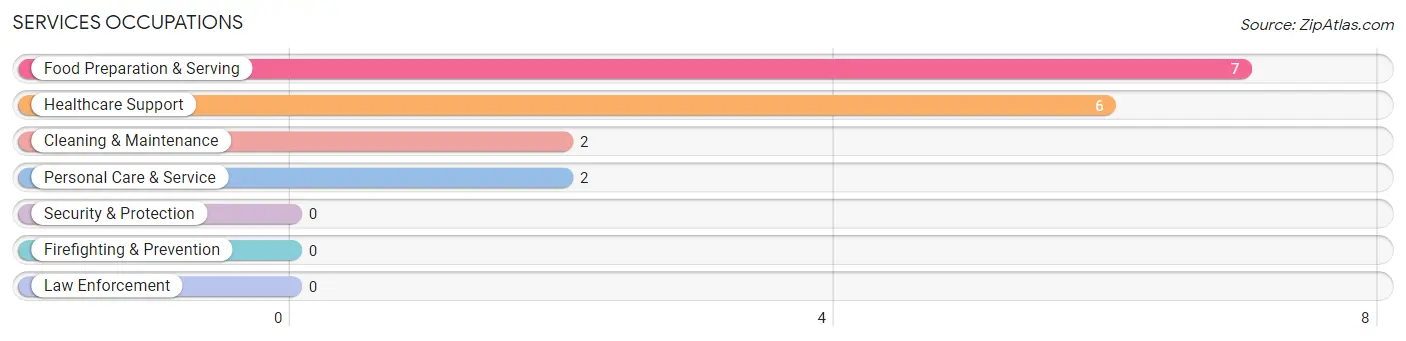
Services Occupations
The most common Services occupations in Buck Run are Food Preparation & Serving (7 | 10.4%), Healthcare Support (6 | 9.0%), Cleaning & Maintenance (2 | 3.0%), and Personal Care & Service (2 | 3.0%).
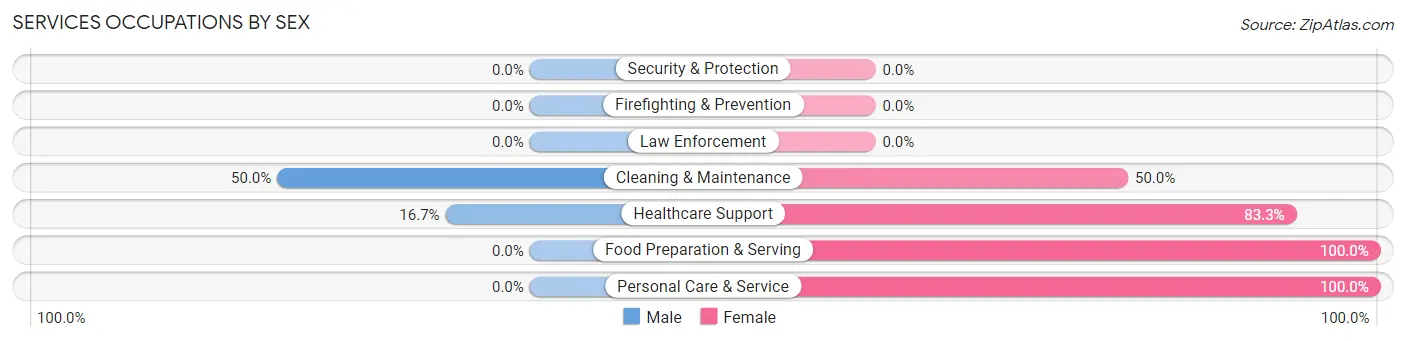
Services Occupations by Sex
Within the Services occupations in Buck Run, the most male-oriented occupations are Cleaning & Maintenance (50.0%), and Healthcare Support (16.7%), while the most female-oriented occupations are Food Preparation & Serving (100.0%), Personal Care & Service (100.0%), and Healthcare Support (83.3%).
| Occupation | Male | Female |
| Healthcare Support | 1 (16.7%) | 5 (83.3%) |
| Security & Protection | 0 (0.0%) | 0 (0.0%) |
| Firefighting & Prevention | 0 (0.0%) | 0 (0.0%) |
| Law Enforcement | 0 (0.0%) | 0 (0.0%) |
| Food Preparation & Serving | 0 (0.0%) | 7 (100.0%) |
| Cleaning & Maintenance | 1 (50.0%) | 1 (50.0%) |
| Personal Care & Service | 0 (0.0%) | 2 (100.0%) |
| Total (Category) | 2 (11.8%) | 15 (88.2%) |
| Total (Overall) | 26 (38.8%) | 41 (61.2%) |
Sales and Office Occupations
The most common Sales and Office occupations in Buck Run are Office & Administration (4 | 6.0%), and Sales & Related (3 | 4.5%).
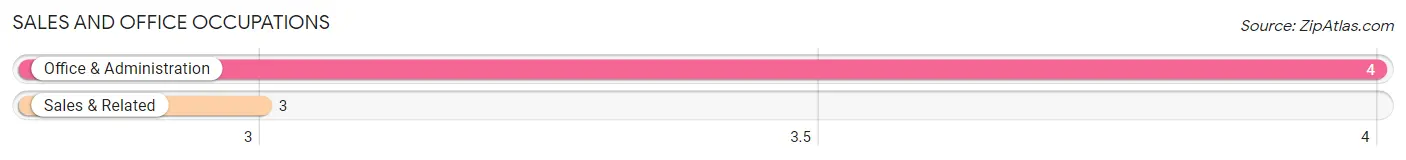
Sales and Office Occupations by Sex

| Occupation | Male | Female |
| Sales & Related | 1 (33.3%) | 2 (66.7%) |
| Office & Administration | 0 (0.0%) | 4 (100.0%) |
| Total (Category) | 1 (14.3%) | 6 (85.7%) |
| Total (Overall) | 26 (38.8%) | 41 (61.2%) |
Natural Resources, Construction and Maintenance Occupations
The most common Natural Resources, Construction and Maintenance occupations in Buck Run are Construction & Extraction (6 | 9.0%), and Installation, Maintenance & Repair (2 | 3.0%).
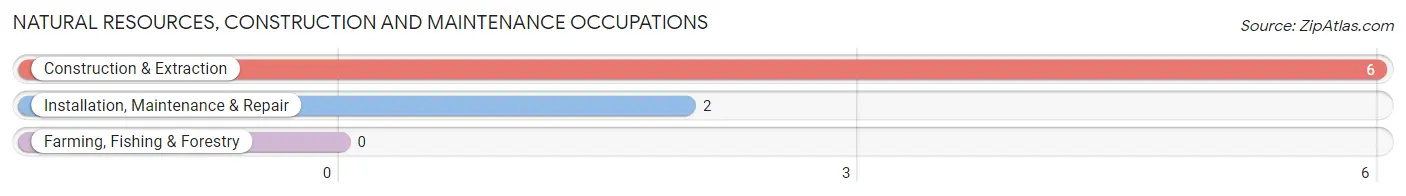
Natural Resources, Construction and Maintenance Occupations by Sex
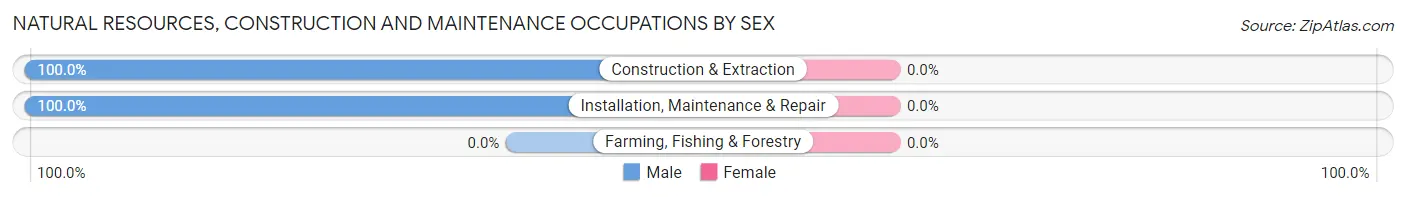
| Occupation | Male | Female |
| Farming, Fishing & Forestry | 0 (0.0%) | 0 (0.0%) |
| Construction & Extraction | 6 (100.0%) | 0 (0.0%) |
| Installation, Maintenance & Repair | 2 (100.0%) | 0 (0.0%) |
| Total (Category) | 8 (100.0%) | 0 (0.0%) |
| Total (Overall) | 26 (38.8%) | 41 (61.2%) |
Production, Transportation and Moving Occupations
The most common Production, Transportation and Moving occupations in Buck Run are Material Moving (4 | 6.0%), and Production (1 | 1.5%).
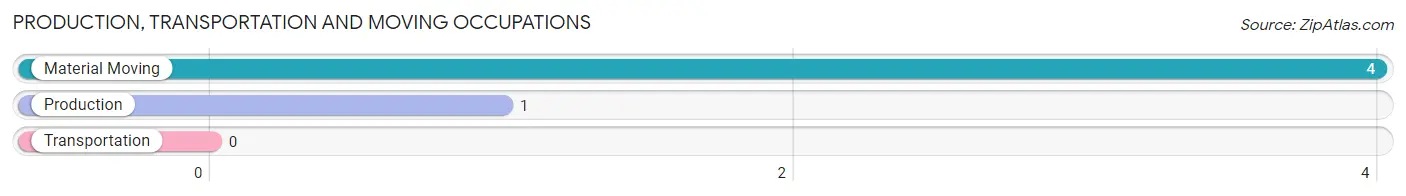
Production, Transportation and Moving Occupations by Sex
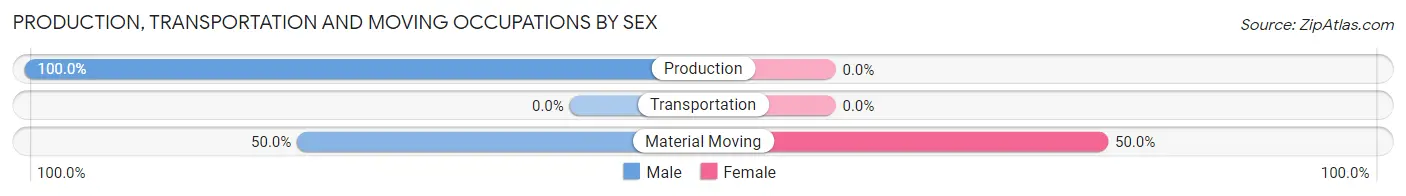
| Occupation | Male | Female |
| Production | 1 (100.0%) | 0 (0.0%) |
| Transportation | 0 (0.0%) | 0 (0.0%) |
| Material Moving | 2 (50.0%) | 2 (50.0%) |
| Total (Category) | 3 (60.0%) | 2 (40.0%) |
| Total (Overall) | 26 (38.8%) | 41 (61.2%) |
Employment Industries by Sex in Buck Run
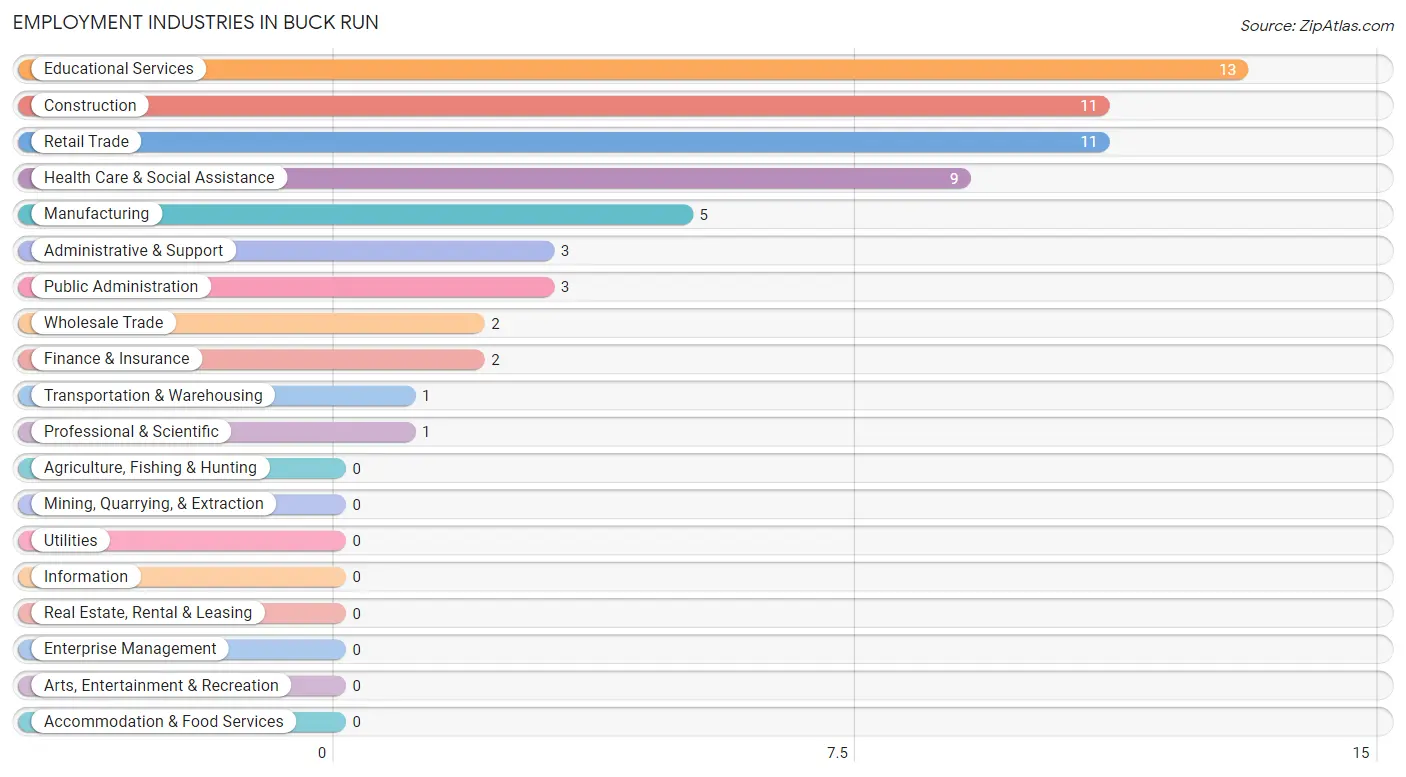
Employment Industries in Buck Run
The major employment industries in Buck Run include Educational Services (13 | 19.4%), Construction (11 | 16.4%), Retail Trade (11 | 16.4%), Health Care & Social Assistance (9 | 13.4%), and Manufacturing (5 | 7.5%).
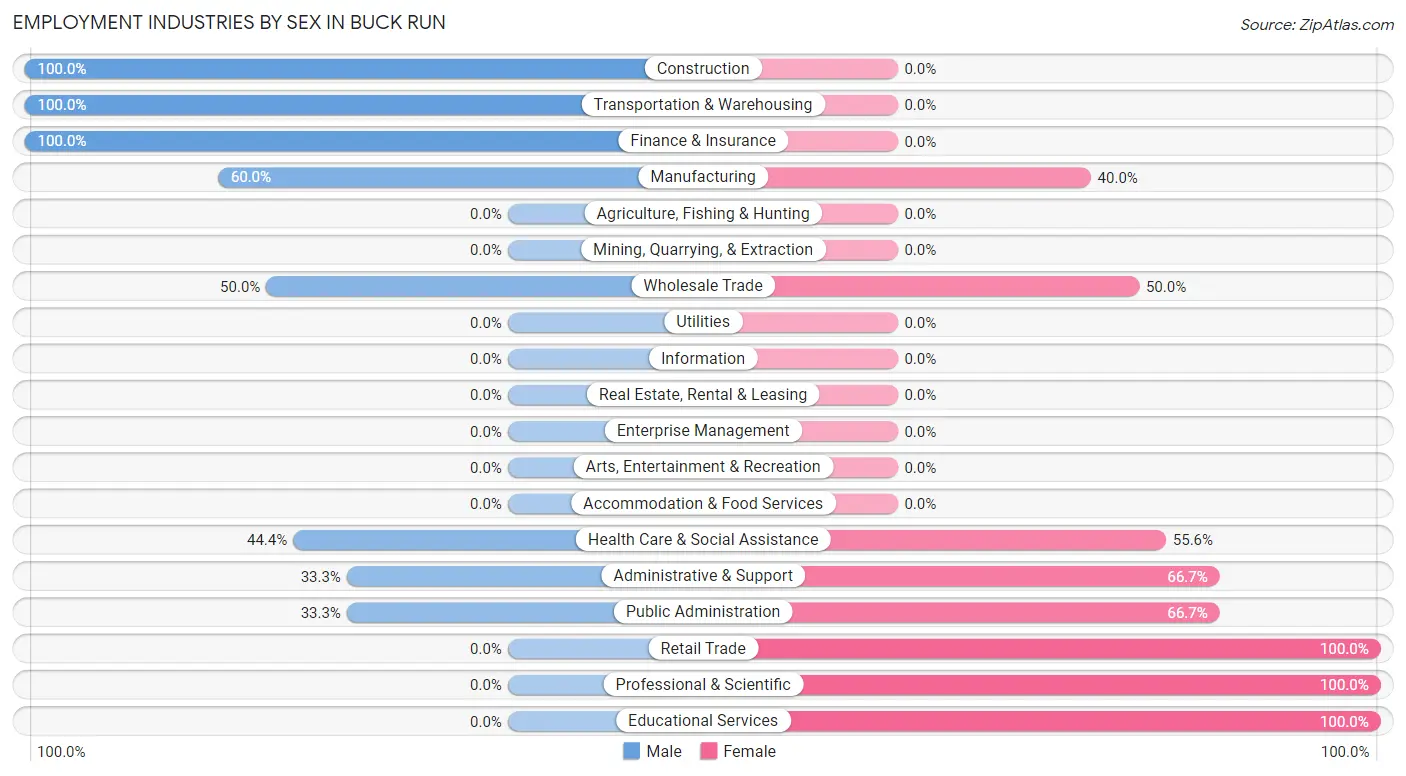
Employment Industries by Sex in Buck Run
The Buck Run industries that see more men than women are Construction (100.0%), Transportation & Warehousing (100.0%), and Finance & Insurance (100.0%), whereas the industries that tend to have a higher number of women are Retail Trade (100.0%), Professional & Scientific (100.0%), and Educational Services (100.0%).
| Industry | Male | Female |
| Agriculture, Fishing & Hunting | 0 (0.0%) | 0 (0.0%) |
| Mining, Quarrying, & Extraction | 0 (0.0%) | 0 (0.0%) |
| Construction | 11 (100.0%) | 0 (0.0%) |
| Manufacturing | 3 (60.0%) | 2 (40.0%) |
| Wholesale Trade | 1 (50.0%) | 1 (50.0%) |
| Retail Trade | 0 (0.0%) | 11 (100.0%) |
| Transportation & Warehousing | 1 (100.0%) | 0 (0.0%) |
| Utilities | 0 (0.0%) | 0 (0.0%) |
| Information | 0 (0.0%) | 0 (0.0%) |
| Finance & Insurance | 2 (100.0%) | 0 (0.0%) |
| Real Estate, Rental & Leasing | 0 (0.0%) | 0 (0.0%) |
| Professional & Scientific | 0 (0.0%) | 1 (100.0%) |
| Enterprise Management | 0 (0.0%) | 0 (0.0%) |
| Administrative & Support | 1 (33.3%) | 2 (66.7%) |
| Educational Services | 0 (0.0%) | 13 (100.0%) |
| Health Care & Social Assistance | 4 (44.4%) | 5 (55.6%) |
| Arts, Entertainment & Recreation | 0 (0.0%) | 0 (0.0%) |
| Accommodation & Food Services | 0 (0.0%) | 0 (0.0%) |
| Public Administration | 1 (33.3%) | 2 (66.7%) |
| Total | 26 (38.8%) | 41 (61.2%) |
Education in Buck Run
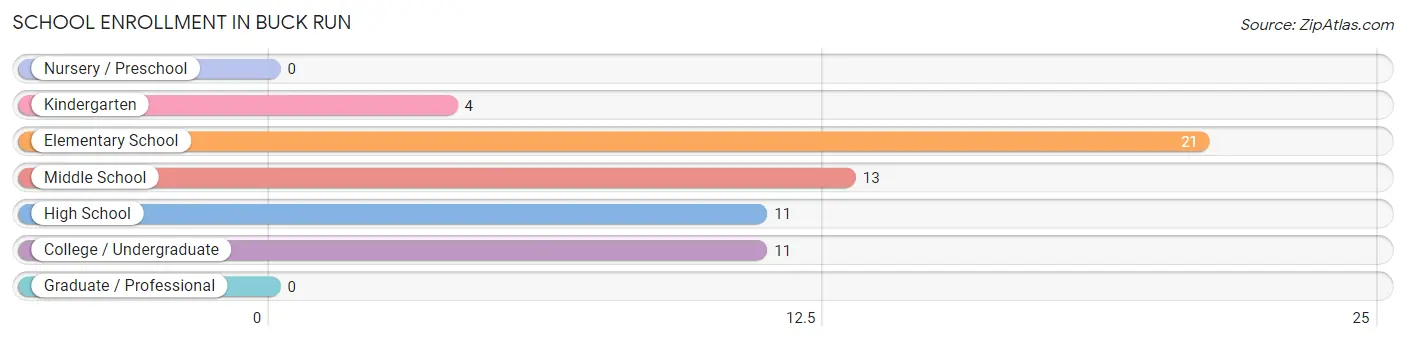
School Enrollment in Buck Run
The most common levels of schooling among the 60 students in Buck Run are elementary school (21 | 35.0%), middle school (13 | 21.7%), and high school (11 | 18.3%).
| School Level | # Students | % Students |
| Nursery / Preschool | 0 | 0.0% |
| Kindergarten | 4 | 6.7% |
| Elementary School | 21 | 35.0% |
| Middle School | 13 | 21.7% |
| High School | 11 | 18.3% |
| College / Undergraduate | 11 | 18.3% |
| Graduate / Professional | 0 | 0.0% |
| Total | 60 | 100.0% |
School Enrollment by Age by Funding Source in Buck Run
Out of a total of 60 students who are enrolled in schools in Buck Run, 5 (8.3%) attend a private institution, while the remaining 55 (91.7%) are enrolled in public schools. The age group of 18 to 19 year olds has the highest likelihood of being enrolled in private schools, with 2 (28.6% in the age bracket) enrolled. Conversely, the age group of 5 to 9 year old has the lowest likelihood of being enrolled in a private school, with 25 (100.0% in the age bracket) attending a public institution.
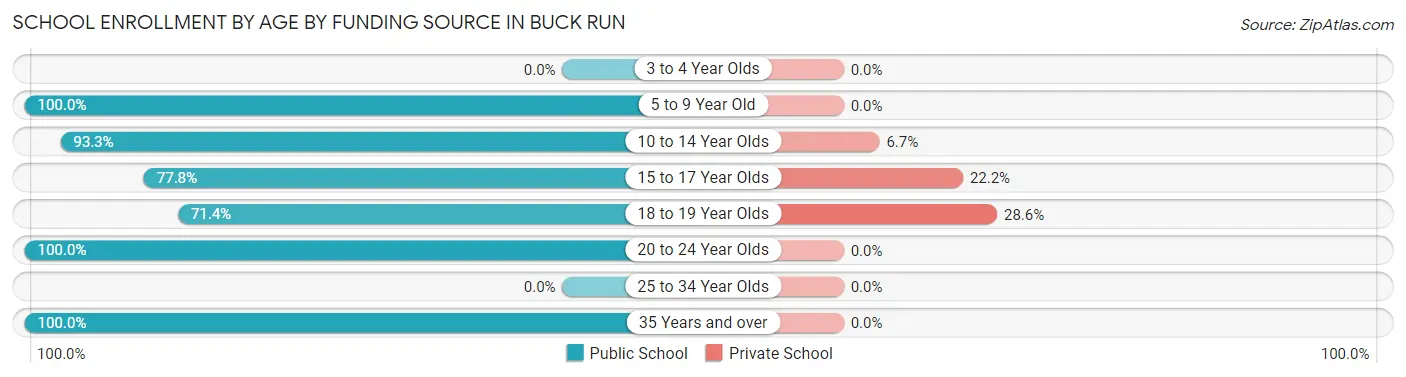
| Age Bracket | Public School | Private School |
| 3 to 4 Year Olds | 0 (0.0%) | 0 (0.0%) |
| 5 to 9 Year Old | 25 (100.0%) | 0 (0.0%) |
| 10 to 14 Year Olds | 14 (93.3%) | 1 (6.7%) |
| 15 to 17 Year Olds | 7 (77.8%) | 2 (22.2%) |
| 18 to 19 Year Olds | 5 (71.4%) | 2 (28.6%) |
| 20 to 24 Year Olds | 2 (100.0%) | 0 (0.0%) |
| 25 to 34 Year Olds | 0 (0.0%) | 0 (0.0%) |
| 35 Years and over | 2 (100.0%) | 0 (0.0%) |
| Total | 55 (91.7%) | 5 (8.3%) |
Educational Attainment by Field of Study in Buck Run
Science & technology (14 | 38.9%), education (6 | 16.7%), psychology (5 | 13.9%), business (5 | 13.9%), and social sciences (4 | 11.1%) are the most common fields of study among 36 individuals in Buck Run who have obtained a bachelor's degree or higher.
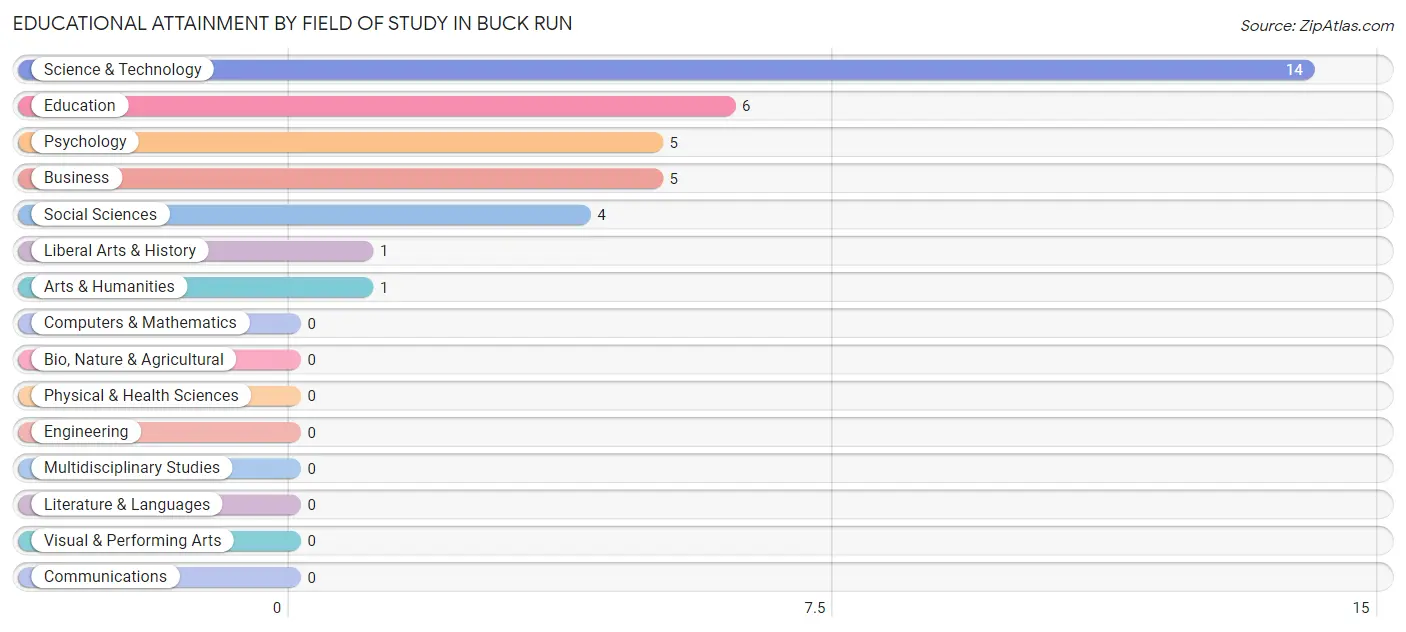
| Field of Study | # Graduates | % Graduates |
| Computers & Mathematics | 0 | 0.0% |
| Bio, Nature & Agricultural | 0 | 0.0% |
| Physical & Health Sciences | 0 | 0.0% |
| Psychology | 5 | 13.9% |
| Social Sciences | 4 | 11.1% |
| Engineering | 0 | 0.0% |
| Multidisciplinary Studies | 0 | 0.0% |
| Science & Technology | 14 | 38.9% |
| Business | 5 | 13.9% |
| Education | 6 | 16.7% |
| Literature & Languages | 0 | 0.0% |
| Liberal Arts & History | 1 | 2.8% |
| Visual & Performing Arts | 0 | 0.0% |
| Communications | 0 | 0.0% |
| Arts & Humanities | 1 | 2.8% |
| Total | 36 | 100.0% |
Transportation & Commute in Buck Run
Vehicle Availability by Sex in Buck Run
The most prevalent vehicle ownership categories in Buck Run are males with 2 vehicles (12, accounting for 50.0%) and females with 2 vehicles (22, making up 32.4%).
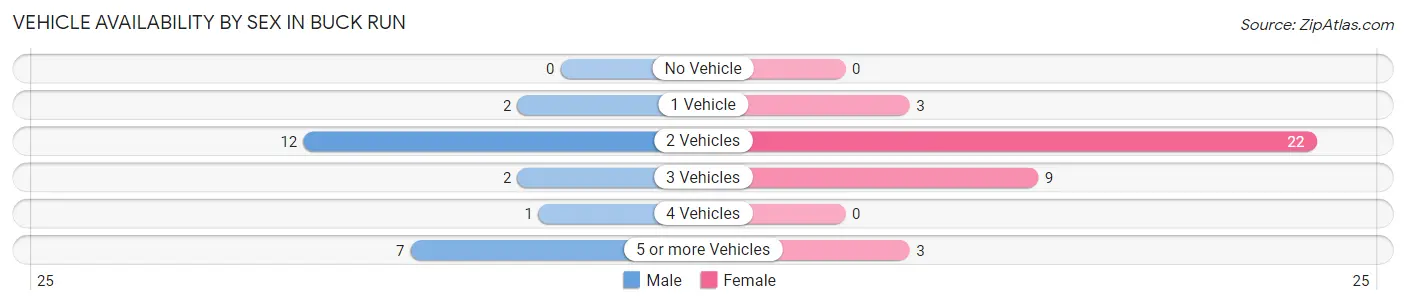
| Vehicles Available | Male | Female |
| No Vehicle | 0 (0.0%) | 0 (0.0%) |
| 1 Vehicle | 2 (8.3%) | 3 (8.1%) |
| 2 Vehicles | 12 (50.0%) | 22 (59.5%) |
| 3 Vehicles | 2 (8.3%) | 9 (24.3%) |
| 4 Vehicles | 1 (4.2%) | 0 (0.0%) |
| 5 or more Vehicles | 7 (29.2%) | 3 (8.1%) |
| Total | 24 (100.0%) | 37 (100.0%) |
Commute Time in Buck Run
The most frequently occuring commute durations in Buck Run are 20 to 24 minutes (20 commuters, 35.7%), 5 to 9 minutes (9 commuters, 16.1%), and 60 to 89 minutes (9 commuters, 16.1%).
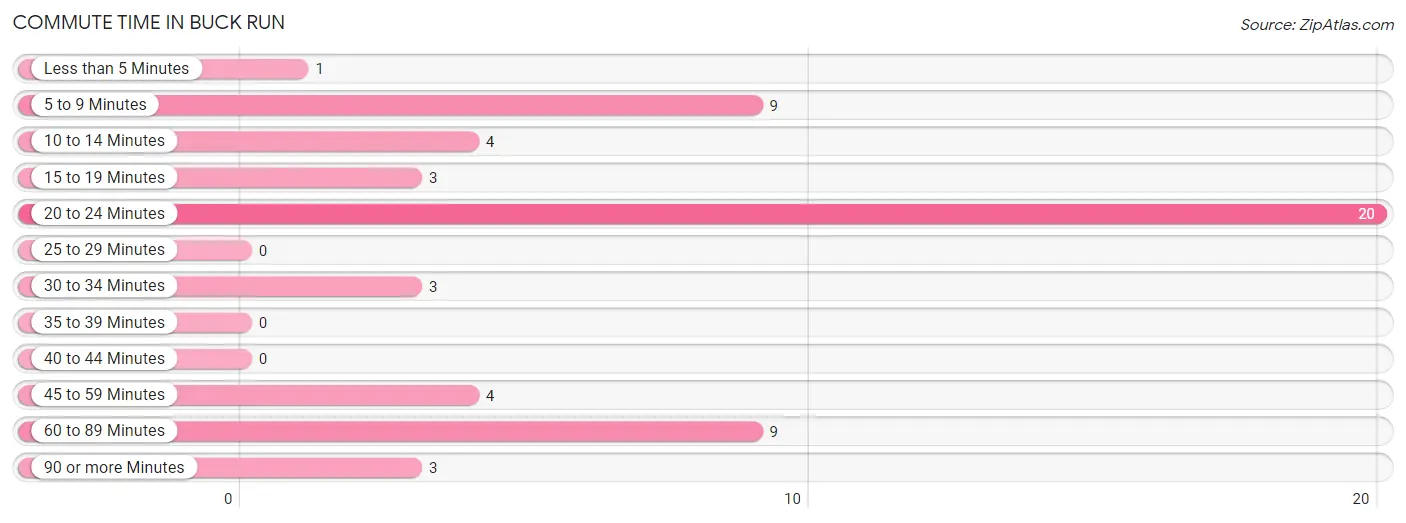
| Commute Time | # Commuters | % Commuters |
| Less than 5 Minutes | 1 | 1.8% |
| 5 to 9 Minutes | 9 | 16.1% |
| 10 to 14 Minutes | 4 | 7.1% |
| 15 to 19 Minutes | 3 | 5.4% |
| 20 to 24 Minutes | 20 | 35.7% |
| 25 to 29 Minutes | 0 | 0.0% |
| 30 to 34 Minutes | 3 | 5.4% |
| 35 to 39 Minutes | 0 | 0.0% |
| 40 to 44 Minutes | 0 | 0.0% |
| 45 to 59 Minutes | 4 | 7.1% |
| 60 to 89 Minutes | 9 | 16.1% |
| 90 or more Minutes | 3 | 5.4% |
Commute Time by Sex in Buck Run
The most common commute times in Buck Run are 5 to 9 minutes (8 commuters, 34.8%) for males and 20 to 24 minutes (16 commuters, 48.5%) for females.
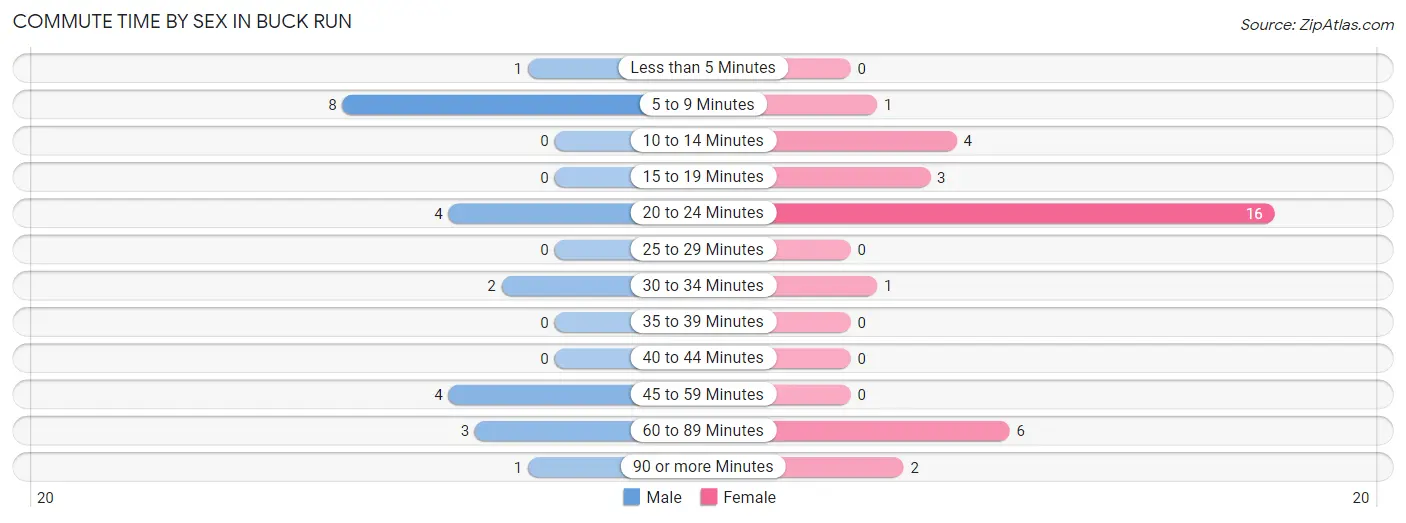
| Commute Time | Male | Female |
| Less than 5 Minutes | 1 (4.3%) | 0 (0.0%) |
| 5 to 9 Minutes | 8 (34.8%) | 1 (3.0%) |
| 10 to 14 Minutes | 0 (0.0%) | 4 (12.1%) |
| 15 to 19 Minutes | 0 (0.0%) | 3 (9.1%) |
| 20 to 24 Minutes | 4 (17.4%) | 16 (48.5%) |
| 25 to 29 Minutes | 0 (0.0%) | 0 (0.0%) |
| 30 to 34 Minutes | 2 (8.7%) | 1 (3.0%) |
| 35 to 39 Minutes | 0 (0.0%) | 0 (0.0%) |
| 40 to 44 Minutes | 0 (0.0%) | 0 (0.0%) |
| 45 to 59 Minutes | 4 (17.4%) | 0 (0.0%) |
| 60 to 89 Minutes | 3 (13.0%) | 6 (18.2%) |
| 90 or more Minutes | 1 (4.3%) | 2 (6.1%) |
Time of Departure to Work by Sex in Buck Run
The most frequent times of departure to work in Buck Run are 7:00 AM to 7:29 AM (8, 34.8%) for males and 6:00 AM to 6:29 AM (9, 27.3%) for females.
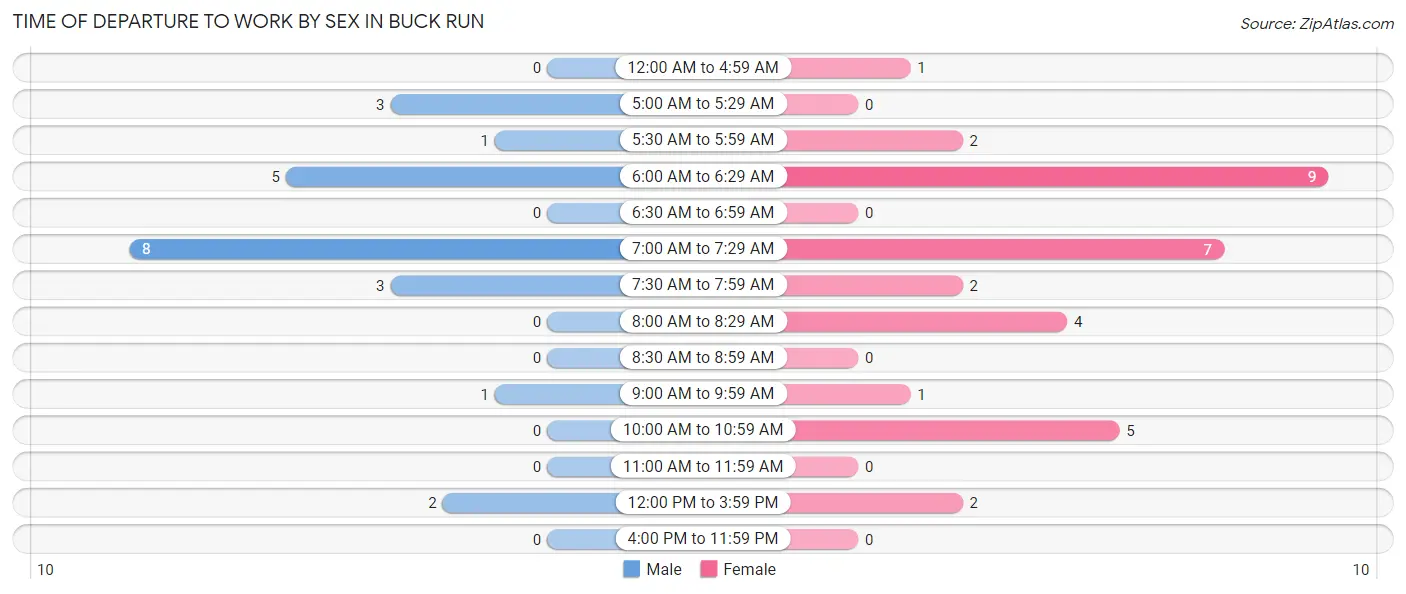
| Time of Departure | Male | Female |
| 12:00 AM to 4:59 AM | 0 (0.0%) | 1 (3.0%) |
| 5:00 AM to 5:29 AM | 3 (13.0%) | 0 (0.0%) |
| 5:30 AM to 5:59 AM | 1 (4.3%) | 2 (6.1%) |
| 6:00 AM to 6:29 AM | 5 (21.7%) | 9 (27.3%) |
| 6:30 AM to 6:59 AM | 0 (0.0%) | 0 (0.0%) |
| 7:00 AM to 7:29 AM | 8 (34.8%) | 7 (21.2%) |
| 7:30 AM to 7:59 AM | 3 (13.0%) | 2 (6.1%) |
| 8:00 AM to 8:29 AM | 0 (0.0%) | 4 (12.1%) |
| 8:30 AM to 8:59 AM | 0 (0.0%) | 0 (0.0%) |
| 9:00 AM to 9:59 AM | 1 (4.3%) | 1 (3.0%) |
| 10:00 AM to 10:59 AM | 0 (0.0%) | 5 (15.1%) |
| 11:00 AM to 11:59 AM | 0 (0.0%) | 0 (0.0%) |
| 12:00 PM to 3:59 PM | 2 (8.7%) | 2 (6.1%) |
| 4:00 PM to 11:59 PM | 0 (0.0%) | 0 (0.0%) |
| Total | 23 (100.0%) | 33 (100.0%) |
Housing Occupancy in Buck Run
Occupancy by Ownership in Buck Run
Of the total 82 dwellings in Buck Run, owner-occupied units account for 76 (92.7%), while renter-occupied units make up 6 (7.3%).
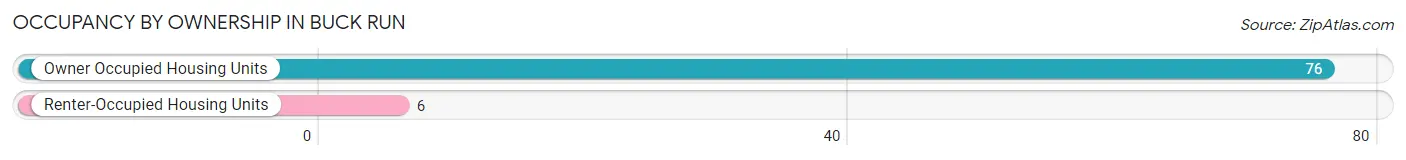
| Occupancy | # Housing Units | % Housing Units |
| Owner Occupied Housing Units | 76 | 92.7% |
| Renter-Occupied Housing Units | 6 | 7.3% |
| Total Occupied Housing Units | 82 | 100.0% |
Occupancy by Household Size in Buck Run
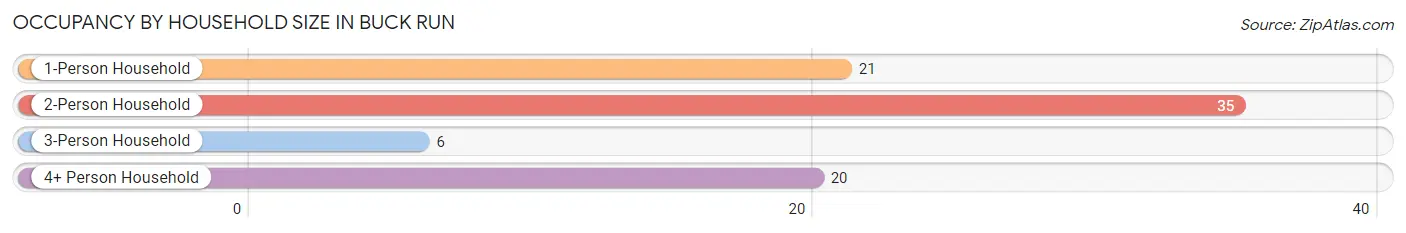
| Household Size | # Housing Units | % Housing Units |
| 1-Person Household | 21 | 25.6% |
| 2-Person Household | 35 | 42.7% |
| 3-Person Household | 6 | 7.3% |
| 4+ Person Household | 20 | 24.4% |
| Total Housing Units | 82 | 100.0% |
Occupancy by Ownership by Household Size in Buck Run
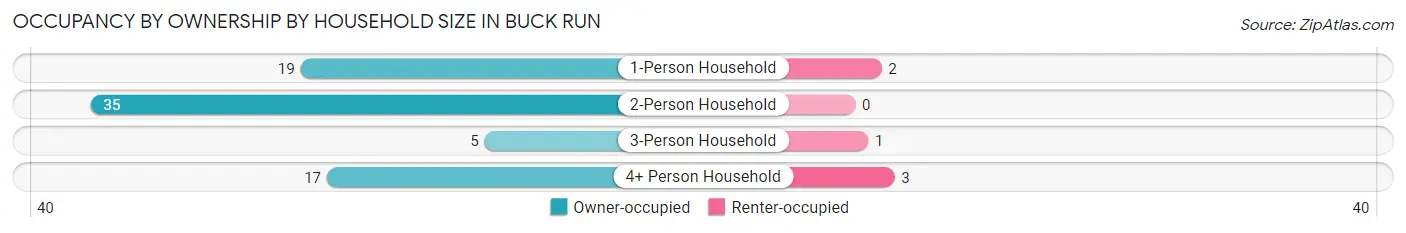
| Household Size | Owner-occupied | Renter-occupied |
| 1-Person Household | 19 (90.5%) | 2 (9.5%) |
| 2-Person Household | 35 (100.0%) | 0 (0.0%) |
| 3-Person Household | 5 (83.3%) | 1 (16.7%) |
| 4+ Person Household | 17 (85.0%) | 3 (15.0%) |
| Total Housing Units | 76 (92.7%) | 6 (7.3%) |
Occupancy by Educational Attainment in Buck Run
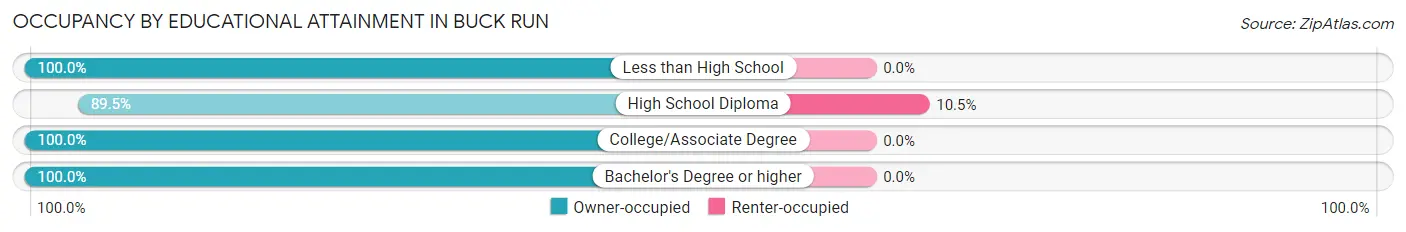
| Household Size | Owner-occupied | Renter-occupied |
| Less than High School | 3 (100.0%) | 0 (0.0%) |
| High School Diploma | 51 (89.5%) | 6 (10.5%) |
| College/Associate Degree | 3 (100.0%) | 0 (0.0%) |
| Bachelor's Degree or higher | 19 (100.0%) | 0 (0.0%) |
Occupancy by Age of Householder in Buck Run
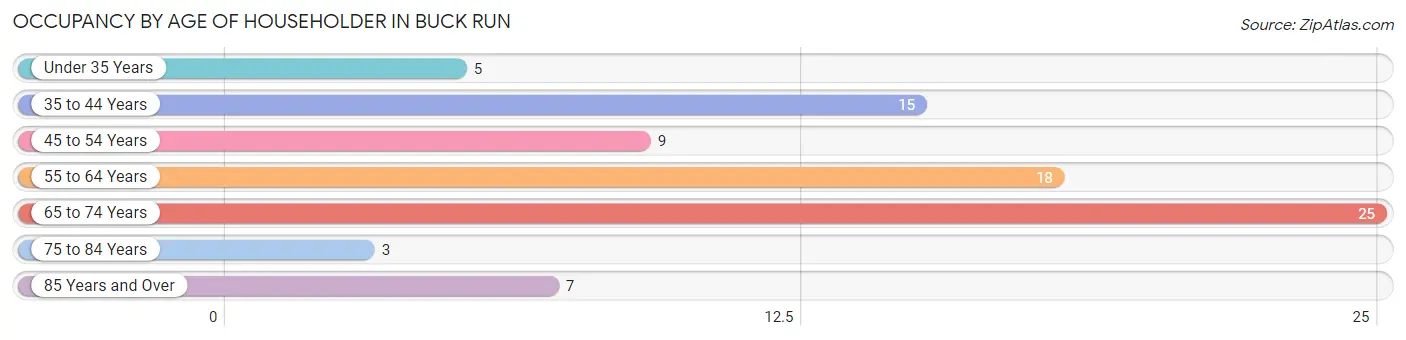
| Age Bracket | # Households | % Households |
| Under 35 Years | 5 | 6.1% |
| 35 to 44 Years | 15 | 18.3% |
| 45 to 54 Years | 9 | 11.0% |
| 55 to 64 Years | 18 | 22.0% |
| 65 to 74 Years | 25 | 30.5% |
| 75 to 84 Years | 3 | 3.7% |
| 85 Years and Over | 7 | 8.5% |
| Total | 82 | 100.0% |
Housing Finances in Buck Run
Median Income by Occupancy in Buck Run
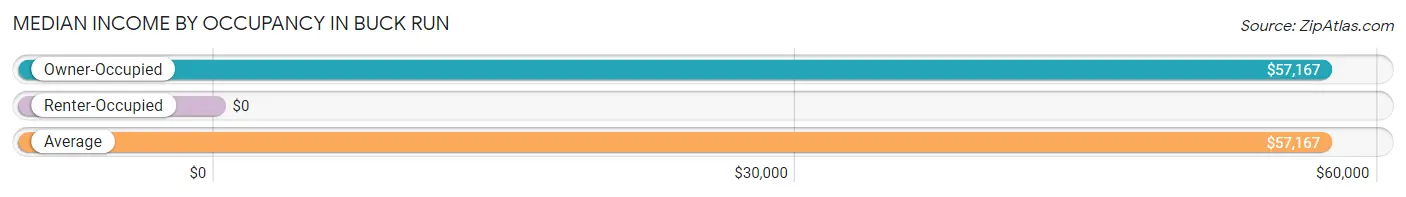
| Occupancy Type | # Households | Median Income |
| Owner-Occupied | 76 (92.7%) | $57,167 |
| Renter-Occupied | 6 (7.3%) | $0 |
| Average | 82 (100.0%) | $57,167 |
Occupancy by Householder Income Bracket in Buck Run
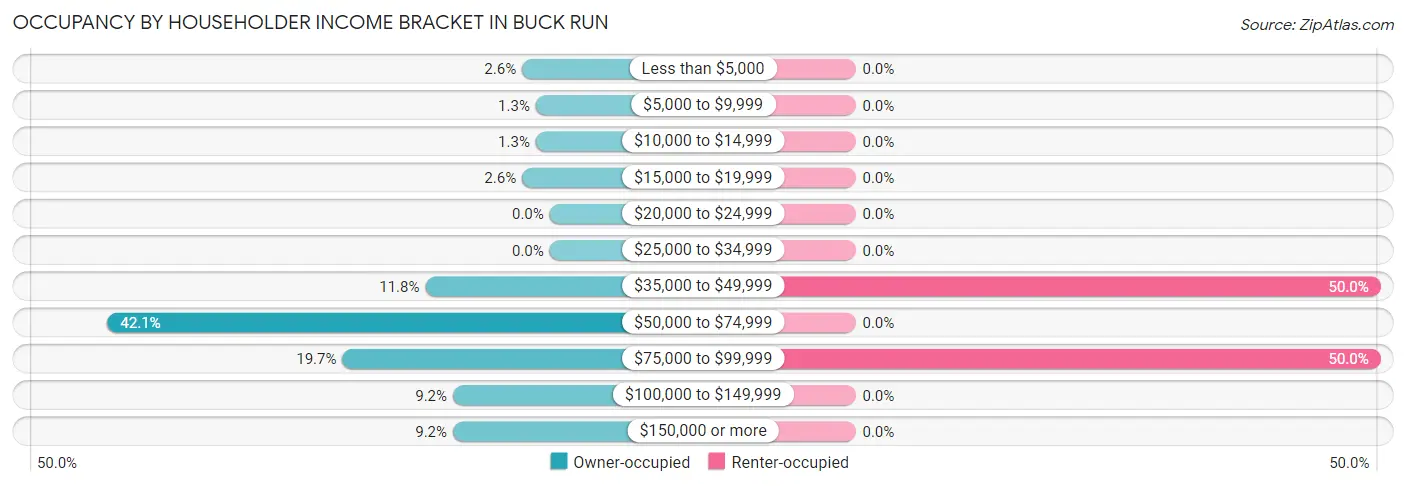
| Income Bracket | Owner-occupied | Renter-occupied |
| Less than $5,000 | 2 (2.6%) | 0 (0.0%) |
| $5,000 to $9,999 | 1 (1.3%) | 0 (0.0%) |
| $10,000 to $14,999 | 1 (1.3%) | 0 (0.0%) |
| $15,000 to $19,999 | 2 (2.6%) | 0 (0.0%) |
| $20,000 to $24,999 | 0 (0.0%) | 0 (0.0%) |
| $25,000 to $34,999 | 0 (0.0%) | 0 (0.0%) |
| $35,000 to $49,999 | 9 (11.8%) | 3 (50.0%) |
| $50,000 to $74,999 | 32 (42.1%) | 0 (0.0%) |
| $75,000 to $99,999 | 15 (19.7%) | 3 (50.0%) |
| $100,000 to $149,999 | 7 (9.2%) | 0 (0.0%) |
| $150,000 or more | 7 (9.2%) | 0 (0.0%) |
| Total | 76 (100.0%) | 6 (100.0%) |
Monthly Housing Cost Tiers in Buck Run
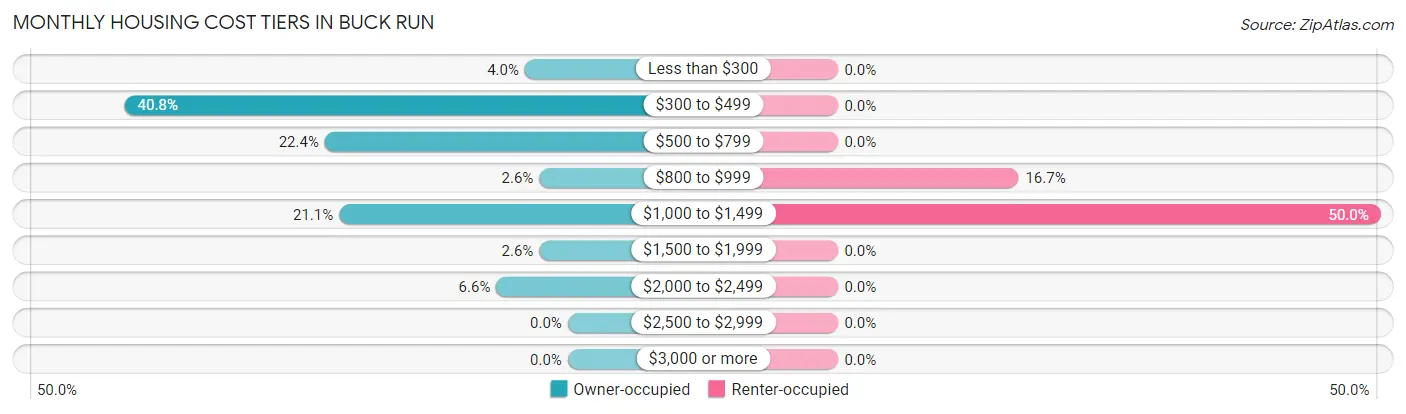
| Monthly Cost | Owner-occupied | Renter-occupied |
| Less than $300 | 3 (4.0%) | 0 (0.0%) |
| $300 to $499 | 31 (40.8%) | 0 (0.0%) |
| $500 to $799 | 17 (22.4%) | 0 (0.0%) |
| $800 to $999 | 2 (2.6%) | 1 (16.7%) |
| $1,000 to $1,499 | 16 (21.0%) | 3 (50.0%) |
| $1,500 to $1,999 | 2 (2.6%) | 0 (0.0%) |
| $2,000 to $2,499 | 5 (6.6%) | 0 (0.0%) |
| $2,500 to $2,999 | 0 (0.0%) | 0 (0.0%) |
| $3,000 or more | 0 (0.0%) | 0 (0.0%) |
| Total | 76 (100.0%) | 6 (100.0%) |
Physical Housing Characteristics in Buck Run
Housing Structures in Buck Run
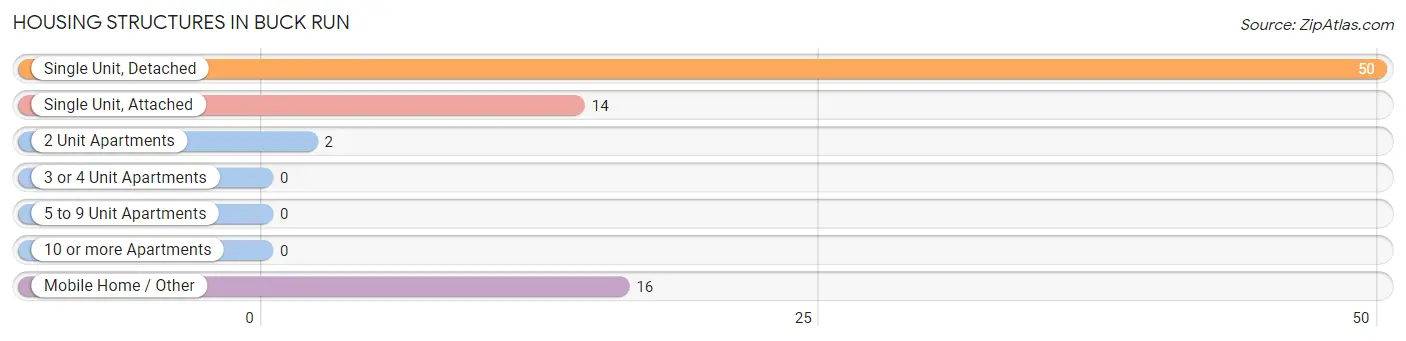
| Structure Type | # Housing Units | % Housing Units |
| Single Unit, Detached | 50 | 61.0% |
| Single Unit, Attached | 14 | 17.1% |
| 2 Unit Apartments | 2 | 2.4% |
| 3 or 4 Unit Apartments | 0 | 0.0% |
| 5 to 9 Unit Apartments | 0 | 0.0% |
| 10 or more Apartments | 0 | 0.0% |
| Mobile Home / Other | 16 | 19.5% |
| Total | 82 | 100.0% |
Housing Structures by Occupancy in Buck Run
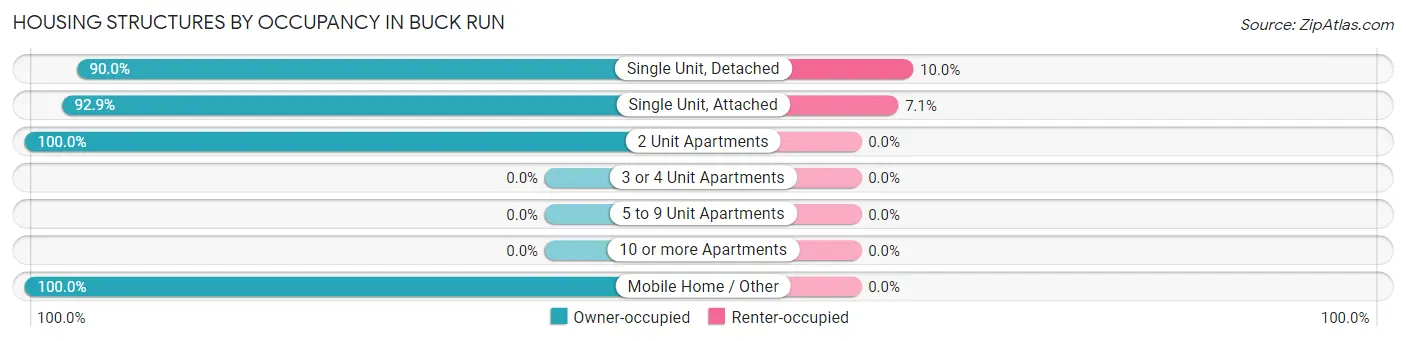
| Structure Type | Owner-occupied | Renter-occupied |
| Single Unit, Detached | 45 (90.0%) | 5 (10.0%) |
| Single Unit, Attached | 13 (92.9%) | 1 (7.1%) |
| 2 Unit Apartments | 2 (100.0%) | 0 (0.0%) |
| 3 or 4 Unit Apartments | 0 (0.0%) | 0 (0.0%) |
| 5 to 9 Unit Apartments | 0 (0.0%) | 0 (0.0%) |
| 10 or more Apartments | 0 (0.0%) | 0 (0.0%) |
| Mobile Home / Other | 16 (100.0%) | 0 (0.0%) |
| Total | 76 (92.7%) | 6 (7.3%) |
Housing Structures by Number of Rooms in Buck Run
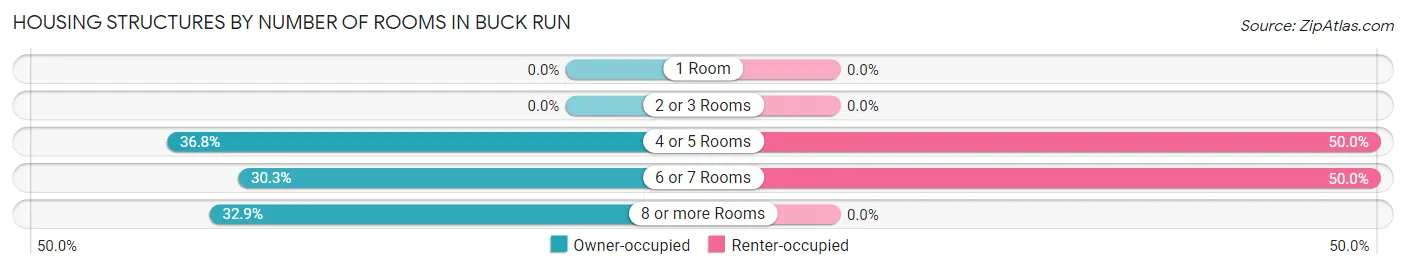
| Number of Rooms | Owner-occupied | Renter-occupied |
| 1 Room | 0 (0.0%) | 0 (0.0%) |
| 2 or 3 Rooms | 0 (0.0%) | 0 (0.0%) |
| 4 or 5 Rooms | 28 (36.8%) | 3 (50.0%) |
| 6 or 7 Rooms | 23 (30.3%) | 3 (50.0%) |
| 8 or more Rooms | 25 (32.9%) | 0 (0.0%) |
| Total | 76 (100.0%) | 6 (100.0%) |
Housing Structure by Heating Type in Buck Run
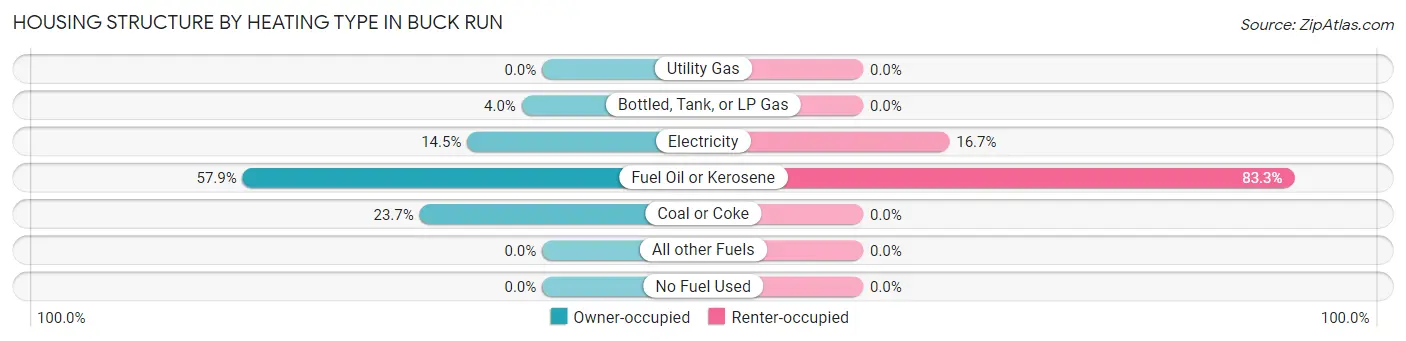
| Heating Type | Owner-occupied | Renter-occupied |
| Utility Gas | 0 (0.0%) | 0 (0.0%) |
| Bottled, Tank, or LP Gas | 3 (4.0%) | 0 (0.0%) |
| Electricity | 11 (14.5%) | 1 (16.7%) |
| Fuel Oil or Kerosene | 44 (57.9%) | 5 (83.3%) |
| Coal or Coke | 18 (23.7%) | 0 (0.0%) |
| All other Fuels | 0 (0.0%) | 0 (0.0%) |
| No Fuel Used | 0 (0.0%) | 0 (0.0%) |
| Total | 76 (100.0%) | 6 (100.0%) |
Household Vehicle Usage in Buck Run
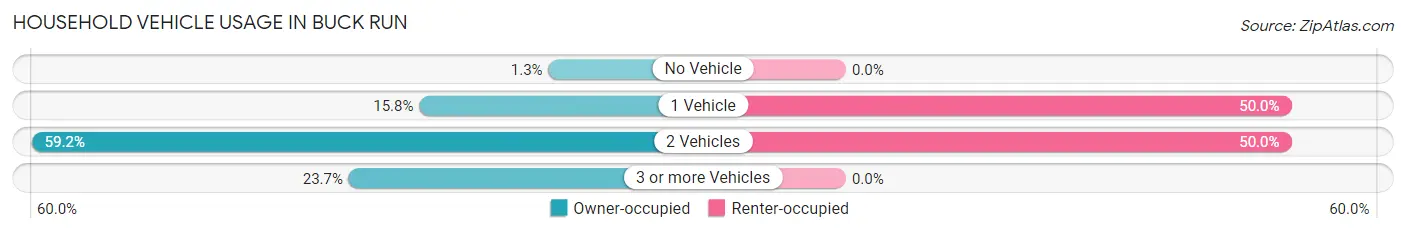
| Vehicles per Household | Owner-occupied | Renter-occupied |
| No Vehicle | 1 (1.3%) | 0 (0.0%) |
| 1 Vehicle | 12 (15.8%) | 3 (50.0%) |
| 2 Vehicles | 45 (59.2%) | 3 (50.0%) |
| 3 or more Vehicles | 18 (23.7%) | 0 (0.0%) |
| Total | 76 (100.0%) | 6 (100.0%) |
Real Estate & Mortgages in Buck Run
Real Estate and Mortgage Overview in Buck Run
| Characteristic | Without Mortgage | With Mortgage |
| Housing Units | 48 | 28 |
| Median Property Value | - | - |
| Median Household Income | $55,833 | $5 |
| Monthly Housing Costs | $423 | $0 |
| Real Estate Taxes | - | - |
Property Value by Mortgage Status in Buck Run
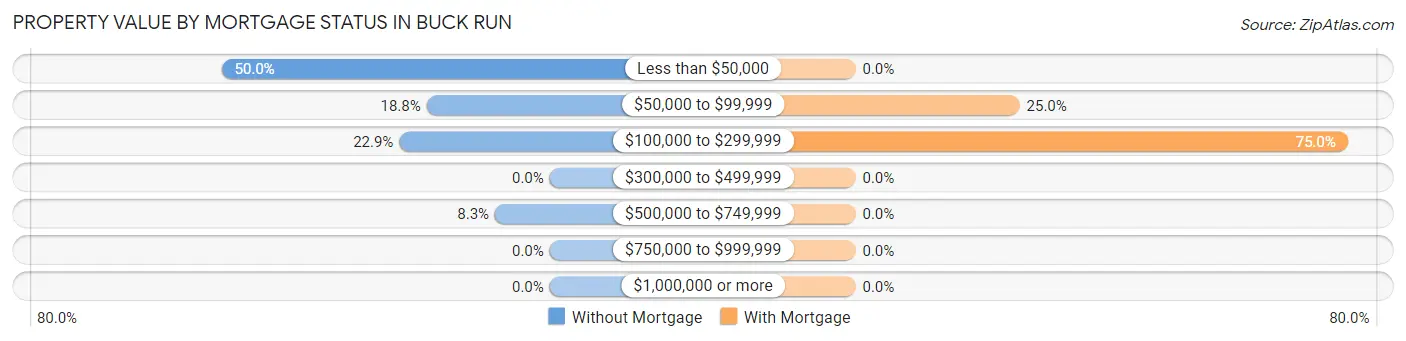
| Property Value | Without Mortgage | With Mortgage |
| Less than $50,000 | 24 (50.0%) | 0 (0.0%) |
| $50,000 to $99,999 | 9 (18.8%) | 7 (25.0%) |
| $100,000 to $299,999 | 11 (22.9%) | 21 (75.0%) |
| $300,000 to $499,999 | 0 (0.0%) | 0 (0.0%) |
| $500,000 to $749,999 | 4 (8.3%) | 0 (0.0%) |
| $750,000 to $999,999 | 0 (0.0%) | 0 (0.0%) |
| $1,000,000 or more | 0 (0.0%) | 0 (0.0%) |
| Total | 48 (100.0%) | 28 (100.0%) |
Household Income by Mortgage Status in Buck Run
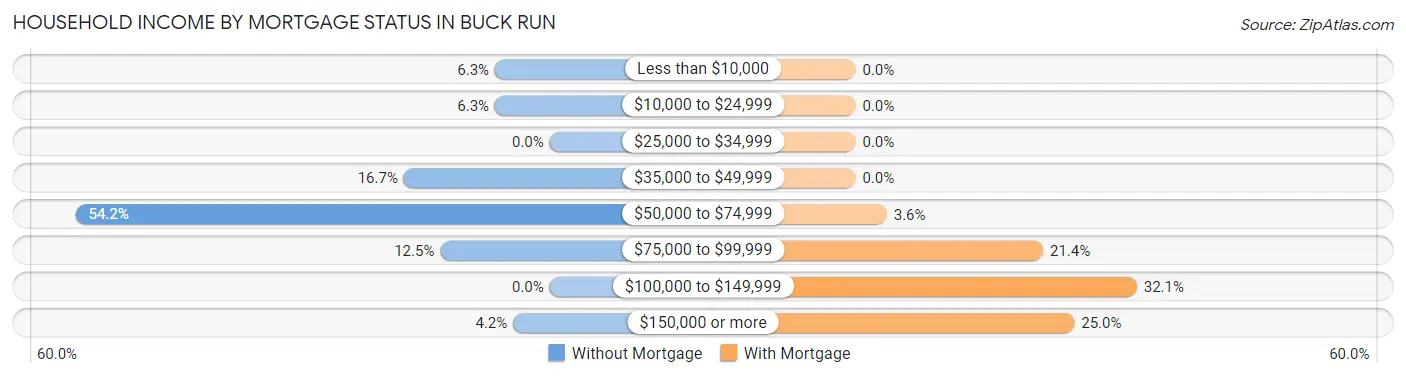
| Household Income | Without Mortgage | With Mortgage |
| Less than $10,000 | 3 (6.2%) | 0 (0.0%) |
| $10,000 to $24,999 | 3 (6.2%) | 0 (0.0%) |
| $25,000 to $34,999 | 0 (0.0%) | 0 (0.0%) |
| $35,000 to $49,999 | 8 (16.7%) | 0 (0.0%) |
| $50,000 to $74,999 | 26 (54.2%) | 1 (3.6%) |
| $75,000 to $99,999 | 6 (12.5%) | 6 (21.4%) |
| $100,000 to $149,999 | 0 (0.0%) | 9 (32.1%) |
| $150,000 or more | 2 (4.2%) | 7 (25.0%) |
| Total | 48 (100.0%) | 28 (100.0%) |
Property Value to Household Income Ratio in Buck Run
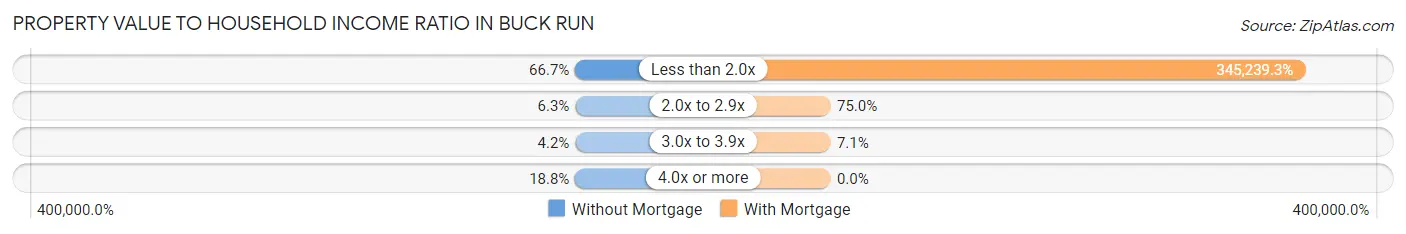
| Value-to-Income Ratio | Without Mortgage | With Mortgage |
| Less than 2.0x | 32 (66.7%) | 96,667 (345,239.3%) |
| 2.0x to 2.9x | 3 (6.2%) | 21 (75.0%) |
| 3.0x to 3.9x | 2 (4.2%) | 2 (7.1%) |
| 4.0x or more | 9 (18.8%) | 0 (0.0%) |
| Total | 48 (100.0%) | 28 (100.0%) |
Real Estate Taxes by Mortgage Status in Buck Run
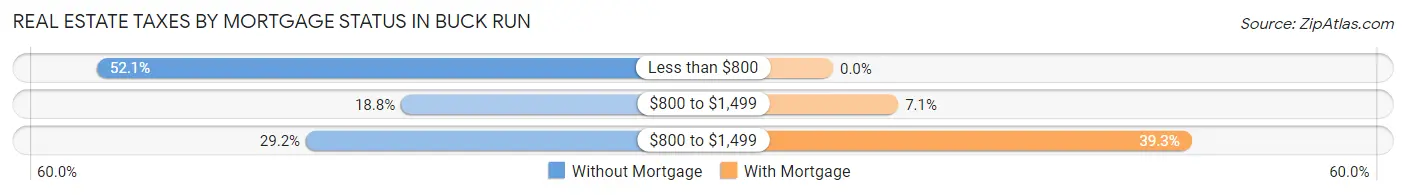
| Property Taxes | Without Mortgage | With Mortgage |
| Less than $800 | 25 (52.1%) | 0 (0.0%) |
| $800 to $1,499 | 9 (18.8%) | 2 (7.1%) |
| $800 to $1,499 | 14 (29.2%) | 11 (39.3%) |
| Total | 48 (100.0%) | 28 (100.0%) |
Health & Disability in Buck Run
Health Insurance Coverage by Age in Buck Run
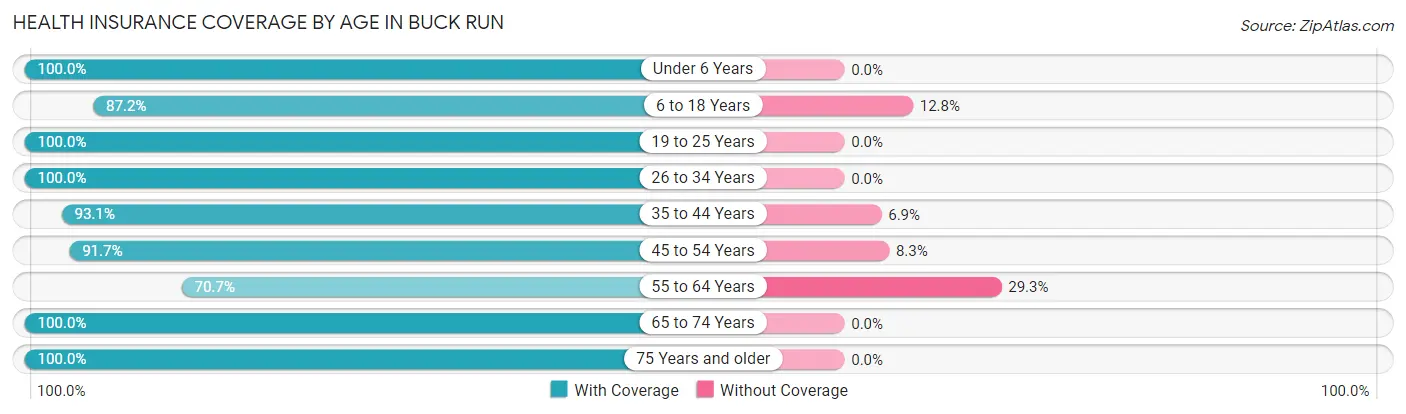
| Age Bracket | With Coverage | Without Coverage |
| Under 6 Years | 9 (100.0%) | 0 (0.0%) |
| 6 to 18 Years | 41 (87.2%) | 6 (12.8%) |
| 19 to 25 Years | 7 (100.0%) | 0 (0.0%) |
| 26 to 34 Years | 15 (100.0%) | 0 (0.0%) |
| 35 to 44 Years | 27 (93.1%) | 2 (6.9%) |
| 45 to 54 Years | 11 (91.7%) | 1 (8.3%) |
| 55 to 64 Years | 29 (70.7%) | 12 (29.3%) |
| 65 to 74 Years | 32 (100.0%) | 0 (0.0%) |
| 75 Years and older | 14 (100.0%) | 0 (0.0%) |
| Total | 185 (89.8%) | 21 (10.2%) |
Health Insurance Coverage by Citizenship Status in Buck Run
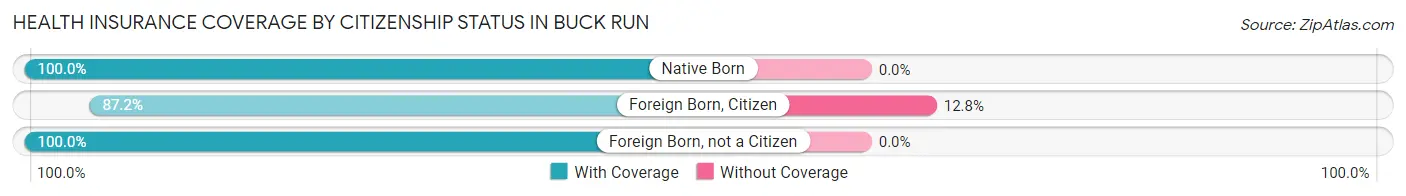
| Citizenship Status | With Coverage | Without Coverage |
| Native Born | 9 (100.0%) | 0 (0.0%) |
| Foreign Born, Citizen | 41 (87.2%) | 6 (12.8%) |
| Foreign Born, not a Citizen | 7 (100.0%) | 0 (0.0%) |
Health Insurance Coverage by Household Income in Buck Run
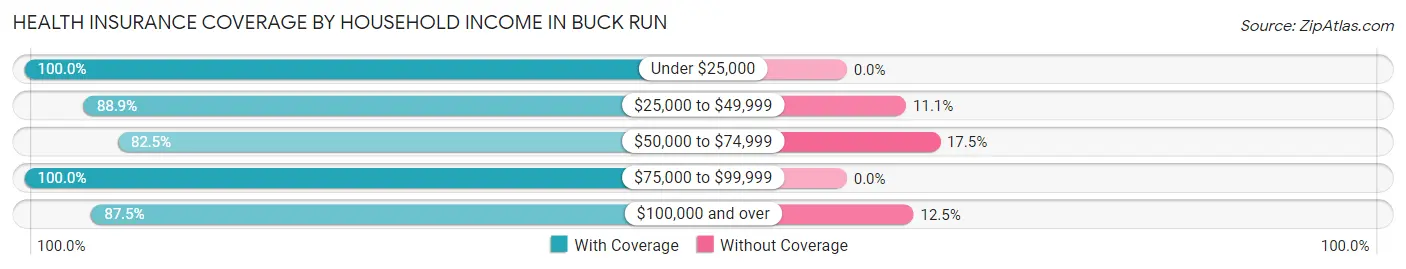
| Household Income | With Coverage | Without Coverage |
| Under $25,000 | 7 (100.0%) | 0 (0.0%) |
| $25,000 to $49,999 | 24 (88.9%) | 3 (11.1%) |
| $50,000 to $74,999 | 52 (82.5%) | 11 (17.5%) |
| $75,000 to $99,999 | 53 (100.0%) | 0 (0.0%) |
| $100,000 and over | 49 (87.5%) | 7 (12.5%) |
Public vs Private Health Insurance Coverage by Age in Buck Run
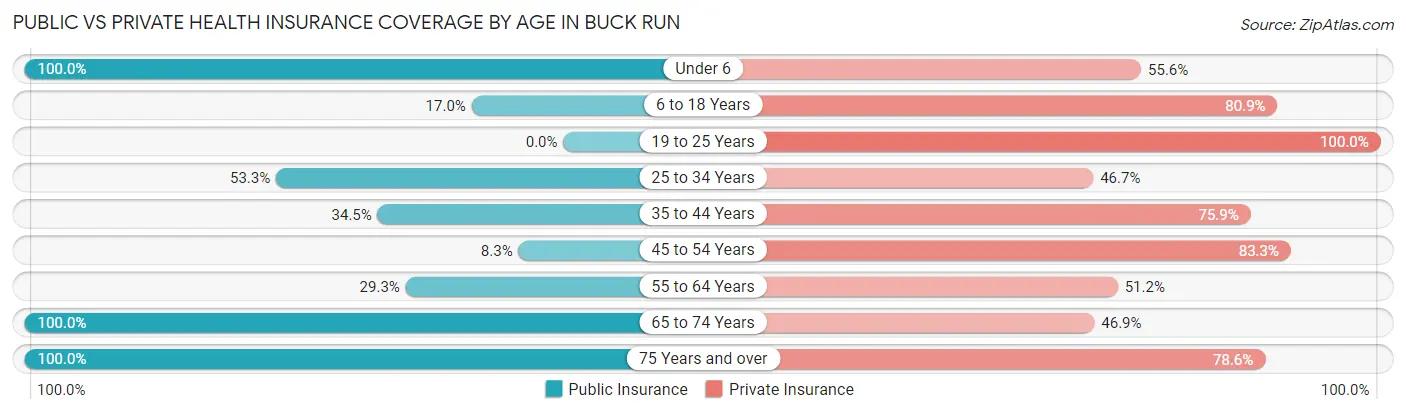
| Age Bracket | Public Insurance | Private Insurance |
| Under 6 | 9 (100.0%) | 5 (55.6%) |
| 6 to 18 Years | 8 (17.0%) | 38 (80.8%) |
| 19 to 25 Years | 0 (0.0%) | 7 (100.0%) |
| 25 to 34 Years | 8 (53.3%) | 7 (46.7%) |
| 35 to 44 Years | 10 (34.5%) | 22 (75.9%) |
| 45 to 54 Years | 1 (8.3%) | 10 (83.3%) |
| 55 to 64 Years | 12 (29.3%) | 21 (51.2%) |
| 65 to 74 Years | 32 (100.0%) | 15 (46.9%) |
| 75 Years and over | 14 (100.0%) | 11 (78.6%) |
| Total | 94 (45.6%) | 136 (66.0%) |
Disability Status by Sex by Age in Buck Run
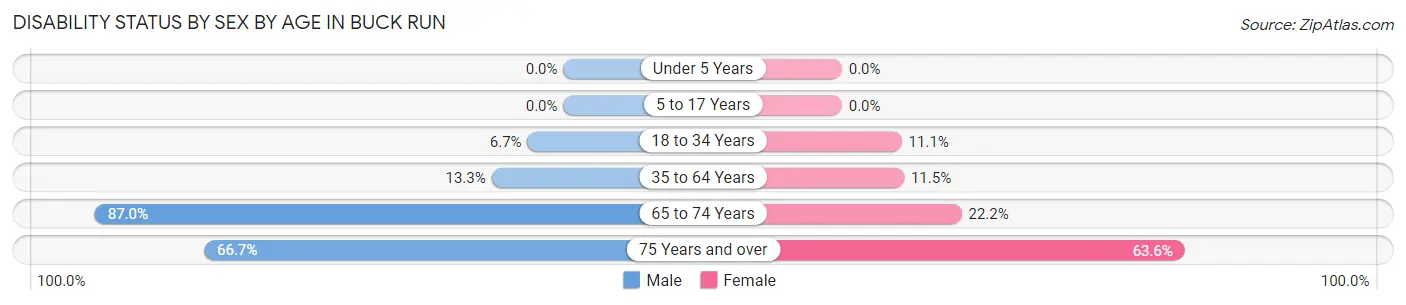
| Age Bracket | Male | Female |
| Under 5 Years | 0 (0.0%) | 0 (0.0%) |
| 5 to 17 Years | 0 (0.0%) | 0 (0.0%) |
| 18 to 34 Years | 1 (6.7%) | 1 (11.1%) |
| 35 to 64 Years | 4 (13.3%) | 6 (11.5%) |
| 65 to 74 Years | 20 (87.0%) | 2 (22.2%) |
| 75 Years and over | 2 (66.7%) | 7 (63.6%) |
Disability Class by Sex by Age in Buck Run
Disability Class: Hearing Difficulty
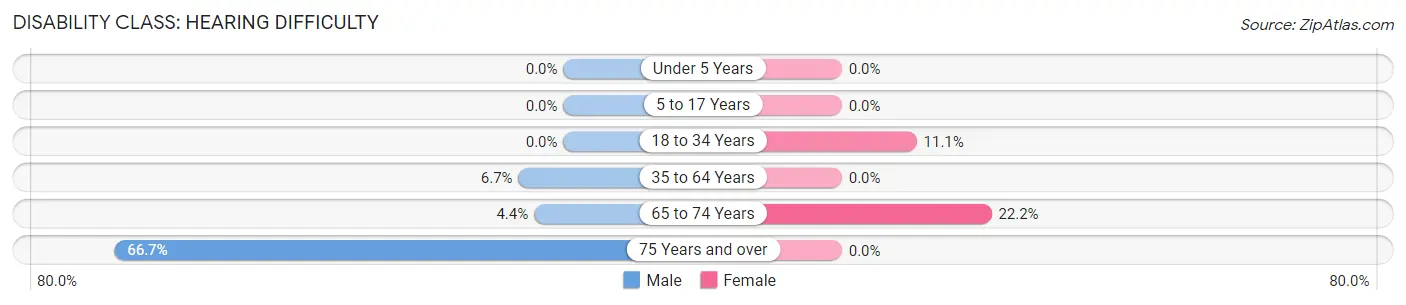
| Age Bracket | Male | Female |
| Under 5 Years | 0 (0.0%) | 0 (0.0%) |
| 5 to 17 Years | 0 (0.0%) | 0 (0.0%) |
| 18 to 34 Years | 0 (0.0%) | 1 (11.1%) |
| 35 to 64 Years | 2 (6.7%) | 0 (0.0%) |
| 65 to 74 Years | 1 (4.3%) | 2 (22.2%) |
| 75 Years and over | 2 (66.7%) | 0 (0.0%) |
Disability Class: Vision Difficulty
| Age Bracket | Male | Female |
| Under 5 Years | 0 (0.0%) | 0 (0.0%) |
| 5 to 17 Years | 0 (0.0%) | 0 (0.0%) |
| 18 to 34 Years | 0 (0.0%) | 0 (0.0%) |
| 35 to 64 Years | 0 (0.0%) | 0 (0.0%) |
| 65 to 74 Years | 0 (0.0%) | 0 (0.0%) |
| 75 Years and over | 0 (0.0%) | 0 (0.0%) |
Disability Class: Cognitive Difficulty
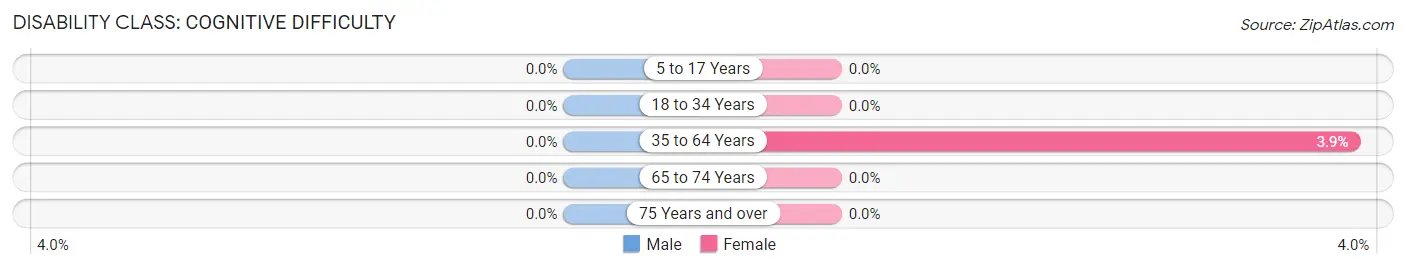
| Age Bracket | Male | Female |
| 5 to 17 Years | 0 (0.0%) | 0 (0.0%) |
| 18 to 34 Years | 0 (0.0%) | 0 (0.0%) |
| 35 to 64 Years | 0 (0.0%) | 2 (3.8%) |
| 65 to 74 Years | 0 (0.0%) | 0 (0.0%) |
| 75 Years and over | 0 (0.0%) | 0 (0.0%) |
Disability Class: Ambulatory Difficulty
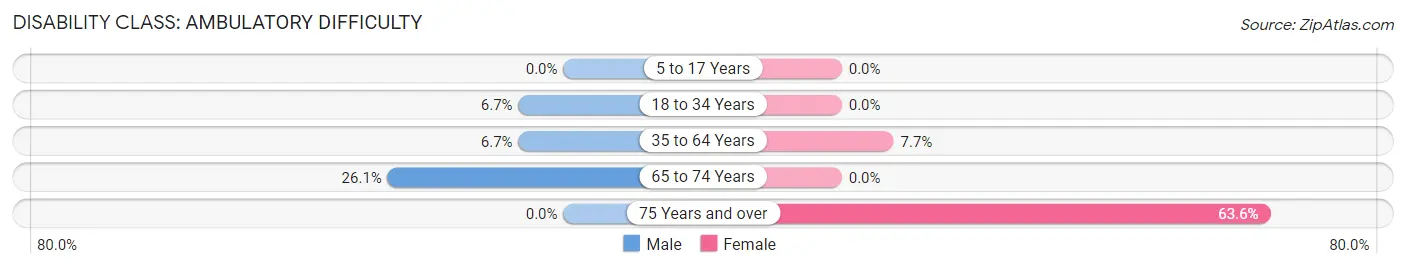
| Age Bracket | Male | Female |
| 5 to 17 Years | 0 (0.0%) | 0 (0.0%) |
| 18 to 34 Years | 1 (6.7%) | 0 (0.0%) |
| 35 to 64 Years | 2 (6.7%) | 4 (7.7%) |
| 65 to 74 Years | 6 (26.1%) | 0 (0.0%) |
| 75 Years and over | 0 (0.0%) | 7 (63.6%) |
Disability Class: Self-Care Difficulty
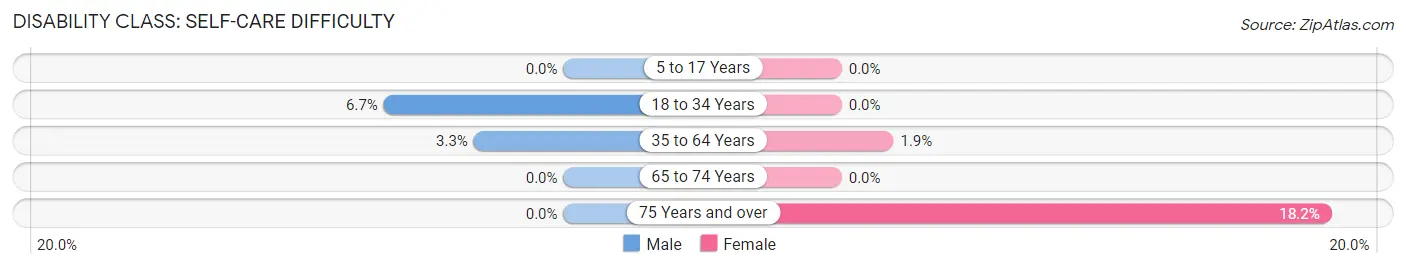
| Age Bracket | Male | Female |
| 5 to 17 Years | 0 (0.0%) | 0 (0.0%) |
| 18 to 34 Years | 1 (6.7%) | 0 (0.0%) |
| 35 to 64 Years | 1 (3.3%) | 1 (1.9%) |
| 65 to 74 Years | 0 (0.0%) | 0 (0.0%) |
| 75 Years and over | 0 (0.0%) | 2 (18.2%) |
Technology Access in Buck Run
Computing Device Access in Buck Run
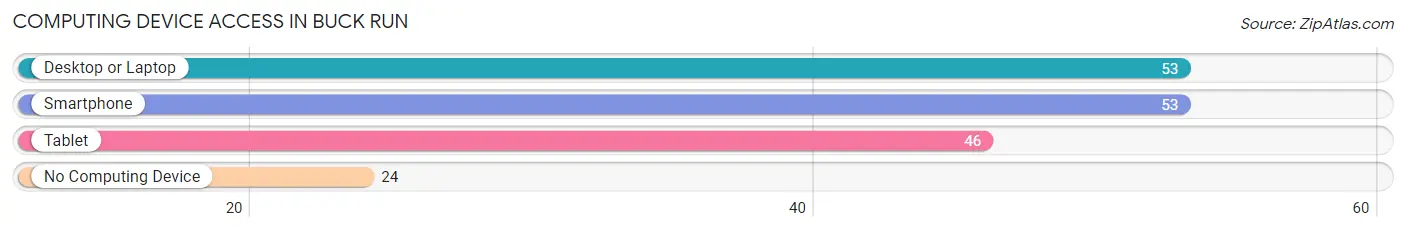
| Device Type | # Households | % Households |
| Desktop or Laptop | 53 | 64.6% |
| Smartphone | 53 | 64.6% |
| Tablet | 46 | 56.1% |
| No Computing Device | 24 | 29.3% |
| Total | 82 | 100.0% |
Internet Access in Buck Run
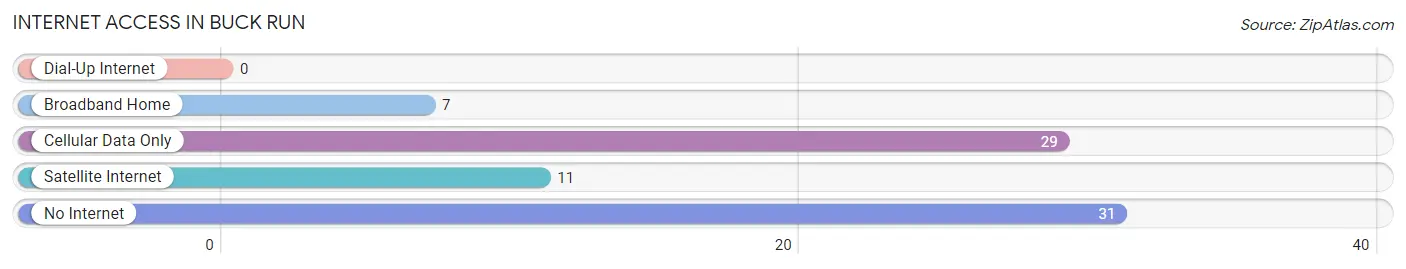
| Internet Type | # Households | % Households |
| Dial-Up Internet | 0 | 0.0% |
| Broadband Home | 7 | 8.5% |
| Cellular Data Only | 29 | 35.4% |
| Satellite Internet | 11 | 13.4% |
| No Internet | 31 | 37.8% |
| Total | 82 | 100.0% |
Buck Run Summary
Buck Run is a small unincorporated community located in the western part of Pennsylvania, in the United States. It is situated in the Allegheny Mountains, in the northern part of the state, and is part of the greater Pittsburgh metropolitan area. The community is located in the borough of West Deer, in Allegheny County.
History
The area that is now Buck Run was first settled in the late 1700s by a group of German immigrants. The community was originally known as “Buck Run” because of the numerous deer that roamed the area. The name was later changed to “West Deer” when the borough was incorporated in 1845.
The area was primarily agricultural until the late 1800s, when the coal industry began to boom in the region. The coal industry brought a large influx of immigrants to the area, and the population of Buck Run began to grow. By the early 1900s, the community had become a bustling coal mining town.
The coal industry in Buck Run began to decline in the mid-1900s, and the population began to decline as well. The decline of the coal industry was due to a combination of factors, including the introduction of new technologies, the rise of natural gas, and the decline of the steel industry. By the late 1900s, the population of Buck Run had dropped to just over 500 people.
Geography
Buck Run is located in the Allegheny Mountains, in the northern part of Pennsylvania. The community is situated in the borough of West Deer, in Allegheny County. The area is characterized by rolling hills and valleys, and is home to a variety of wildlife, including deer, foxes, and other small mammals.
The climate in Buck Run is generally mild, with temperatures ranging from the mid-30s in the winter to the mid-80s in the summer. The area receives an average of 40 inches of precipitation per year, with most of it falling in the form of snow in the winter months.
Economy
The economy of Buck Run is largely based on agriculture and tourism. The area is home to several small farms, which produce a variety of crops, including corn, soybeans, and hay. The area is also home to several wineries, which produce a variety of wines.
Tourism is also an important part of the economy of Buck Run. The area is home to several popular attractions, including the Allegheny National Forest, the Allegheny River, and the Allegheny Reservoir. The area is also home to several popular outdoor activities, such as fishing, hunting, and camping.
Demographics
As of the 2010 census, the population of Buck Run was 517 people. The racial makeup of the community was 97.3% White, 0.6% African American, 0.2% Native American, 0.4% Asian, and 1.5% from other races. The median household income in Buck Run was $45,000, and the median age was 44 years.
Conclusion
Buck Run is a small unincorporated community located in the western part of Pennsylvania, in the United States. It is situated in the Allegheny Mountains, in the northern part of the state, and is part of the greater Pittsburgh metropolitan area. The community is primarily agricultural, with a small tourism industry, and is home to a population of just over 500 people. The economy of Buck Run is largely based on agriculture and tourism, and the area is home to several popular attractions, including the Allegheny National Forest, the Allegheny River, and the Allegheny Reservoir.
Common Questions
What is Per Capita Income in Buck Run?
Per Capita income in Buck Run is $32,947.
What is the Median Family Income in Buck Run?
Median Family Income in Buck Run is $57,500.
What is the Median Household income in Buck Run?
Median Household Income in Buck Run is $57,167.
What is Income or Wage Gap in Buck Run?
Income or Wage Gap in Buck Run is 35.2%.
Women in Buck Run earn 64.8 cents for every dollar earned by a man.
What is Inequality or Gini Index in Buck Run?
Inequality or Gini Index in Buck Run is 0.38.
What is the Total Population of Buck Run?
Total Population of Buck Run is 206.
What is the Total Male Population of Buck Run?
Total Male Population of Buck Run is 96.
What is the Total Female Population of Buck Run?
Total Female Population of Buck Run is 110.
What is the Ratio of Males per 100 Females in Buck Run?
There are 87.27 Males per 100 Females in Buck Run.
What is the Ratio of Females per 100 Males in Buck Run?
There are 114.58 Females per 100 Males in Buck Run.
What is the Median Population Age in Buck Run?
Median Population Age in Buck Run is 42.3 Years.
What is the Average Family Size in Buck Run
Average Family Size in Buck Run is 3.1 People.
What is the Average Household Size in Buck Run
Average Household Size in Buck Run is 2.5 People.
How Large is the Labor Force in Buck Run?
There are 76 People in the Labor Forcein in Buck Run.
What is the Percentage of People in the Labor Force in Buck Run?
48.4% of People are in the Labor Force in Buck Run.
What is the Unemployment Rate in Buck Run?
Unemployment Rate in Buck Run is 11.8%.