Northampton borough, PA Map & Demographics
Northampton borough Overview
$38,274
PER CAPITA INCOME
$89,741
AVG FAMILY INCOME
$77,182
AVG HOUSEHOLD INCOME
41.9%
WAGE / INCOME GAP [ % ]
58.1¢/ $1
WAGE / INCOME GAP [ $ ]
0.43
INEQUALITY / GINI INDEX
10,341
TOTAL POPULATION
5,205
MALE POPULATION
5,136
FEMALE POPULATION
101.34
MALES / 100 FEMALES
98.67
FEMALES / 100 MALES
40.6
MEDIAN AGE
2.9
AVG FAMILY SIZE
2.5
AVG HOUSEHOLD SIZE
5,400
LABOR FORCE [ PEOPLE ]
63.2%
PERCENT IN LABOR FORCE
4.1%
UNEMPLOYMENT RATE
Income in Northampton borough
Income Overview in Northampton borough
Per Capita Income in Northampton borough is $38,274, while median incomes of families and households are $89,741 and $77,182 respectively.
| Characteristic | Number | Measure |
| Per Capita Income | 10,341 | $38,274 |
| Median Family Income | 2,728 | $89,741 |
| Mean Family Income | 2,728 | $107,082 |
| Median Household Income | 4,195 | $77,182 |
| Mean Household Income | 4,195 | $93,024 |
| Income Deficit | 2,728 | $0 |
| Wage / Income Gap (%) | 10,341 | 41.86% |
| Wage / Income Gap ($) | 10,341 | 58.14¢ per $1 |
| Gini / Inequality Index | 10,341 | 0.43 |
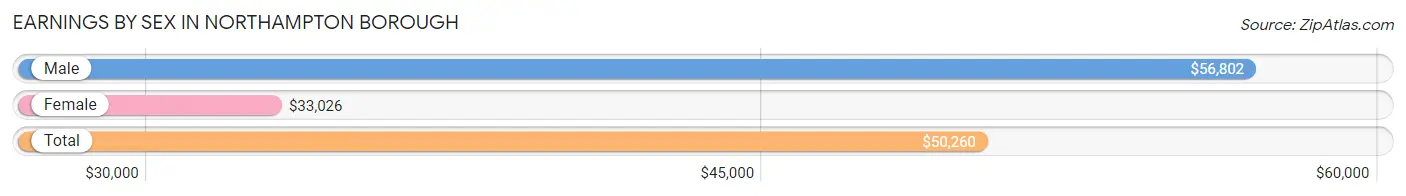
Earnings by Sex in Northampton borough
Average Earnings in Northampton borough are $50,260, $56,802 for men and $33,026 for women, a difference of 41.9%.
| Sex | Number | Average Earnings |
| Male | 2,801 (51.3%) | $56,802 |
| Female | 2,654 (48.6%) | $33,026 |
| Total | 5,455 (100.0%) | $50,260 |
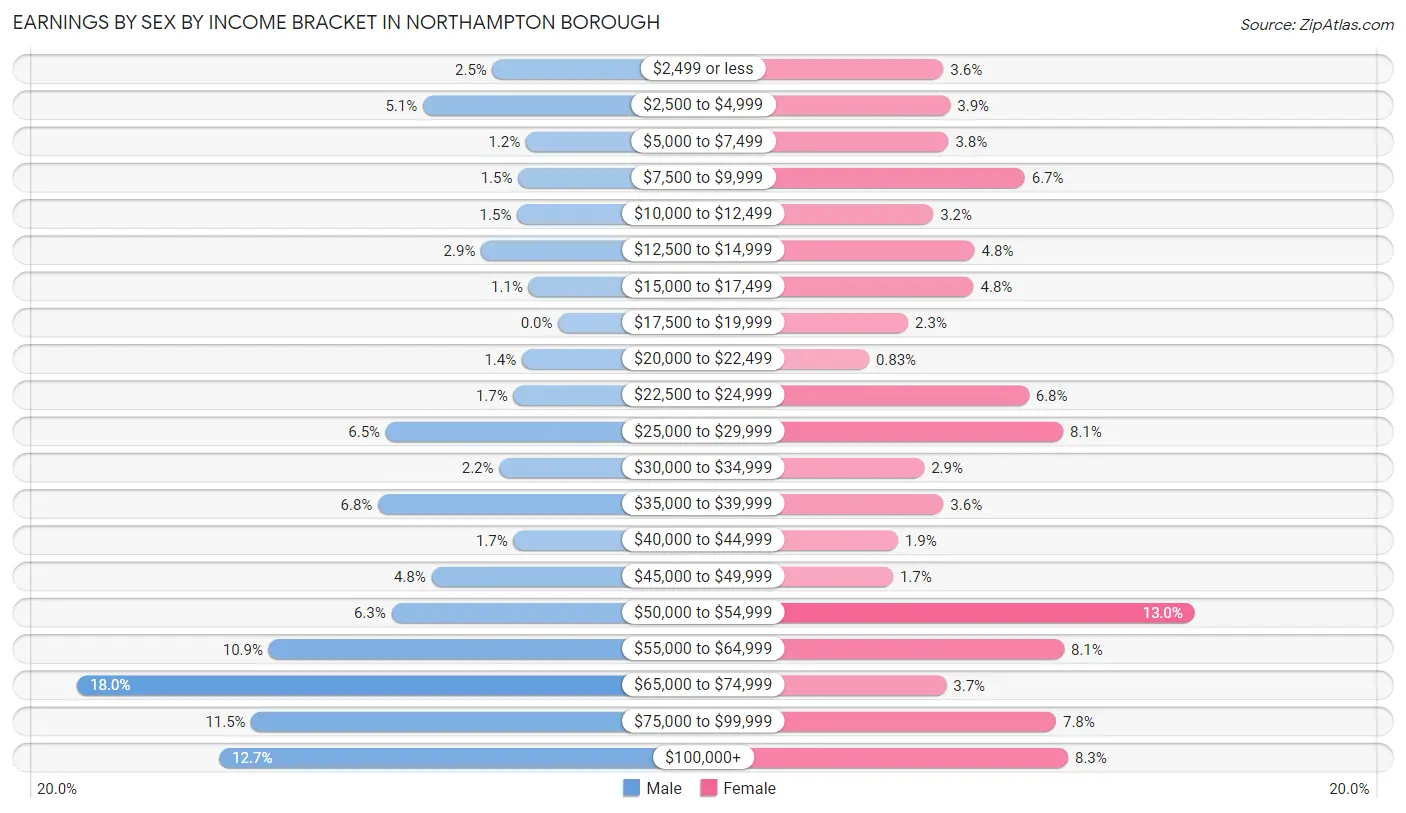
Earnings by Sex by Income Bracket in Northampton borough
The most common earnings brackets in Northampton borough are $65,000 to $74,999 for men (505 | 18.0%) and $50,000 to $54,999 for women (346 | 13.0%).
| Income | Male | Female |
| $2,499 or less | 69 (2.5%) | 96 (3.6%) |
| $2,500 to $4,999 | 142 (5.1%) | 103 (3.9%) |
| $5,000 to $7,499 | 34 (1.2%) | 101 (3.8%) |
| $7,500 to $9,999 | 42 (1.5%) | 177 (6.7%) |
| $10,000 to $12,499 | 43 (1.5%) | 86 (3.2%) |
| $12,500 to $14,999 | 81 (2.9%) | 127 (4.8%) |
| $15,000 to $17,499 | 31 (1.1%) | 126 (4.8%) |
| $17,500 to $19,999 | 0 (0.0%) | 61 (2.3%) |
| $20,000 to $22,499 | 38 (1.4%) | 22 (0.8%) |
| $22,500 to $24,999 | 47 (1.7%) | 181 (6.8%) |
| $25,000 to $29,999 | 181 (6.5%) | 215 (8.1%) |
| $30,000 to $34,999 | 62 (2.2%) | 77 (2.9%) |
| $35,000 to $39,999 | 189 (6.8%) | 96 (3.6%) |
| $40,000 to $44,999 | 47 (1.7%) | 51 (1.9%) |
| $45,000 to $49,999 | 133 (4.8%) | 46 (1.7%) |
| $50,000 to $54,999 | 175 (6.2%) | 346 (13.0%) |
| $55,000 to $64,999 | 304 (10.8%) | 216 (8.1%) |
| $65,000 to $74,999 | 505 (18.0%) | 99 (3.7%) |
| $75,000 to $99,999 | 322 (11.5%) | 208 (7.8%) |
| $100,000+ | 356 (12.7%) | 220 (8.3%) |
| Total | 2,801 (100.0%) | 2,654 (100.0%) |
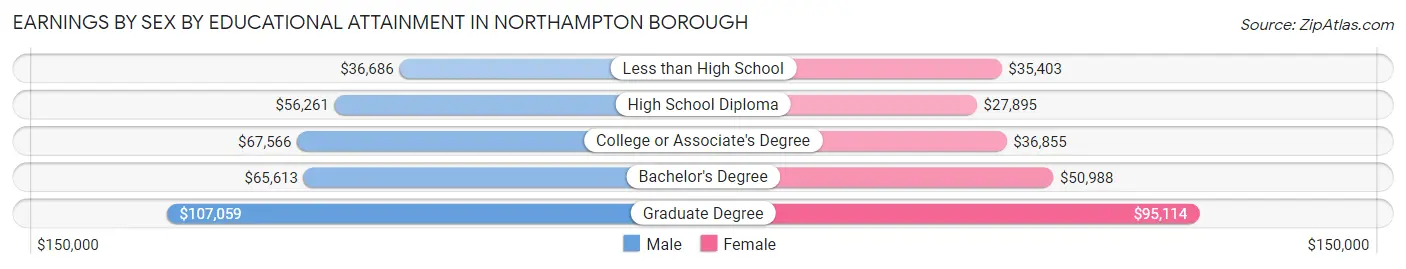
Earnings by Sex by Educational Attainment in Northampton borough
Average earnings in Northampton borough are $60,335 for men and $36,653 for women, a difference of 39.3%. Men with an educational attainment of graduate degree enjoy the highest average annual earnings of $107,059, while those with less than high school education earn the least with $36,686. Women with an educational attainment of graduate degree earn the most with the average annual earnings of $95,114, while those with high school diploma education have the smallest earnings of $27,895.
| Educational Attainment | Male Income | Female Income |
| Less than High School | $36,686 | $35,403 |
| High School Diploma | $56,261 | $27,895 |
| College or Associate's Degree | $67,566 | $36,855 |
| Bachelor's Degree | $65,613 | $50,988 |
| Graduate Degree | $107,059 | $95,114 |
| Total | $60,335 | $36,653 |
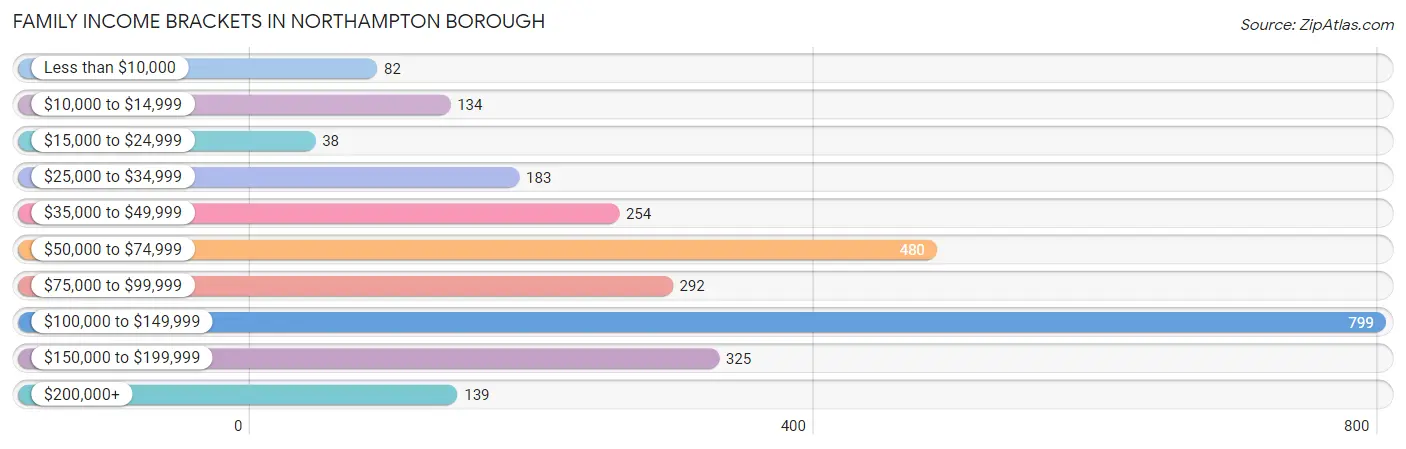
Family Income in Northampton borough
Family Income Brackets in Northampton borough
According to the Northampton borough family income data, there are 799 families falling into the $100,000 to $149,999 income range, which is the most common income bracket and makes up 29.3% of all families. Conversely, the $15,000 to $24,999 income bracket is the least frequent group with only 38 families (1.4%) belonging to this category.
| Income Bracket | # Families | % Families |
| Less than $10,000 | 82 | 3.0% |
| $10,000 to $14,999 | 134 | 4.9% |
| $15,000 to $24,999 | 38 | 1.4% |
| $25,000 to $34,999 | 183 | 6.7% |
| $35,000 to $49,999 | 254 | 9.3% |
| $50,000 to $74,999 | 480 | 17.6% |
| $75,000 to $99,999 | 292 | 10.7% |
| $100,000 to $149,999 | 799 | 29.3% |
| $150,000 to $199,999 | 325 | 11.9% |
| $200,000+ | 139 | 5.1% |
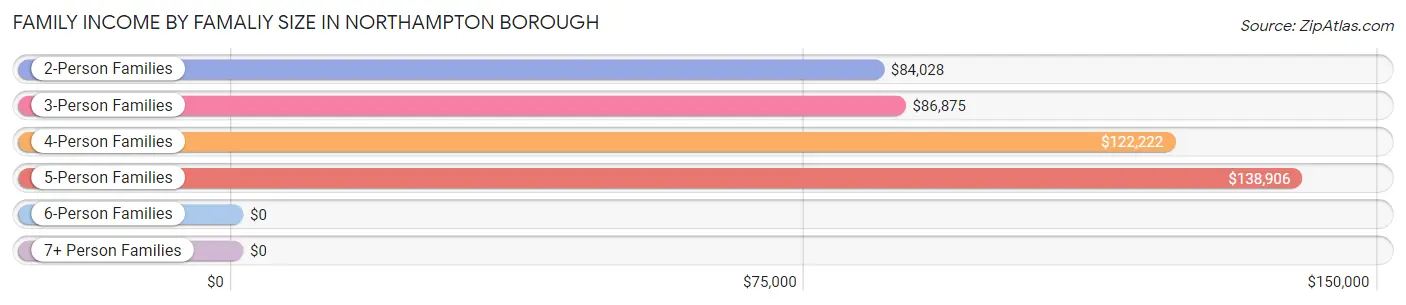
Family Income by Famaliy Size in Northampton borough
5-person families (174 | 6.4%) account for the highest median family income in Northampton borough with $138,906 per family, while 2-person families (1,387 | 50.8%) have the highest median income of $42,014 per family member.
| Income Bracket | # Families | Median Income |
| 2-Person Families | 1,387 (50.8%) | $84,028 |
| 3-Person Families | 768 (28.1%) | $86,875 |
| 4-Person Families | 376 (13.8%) | $122,222 |
| 5-Person Families | 174 (6.4%) | $138,906 |
| 6-Person Families | 22 (0.8%) | $0 |
| 7+ Person Families | 1 (0.0%) | $0 |
| Total | 2,728 (100.0%) | $89,741 |
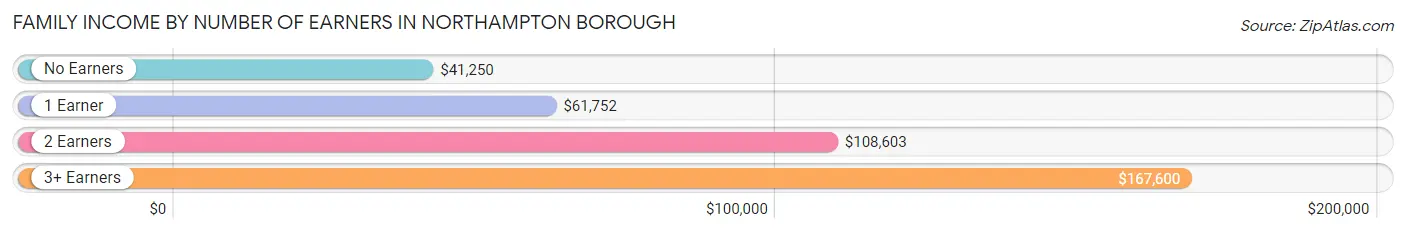
Family Income by Number of Earners in Northampton borough
The median family income in Northampton borough is $89,741, with families comprising 3+ earners (238) having the highest median family income of $167,600, while families with no earners (410) have the lowest median family income of $41,250, accounting for 8.7% and 15.0% of families, respectively.
| Number of Earners | # Families | Median Income |
| No Earners | 410 (15.0%) | $41,250 |
| 1 Earner | 962 (35.3%) | $61,752 |
| 2 Earners | 1,118 (41.0%) | $108,603 |
| 3+ Earners | 238 (8.7%) | $167,600 |
| Total | 2,728 (100.0%) | $89,741 |
Household Income in Northampton borough
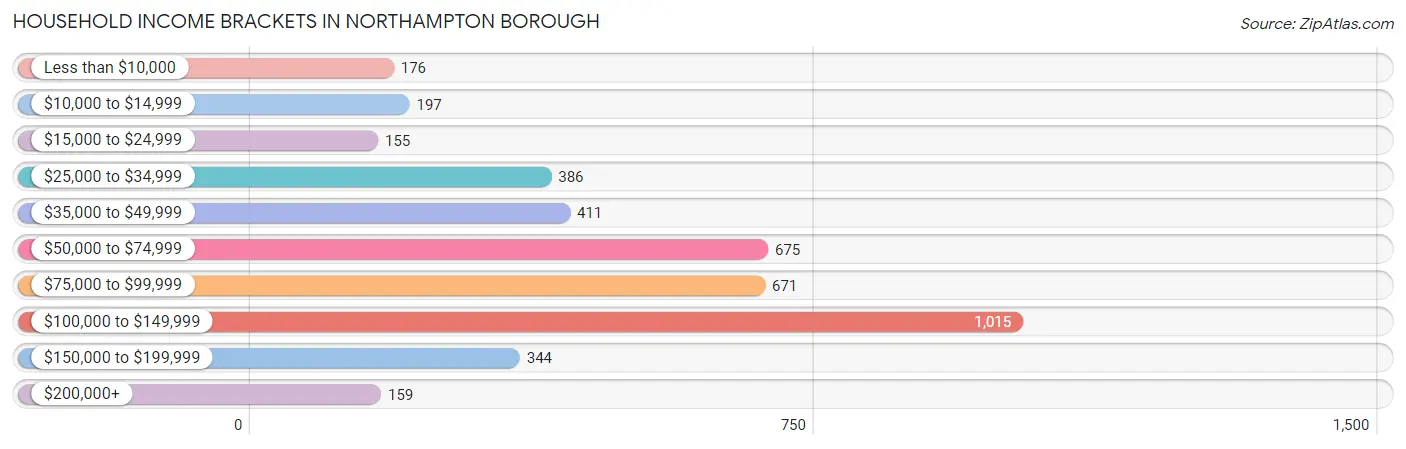
Household Income Brackets in Northampton borough
With 1,015 households falling in the category, the $100,000 to $149,999 income range is the most frequent in Northampton borough, accounting for 24.2% of all households. In contrast, only 155 households (3.7%) fall into the $15,000 to $24,999 income bracket, making it the least populous group.
| Income Bracket | # Households | % Households |
| Less than $10,000 | 176 | 4.2% |
| $10,000 to $14,999 | 197 | 4.7% |
| $15,000 to $24,999 | 155 | 3.7% |
| $25,000 to $34,999 | 386 | 9.2% |
| $35,000 to $49,999 | 411 | 9.8% |
| $50,000 to $74,999 | 675 | 16.1% |
| $75,000 to $99,999 | 671 | 16.0% |
| $100,000 to $149,999 | 1,015 | 24.2% |
| $150,000 to $199,999 | 344 | 8.2% |
| $200,000+ | 159 | 3.8% |
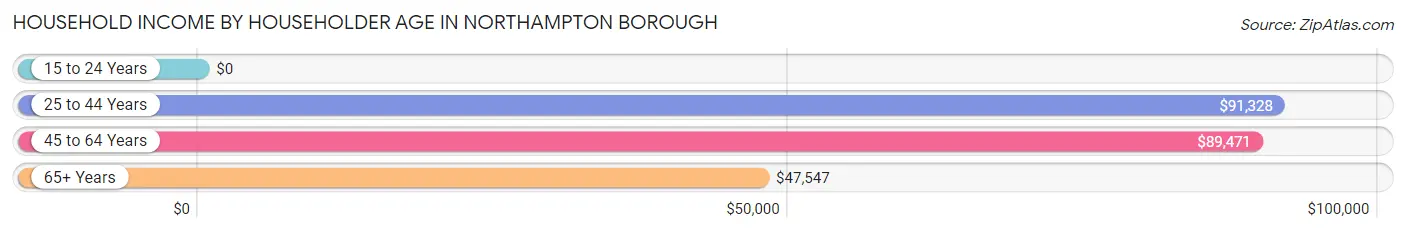
Household Income by Householder Age in Northampton borough
The median household income in Northampton borough is $77,182, with the highest median household income of $91,328 found in the 25 to 44 years age bracket for the primary householder. A total of 1,318 households (31.4%) fall into this category. Meanwhile, the 15 to 24 years age bracket for the primary householder has the lowest median household income of $0, with 71 households (1.7%) in this group.
| Income Bracket | # Households | Median Income |
| 15 to 24 Years | 71 (1.7%) | $0 |
| 25 to 44 Years | 1,318 (31.4%) | $91,328 |
| 45 to 64 Years | 1,591 (37.9%) | $89,471 |
| 65+ Years | 1,215 (29.0%) | $47,547 |
| Total | 4,195 (100.0%) | $77,182 |
Poverty in Northampton borough
Income Below Poverty by Sex and Age in Northampton borough
With 5.2% poverty level for males and 13.0% for females among the residents of Northampton borough, 55 to 64 year old males and 16 and 17 year old females are the most vulnerable to poverty, with 131 males (15.8%) and 79 females (85.0%) in their respective age groups living below the poverty level.
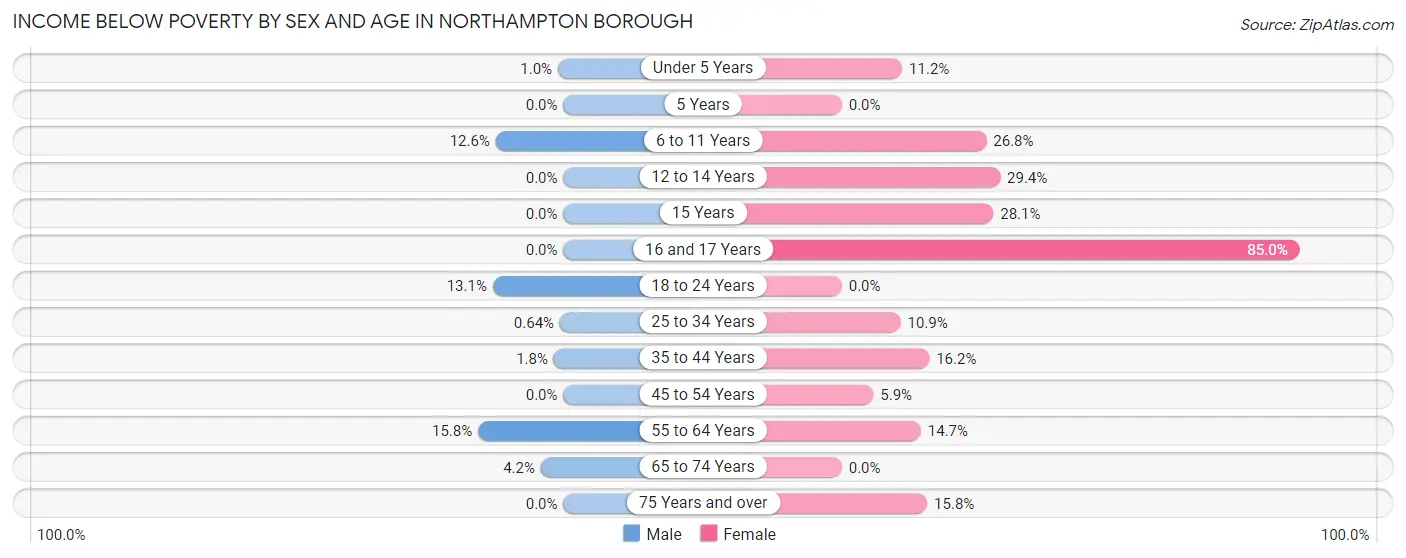
| Age Bracket | Male | Female |
| Under 5 Years | 2 (1.0%) | 27 (11.2%) |
| 5 Years | 0 (0.0%) | 0 (0.0%) |
| 6 to 11 Years | 50 (12.6%) | 44 (26.8%) |
| 12 to 14 Years | 0 (0.0%) | 67 (29.4%) |
| 15 Years | 0 (0.0%) | 18 (28.1%) |
| 16 and 17 Years | 0 (0.0%) | 79 (85.0%) |
| 18 to 24 Years | 46 (13.1%) | 0 (0.0%) |
| 25 to 34 Years | 7 (0.6%) | 103 (10.9%) |
| 35 to 44 Years | 8 (1.8%) | 68 (16.2%) |
| 45 to 54 Years | 0 (0.0%) | 39 (5.9%) |
| 55 to 64 Years | 131 (15.8%) | 130 (14.7%) |
| 65 to 74 Years | 23 (4.2%) | 0 (0.0%) |
| 75 Years and over | 0 (0.0%) | 73 (15.8%) |
| Total | 267 (5.2%) | 648 (13.0%) |
Income Above Poverty by Sex and Age in Northampton borough
According to the poverty statistics in Northampton borough, males aged 5 years and females aged 5 years are the age groups that are most secure financially, with 100.0% of males and 100.0% of females in these age groups living above the poverty line.
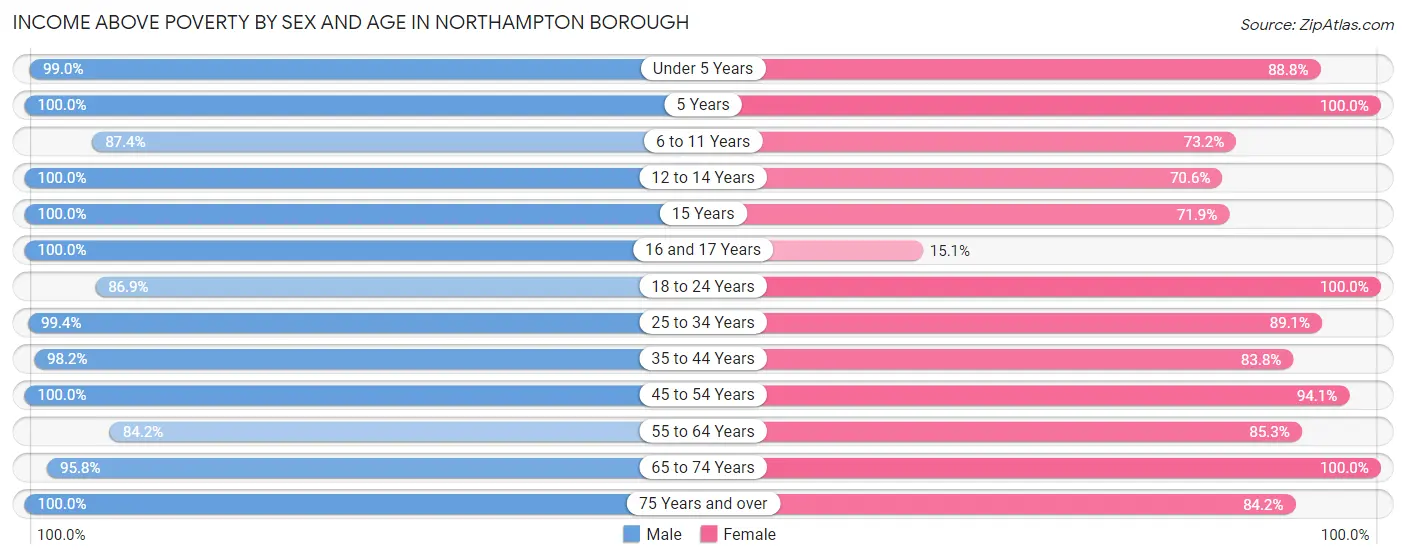
| Age Bracket | Male | Female |
| Under 5 Years | 196 (99.0%) | 214 (88.8%) |
| 5 Years | 86 (100.0%) | 6 (100.0%) |
| 6 to 11 Years | 348 (87.4%) | 120 (73.2%) |
| 12 to 14 Years | 120 (100.0%) | 161 (70.6%) |
| 15 Years | 40 (100.0%) | 46 (71.9%) |
| 16 and 17 Years | 50 (100.0%) | 14 (15.0%) |
| 18 to 24 Years | 305 (86.9%) | 292 (100.0%) |
| 25 to 34 Years | 1,083 (99.4%) | 842 (89.1%) |
| 35 to 44 Years | 444 (98.2%) | 351 (83.8%) |
| 45 to 54 Years | 597 (100.0%) | 627 (94.1%) |
| 55 to 64 Years | 696 (84.2%) | 756 (85.3%) |
| 65 to 74 Years | 527 (95.8%) | 520 (100.0%) |
| 75 Years and over | 323 (100.0%) | 388 (84.2%) |
| Total | 4,815 (94.8%) | 4,337 (87.0%) |
Income Below Poverty Among Married-Couple Families in Northampton borough
The poverty statistics for married-couple families in Northampton borough show that 4.8% or 83 of the total 1,718 families live below the poverty line. Families with 5 or more children have the highest poverty rate of 100.0%, comprising of 1 families. On the other hand, families with 1 or 2 children have the lowest poverty rate of 0.0%, which includes 0 families.
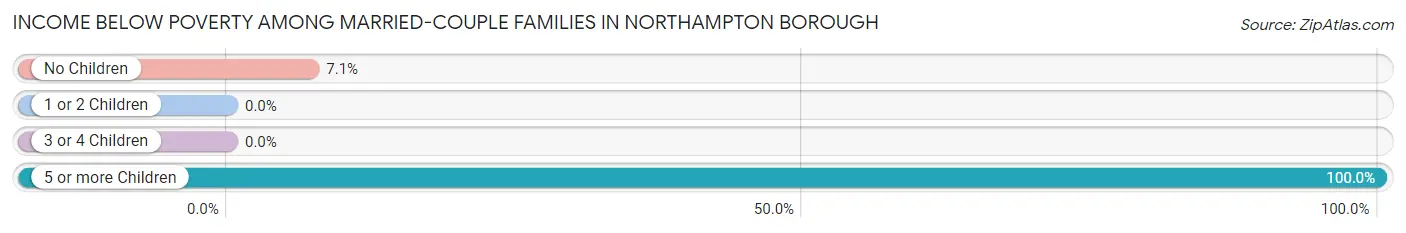
| Children | Above Poverty | Below Poverty |
| No Children | 1,076 (92.9%) | 82 (7.1%) |
| 1 or 2 Children | 476 (100.0%) | 0 (0.0%) |
| 3 or 4 Children | 83 (100.0%) | 0 (0.0%) |
| 5 or more Children | 0 (0.0%) | 1 (100.0%) |
| Total | 1,635 (95.2%) | 83 (4.8%) |
Income Below Poverty Among Single-Parent Households in Northampton borough
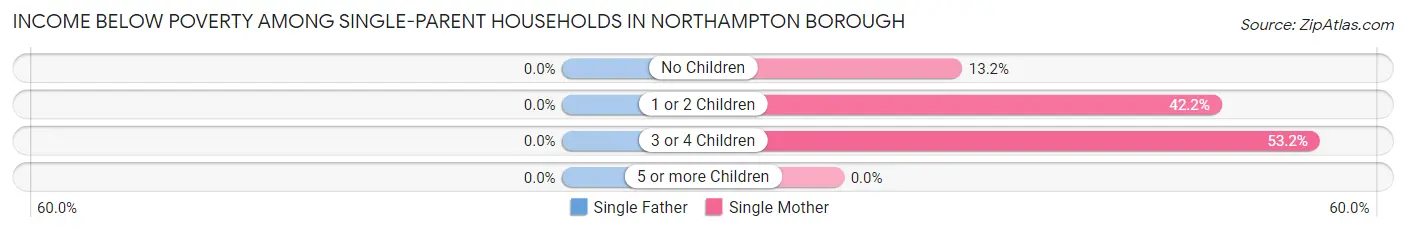
| Children | Single Father | Single Mother |
| No Children | 0 (0.0%) | 49 (13.2%) |
| 1 or 2 Children | 0 (0.0%) | 87 (42.2%) |
| 3 or 4 Children | 0 (0.0%) | 25 (53.2%) |
| 5 or more Children | 0 (0.0%) | 0 (0.0%) |
| Total | 0 (0.0%) | 161 (25.8%) |
Income Below Poverty Among Married-Couple vs Single-Parent Households in Northampton borough
The poverty data for Northampton borough shows that 83 of the married-couple family households (4.8%) and 161 of the single-parent households (15.9%) are living below the poverty level. Within the married-couple family households, those with 5 or more children have the highest poverty rate, with 1 households (100.0%) falling below the poverty line. Among the single-parent households, those with 3 or 4 children have the highest poverty rate, with 25 household (45.5%) living below poverty.
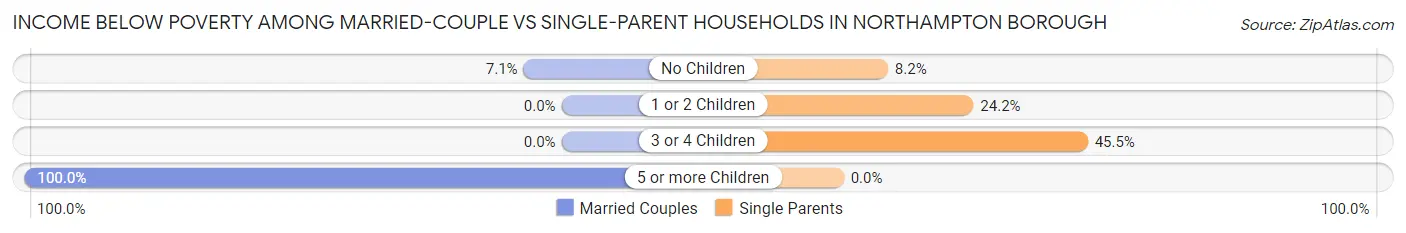
| Children | Married-Couple Families | Single-Parent Households |
| No Children | 82 (7.1%) | 49 (8.2%) |
| 1 or 2 Children | 0 (0.0%) | 87 (24.2%) |
| 3 or 4 Children | 0 (0.0%) | 25 (45.5%) |
| 5 or more Children | 1 (100.0%) | 0 (0.0%) |
| Total | 83 (4.8%) | 161 (15.9%) |
Race in Northampton borough
The most populous races in Northampton borough are White / Caucasian (9,107 | 88.1%), Hispanic or Latino (1,029 | 10.0%), and Two or more Races (650 | 6.3%).
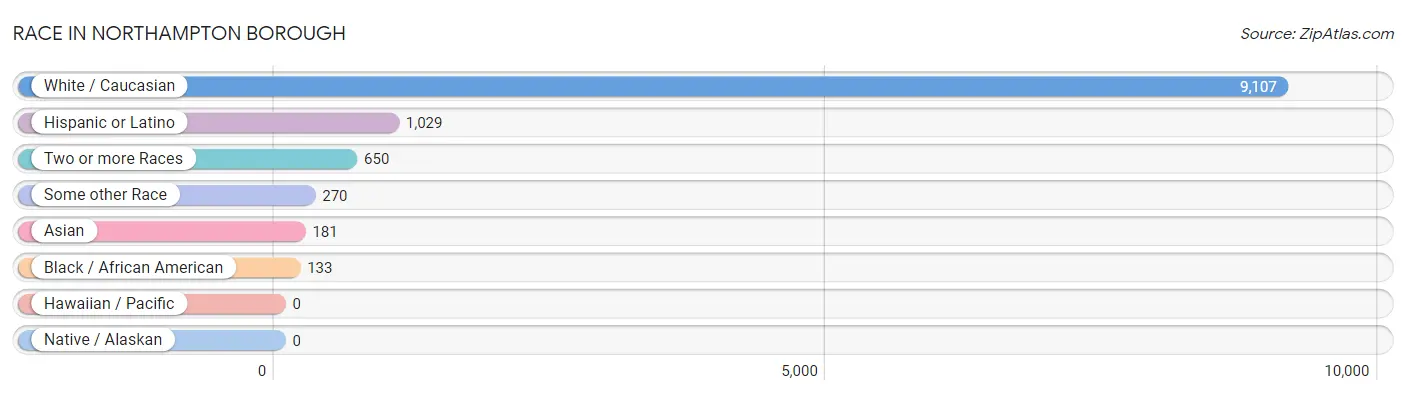
| Race | # Population | % Population |
| Asian | 181 | 1.8% |
| Black / African American | 133 | 1.3% |
| Hawaiian / Pacific | 0 | 0.0% |
| Hispanic or Latino | 1,029 | 10.0% |
| Native / Alaskan | 0 | 0.0% |
| White / Caucasian | 9,107 | 88.1% |
| Two or more Races | 650 | 6.3% |
| Some other Race | 270 | 2.6% |
| Total | 10,341 | 100.0% |
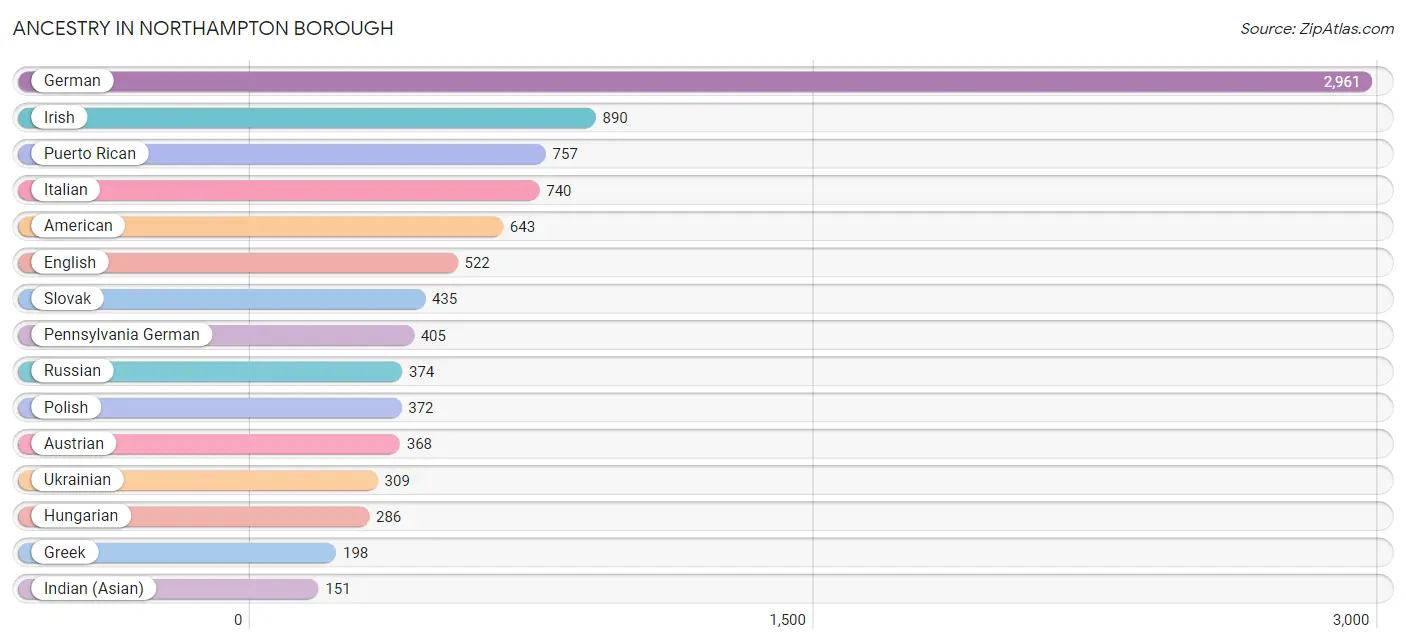
Ancestry in Northampton borough
The most populous ancestries reported in Northampton borough are German (2,961 | 28.6%), Irish (890 | 8.6%), Puerto Rican (757 | 7.3%), Italian (740 | 7.2%), and American (643 | 6.2%), together accounting for 57.9% of all Northampton borough residents.
| Ancestry | # Population | % Population |
| American | 643 | 6.2% |
| Arab | 39 | 0.4% |
| Austrian | 368 | 3.6% |
| Bolivian | 12 | 0.1% |
| British | 39 | 0.4% |
| Colombian | 8 | 0.1% |
| Croatian | 27 | 0.3% |
| Czech | 52 | 0.5% |
| Delaware | 12 | 0.1% |
| Dominican | 50 | 0.5% |
| Dutch | 78 | 0.7% |
| Eastern European | 53 | 0.5% |
| Ecuadorian | 13 | 0.1% |
| English | 522 | 5.1% |
| European | 84 | 0.8% |
| French | 106 | 1.0% |
| French Canadian | 10 | 0.1% |
| German | 2,961 | 28.6% |
| Greek | 198 | 1.9% |
| Hungarian | 286 | 2.8% |
| Indian (Asian) | 151 | 1.5% |
| Irish | 890 | 8.6% |
| Italian | 740 | 7.2% |
| Korean | 8 | 0.1% |
| Lithuanian | 1 | 0.0% |
| Mexican | 62 | 0.6% |
| Norwegian | 30 | 0.3% |
| Pakistani | 25 | 0.2% |
| Pennsylvania German | 405 | 3.9% |
| Peruvian | 17 | 0.2% |
| Polish | 372 | 3.6% |
| Portuguese | 23 | 0.2% |
| Puerto Rican | 757 | 7.3% |
| Russian | 374 | 3.6% |
| Scandinavian | 22 | 0.2% |
| Scotch-Irish | 8 | 0.1% |
| Scottish | 39 | 0.4% |
| Slavic | 29 | 0.3% |
| Slovak | 435 | 4.2% |
| South American | 146 | 1.4% |
| Spanish | 14 | 0.1% |
| Sri Lankan | 39 | 0.4% |
| Swedish | 11 | 0.1% |
| Swiss | 88 | 0.9% |
| Syrian | 31 | 0.3% |
| Thai | 16 | 0.2% |
| Ukrainian | 309 | 3.0% |
| Welsh | 91 | 0.9% |
| Yugoslavian | 13 | 0.1% | View All 49 Rows |
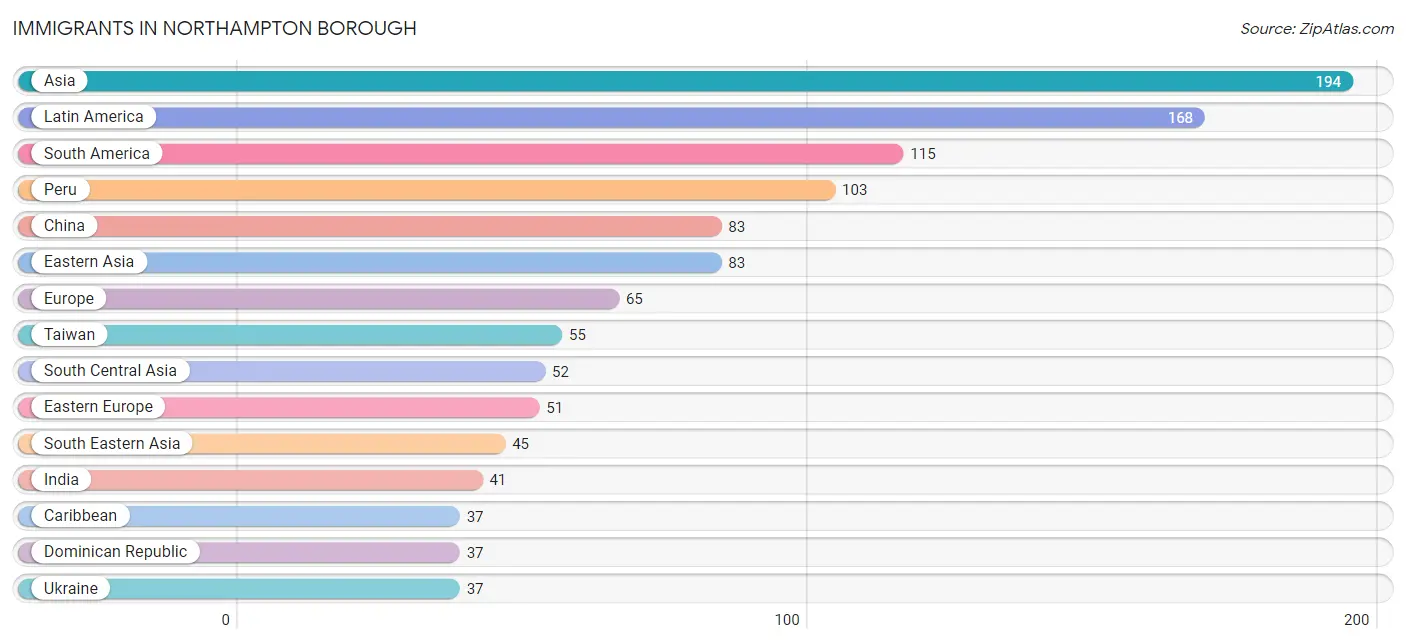
Immigrants in Northampton borough
The most numerous immigrant groups reported in Northampton borough came from Asia (194 | 1.9%), Latin America (168 | 1.6%), South America (115 | 1.1%), Peru (103 | 1.0%), and China (83 | 0.8%), together accounting for 6.4% of all Northampton borough residents.
| Immigration Origin | # Population | % Population |
| Asia | 194 | 1.9% |
| Bolivia | 12 | 0.1% |
| Caribbean | 37 | 0.4% |
| Central America | 16 | 0.2% |
| China | 83 | 0.8% |
| Dominican Republic | 37 | 0.4% |
| Eastern Asia | 83 | 0.8% |
| Eastern Europe | 51 | 0.5% |
| Europe | 65 | 0.6% |
| India | 41 | 0.4% |
| Kazakhstan | 11 | 0.1% |
| Latin America | 168 | 1.6% |
| Mexico | 16 | 0.2% |
| Peru | 103 | 1.0% |
| Poland | 14 | 0.1% |
| South America | 115 | 1.1% |
| South Central Asia | 52 | 0.5% |
| South Eastern Asia | 45 | 0.4% |
| Switzerland | 14 | 0.1% |
| Syria | 14 | 0.1% |
| Taiwan | 55 | 0.5% |
| Thailand | 25 | 0.2% |
| Ukraine | 37 | 0.4% |
| Vietnam | 20 | 0.2% |
| Western Asia | 14 | 0.1% |
| Western Europe | 14 | 0.1% | View All 26 Rows |
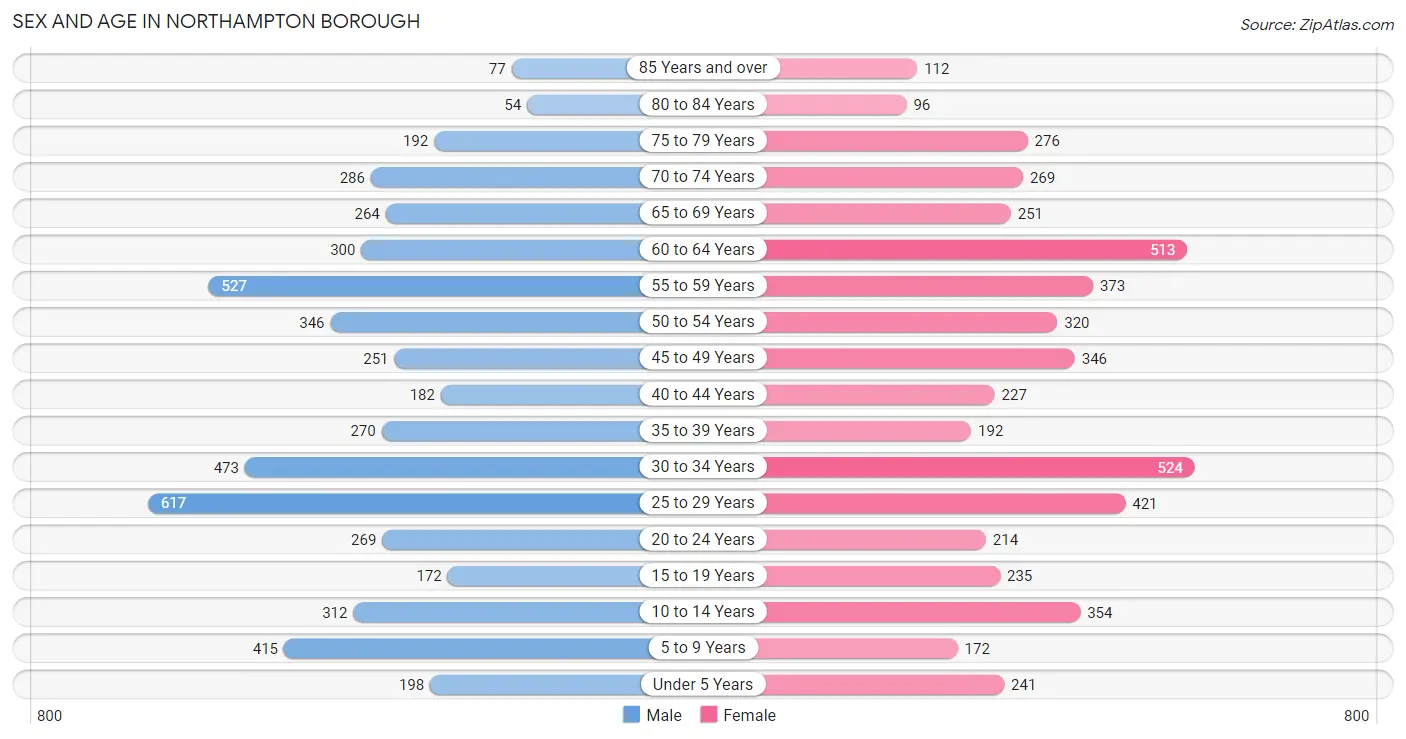
Sex and Age in Northampton borough
Sex and Age in Northampton borough
The most populous age groups in Northampton borough are 25 to 29 Years (617 | 11.8%) for men and 30 to 34 Years (524 | 10.2%) for women.
| Age Bracket | Male | Female |
| Under 5 Years | 198 (3.8%) | 241 (4.7%) |
| 5 to 9 Years | 415 (8.0%) | 172 (3.4%) |
| 10 to 14 Years | 312 (6.0%) | 354 (6.9%) |
| 15 to 19 Years | 172 (3.3%) | 235 (4.6%) |
| 20 to 24 Years | 269 (5.2%) | 214 (4.2%) |
| 25 to 29 Years | 617 (11.8%) | 421 (8.2%) |
| 30 to 34 Years | 473 (9.1%) | 524 (10.2%) |
| 35 to 39 Years | 270 (5.2%) | 192 (3.7%) |
| 40 to 44 Years | 182 (3.5%) | 227 (4.4%) |
| 45 to 49 Years | 251 (4.8%) | 346 (6.7%) |
| 50 to 54 Years | 346 (6.7%) | 320 (6.2%) |
| 55 to 59 Years | 527 (10.1%) | 373 (7.3%) |
| 60 to 64 Years | 300 (5.8%) | 513 (10.0%) |
| 65 to 69 Years | 264 (5.1%) | 251 (4.9%) |
| 70 to 74 Years | 286 (5.5%) | 269 (5.2%) |
| 75 to 79 Years | 192 (3.7%) | 276 (5.4%) |
| 80 to 84 Years | 54 (1.0%) | 96 (1.9%) |
| 85 Years and over | 77 (1.5%) | 112 (2.2%) |
| Total | 5,205 (100.0%) | 5,136 (100.0%) |
Families and Households in Northampton borough
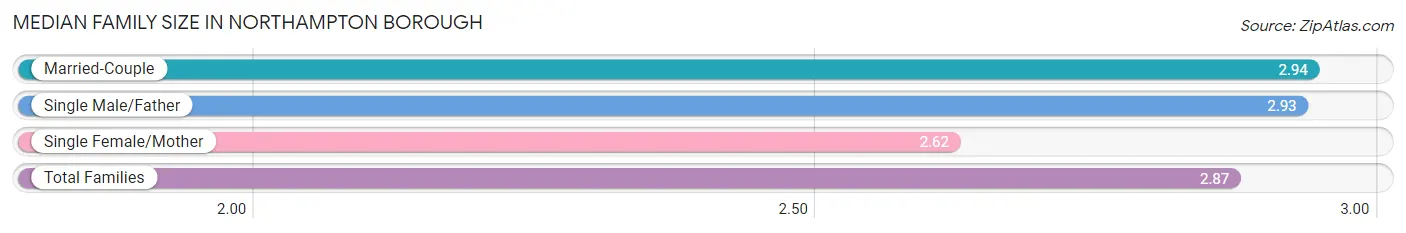
Median Family Size in Northampton borough
The median family size in Northampton borough is 2.87 persons per family, with married-couple families (1,718 | 63.0%) accounting for the largest median family size of 2.94 persons per family. On the other hand, single female/mother families (624 | 22.9%) represent the smallest median family size with 2.62 persons per family.
| Family Type | # Families | Family Size |
| Married-Couple | 1,718 (63.0%) | 2.94 |
| Single Male/Father | 386 (14.1%) | 2.93 |
| Single Female/Mother | 624 (22.9%) | 2.62 |
| Total Families | 2,728 (100.0%) | 2.87 |
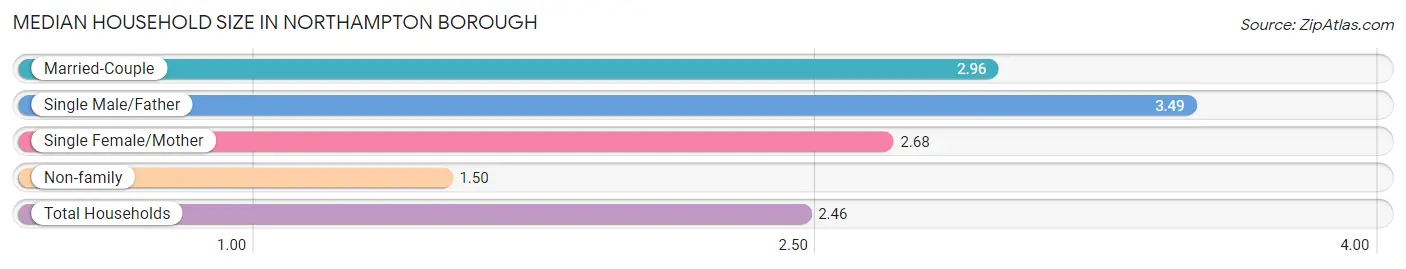
Median Household Size in Northampton borough
The median household size in Northampton borough is 2.46 persons per household, with single male/father households (386 | 9.2%) accounting for the largest median household size of 3.49 persons per household. non-family households (1,467 | 35.0%) represent the smallest median household size with 1.50 persons per household.
| Household Type | # Households | Household Size |
| Married-Couple | 1,718 (40.9%) | 2.96 |
| Single Male/Father | 386 (9.2%) | 3.49 |
| Single Female/Mother | 624 (14.9%) | 2.68 |
| Non-family | 1,467 (35.0%) | 1.50 |
| Total Households | 4,195 (100.0%) | 2.46 |
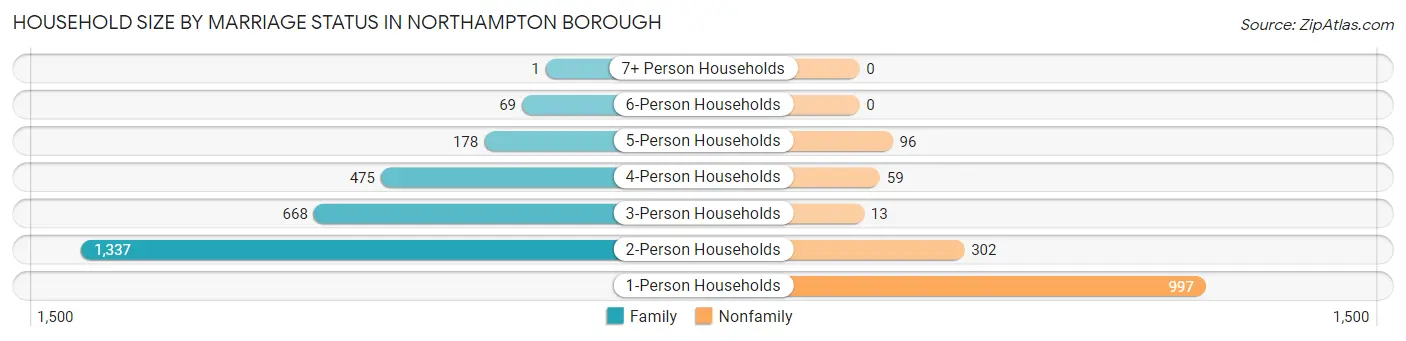
Household Size by Marriage Status in Northampton borough
Out of a total of 4,195 households in Northampton borough, 2,728 (65.0%) are family households, while 1,467 (35.0%) are nonfamily households. The most numerous type of family households are 2-person households, comprising 1,337, and the most common type of nonfamily households are 1-person households, comprising 997.
| Household Size | Family Households | Nonfamily Households |
| 1-Person Households | - | 997 (23.8%) |
| 2-Person Households | 1,337 (31.9%) | 302 (7.2%) |
| 3-Person Households | 668 (15.9%) | 13 (0.3%) |
| 4-Person Households | 475 (11.3%) | 59 (1.4%) |
| 5-Person Households | 178 (4.2%) | 96 (2.3%) |
| 6-Person Households | 69 (1.6%) | 0 (0.0%) |
| 7+ Person Households | 1 (0.0%) | 0 (0.0%) |
| Total | 2,728 (65.0%) | 1,467 (35.0%) |
Female Fertility in Northampton borough
Fertility by Age in Northampton borough
Average fertility rate in Northampton borough is 43.0 births per 1,000 women. Women in the age bracket of 20 to 34 years have the highest fertility rate with 69.0 births per 1,000 women. Women in the age bracket of 20 to 34 years acount for 84.2% of all women with births.
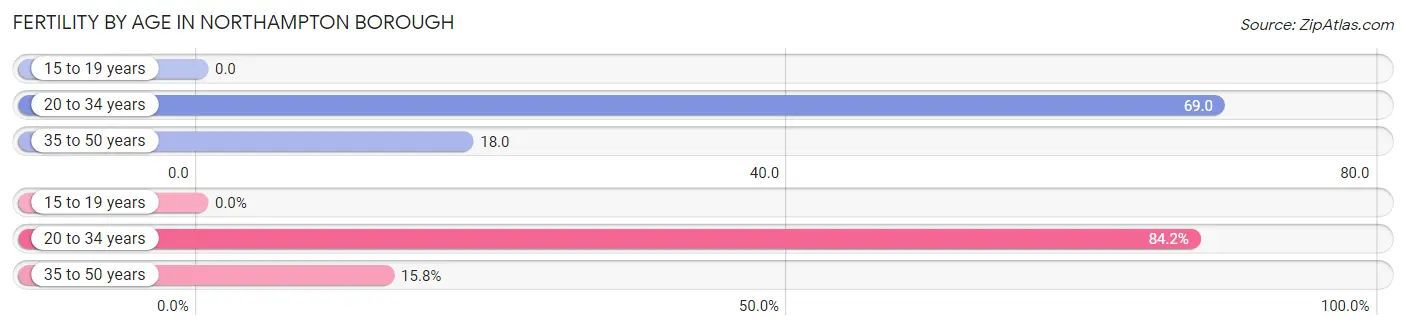
| Age Bracket | Women with Births | Births / 1,000 Women |
| 15 to 19 years | 0 (0.0%) | 0.0 |
| 20 to 34 years | 80 (84.2%) | 69.0 |
| 35 to 50 years | 15 (15.8%) | 18.0 |
| Total | 95 (100.0%) | 43.0 |
Fertility by Age by Marriage Status in Northampton borough
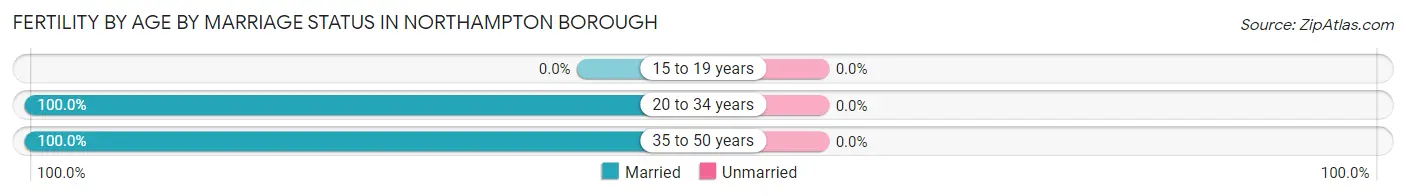
| Age Bracket | Married | Unmarried |
| 15 to 19 years | 0 (0.0%) | 0 (0.0%) |
| 20 to 34 years | 80 (100.0%) | 0 (0.0%) |
| 35 to 50 years | 15 (100.0%) | 0 (0.0%) |
| Total | 95 (100.0%) | 0 (0.0%) |
Fertility by Education in Northampton borough
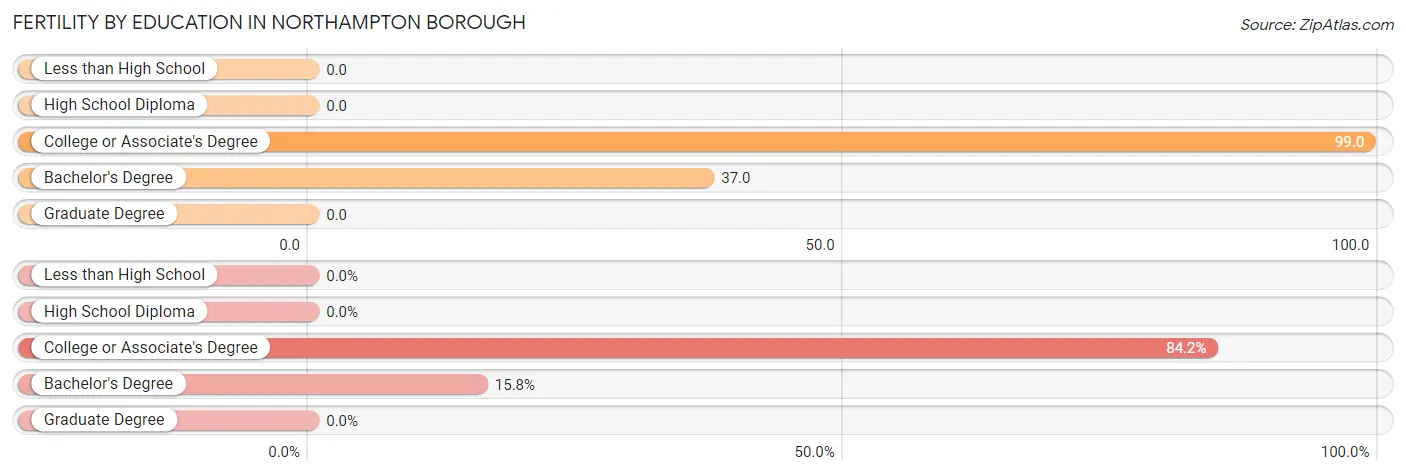
| Educational Attainment | Women with Births | Births / 1,000 Women |
| Less than High School | 0 (0.0%) | 0.0 |
| High School Diploma | 0 (0.0%) | 0.0 |
| College or Associate's Degree | 80 (84.2%) | 99.0 |
| Bachelor's Degree | 15 (15.8%) | 37.0 |
| Graduate Degree | 0 (0.0%) | 0.0 |
| Total | 95 (100.0%) | 43.0 |
Fertility by Education by Marriage Status in Northampton borough
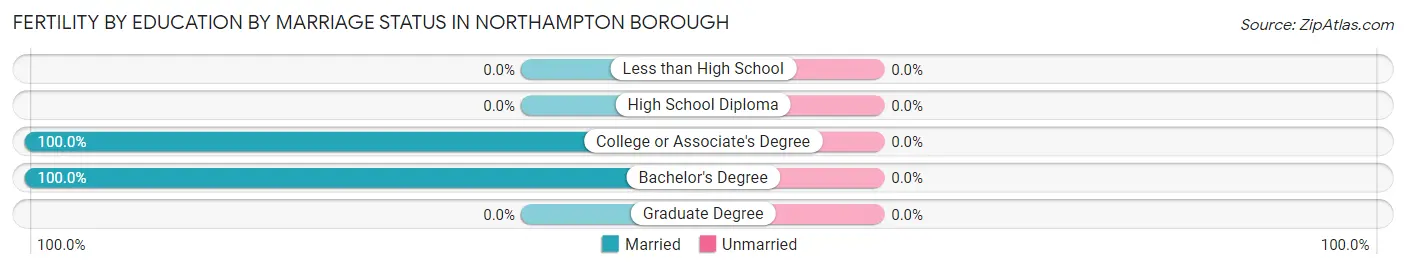
| Educational Attainment | Married | Unmarried |
| Less than High School | 0 (0.0%) | 0 (0.0%) |
| High School Diploma | 0 (0.0%) | 0 (0.0%) |
| College or Associate's Degree | 80 (100.0%) | 0 (0.0%) |
| Bachelor's Degree | 15 (100.0%) | 0 (0.0%) |
| Graduate Degree | 0 (0.0%) | 0 (0.0%) |
| Total | 95 (100.0%) | 0 (0.0%) |
Employment Characteristics in Northampton borough
Employment by Class of Employer in Northampton borough
Among the 5,159 employed individuals in Northampton borough, private company employees (3,930 | 76.2%), not-for-profit organizations (552 | 10.7%), and local government employees (339 | 6.6%) make up the most common classes of employment.
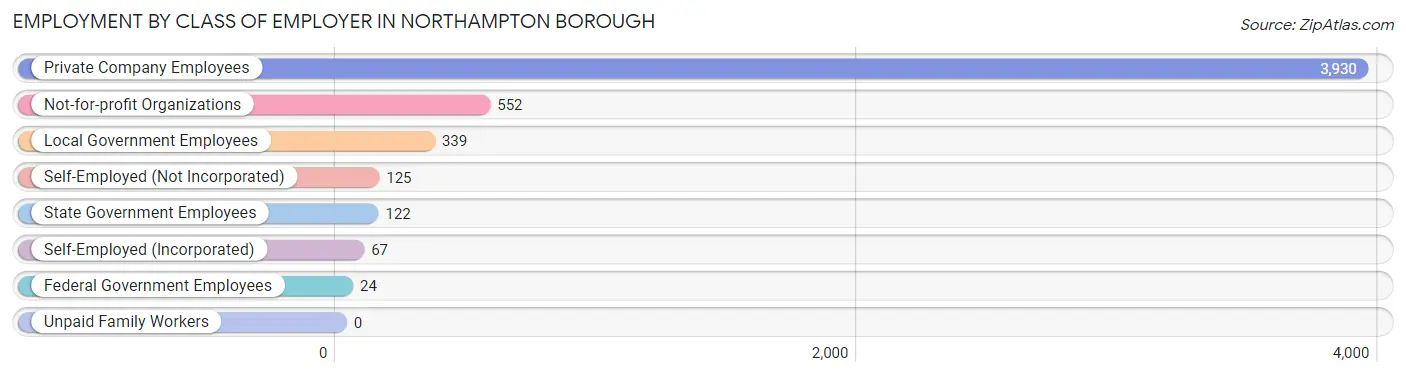
| Employer Class | # Employees | % Employees |
| Private Company Employees | 3,930 | 76.2% |
| Self-Employed (Incorporated) | 67 | 1.3% |
| Self-Employed (Not Incorporated) | 125 | 2.4% |
| Not-for-profit Organizations | 552 | 10.7% |
| Local Government Employees | 339 | 6.6% |
| State Government Employees | 122 | 2.4% |
| Federal Government Employees | 24 | 0.5% |
| Unpaid Family Workers | 0 | 0.0% |
| Total | 5,159 | 100.0% |
Employment Status by Age in Northampton borough
According to the labor force statistics for Northampton borough, out of the total population over 16 years of age (8,545), 63.2% or 5,400 individuals are in the labor force, with 4.1% or 221 of them unemployed. The age group with the highest labor force participation rate is 35 to 44 years, with 89.4% or 779 individuals in the labor force. Within the labor force, the 16 to 19 years age range has the highest percentage of unemployed individuals, with 17.0% or 17 of them being unemployed.
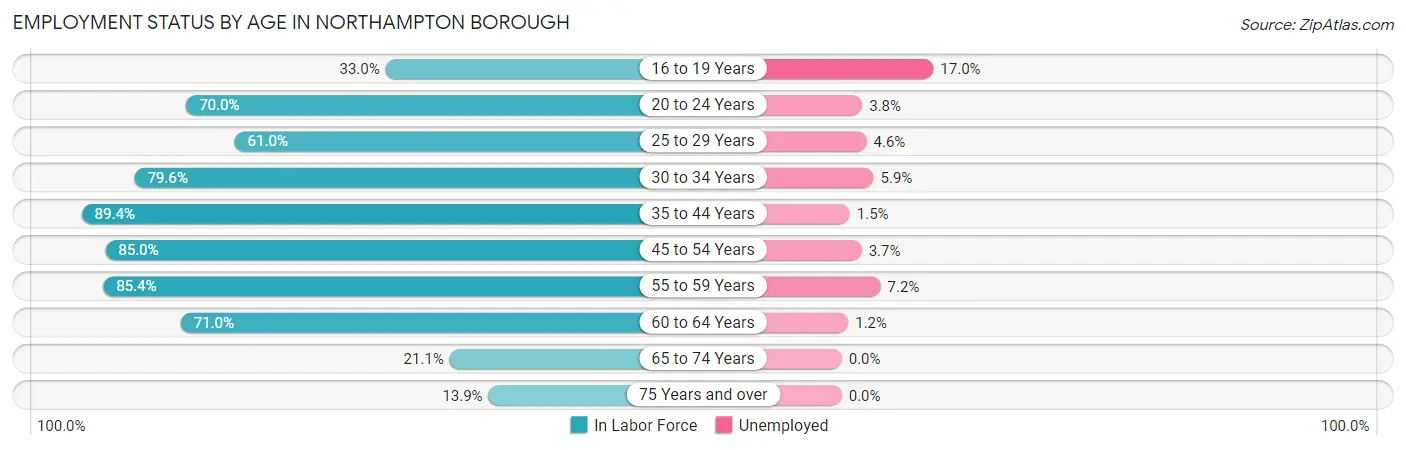
| Age Bracket | In Labor Force | Unemployed |
| 16 to 19 Years | 100 (33.0%) | 17 (17.0%) |
| 20 to 24 Years | 338 (70.0%) | 13 (3.8%) |
| 25 to 29 Years | 633 (61.0%) | 29 (4.6%) |
| 30 to 34 Years | 794 (79.6%) | 47 (5.9%) |
| 35 to 44 Years | 779 (89.4%) | 12 (1.5%) |
| 45 to 54 Years | 1,074 (85.0%) | 40 (3.7%) |
| 55 to 59 Years | 769 (85.4%) | 55 (7.2%) |
| 60 to 64 Years | 577 (71.0%) | 7 (1.2%) |
| 65 to 74 Years | 226 (21.1%) | 0 (0.0%) |
| 75 Years and over | 112 (13.9%) | 0 (0.0%) |
| Total | 5,400 (63.2%) | 221 (4.1%) |
Employment Status by Educational Attainment in Northampton borough
According to labor force statistics for Northampton borough, 78.6% of individuals (4,623) out of the total population between 25 and 64 years of age (5,882) are in the labor force, with 4.1% or 190 of them being unemployed. The group with the highest labor force participation rate are those with the educational attainment of bachelor's degree or higher, with 98.4% or 1,327 individuals in the labor force. Within the labor force, individuals with bachelor's degree or higher education have the highest percentage of unemployment, with 6.1% or 81 of them being unemployed.
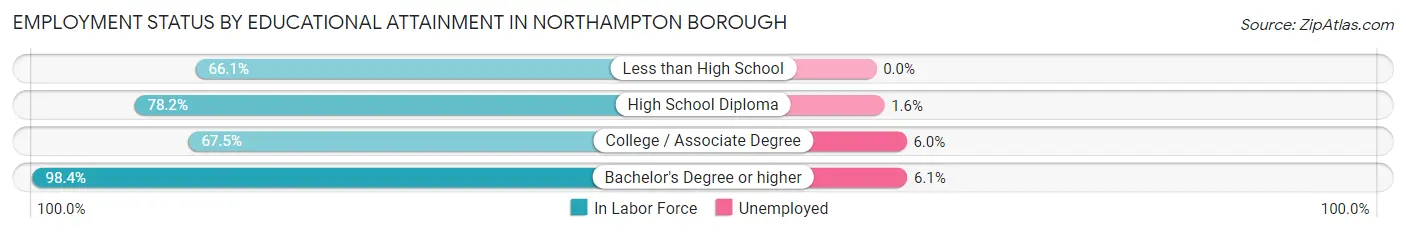
| Educational Attainment | In Labor Force | Unemployed |
| Less than High School | 205 (66.1%) | 0 (0.0%) |
| High School Diploma | 1,769 (78.2%) | 36 (1.6%) |
| College / Associate Degree | 1,324 (67.5%) | 118 (6.0%) |
| Bachelor's Degree or higher | 1,327 (98.4%) | 82 (6.1%) |
| Total | 4,623 (78.6%) | 241 (4.1%) |
Employment Occupations by Sex in Northampton borough
Management, Business, Science and Arts Occupations
The most common Management, Business, Science and Arts occupations in Northampton borough are Community & Social Service (615 | 11.9%), Management (476 | 9.2%), Education Instruction & Library (353 | 6.8%), Health Diagnosing & Treating (287 | 5.5%), and Business & Financial (199 | 3.8%).
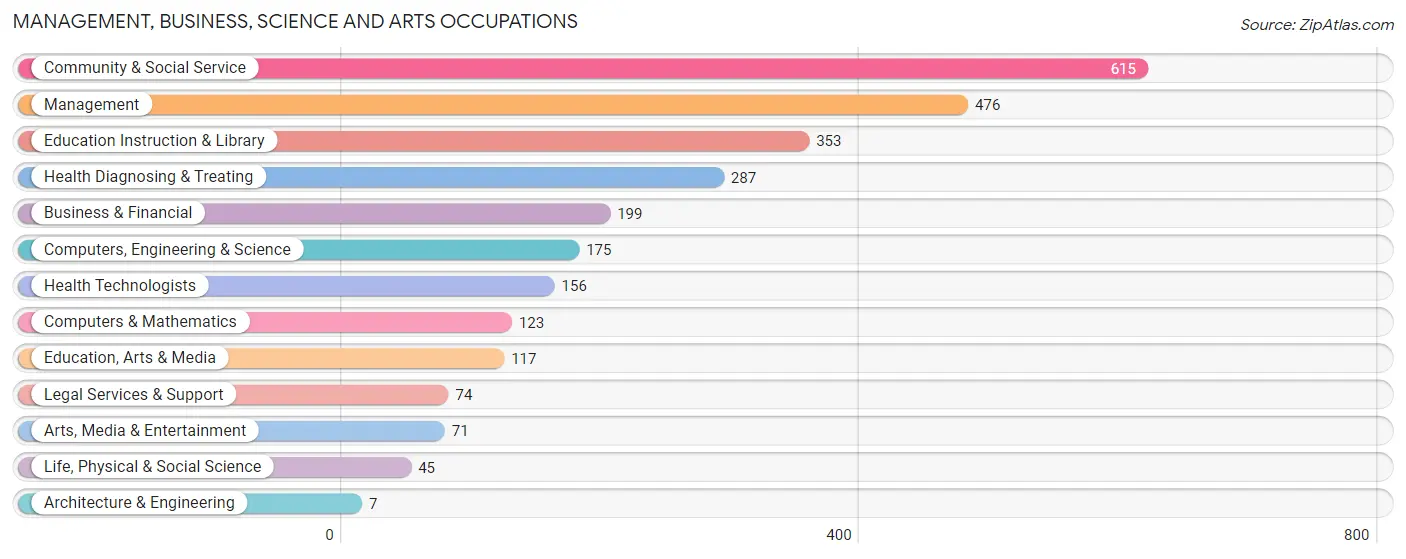
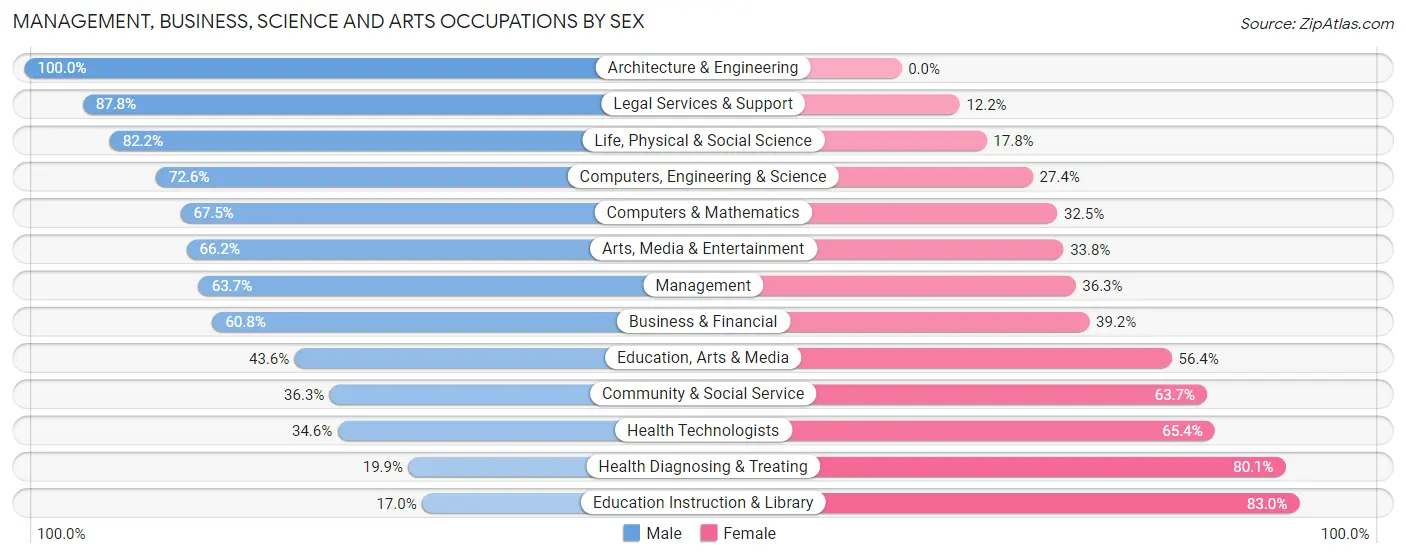
Management, Business, Science and Arts Occupations by Sex
Within the Management, Business, Science and Arts occupations in Northampton borough, the most male-oriented occupations are Architecture & Engineering (100.0%), Legal Services & Support (87.8%), and Life, Physical & Social Science (82.2%), while the most female-oriented occupations are Education Instruction & Library (83.0%), Health Diagnosing & Treating (80.1%), and Health Technologists (65.4%).
| Occupation | Male | Female |
| Management | 303 (63.7%) | 173 (36.3%) |
| Business & Financial | 121 (60.8%) | 78 (39.2%) |
| Computers, Engineering & Science | 127 (72.6%) | 48 (27.4%) |
| Computers & Mathematics | 83 (67.5%) | 40 (32.5%) |
| Architecture & Engineering | 7 (100.0%) | 0 (0.0%) |
| Life, Physical & Social Science | 37 (82.2%) | 8 (17.8%) |
| Community & Social Service | 223 (36.3%) | 392 (63.7%) |
| Education, Arts & Media | 51 (43.6%) | 66 (56.4%) |
| Legal Services & Support | 65 (87.8%) | 9 (12.2%) |
| Education Instruction & Library | 60 (17.0%) | 293 (83.0%) |
| Arts, Media & Entertainment | 47 (66.2%) | 24 (33.8%) |
| Health Diagnosing & Treating | 57 (19.9%) | 230 (80.1%) |
| Health Technologists | 54 (34.6%) | 102 (65.4%) |
| Total (Category) | 831 (47.4%) | 921 (52.6%) |
| Total (Overall) | 2,667 (51.5%) | 2,514 (48.5%) |
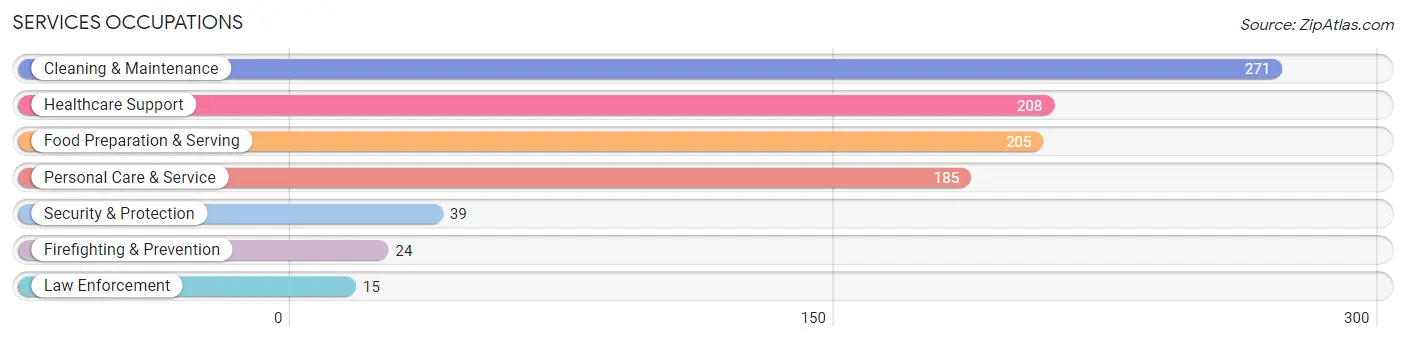
Services Occupations
The most common Services occupations in Northampton borough are Cleaning & Maintenance (271 | 5.2%), Healthcare Support (208 | 4.0%), Food Preparation & Serving (205 | 4.0%), Personal Care & Service (185 | 3.6%), and Security & Protection (39 | 0.7%).
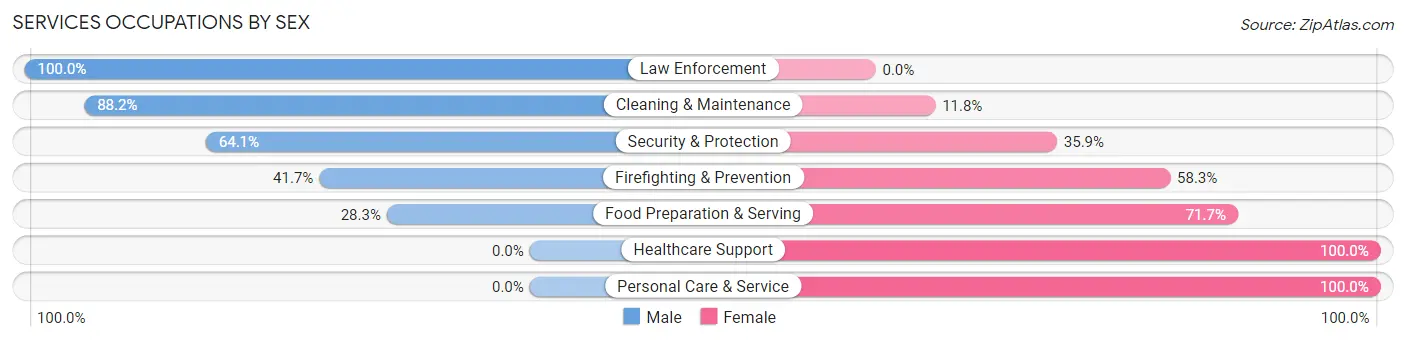
Services Occupations by Sex
Within the Services occupations in Northampton borough, the most male-oriented occupations are Law Enforcement (100.0%), Cleaning & Maintenance (88.2%), and Security & Protection (64.1%), while the most female-oriented occupations are Healthcare Support (100.0%), Personal Care & Service (100.0%), and Food Preparation & Serving (71.7%).
| Occupation | Male | Female |
| Healthcare Support | 0 (0.0%) | 208 (100.0%) |
| Security & Protection | 25 (64.1%) | 14 (35.9%) |
| Firefighting & Prevention | 10 (41.7%) | 14 (58.3%) |
| Law Enforcement | 15 (100.0%) | 0 (0.0%) |
| Food Preparation & Serving | 58 (28.3%) | 147 (71.7%) |
| Cleaning & Maintenance | 239 (88.2%) | 32 (11.8%) |
| Personal Care & Service | 0 (0.0%) | 185 (100.0%) |
| Total (Category) | 322 (35.5%) | 586 (64.5%) |
| Total (Overall) | 2,667 (51.5%) | 2,514 (48.5%) |
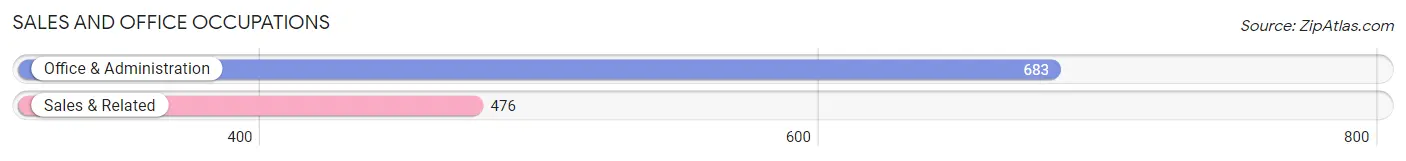
Sales and Office Occupations
The most common Sales and Office occupations in Northampton borough are Office & Administration (683 | 13.2%), and Sales & Related (476 | 9.2%).
Sales and Office Occupations by Sex
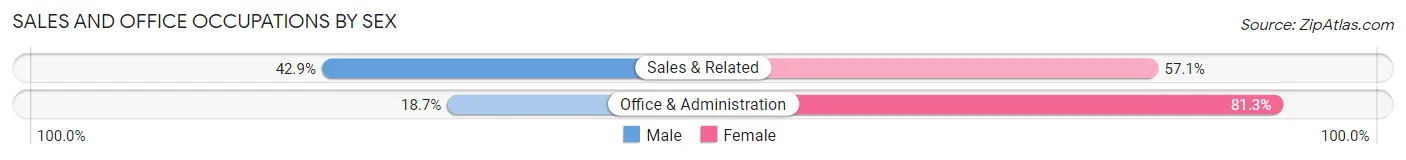
| Occupation | Male | Female |
| Sales & Related | 204 (42.9%) | 272 (57.1%) |
| Office & Administration | 128 (18.7%) | 555 (81.3%) |
| Total (Category) | 332 (28.6%) | 827 (71.4%) |
| Total (Overall) | 2,667 (51.5%) | 2,514 (48.5%) |
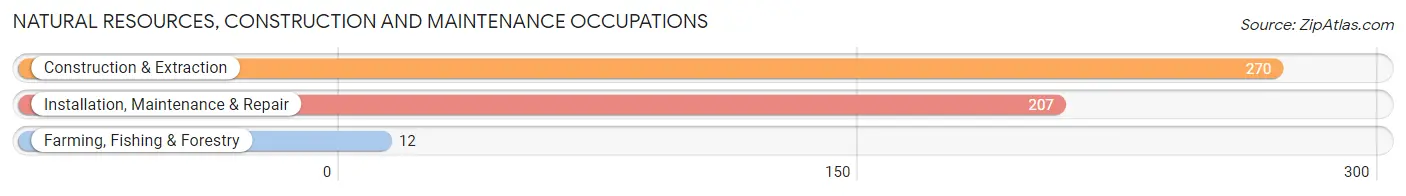
Natural Resources, Construction and Maintenance Occupations
The most common Natural Resources, Construction and Maintenance occupations in Northampton borough are Construction & Extraction (270 | 5.2%), Installation, Maintenance & Repair (207 | 4.0%), and Farming, Fishing & Forestry (12 | 0.2%).
Natural Resources, Construction and Maintenance Occupations by Sex
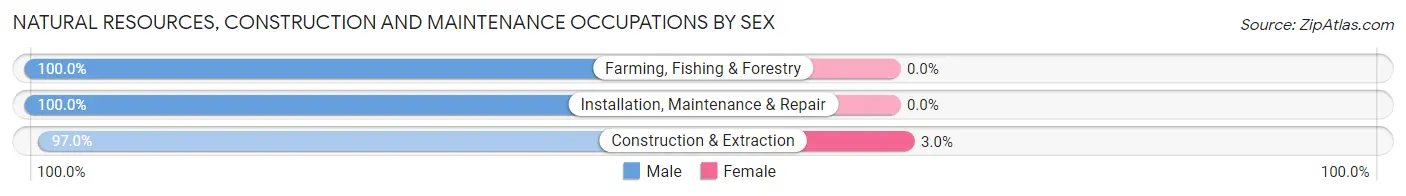
| Occupation | Male | Female |
| Farming, Fishing & Forestry | 12 (100.0%) | 0 (0.0%) |
| Construction & Extraction | 262 (97.0%) | 8 (3.0%) |
| Installation, Maintenance & Repair | 207 (100.0%) | 0 (0.0%) |
| Total (Category) | 481 (98.4%) | 8 (1.6%) |
| Total (Overall) | 2,667 (51.5%) | 2,514 (48.5%) |
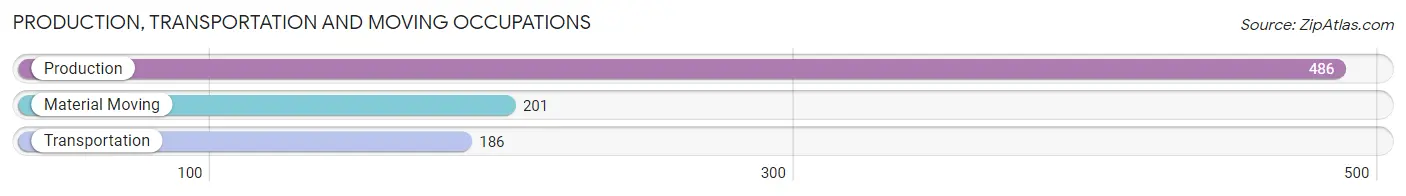
Production, Transportation and Moving Occupations
The most common Production, Transportation and Moving occupations in Northampton borough are Production (486 | 9.4%), Material Moving (201 | 3.9%), and Transportation (186 | 3.6%).
Production, Transportation and Moving Occupations by Sex
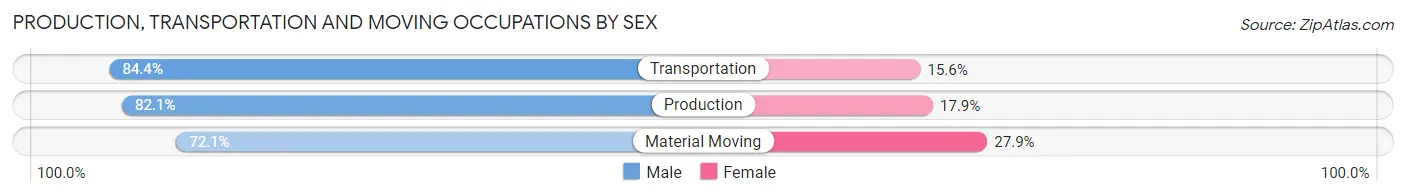
| Occupation | Male | Female |
| Production | 399 (82.1%) | 87 (17.9%) |
| Transportation | 157 (84.4%) | 29 (15.6%) |
| Material Moving | 145 (72.1%) | 56 (27.9%) |
| Total (Category) | 701 (80.3%) | 172 (19.7%) |
| Total (Overall) | 2,667 (51.5%) | 2,514 (48.5%) |
Employment Industries by Sex in Northampton borough
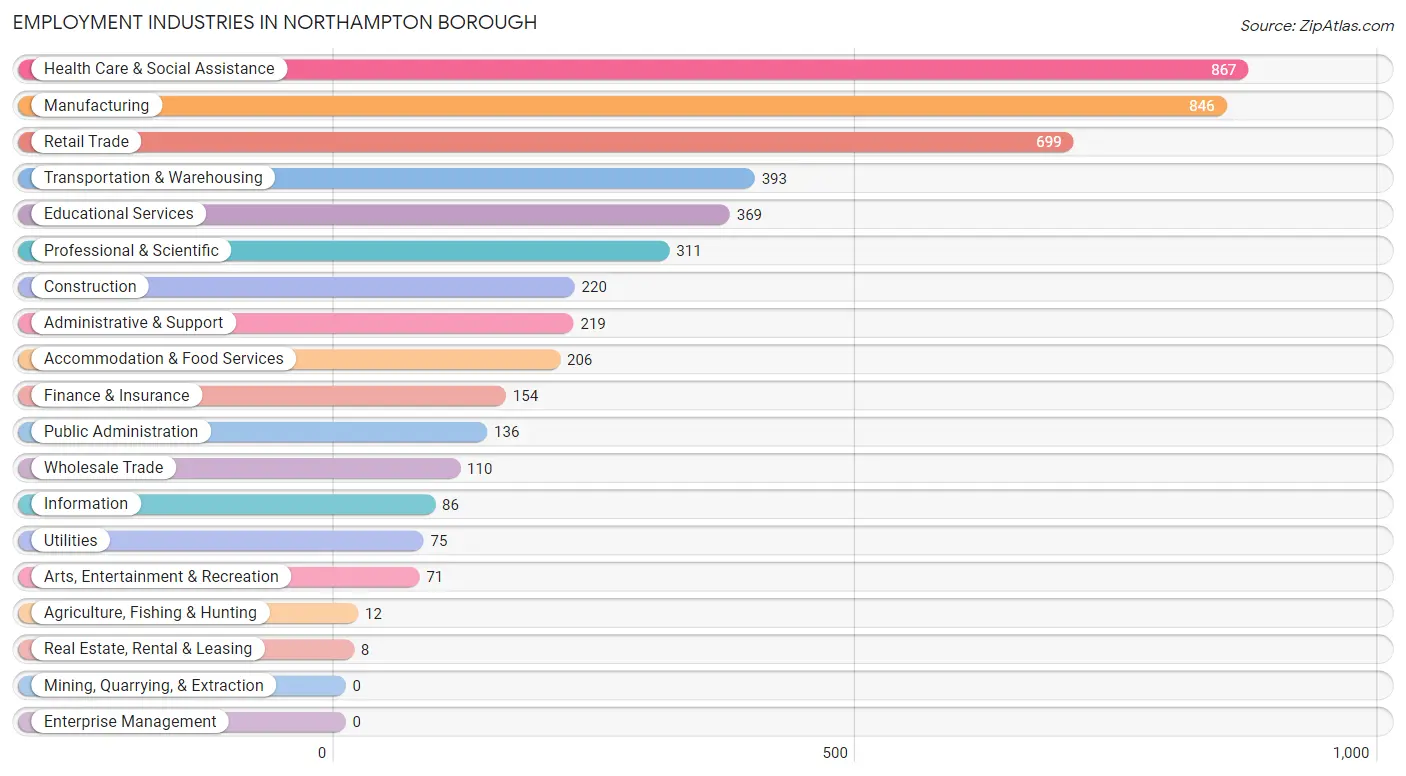
Employment Industries in Northampton borough
The major employment industries in Northampton borough include Health Care & Social Assistance (867 | 16.7%), Manufacturing (846 | 16.3%), Retail Trade (699 | 13.5%), Transportation & Warehousing (393 | 7.6%), and Educational Services (369 | 7.1%).
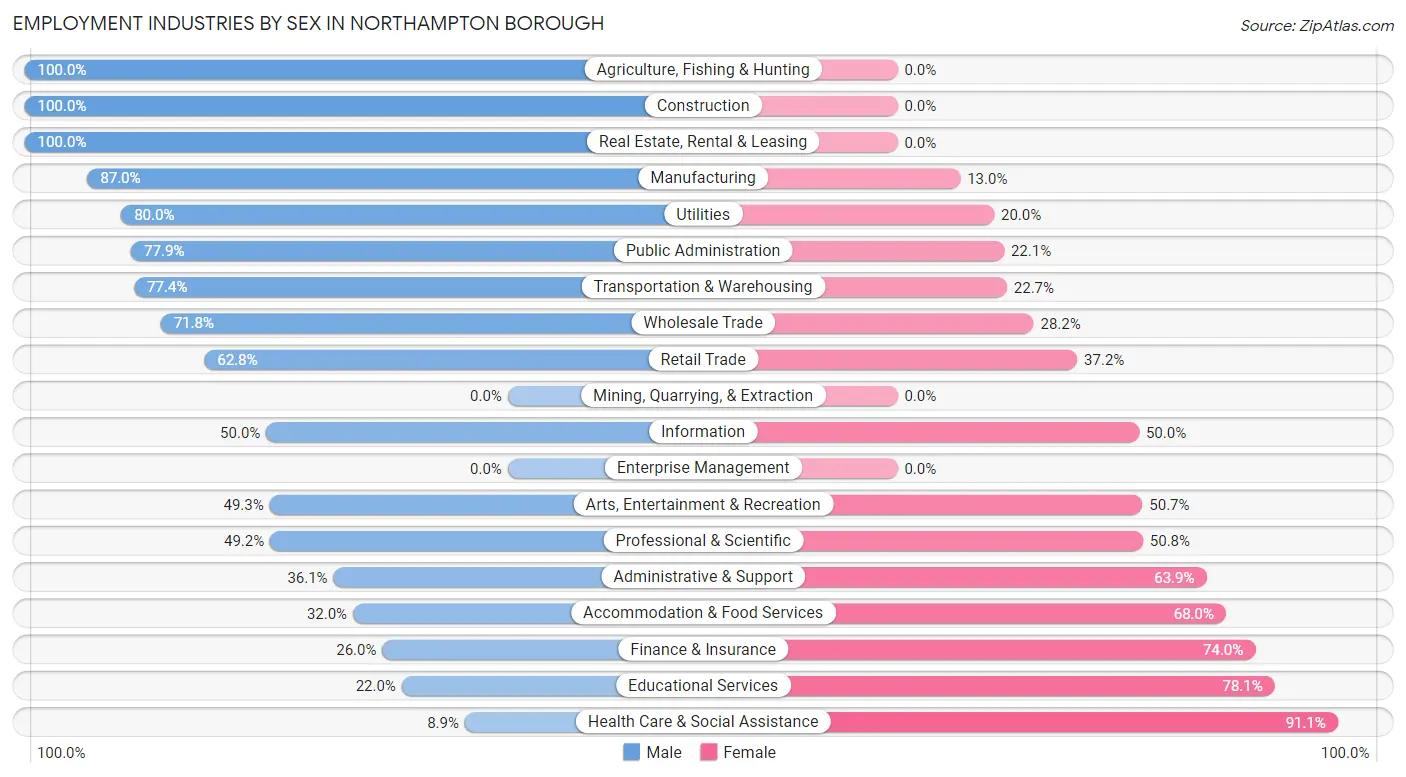
Employment Industries by Sex in Northampton borough
The Northampton borough industries that see more men than women are Agriculture, Fishing & Hunting (100.0%), Construction (100.0%), and Real Estate, Rental & Leasing (100.0%), whereas the industries that tend to have a higher number of women are Health Care & Social Assistance (91.1%), Educational Services (78.0%), and Finance & Insurance (74.0%).
| Industry | Male | Female |
| Agriculture, Fishing & Hunting | 12 (100.0%) | 0 (0.0%) |
| Mining, Quarrying, & Extraction | 0 (0.0%) | 0 (0.0%) |
| Construction | 220 (100.0%) | 0 (0.0%) |
| Manufacturing | 736 (87.0%) | 110 (13.0%) |
| Wholesale Trade | 79 (71.8%) | 31 (28.2%) |
| Retail Trade | 439 (62.8%) | 260 (37.2%) |
| Transportation & Warehousing | 304 (77.3%) | 89 (22.7%) |
| Utilities | 60 (80.0%) | 15 (20.0%) |
| Information | 43 (50.0%) | 43 (50.0%) |
| Finance & Insurance | 40 (26.0%) | 114 (74.0%) |
| Real Estate, Rental & Leasing | 8 (100.0%) | 0 (0.0%) |
| Professional & Scientific | 153 (49.2%) | 158 (50.8%) |
| Enterprise Management | 0 (0.0%) | 0 (0.0%) |
| Administrative & Support | 79 (36.1%) | 140 (63.9%) |
| Educational Services | 81 (22.0%) | 288 (78.0%) |
| Health Care & Social Assistance | 77 (8.9%) | 790 (91.1%) |
| Arts, Entertainment & Recreation | 35 (49.3%) | 36 (50.7%) |
| Accommodation & Food Services | 66 (32.0%) | 140 (68.0%) |
| Public Administration | 106 (77.9%) | 30 (22.1%) |
| Total | 2,667 (51.5%) | 2,514 (48.5%) |
Education in Northampton borough
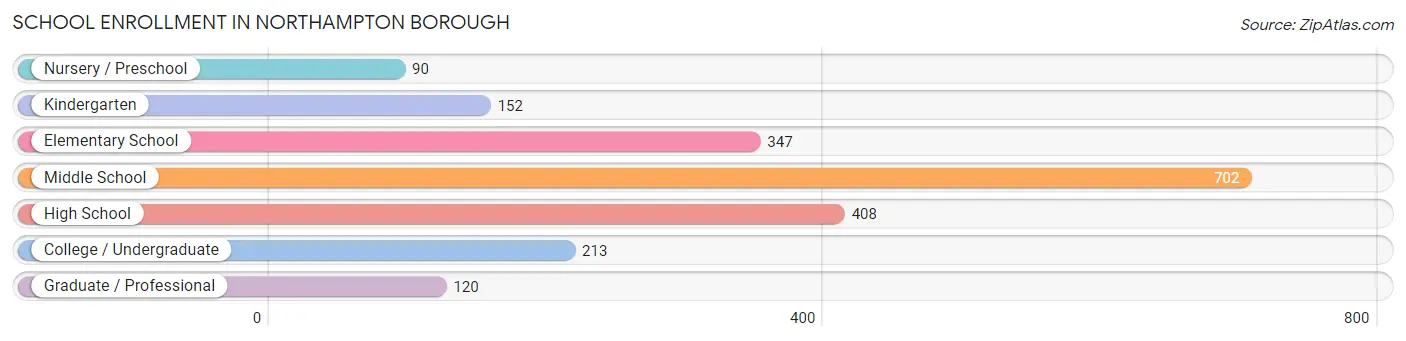
School Enrollment in Northampton borough
The most common levels of schooling among the 2,032 students in Northampton borough are middle school (702 | 34.5%), high school (408 | 20.1%), and elementary school (347 | 17.1%).
| School Level | # Students | % Students |
| Nursery / Preschool | 90 | 4.4% |
| Kindergarten | 152 | 7.5% |
| Elementary School | 347 | 17.1% |
| Middle School | 702 | 34.5% |
| High School | 408 | 20.1% |
| College / Undergraduate | 213 | 10.5% |
| Graduate / Professional | 120 | 5.9% |
| Total | 2,032 | 100.0% |
School Enrollment by Age by Funding Source in Northampton borough
Out of a total of 2,032 students who are enrolled in schools in Northampton borough, 319 (15.7%) attend a private institution, while the remaining 1,713 (84.3%) are enrolled in public schools. The age group of 25 to 34 year olds has the highest likelihood of being enrolled in private schools, with 29 (76.3% in the age bracket) enrolled. Conversely, the age group of 15 to 17 year olds has the lowest likelihood of being enrolled in a private school, with 247 (100.0% in the age bracket) attending a public institution.
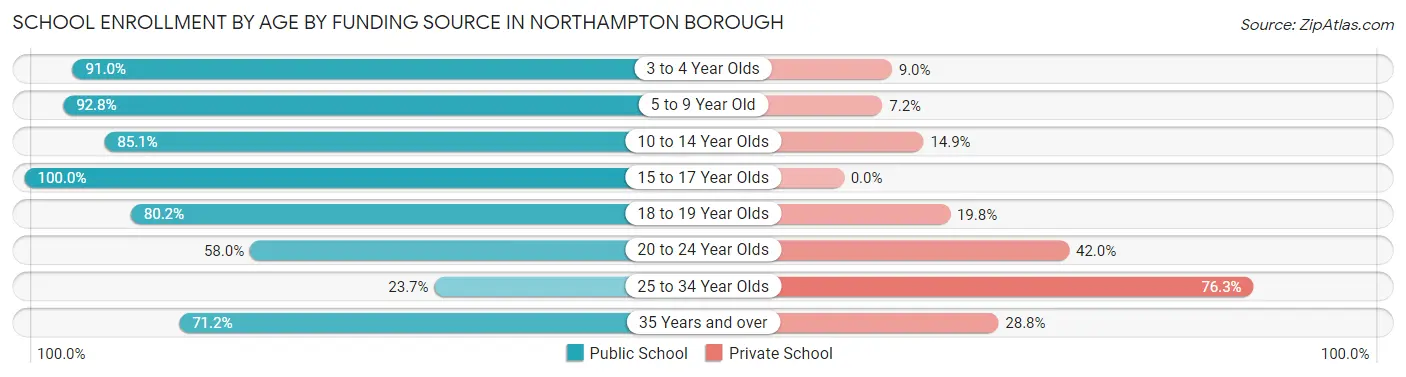
| Age Bracket | Public School | Private School |
| 3 to 4 Year Olds | 61 (91.0%) | 6 (9.0%) |
| 5 to 9 Year Old | 541 (92.8%) | 42 (7.2%) |
| 10 to 14 Year Olds | 567 (85.1%) | 99 (14.9%) |
| 15 to 17 Year Olds | 247 (100.0%) | 0 (0.0%) |
| 18 to 19 Year Olds | 81 (80.2%) | 20 (19.8%) |
| 20 to 24 Year Olds | 123 (58.0%) | 89 (42.0%) |
| 25 to 34 Year Olds | 9 (23.7%) | 29 (76.3%) |
| 35 Years and over | 84 (71.2%) | 34 (28.8%) |
| Total | 1,713 (84.3%) | 319 (15.7%) |
Educational Attainment by Field of Study in Northampton borough
Science & technology (471 | 29.7%), business (304 | 19.1%), education (213 | 13.4%), communications (102 | 6.4%), and social sciences (87 | 5.5%) are the most common fields of study among 1,588 individuals in Northampton borough who have obtained a bachelor's degree or higher.
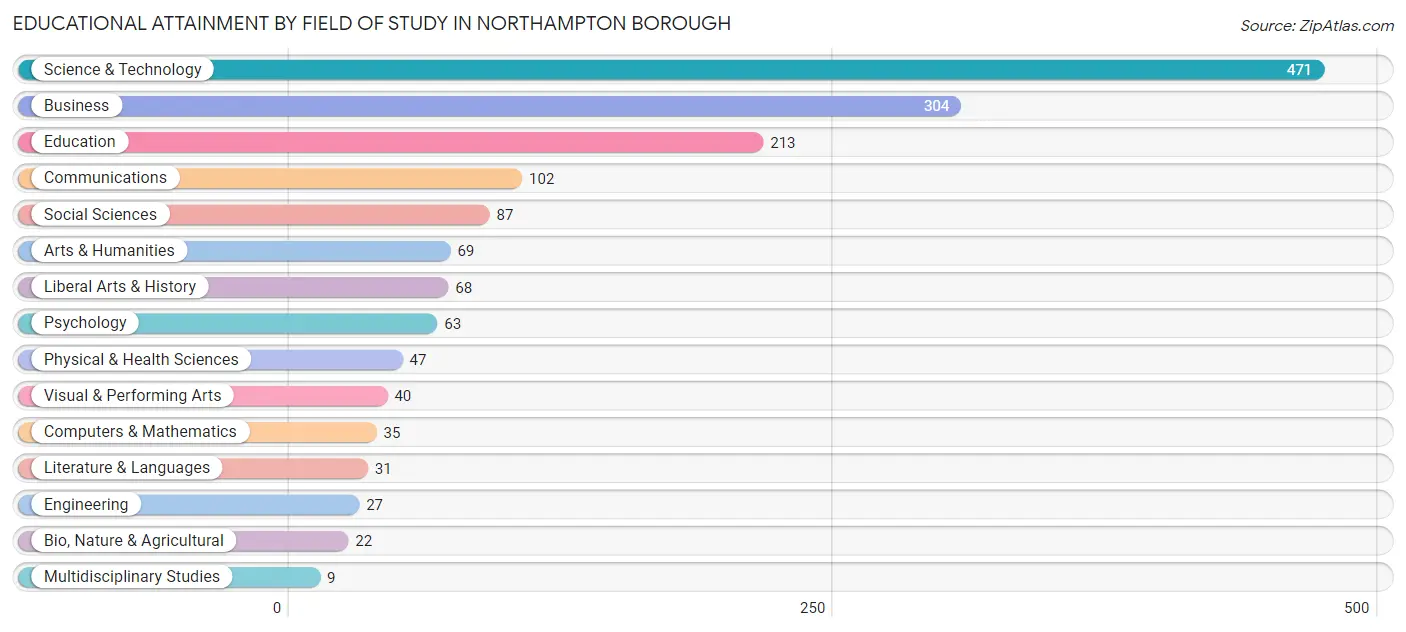
| Field of Study | # Graduates | % Graduates |
| Computers & Mathematics | 35 | 2.2% |
| Bio, Nature & Agricultural | 22 | 1.4% |
| Physical & Health Sciences | 47 | 3.0% |
| Psychology | 63 | 4.0% |
| Social Sciences | 87 | 5.5% |
| Engineering | 27 | 1.7% |
| Multidisciplinary Studies | 9 | 0.6% |
| Science & Technology | 471 | 29.7% |
| Business | 304 | 19.1% |
| Education | 213 | 13.4% |
| Literature & Languages | 31 | 1.9% |
| Liberal Arts & History | 68 | 4.3% |
| Visual & Performing Arts | 40 | 2.5% |
| Communications | 102 | 6.4% |
| Arts & Humanities | 69 | 4.3% |
| Total | 1,588 | 100.0% |
Transportation & Commute in Northampton borough
Vehicle Availability by Sex in Northampton borough
The most prevalent vehicle ownership categories in Northampton borough are males with 2 vehicles (1,314, accounting for 49.3%) and females with 2 vehicles (1,211, making up 52.8%).
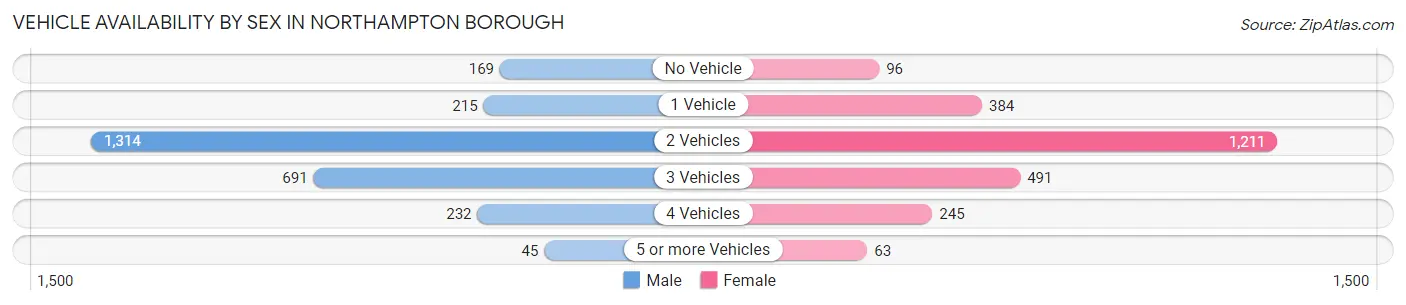
| Vehicles Available | Male | Female |
| No Vehicle | 169 (6.3%) | 96 (3.9%) |
| 1 Vehicle | 215 (8.1%) | 384 (15.4%) |
| 2 Vehicles | 1,314 (49.3%) | 1,211 (48.6%) |
| 3 Vehicles | 691 (25.9%) | 491 (19.7%) |
| 4 Vehicles | 232 (8.7%) | 245 (9.8%) |
| 5 or more Vehicles | 45 (1.7%) | 63 (2.5%) |
| Total | 2,666 (100.0%) | 2,490 (100.0%) |
Commute Time in Northampton borough
The most frequently occuring commute durations in Northampton borough are 30 to 34 minutes (878 commuters, 19.0%), 25 to 29 minutes (675 commuters, 14.6%), and 20 to 24 minutes (648 commuters, 14.0%).
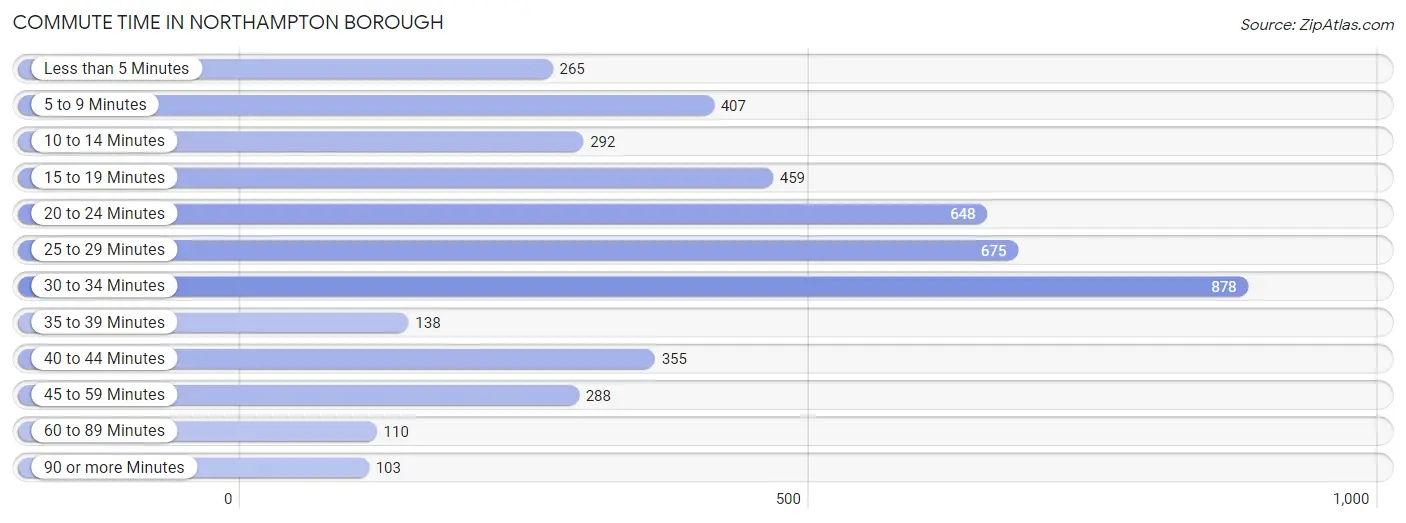
| Commute Time | # Commuters | % Commuters |
| Less than 5 Minutes | 265 | 5.7% |
| 5 to 9 Minutes | 407 | 8.8% |
| 10 to 14 Minutes | 292 | 6.3% |
| 15 to 19 Minutes | 459 | 9.9% |
| 20 to 24 Minutes | 648 | 14.0% |
| 25 to 29 Minutes | 675 | 14.6% |
| 30 to 34 Minutes | 878 | 19.0% |
| 35 to 39 Minutes | 138 | 3.0% |
| 40 to 44 Minutes | 355 | 7.7% |
| 45 to 59 Minutes | 288 | 6.2% |
| 60 to 89 Minutes | 110 | 2.4% |
| 90 or more Minutes | 103 | 2.2% |
Commute Time by Sex in Northampton borough
The most common commute times in Northampton borough are 30 to 34 minutes (402 commuters, 16.1%) for males and 30 to 34 minutes (476 commuters, 22.5%) for females.
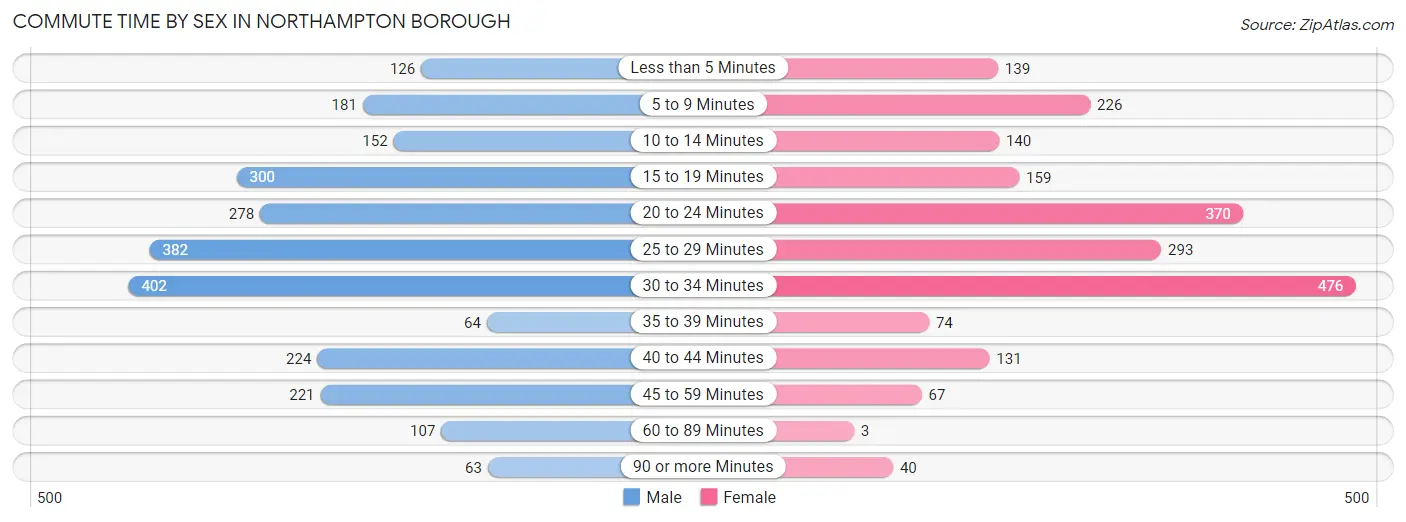
| Commute Time | Male | Female |
| Less than 5 Minutes | 126 (5.0%) | 139 (6.6%) |
| 5 to 9 Minutes | 181 (7.2%) | 226 (10.7%) |
| 10 to 14 Minutes | 152 (6.1%) | 140 (6.6%) |
| 15 to 19 Minutes | 300 (12.0%) | 159 (7.5%) |
| 20 to 24 Minutes | 278 (11.1%) | 370 (17.5%) |
| 25 to 29 Minutes | 382 (15.3%) | 293 (13.8%) |
| 30 to 34 Minutes | 402 (16.1%) | 476 (22.5%) |
| 35 to 39 Minutes | 64 (2.6%) | 74 (3.5%) |
| 40 to 44 Minutes | 224 (9.0%) | 131 (6.2%) |
| 45 to 59 Minutes | 221 (8.8%) | 67 (3.2%) |
| 60 to 89 Minutes | 107 (4.3%) | 3 (0.1%) |
| 90 or more Minutes | 63 (2.5%) | 40 (1.9%) |
Time of Departure to Work by Sex in Northampton borough
The most frequent times of departure to work in Northampton borough are 6:30 AM to 6:59 AM (486, 19.4%) for males and 7:00 AM to 7:29 AM (593, 28.0%) for females.
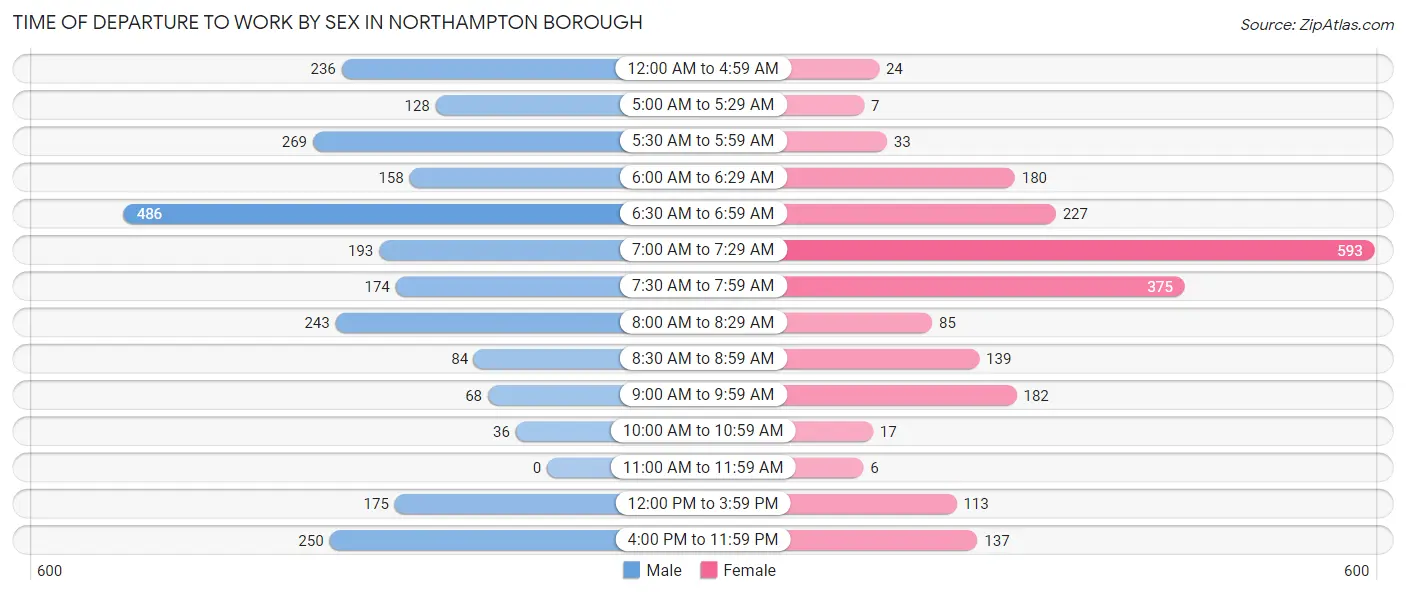
| Time of Departure | Male | Female |
| 12:00 AM to 4:59 AM | 236 (9.4%) | 24 (1.1%) |
| 5:00 AM to 5:29 AM | 128 (5.1%) | 7 (0.3%) |
| 5:30 AM to 5:59 AM | 269 (10.8%) | 33 (1.6%) |
| 6:00 AM to 6:29 AM | 158 (6.3%) | 180 (8.5%) |
| 6:30 AM to 6:59 AM | 486 (19.4%) | 227 (10.7%) |
| 7:00 AM to 7:29 AM | 193 (7.7%) | 593 (28.0%) |
| 7:30 AM to 7:59 AM | 174 (7.0%) | 375 (17.7%) |
| 8:00 AM to 8:29 AM | 243 (9.7%) | 85 (4.0%) |
| 8:30 AM to 8:59 AM | 84 (3.4%) | 139 (6.6%) |
| 9:00 AM to 9:59 AM | 68 (2.7%) | 182 (8.6%) |
| 10:00 AM to 10:59 AM | 36 (1.4%) | 17 (0.8%) |
| 11:00 AM to 11:59 AM | 0 (0.0%) | 6 (0.3%) |
| 12:00 PM to 3:59 PM | 175 (7.0%) | 113 (5.3%) |
| 4:00 PM to 11:59 PM | 250 (10.0%) | 137 (6.5%) |
| Total | 2,500 (100.0%) | 2,118 (100.0%) |
Housing Occupancy in Northampton borough
Occupancy by Ownership in Northampton borough
Of the total 4,195 dwellings in Northampton borough, owner-occupied units account for 2,909 (69.3%), while renter-occupied units make up 1,286 (30.7%).
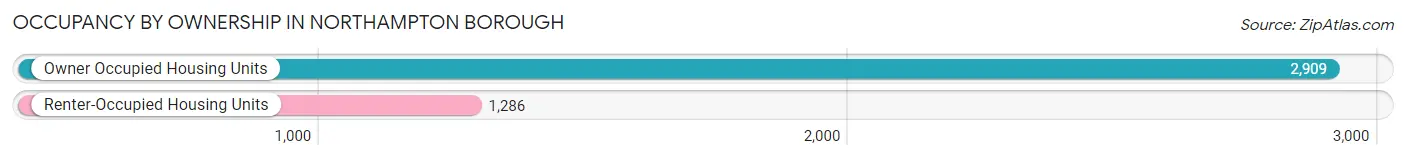
| Occupancy | # Housing Units | % Housing Units |
| Owner Occupied Housing Units | 2,909 | 69.3% |
| Renter-Occupied Housing Units | 1,286 | 30.7% |
| Total Occupied Housing Units | 4,195 | 100.0% |
Occupancy by Household Size in Northampton borough
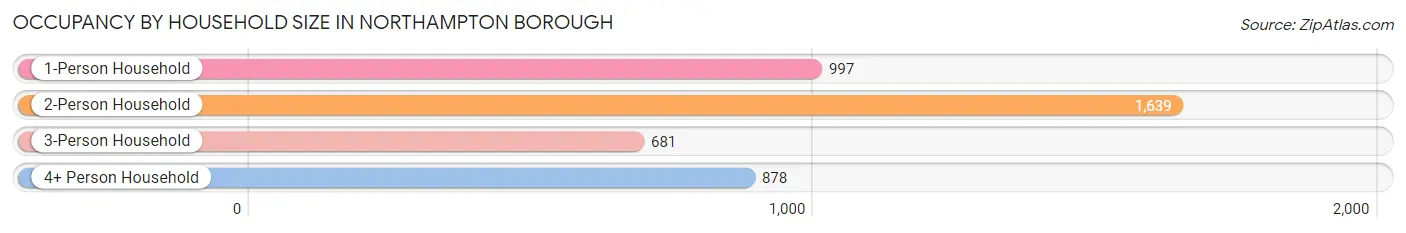
| Household Size | # Housing Units | % Housing Units |
| 1-Person Household | 997 | 23.8% |
| 2-Person Household | 1,639 | 39.1% |
| 3-Person Household | 681 | 16.2% |
| 4+ Person Household | 878 | 20.9% |
| Total Housing Units | 4,195 | 100.0% |
Occupancy by Ownership by Household Size in Northampton borough
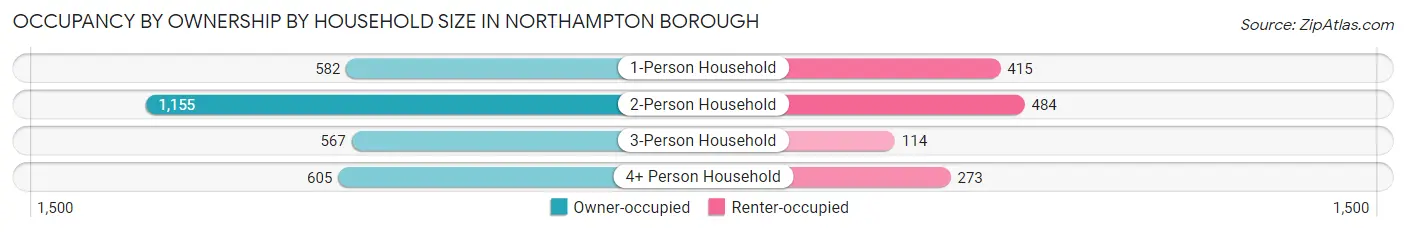
| Household Size | Owner-occupied | Renter-occupied |
| 1-Person Household | 582 (58.4%) | 415 (41.6%) |
| 2-Person Household | 1,155 (70.5%) | 484 (29.5%) |
| 3-Person Household | 567 (83.3%) | 114 (16.7%) |
| 4+ Person Household | 605 (68.9%) | 273 (31.1%) |
| Total Housing Units | 2,909 (69.3%) | 1,286 (30.7%) |
Occupancy by Educational Attainment in Northampton borough
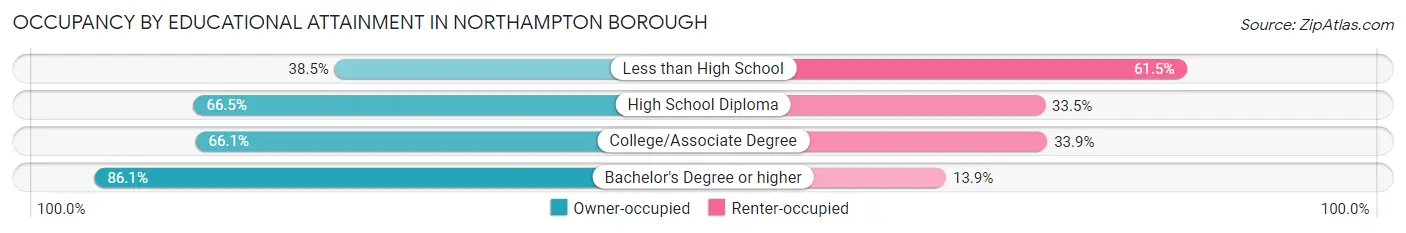
| Household Size | Owner-occupied | Renter-occupied |
| Less than High School | 89 (38.5%) | 142 (61.5%) |
| High School Diploma | 1,052 (66.5%) | 530 (33.5%) |
| College/Associate Degree | 935 (66.1%) | 480 (33.9%) |
| Bachelor's Degree or higher | 833 (86.1%) | 134 (13.9%) |
Occupancy by Age of Householder in Northampton borough
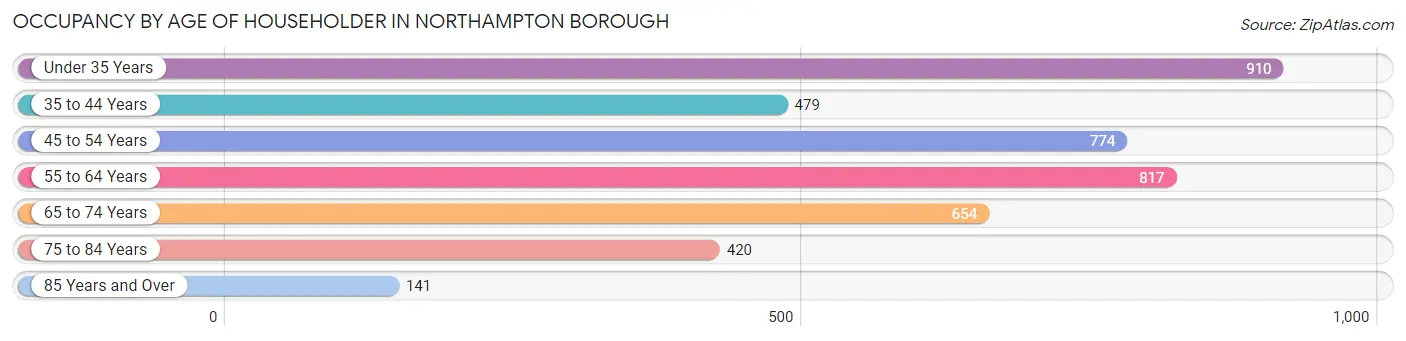
| Age Bracket | # Households | % Households |
| Under 35 Years | 910 | 21.7% |
| 35 to 44 Years | 479 | 11.4% |
| 45 to 54 Years | 774 | 18.4% |
| 55 to 64 Years | 817 | 19.5% |
| 65 to 74 Years | 654 | 15.6% |
| 75 to 84 Years | 420 | 10.0% |
| 85 Years and Over | 141 | 3.4% |
| Total | 4,195 | 100.0% |
Housing Finances in Northampton borough
Median Income by Occupancy in Northampton borough
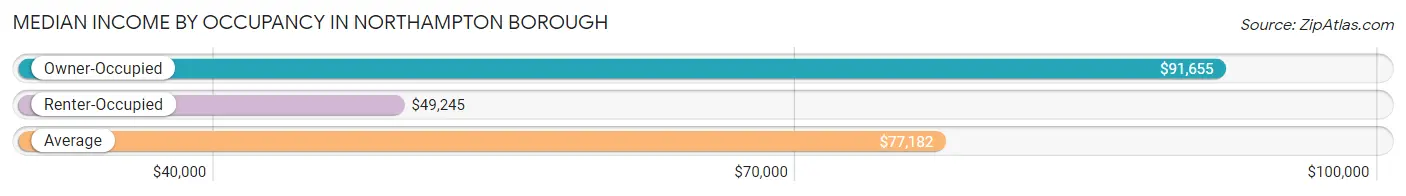
| Occupancy Type | # Households | Median Income |
| Owner-Occupied | 2,909 (69.3%) | $91,655 |
| Renter-Occupied | 1,286 (30.7%) | $49,245 |
| Average | 4,195 (100.0%) | $77,182 |
Occupancy by Householder Income Bracket in Northampton borough
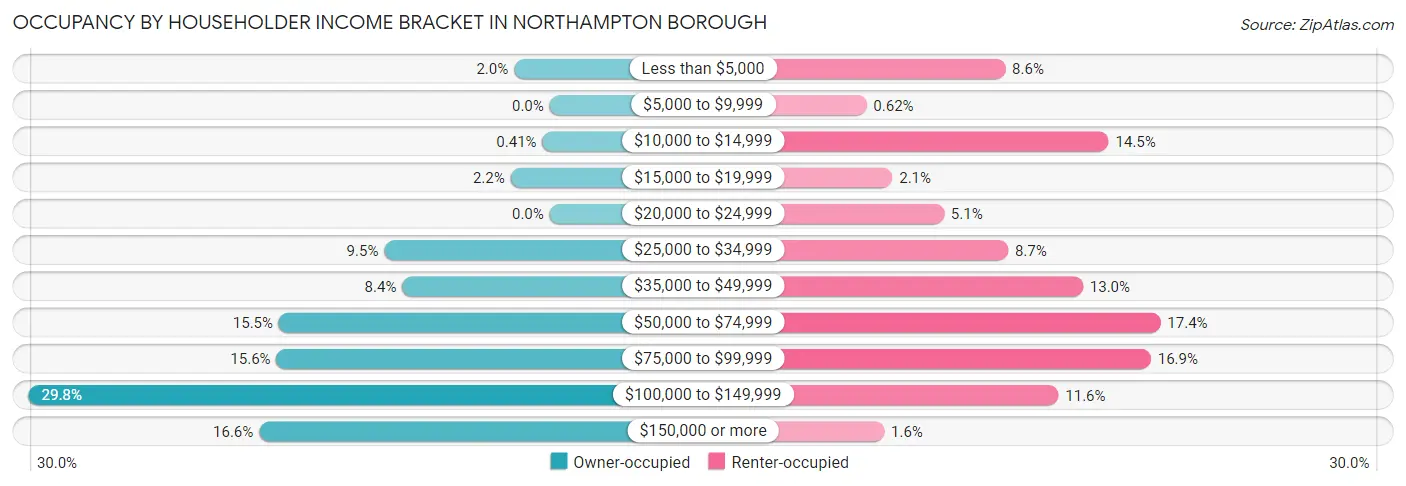
| Income Bracket | Owner-occupied | Renter-occupied |
| Less than $5,000 | 59 (2.0%) | 110 (8.6%) |
| $5,000 to $9,999 | 0 (0.0%) | 8 (0.6%) |
| $10,000 to $14,999 | 12 (0.4%) | 186 (14.5%) |
| $15,000 to $19,999 | 65 (2.2%) | 27 (2.1%) |
| $20,000 to $24,999 | 0 (0.0%) | 65 (5.1%) |
| $25,000 to $34,999 | 275 (9.5%) | 112 (8.7%) |
| $35,000 to $49,999 | 245 (8.4%) | 167 (13.0%) |
| $50,000 to $74,999 | 450 (15.5%) | 224 (17.4%) |
| $75,000 to $99,999 | 454 (15.6%) | 217 (16.9%) |
| $100,000 to $149,999 | 866 (29.8%) | 149 (11.6%) |
| $150,000 or more | 483 (16.6%) | 21 (1.6%) |
| Total | 2,909 (100.0%) | 1,286 (100.0%) |
Monthly Housing Cost Tiers in Northampton borough
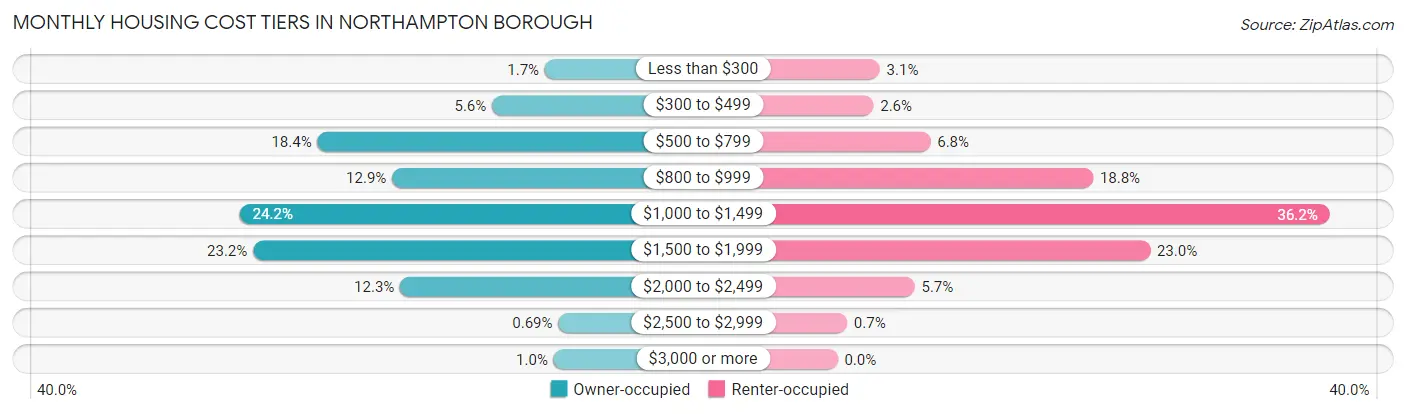
| Monthly Cost | Owner-occupied | Renter-occupied |
| Less than $300 | 49 (1.7%) | 40 (3.1%) |
| $300 to $499 | 162 (5.6%) | 34 (2.6%) |
| $500 to $799 | 536 (18.4%) | 88 (6.8%) |
| $800 to $999 | 376 (12.9%) | 242 (18.8%) |
| $1,000 to $1,499 | 703 (24.2%) | 466 (36.2%) |
| $1,500 to $1,999 | 674 (23.2%) | 296 (23.0%) |
| $2,000 to $2,499 | 359 (12.3%) | 73 (5.7%) |
| $2,500 to $2,999 | 20 (0.7%) | 9 (0.7%) |
| $3,000 or more | 30 (1.0%) | 0 (0.0%) |
| Total | 2,909 (100.0%) | 1,286 (100.0%) |
Physical Housing Characteristics in Northampton borough
Housing Structures in Northampton borough
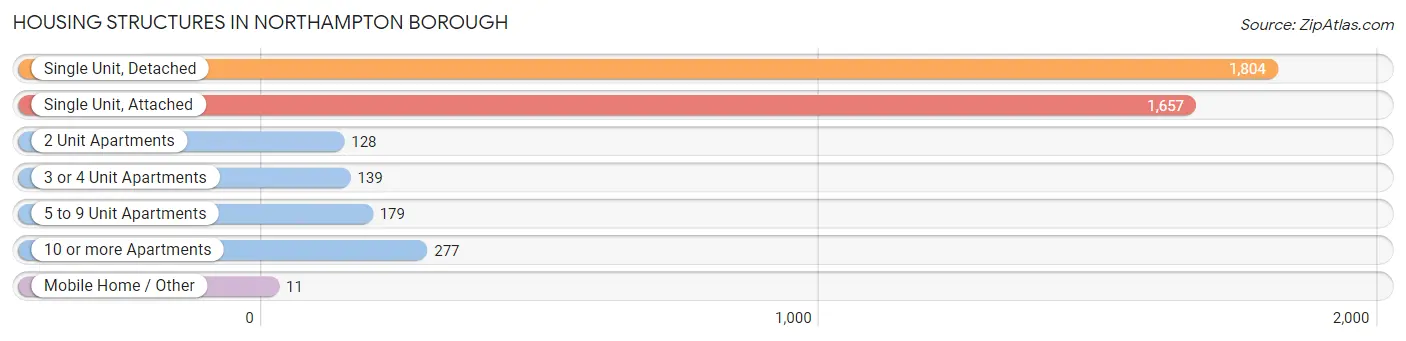
| Structure Type | # Housing Units | % Housing Units |
| Single Unit, Detached | 1,804 | 43.0% |
| Single Unit, Attached | 1,657 | 39.5% |
| 2 Unit Apartments | 128 | 3.0% |
| 3 or 4 Unit Apartments | 139 | 3.3% |
| 5 to 9 Unit Apartments | 179 | 4.3% |
| 10 or more Apartments | 277 | 6.6% |
| Mobile Home / Other | 11 | 0.3% |
| Total | 4,195 | 100.0% |
Housing Structures by Occupancy in Northampton borough
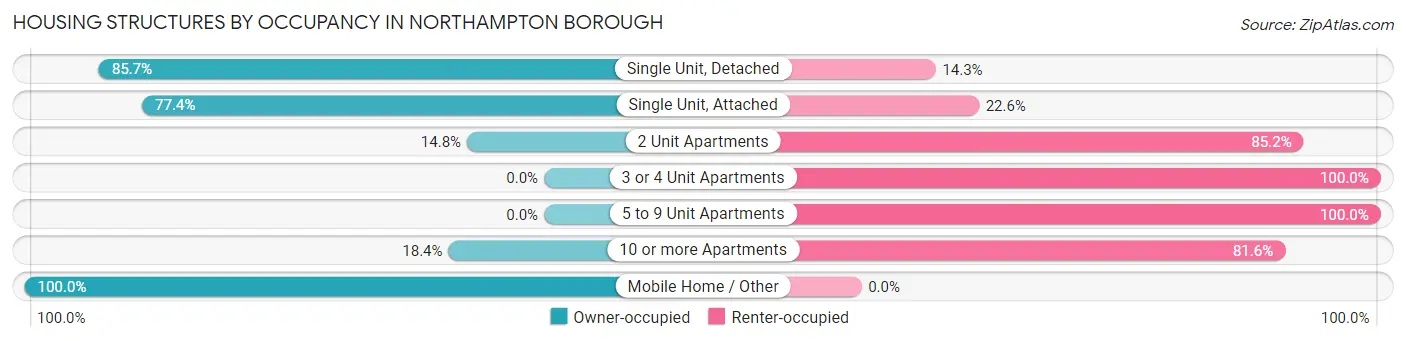
| Structure Type | Owner-occupied | Renter-occupied |
| Single Unit, Detached | 1,546 (85.7%) | 258 (14.3%) |
| Single Unit, Attached | 1,282 (77.4%) | 375 (22.6%) |
| 2 Unit Apartments | 19 (14.8%) | 109 (85.2%) |
| 3 or 4 Unit Apartments | 0 (0.0%) | 139 (100.0%) |
| 5 to 9 Unit Apartments | 0 (0.0%) | 179 (100.0%) |
| 10 or more Apartments | 51 (18.4%) | 226 (81.6%) |
| Mobile Home / Other | 11 (100.0%) | 0 (0.0%) |
| Total | 2,909 (69.3%) | 1,286 (30.7%) |
Housing Structures by Number of Rooms in Northampton borough
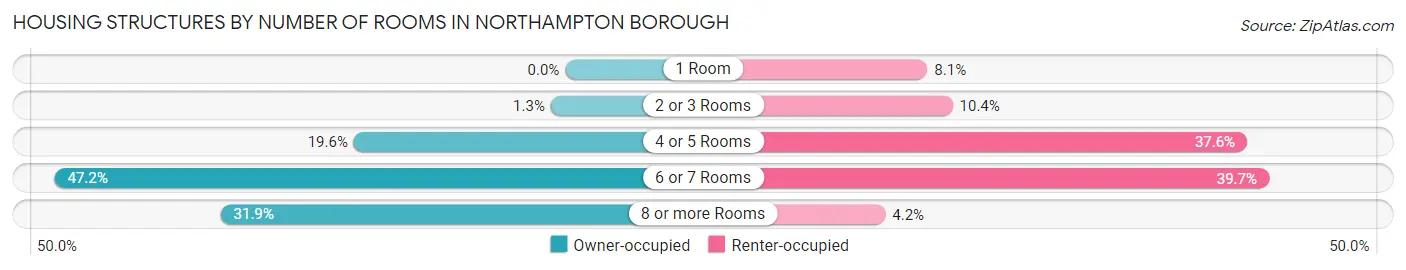
| Number of Rooms | Owner-occupied | Renter-occupied |
| 1 Room | 0 (0.0%) | 104 (8.1%) |
| 2 or 3 Rooms | 39 (1.3%) | 134 (10.4%) |
| 4 or 5 Rooms | 569 (19.6%) | 484 (37.6%) |
| 6 or 7 Rooms | 1,374 (47.2%) | 510 (39.7%) |
| 8 or more Rooms | 927 (31.9%) | 54 (4.2%) |
| Total | 2,909 (100.0%) | 1,286 (100.0%) |
Housing Structure by Heating Type in Northampton borough
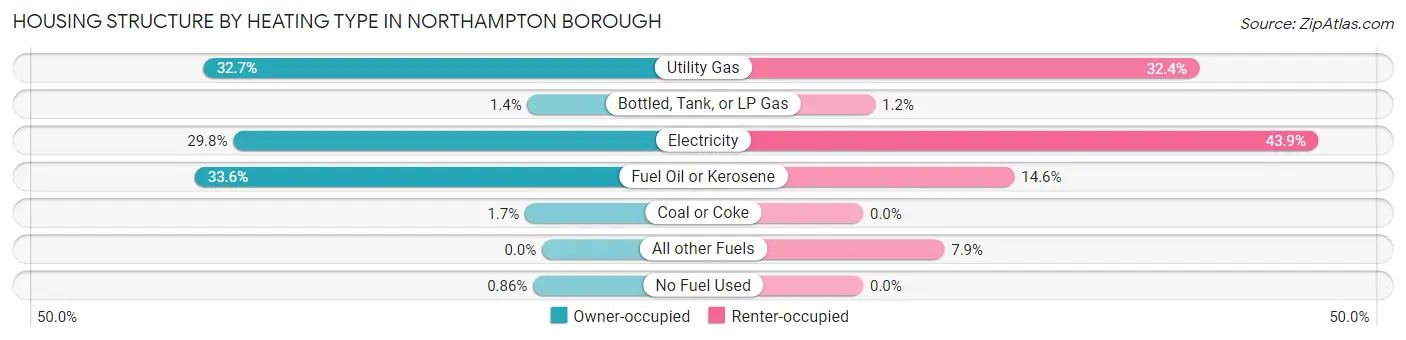
| Heating Type | Owner-occupied | Renter-occupied |
| Utility Gas | 951 (32.7%) | 417 (32.4%) |
| Bottled, Tank, or LP Gas | 41 (1.4%) | 15 (1.2%) |
| Electricity | 868 (29.8%) | 565 (43.9%) |
| Fuel Oil or Kerosene | 976 (33.6%) | 188 (14.6%) |
| Coal or Coke | 48 (1.7%) | 0 (0.0%) |
| All other Fuels | 0 (0.0%) | 101 (7.9%) |
| No Fuel Used | 25 (0.9%) | 0 (0.0%) |
| Total | 2,909 (100.0%) | 1,286 (100.0%) |
Household Vehicle Usage in Northampton borough
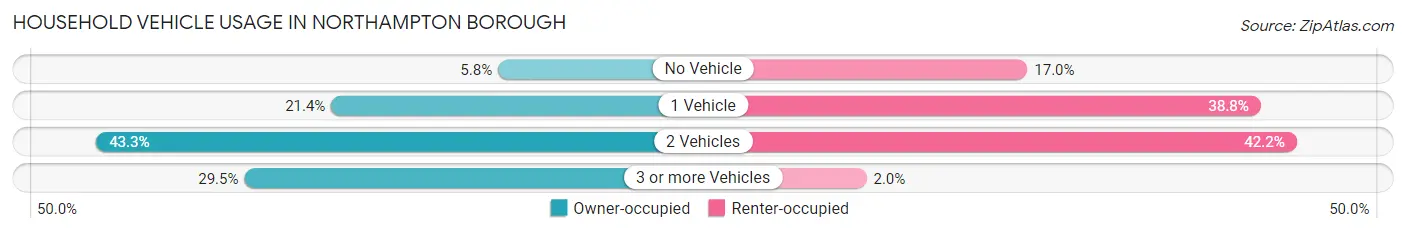
| Vehicles per Household | Owner-occupied | Renter-occupied |
| No Vehicle | 169 (5.8%) | 219 (17.0%) |
| 1 Vehicle | 622 (21.4%) | 499 (38.8%) |
| 2 Vehicles | 1,260 (43.3%) | 542 (42.1%) |
| 3 or more Vehicles | 858 (29.5%) | 26 (2.0%) |
| Total | 2,909 (100.0%) | 1,286 (100.0%) |
Real Estate & Mortgages in Northampton borough
Real Estate and Mortgage Overview in Northampton borough
| Characteristic | Without Mortgage | With Mortgage |
| Housing Units | 941 | 1,968 |
| Median Property Value | $192,000 | $208,800 |
| Median Household Income | $67,917 | $326 |
| Monthly Housing Costs | $675 | $30 |
| Real Estate Taxes | $3,390 | $8 |
Property Value by Mortgage Status in Northampton borough
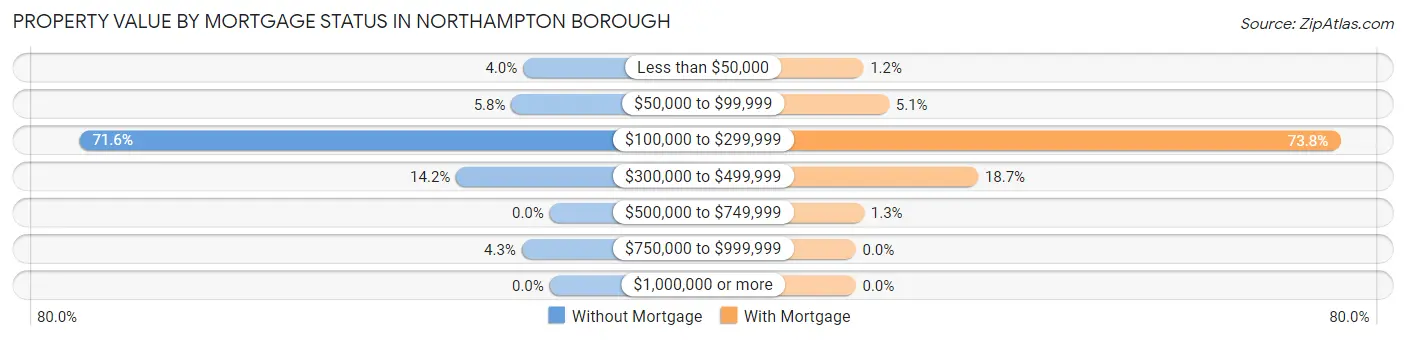
| Property Value | Without Mortgage | With Mortgage |
| Less than $50,000 | 38 (4.0%) | 23 (1.2%) |
| $50,000 to $99,999 | 55 (5.8%) | 100 (5.1%) |
| $100,000 to $299,999 | 674 (71.6%) | 1,453 (73.8%) |
| $300,000 to $499,999 | 134 (14.2%) | 367 (18.6%) |
| $500,000 to $749,999 | 0 (0.0%) | 25 (1.3%) |
| $750,000 to $999,999 | 40 (4.3%) | 0 (0.0%) |
| $1,000,000 or more | 0 (0.0%) | 0 (0.0%) |
| Total | 941 (100.0%) | 1,968 (100.0%) |
Household Income by Mortgage Status in Northampton borough
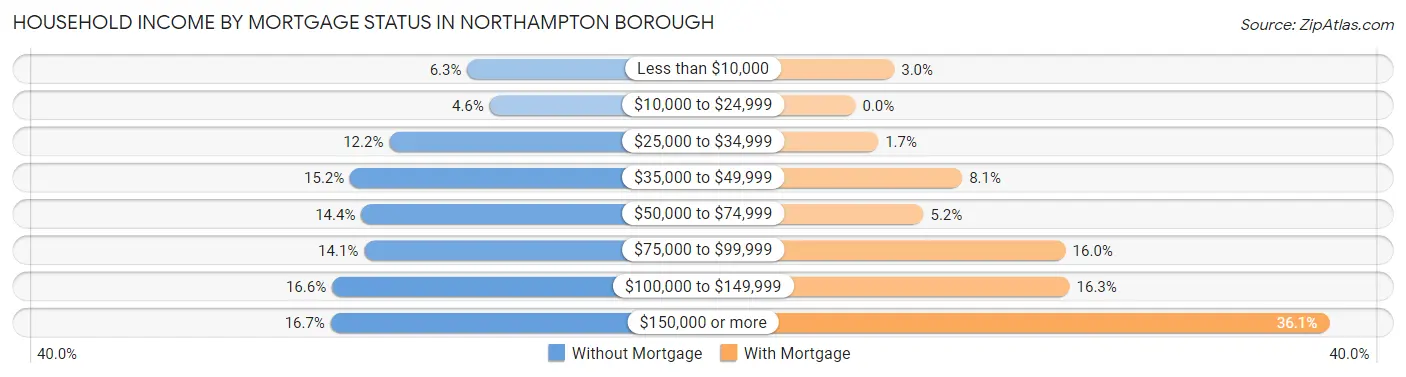
| Household Income | Without Mortgage | With Mortgage |
| Less than $10,000 | 59 (6.3%) | 58 (2.9%) |
| $10,000 to $24,999 | 43 (4.6%) | 0 (0.0%) |
| $25,000 to $34,999 | 115 (12.2%) | 34 (1.7%) |
| $35,000 to $49,999 | 143 (15.2%) | 160 (8.1%) |
| $50,000 to $74,999 | 135 (14.3%) | 102 (5.2%) |
| $75,000 to $99,999 | 133 (14.1%) | 315 (16.0%) |
| $100,000 to $149,999 | 156 (16.6%) | 321 (16.3%) |
| $150,000 or more | 157 (16.7%) | 710 (36.1%) |
| Total | 941 (100.0%) | 1,968 (100.0%) |
Property Value to Household Income Ratio in Northampton borough
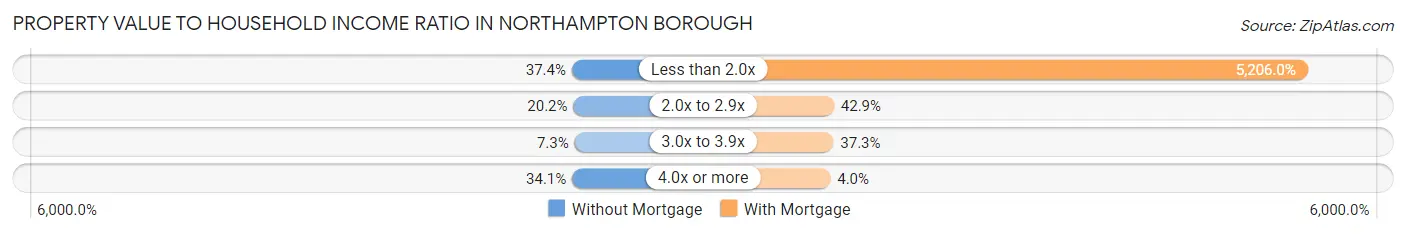
| Value-to-Income Ratio | Without Mortgage | With Mortgage |
| Less than 2.0x | 352 (37.4%) | 102,453 (5,205.9%) |
| 2.0x to 2.9x | 190 (20.2%) | 844 (42.9%) |
| 3.0x to 3.9x | 69 (7.3%) | 733 (37.2%) |
| 4.0x or more | 321 (34.1%) | 79 (4.0%) |
| Total | 941 (100.0%) | 1,968 (100.0%) |
Real Estate Taxes by Mortgage Status in Northampton borough
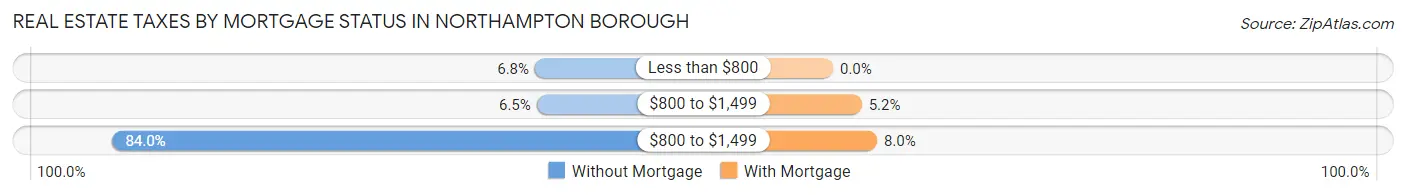
| Property Taxes | Without Mortgage | With Mortgage |
| Less than $800 | 64 (6.8%) | 0 (0.0%) |
| $800 to $1,499 | 61 (6.5%) | 103 (5.2%) |
| $800 to $1,499 | 790 (84.0%) | 158 (8.0%) |
| Total | 941 (100.0%) | 1,968 (100.0%) |
Health & Disability in Northampton borough
Health Insurance Coverage by Age in Northampton borough
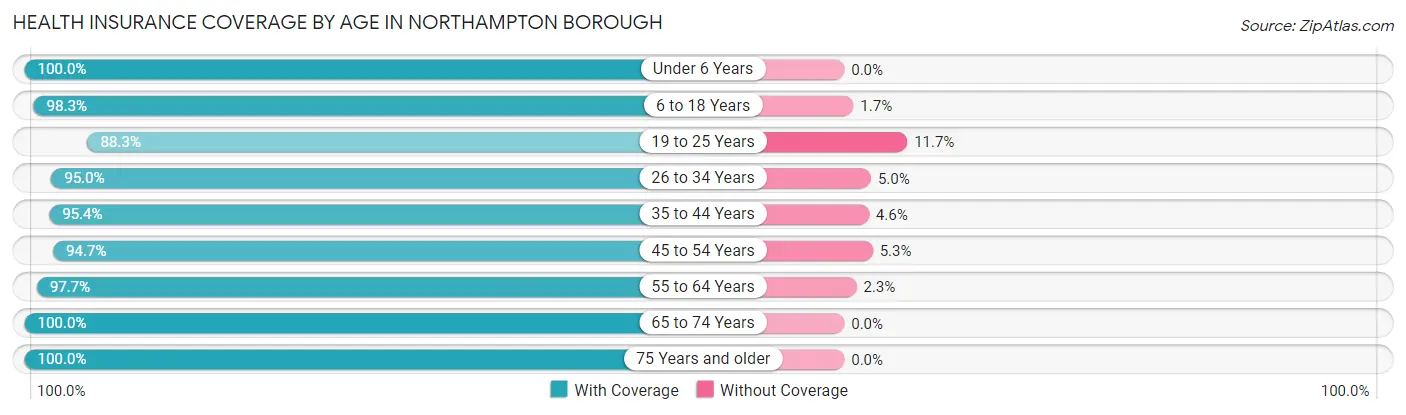
| Age Bracket | With Coverage | Without Coverage |
| Under 6 Years | 582 (100.0%) | 0 (0.0%) |
| 6 to 18 Years | 1,449 (98.3%) | 25 (1.7%) |
| 19 to 25 Years | 700 (88.3%) | 93 (11.7%) |
| 26 to 34 Years | 1,680 (95.0%) | 88 (5.0%) |
| 35 to 44 Years | 831 (95.4%) | 40 (4.6%) |
| 45 to 54 Years | 1,196 (94.7%) | 67 (5.3%) |
| 55 to 64 Years | 1,674 (97.7%) | 39 (2.3%) |
| 65 to 74 Years | 1,070 (100.0%) | 0 (0.0%) |
| 75 Years and older | 784 (100.0%) | 0 (0.0%) |
| Total | 9,966 (96.6%) | 352 (3.4%) |
Health Insurance Coverage by Citizenship Status in Northampton borough
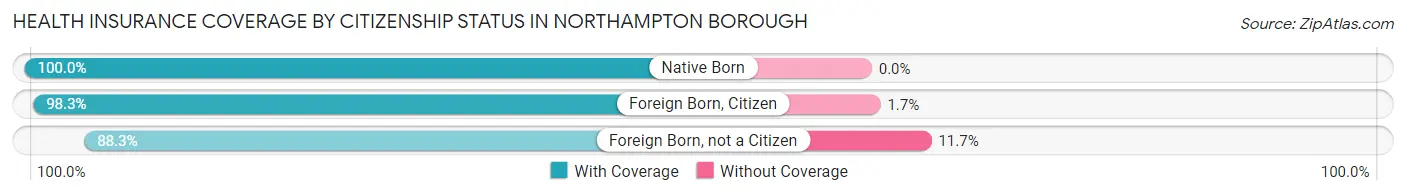
| Citizenship Status | With Coverage | Without Coverage |
| Native Born | 582 (100.0%) | 0 (0.0%) |
| Foreign Born, Citizen | 1,449 (98.3%) | 25 (1.7%) |
| Foreign Born, not a Citizen | 700 (88.3%) | 93 (11.7%) |
Health Insurance Coverage by Household Income in Northampton borough
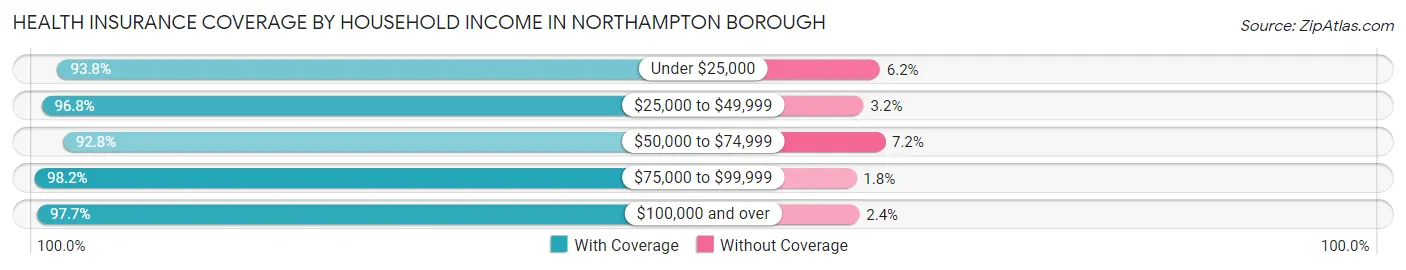
| Household Income | With Coverage | Without Coverage |
| Under $25,000 | 819 (93.8%) | 54 (6.2%) |
| $25,000 to $49,999 | 1,530 (96.8%) | 50 (3.2%) |
| $50,000 to $74,999 | 1,413 (92.8%) | 109 (7.2%) |
| $75,000 to $99,999 | 1,800 (98.2%) | 33 (1.8%) |
| $100,000 and over | 4,399 (97.7%) | 106 (2.4%) |
Public vs Private Health Insurance Coverage by Age in Northampton borough
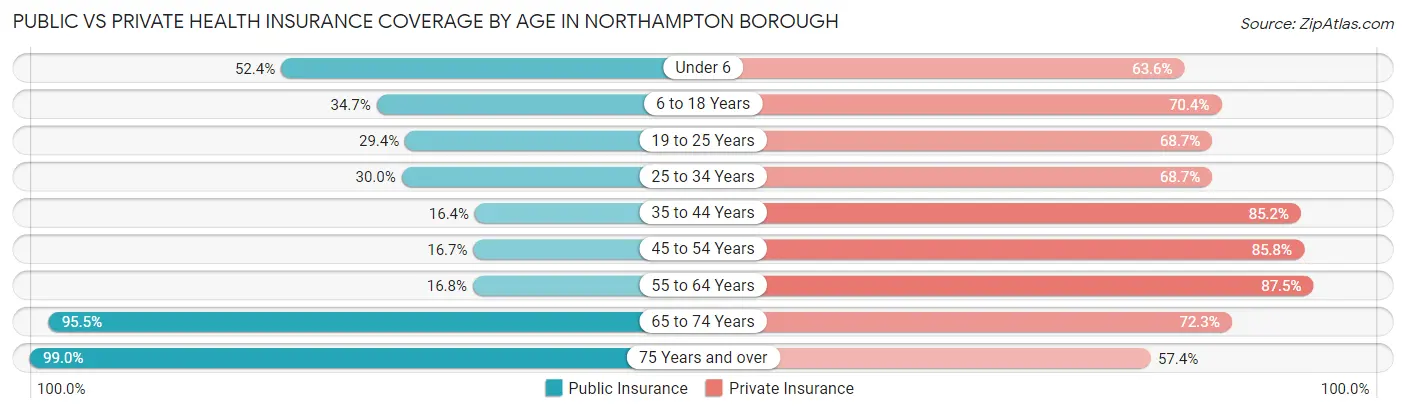
| Age Bracket | Public Insurance | Private Insurance |
| Under 6 | 305 (52.4%) | 370 (63.6%) |
| 6 to 18 Years | 511 (34.7%) | 1,038 (70.4%) |
| 19 to 25 Years | 233 (29.4%) | 545 (68.7%) |
| 25 to 34 Years | 531 (30.0%) | 1,215 (68.7%) |
| 35 to 44 Years | 143 (16.4%) | 742 (85.2%) |
| 45 to 54 Years | 211 (16.7%) | 1,083 (85.8%) |
| 55 to 64 Years | 288 (16.8%) | 1,499 (87.5%) |
| 65 to 74 Years | 1,022 (95.5%) | 774 (72.3%) |
| 75 Years and over | 776 (99.0%) | 450 (57.4%) |
| Total | 4,020 (39.0%) | 7,716 (74.8%) |
Disability Status by Sex by Age in Northampton borough
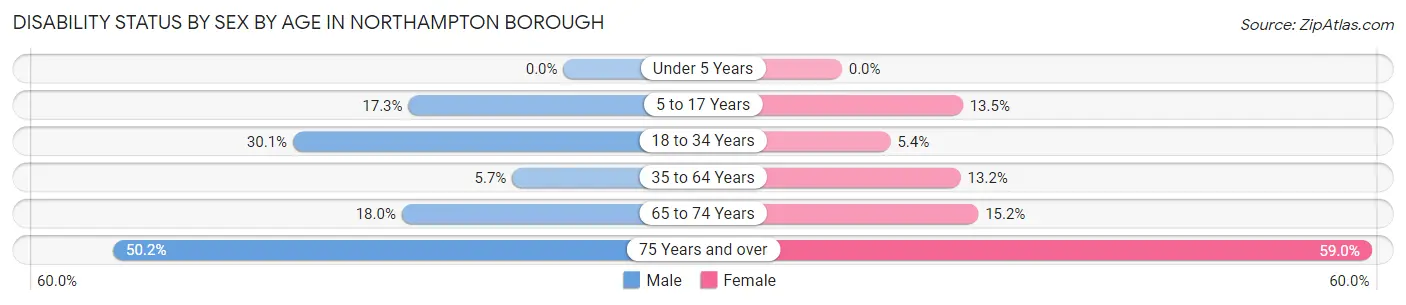
| Age Bracket | Male | Female |
| Under 5 Years | 0 (0.0%) | 0 (0.0%) |
| 5 to 17 Years | 141 (17.3%) | 92 (13.5%) |
| 18 to 34 Years | 434 (30.1%) | 67 (5.4%) |
| 35 to 64 Years | 107 (5.7%) | 261 (13.2%) |
| 65 to 74 Years | 99 (18.0%) | 79 (15.2%) |
| 75 Years and over | 162 (50.1%) | 272 (59.0%) |
Disability Class by Sex by Age in Northampton borough
Disability Class: Hearing Difficulty
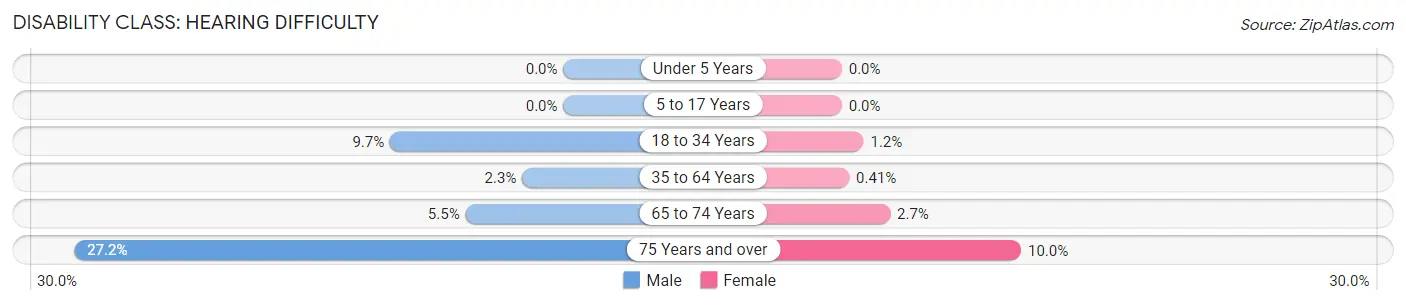
| Age Bracket | Male | Female |
| Under 5 Years | 0 (0.0%) | 0 (0.0%) |
| 5 to 17 Years | 0 (0.0%) | 0 (0.0%) |
| 18 to 34 Years | 139 (9.7%) | 15 (1.2%) |
| 35 to 64 Years | 43 (2.3%) | 8 (0.4%) |
| 65 to 74 Years | 30 (5.4%) | 14 (2.7%) |
| 75 Years and over | 88 (27.2%) | 46 (10.0%) |
Disability Class: Vision Difficulty
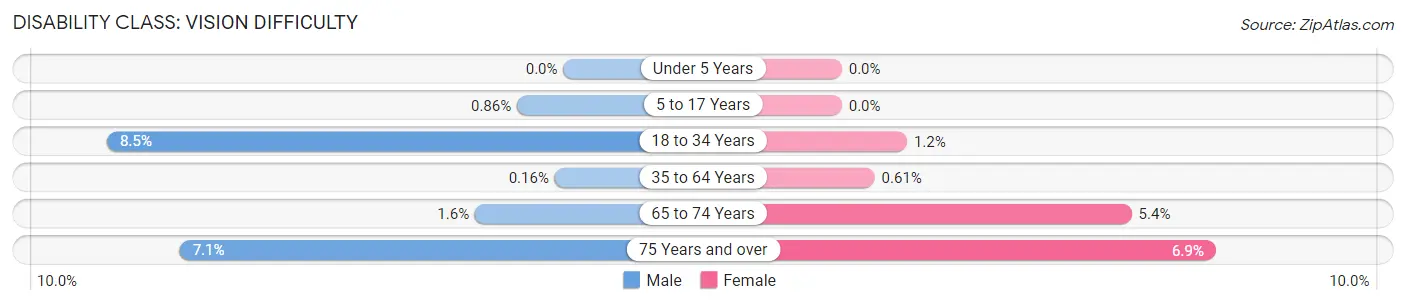
| Age Bracket | Male | Female |
| Under 5 Years | 0 (0.0%) | 0 (0.0%) |
| 5 to 17 Years | 7 (0.9%) | 0 (0.0%) |
| 18 to 34 Years | 122 (8.5%) | 15 (1.2%) |
| 35 to 64 Years | 3 (0.2%) | 12 (0.6%) |
| 65 to 74 Years | 9 (1.6%) | 28 (5.4%) |
| 75 Years and over | 23 (7.1%) | 32 (6.9%) |
Disability Class: Cognitive Difficulty
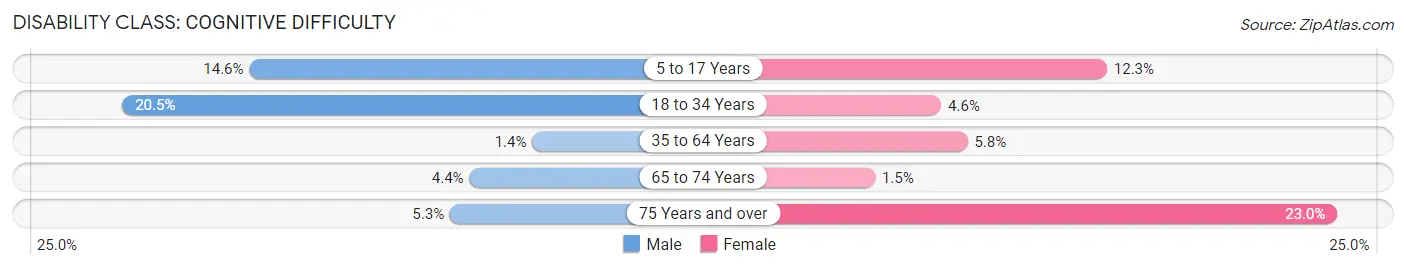
| Age Bracket | Male | Female |
| 5 to 17 Years | 119 (14.6%) | 84 (12.3%) |
| 18 to 34 Years | 295 (20.5%) | 57 (4.6%) |
| 35 to 64 Years | 27 (1.4%) | 115 (5.8%) |
| 65 to 74 Years | 24 (4.4%) | 8 (1.5%) |
| 75 Years and over | 17 (5.3%) | 106 (23.0%) |
Disability Class: Ambulatory Difficulty
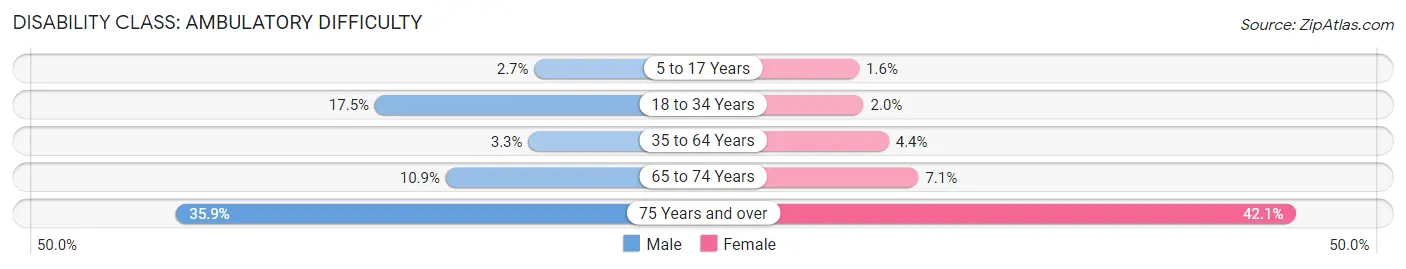
| Age Bracket | Male | Female |
| 5 to 17 Years | 22 (2.7%) | 11 (1.6%) |
| 18 to 34 Years | 252 (17.5%) | 25 (2.0%) |
| 35 to 64 Years | 61 (3.3%) | 86 (4.4%) |
| 65 to 74 Years | 60 (10.9%) | 37 (7.1%) |
| 75 Years and over | 116 (35.9%) | 194 (42.1%) |
Disability Class: Self-Care Difficulty
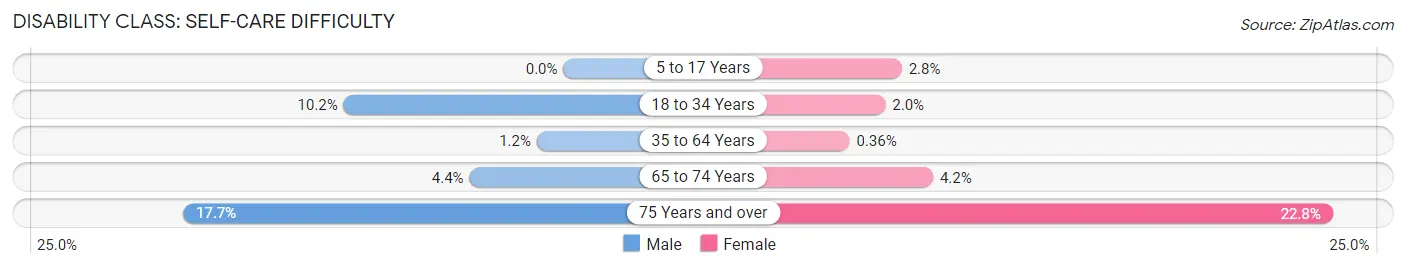
| Age Bracket | Male | Female |
| 5 to 17 Years | 0 (0.0%) | 19 (2.8%) |
| 18 to 34 Years | 147 (10.2%) | 25 (2.0%) |
| 35 to 64 Years | 23 (1.2%) | 7 (0.4%) |
| 65 to 74 Years | 24 (4.4%) | 22 (4.2%) |
| 75 Years and over | 57 (17.6%) | 105 (22.8%) |
Technology Access in Northampton borough
Computing Device Access in Northampton borough
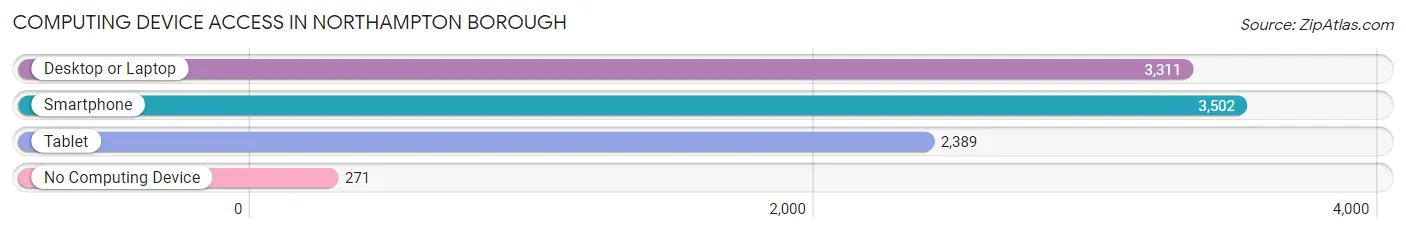
| Device Type | # Households | % Households |
| Desktop or Laptop | 3,311 | 78.9% |
| Smartphone | 3,502 | 83.5% |
| Tablet | 2,389 | 57.0% |
| No Computing Device | 271 | 6.5% |
| Total | 4,195 | 100.0% |
Internet Access in Northampton borough
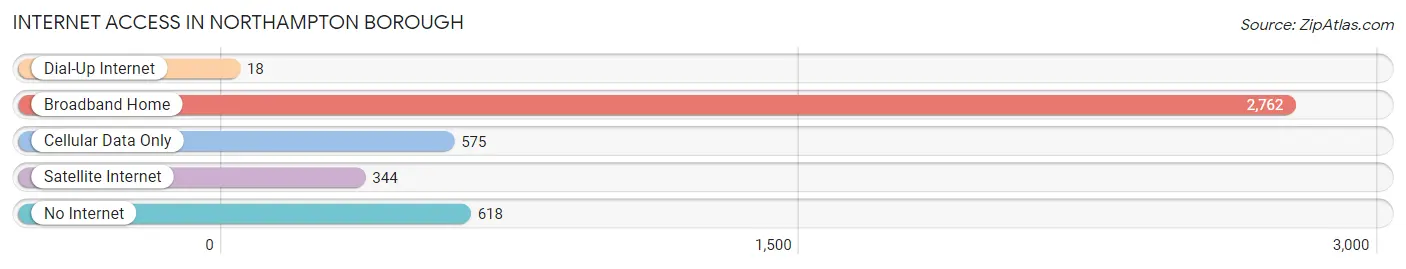
| Internet Type | # Households | % Households |
| Dial-Up Internet | 18 | 0.4% |
| Broadband Home | 2,762 | 65.8% |
| Cellular Data Only | 575 | 13.7% |
| Satellite Internet | 344 | 8.2% |
| No Internet | 618 | 14.7% |
| Total | 4,195 | 100.0% |
Northampton borough Summary
Northampton Borough is a borough located in Northampton County, Pennsylvania. It is located in the Lehigh Valley region of the state and is part of the Allentown-Bethlehem-Easton metropolitan area. The borough has a population of 8,845 as of the 2010 census.
Geography
Northampton Borough is located at 40°41'17" North, 75°22'17" West (40.6879, -75.3714). It is situated in the Lehigh Valley region of Pennsylvania, approximately 10 miles north of Allentown and 12 miles west of Easton. The borough is bordered by Allen Township to the north, Moore Township to the east, and Lehigh Township to the south and west.
The borough is located in the Lehigh Valley, a region of Pennsylvania that is known for its rolling hills and fertile farmland. The Lehigh River flows through the borough, providing a source of recreation and transportation. The borough is also home to several parks, including Canal Park, which features a walking path along the Lehigh Canal.
Demographics
As of the 2010 census, there were 8,845 people, 3,717 households, and 2,323 families residing in the borough. The population density was 2,845.3 people per square mile (1,098.7/km2). There were 3,945 housing units at an average density of 1,241.3 per square mile (477.3/km2). The racial makeup of the borough was 94.2% White, 1.3% African American, 0.2% Native American, 1.3% Asian, 0.1% Pacific Islander, 1.3% from other races, and 1.6% from two or more races. Hispanic or Latino of any race were 4.2% of the population.
There were 3,717 households, out of which 28.2% had children under the age of 18 living with them, 44.2% were married couples living together, 12.7% had a female householder with no husband present, and 38.2% were non-families. 32.2% of all households were made up of individuals, and 14.2% had someone living alone who was 65 years of age or older. The average household size was 2.37 and the average family size was 3.00.
In the borough, the population was spread out, with 22.7% under the age of 18, 8.2% from 18 to 24, 29.7% from 25 to 44, 22.2% from 45 to 64, and 17.2% who were 65 years of age or older. The median age was 38 years. For every 100 females, there were 91.2 males. For every 100 females age 18 and over, there were 87.7 males.
The median income for a household in the borough was $41,945, and the median income for a family was $50,945. Males had a median income of $37,945 versus $27,945 for females. The per capita income for the borough was $20,945. About 5.2% of families and 7.2% of the population were below the poverty line, including 8.2% of those under age 18 and 8.2% of those age 65 or over.
Economy
Northampton Borough is home to a variety of businesses, including manufacturing, retail, and service industries. The borough is home to several large employers, including Air Products and Chemicals, Inc., a Fortune 500 company that produces industrial gases and chemicals. The borough is also home to several smaller businesses, including restaurants, shops, and professional services.
The borough is served by the Lehigh Valley International Airport, which is located just outside the borough limits. The airport provides air service to the region and is a major economic driver for the area.
Conclusion
Northampton Borough is a borough located in Northampton County, Pennsylvania. It is located in the Lehigh Valley region of the state and is part of the Allentown-Bethlehem-Easton metropolitan area. The borough has a population of 8,845 as of the 2010 census. The borough is located in the Lehigh Valley, a region of Pennsylvania that is known for its rolling hills and fertile farmland. The borough is home to a variety of businesses, including manufacturing, retail, and service industries. The borough is served by the Lehigh Valley International Airport, which is located just outside the borough limits. The airport provides air service to the region and is a major economic driver for the area.
Common Questions
What is Per Capita Income in Northampton borough?
Per Capita income in Northampton borough is $38,274.
What is the Median Family Income in Northampton borough?
Median Family Income in Northampton borough is $89,741.
What is the Median Household income in Northampton borough?
Median Household Income in Northampton borough is $77,182.
What is Income or Wage Gap in Northampton borough?
Income or Wage Gap in Northampton borough is 41.9%.
Women in Northampton borough earn 58.1 cents for every dollar earned by a man.
What is Inequality or Gini Index in Northampton borough?
Inequality or Gini Index in Northampton borough is 0.43.
What is the Total Population of Northampton borough?
Total Population of Northampton borough is 10,341.
What is the Total Male Population of Northampton borough?
Total Male Population of Northampton borough is 5,205.
What is the Total Female Population of Northampton borough?
Total Female Population of Northampton borough is 5,136.
What is the Ratio of Males per 100 Females in Northampton borough?
There are 101.34 Males per 100 Females in Northampton borough.
What is the Ratio of Females per 100 Males in Northampton borough?
There are 98.67 Females per 100 Males in Northampton borough.
What is the Median Population Age in Northampton borough?
Median Population Age in Northampton borough is 40.6 Years.
What is the Average Family Size in Northampton borough
Average Family Size in Northampton borough is 2.9 People.
What is the Average Household Size in Northampton borough
Average Household Size in Northampton borough is 2.5 People.
How Large is the Labor Force in Northampton borough?
There are 5,400 People in the Labor Forcein in Northampton borough.
What is the Percentage of People in the Labor Force in Northampton borough?
63.2% of People are in the Labor Force in Northampton borough.
What is the Unemployment Rate in Northampton borough?
Unemployment Rate in Northampton borough is 4.1%.