Sligo borough, PA Map & Demographics
Sligo borough Overview
$26,795
PER CAPITA INCOME
$54,875
AVG FAMILY INCOME
$46,346
AVG HOUSEHOLD INCOME
34.0%
WAGE / INCOME GAP [ % ]
66.0¢/ $1
WAGE / INCOME GAP [ $ ]
0.46
INEQUALITY / GINI INDEX
745
TOTAL POPULATION
365
MALE POPULATION
380
FEMALE POPULATION
96.05
MALES / 100 FEMALES
104.11
FEMALES / 100 MALES
43.8
MEDIAN AGE
2.8
AVG FAMILY SIZE
2.4
AVG HOUSEHOLD SIZE
334
LABOR FORCE [ PEOPLE ]
52.8%
PERCENT IN LABOR FORCE
7.8%
UNEMPLOYMENT RATE
Income in Sligo borough
Income Overview in Sligo borough
Per Capita Income in Sligo borough is $26,795, while median incomes of families and households are $54,875 and $46,346 respectively.
| Characteristic | Number | Measure |
| Per Capita Income | 745 | $26,795 |
| Median Family Income | 203 | $54,875 |
| Mean Family Income | 203 | $75,540 |
| Median Household Income | 308 | $46,346 |
| Mean Household Income | 308 | $63,430 |
| Income Deficit | 203 | $0 |
| Wage / Income Gap (%) | 745 | 34.00% |
| Wage / Income Gap ($) | 745 | 66.00¢ per $1 |
| Gini / Inequality Index | 745 | 0.46 |
Earnings by Sex in Sligo borough
Average Earnings in Sligo borough are $28,313, $37,500 for men and $24,750 for women, a difference of 34.0%.
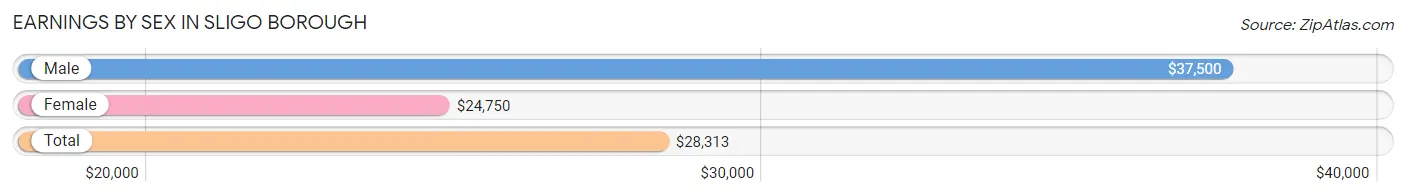
| Sex | Number | Average Earnings |
| Male | 182 (52.7%) | $37,500 |
| Female | 163 (47.2%) | $24,750 |
| Total | 345 (100.0%) | $28,313 |
Earnings by Sex by Income Bracket in Sligo borough
The most common earnings brackets in Sligo borough are $100,000+ for men (28 | 15.4%) and $25,000 to $29,999 for women (28 | 17.2%).
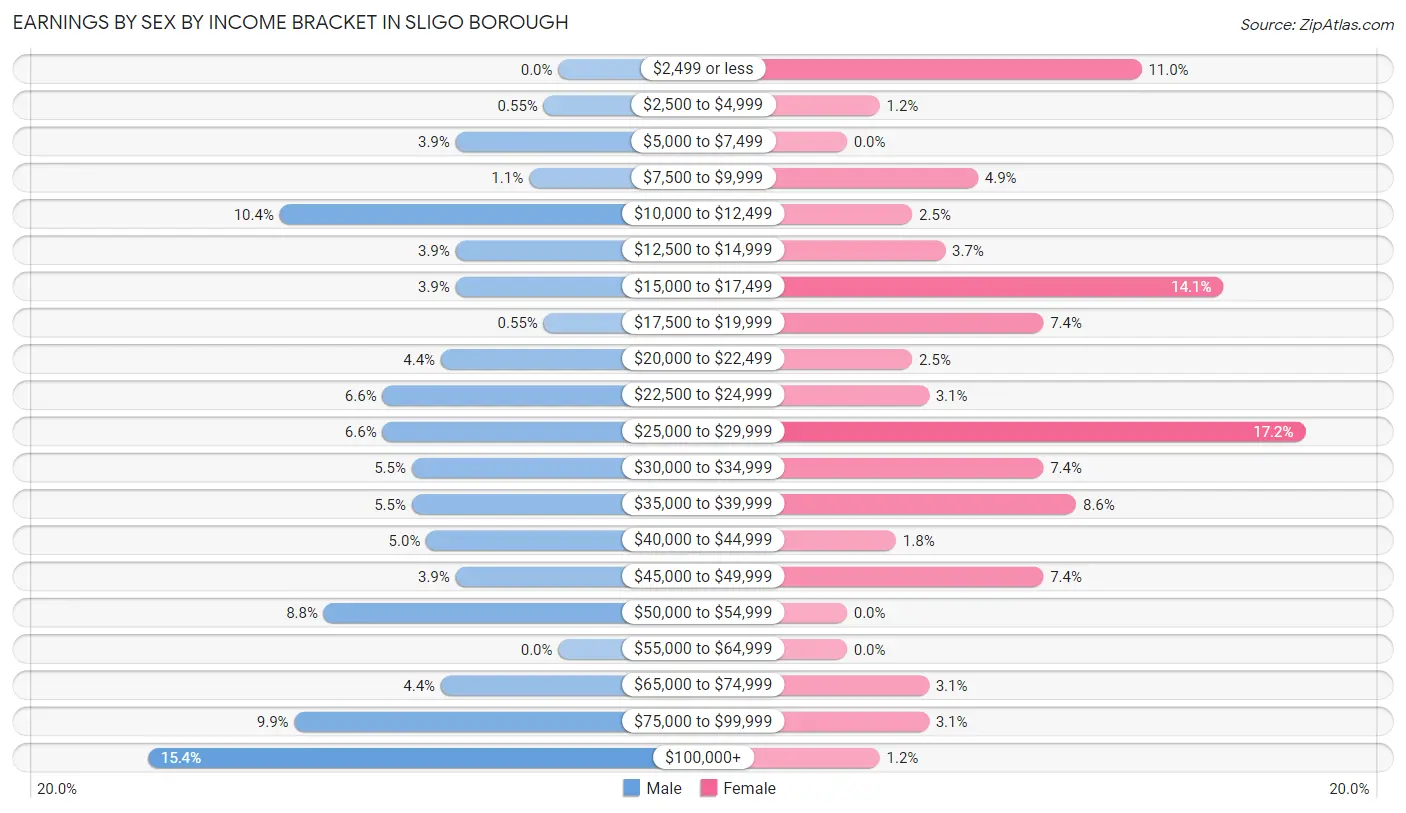
| Income | Male | Female |
| $2,499 or less | 0 (0.0%) | 18 (11.0%) |
| $2,500 to $4,999 | 1 (0.5%) | 2 (1.2%) |
| $5,000 to $7,499 | 7 (3.8%) | 0 (0.0%) |
| $7,500 to $9,999 | 2 (1.1%) | 8 (4.9%) |
| $10,000 to $12,499 | 19 (10.4%) | 4 (2.5%) |
| $12,500 to $14,999 | 7 (3.8%) | 6 (3.7%) |
| $15,000 to $17,499 | 7 (3.8%) | 23 (14.1%) |
| $17,500 to $19,999 | 1 (0.5%) | 12 (7.4%) |
| $20,000 to $22,499 | 8 (4.4%) | 4 (2.5%) |
| $22,500 to $24,999 | 12 (6.6%) | 5 (3.1%) |
| $25,000 to $29,999 | 12 (6.6%) | 28 (17.2%) |
| $30,000 to $34,999 | 10 (5.5%) | 12 (7.4%) |
| $35,000 to $39,999 | 10 (5.5%) | 14 (8.6%) |
| $40,000 to $44,999 | 9 (5.0%) | 3 (1.8%) |
| $45,000 to $49,999 | 7 (3.8%) | 12 (7.4%) |
| $50,000 to $54,999 | 16 (8.8%) | 0 (0.0%) |
| $55,000 to $64,999 | 0 (0.0%) | 0 (0.0%) |
| $65,000 to $74,999 | 8 (4.4%) | 5 (3.1%) |
| $75,000 to $99,999 | 18 (9.9%) | 5 (3.1%) |
| $100,000+ | 28 (15.4%) | 2 (1.2%) |
| Total | 182 (100.0%) | 163 (100.0%) |
Earnings by Sex by Educational Attainment in Sligo borough
Average earnings in Sligo borough are $43,056 for men and $26,188 for women, a difference of 39.2%. Men with an educational attainment of bachelor's degree enjoy the highest average annual earnings of $51,563, while those with less than high school education earn the least with $26,250. Women with an educational attainment of college or associate's degree earn the most with the average annual earnings of $27,417, while those with high school diploma education have the smallest earnings of $22,500.
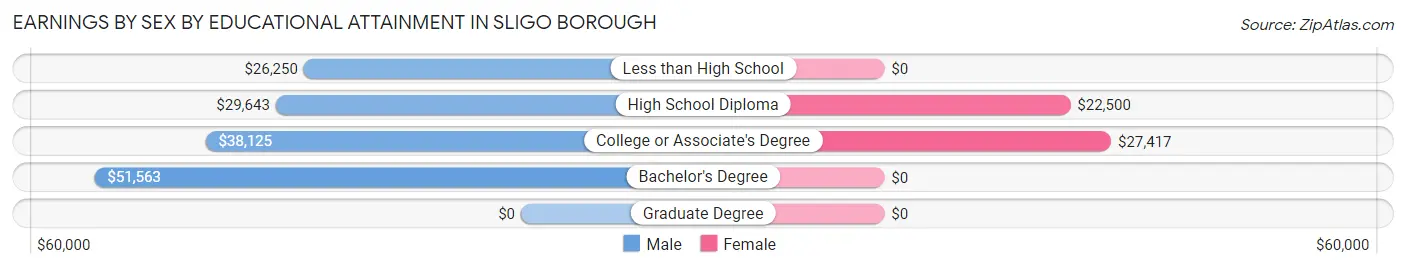
| Educational Attainment | Male Income | Female Income |
| Less than High School | $26,250 | $0 |
| High School Diploma | $29,643 | $22,500 |
| College or Associate's Degree | $38,125 | $27,417 |
| Bachelor's Degree | $51,563 | $0 |
| Graduate Degree | - | - |
| Total | $43,056 | $26,188 |
Family Income in Sligo borough
Family Income Brackets in Sligo borough
According to the Sligo borough family income data, there are 35 families falling into the $15,000 to $24,999 income range, which is the most common income bracket and makes up 17.2% of all families. Conversely, the $10,000 to $14,999 income bracket is the least frequent group with only 5 families (2.5%) belonging to this category.
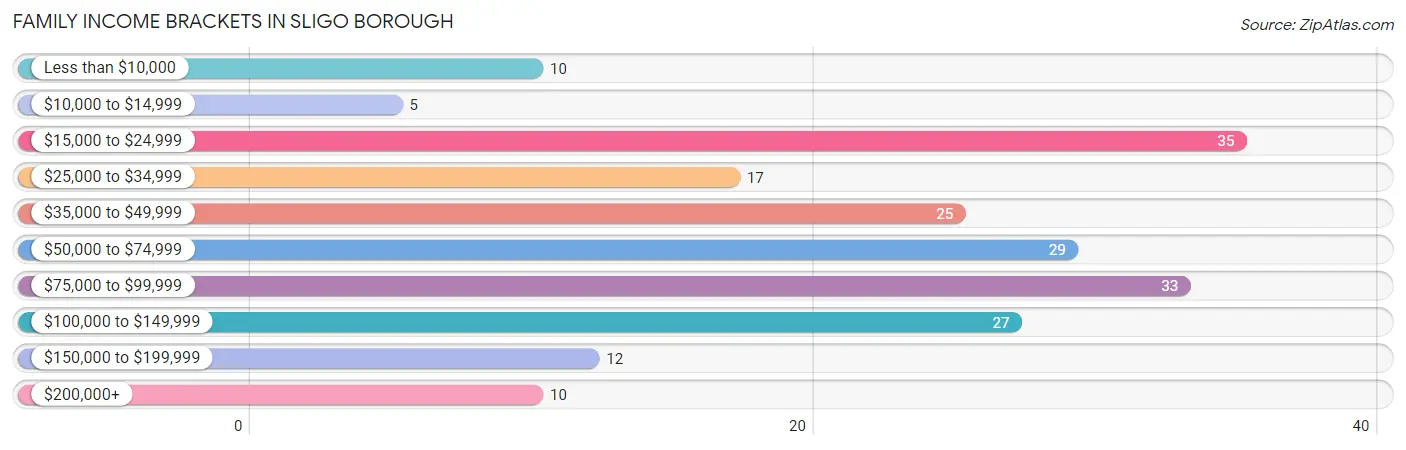
| Income Bracket | # Families | % Families |
| Less than $10,000 | 10 | 4.9% |
| $10,000 to $14,999 | 5 | 2.5% |
| $15,000 to $24,999 | 35 | 17.2% |
| $25,000 to $34,999 | 17 | 8.4% |
| $35,000 to $49,999 | 25 | 12.3% |
| $50,000 to $74,999 | 29 | 14.3% |
| $75,000 to $99,999 | 33 | 16.3% |
| $100,000 to $149,999 | 27 | 13.3% |
| $150,000 to $199,999 | 12 | 5.9% |
| $200,000+ | 10 | 4.9% |
Family Income by Famaliy Size in Sligo borough
3-person families (40 | 19.7%) account for the highest median family income in Sligo borough with $90,000 per family, while 3-person families (40 | 19.7%) have the highest median income of $30,000 per family member.
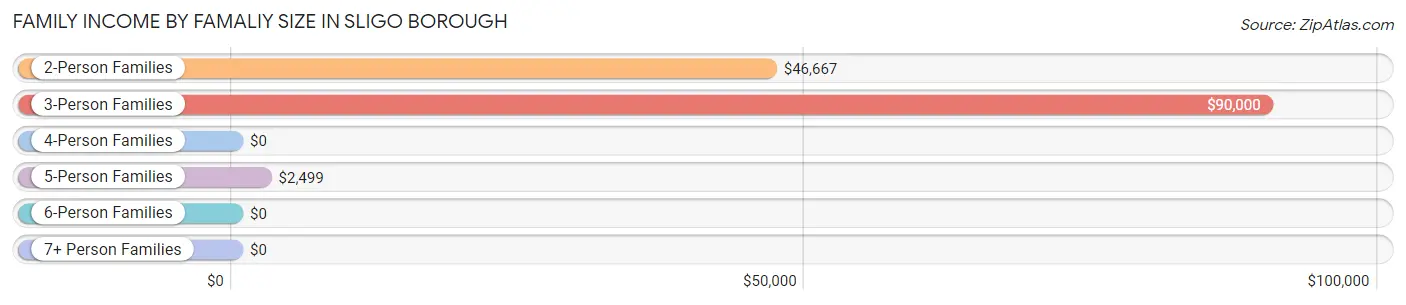
| Income Bracket | # Families | Median Income |
| 2-Person Families | 114 (56.2%) | $46,667 |
| 3-Person Families | 40 (19.7%) | $90,000 |
| 4-Person Families | 23 (11.3%) | $0 |
| 5-Person Families | 16 (7.9%) | $2,499 |
| 6-Person Families | 10 (4.9%) | $0 |
| 7+ Person Families | 0 (0.0%) | $0 |
| Total | 203 (100.0%) | $54,875 |
Family Income by Number of Earners in Sligo borough
The median family income in Sligo borough is $54,875, with families comprising 3+ earners (16) having the highest median family income of $98,750, while families with no earners (50) have the lowest median family income of $20,962, accounting for 7.9% and 24.6% of families, respectively.
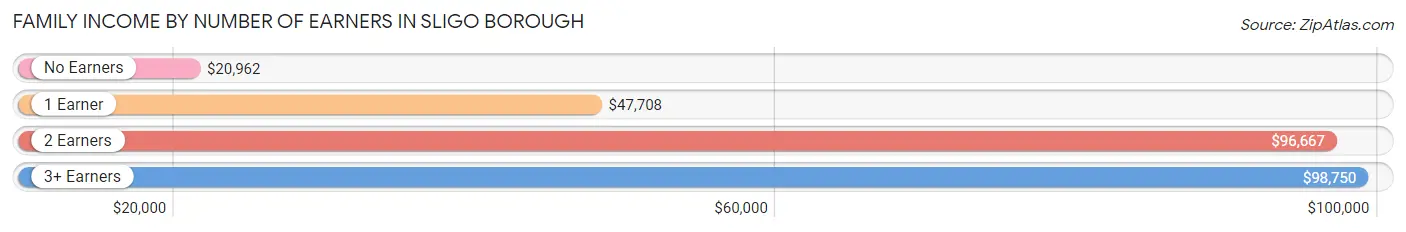
| Number of Earners | # Families | Median Income |
| No Earners | 50 (24.6%) | $20,962 |
| 1 Earner | 67 (33.0%) | $47,708 |
| 2 Earners | 70 (34.5%) | $96,667 |
| 3+ Earners | 16 (7.9%) | $98,750 |
| Total | 203 (100.0%) | $54,875 |
Household Income in Sligo borough
Household Income Brackets in Sligo borough
With 72 households falling in the category, the $15,000 to $24,999 income range is the most frequent in Sligo borough, accounting for 23.4% of all households. In contrast, only 4 households (1.3%) fall into the less than $10,000 income bracket, making it the least populous group.
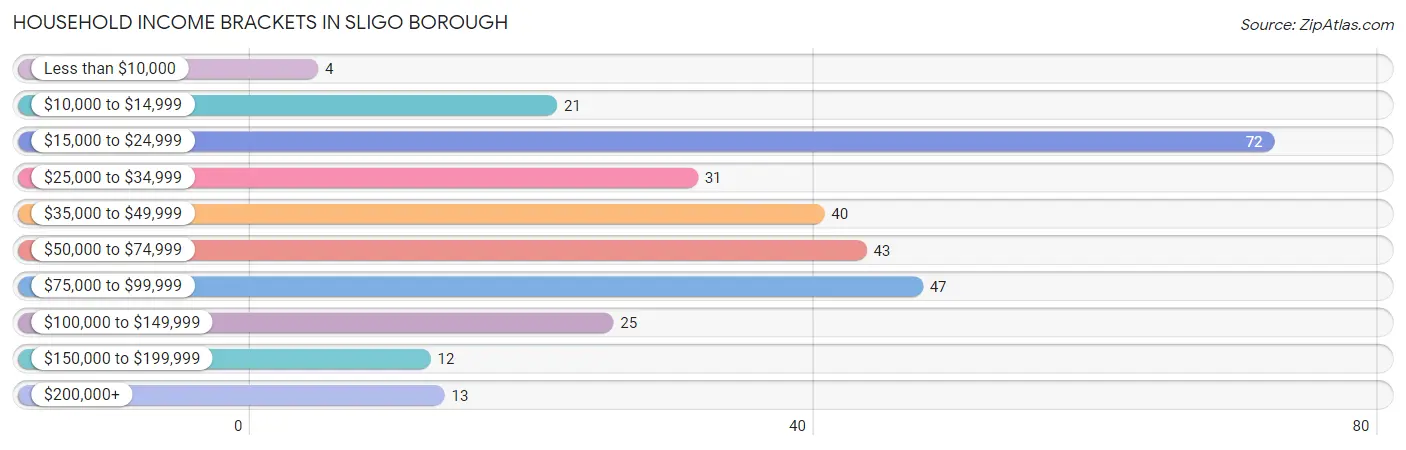
| Income Bracket | # Households | % Households |
| Less than $10,000 | 4 | 1.3% |
| $10,000 to $14,999 | 21 | 6.8% |
| $15,000 to $24,999 | 72 | 23.4% |
| $25,000 to $34,999 | 31 | 10.1% |
| $35,000 to $49,999 | 40 | 13.0% |
| $50,000 to $74,999 | 43 | 14.0% |
| $75,000 to $99,999 | 47 | 15.3% |
| $100,000 to $149,999 | 25 | 8.1% |
| $150,000 to $199,999 | 12 | 3.9% |
| $200,000+ | 13 | 4.2% |
Household Income by Householder Age in Sligo borough
The median household income in Sligo borough is $46,346, with the highest median household income of $58,750 found in the 25 to 44 years age bracket for the primary householder. A total of 76 households (24.7%) fall into this category. Meanwhile, the 15 to 24 years age bracket for the primary householder has the lowest median household income of $0, with 5 households (1.6%) in this group.
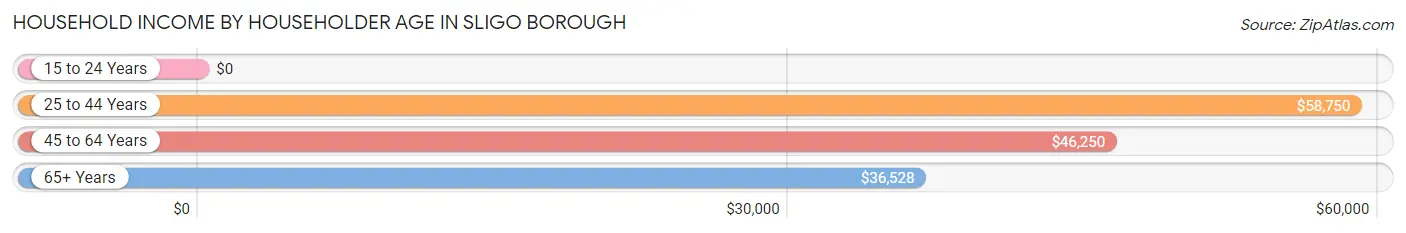
| Income Bracket | # Households | Median Income |
| 15 to 24 Years | 5 (1.6%) | $0 |
| 25 to 44 Years | 76 (24.7%) | $58,750 |
| 45 to 64 Years | 134 (43.5%) | $46,250 |
| 65+ Years | 93 (30.2%) | $36,528 |
| Total | 308 (100.0%) | $46,346 |
Poverty in Sligo borough
Income Below Poverty by Sex and Age in Sligo borough
With 20.8% poverty level for males and 17.1% for females among the residents of Sligo borough, 6 to 11 year old males and 5 year old females are the most vulnerable to poverty, with 23 males (67.6%) and 3 females (60.0%) in their respective age groups living below the poverty level.
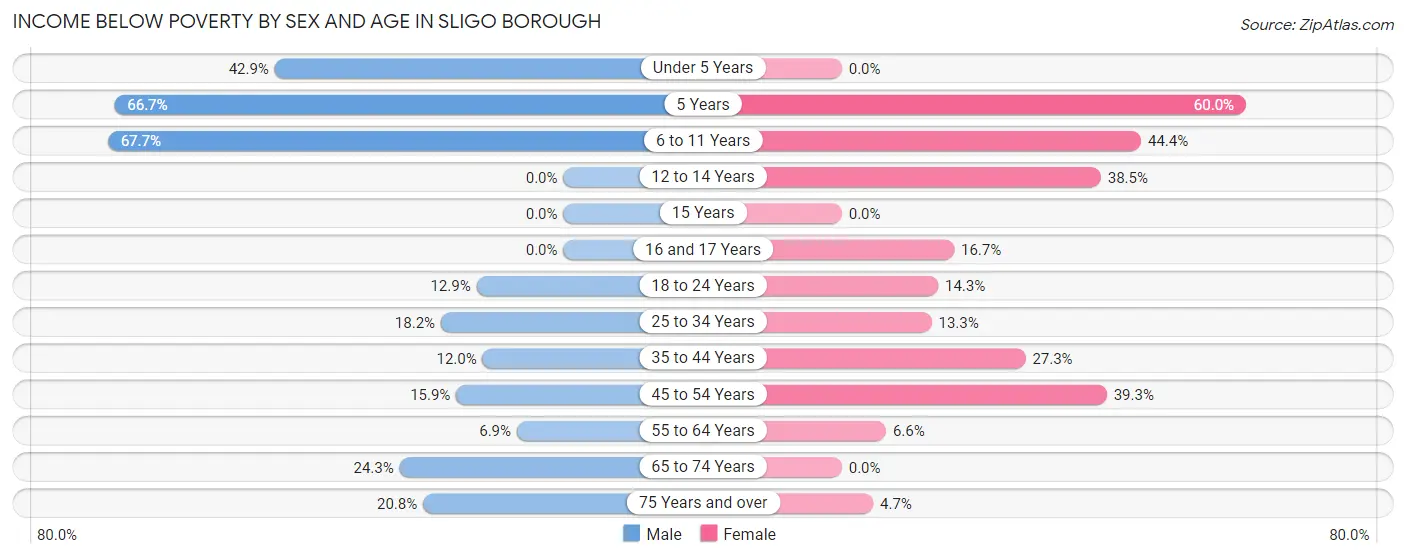
| Age Bracket | Male | Female |
| Under 5 Years | 6 (42.9%) | 0 (0.0%) |
| 5 Years | 4 (66.7%) | 3 (60.0%) |
| 6 to 11 Years | 23 (67.6%) | 4 (44.4%) |
| 12 to 14 Years | 0 (0.0%) | 5 (38.5%) |
| 15 Years | 0 (0.0%) | 0 (0.0%) |
| 16 and 17 Years | 0 (0.0%) | 2 (16.7%) |
| 18 to 24 Years | 4 (12.9%) | 3 (14.3%) |
| 25 to 34 Years | 8 (18.2%) | 12 (13.3%) |
| 35 to 44 Years | 6 (12.0%) | 6 (27.3%) |
| 45 to 54 Years | 7 (15.9%) | 24 (39.3%) |
| 55 to 64 Years | 4 (6.9%) | 4 (6.6%) |
| 65 to 74 Years | 9 (24.3%) | 0 (0.0%) |
| 75 Years and over | 5 (20.8%) | 2 (4.6%) |
| Total | 76 (20.8%) | 65 (17.1%) |
Income Above Poverty by Sex and Age in Sligo borough
According to the poverty statistics in Sligo borough, males aged 12 to 14 years and females aged under 5 years are the age groups that are most secure financially, with 100.0% of males and 100.0% of females in these age groups living above the poverty line.
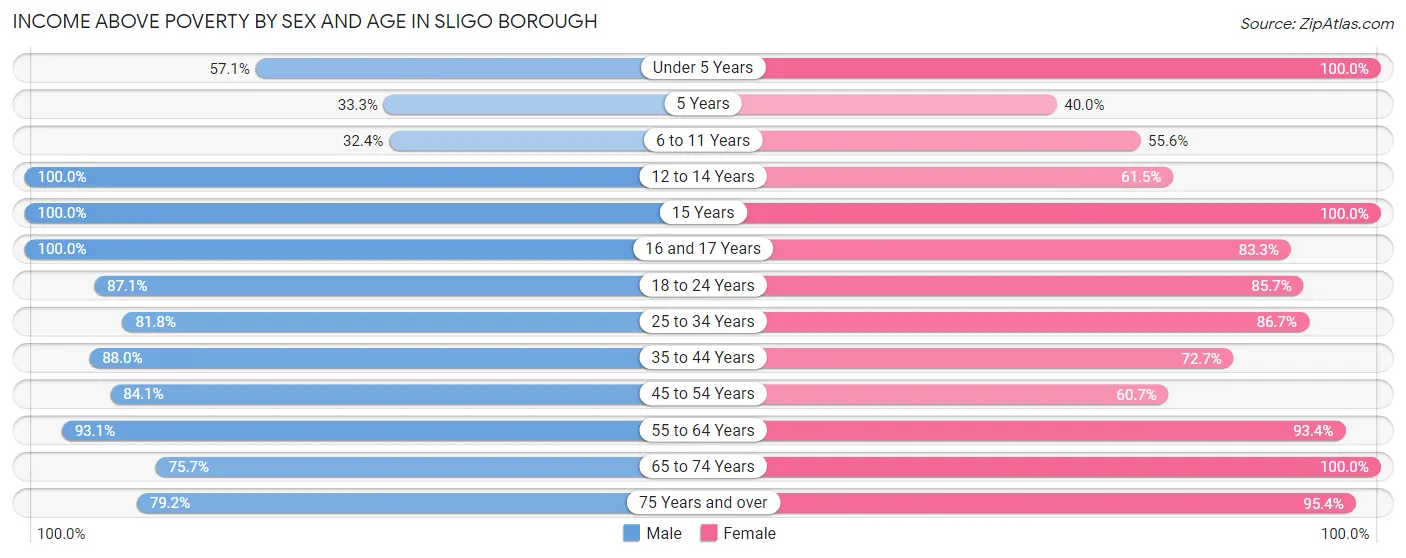
| Age Bracket | Male | Female |
| Under 5 Years | 8 (57.1%) | 8 (100.0%) |
| 5 Years | 2 (33.3%) | 2 (40.0%) |
| 6 to 11 Years | 11 (32.4%) | 5 (55.6%) |
| 12 to 14 Years | 13 (100.0%) | 8 (61.5%) |
| 15 Years | 9 (100.0%) | 2 (100.0%) |
| 16 and 17 Years | 1 (100.0%) | 10 (83.3%) |
| 18 to 24 Years | 27 (87.1%) | 18 (85.7%) |
| 25 to 34 Years | 36 (81.8%) | 78 (86.7%) |
| 35 to 44 Years | 44 (88.0%) | 16 (72.7%) |
| 45 to 54 Years | 37 (84.1%) | 37 (60.7%) |
| 55 to 64 Years | 54 (93.1%) | 57 (93.4%) |
| 65 to 74 Years | 28 (75.7%) | 33 (100.0%) |
| 75 Years and over | 19 (79.2%) | 41 (95.4%) |
| Total | 289 (79.2%) | 315 (82.9%) |
Income Below Poverty Among Married-Couple Families in Sligo borough
The poverty statistics for married-couple families in Sligo borough show that 7.1% or 9 of the total 127 families live below the poverty line. Families with 3 or 4 children have the highest poverty rate of 50.0%, comprising of 7 families. On the other hand, families with 1 or 2 children have the lowest poverty rate of 0.0%, which includes 0 families.
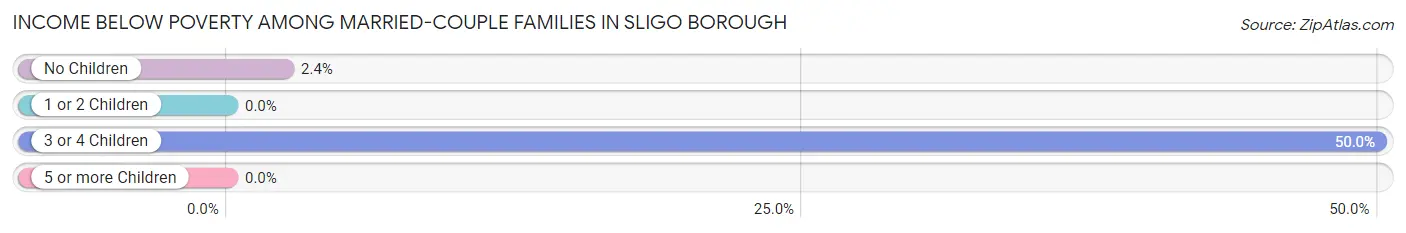
| Children | Above Poverty | Below Poverty |
| No Children | 80 (97.6%) | 2 (2.4%) |
| 1 or 2 Children | 31 (100.0%) | 0 (0.0%) |
| 3 or 4 Children | 7 (50.0%) | 7 (50.0%) |
| 5 or more Children | 0 (0.0%) | 0 (0.0%) |
| Total | 118 (92.9%) | 9 (7.1%) |
Income Below Poverty Among Single-Parent Households in Sligo borough
According to the poverty data in Sligo borough, 17.5% or 7 single-father households and 22.2% or 8 single-mother households are living below the poverty line. Among single-father households, those with 3 or 4 children have the highest poverty rate, with 7 households (100.0%) experiencing poverty. Likewise, among single-mother households, those with 3 or 4 children have the highest poverty rate, with 5 households (100.0%) falling below the poverty line.
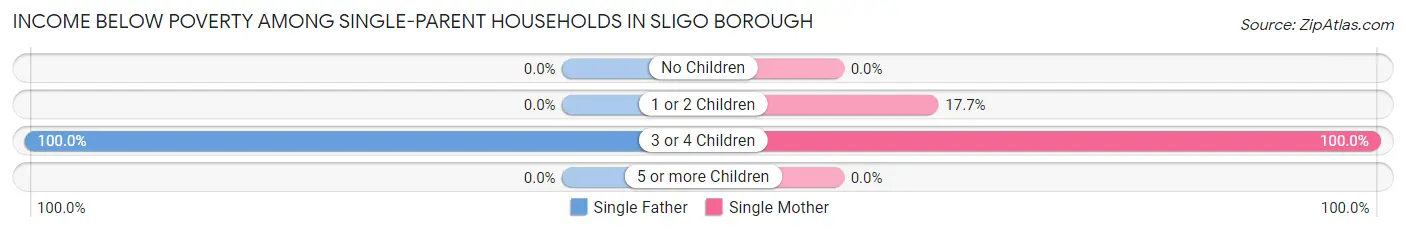
| Children | Single Father | Single Mother |
| No Children | 0 (0.0%) | 0 (0.0%) |
| 1 or 2 Children | 0 (0.0%) | 3 (17.6%) |
| 3 or 4 Children | 7 (100.0%) | 5 (100.0%) |
| 5 or more Children | 0 (0.0%) | 0 (0.0%) |
| Total | 7 (17.5%) | 8 (22.2%) |
Income Below Poverty Among Married-Couple vs Single-Parent Households in Sligo borough
The poverty data for Sligo borough shows that 9 of the married-couple family households (7.1%) and 15 of the single-parent households (19.7%) are living below the poverty level. Within the married-couple family households, those with 3 or 4 children have the highest poverty rate, with 7 households (50.0%) falling below the poverty line. Among the single-parent households, those with 3 or 4 children have the highest poverty rate, with 12 household (100.0%) living below poverty.
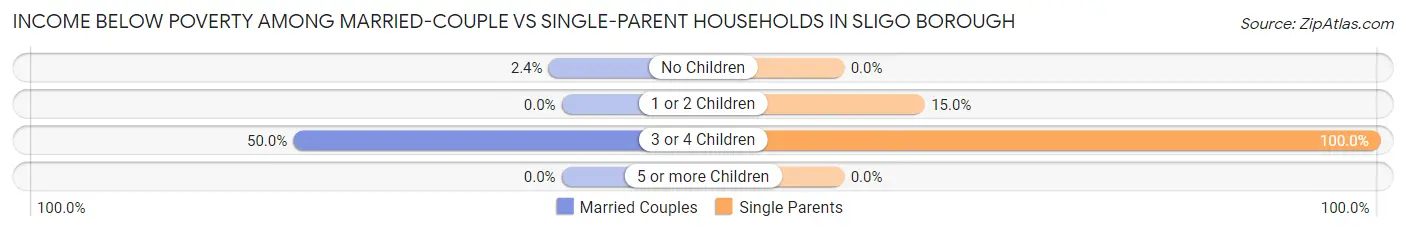
| Children | Married-Couple Families | Single-Parent Households |
| No Children | 2 (2.4%) | 0 (0.0%) |
| 1 or 2 Children | 0 (0.0%) | 3 (15.0%) |
| 3 or 4 Children | 7 (50.0%) | 12 (100.0%) |
| 5 or more Children | 0 (0.0%) | 0 (0.0%) |
| Total | 9 (7.1%) | 15 (19.7%) |
Race in Sligo borough
The most populous races in Sligo borough are White / Caucasian (681 | 91.4%), Two or more Races (62 | 8.3%), and Native / Alaskan (2 | 0.3%).
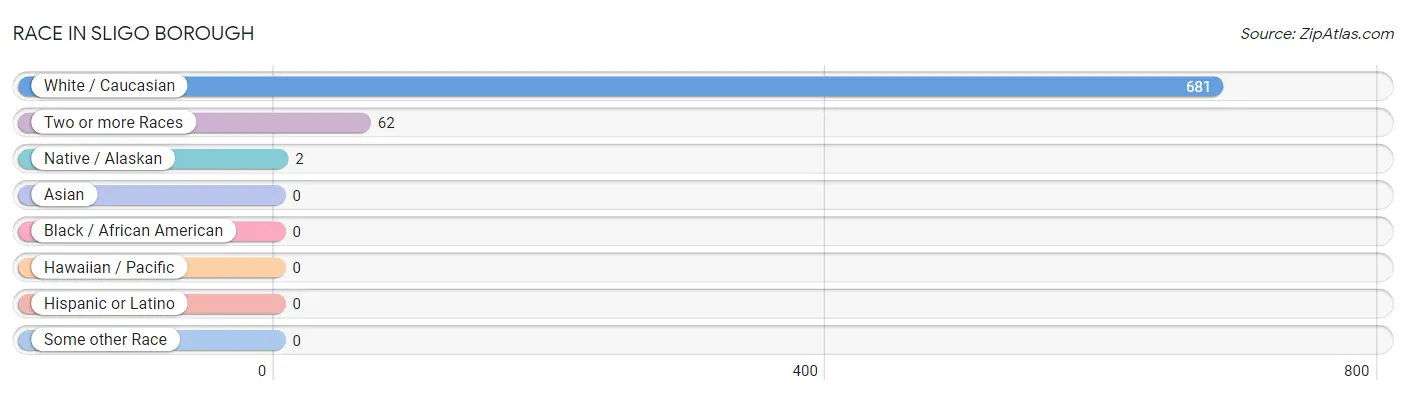
| Race | # Population | % Population |
| Asian | 0 | 0.0% |
| Black / African American | 0 | 0.0% |
| Hawaiian / Pacific | 0 | 0.0% |
| Hispanic or Latino | 0 | 0.0% |
| Native / Alaskan | 2 | 0.3% |
| White / Caucasian | 681 | 91.4% |
| Two or more Races | 62 | 8.3% |
| Some other Race | 0 | 0.0% |
| Total | 745 | 100.0% |
Ancestry in Sligo borough
The most populous ancestries reported in Sligo borough are German (209 | 28.1%), Irish (198 | 26.6%), Dutch (68 | 9.1%), Italian (51 | 6.9%), and American (38 | 5.1%), together accounting for 75.7% of all Sligo borough residents.
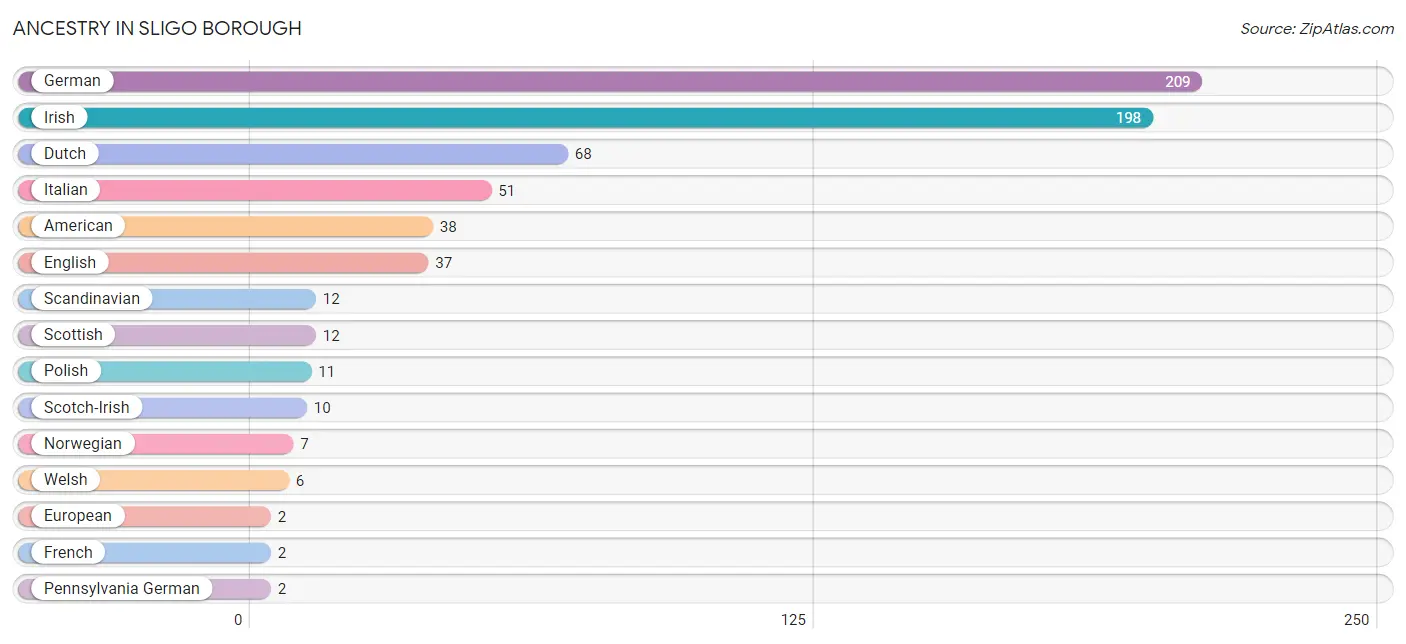
| Ancestry | # Population | % Population |
| American | 38 | 5.1% |
| Dutch | 68 | 9.1% |
| English | 37 | 5.0% |
| European | 2 | 0.3% |
| French | 2 | 0.3% |
| German | 209 | 28.1% |
| Irish | 198 | 26.6% |
| Italian | 51 | 6.9% |
| Norwegian | 7 | 0.9% |
| Pennsylvania German | 2 | 0.3% |
| Polish | 11 | 1.5% |
| Scandinavian | 12 | 1.6% |
| Scotch-Irish | 10 | 1.3% |
| Scottish | 12 | 1.6% |
| Welsh | 6 | 0.8% | View All 15 Rows |
Immigrants in Sligo borough
The most numerous immigrant groups reported in Sligo borough came from Europe (2 | 0.3%), Germany (2 | 0.3%), and Western Europe (2 | 0.3%), together accounting for 0.8% of all Sligo borough residents.
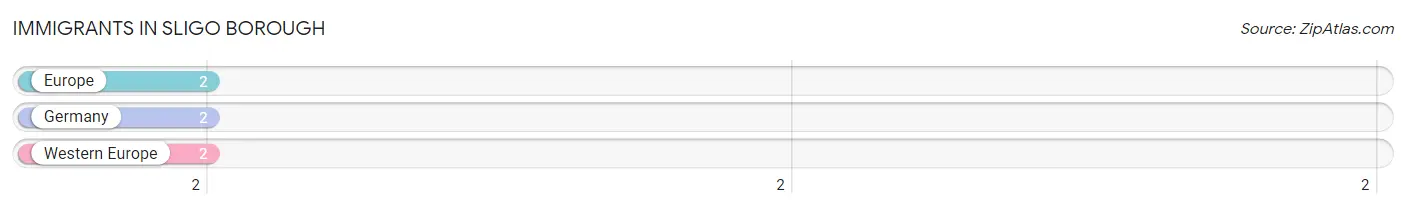
| Immigration Origin | # Population | % Population |
| Europe | 2 | 0.3% |
| Germany | 2 | 0.3% |
| Western Europe | 2 | 0.3% | View All 3 Rows |
Sex and Age in Sligo borough
Sex and Age in Sligo borough
The most populous age groups in Sligo borough are 60 to 64 Years (48 | 13.2%) for men and 25 to 29 Years (73 | 19.2%) for women.
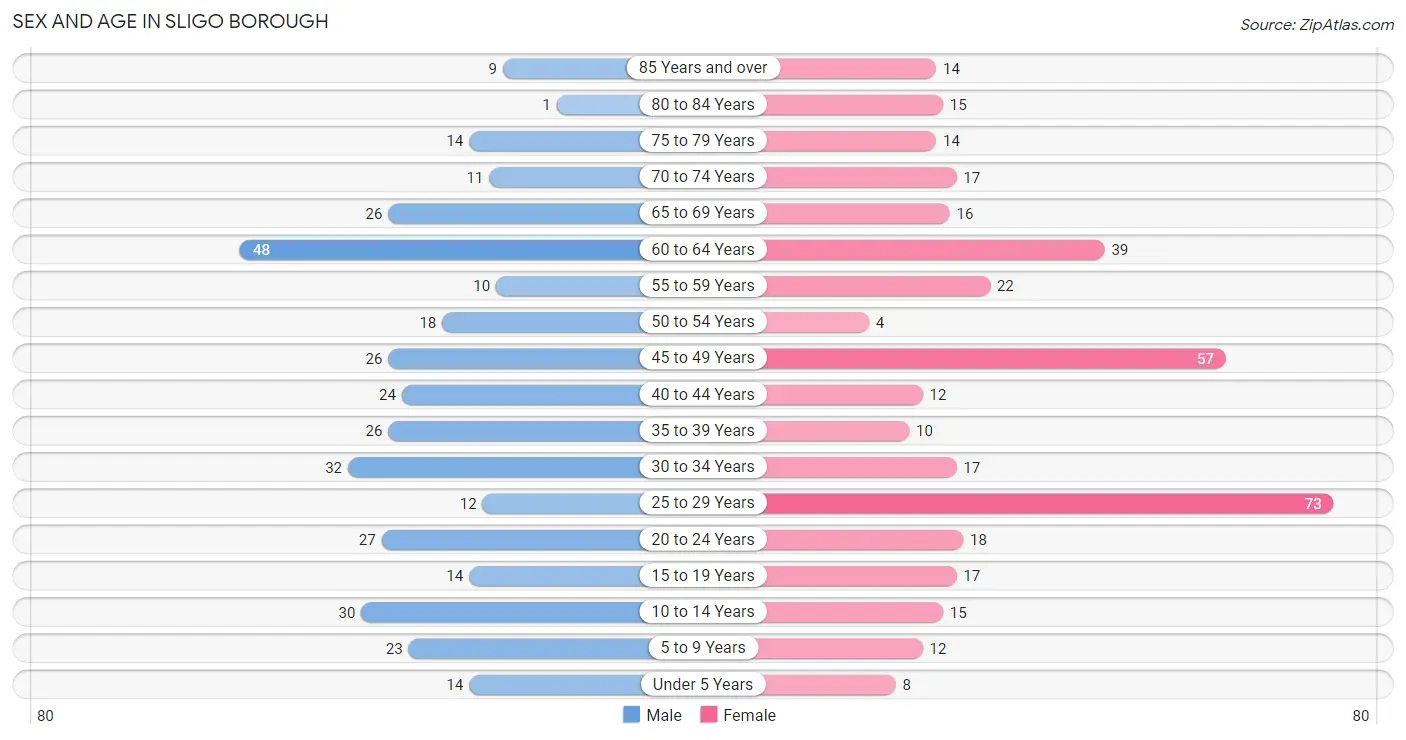
| Age Bracket | Male | Female |
| Under 5 Years | 14 (3.8%) | 8 (2.1%) |
| 5 to 9 Years | 23 (6.3%) | 12 (3.2%) |
| 10 to 14 Years | 30 (8.2%) | 15 (4.0%) |
| 15 to 19 Years | 14 (3.8%) | 17 (4.5%) |
| 20 to 24 Years | 27 (7.4%) | 18 (4.7%) |
| 25 to 29 Years | 12 (3.3%) | 73 (19.2%) |
| 30 to 34 Years | 32 (8.8%) | 17 (4.5%) |
| 35 to 39 Years | 26 (7.1%) | 10 (2.6%) |
| 40 to 44 Years | 24 (6.6%) | 12 (3.2%) |
| 45 to 49 Years | 26 (7.1%) | 57 (15.0%) |
| 50 to 54 Years | 18 (4.9%) | 4 (1.1%) |
| 55 to 59 Years | 10 (2.7%) | 22 (5.8%) |
| 60 to 64 Years | 48 (13.2%) | 39 (10.3%) |
| 65 to 69 Years | 26 (7.1%) | 16 (4.2%) |
| 70 to 74 Years | 11 (3.0%) | 17 (4.5%) |
| 75 to 79 Years | 14 (3.8%) | 14 (3.7%) |
| 80 to 84 Years | 1 (0.3%) | 15 (4.0%) |
| 85 Years and over | 9 (2.5%) | 14 (3.7%) |
| Total | 365 (100.0%) | 380 (100.0%) |
Families and Households in Sligo borough
Median Family Size in Sligo borough
The median family size in Sligo borough is 2.83 persons per family, with single female/mother families (36 | 17.7%) accounting for the largest median family size of 2.94 persons per family. On the other hand, single male/father families (40 | 19.7%) represent the smallest median family size with 2.65 persons per family.
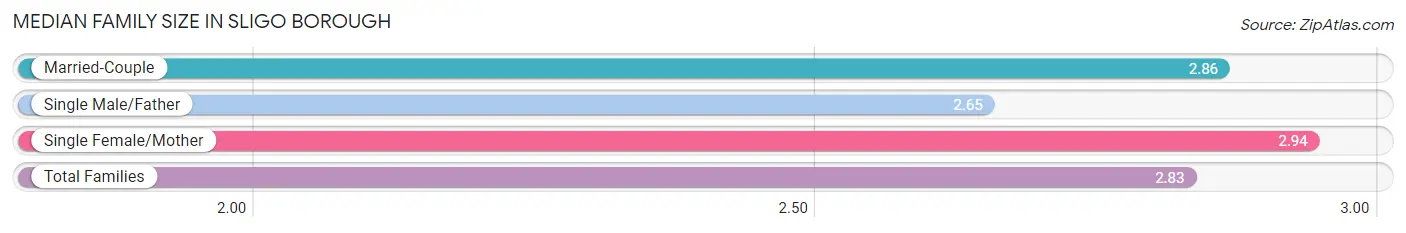
| Family Type | # Families | Family Size |
| Married-Couple | 127 (62.6%) | 2.86 |
| Single Male/Father | 40 (19.7%) | 2.65 |
| Single Female/Mother | 36 (17.7%) | 2.94 |
| Total Families | 203 (100.0%) | 2.83 |
Median Household Size in Sligo borough
The median household size in Sligo borough is 2.42 persons per household, with single male/father households (40 | 13.0%) accounting for the largest median household size of 3.63 persons per household. non-family households (105 | 34.1%) represent the smallest median household size with 1.18 persons per household.
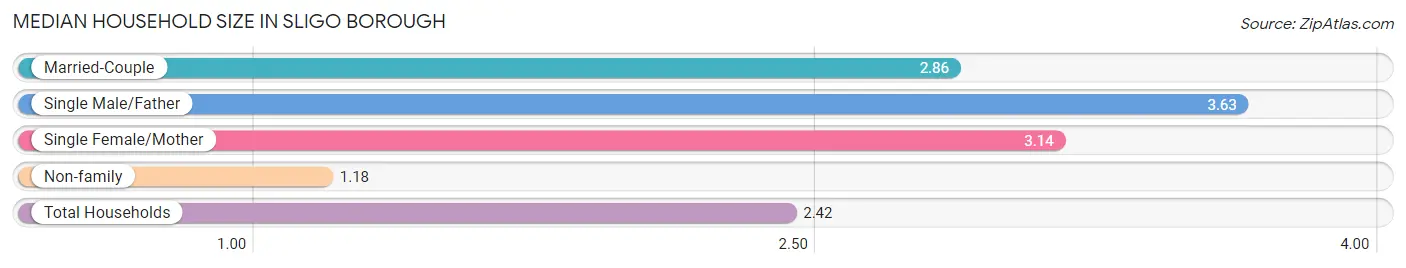
| Household Type | # Households | Household Size |
| Married-Couple | 127 (41.2%) | 2.86 |
| Single Male/Father | 40 (13.0%) | 3.63 |
| Single Female/Mother | 36 (11.7%) | 3.14 |
| Non-family | 105 (34.1%) | 1.18 |
| Total Households | 308 (100.0%) | 2.42 |
Household Size by Marriage Status in Sligo borough
Out of a total of 308 households in Sligo borough, 203 (65.9%) are family households, while 105 (34.1%) are nonfamily households. The most numerous type of family households are 2-person households, comprising 110, and the most common type of nonfamily households are 1-person households, comprising 91.
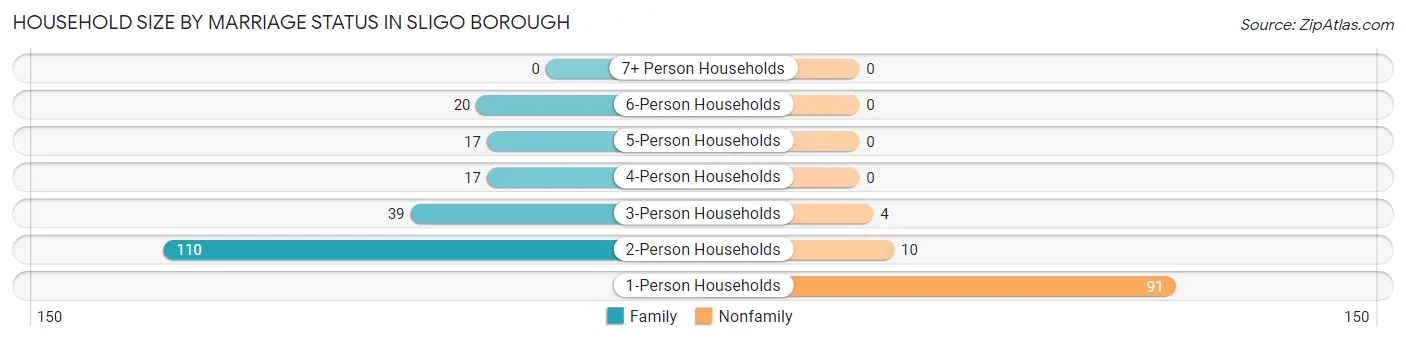
| Household Size | Family Households | Nonfamily Households |
| 1-Person Households | - | 91 (29.5%) |
| 2-Person Households | 110 (35.7%) | 10 (3.3%) |
| 3-Person Households | 39 (12.7%) | 4 (1.3%) |
| 4-Person Households | 17 (5.5%) | 0 (0.0%) |
| 5-Person Households | 17 (5.5%) | 0 (0.0%) |
| 6-Person Households | 20 (6.5%) | 0 (0.0%) |
| 7+ Person Households | 0 (0.0%) | 0 (0.0%) |
| Total | 203 (65.9%) | 105 (34.1%) |
Female Fertility in Sligo borough
Fertility by Age in Sligo borough
| Age Bracket | Women with Births | Births / 1,000 Women |
| 15 to 19 years | 0 (0.0%) | 0.0 |
| 20 to 34 years | 0 (0.0%) | 0.0 |
| 35 to 50 years | 0 (0.0%) | 0.0 |
| Total | 0 (0.0%) | 0.0 |
Fertility by Age by Marriage Status in Sligo borough
| Age Bracket | Married | Unmarried |
| 15 to 19 years | 0 (0.0%) | 0 (0.0%) |
| 20 to 34 years | 0 (0.0%) | 0 (0.0%) |
| 35 to 50 years | 0 (0.0%) | 0 (0.0%) |
| Total | 0 (0.0%) | 0 (0.0%) |
Fertility by Education in Sligo borough
| Educational Attainment | Women with Births | Births / 1,000 Women |
| Less than High School | 0 (0.0%) | 0.0 |
| High School Diploma | 0 (0.0%) | 0.0 |
| College or Associate's Degree | 0 (0.0%) | 0.0 |
| Bachelor's Degree | 0 (0.0%) | 0.0 |
| Graduate Degree | 0 (0.0%) | 0.0 |
| Total | 0 (0.0%) | 0.0 |
Fertility by Education by Marriage Status in Sligo borough
| Educational Attainment | Married | Unmarried |
| Less than High School | 0 (0.0%) | 0 (0.0%) |
| High School Diploma | 0 (0.0%) | 0 (0.0%) |
| College or Associate's Degree | 0 (0.0%) | 0 (0.0%) |
| Bachelor's Degree | 0 (0.0%) | 0 (0.0%) |
| Graduate Degree | 0 (0.0%) | 0 (0.0%) |
| Total | 0 (0.0%) | 0 (0.0%) |
Employment Characteristics in Sligo borough
Employment by Class of Employer in Sligo borough
Among the 305 employed individuals in Sligo borough, private company employees (225 | 73.8%), local government employees (43 | 14.1%), and state government employees (13 | 4.3%) make up the most common classes of employment.
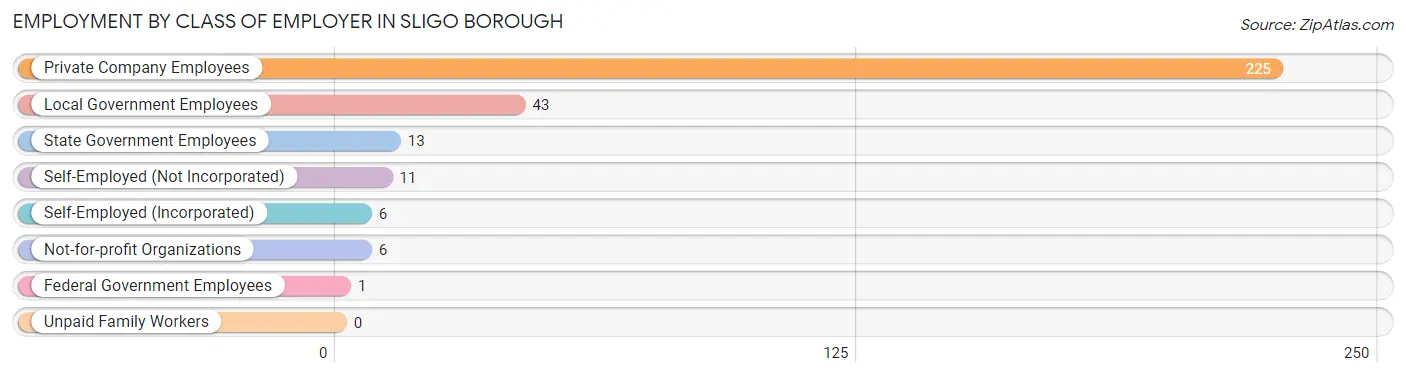
| Employer Class | # Employees | % Employees |
| Private Company Employees | 225 | 73.8% |
| Self-Employed (Incorporated) | 6 | 2.0% |
| Self-Employed (Not Incorporated) | 11 | 3.6% |
| Not-for-profit Organizations | 6 | 2.0% |
| Local Government Employees | 43 | 14.1% |
| State Government Employees | 13 | 4.3% |
| Federal Government Employees | 1 | 0.3% |
| Unpaid Family Workers | 0 | 0.0% |
| Total | 305 | 100.0% |
Employment Status by Age in Sligo borough
According to the labor force statistics for Sligo borough, out of the total population over 16 years of age (632), 52.8% or 334 individuals are in the labor force, with 7.8% or 26 of them unemployed. The age group with the highest labor force participation rate is 30 to 34 years, with 93.9% or 46 individuals in the labor force. Within the labor force, the 16 to 19 years age range has the highest percentage of unemployed individuals, with 50.0% or 4 of them being unemployed.
| Age Bracket | In Labor Force | Unemployed |
| 16 to 19 Years | 8 (40.0%) | 4 (50.0%) |
| 20 to 24 Years | 37 (82.2%) | 4 (10.8%) |
| 25 to 29 Years | 28 (32.9%) | 0 (0.0%) |
| 30 to 34 Years | 46 (93.9%) | 0 (0.0%) |
| 35 to 44 Years | 56 (77.8%) | 7 (12.5%) |
| 45 to 54 Years | 73 (69.5%) | 7 (9.6%) |
| 55 to 59 Years | 26 (81.3%) | 2 (7.7%) |
| 60 to 64 Years | 34 (39.1%) | 2 (5.9%) |
| 65 to 74 Years | 22 (31.4%) | 0 (0.0%) |
| 75 Years and over | 4 (6.0%) | 0 (0.0%) |
| Total | 334 (52.8%) | 26 (7.8%) |
Employment Status by Educational Attainment in Sligo borough
According to labor force statistics for Sligo borough, 61.2% of individuals (263) out of the total population between 25 and 64 years of age (430) are in the labor force, with 6.8% or 18 of them being unemployed. The group with the highest labor force participation rate are those with the educational attainment of college / associate degree, with 73.2% or 52 individuals in the labor force. Within the labor force, individuals with high school diploma education have the highest percentage of unemployment, with 10.8% or 16 of them being unemployed.
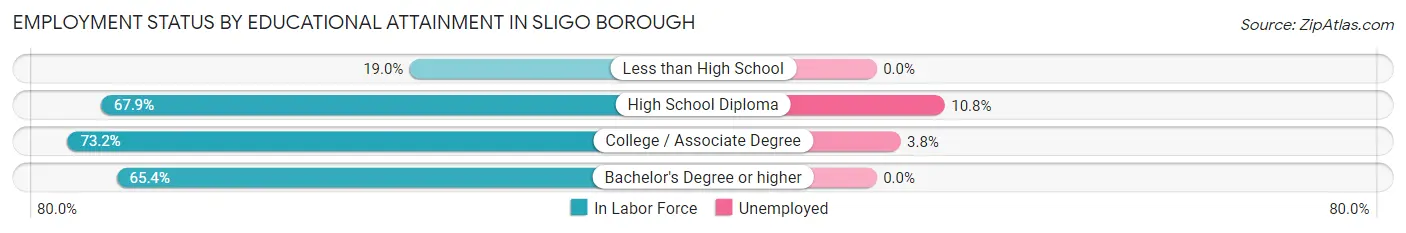
| Educational Attainment | In Labor Force | Unemployed |
| Less than High School | 12 (19.0%) | 0 (0.0%) |
| High School Diploma | 148 (67.9%) | 24 (10.8%) |
| College / Associate Degree | 52 (73.2%) | 3 (3.8%) |
| Bachelor's Degree or higher | 51 (65.4%) | 0 (0.0%) |
| Total | 263 (61.2%) | 29 (6.8%) |
Employment Occupations by Sex in Sligo borough
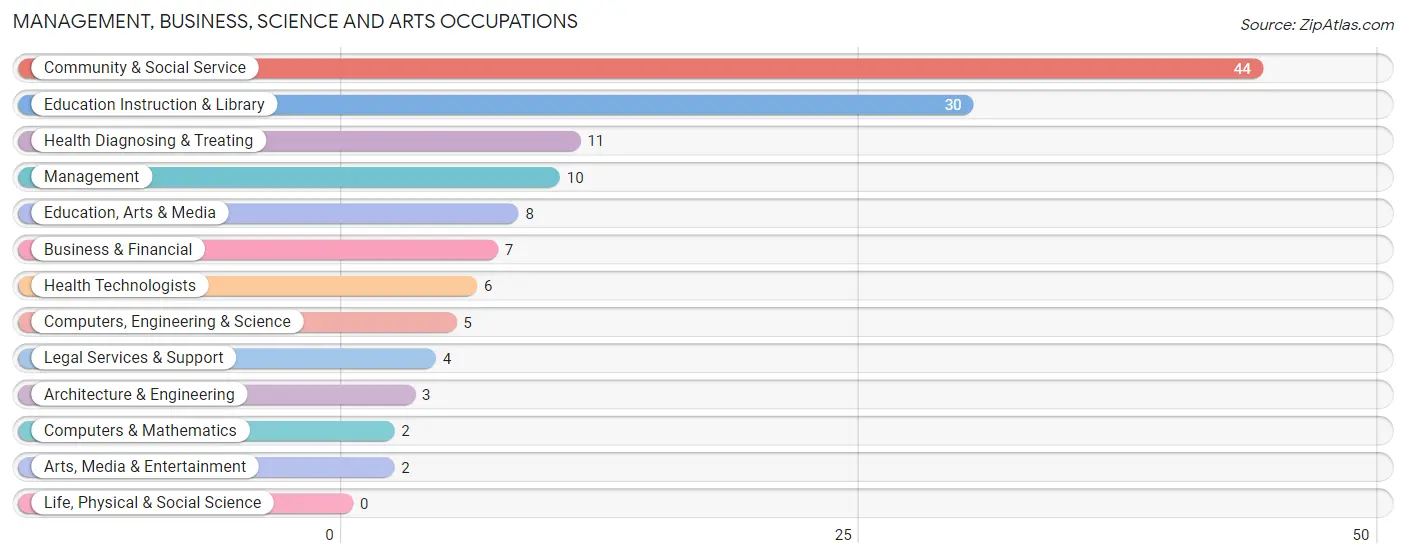
Management, Business, Science and Arts Occupations
The most common Management, Business, Science and Arts occupations in Sligo borough are Community & Social Service (44 | 14.3%), Education Instruction & Library (30 | 9.7%), Health Diagnosing & Treating (11 | 3.6%), Management (10 | 3.3%), and Education, Arts & Media (8 | 2.6%).
Management, Business, Science and Arts Occupations by Sex
Within the Management, Business, Science and Arts occupations in Sligo borough, the most male-oriented occupations are Management (100.0%), Computers, Engineering & Science (100.0%), and Computers & Mathematics (100.0%), while the most female-oriented occupations are Legal Services & Support (100.0%), Health Diagnosing & Treating (100.0%), and Health Technologists (100.0%).
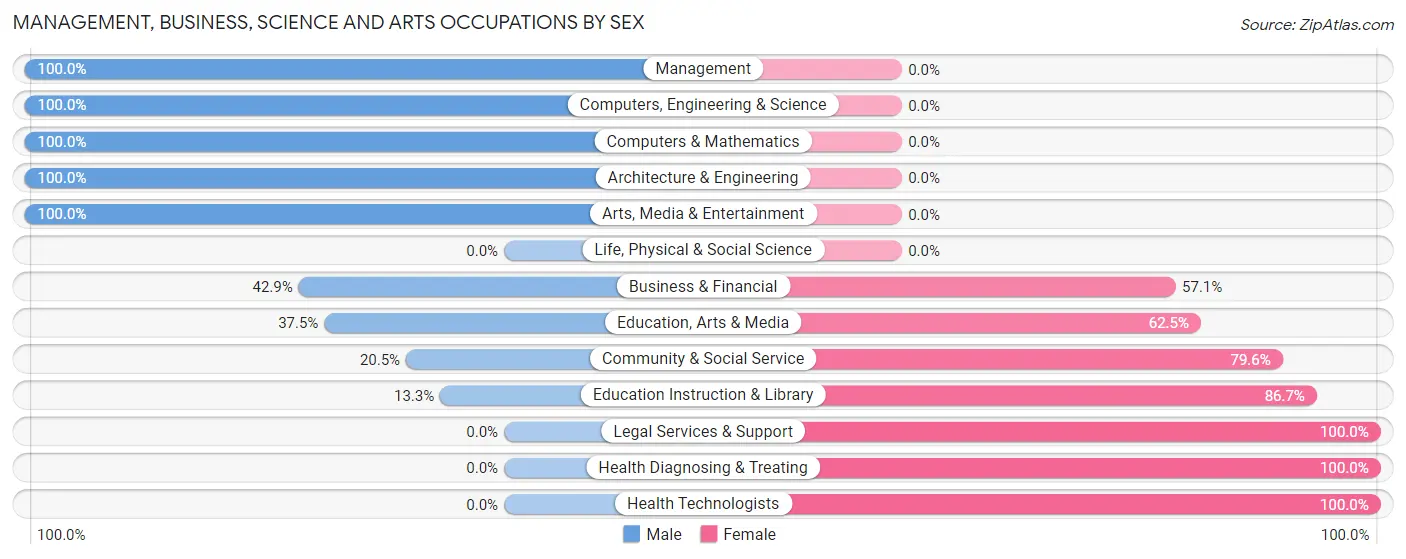
| Occupation | Male | Female |
| Management | 10 (100.0%) | 0 (0.0%) |
| Business & Financial | 3 (42.9%) | 4 (57.1%) |
| Computers, Engineering & Science | 5 (100.0%) | 0 (0.0%) |
| Computers & Mathematics | 2 (100.0%) | 0 (0.0%) |
| Architecture & Engineering | 3 (100.0%) | 0 (0.0%) |
| Life, Physical & Social Science | 0 (0.0%) | 0 (0.0%) |
| Community & Social Service | 9 (20.4%) | 35 (79.5%) |
| Education, Arts & Media | 3 (37.5%) | 5 (62.5%) |
| Legal Services & Support | 0 (0.0%) | 4 (100.0%) |
| Education Instruction & Library | 4 (13.3%) | 26 (86.7%) |
| Arts, Media & Entertainment | 2 (100.0%) | 0 (0.0%) |
| Health Diagnosing & Treating | 0 (0.0%) | 11 (100.0%) |
| Health Technologists | 0 (0.0%) | 6 (100.0%) |
| Total (Category) | 27 (35.1%) | 50 (64.9%) |
| Total (Overall) | 167 (54.2%) | 141 (45.8%) |
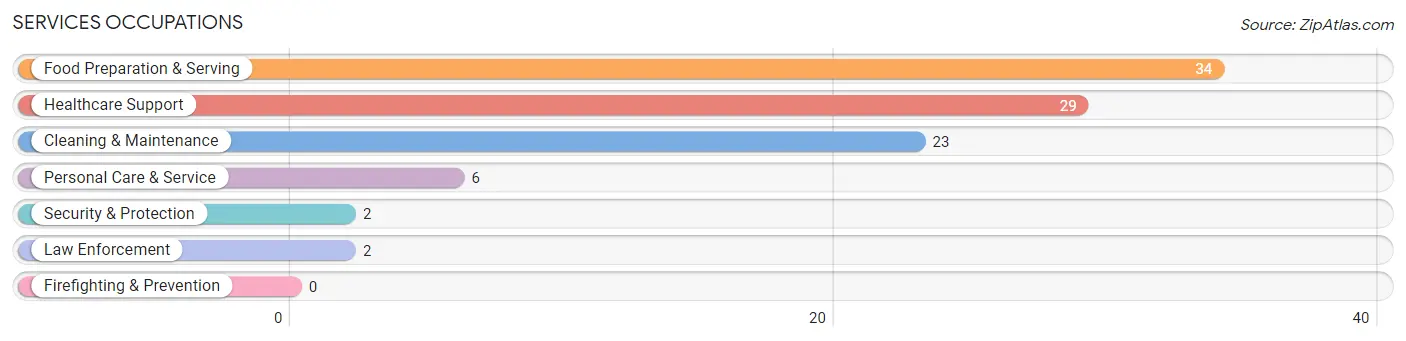
Services Occupations
The most common Services occupations in Sligo borough are Food Preparation & Serving (34 | 11.0%), Healthcare Support (29 | 9.4%), Cleaning & Maintenance (23 | 7.5%), Personal Care & Service (6 | 1.9%), and Security & Protection (2 | 0.6%).
Services Occupations by Sex
Within the Services occupations in Sligo borough, the most male-oriented occupations are Cleaning & Maintenance (56.5%), Food Preparation & Serving (35.3%), and Personal Care & Service (33.3%), while the most female-oriented occupations are Security & Protection (100.0%), Law Enforcement (100.0%), and Healthcare Support (75.9%).
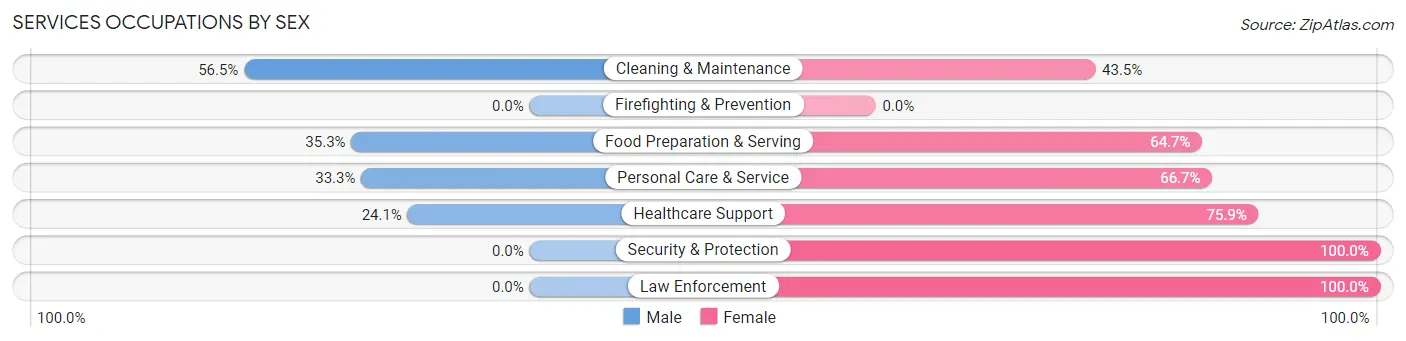
| Occupation | Male | Female |
| Healthcare Support | 7 (24.1%) | 22 (75.9%) |
| Security & Protection | 0 (0.0%) | 2 (100.0%) |
| Firefighting & Prevention | 0 (0.0%) | 0 (0.0%) |
| Law Enforcement | 0 (0.0%) | 2 (100.0%) |
| Food Preparation & Serving | 12 (35.3%) | 22 (64.7%) |
| Cleaning & Maintenance | 13 (56.5%) | 10 (43.5%) |
| Personal Care & Service | 2 (33.3%) | 4 (66.7%) |
| Total (Category) | 34 (36.2%) | 60 (63.8%) |
| Total (Overall) | 167 (54.2%) | 141 (45.8%) |
Sales and Office Occupations
The most common Sales and Office occupations in Sligo borough are Sales & Related (21 | 6.8%), and Office & Administration (21 | 6.8%).
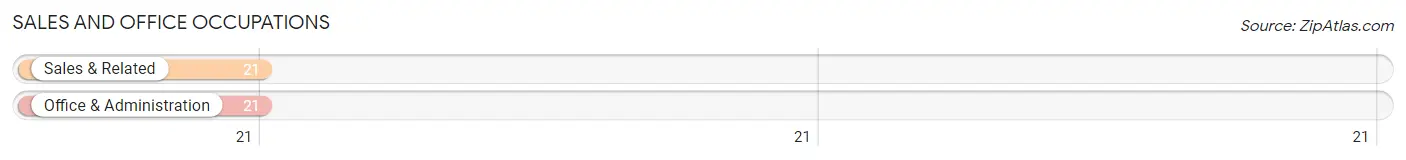
Sales and Office Occupations by Sex
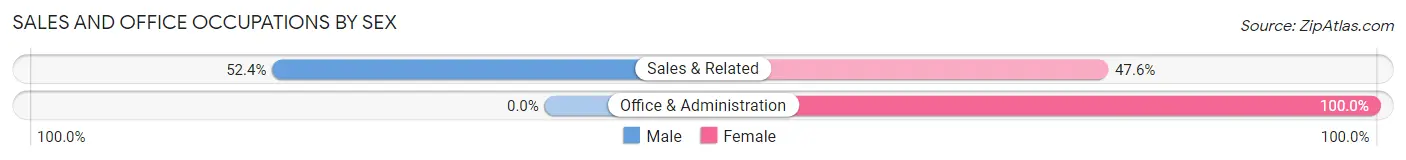
| Occupation | Male | Female |
| Sales & Related | 11 (52.4%) | 10 (47.6%) |
| Office & Administration | 0 (0.0%) | 21 (100.0%) |
| Total (Category) | 11 (26.2%) | 31 (73.8%) |
| Total (Overall) | 167 (54.2%) | 141 (45.8%) |
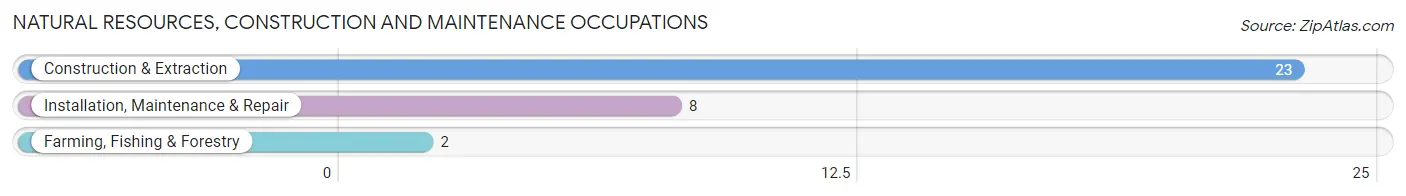
Natural Resources, Construction and Maintenance Occupations
The most common Natural Resources, Construction and Maintenance occupations in Sligo borough are Construction & Extraction (23 | 7.5%), Installation, Maintenance & Repair (8 | 2.6%), and Farming, Fishing & Forestry (2 | 0.6%).
Natural Resources, Construction and Maintenance Occupations by Sex
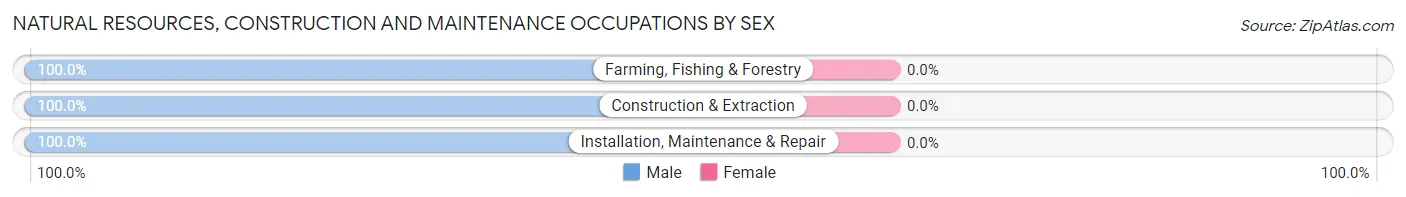
| Occupation | Male | Female |
| Farming, Fishing & Forestry | 2 (100.0%) | 0 (0.0%) |
| Construction & Extraction | 23 (100.0%) | 0 (0.0%) |
| Installation, Maintenance & Repair | 8 (100.0%) | 0 (0.0%) |
| Total (Category) | 33 (100.0%) | 0 (0.0%) |
| Total (Overall) | 167 (54.2%) | 141 (45.8%) |
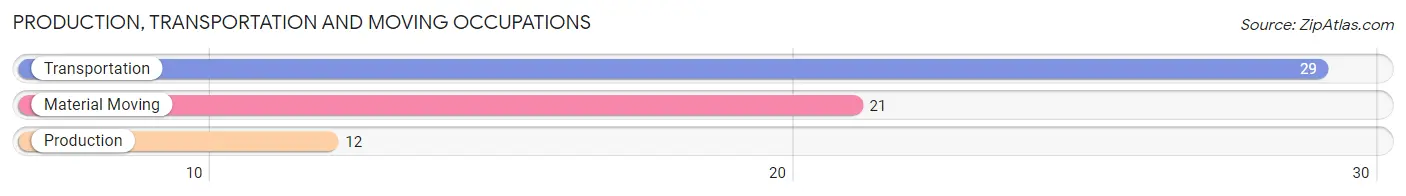
Production, Transportation and Moving Occupations
The most common Production, Transportation and Moving occupations in Sligo borough are Transportation (29 | 9.4%), Material Moving (21 | 6.8%), and Production (12 | 3.9%).
Production, Transportation and Moving Occupations by Sex
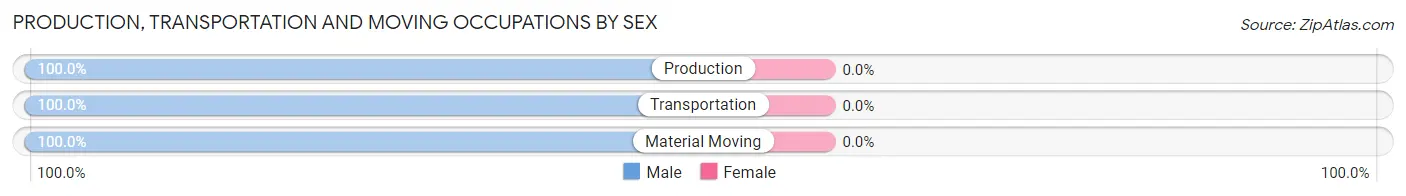
| Occupation | Male | Female |
| Production | 12 (100.0%) | 0 (0.0%) |
| Transportation | 29 (100.0%) | 0 (0.0%) |
| Material Moving | 21 (100.0%) | 0 (0.0%) |
| Total (Category) | 62 (100.0%) | 0 (0.0%) |
| Total (Overall) | 167 (54.2%) | 141 (45.8%) |
Employment Industries by Sex in Sligo borough
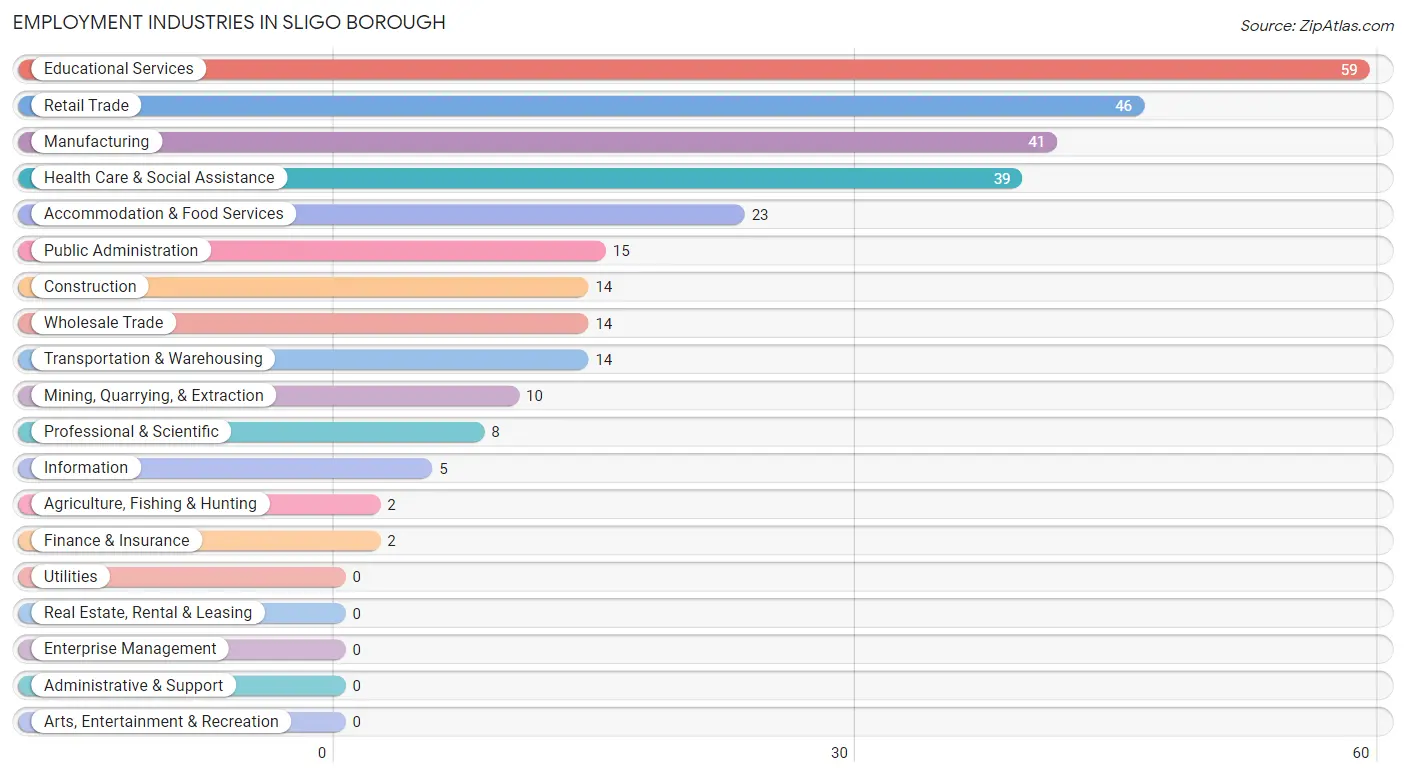
Employment Industries in Sligo borough
The major employment industries in Sligo borough include Educational Services (59 | 19.2%), Retail Trade (46 | 14.9%), Manufacturing (41 | 13.3%), Health Care & Social Assistance (39 | 12.7%), and Accommodation & Food Services (23 | 7.5%).
Employment Industries by Sex in Sligo borough
The Sligo borough industries that see more men than women are Agriculture, Fishing & Hunting (100.0%), Construction (100.0%), and Wholesale Trade (100.0%), whereas the industries that tend to have a higher number of women are Professional & Scientific (100.0%), Public Administration (100.0%), and Health Care & Social Assistance (76.9%).
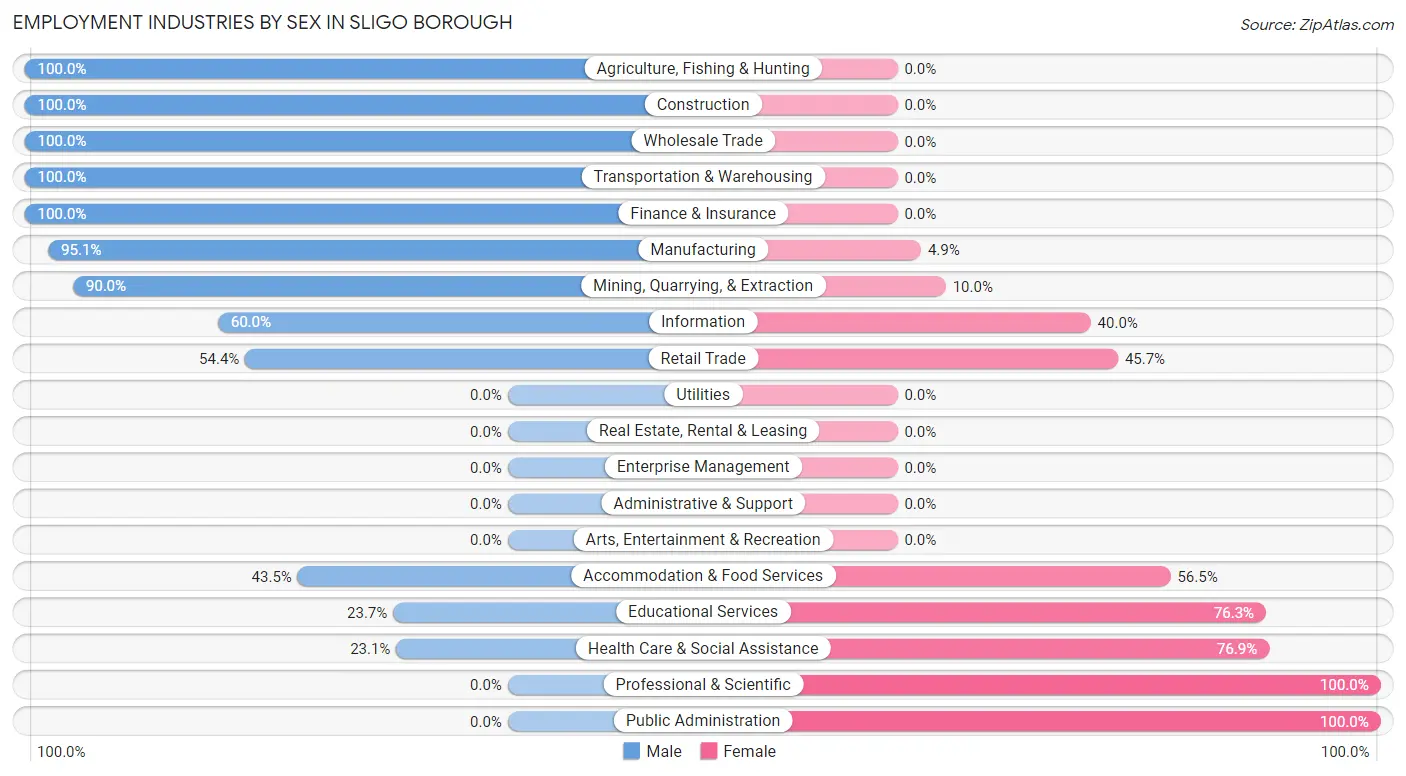
| Industry | Male | Female |
| Agriculture, Fishing & Hunting | 2 (100.0%) | 0 (0.0%) |
| Mining, Quarrying, & Extraction | 9 (90.0%) | 1 (10.0%) |
| Construction | 14 (100.0%) | 0 (0.0%) |
| Manufacturing | 39 (95.1%) | 2 (4.9%) |
| Wholesale Trade | 14 (100.0%) | 0 (0.0%) |
| Retail Trade | 25 (54.3%) | 21 (45.7%) |
| Transportation & Warehousing | 14 (100.0%) | 0 (0.0%) |
| Utilities | 0 (0.0%) | 0 (0.0%) |
| Information | 3 (60.0%) | 2 (40.0%) |
| Finance & Insurance | 2 (100.0%) | 0 (0.0%) |
| Real Estate, Rental & Leasing | 0 (0.0%) | 0 (0.0%) |
| Professional & Scientific | 0 (0.0%) | 8 (100.0%) |
| Enterprise Management | 0 (0.0%) | 0 (0.0%) |
| Administrative & Support | 0 (0.0%) | 0 (0.0%) |
| Educational Services | 14 (23.7%) | 45 (76.3%) |
| Health Care & Social Assistance | 9 (23.1%) | 30 (76.9%) |
| Arts, Entertainment & Recreation | 0 (0.0%) | 0 (0.0%) |
| Accommodation & Food Services | 10 (43.5%) | 13 (56.5%) |
| Public Administration | 0 (0.0%) | 15 (100.0%) |
| Total | 167 (54.2%) | 141 (45.8%) |
Education in Sligo borough
School Enrollment in Sligo borough
The most common levels of schooling among the 115 students in Sligo borough are middle school (38 | 33.0%), elementary school (31 | 27.0%), and high school (31 | 27.0%).
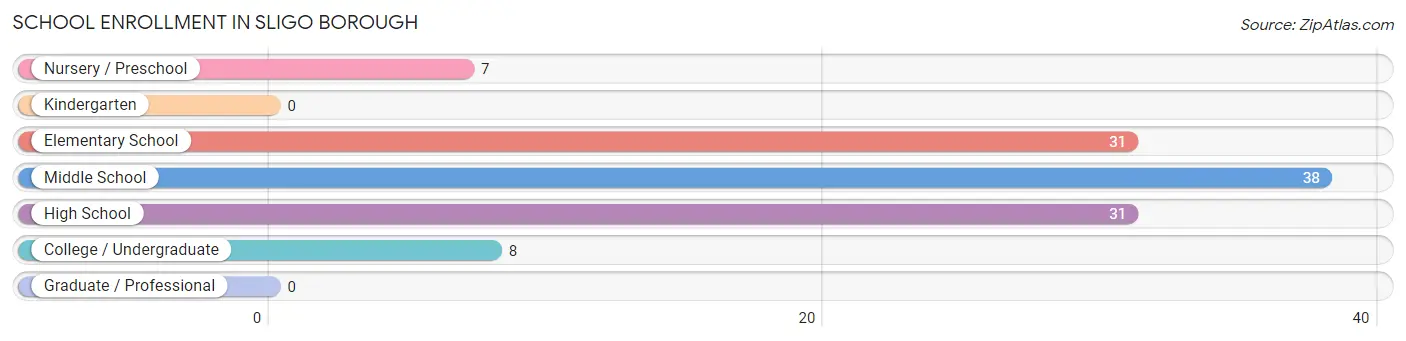
| School Level | # Students | % Students |
| Nursery / Preschool | 7 | 6.1% |
| Kindergarten | 0 | 0.0% |
| Elementary School | 31 | 27.0% |
| Middle School | 38 | 33.0% |
| High School | 31 | 27.0% |
| College / Undergraduate | 8 | 7.0% |
| Graduate / Professional | 0 | 0.0% |
| Total | 115 | 100.0% |
School Enrollment by Age by Funding Source in Sligo borough
Out of a total of 115 students who are enrolled in schools in Sligo borough, 5 (4.3%) attend a private institution, while the remaining 110 (95.7%) are enrolled in public schools. The age group of 10 to 14 year olds has the highest likelihood of being enrolled in private schools, with 5 (11.1% in the age bracket) enrolled. Conversely, the age group of 3 to 4 year olds has the lowest likelihood of being enrolled in a private school, with 3 (100.0% in the age bracket) attending a public institution.
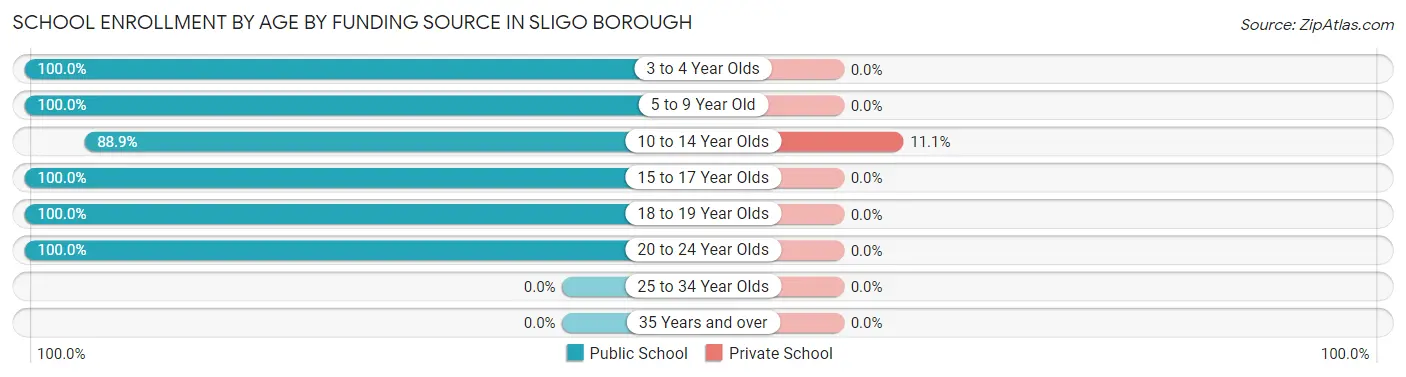
| Age Bracket | Public School | Private School |
| 3 to 4 Year Olds | 3 (100.0%) | 0 (0.0%) |
| 5 to 9 Year Old | 28 (100.0%) | 0 (0.0%) |
| 10 to 14 Year Olds | 40 (88.9%) | 5 (11.1%) |
| 15 to 17 Year Olds | 24 (100.0%) | 0 (0.0%) |
| 18 to 19 Year Olds | 7 (100.0%) | 0 (0.0%) |
| 20 to 24 Year Olds | 8 (100.0%) | 0 (0.0%) |
| 25 to 34 Year Olds | 0 (0.0%) | 0 (0.0%) |
| 35 Years and over | 0 (0.0%) | 0 (0.0%) |
| Total | 110 (95.7%) | 5 (4.3%) |
Educational Attainment by Field of Study in Sligo borough
Education (38 | 32.5%), science & technology (35 | 29.9%), liberal arts & history (12 | 10.3%), business (7 | 6.0%), and communications (7 | 6.0%) are the most common fields of study among 117 individuals in Sligo borough who have obtained a bachelor's degree or higher.
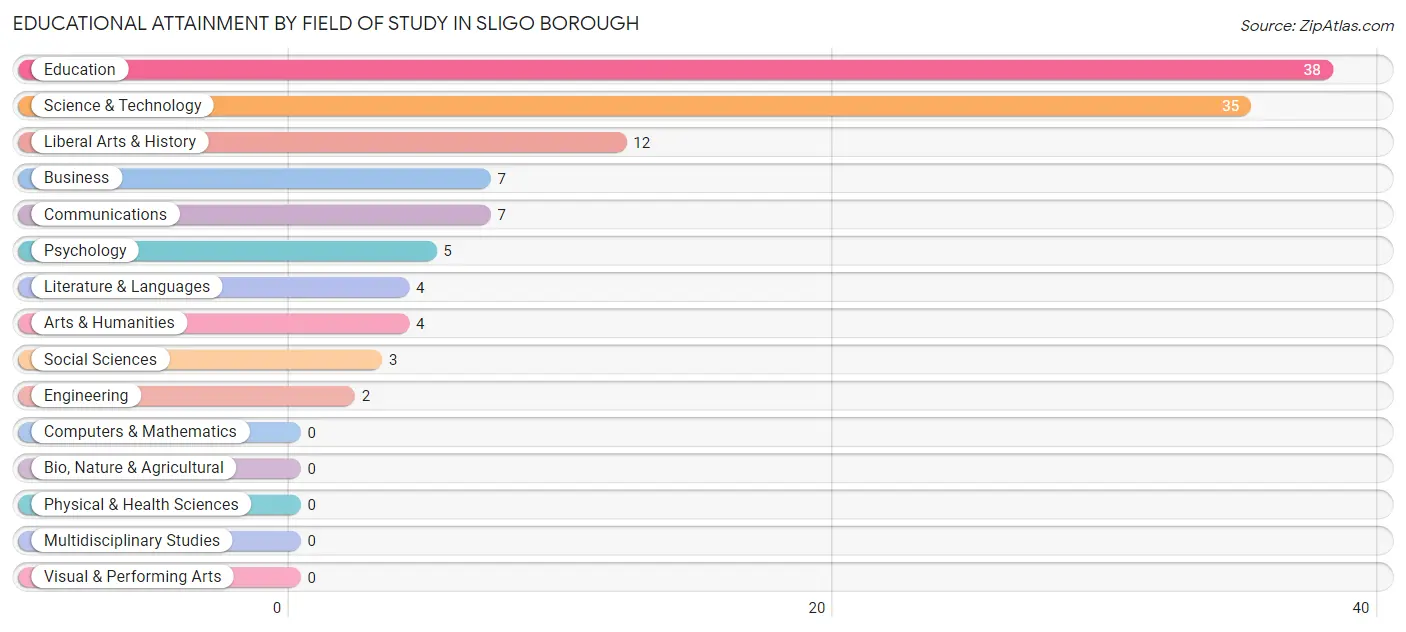
| Field of Study | # Graduates | % Graduates |
| Computers & Mathematics | 0 | 0.0% |
| Bio, Nature & Agricultural | 0 | 0.0% |
| Physical & Health Sciences | 0 | 0.0% |
| Psychology | 5 | 4.3% |
| Social Sciences | 3 | 2.6% |
| Engineering | 2 | 1.7% |
| Multidisciplinary Studies | 0 | 0.0% |
| Science & Technology | 35 | 29.9% |
| Business | 7 | 6.0% |
| Education | 38 | 32.5% |
| Literature & Languages | 4 | 3.4% |
| Liberal Arts & History | 12 | 10.3% |
| Visual & Performing Arts | 0 | 0.0% |
| Communications | 7 | 6.0% |
| Arts & Humanities | 4 | 3.4% |
| Total | 117 | 100.0% |
Transportation & Commute in Sligo borough
Vehicle Availability by Sex in Sligo borough
The most prevalent vehicle ownership categories in Sligo borough are males with 2 vehicles (58, accounting for 35.4%) and females with 2 vehicles (39, making up 41.1%).
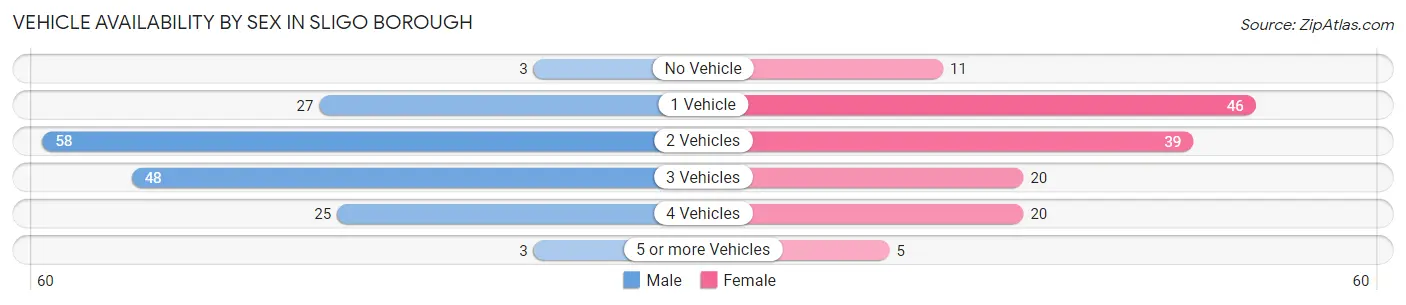
| Vehicles Available | Male | Female |
| No Vehicle | 3 (1.8%) | 11 (7.8%) |
| 1 Vehicle | 27 (16.5%) | 46 (32.6%) |
| 2 Vehicles | 58 (35.4%) | 39 (27.7%) |
| 3 Vehicles | 48 (29.3%) | 20 (14.2%) |
| 4 Vehicles | 25 (15.2%) | 20 (14.2%) |
| 5 or more Vehicles | 3 (1.8%) | 5 (3.5%) |
| Total | 164 (100.0%) | 141 (100.0%) |
Commute Time in Sligo borough
The most frequently occuring commute durations in Sligo borough are 20 to 24 minutes (80 commuters, 27.1%), 15 to 19 minutes (31 commuters, 10.5%), and 10 to 14 minutes (30 commuters, 10.2%).
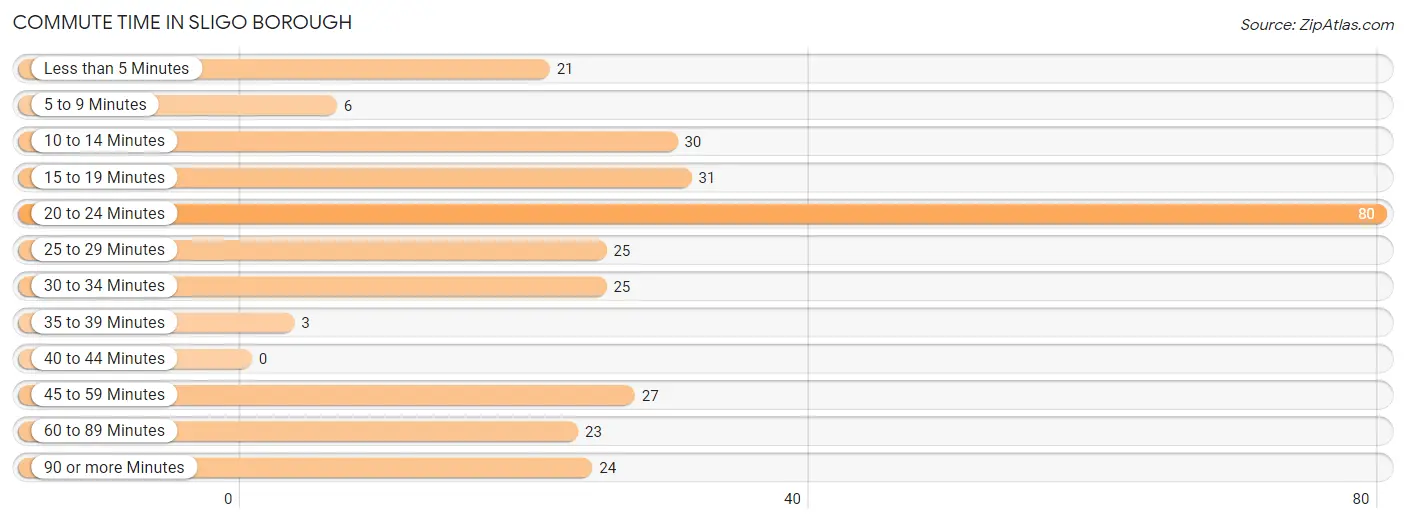
| Commute Time | # Commuters | % Commuters |
| Less than 5 Minutes | 21 | 7.1% |
| 5 to 9 Minutes | 6 | 2.0% |
| 10 to 14 Minutes | 30 | 10.2% |
| 15 to 19 Minutes | 31 | 10.5% |
| 20 to 24 Minutes | 80 | 27.1% |
| 25 to 29 Minutes | 25 | 8.5% |
| 30 to 34 Minutes | 25 | 8.5% |
| 35 to 39 Minutes | 3 | 1.0% |
| 40 to 44 Minutes | 0 | 0.0% |
| 45 to 59 Minutes | 27 | 9.1% |
| 60 to 89 Minutes | 23 | 7.8% |
| 90 or more Minutes | 24 | 8.1% |
Commute Time by Sex in Sligo borough
The most common commute times in Sligo borough are 20 to 24 minutes (46 commuters, 28.4%) for males and 20 to 24 minutes (34 commuters, 25.6%) for females.
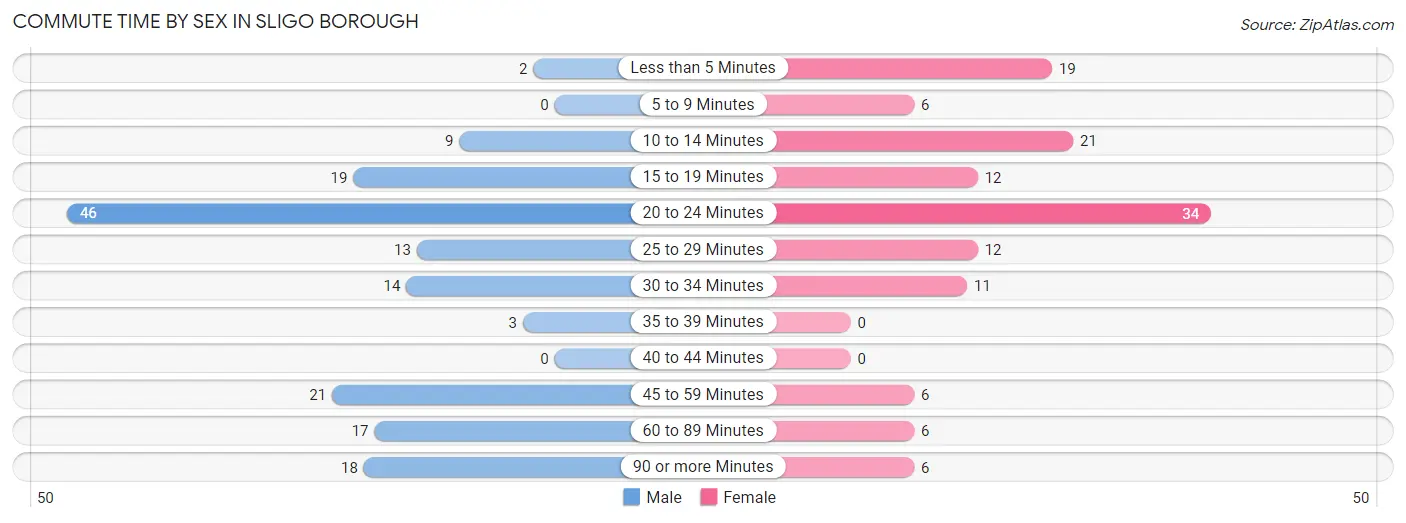
| Commute Time | Male | Female |
| Less than 5 Minutes | 2 (1.2%) | 19 (14.3%) |
| 5 to 9 Minutes | 0 (0.0%) | 6 (4.5%) |
| 10 to 14 Minutes | 9 (5.6%) | 21 (15.8%) |
| 15 to 19 Minutes | 19 (11.7%) | 12 (9.0%) |
| 20 to 24 Minutes | 46 (28.4%) | 34 (25.6%) |
| 25 to 29 Minutes | 13 (8.0%) | 12 (9.0%) |
| 30 to 34 Minutes | 14 (8.6%) | 11 (8.3%) |
| 35 to 39 Minutes | 3 (1.8%) | 0 (0.0%) |
| 40 to 44 Minutes | 0 (0.0%) | 0 (0.0%) |
| 45 to 59 Minutes | 21 (13.0%) | 6 (4.5%) |
| 60 to 89 Minutes | 17 (10.5%) | 6 (4.5%) |
| 90 or more Minutes | 18 (11.1%) | 6 (4.5%) |
Time of Departure to Work by Sex in Sligo borough
The most frequent times of departure to work in Sligo borough are 12:00 AM to 4:59 AM (37, 22.8%) for males and 7:00 AM to 7:29 AM (30, 22.6%) for females.
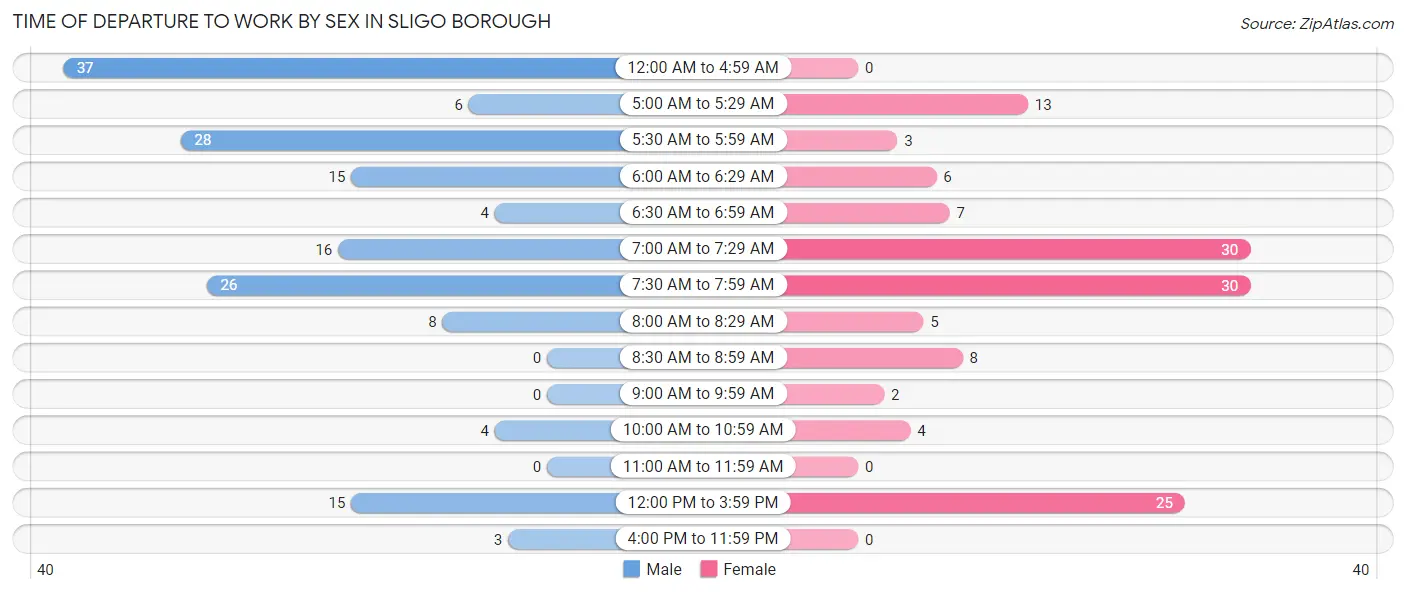
| Time of Departure | Male | Female |
| 12:00 AM to 4:59 AM | 37 (22.8%) | 0 (0.0%) |
| 5:00 AM to 5:29 AM | 6 (3.7%) | 13 (9.8%) |
| 5:30 AM to 5:59 AM | 28 (17.3%) | 3 (2.3%) |
| 6:00 AM to 6:29 AM | 15 (9.3%) | 6 (4.5%) |
| 6:30 AM to 6:59 AM | 4 (2.5%) | 7 (5.3%) |
| 7:00 AM to 7:29 AM | 16 (9.9%) | 30 (22.6%) |
| 7:30 AM to 7:59 AM | 26 (16.1%) | 30 (22.6%) |
| 8:00 AM to 8:29 AM | 8 (4.9%) | 5 (3.8%) |
| 8:30 AM to 8:59 AM | 0 (0.0%) | 8 (6.0%) |
| 9:00 AM to 9:59 AM | 0 (0.0%) | 2 (1.5%) |
| 10:00 AM to 10:59 AM | 4 (2.5%) | 4 (3.0%) |
| 11:00 AM to 11:59 AM | 0 (0.0%) | 0 (0.0%) |
| 12:00 PM to 3:59 PM | 15 (9.3%) | 25 (18.8%) |
| 4:00 PM to 11:59 PM | 3 (1.8%) | 0 (0.0%) |
| Total | 162 (100.0%) | 133 (100.0%) |
Housing Occupancy in Sligo borough
Occupancy by Ownership in Sligo borough
Of the total 308 dwellings in Sligo borough, owner-occupied units account for 199 (64.6%), while renter-occupied units make up 109 (35.4%).
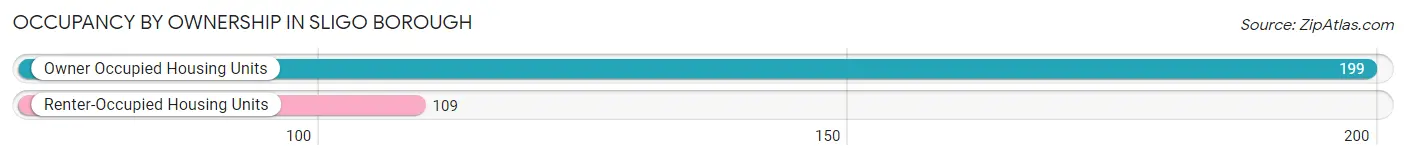
| Occupancy | # Housing Units | % Housing Units |
| Owner Occupied Housing Units | 199 | 64.6% |
| Renter-Occupied Housing Units | 109 | 35.4% |
| Total Occupied Housing Units | 308 | 100.0% |
Occupancy by Household Size in Sligo borough
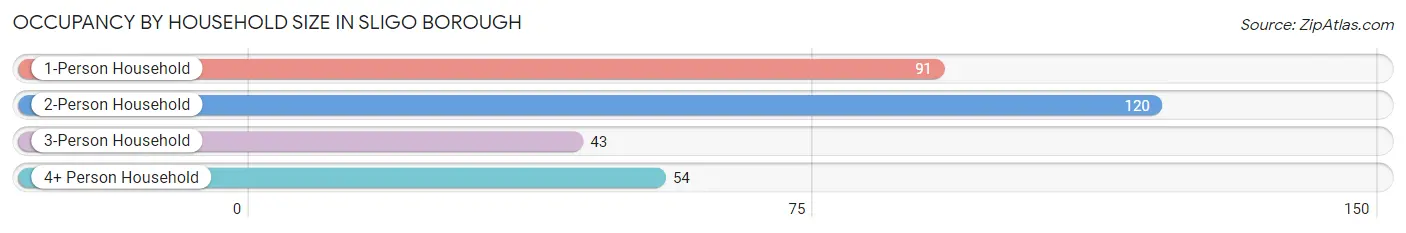
| Household Size | # Housing Units | % Housing Units |
| 1-Person Household | 91 | 29.5% |
| 2-Person Household | 120 | 39.0% |
| 3-Person Household | 43 | 14.0% |
| 4+ Person Household | 54 | 17.5% |
| Total Housing Units | 308 | 100.0% |
Occupancy by Ownership by Household Size in Sligo borough
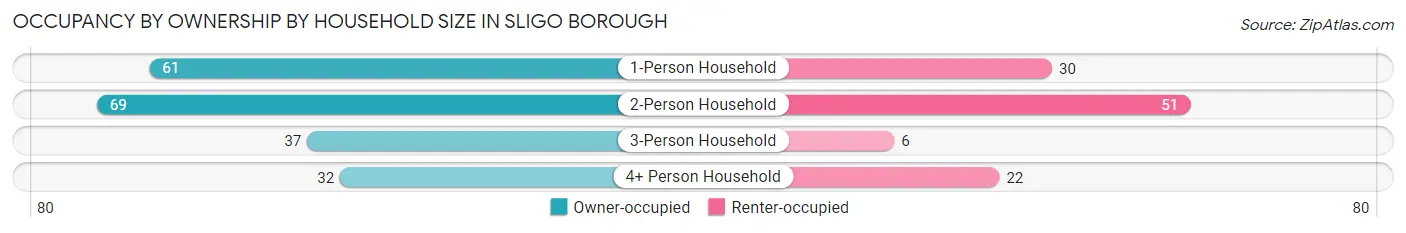
| Household Size | Owner-occupied | Renter-occupied |
| 1-Person Household | 61 (67.0%) | 30 (33.0%) |
| 2-Person Household | 69 (57.5%) | 51 (42.5%) |
| 3-Person Household | 37 (86.1%) | 6 (14.0%) |
| 4+ Person Household | 32 (59.3%) | 22 (40.7%) |
| Total Housing Units | 199 (64.6%) | 109 (35.4%) |
Occupancy by Educational Attainment in Sligo borough
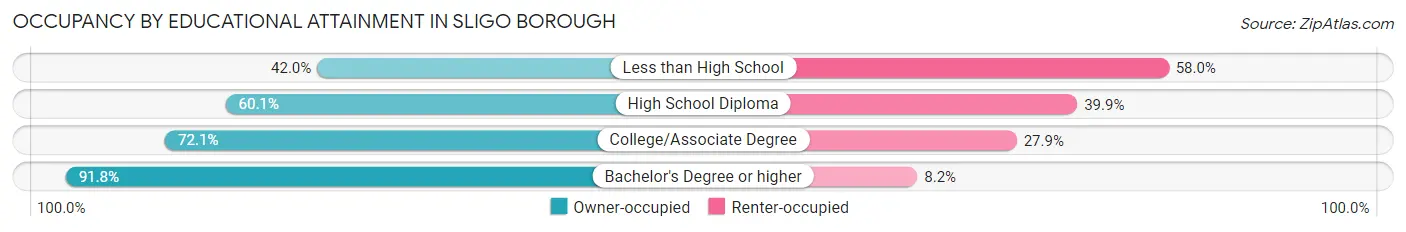
| Household Size | Owner-occupied | Renter-occupied |
| Less than High School | 21 (42.0%) | 29 (58.0%) |
| High School Diploma | 89 (60.1%) | 59 (39.9%) |
| College/Associate Degree | 44 (72.1%) | 17 (27.9%) |
| Bachelor's Degree or higher | 45 (91.8%) | 4 (8.2%) |
Occupancy by Age of Householder in Sligo borough
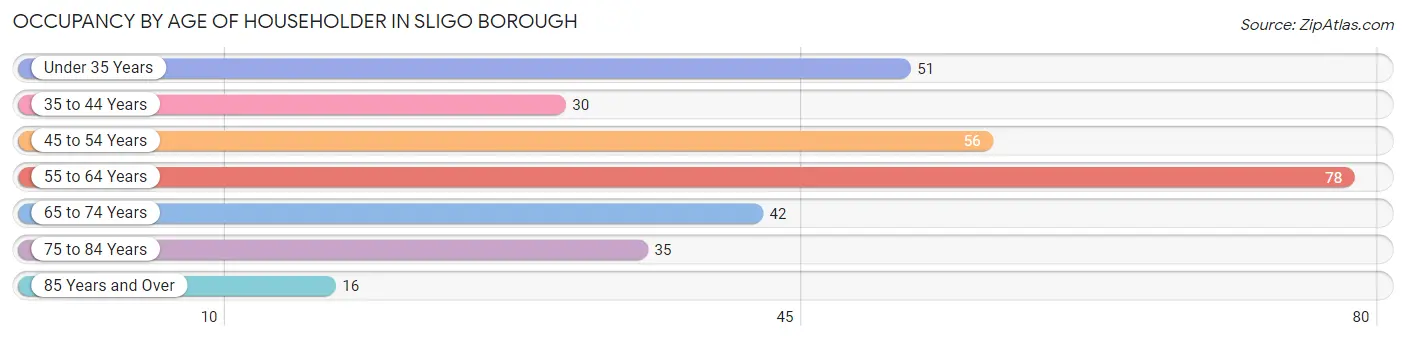
| Age Bracket | # Households | % Households |
| Under 35 Years | 51 | 16.6% |
| 35 to 44 Years | 30 | 9.7% |
| 45 to 54 Years | 56 | 18.2% |
| 55 to 64 Years | 78 | 25.3% |
| 65 to 74 Years | 42 | 13.6% |
| 75 to 84 Years | 35 | 11.4% |
| 85 Years and Over | 16 | 5.2% |
| Total | 308 | 100.0% |
Housing Finances in Sligo borough
Median Income by Occupancy in Sligo borough
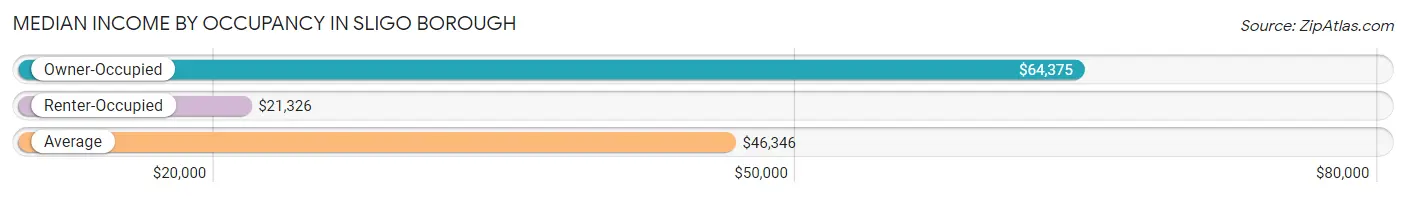
| Occupancy Type | # Households | Median Income |
| Owner-Occupied | 199 (64.6%) | $64,375 |
| Renter-Occupied | 109 (35.4%) | $21,326 |
| Average | 308 (100.0%) | $46,346 |
Occupancy by Householder Income Bracket in Sligo borough
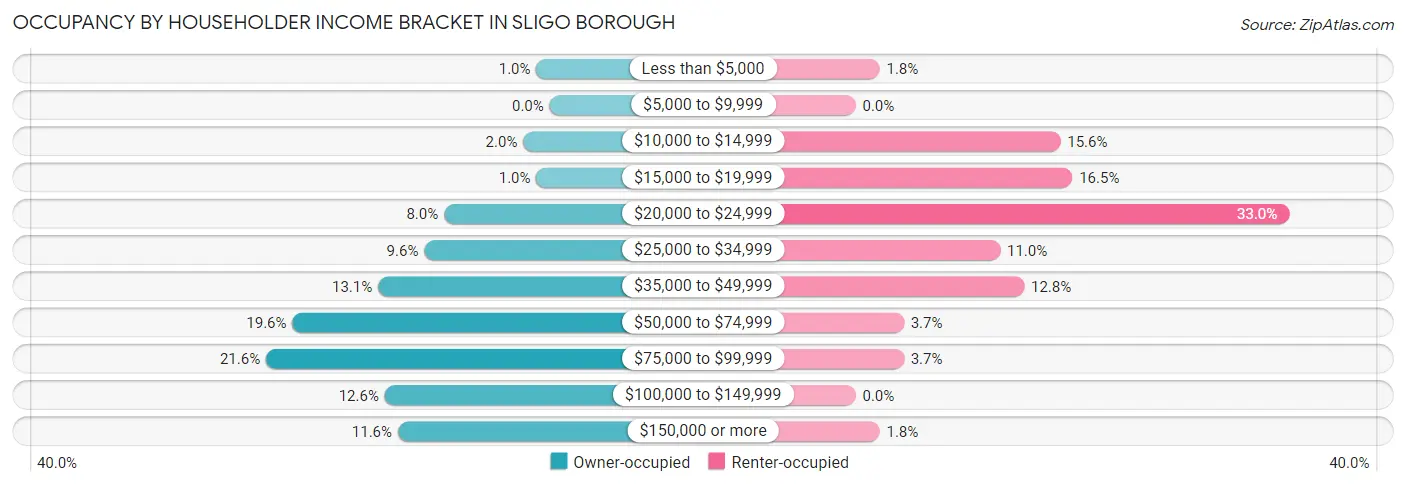
| Income Bracket | Owner-occupied | Renter-occupied |
| Less than $5,000 | 2 (1.0%) | 2 (1.8%) |
| $5,000 to $9,999 | 0 (0.0%) | 0 (0.0%) |
| $10,000 to $14,999 | 4 (2.0%) | 17 (15.6%) |
| $15,000 to $19,999 | 2 (1.0%) | 18 (16.5%) |
| $20,000 to $24,999 | 16 (8.0%) | 36 (33.0%) |
| $25,000 to $34,999 | 19 (9.6%) | 12 (11.0%) |
| $35,000 to $49,999 | 26 (13.1%) | 14 (12.8%) |
| $50,000 to $74,999 | 39 (19.6%) | 4 (3.7%) |
| $75,000 to $99,999 | 43 (21.6%) | 4 (3.7%) |
| $100,000 to $149,999 | 25 (12.6%) | 0 (0.0%) |
| $150,000 or more | 23 (11.6%) | 2 (1.8%) |
| Total | 199 (100.0%) | 109 (100.0%) |
Monthly Housing Cost Tiers in Sligo borough
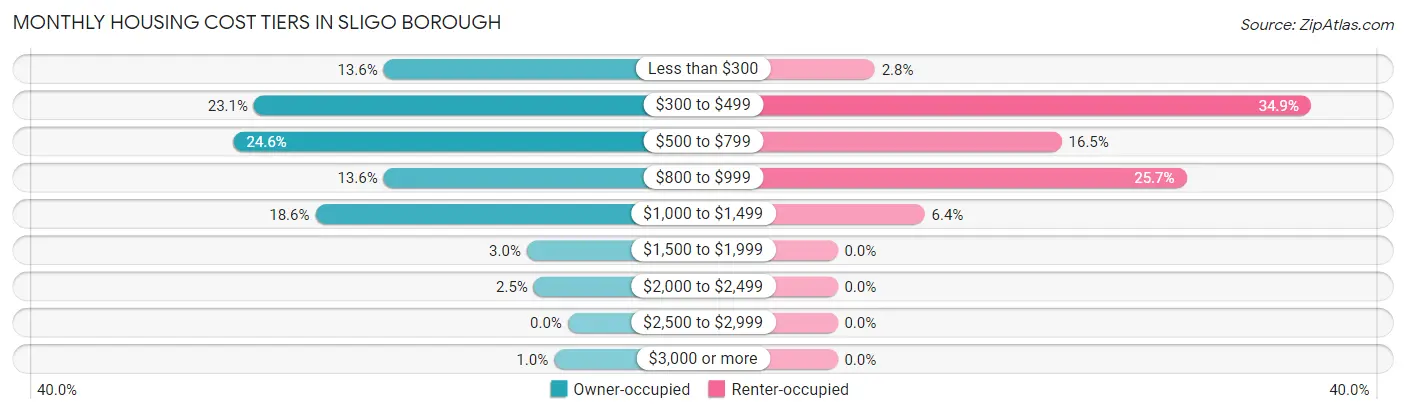
| Monthly Cost | Owner-occupied | Renter-occupied |
| Less than $300 | 27 (13.6%) | 3 (2.8%) |
| $300 to $499 | 46 (23.1%) | 38 (34.9%) |
| $500 to $799 | 49 (24.6%) | 18 (16.5%) |
| $800 to $999 | 27 (13.6%) | 28 (25.7%) |
| $1,000 to $1,499 | 37 (18.6%) | 7 (6.4%) |
| $1,500 to $1,999 | 6 (3.0%) | 0 (0.0%) |
| $2,000 to $2,499 | 5 (2.5%) | 0 (0.0%) |
| $2,500 to $2,999 | 0 (0.0%) | 0 (0.0%) |
| $3,000 or more | 2 (1.0%) | 0 (0.0%) |
| Total | 199 (100.0%) | 109 (100.0%) |
Physical Housing Characteristics in Sligo borough
Housing Structures in Sligo borough
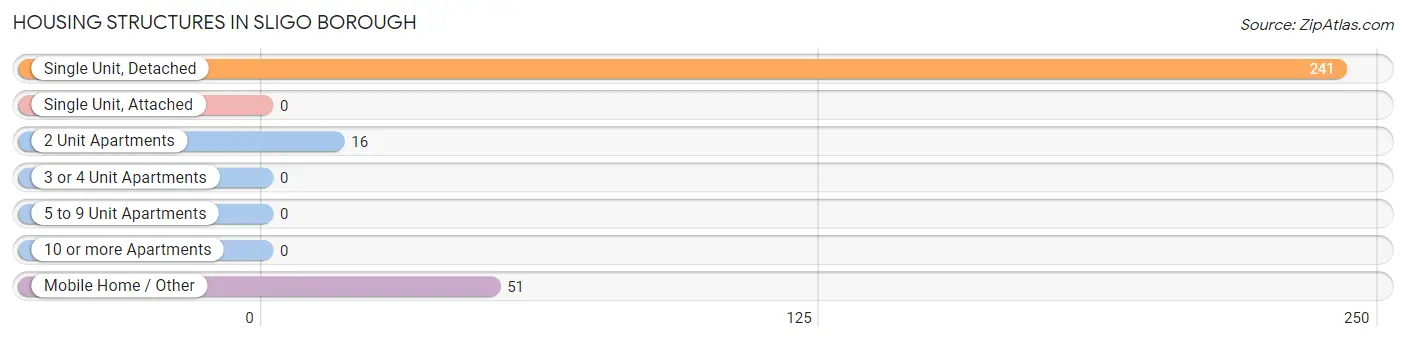
| Structure Type | # Housing Units | % Housing Units |
| Single Unit, Detached | 241 | 78.2% |
| Single Unit, Attached | 0 | 0.0% |
| 2 Unit Apartments | 16 | 5.2% |
| 3 or 4 Unit Apartments | 0 | 0.0% |
| 5 to 9 Unit Apartments | 0 | 0.0% |
| 10 or more Apartments | 0 | 0.0% |
| Mobile Home / Other | 51 | 16.6% |
| Total | 308 | 100.0% |
Housing Structures by Occupancy in Sligo borough
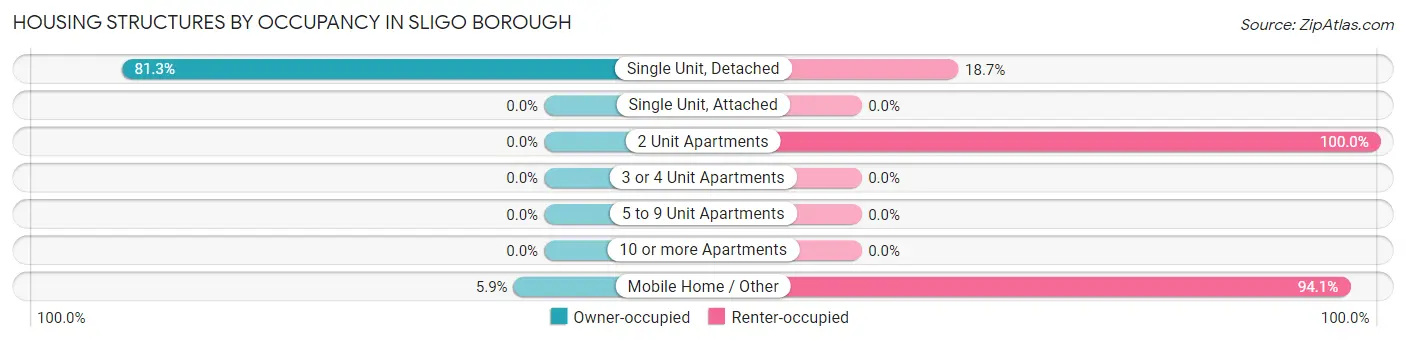
| Structure Type | Owner-occupied | Renter-occupied |
| Single Unit, Detached | 196 (81.3%) | 45 (18.7%) |
| Single Unit, Attached | 0 (0.0%) | 0 (0.0%) |
| 2 Unit Apartments | 0 (0.0%) | 16 (100.0%) |
| 3 or 4 Unit Apartments | 0 (0.0%) | 0 (0.0%) |
| 5 to 9 Unit Apartments | 0 (0.0%) | 0 (0.0%) |
| 10 or more Apartments | 0 (0.0%) | 0 (0.0%) |
| Mobile Home / Other | 3 (5.9%) | 48 (94.1%) |
| Total | 199 (64.6%) | 109 (35.4%) |
Housing Structures by Number of Rooms in Sligo borough
| Number of Rooms | Owner-occupied | Renter-occupied |
| 1 Room | 1 (0.5%) | 0 (0.0%) |
| 2 or 3 Rooms | 5 (2.5%) | 0 (0.0%) |
| 4 or 5 Rooms | 42 (21.1%) | 57 (52.3%) |
| 6 or 7 Rooms | 77 (38.7%) | 45 (41.3%) |
| 8 or more Rooms | 74 (37.2%) | 7 (6.4%) |
| Total | 199 (100.0%) | 109 (100.0%) |
Housing Structure by Heating Type in Sligo borough
| Heating Type | Owner-occupied | Renter-occupied |
| Utility Gas | 199 (100.0%) | 106 (97.3%) |
| Bottled, Tank, or LP Gas | 0 (0.0%) | 0 (0.0%) |
| Electricity | 0 (0.0%) | 3 (2.8%) |
| Fuel Oil or Kerosene | 0 (0.0%) | 0 (0.0%) |
| Coal or Coke | 0 (0.0%) | 0 (0.0%) |
| All other Fuels | 0 (0.0%) | 0 (0.0%) |
| No Fuel Used | 0 (0.0%) | 0 (0.0%) |
| Total | 199 (100.0%) | 109 (100.0%) |
Household Vehicle Usage in Sligo borough
| Vehicles per Household | Owner-occupied | Renter-occupied |
| No Vehicle | 7 (3.5%) | 25 (22.9%) |
| 1 Vehicle | 57 (28.6%) | 68 (62.4%) |
| 2 Vehicles | 75 (37.7%) | 10 (9.2%) |
| 3 or more Vehicles | 60 (30.1%) | 6 (5.5%) |
| Total | 199 (100.0%) | 109 (100.0%) |
Real Estate & Mortgages in Sligo borough
Real Estate and Mortgage Overview in Sligo borough
| Characteristic | Without Mortgage | With Mortgage |
| Housing Units | 118 | 81 |
| Median Property Value | $96,200 | $118,300 |
| Median Household Income | $50,893 | $12 |
| Monthly Housing Costs | $443 | $2 |
| Real Estate Taxes | $1,375 | $2 |
Property Value by Mortgage Status in Sligo borough
| Property Value | Without Mortgage | With Mortgage |
| Less than $50,000 | 13 (11.0%) | 6 (7.4%) |
| $50,000 to $99,999 | 51 (43.2%) | 25 (30.9%) |
| $100,000 to $299,999 | 48 (40.7%) | 46 (56.8%) |
| $300,000 to $499,999 | 0 (0.0%) | 2 (2.5%) |
| $500,000 to $749,999 | 6 (5.1%) | 2 (2.5%) |
| $750,000 to $999,999 | 0 (0.0%) | 0 (0.0%) |
| $1,000,000 or more | 0 (0.0%) | 0 (0.0%) |
| Total | 118 (100.0%) | 81 (100.0%) |
Household Income by Mortgage Status in Sligo borough
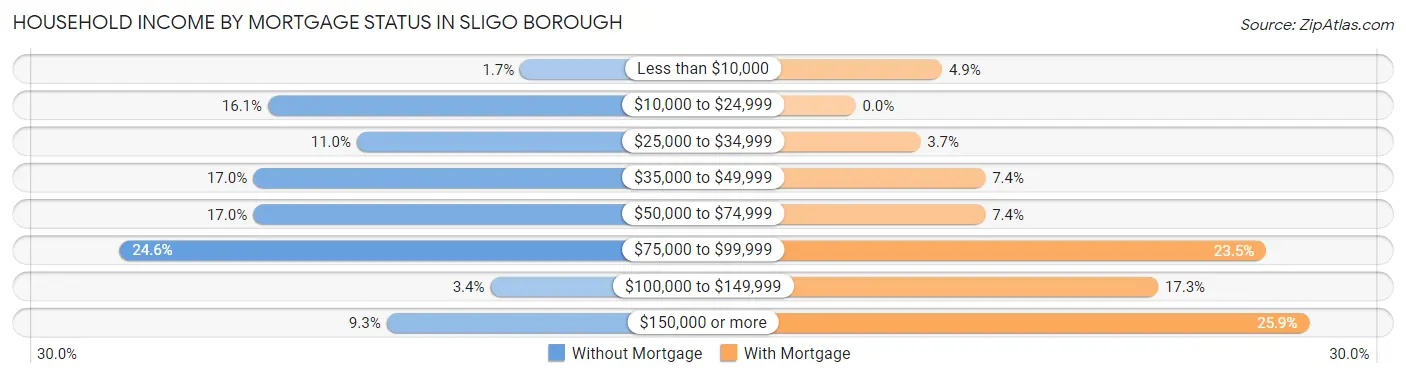
| Household Income | Without Mortgage | With Mortgage |
| Less than $10,000 | 2 (1.7%) | 4 (4.9%) |
| $10,000 to $24,999 | 19 (16.1%) | 0 (0.0%) |
| $25,000 to $34,999 | 13 (11.0%) | 3 (3.7%) |
| $35,000 to $49,999 | 20 (17.0%) | 6 (7.4%) |
| $50,000 to $74,999 | 20 (17.0%) | 6 (7.4%) |
| $75,000 to $99,999 | 29 (24.6%) | 19 (23.5%) |
| $100,000 to $149,999 | 4 (3.4%) | 14 (17.3%) |
| $150,000 or more | 11 (9.3%) | 21 (25.9%) |
| Total | 118 (100.0%) | 81 (100.0%) |
Property Value to Household Income Ratio in Sligo borough
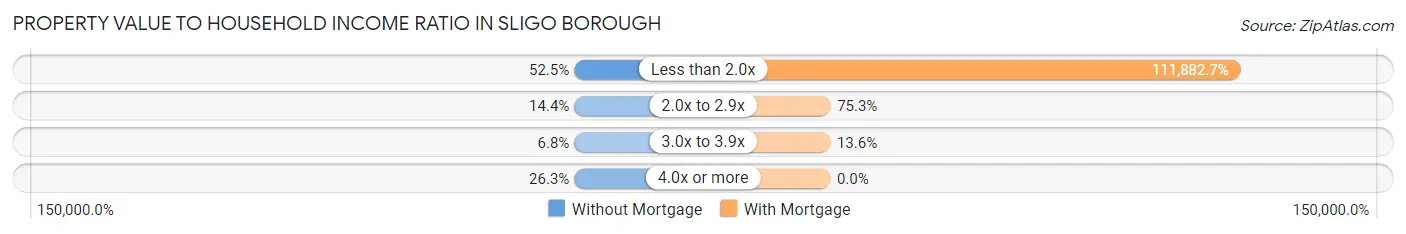
| Value-to-Income Ratio | Without Mortgage | With Mortgage |
| Less than 2.0x | 62 (52.5%) | 90,625 (111,882.7%) |
| 2.0x to 2.9x | 17 (14.4%) | 61 (75.3%) |
| 3.0x to 3.9x | 8 (6.8%) | 11 (13.6%) |
| 4.0x or more | 31 (26.3%) | 0 (0.0%) |
| Total | 118 (100.0%) | 81 (100.0%) |
Real Estate Taxes by Mortgage Status in Sligo borough
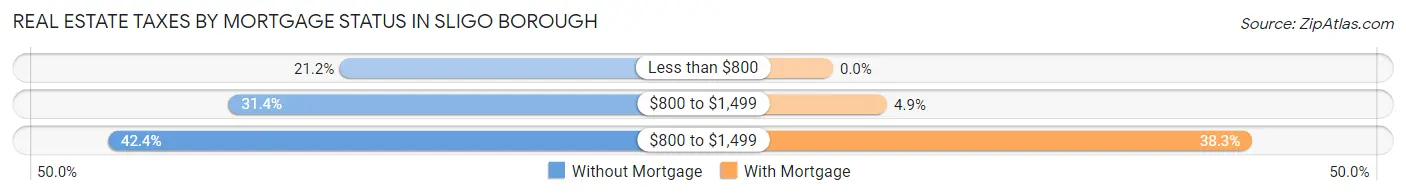
| Property Taxes | Without Mortgage | With Mortgage |
| Less than $800 | 25 (21.2%) | 0 (0.0%) |
| $800 to $1,499 | 37 (31.4%) | 4 (4.9%) |
| $800 to $1,499 | 50 (42.4%) | 31 (38.3%) |
| Total | 118 (100.0%) | 81 (100.0%) |
Health & Disability in Sligo borough
Health Insurance Coverage by Age in Sligo borough
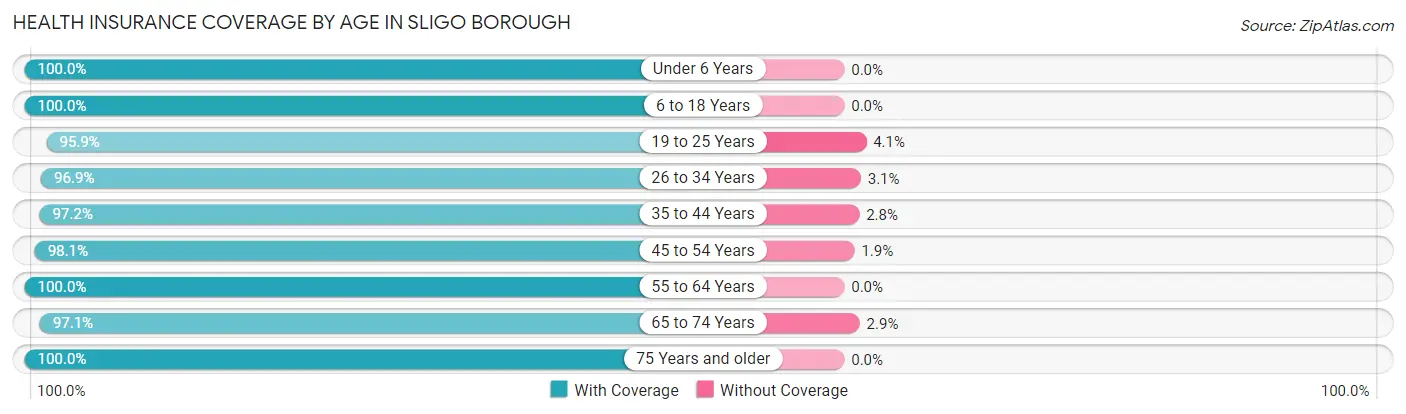
| Age Bracket | With Coverage | Without Coverage |
| Under 6 Years | 33 (100.0%) | 0 (0.0%) |
| 6 to 18 Years | 100 (100.0%) | 0 (0.0%) |
| 19 to 25 Years | 47 (95.9%) | 2 (4.1%) |
| 26 to 34 Years | 126 (96.9%) | 4 (3.1%) |
| 35 to 44 Years | 70 (97.2%) | 2 (2.8%) |
| 45 to 54 Years | 103 (98.1%) | 2 (1.9%) |
| 55 to 64 Years | 119 (100.0%) | 0 (0.0%) |
| 65 to 74 Years | 68 (97.1%) | 2 (2.9%) |
| 75 Years and older | 67 (100.0%) | 0 (0.0%) |
| Total | 733 (98.4%) | 12 (1.6%) |
Health Insurance Coverage by Citizenship Status in Sligo borough
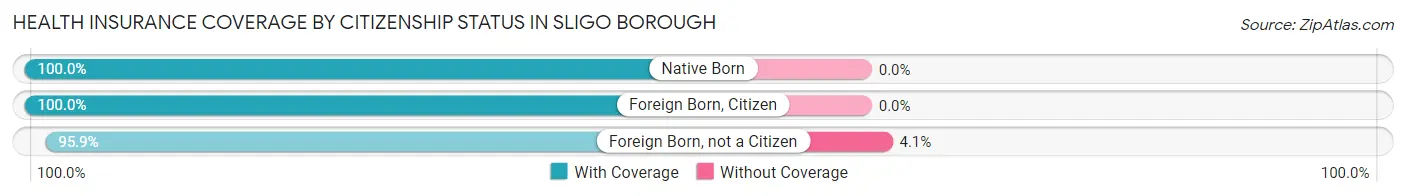
| Citizenship Status | With Coverage | Without Coverage |
| Native Born | 33 (100.0%) | 0 (0.0%) |
| Foreign Born, Citizen | 100 (100.0%) | 0 (0.0%) |
| Foreign Born, not a Citizen | 47 (95.9%) | 2 (4.1%) |
Health Insurance Coverage by Household Income in Sligo borough
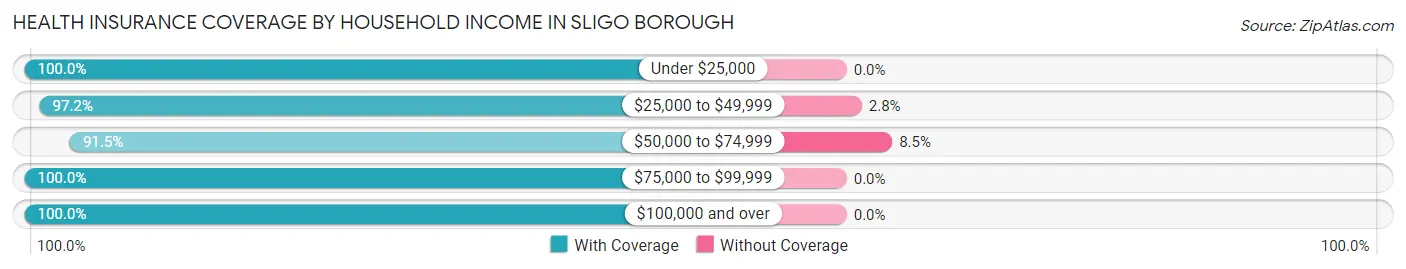
| Household Income | With Coverage | Without Coverage |
| Under $25,000 | 221 (100.0%) | 0 (0.0%) |
| $25,000 to $49,999 | 138 (97.2%) | 4 (2.8%) |
| $50,000 to $74,999 | 86 (91.5%) | 8 (8.5%) |
| $75,000 to $99,999 | 130 (100.0%) | 0 (0.0%) |
| $100,000 and over | 158 (100.0%) | 0 (0.0%) |
Public vs Private Health Insurance Coverage by Age in Sligo borough
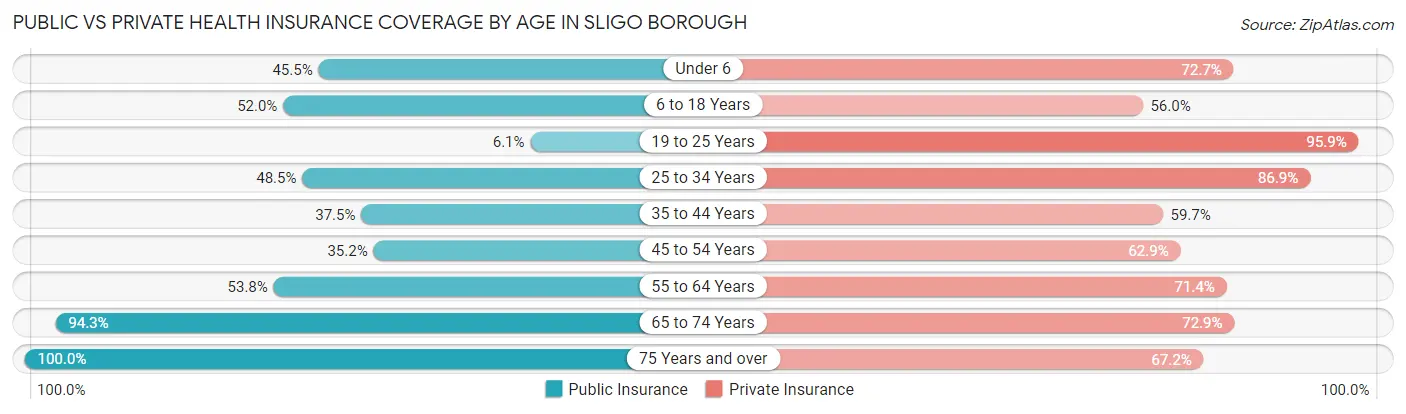
| Age Bracket | Public Insurance | Private Insurance |
| Under 6 | 15 (45.5%) | 24 (72.7%) |
| 6 to 18 Years | 52 (52.0%) | 56 (56.0%) |
| 19 to 25 Years | 3 (6.1%) | 47 (95.9%) |
| 25 to 34 Years | 63 (48.5%) | 113 (86.9%) |
| 35 to 44 Years | 27 (37.5%) | 43 (59.7%) |
| 45 to 54 Years | 37 (35.2%) | 66 (62.9%) |
| 55 to 64 Years | 64 (53.8%) | 85 (71.4%) |
| 65 to 74 Years | 66 (94.3%) | 51 (72.9%) |
| 75 Years and over | 67 (100.0%) | 45 (67.2%) |
| Total | 394 (52.9%) | 530 (71.1%) |
Disability Status by Sex by Age in Sligo borough
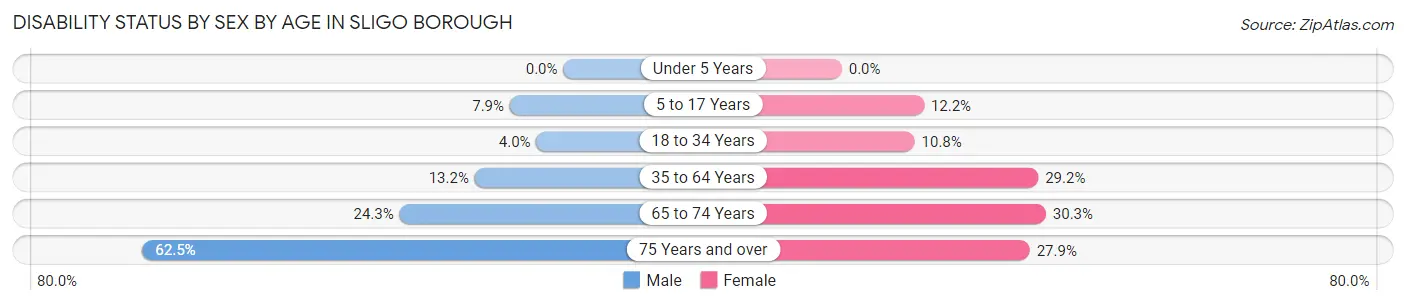
| Age Bracket | Male | Female |
| Under 5 Years | 0 (0.0%) | 0 (0.0%) |
| 5 to 17 Years | 5 (7.9%) | 5 (12.2%) |
| 18 to 34 Years | 3 (4.0%) | 12 (10.8%) |
| 35 to 64 Years | 20 (13.2%) | 42 (29.2%) |
| 65 to 74 Years | 9 (24.3%) | 10 (30.3%) |
| 75 Years and over | 15 (62.5%) | 12 (27.9%) |
Disability Class by Sex by Age in Sligo borough
Disability Class: Hearing Difficulty
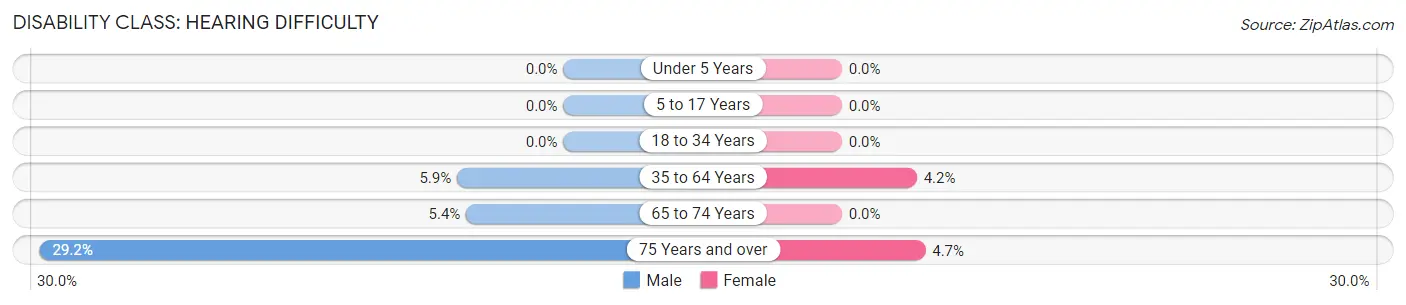
| Age Bracket | Male | Female |
| Under 5 Years | 0 (0.0%) | 0 (0.0%) |
| 5 to 17 Years | 0 (0.0%) | 0 (0.0%) |
| 18 to 34 Years | 0 (0.0%) | 0 (0.0%) |
| 35 to 64 Years | 9 (5.9%) | 6 (4.2%) |
| 65 to 74 Years | 2 (5.4%) | 0 (0.0%) |
| 75 Years and over | 7 (29.2%) | 2 (4.6%) |
Disability Class: Vision Difficulty
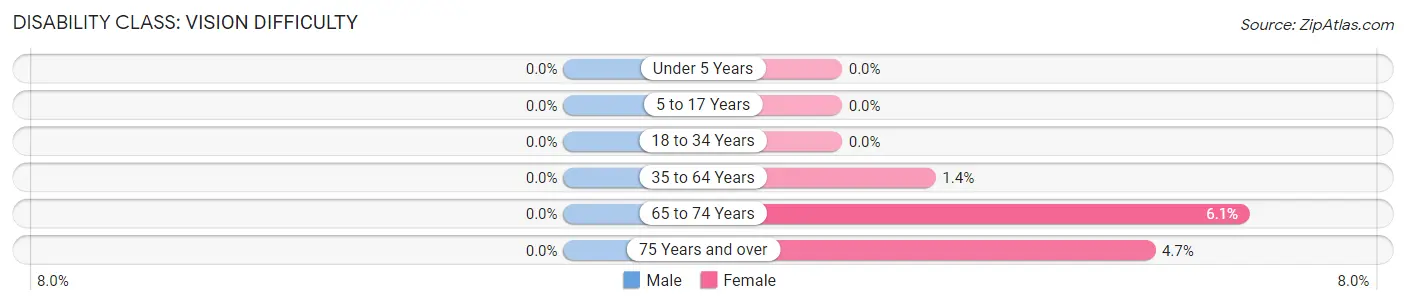
| Age Bracket | Male | Female |
| Under 5 Years | 0 (0.0%) | 0 (0.0%) |
| 5 to 17 Years | 0 (0.0%) | 0 (0.0%) |
| 18 to 34 Years | 0 (0.0%) | 0 (0.0%) |
| 35 to 64 Years | 0 (0.0%) | 2 (1.4%) |
| 65 to 74 Years | 0 (0.0%) | 2 (6.1%) |
| 75 Years and over | 0 (0.0%) | 2 (4.6%) |
Disability Class: Cognitive Difficulty
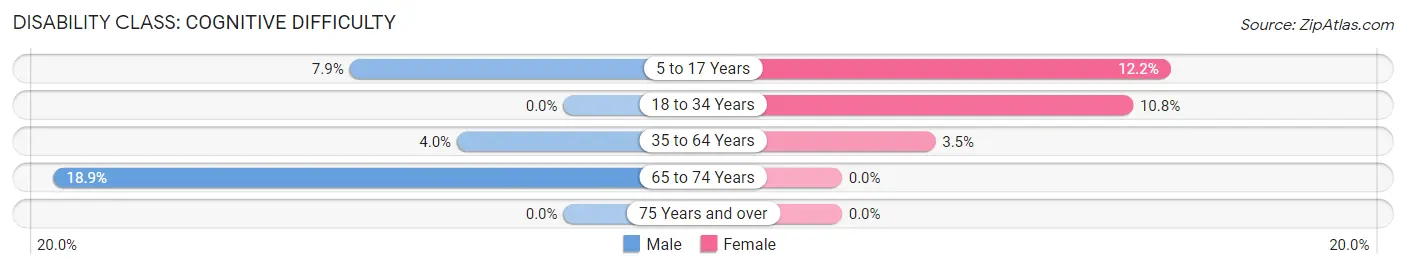
| Age Bracket | Male | Female |
| 5 to 17 Years | 5 (7.9%) | 5 (12.2%) |
| 18 to 34 Years | 0 (0.0%) | 12 (10.8%) |
| 35 to 64 Years | 6 (4.0%) | 5 (3.5%) |
| 65 to 74 Years | 7 (18.9%) | 0 (0.0%) |
| 75 Years and over | 0 (0.0%) | 0 (0.0%) |
Disability Class: Ambulatory Difficulty
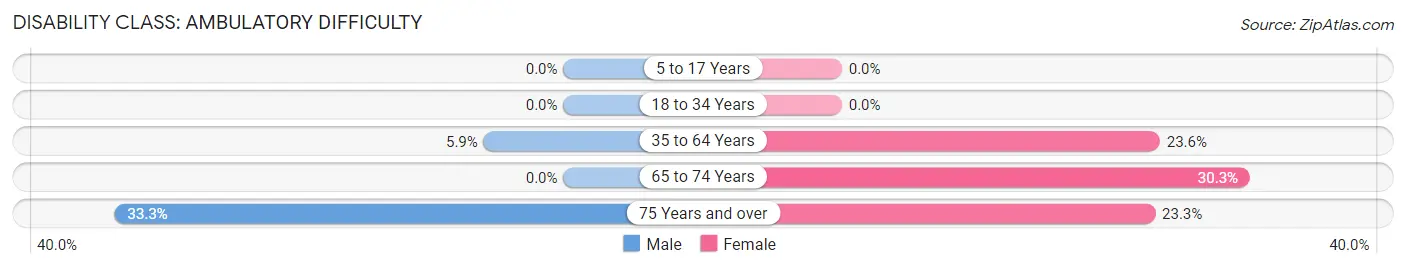
| Age Bracket | Male | Female |
| 5 to 17 Years | 0 (0.0%) | 0 (0.0%) |
| 18 to 34 Years | 0 (0.0%) | 0 (0.0%) |
| 35 to 64 Years | 9 (5.9%) | 34 (23.6%) |
| 65 to 74 Years | 0 (0.0%) | 10 (30.3%) |
| 75 Years and over | 8 (33.3%) | 10 (23.3%) |
Disability Class: Self-Care Difficulty
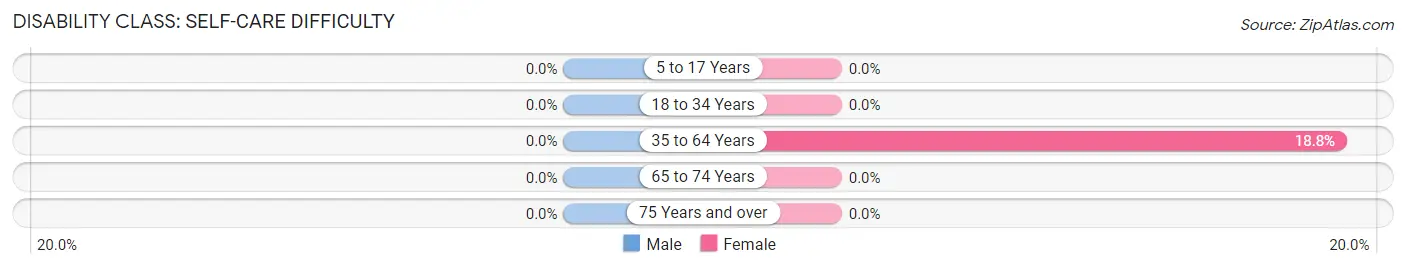
| Age Bracket | Male | Female |
| 5 to 17 Years | 0 (0.0%) | 0 (0.0%) |
| 18 to 34 Years | 0 (0.0%) | 0 (0.0%) |
| 35 to 64 Years | 0 (0.0%) | 27 (18.8%) |
| 65 to 74 Years | 0 (0.0%) | 0 (0.0%) |
| 75 Years and over | 0 (0.0%) | 0 (0.0%) |
Technology Access in Sligo borough
Computing Device Access in Sligo borough
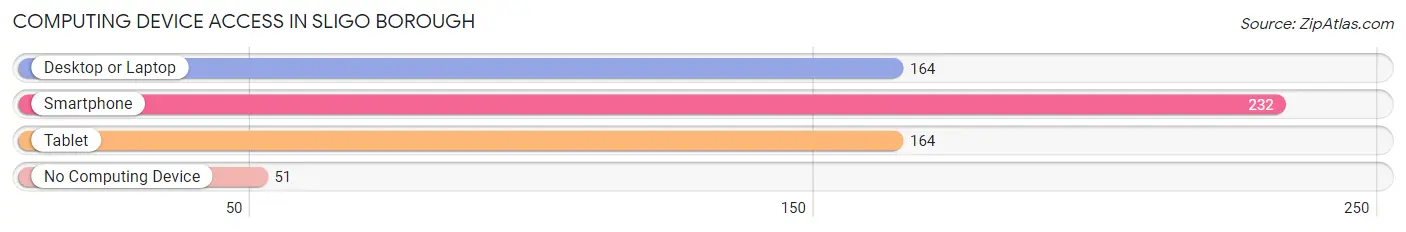
| Device Type | # Households | % Households |
| Desktop or Laptop | 164 | 53.2% |
| Smartphone | 232 | 75.3% |
| Tablet | 164 | 53.2% |
| No Computing Device | 51 | 16.6% |
| Total | 308 | 100.0% |
Internet Access in Sligo borough
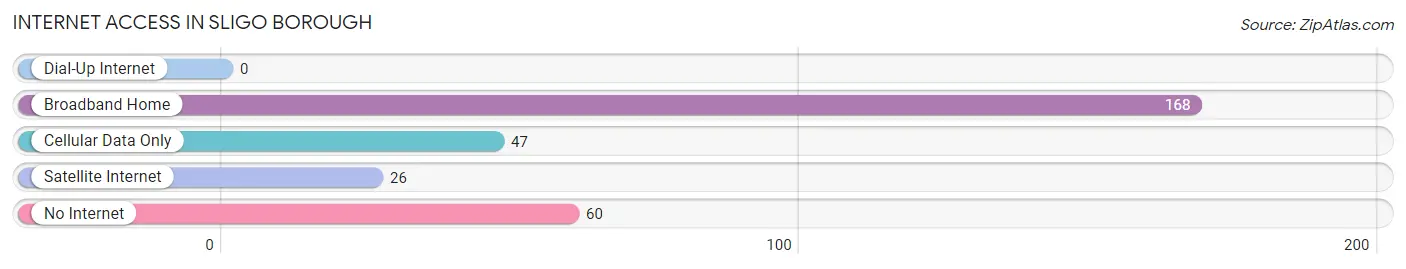
| Internet Type | # Households | % Households |
| Dial-Up Internet | 0 | 0.0% |
| Broadband Home | 168 | 54.5% |
| Cellular Data Only | 47 | 15.3% |
| Satellite Internet | 26 | 8.4% |
| No Internet | 60 | 19.5% |
| Total | 308 | 100.0% |
Sligo borough Summary
Sligo Borough is a small borough located in Clarion County, Pennsylvania. It is situated in the northwest corner of the county, and is bordered by the Clarion River to the north and east, and by the Allegheny River to the south and west. The borough has a population of approximately 1,000 people, and is part of the Clarion-Forest-Venango tri-county area.
History
Sligo Borough was founded in 1845 by a group of settlers from Sligo, Ireland. The settlers were attracted to the area by the abundance of natural resources, including timber, coal, and iron ore. The borough was named after the Irish town of Sligo, and the settlers brought with them many of the customs and traditions of their homeland.
The borough was incorporated in 1851, and the first mayor was elected in 1852. The first post office was established in 1853, and the first school was built in 1854. The borough was home to several industries, including a sawmill, a grist mill, a tannery, and a brickyard.
Geography
Sligo Borough is located in the northwest corner of Clarion County, Pennsylvania. It is bordered by the Clarion River to the north and east, and by the Allegheny River to the south and west. The borough covers an area of 1.2 square miles, and has a population of approximately 1,000 people.
The borough is situated in a rural area, and is surrounded by rolling hills and forests. The terrain is mostly flat, with some areas of higher elevation. The climate is humid continental, with cold winters and warm summers.
Economy
The economy of Sligo Borough is largely based on agriculture and tourism. The borough is home to several farms, which produce a variety of crops, including corn, soybeans, hay, and wheat. The borough also has several small businesses, including restaurants, shops, and a bed and breakfast.
Tourism is an important part of the local economy, as the borough is home to several attractions, including the Clarion River, the Allegheny River, and the Sligo Creek State Park. The borough also hosts several festivals and events throughout the year, including the Sligo Irish Festival and the Sligo County Fair.
Demographics
As of the 2010 census, the population of Sligo Borough was 1,000 people. The racial makeup of the borough was 97.2% White, 0.7% African American, 0.3% Native American, 0.3% Asian, and 1.5% from other races. The median household income was $37,500, and the median family income was $45,000.
The population of Sligo Borough is largely rural, and the majority of the population is employed in agriculture and tourism. The borough is home to several churches, and the majority of the population is Christian. The borough is also home to a small Jewish community.
Common Questions
What is Per Capita Income in Sligo borough?
Per Capita income in Sligo borough is $26,795.
What is the Median Family Income in Sligo borough?
Median Family Income in Sligo borough is $54,875.
What is the Median Household income in Sligo borough?
Median Household Income in Sligo borough is $46,346.
What is Income or Wage Gap in Sligo borough?
Income or Wage Gap in Sligo borough is 34.0%.
Women in Sligo borough earn 66.0 cents for every dollar earned by a man.
What is Inequality or Gini Index in Sligo borough?
Inequality or Gini Index in Sligo borough is 0.46.
What is the Total Population of Sligo borough?
Total Population of Sligo borough is 745.
What is the Total Male Population of Sligo borough?
Total Male Population of Sligo borough is 365.
What is the Total Female Population of Sligo borough?
Total Female Population of Sligo borough is 380.
What is the Ratio of Males per 100 Females in Sligo borough?
There are 96.05 Males per 100 Females in Sligo borough.
What is the Ratio of Females per 100 Males in Sligo borough?
There are 104.11 Females per 100 Males in Sligo borough.
What is the Median Population Age in Sligo borough?
Median Population Age in Sligo borough is 43.8 Years.
What is the Average Family Size in Sligo borough
Average Family Size in Sligo borough is 2.8 People.
What is the Average Household Size in Sligo borough
Average Household Size in Sligo borough is 2.4 People.
How Large is the Labor Force in Sligo borough?
There are 334 People in the Labor Forcein in Sligo borough.
What is the Percentage of People in the Labor Force in Sligo borough?
52.8% of People are in the Labor Force in Sligo borough.
What is the Unemployment Rate in Sligo borough?
Unemployment Rate in Sligo borough is 7.8%.