Zip Codes with the Highest Percentage of Population with a Degree in Science and Engineering in Pittsburgh, PA
RELATED REPORTS & OPTIONS
Science and Engineering
Pittsburgh
Compare Zip Codes
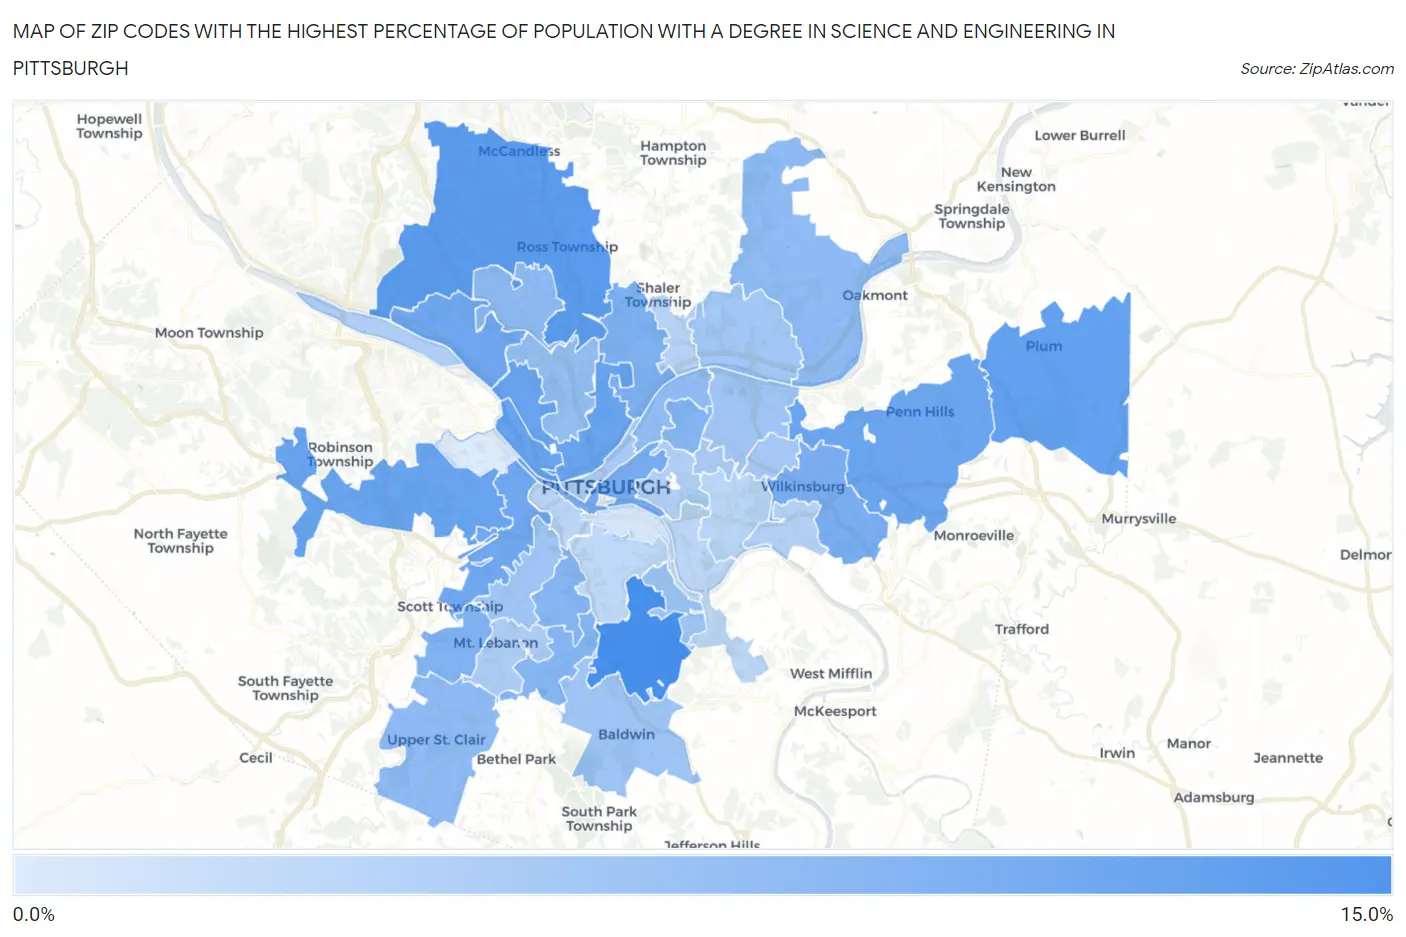
Map of Zip Codes with the Highest Percentage of Population with a Degree in Science and Engineering in Pittsburgh
4.8%
13.0%
Zip Codes with the Highest Percentage of Population with a Degree in Science and Engineering in Pittsburgh, PA
| Zip Code | % Graduates | vs State | vs National | |
| 1. | 15227 | 13.0% | 10.9%(+2.17)#641 | 9.8%(+3.25)#9,207 |
| 2. | 15237 | 11.9% | 10.9%(+1.08)#740 | 9.8%(+2.16)#10,991 |
| 3. | 15239 | 11.4% | 10.9%(+0.549)#804 | 9.8%(+1.63)#12,011 |
| 4. | 15212 | 11.0% | 10.9%(+0.174)#843 | 9.8%(+1.25)#12,799 |
| 5. | 15233 | 11.0% | 10.9%(+0.149)#848 | 9.8%(+1.23)#12,852 |
| 6. | 15205 | 11.0% | 10.9%(+0.145)#849 | 9.8%(+1.23)#12,862 |
| 7. | 15235 | 11.0% | 10.9%(+0.101)#852 | 9.8%(+1.18)#12,949 |
| 8. | 15202 | 10.7% | 10.9%(-0.188)#882 | 9.8%(+0.892)#13,583 |
| 9. | 15220 | 10.7% | 10.9%(-0.202)#886 | 9.8%(+0.878)#13,618 |
| 10. | 15219 | 10.3% | 10.9%(-0.550)#934 | 9.8%(+0.530)#14,357 |
| 11. | 15221 | 10.2% | 10.9%(-0.645)#943 | 9.8%(+0.435)#14,562 |
| 12. | 15209 | 9.9% | 10.9%(-1.00)#992 | 9.8%(+0.076)#15,350 |
| 13. | 15243 | 9.7% | 10.9%(-1.11)#1,006 | 9.8%(-0.034)#15,594 |
| 14. | 15226 | 9.6% | 10.9%(-1.29)#1,026 | 9.8%(-0.206)#15,980 |
| 15. | 15224 | 9.6% | 10.9%(-1.29)#1,029 | 9.8%(-0.210)#15,996 |
| 16. | 15234 | 9.5% | 10.9%(-1.33)#1,032 | 9.8%(-0.252)#16,072 |
| 17. | 15229 | 9.1% | 10.9%(-1.78)#1,080 | 9.8%(-0.703)#17,157 |
| 18. | 15238 | 9.1% | 10.9%(-1.80)#1,083 | 9.8%(-0.717)#17,188 |
| 19. | 15241 | 9.0% | 10.9%(-1.89)#1,089 | 9.8%(-0.813)#17,408 |
| 20. | 15201 | 8.9% | 10.9%(-2.00)#1,104 | 9.8%(-0.917)#17,634 |
| 21. | 15214 | 8.6% | 10.9%(-2.27)#1,127 | 9.8%(-1.19)#18,263 |
| 22. | 15236 | 8.2% | 10.9%(-2.67)#1,174 | 9.8%(-1.59)#19,216 |
| 23. | 15206 | 8.0% | 10.9%(-2.86)#1,195 | 9.8%(-1.78)#19,650 |
| 24. | 15216 | 8.0% | 10.9%(-2.88)#1,200 | 9.8%(-1.80)#19,687 |
| 25. | 15215 | 7.9% | 10.9%(-2.98)#1,207 | 9.8%(-1.90)#19,902 |
| 26. | 15208 | 7.8% | 10.9%(-3.06)#1,214 | 9.8%(-1.98)#20,086 |
| 27. | 15232 | 7.6% | 10.9%(-3.27)#1,234 | 9.8%(-2.19)#20,550 |
| 28. | 15222 | 7.5% | 10.9%(-3.33)#1,243 | 9.8%(-2.25)#20,659 |
| 29. | 15228 | 7.4% | 10.9%(-3.43)#1,248 | 9.8%(-2.35)#20,853 |
| 30. | 15213 | 7.2% | 10.9%(-3.69)#1,269 | 9.8%(-2.61)#21,382 |
| 31. | 15225 | 7.1% | 10.9%(-3.76)#1,284 | 9.8%(-2.68)#21,532 |
| 32. | 15218 | 7.0% | 10.9%(-3.90)#1,294 | 9.8%(-2.82)#21,791 |
| 33. | 15223 | 6.7% | 10.9%(-4.13)#1,306 | 9.8%(-3.05)#22,179 |
| 34. | 15211 | 6.6% | 10.9%(-4.24)#1,313 | 9.8%(-3.16)#22,372 |
| 35. | 15217 | 6.6% | 10.9%(-4.27)#1,316 | 9.8%(-3.19)#22,431 |
| 36. | 15207 | 6.5% | 10.9%(-4.38)#1,325 | 9.8%(-3.30)#22,618 |
| 37. | 15210 | 6.4% | 10.9%(-4.50)#1,331 | 9.8%(-3.42)#22,812 |
| 38. | 15203 | 5.1% | 10.9%(-5.75)#1,380 | 9.8%(-4.67)#24,617 |
| 39. | 15204 | 4.8% | 10.9%(-6.09)#1,391 | 9.8%(-5.01)#24,979 |
1
Common Questions
What are the Top 10 Zip Codes with the Highest Percentage of Population with a Degree in Science and Engineering in Pittsburgh, PA?
Top 10 Zip Codes with the Highest Percentage of Population with a Degree in Science and Engineering in Pittsburgh, PA are:
What zip code has the Highest Percentage of Population with a Degree in Science and Engineering in Pittsburgh, PA?
15227 has the Highest Percentage of Population with a Degree in Science and Engineering in Pittsburgh, PA with 13.0%.
What is the Percentage of Population with a Degree in Science and Engineering in Pittsburgh, PA?
Percentage of Population with a Degree in Science and Engineering in Pittsburgh is 8.1%.
What is the Percentage of Population with a Degree in Science and Engineering in Pennsylvania?
Percentage of Population with a Degree in Science and Engineering in Pennsylvania is 10.9%.
What is the Percentage of Population with a Degree in Science and Engineering in the United States?
Percentage of Population with a Degree in Science and Engineering in the United States is 9.8%.