Zip Codes with the Highest Percentage of Population with a Degree in Science and Engineering in Lancaster, PA
RELATED REPORTS & OPTIONS
Science and Engineering
Lancaster
Compare Zip Codes
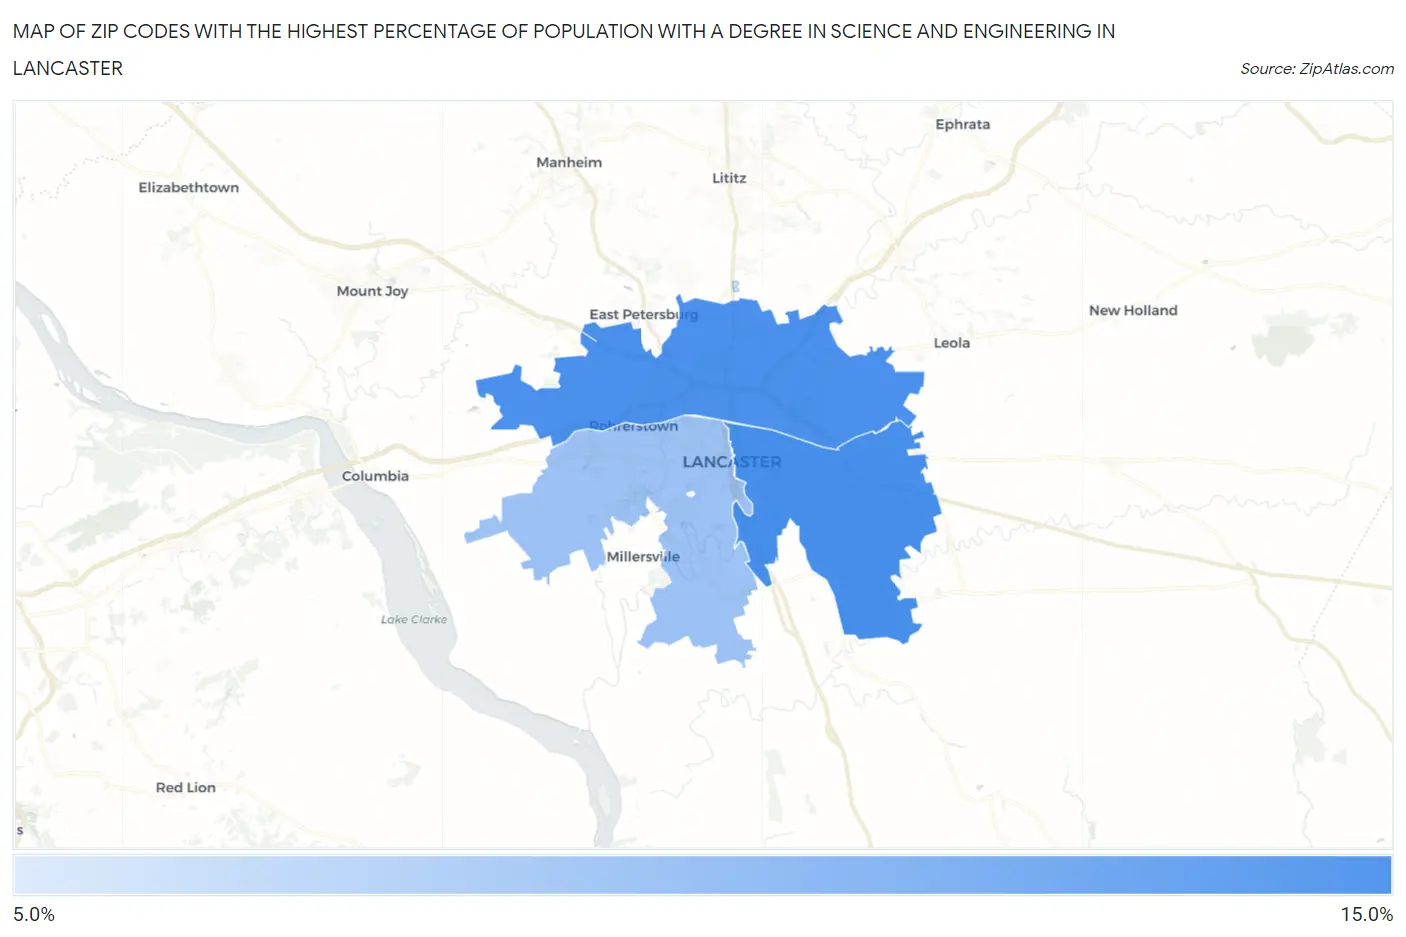
Map of Zip Codes with the Highest Percentage of Population with a Degree in Science and Engineering in Lancaster
5.8%
10.9%
Zip Codes with the Highest Percentage of Population with a Degree in Science and Engineering in Lancaster, PA
| Zip Code | % Graduates | vs State | vs National | |
| 1. | 17602 | 10.9% | 10.9%(+0.042)#862 | 9.8%(+1.12)#13,079 |
| 2. | 17601 | 10.8% | 10.9%(-0.071)#872 | 9.8%(+1.01)#13,347 |
| 3. | 17603 | 8.1% | 10.9%(-2.78)#1,184 | 9.8%(-1.70)#19,458 |
| 4. | 17606 | 5.8% | 10.9%(-5.03)#1,352 | 9.8%(-3.95)#23,709 |
1
Common Questions
What are the Top 3 Zip Codes with the Highest Percentage of Population with a Degree in Science and Engineering in Lancaster, PA?
Top 3 Zip Codes with the Highest Percentage of Population with a Degree in Science and Engineering in Lancaster, PA are:
What zip code has the Highest Percentage of Population with a Degree in Science and Engineering in Lancaster, PA?
17602 has the Highest Percentage of Population with a Degree in Science and Engineering in Lancaster, PA with 10.9%.
What is the Percentage of Population with a Degree in Science and Engineering in Lancaster, PA?
Percentage of Population with a Degree in Science and Engineering in Lancaster is 7.6%.
What is the Percentage of Population with a Degree in Science and Engineering in Pennsylvania?
Percentage of Population with a Degree in Science and Engineering in Pennsylvania is 10.9%.
What is the Percentage of Population with a Degree in Science and Engineering in the United States?
Percentage of Population with a Degree in Science and Engineering in the United States is 9.8%.