Vanderbilt borough, PA Map & Demographics
Vanderbilt borough Overview
$30,996
PER CAPITA INCOME
$73,000
AVG FAMILY INCOME
$51,000
AVG HOUSEHOLD INCOME
44.6%
WAGE / INCOME GAP [ % ]
55.4¢/ $1
WAGE / INCOME GAP [ $ ]
0.40
INEQUALITY / GINI INDEX
314
TOTAL POPULATION
161
MALE POPULATION
153
FEMALE POPULATION
105.23
MALES / 100 FEMALES
95.03
FEMALES / 100 MALES
38.8
MEDIAN AGE
2.7
AVG FAMILY SIZE
2.3
AVG HOUSEHOLD SIZE
152
LABOR FORCE [ PEOPLE ]
62.8%
PERCENT IN LABOR FORCE
Income in Vanderbilt borough
Income Overview in Vanderbilt borough
Per Capita Income in Vanderbilt borough is $30,996, while median incomes of families and households are $73,000 and $51,000 respectively.
| Characteristic | Number | Measure |
| Per Capita Income | 314 | $30,996 |
| Median Family Income | 94 | $73,000 |
| Mean Family Income | 94 | $81,510 |
| Median Household Income | 138 | $51,000 |
| Mean Household Income | 138 | $69,180 |
| Income Deficit | 94 | $0 |
| Wage / Income Gap (%) | 314 | 44.62% |
| Wage / Income Gap ($) | 314 | 55.38¢ per $1 |
| Gini / Inequality Index | 314 | 0.40 |
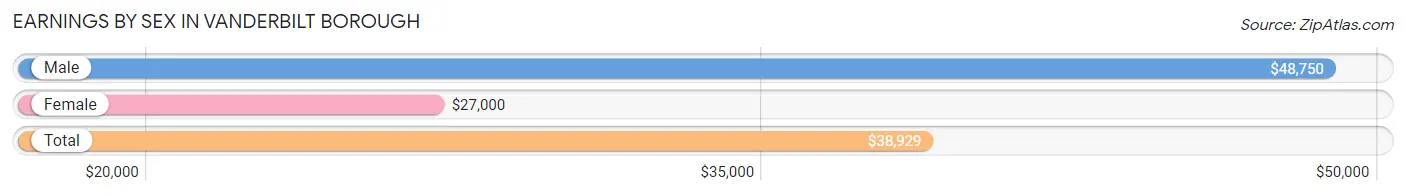
Earnings by Sex in Vanderbilt borough
Average Earnings in Vanderbilt borough are $38,929, $48,750 for men and $27,000 for women, a difference of 44.6%.
| Sex | Number | Average Earnings |
| Male | 80 (52.6%) | $48,750 |
| Female | 72 (47.4%) | $27,000 |
| Total | 152 (100.0%) | $38,929 |
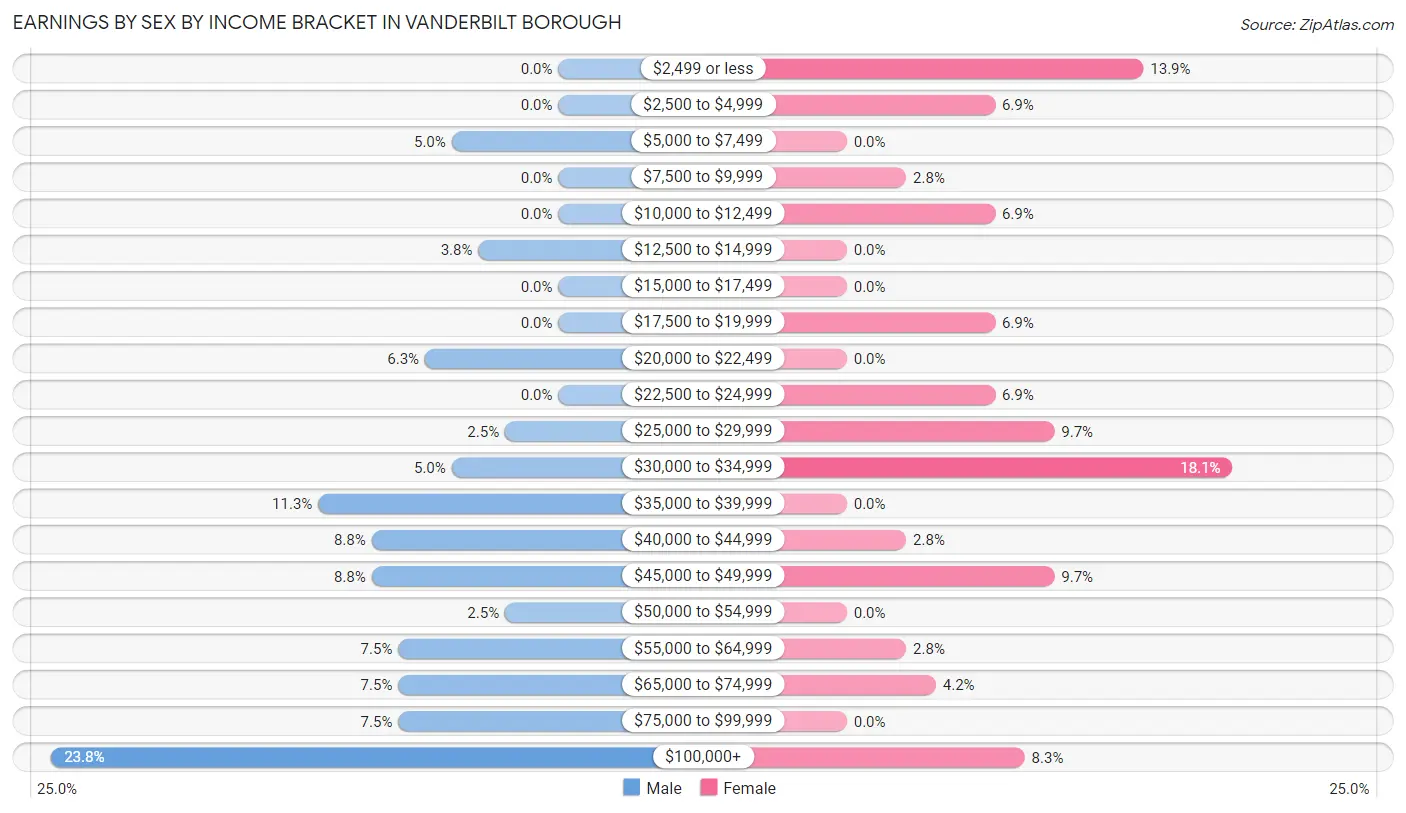
Earnings by Sex by Income Bracket in Vanderbilt borough
The most common earnings brackets in Vanderbilt borough are $100,000+ for men (19 | 23.7%) and $30,000 to $34,999 for women (13 | 18.1%).
| Income | Male | Female |
| $2,499 or less | 0 (0.0%) | 10 (13.9%) |
| $2,500 to $4,999 | 0 (0.0%) | 5 (6.9%) |
| $5,000 to $7,499 | 4 (5.0%) | 0 (0.0%) |
| $7,500 to $9,999 | 0 (0.0%) | 2 (2.8%) |
| $10,000 to $12,499 | 0 (0.0%) | 5 (6.9%) |
| $12,500 to $14,999 | 3 (3.7%) | 0 (0.0%) |
| $15,000 to $17,499 | 0 (0.0%) | 0 (0.0%) |
| $17,500 to $19,999 | 0 (0.0%) | 5 (6.9%) |
| $20,000 to $22,499 | 5 (6.2%) | 0 (0.0%) |
| $22,500 to $24,999 | 0 (0.0%) | 5 (6.9%) |
| $25,000 to $29,999 | 2 (2.5%) | 7 (9.7%) |
| $30,000 to $34,999 | 4 (5.0%) | 13 (18.1%) |
| $35,000 to $39,999 | 9 (11.3%) | 0 (0.0%) |
| $40,000 to $44,999 | 7 (8.7%) | 2 (2.8%) |
| $45,000 to $49,999 | 7 (8.7%) | 7 (9.7%) |
| $50,000 to $54,999 | 2 (2.5%) | 0 (0.0%) |
| $55,000 to $64,999 | 6 (7.5%) | 2 (2.8%) |
| $65,000 to $74,999 | 6 (7.5%) | 3 (4.2%) |
| $75,000 to $99,999 | 6 (7.5%) | 0 (0.0%) |
| $100,000+ | 19 (23.7%) | 6 (8.3%) |
| Total | 80 (100.0%) | 72 (100.0%) |
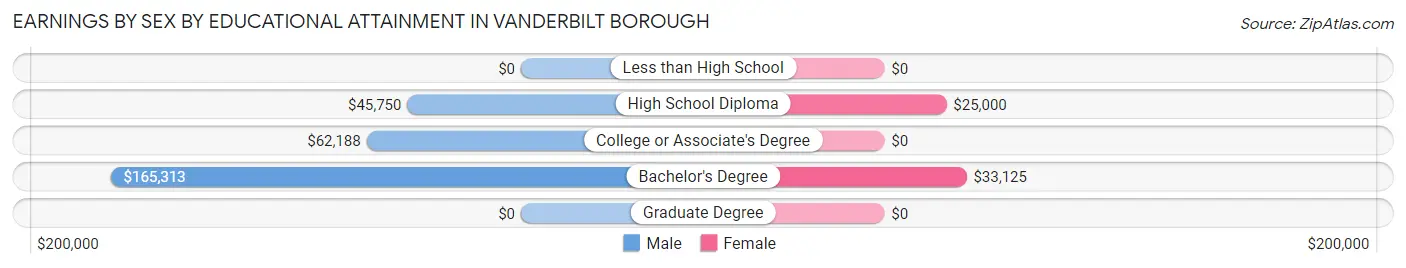
Earnings by Sex by Educational Attainment in Vanderbilt borough
Average earnings in Vanderbilt borough are $60,313 for men and $27,000 for women, a difference of 55.2%. Men with an educational attainment of bachelor's degree enjoy the highest average annual earnings of $165,313, while those with high school diploma education earn the least with $45,750. Women with an educational attainment of bachelor's degree earn the most with the average annual earnings of $33,125, while those with high school diploma education have the smallest earnings of $25,000.
| Educational Attainment | Male Income | Female Income |
| Less than High School | - | - |
| High School Diploma | $45,750 | $25,000 |
| College or Associate's Degree | $62,188 | $0 |
| Bachelor's Degree | $165,313 | $33,125 |
| Graduate Degree | - | - |
| Total | $60,313 | $27,000 |
Family Income in Vanderbilt borough
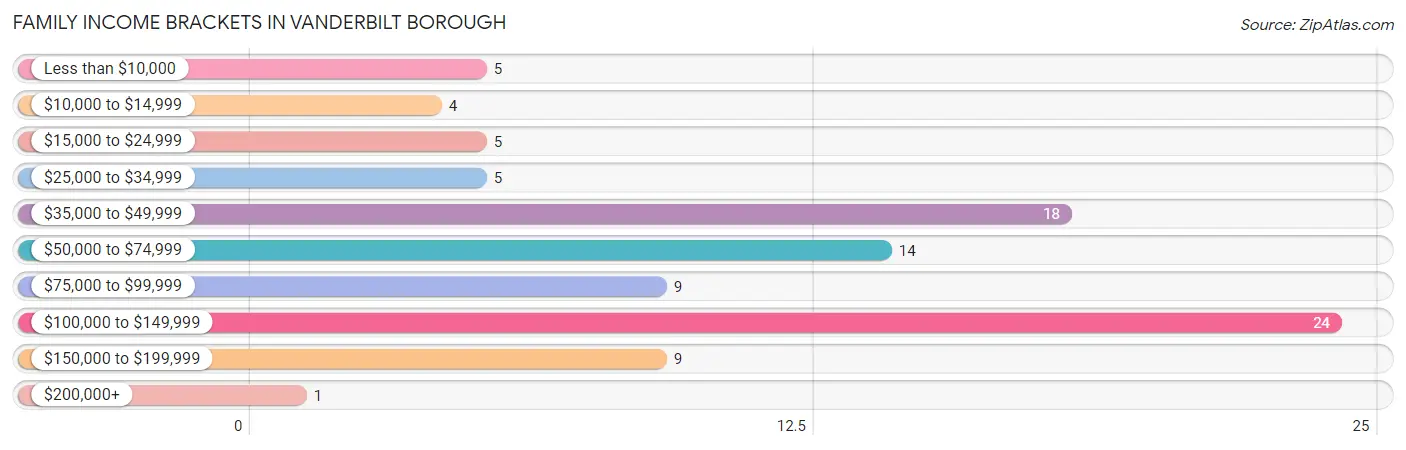
Family Income Brackets in Vanderbilt borough
According to the Vanderbilt borough family income data, there are 24 families falling into the $100,000 to $149,999 income range, which is the most common income bracket and makes up 25.5% of all families. Conversely, the $200,000+ income bracket is the least frequent group with only 1 families (1.1%) belonging to this category.
| Income Bracket | # Families | % Families |
| Less than $10,000 | 5 | 5.3% |
| $10,000 to $14,999 | 4 | 4.3% |
| $15,000 to $24,999 | 5 | 5.3% |
| $25,000 to $34,999 | 5 | 5.3% |
| $35,000 to $49,999 | 18 | 19.1% |
| $50,000 to $74,999 | 14 | 14.9% |
| $75,000 to $99,999 | 9 | 9.6% |
| $100,000 to $149,999 | 24 | 25.5% |
| $150,000 to $199,999 | 9 | 9.6% |
| $200,000+ | 1 | 1.1% |
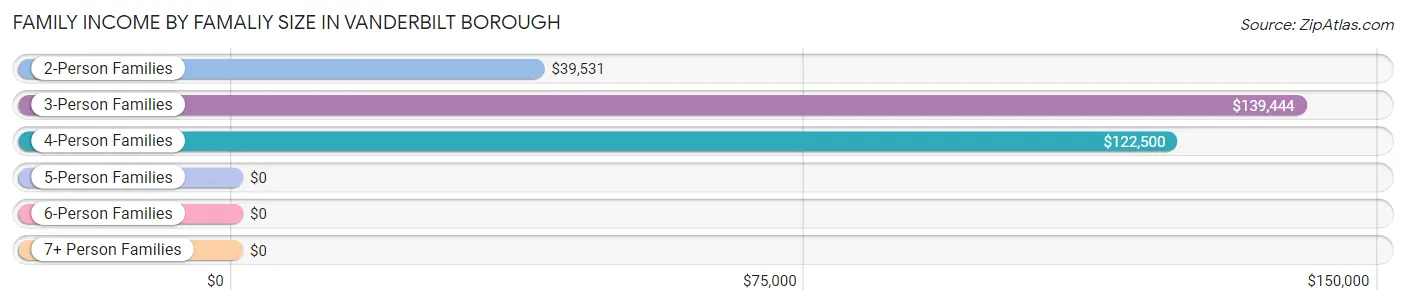
Family Income by Famaliy Size in Vanderbilt borough
3-person families (24 | 25.5%) account for the highest median family income in Vanderbilt borough with $139,444 per family, while 3-person families (24 | 25.5%) have the highest median income of $46,481 per family member.
| Income Bracket | # Families | Median Income |
| 2-Person Families | 53 (56.4%) | $39,531 |
| 3-Person Families | 24 (25.5%) | $139,444 |
| 4-Person Families | 12 (12.8%) | $122,500 |
| 5-Person Families | 5 (5.3%) | $0 |
| 6-Person Families | 0 (0.0%) | $0 |
| 7+ Person Families | 0 (0.0%) | $0 |
| Total | 94 (100.0%) | $73,000 |
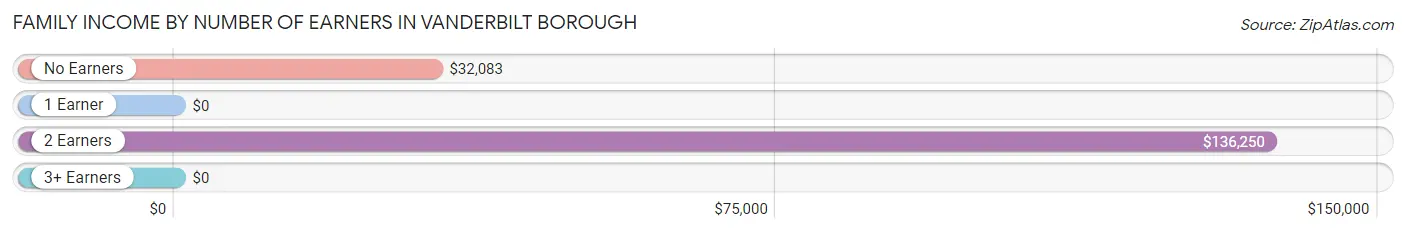
Family Income by Number of Earners in Vanderbilt borough
| Number of Earners | # Families | Median Income |
| No Earners | 23 (24.5%) | $32,083 |
| 1 Earner | 29 (30.8%) | $0 |
| 2 Earners | 38 (40.4%) | $136,250 |
| 3+ Earners | 4 (4.3%) | $0 |
| Total | 94 (100.0%) | $73,000 |
Household Income in Vanderbilt borough
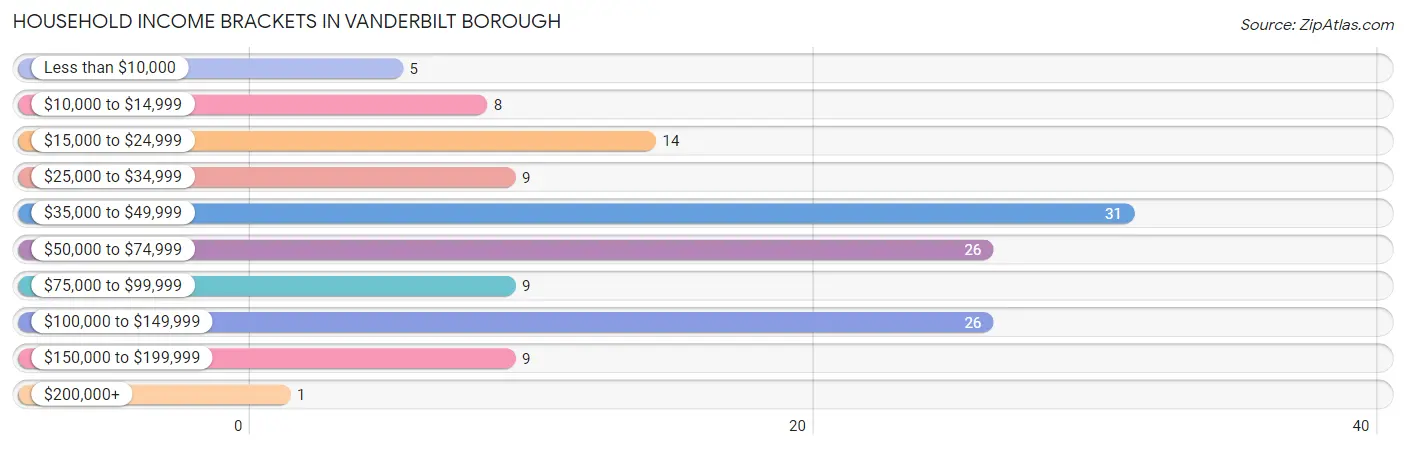
Household Income Brackets in Vanderbilt borough
With 31 households falling in the category, the $35,000 to $49,999 income range is the most frequent in Vanderbilt borough, accounting for 22.5% of all households. In contrast, only 1 households (0.7%) fall into the $200,000+ income bracket, making it the least populous group.
| Income Bracket | # Households | % Households |
| Less than $10,000 | 5 | 3.6% |
| $10,000 to $14,999 | 8 | 5.8% |
| $15,000 to $24,999 | 14 | 10.1% |
| $25,000 to $34,999 | 9 | 6.5% |
| $35,000 to $49,999 | 31 | 22.5% |
| $50,000 to $74,999 | 26 | 18.8% |
| $75,000 to $99,999 | 9 | 6.5% |
| $100,000 to $149,999 | 26 | 18.8% |
| $150,000 to $199,999 | 9 | 6.5% |
| $200,000+ | 1 | 0.7% |
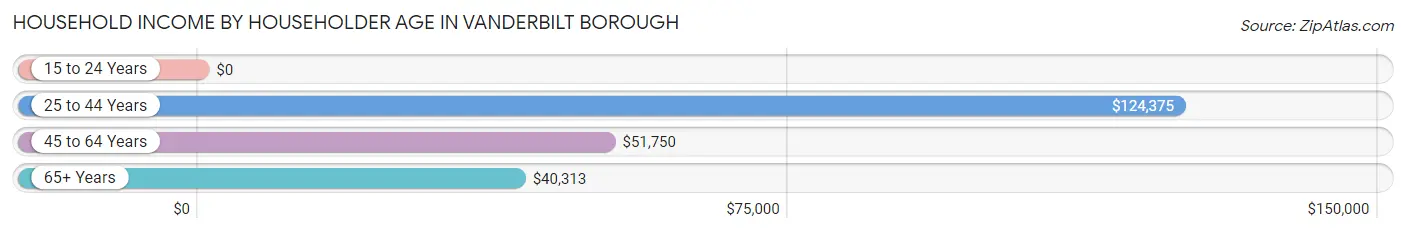
Household Income by Householder Age in Vanderbilt borough
The median household income in Vanderbilt borough is $51,000, with the highest median household income of $124,375 found in the 25 to 44 years age bracket for the primary householder. A total of 39 households (28.3%) fall into this category. Meanwhile, the 15 to 24 years age bracket for the primary householder has the lowest median household income of $0, with 7 households (5.1%) in this group.
| Income Bracket | # Households | Median Income |
| 15 to 24 Years | 7 (5.1%) | $0 |
| 25 to 44 Years | 39 (28.3%) | $124,375 |
| 45 to 64 Years | 55 (39.9%) | $51,750 |
| 65+ Years | 37 (26.8%) | $40,313 |
| Total | 138 (100.0%) | $51,000 |
Poverty in Vanderbilt borough
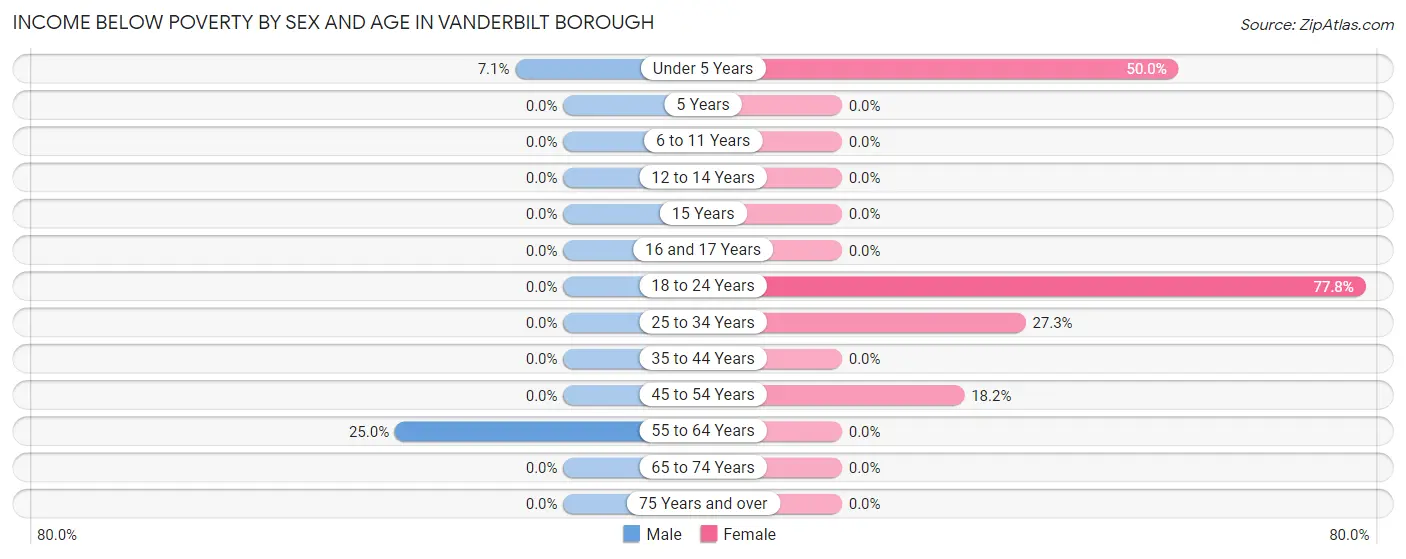
Income Below Poverty by Sex and Age in Vanderbilt borough
With 4.4% poverty level for males and 15.4% for females among the residents of Vanderbilt borough, 55 to 64 year old males and 18 to 24 year old females are the most vulnerable to poverty, with 6 males (25.0%) and 7 females (77.8%) in their respective age groups living below the poverty level.
| Age Bracket | Male | Female |
| Under 5 Years | 1 (7.1%) | 6 (50.0%) |
| 5 Years | 0 (0.0%) | 0 (0.0%) |
| 6 to 11 Years | 0 (0.0%) | 0 (0.0%) |
| 12 to 14 Years | 0 (0.0%) | 0 (0.0%) |
| 15 Years | 0 (0.0%) | 0 (0.0%) |
| 16 and 17 Years | 0 (0.0%) | 0 (0.0%) |
| 18 to 24 Years | 0 (0.0%) | 7 (77.8%) |
| 25 to 34 Years | 0 (0.0%) | 6 (27.3%) |
| 35 to 44 Years | 0 (0.0%) | 0 (0.0%) |
| 45 to 54 Years | 0 (0.0%) | 4 (18.2%) |
| 55 to 64 Years | 6 (25.0%) | 0 (0.0%) |
| 65 to 74 Years | 0 (0.0%) | 0 (0.0%) |
| 75 Years and over | 0 (0.0%) | 0 (0.0%) |
| Total | 7 (4.4%) | 23 (15.4%) |
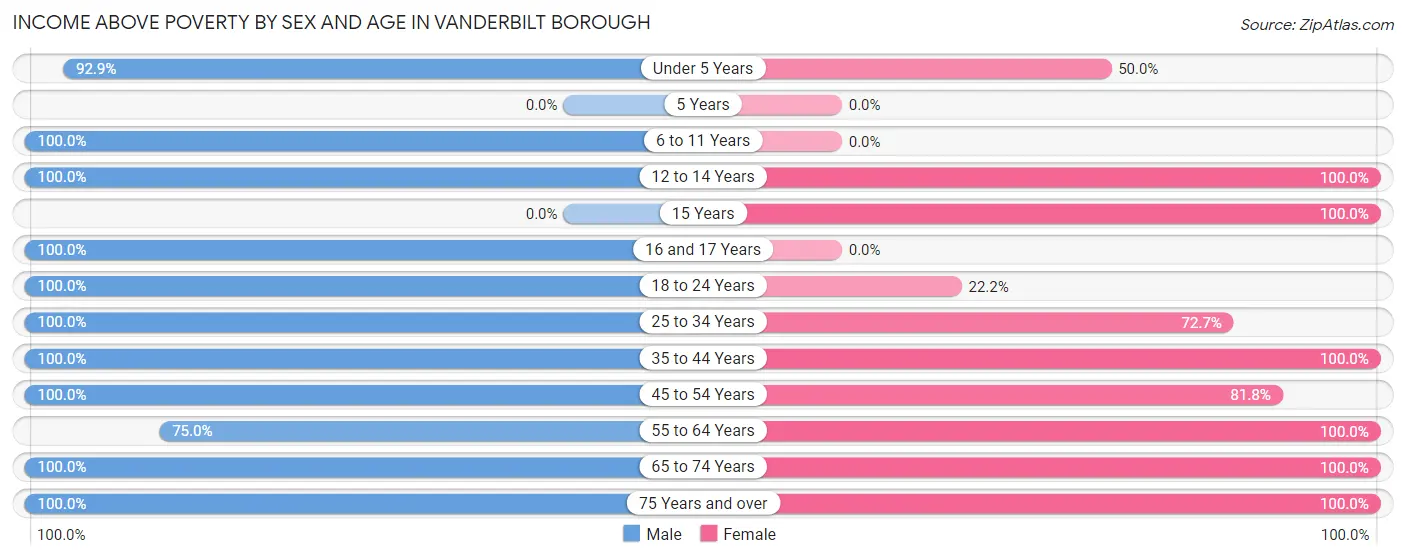
Income Above Poverty by Sex and Age in Vanderbilt borough
According to the poverty statistics in Vanderbilt borough, males aged 6 to 11 years and females aged 12 to 14 years are the age groups that are most secure financially, with 100.0% of males and 100.0% of females in these age groups living above the poverty line.
| Age Bracket | Male | Female |
| Under 5 Years | 13 (92.9%) | 6 (50.0%) |
| 5 Years | 0 (0.0%) | 0 (0.0%) |
| 6 to 11 Years | 11 (100.0%) | 0 (0.0%) |
| 12 to 14 Years | 12 (100.0%) | 6 (100.0%) |
| 15 Years | 0 (0.0%) | 12 (100.0%) |
| 16 and 17 Years | 2 (100.0%) | 0 (0.0%) |
| 18 to 24 Years | 7 (100.0%) | 2 (22.2%) |
| 25 to 34 Years | 25 (100.0%) | 16 (72.7%) |
| 35 to 44 Years | 18 (100.0%) | 20 (100.0%) |
| 45 to 54 Years | 24 (100.0%) | 18 (81.8%) |
| 55 to 64 Years | 18 (75.0%) | 19 (100.0%) |
| 65 to 74 Years | 10 (100.0%) | 11 (100.0%) |
| 75 Years and over | 13 (100.0%) | 16 (100.0%) |
| Total | 153 (95.6%) | 126 (84.6%) |
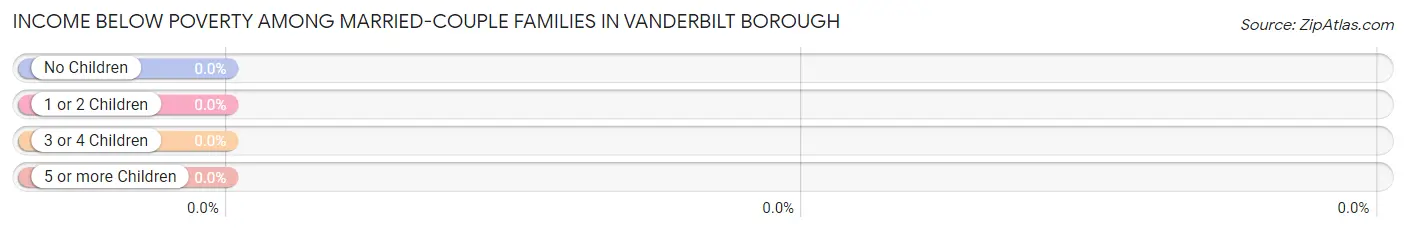
Income Below Poverty Among Married-Couple Families in Vanderbilt borough
| Children | Above Poverty | Below Poverty |
| No Children | 24 (100.0%) | 0 (0.0%) |
| 1 or 2 Children | 35 (100.0%) | 0 (0.0%) |
| 3 or 4 Children | 5 (100.0%) | 0 (0.0%) |
| 5 or more Children | 0 (0.0%) | 0 (0.0%) |
| Total | 64 (100.0%) | 0 (0.0%) |
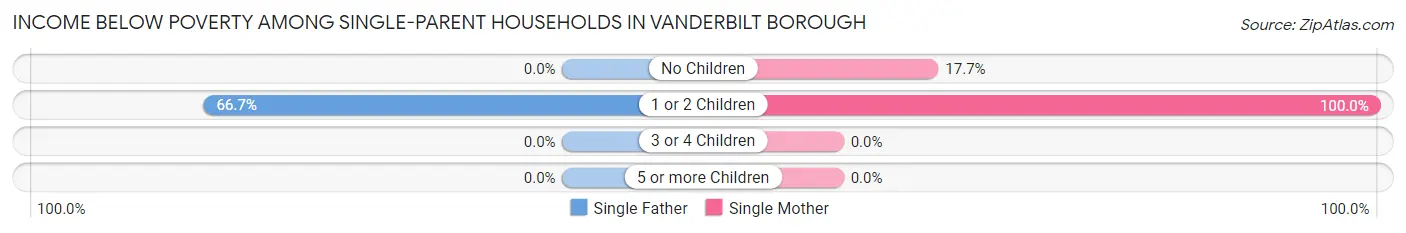
Income Below Poverty Among Single-Parent Households in Vanderbilt borough
According to the poverty data in Vanderbilt borough, 36.4% or 4 single-father households and 26.3% or 5 single-mother households are living below the poverty line. Among single-father households, those with 1 or 2 children have the highest poverty rate, with 4 households (66.7%) experiencing poverty. Likewise, among single-mother households, those with 1 or 2 children have the highest poverty rate, with 2 households (100.0%) falling below the poverty line.
| Children | Single Father | Single Mother |
| No Children | 0 (0.0%) | 3 (17.6%) |
| 1 or 2 Children | 4 (66.7%) | 2 (100.0%) |
| 3 or 4 Children | 0 (0.0%) | 0 (0.0%) |
| 5 or more Children | 0 (0.0%) | 0 (0.0%) |
| Total | 4 (36.4%) | 5 (26.3%) |
Income Below Poverty Among Married-Couple vs Single-Parent Households in Vanderbilt borough
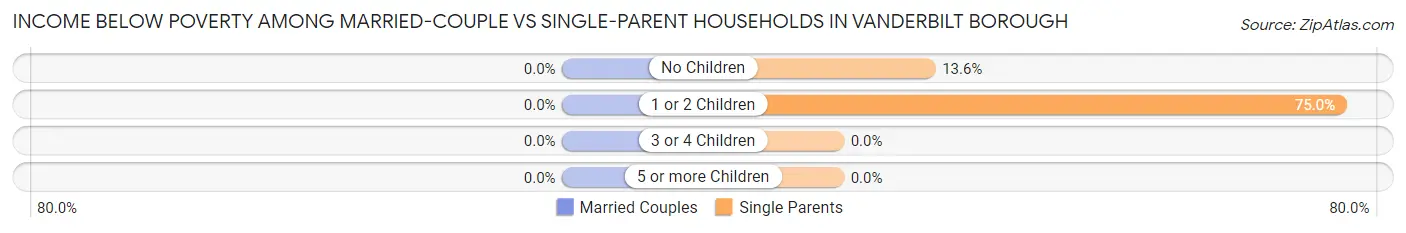
| Children | Married-Couple Families | Single-Parent Households |
| No Children | 0 (0.0%) | 3 (13.6%) |
| 1 or 2 Children | 0 (0.0%) | 6 (75.0%) |
| 3 or 4 Children | 0 (0.0%) | 0 (0.0%) |
| 5 or more Children | 0 (0.0%) | 0 (0.0%) |
| Total | 0 (0.0%) | 9 (30.0%) |
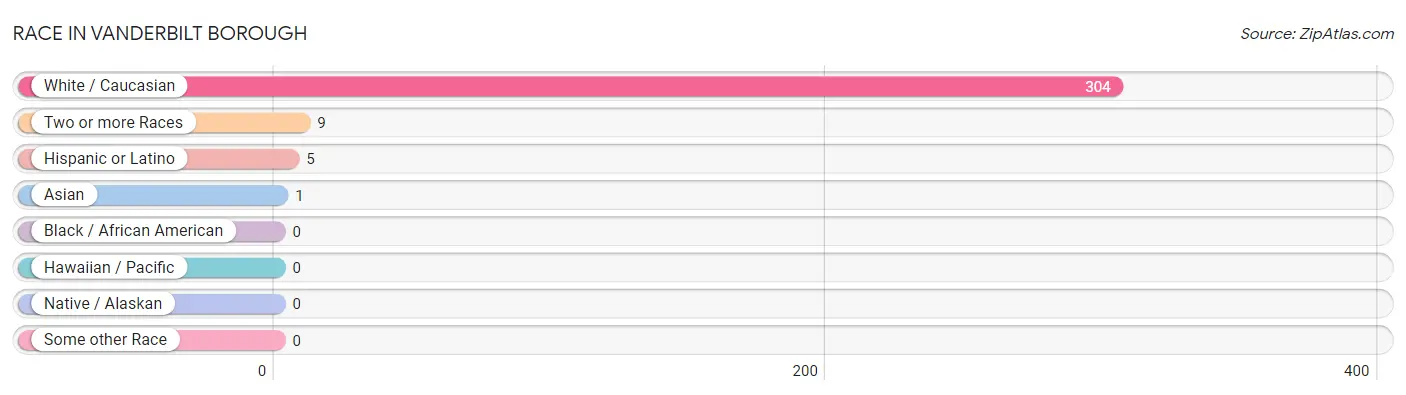
Race in Vanderbilt borough
The most populous races in Vanderbilt borough are White / Caucasian (304 | 96.8%), Two or more Races (9 | 2.9%), and Hispanic or Latino (5 | 1.6%).
| Race | # Population | % Population |
| Asian | 1 | 0.3% |
| Black / African American | 0 | 0.0% |
| Hawaiian / Pacific | 0 | 0.0% |
| Hispanic or Latino | 5 | 1.6% |
| Native / Alaskan | 0 | 0.0% |
| White / Caucasian | 304 | 96.8% |
| Two or more Races | 9 | 2.9% |
| Some other Race | 0 | 0.0% |
| Total | 314 | 100.0% |
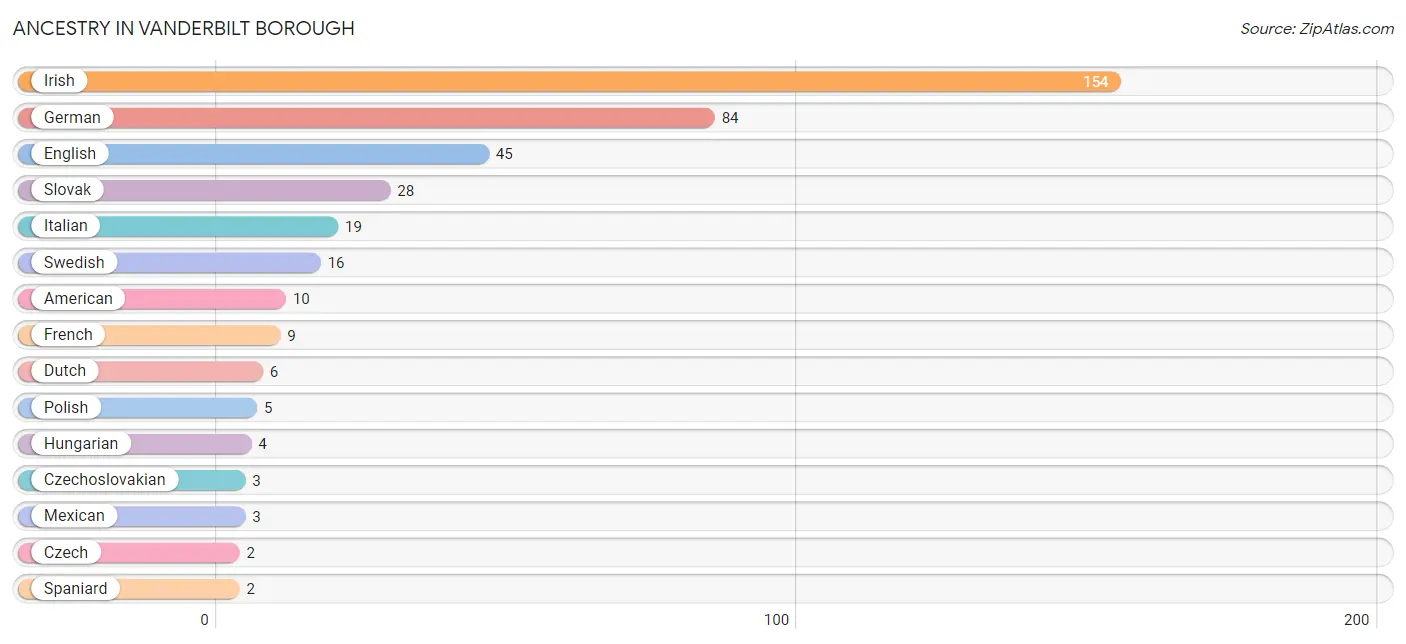
Ancestry in Vanderbilt borough
The most populous ancestries reported in Vanderbilt borough are Irish (154 | 49.0%), German (84 | 26.8%), English (45 | 14.3%), Slovak (28 | 8.9%), and Italian (19 | 6.0%), together accounting for 105.1% of all Vanderbilt borough residents.
| Ancestry | # Population | % Population |
| American | 10 | 3.2% |
| Bhutanese | 1 | 0.3% |
| Czech | 2 | 0.6% |
| Czechoslovakian | 3 | 1.0% |
| Dutch | 6 | 1.9% |
| English | 45 | 14.3% |
| French | 9 | 2.9% |
| German | 84 | 26.8% |
| Hungarian | 4 | 1.3% |
| Irish | 154 | 49.0% |
| Italian | 19 | 6.0% |
| Mexican | 3 | 1.0% |
| Polish | 5 | 1.6% |
| Scotch-Irish | 1 | 0.3% |
| Slovak | 28 | 8.9% |
| Spaniard | 2 | 0.6% |
| Swedish | 16 | 5.1% | View All 17 Rows |
Immigrants in Vanderbilt borough
The most numerous immigrant groups reported in Vanderbilt borough came from , and Canada (5 | 1.6%), together accounting for 1.6% of all Vanderbilt borough residents.

| Immigration Origin | # Population | % Population |
| Canada | 5 | 1.6% | View All 1 Rows |
Sex and Age in Vanderbilt borough
Sex and Age in Vanderbilt borough
The most populous age groups in Vanderbilt borough are 50 to 54 Years (20 | 12.4%) for men and 30 to 34 Years (21 | 13.7%) for women.
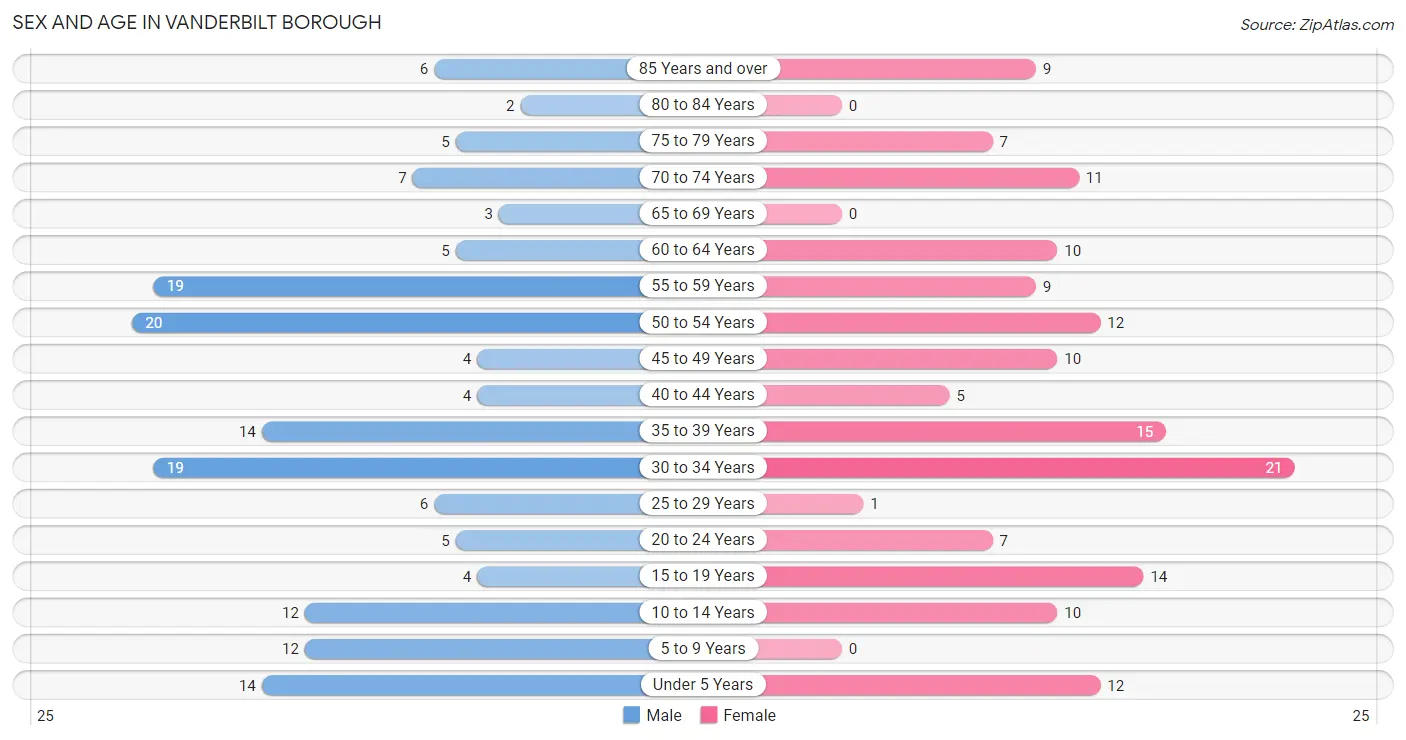
| Age Bracket | Male | Female |
| Under 5 Years | 14 (8.7%) | 12 (7.8%) |
| 5 to 9 Years | 12 (7.4%) | 0 (0.0%) |
| 10 to 14 Years | 12 (7.4%) | 10 (6.5%) |
| 15 to 19 Years | 4 (2.5%) | 14 (9.1%) |
| 20 to 24 Years | 5 (3.1%) | 7 (4.6%) |
| 25 to 29 Years | 6 (3.7%) | 1 (0.6%) |
| 30 to 34 Years | 19 (11.8%) | 21 (13.7%) |
| 35 to 39 Years | 14 (8.7%) | 15 (9.8%) |
| 40 to 44 Years | 4 (2.5%) | 5 (3.3%) |
| 45 to 49 Years | 4 (2.5%) | 10 (6.5%) |
| 50 to 54 Years | 20 (12.4%) | 12 (7.8%) |
| 55 to 59 Years | 19 (11.8%) | 9 (5.9%) |
| 60 to 64 Years | 5 (3.1%) | 10 (6.5%) |
| 65 to 69 Years | 3 (1.9%) | 0 (0.0%) |
| 70 to 74 Years | 7 (4.3%) | 11 (7.2%) |
| 75 to 79 Years | 5 (3.1%) | 7 (4.6%) |
| 80 to 84 Years | 2 (1.2%) | 0 (0.0%) |
| 85 Years and over | 6 (3.7%) | 9 (5.9%) |
| Total | 161 (100.0%) | 153 (100.0%) |
Families and Households in Vanderbilt borough
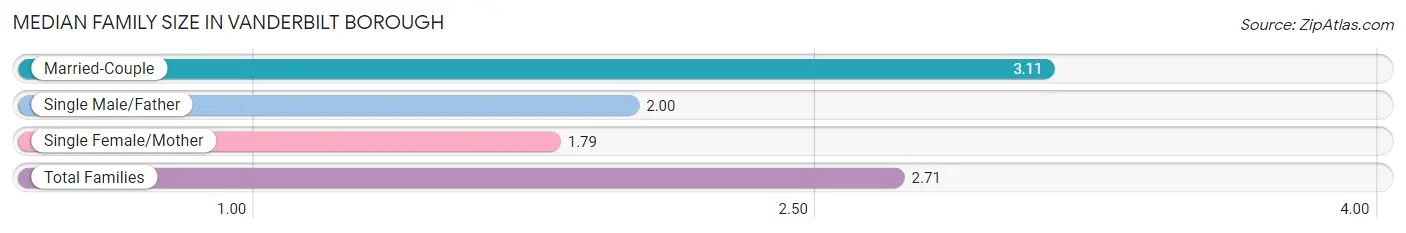
Median Family Size in Vanderbilt borough
The median family size in Vanderbilt borough is 2.71 persons per family, with married-couple families (64 | 68.1%) accounting for the largest median family size of 3.11 persons per family. On the other hand, single female/mother families (19 | 20.2%) represent the smallest median family size with 1.79 persons per family.
| Family Type | # Families | Family Size |
| Married-Couple | 64 (68.1%) | 3.11 |
| Single Male/Father | 11 (11.7%) | 2.00 |
| Single Female/Mother | 19 (20.2%) | 1.79 |
| Total Families | 94 (100.0%) | 2.71 |
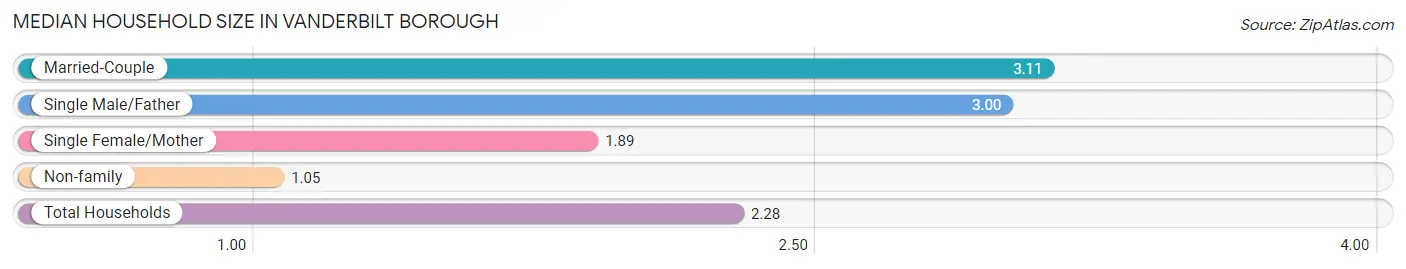
Median Household Size in Vanderbilt borough
The median household size in Vanderbilt borough is 2.28 persons per household, with married-couple households (64 | 46.4%) accounting for the largest median household size of 3.11 persons per household. non-family households (44 | 31.9%) represent the smallest median household size with 1.05 persons per household.
| Household Type | # Households | Household Size |
| Married-Couple | 64 (46.4%) | 3.11 |
| Single Male/Father | 11 (8.0%) | 3.00 |
| Single Female/Mother | 19 (13.8%) | 1.89 |
| Non-family | 44 (31.9%) | 1.05 |
| Total Households | 138 (100.0%) | 2.28 |
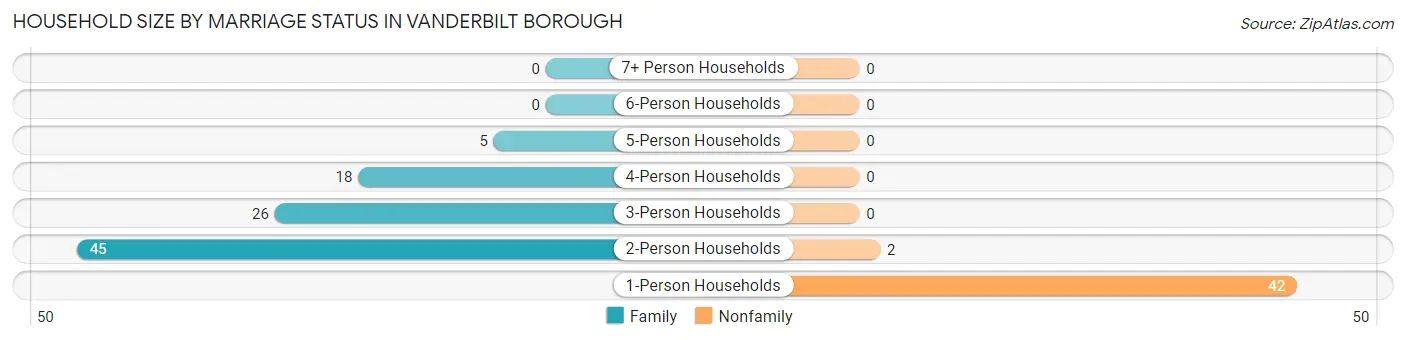
Household Size by Marriage Status in Vanderbilt borough
Out of a total of 138 households in Vanderbilt borough, 94 (68.1%) are family households, while 44 (31.9%) are nonfamily households. The most numerous type of family households are 2-person households, comprising 45, and the most common type of nonfamily households are 1-person households, comprising 42.
| Household Size | Family Households | Nonfamily Households |
| 1-Person Households | - | 42 (30.4%) |
| 2-Person Households | 45 (32.6%) | 2 (1.5%) |
| 3-Person Households | 26 (18.8%) | 0 (0.0%) |
| 4-Person Households | 18 (13.0%) | 0 (0.0%) |
| 5-Person Households | 5 (3.6%) | 0 (0.0%) |
| 6-Person Households | 0 (0.0%) | 0 (0.0%) |
| 7+ Person Households | 0 (0.0%) | 0 (0.0%) |
| Total | 94 (68.1%) | 44 (31.9%) |
Female Fertility in Vanderbilt borough
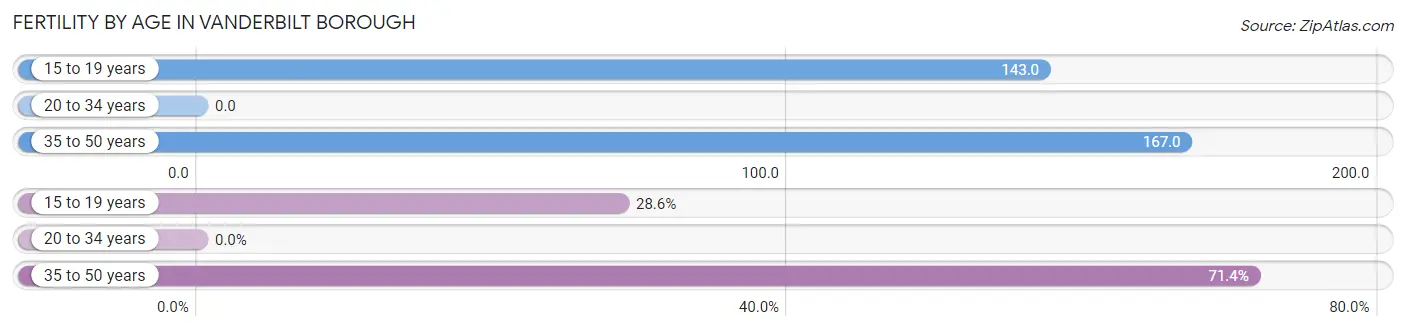
Fertility by Age in Vanderbilt borough
Average fertility rate in Vanderbilt borough is 96.0 births per 1,000 women. Women in the age bracket of 35 to 50 years have the highest fertility rate with 167.0 births per 1,000 women. Women in the age bracket of 35 to 50 years acount for 71.4% of all women with births.
| Age Bracket | Women with Births | Births / 1,000 Women |
| 15 to 19 years | 2 (28.6%) | 143.0 |
| 20 to 34 years | 0 (0.0%) | 0.0 |
| 35 to 50 years | 5 (71.4%) | 167.0 |
| Total | 7 (100.0%) | 96.0 |
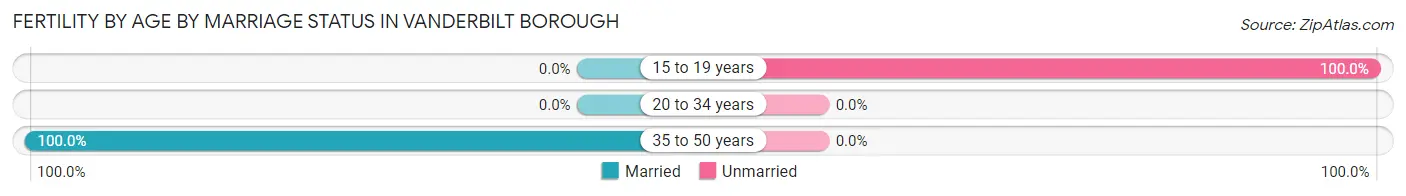
Fertility by Age by Marriage Status in Vanderbilt borough
71.4% of women with births (7) in Vanderbilt borough are married. The highest percentage of unmarried women with births falls into 15 to 19 years age bracket with 100.0% of them unmarried at the time of birth, while the lowest percentage of unmarried women with births belong to 35 to 50 years age bracket with 0.0% of them unmarried.
| Age Bracket | Married | Unmarried |
| 15 to 19 years | 0 (0.0%) | 2 (100.0%) |
| 20 to 34 years | 0 (0.0%) | 0 (0.0%) |
| 35 to 50 years | 5 (100.0%) | 0 (0.0%) |
| Total | 5 (71.4%) | 2 (28.6%) |
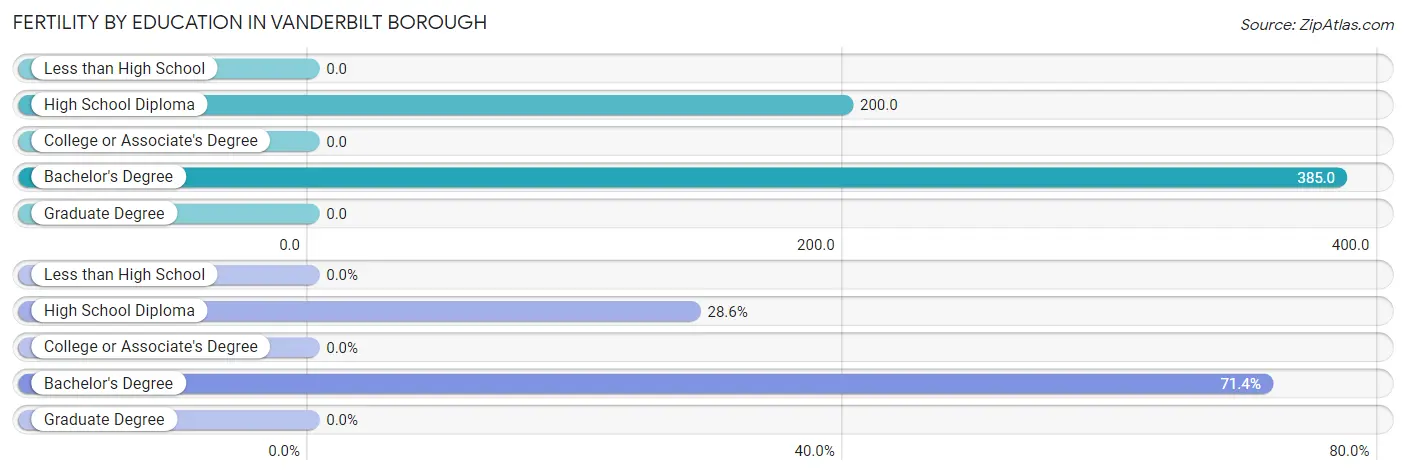
Fertility by Education in Vanderbilt borough
| Educational Attainment | Women with Births | Births / 1,000 Women |
| Less than High School | 0 (0.0%) | 0.0 |
| High School Diploma | 2 (28.6%) | 200.0 |
| College or Associate's Degree | 0 (0.0%) | 0.0 |
| Bachelor's Degree | 5 (71.4%) | 385.0 |
| Graduate Degree | 0 (0.0%) | 0.0 |
| Total | 7 (100.0%) | 96.0 |
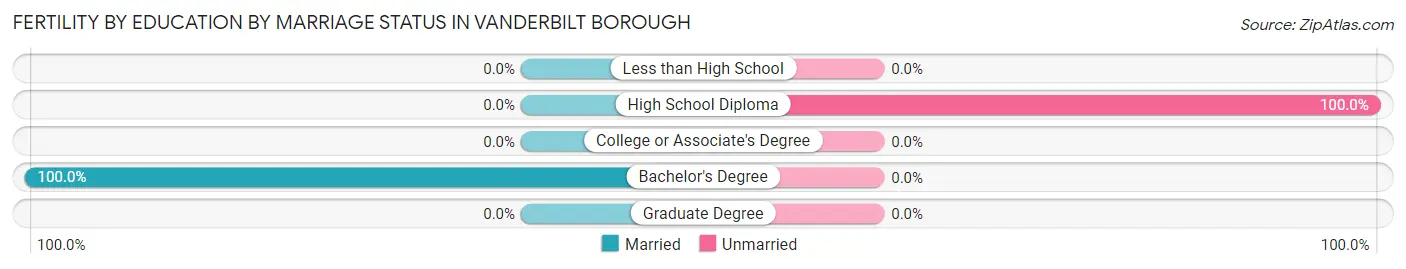
Fertility by Education by Marriage Status in Vanderbilt borough
28.6% of women with births in Vanderbilt borough are unmarried. Women with the educational attainment of bachelor's degree are most likely to be married with 100.0% of them married at childbirth, while women with the educational attainment of high school diploma are least likely to be married with 100.0% of them unmarried at childbirth.
| Educational Attainment | Married | Unmarried |
| Less than High School | 0 (0.0%) | 0 (0.0%) |
| High School Diploma | 0 (0.0%) | 2 (100.0%) |
| College or Associate's Degree | 0 (0.0%) | 0 (0.0%) |
| Bachelor's Degree | 5 (100.0%) | 0 (0.0%) |
| Graduate Degree | 0 (0.0%) | 0 (0.0%) |
| Total | 5 (71.4%) | 2 (28.6%) |
Employment Characteristics in Vanderbilt borough
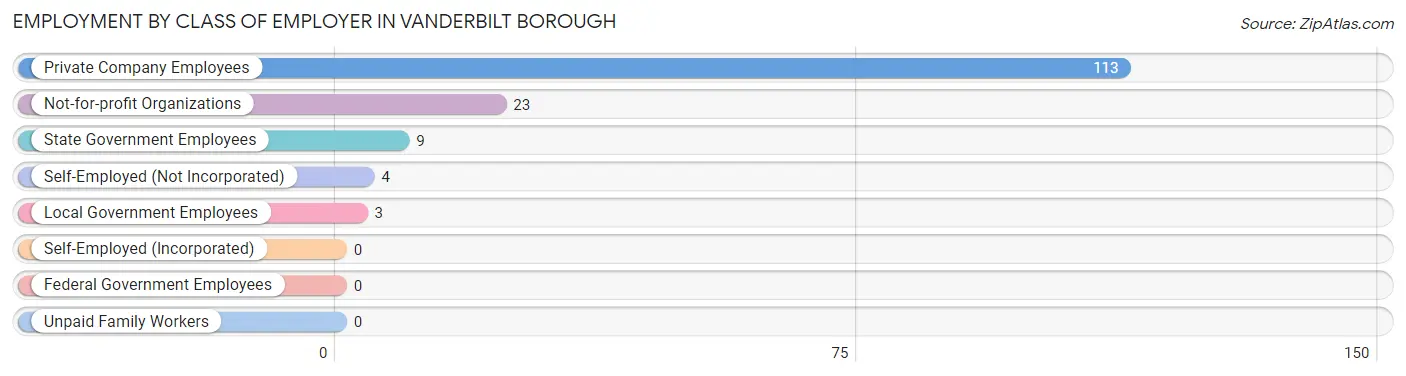
Employment by Class of Employer in Vanderbilt borough
Among the 152 employed individuals in Vanderbilt borough, private company employees (113 | 74.3%), not-for-profit organizations (23 | 15.1%), and state government employees (9 | 5.9%) make up the most common classes of employment.
| Employer Class | # Employees | % Employees |
| Private Company Employees | 113 | 74.3% |
| Self-Employed (Incorporated) | 0 | 0.0% |
| Self-Employed (Not Incorporated) | 4 | 2.6% |
| Not-for-profit Organizations | 23 | 15.1% |
| Local Government Employees | 3 | 2.0% |
| State Government Employees | 9 | 5.9% |
| Federal Government Employees | 0 | 0.0% |
| Unpaid Family Workers | 0 | 0.0% |
| Total | 152 | 100.0% |
Employment Status by Age in Vanderbilt borough
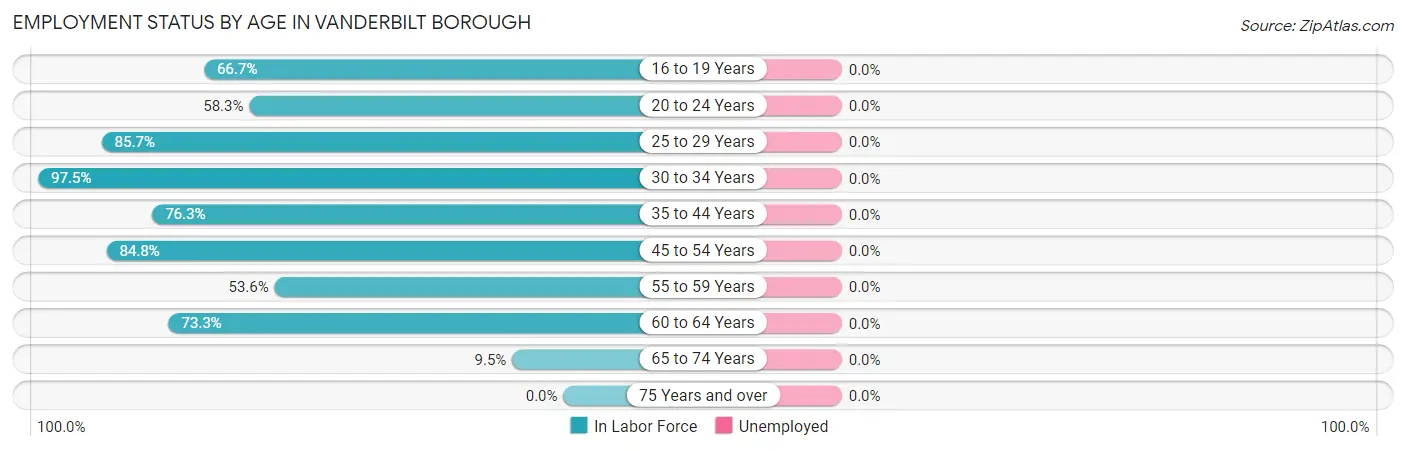
| Age Bracket | In Labor Force | Unemployed |
| 16 to 19 Years | 4 (66.7%) | 0 (0.0%) |
| 20 to 24 Years | 7 (58.3%) | 0 (0.0%) |
| 25 to 29 Years | 6 (85.7%) | 0 (0.0%) |
| 30 to 34 Years | 39 (97.5%) | 0 (0.0%) |
| 35 to 44 Years | 29 (76.3%) | 0 (0.0%) |
| 45 to 54 Years | 39 (84.8%) | 0 (0.0%) |
| 55 to 59 Years | 15 (53.6%) | 0 (0.0%) |
| 60 to 64 Years | 11 (73.3%) | 0 (0.0%) |
| 65 to 74 Years | 2 (9.5%) | 0 (0.0%) |
| 75 Years and over | 0 (0.0%) | 0 (0.0%) |
| Total | 152 (62.8%) | 0 (0.0%) |
Employment Status by Educational Attainment in Vanderbilt borough
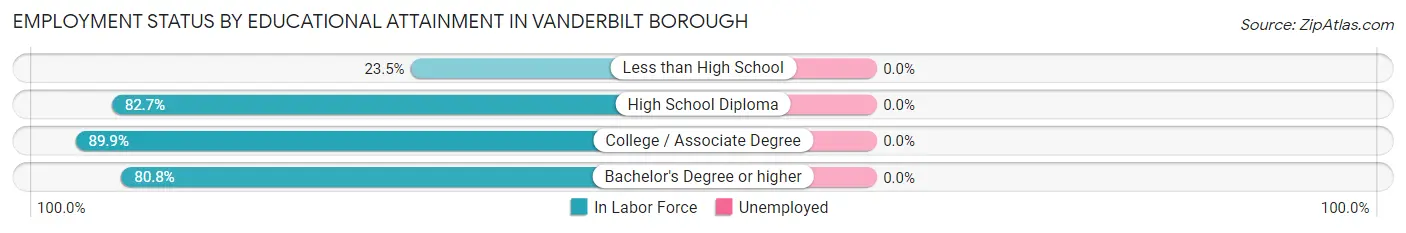
| Educational Attainment | In Labor Force | Unemployed |
| Less than High School | 4 (23.5%) | 0 (0.0%) |
| High School Diploma | 43 (82.7%) | 0 (0.0%) |
| College / Associate Degree | 71 (89.9%) | 0 (0.0%) |
| Bachelor's Degree or higher | 21 (80.8%) | 0 (0.0%) |
| Total | 139 (79.9%) | 0 (0.0%) |
Employment Occupations by Sex in Vanderbilt borough
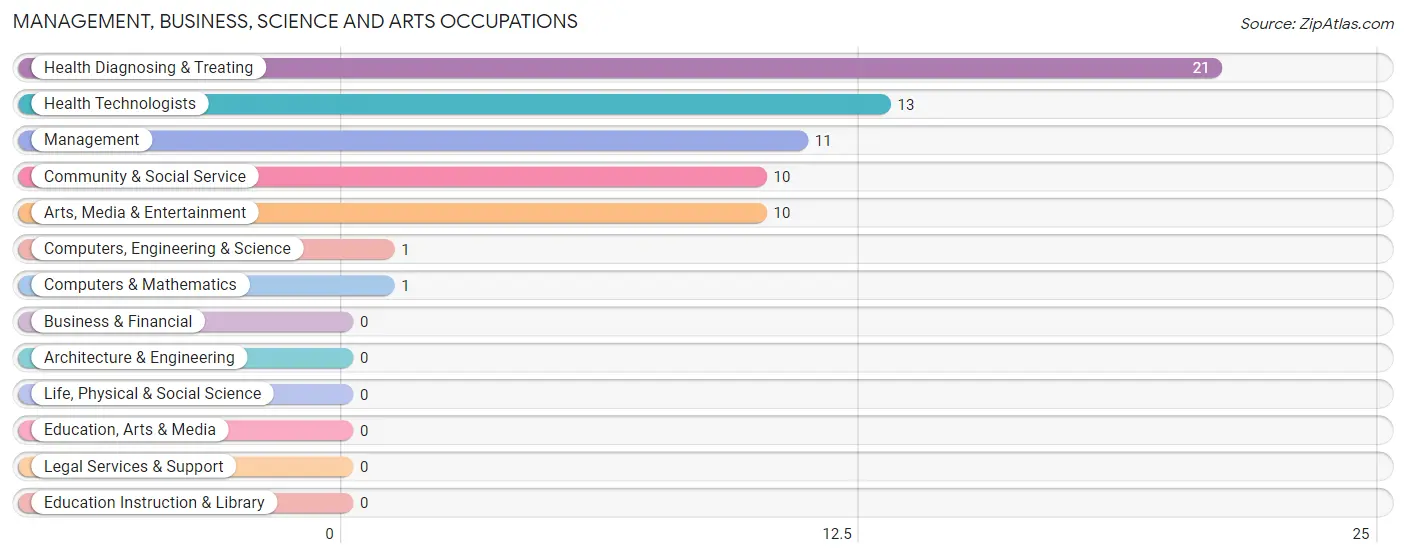
Management, Business, Science and Arts Occupations
The most common Management, Business, Science and Arts occupations in Vanderbilt borough are Health Diagnosing & Treating (21 | 13.8%), Health Technologists (13 | 8.6%), Management (11 | 7.2%), Community & Social Service (10 | 6.6%), and Arts, Media & Entertainment (10 | 6.6%).
Management, Business, Science and Arts Occupations by Sex
Within the Management, Business, Science and Arts occupations in Vanderbilt borough, the most male-oriented occupations are Computers, Engineering & Science (100.0%), Computers & Mathematics (100.0%), and Management (45.5%), while the most female-oriented occupations are Community & Social Service (100.0%), Arts, Media & Entertainment (100.0%), and Health Technologists (100.0%).
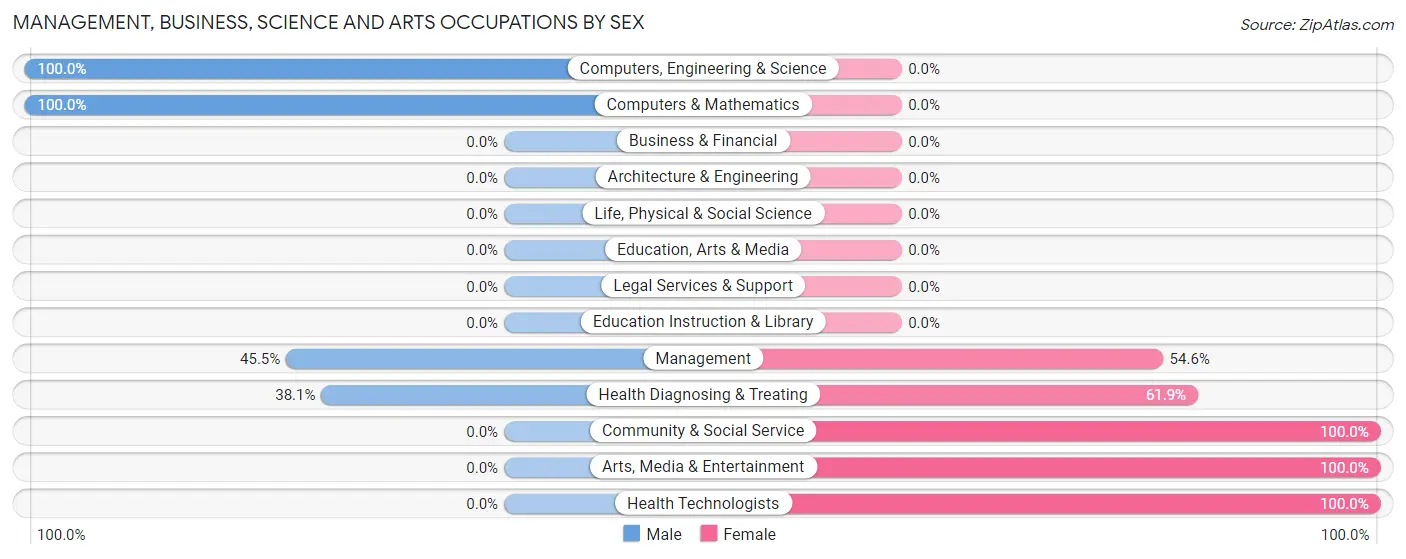
| Occupation | Male | Female |
| Management | 5 (45.5%) | 6 (54.5%) |
| Business & Financial | 0 (0.0%) | 0 (0.0%) |
| Computers, Engineering & Science | 1 (100.0%) | 0 (0.0%) |
| Computers & Mathematics | 1 (100.0%) | 0 (0.0%) |
| Architecture & Engineering | 0 (0.0%) | 0 (0.0%) |
| Life, Physical & Social Science | 0 (0.0%) | 0 (0.0%) |
| Community & Social Service | 0 (0.0%) | 10 (100.0%) |
| Education, Arts & Media | 0 (0.0%) | 0 (0.0%) |
| Legal Services & Support | 0 (0.0%) | 0 (0.0%) |
| Education Instruction & Library | 0 (0.0%) | 0 (0.0%) |
| Arts, Media & Entertainment | 0 (0.0%) | 10 (100.0%) |
| Health Diagnosing & Treating | 8 (38.1%) | 13 (61.9%) |
| Health Technologists | 0 (0.0%) | 13 (100.0%) |
| Total (Category) | 14 (32.6%) | 29 (67.4%) |
| Total (Overall) | 80 (52.6%) | 72 (47.4%) |
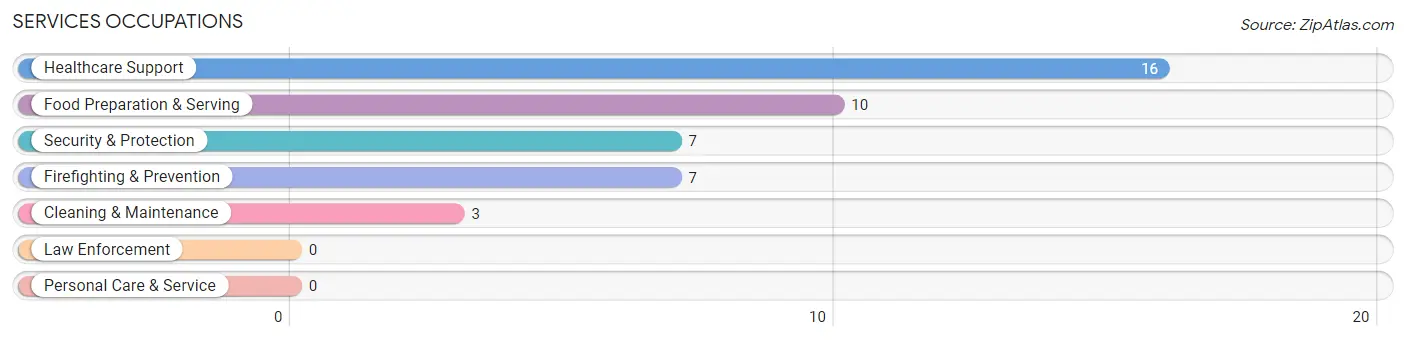
Services Occupations
The most common Services occupations in Vanderbilt borough are Healthcare Support (16 | 10.5%), Food Preparation & Serving (10 | 6.6%), Security & Protection (7 | 4.6%), Firefighting & Prevention (7 | 4.6%), and Cleaning & Maintenance (3 | 2.0%).
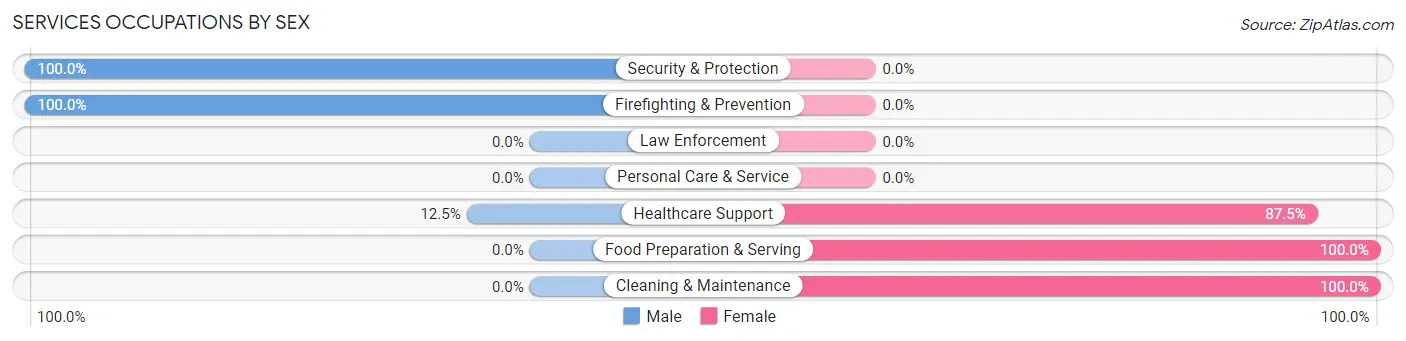
Services Occupations by Sex
Within the Services occupations in Vanderbilt borough, the most male-oriented occupations are Security & Protection (100.0%), Firefighting & Prevention (100.0%), and Healthcare Support (12.5%), while the most female-oriented occupations are Food Preparation & Serving (100.0%), Cleaning & Maintenance (100.0%), and Healthcare Support (87.5%).
| Occupation | Male | Female |
| Healthcare Support | 2 (12.5%) | 14 (87.5%) |
| Security & Protection | 7 (100.0%) | 0 (0.0%) |
| Firefighting & Prevention | 7 (100.0%) | 0 (0.0%) |
| Law Enforcement | 0 (0.0%) | 0 (0.0%) |
| Food Preparation & Serving | 0 (0.0%) | 10 (100.0%) |
| Cleaning & Maintenance | 0 (0.0%) | 3 (100.0%) |
| Personal Care & Service | 0 (0.0%) | 0 (0.0%) |
| Total (Category) | 9 (25.0%) | 27 (75.0%) |
| Total (Overall) | 80 (52.6%) | 72 (47.4%) |
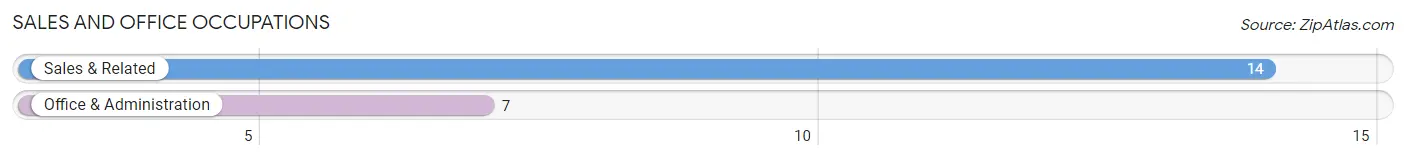
Sales and Office Occupations
The most common Sales and Office occupations in Vanderbilt borough are Sales & Related (14 | 9.2%), and Office & Administration (7 | 4.6%).
Sales and Office Occupations by Sex
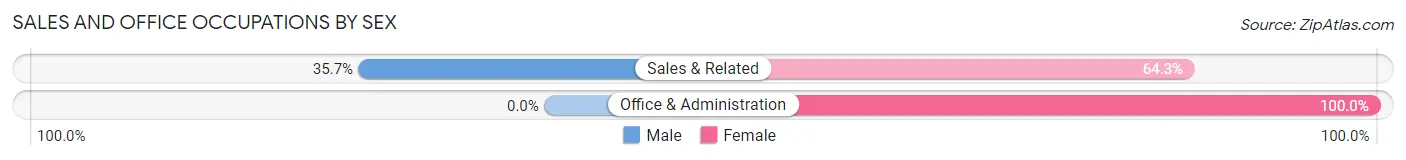
| Occupation | Male | Female |
| Sales & Related | 5 (35.7%) | 9 (64.3%) |
| Office & Administration | 0 (0.0%) | 7 (100.0%) |
| Total (Category) | 5 (23.8%) | 16 (76.2%) |
| Total (Overall) | 80 (52.6%) | 72 (47.4%) |
Natural Resources, Construction and Maintenance Occupations
The most common Natural Resources, Construction and Maintenance occupations in Vanderbilt borough are , and Construction & Extraction (16 | 10.5%).
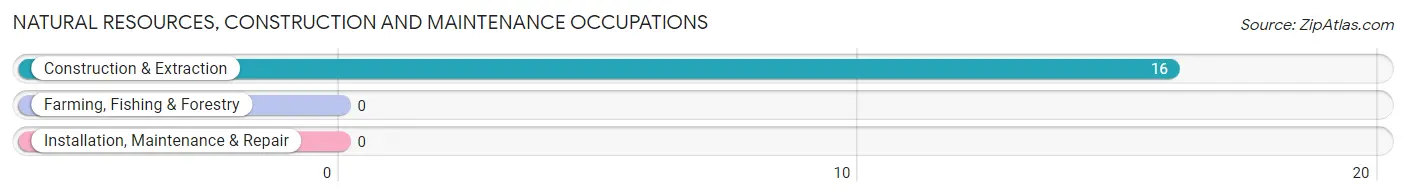
Natural Resources, Construction and Maintenance Occupations by Sex
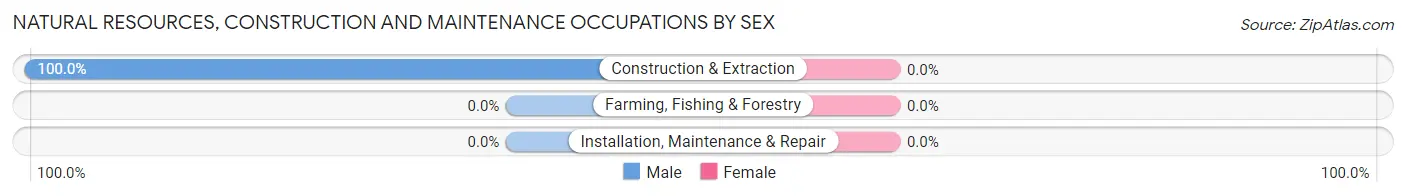
| Occupation | Male | Female |
| Farming, Fishing & Forestry | 0 (0.0%) | 0 (0.0%) |
| Construction & Extraction | 16 (100.0%) | 0 (0.0%) |
| Installation, Maintenance & Repair | 0 (0.0%) | 0 (0.0%) |
| Total (Category) | 16 (100.0%) | 0 (0.0%) |
| Total (Overall) | 80 (52.6%) | 72 (47.4%) |
Production, Transportation and Moving Occupations
The most common Production, Transportation and Moving occupations in Vanderbilt borough are Transportation (21 | 13.8%), Material Moving (11 | 7.2%), and Production (4 | 2.6%).
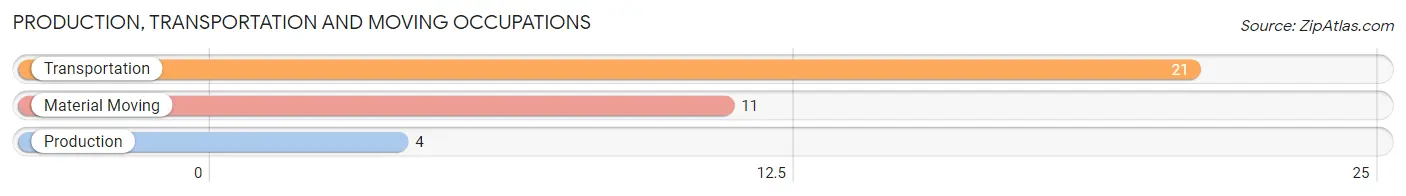
Production, Transportation and Moving Occupations by Sex
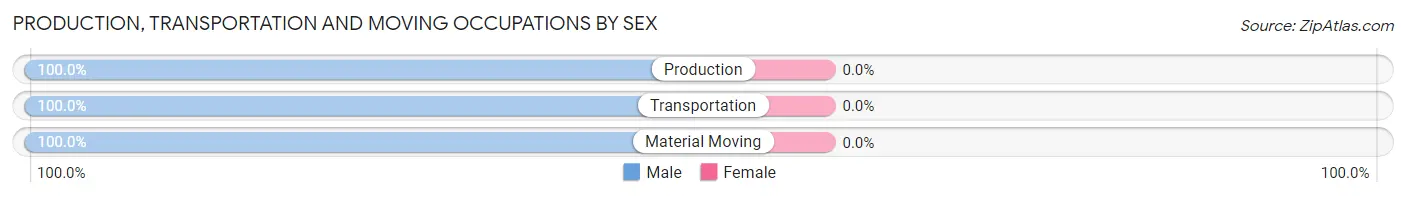
| Occupation | Male | Female |
| Production | 4 (100.0%) | 0 (0.0%) |
| Transportation | 21 (100.0%) | 0 (0.0%) |
| Material Moving | 11 (100.0%) | 0 (0.0%) |
| Total (Category) | 36 (100.0%) | 0 (0.0%) |
| Total (Overall) | 80 (52.6%) | 72 (47.4%) |
Employment Industries by Sex in Vanderbilt borough
Employment Industries in Vanderbilt borough
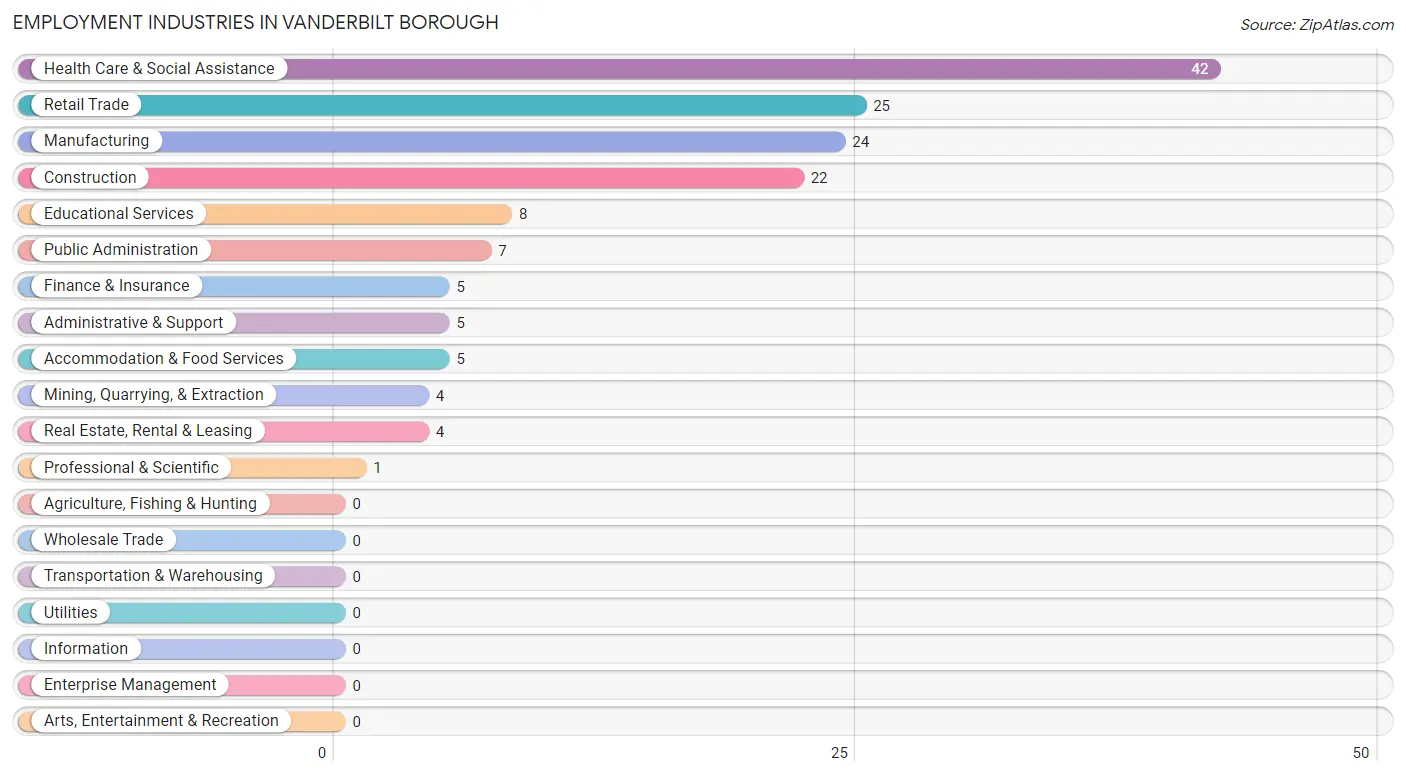
The major employment industries in Vanderbilt borough include Health Care & Social Assistance (42 | 27.6%), Retail Trade (25 | 16.5%), Manufacturing (24 | 15.8%), Construction (22 | 14.5%), and Educational Services (8 | 5.3%).
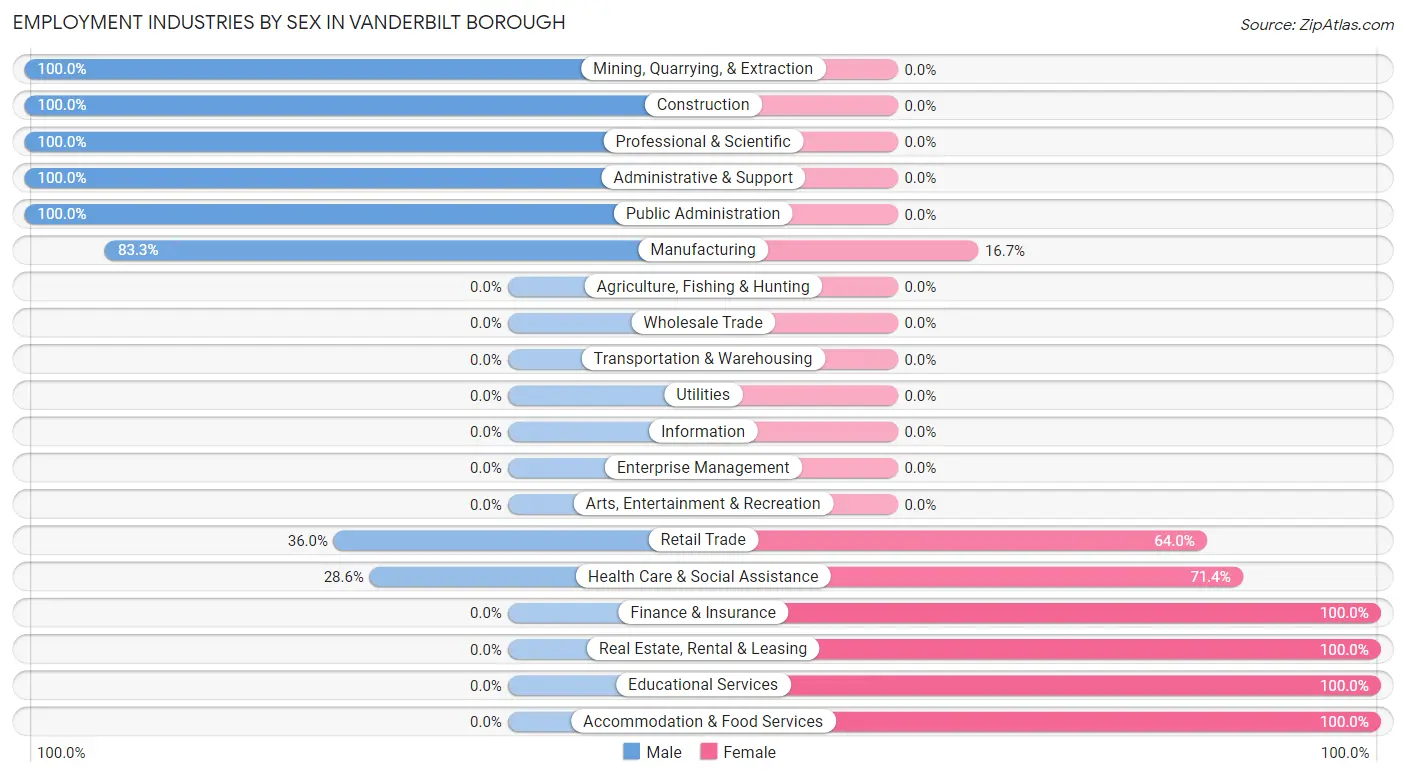
Employment Industries by Sex in Vanderbilt borough
The Vanderbilt borough industries that see more men than women are Mining, Quarrying, & Extraction (100.0%), Construction (100.0%), and Professional & Scientific (100.0%), whereas the industries that tend to have a higher number of women are Finance & Insurance (100.0%), Real Estate, Rental & Leasing (100.0%), and Educational Services (100.0%).
| Industry | Male | Female |
| Agriculture, Fishing & Hunting | 0 (0.0%) | 0 (0.0%) |
| Mining, Quarrying, & Extraction | 4 (100.0%) | 0 (0.0%) |
| Construction | 22 (100.0%) | 0 (0.0%) |
| Manufacturing | 20 (83.3%) | 4 (16.7%) |
| Wholesale Trade | 0 (0.0%) | 0 (0.0%) |
| Retail Trade | 9 (36.0%) | 16 (64.0%) |
| Transportation & Warehousing | 0 (0.0%) | 0 (0.0%) |
| Utilities | 0 (0.0%) | 0 (0.0%) |
| Information | 0 (0.0%) | 0 (0.0%) |
| Finance & Insurance | 0 (0.0%) | 5 (100.0%) |
| Real Estate, Rental & Leasing | 0 (0.0%) | 4 (100.0%) |
| Professional & Scientific | 1 (100.0%) | 0 (0.0%) |
| Enterprise Management | 0 (0.0%) | 0 (0.0%) |
| Administrative & Support | 5 (100.0%) | 0 (0.0%) |
| Educational Services | 0 (0.0%) | 8 (100.0%) |
| Health Care & Social Assistance | 12 (28.6%) | 30 (71.4%) |
| Arts, Entertainment & Recreation | 0 (0.0%) | 0 (0.0%) |
| Accommodation & Food Services | 0 (0.0%) | 5 (100.0%) |
| Public Administration | 7 (100.0%) | 0 (0.0%) |
| Total | 80 (52.6%) | 72 (47.4%) |
Education in Vanderbilt borough
School Enrollment in Vanderbilt borough
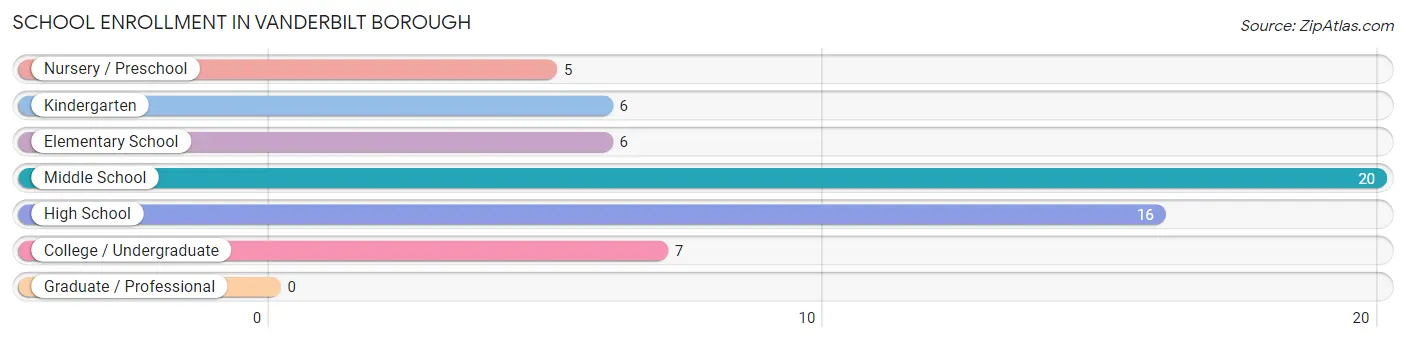
The most common levels of schooling among the 60 students in Vanderbilt borough are middle school (20 | 33.3%), high school (16 | 26.7%), and college / undergraduate (7 | 11.7%).
| School Level | # Students | % Students |
| Nursery / Preschool | 5 | 8.3% |
| Kindergarten | 6 | 10.0% |
| Elementary School | 6 | 10.0% |
| Middle School | 20 | 33.3% |
| High School | 16 | 26.7% |
| College / Undergraduate | 7 | 11.7% |
| Graduate / Professional | 0 | 0.0% |
| Total | 60 | 100.0% |
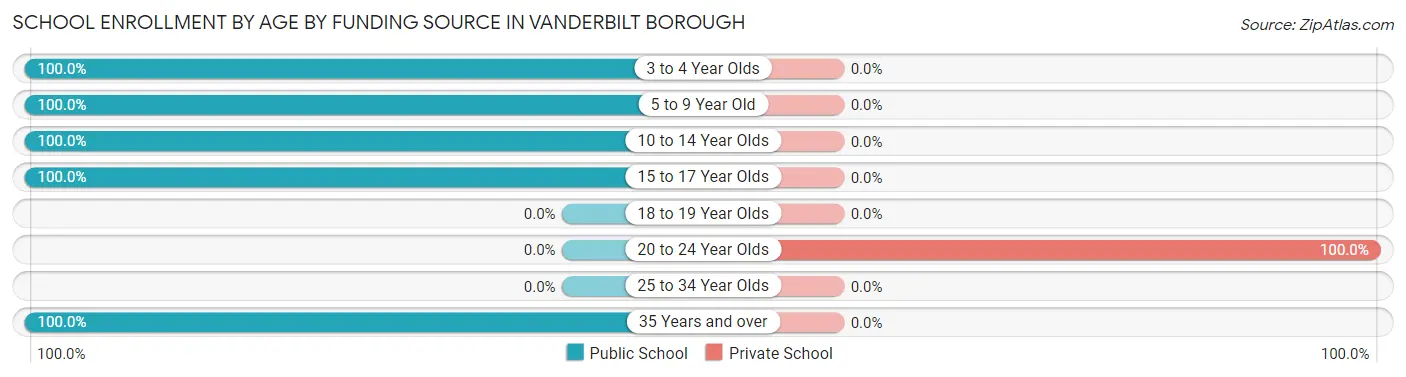
School Enrollment by Age by Funding Source in Vanderbilt borough
Out of a total of 60 students who are enrolled in schools in Vanderbilt borough, 5 (8.3%) attend a private institution, while the remaining 55 (91.7%) are enrolled in public schools. The age group of 20 to 24 year olds has the highest likelihood of being enrolled in private schools, with 5 (100.0% in the age bracket) enrolled. Conversely, the age group of 3 to 4 year olds has the lowest likelihood of being enrolled in a private school, with 5 (100.0% in the age bracket) attending a public institution.
| Age Bracket | Public School | Private School |
| 3 to 4 Year Olds | 5 (100.0%) | 0 (0.0%) |
| 5 to 9 Year Old | 12 (100.0%) | 0 (0.0%) |
| 10 to 14 Year Olds | 22 (100.0%) | 0 (0.0%) |
| 15 to 17 Year Olds | 14 (100.0%) | 0 (0.0%) |
| 18 to 19 Year Olds | 0 (0.0%) | 0 (0.0%) |
| 20 to 24 Year Olds | 0 (0.0%) | 5 (100.0%) |
| 25 to 34 Year Olds | 0 (0.0%) | 0 (0.0%) |
| 35 Years and over | 2 (100.0%) | 0 (0.0%) |
| Total | 55 (91.7%) | 5 (8.3%) |
Educational Attainment by Field of Study in Vanderbilt borough
Science & technology (12 | 33.3%), business (7 | 19.4%), arts & humanities (7 | 19.4%), bio, nature & agricultural (5 | 13.9%), and education (3 | 8.3%) are the most common fields of study among 36 individuals in Vanderbilt borough who have obtained a bachelor's degree or higher.
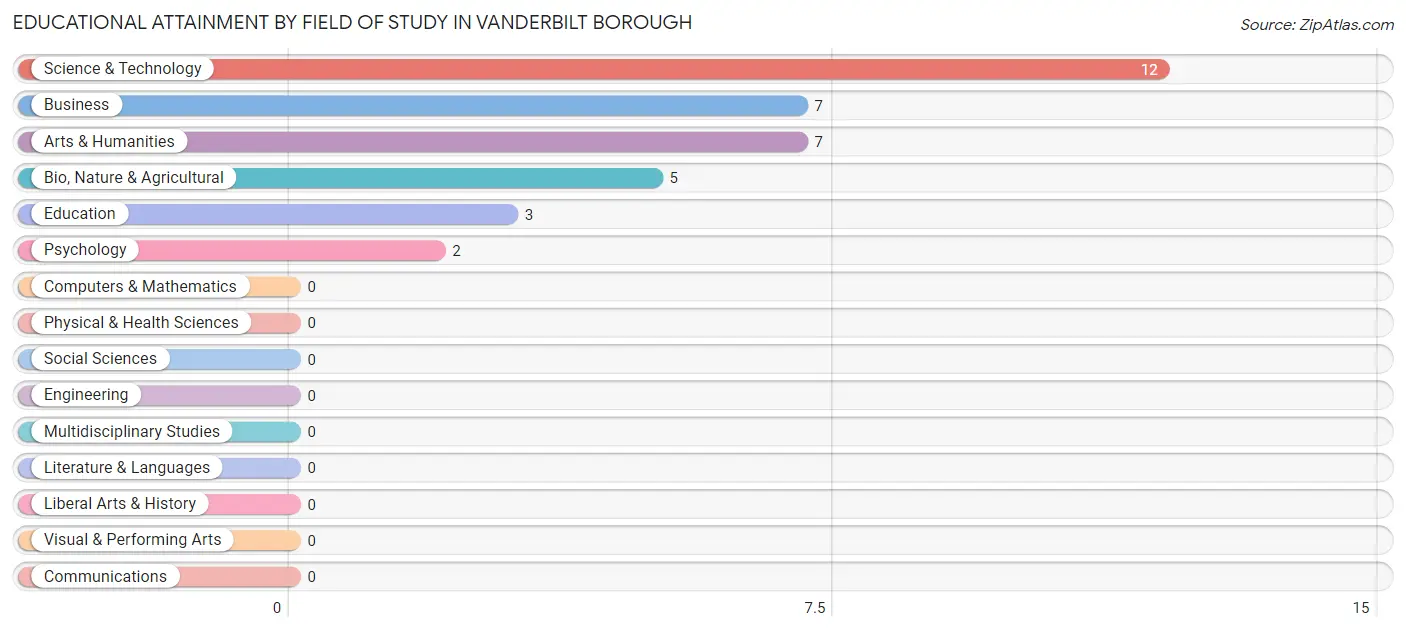
| Field of Study | # Graduates | % Graduates |
| Computers & Mathematics | 0 | 0.0% |
| Bio, Nature & Agricultural | 5 | 13.9% |
| Physical & Health Sciences | 0 | 0.0% |
| Psychology | 2 | 5.6% |
| Social Sciences | 0 | 0.0% |
| Engineering | 0 | 0.0% |
| Multidisciplinary Studies | 0 | 0.0% |
| Science & Technology | 12 | 33.3% |
| Business | 7 | 19.4% |
| Education | 3 | 8.3% |
| Literature & Languages | 0 | 0.0% |
| Liberal Arts & History | 0 | 0.0% |
| Visual & Performing Arts | 0 | 0.0% |
| Communications | 0 | 0.0% |
| Arts & Humanities | 7 | 19.4% |
| Total | 36 | 100.0% |
Transportation & Commute in Vanderbilt borough
Vehicle Availability by Sex in Vanderbilt borough
The most prevalent vehicle ownership categories in Vanderbilt borough are males with 2 vehicles (27, accounting for 33.8%) and females with 2 vehicles (26, making up 37.5%).
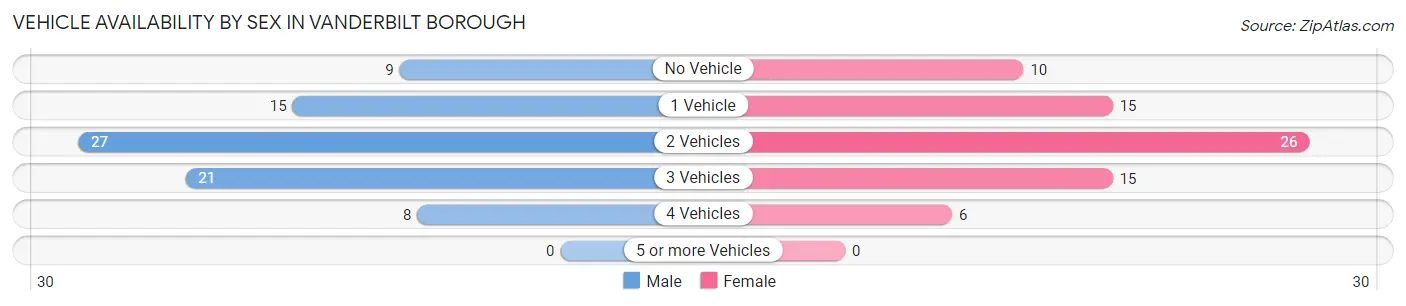
| Vehicles Available | Male | Female |
| No Vehicle | 9 (11.3%) | 10 (13.9%) |
| 1 Vehicle | 15 (18.8%) | 15 (20.8%) |
| 2 Vehicles | 27 (33.8%) | 26 (36.1%) |
| 3 Vehicles | 21 (26.3%) | 15 (20.8%) |
| 4 Vehicles | 8 (10.0%) | 6 (8.3%) |
| 5 or more Vehicles | 0 (0.0%) | 0 (0.0%) |
| Total | 80 (100.0%) | 72 (100.0%) |
Commute Time in Vanderbilt borough
The most frequently occuring commute durations in Vanderbilt borough are 20 to 24 minutes (26 commuters, 17.1%), 15 to 19 minutes (25 commuters, 16.5%), and 35 to 39 minutes (22 commuters, 14.5%).
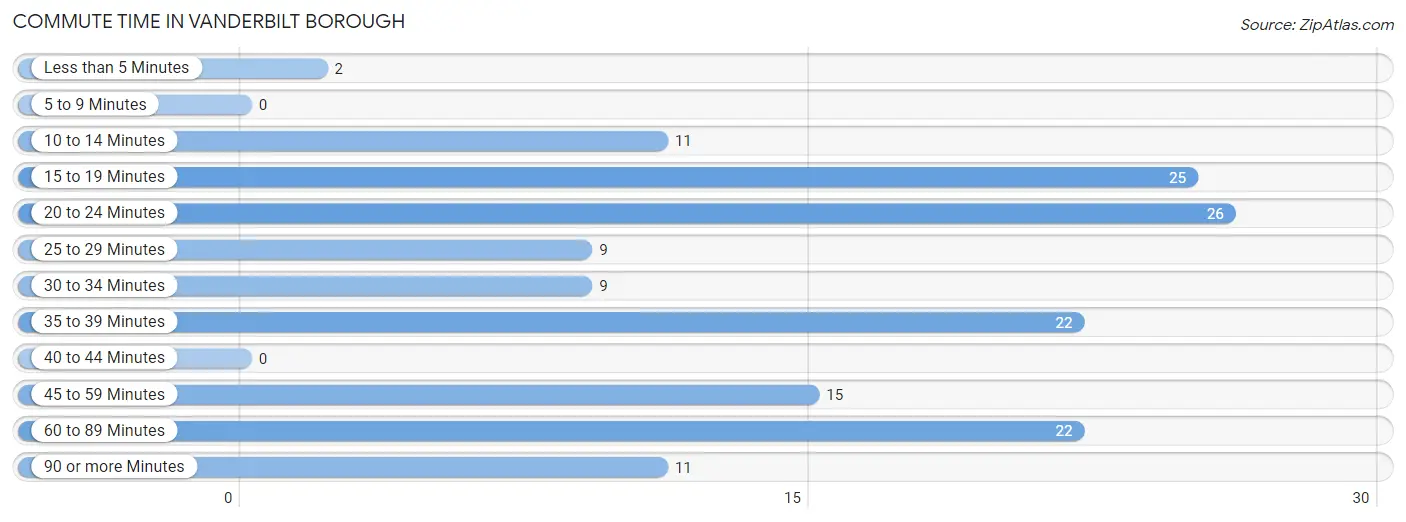
| Commute Time | # Commuters | % Commuters |
| Less than 5 Minutes | 2 | 1.3% |
| 5 to 9 Minutes | 0 | 0.0% |
| 10 to 14 Minutes | 11 | 7.2% |
| 15 to 19 Minutes | 25 | 16.5% |
| 20 to 24 Minutes | 26 | 17.1% |
| 25 to 29 Minutes | 9 | 5.9% |
| 30 to 34 Minutes | 9 | 5.9% |
| 35 to 39 Minutes | 22 | 14.5% |
| 40 to 44 Minutes | 0 | 0.0% |
| 45 to 59 Minutes | 15 | 9.9% |
| 60 to 89 Minutes | 22 | 14.5% |
| 90 or more Minutes | 11 | 7.2% |
Commute Time by Sex in Vanderbilt borough
The most common commute times in Vanderbilt borough are 60 to 89 minutes (15 commuters, 18.8%) for males and 15 to 19 minutes (14 commuters, 19.4%) for females.
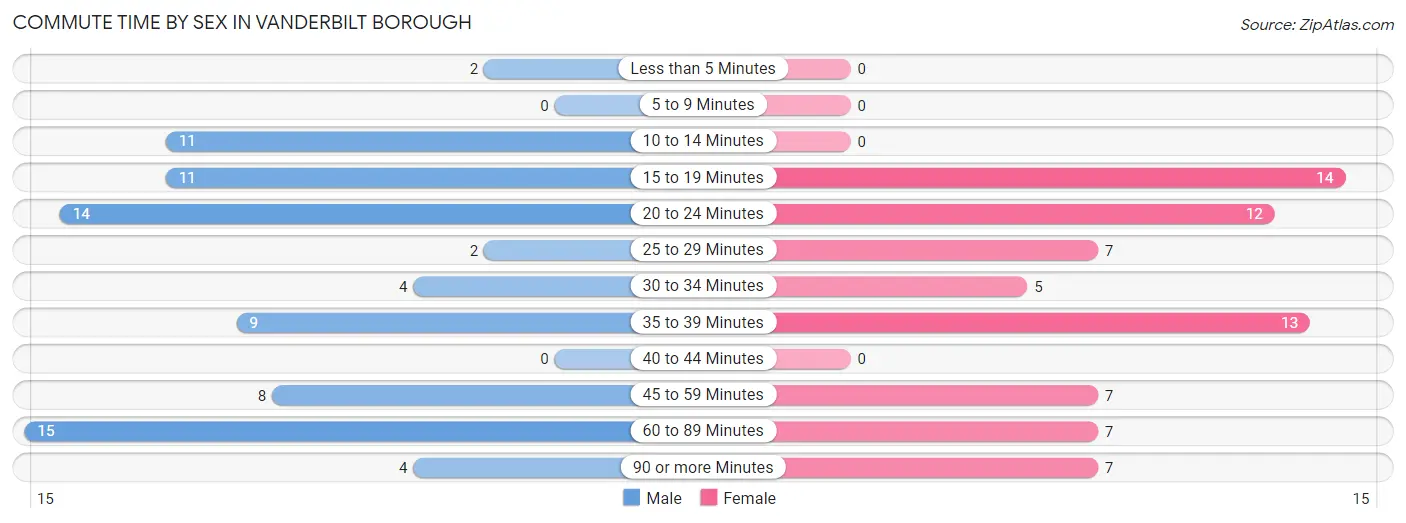
| Commute Time | Male | Female |
| Less than 5 Minutes | 2 (2.5%) | 0 (0.0%) |
| 5 to 9 Minutes | 0 (0.0%) | 0 (0.0%) |
| 10 to 14 Minutes | 11 (13.8%) | 0 (0.0%) |
| 15 to 19 Minutes | 11 (13.8%) | 14 (19.4%) |
| 20 to 24 Minutes | 14 (17.5%) | 12 (16.7%) |
| 25 to 29 Minutes | 2 (2.5%) | 7 (9.7%) |
| 30 to 34 Minutes | 4 (5.0%) | 5 (6.9%) |
| 35 to 39 Minutes | 9 (11.3%) | 13 (18.1%) |
| 40 to 44 Minutes | 0 (0.0%) | 0 (0.0%) |
| 45 to 59 Minutes | 8 (10.0%) | 7 (9.7%) |
| 60 to 89 Minutes | 15 (18.8%) | 7 (9.7%) |
| 90 or more Minutes | 4 (5.0%) | 7 (9.7%) |
Time of Departure to Work by Sex in Vanderbilt borough
The most frequent times of departure to work in Vanderbilt borough are 12:00 AM to 4:59 AM (28, 35.0%) for males and 7:30 AM to 7:59 AM (16, 22.2%) for females.
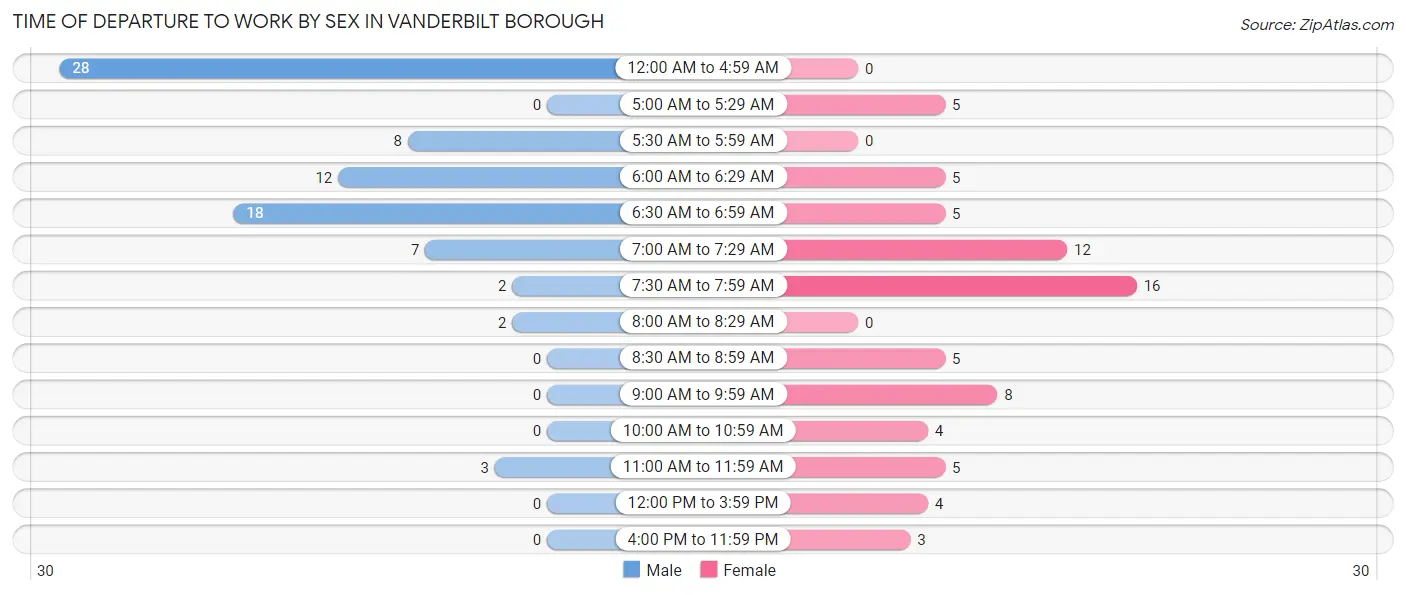
| Time of Departure | Male | Female |
| 12:00 AM to 4:59 AM | 28 (35.0%) | 0 (0.0%) |
| 5:00 AM to 5:29 AM | 0 (0.0%) | 5 (6.9%) |
| 5:30 AM to 5:59 AM | 8 (10.0%) | 0 (0.0%) |
| 6:00 AM to 6:29 AM | 12 (15.0%) | 5 (6.9%) |
| 6:30 AM to 6:59 AM | 18 (22.5%) | 5 (6.9%) |
| 7:00 AM to 7:29 AM | 7 (8.7%) | 12 (16.7%) |
| 7:30 AM to 7:59 AM | 2 (2.5%) | 16 (22.2%) |
| 8:00 AM to 8:29 AM | 2 (2.5%) | 0 (0.0%) |
| 8:30 AM to 8:59 AM | 0 (0.0%) | 5 (6.9%) |
| 9:00 AM to 9:59 AM | 0 (0.0%) | 8 (11.1%) |
| 10:00 AM to 10:59 AM | 0 (0.0%) | 4 (5.6%) |
| 11:00 AM to 11:59 AM | 3 (3.7%) | 5 (6.9%) |
| 12:00 PM to 3:59 PM | 0 (0.0%) | 4 (5.6%) |
| 4:00 PM to 11:59 PM | 0 (0.0%) | 3 (4.2%) |
| Total | 80 (100.0%) | 72 (100.0%) |
Housing Occupancy in Vanderbilt borough
Occupancy by Ownership in Vanderbilt borough
Of the total 138 dwellings in Vanderbilt borough, owner-occupied units account for 129 (93.5%), while renter-occupied units make up 9 (6.5%).
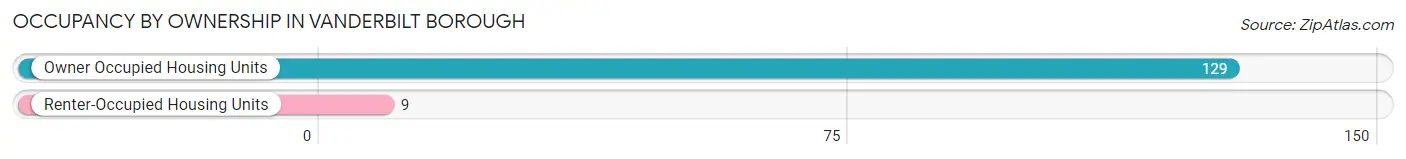
| Occupancy | # Housing Units | % Housing Units |
| Owner Occupied Housing Units | 129 | 93.5% |
| Renter-Occupied Housing Units | 9 | 6.5% |
| Total Occupied Housing Units | 138 | 100.0% |
Occupancy by Household Size in Vanderbilt borough
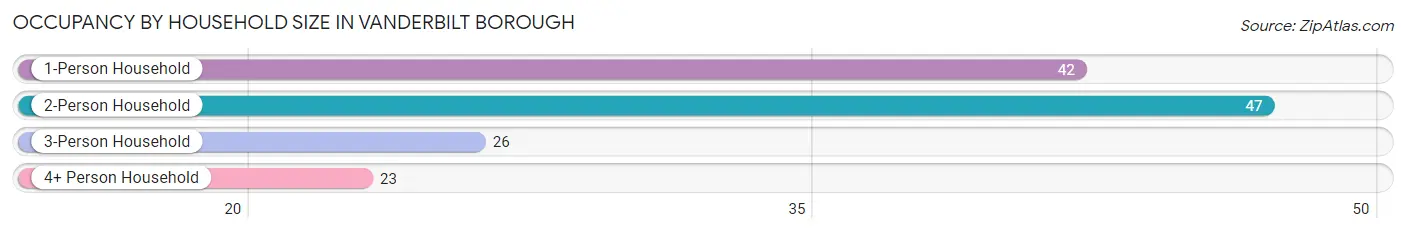
| Household Size | # Housing Units | % Housing Units |
| 1-Person Household | 42 | 30.4% |
| 2-Person Household | 47 | 34.1% |
| 3-Person Household | 26 | 18.8% |
| 4+ Person Household | 23 | 16.7% |
| Total Housing Units | 138 | 100.0% |
Occupancy by Ownership by Household Size in Vanderbilt borough
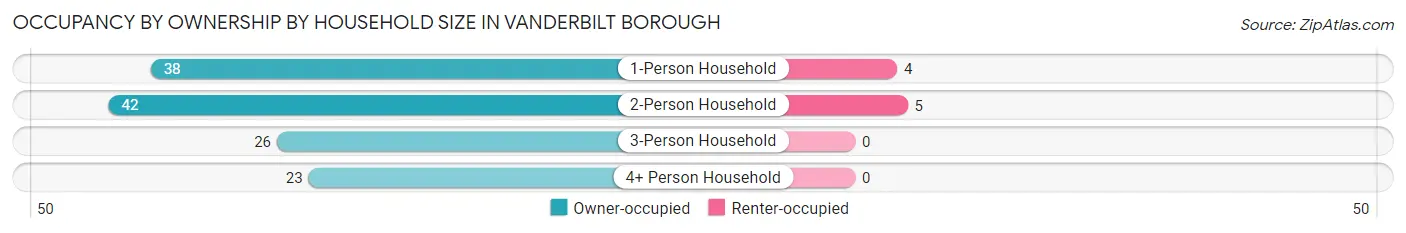
| Household Size | Owner-occupied | Renter-occupied |
| 1-Person Household | 38 (90.5%) | 4 (9.5%) |
| 2-Person Household | 42 (89.4%) | 5 (10.6%) |
| 3-Person Household | 26 (100.0%) | 0 (0.0%) |
| 4+ Person Household | 23 (100.0%) | 0 (0.0%) |
| Total Housing Units | 129 (93.5%) | 9 (6.5%) |
Occupancy by Educational Attainment in Vanderbilt borough
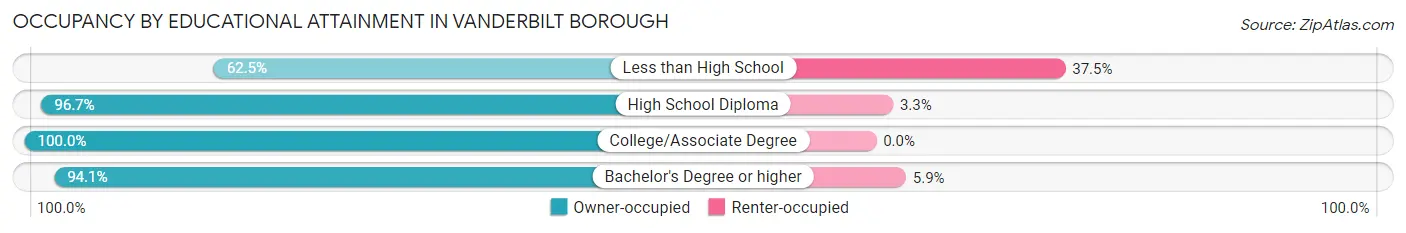
| Household Size | Owner-occupied | Renter-occupied |
| Less than High School | 10 (62.5%) | 6 (37.5%) |
| High School Diploma | 58 (96.7%) | 2 (3.3%) |
| College/Associate Degree | 45 (100.0%) | 0 (0.0%) |
| Bachelor's Degree or higher | 16 (94.1%) | 1 (5.9%) |
Occupancy by Age of Householder in Vanderbilt borough
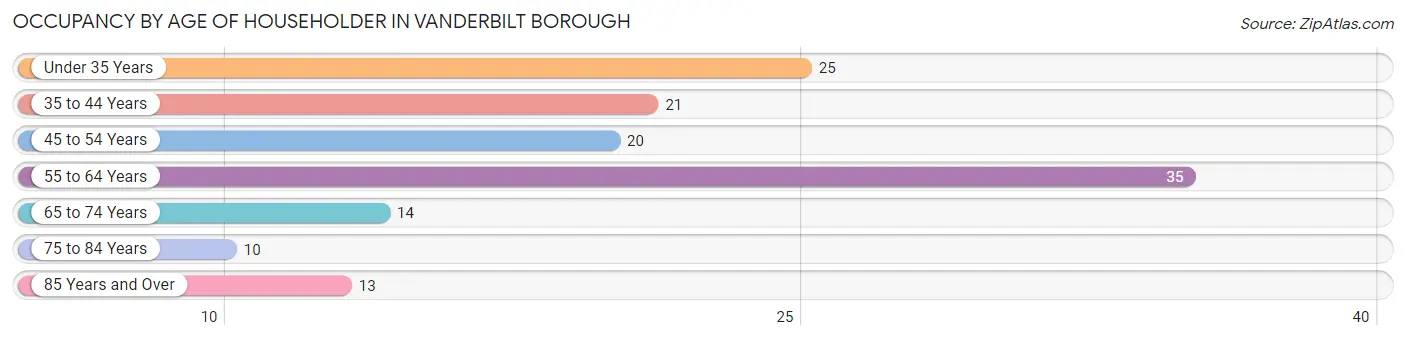
| Age Bracket | # Households | % Households |
| Under 35 Years | 25 | 18.1% |
| 35 to 44 Years | 21 | 15.2% |
| 45 to 54 Years | 20 | 14.5% |
| 55 to 64 Years | 35 | 25.4% |
| 65 to 74 Years | 14 | 10.1% |
| 75 to 84 Years | 10 | 7.2% |
| 85 Years and Over | 13 | 9.4% |
| Total | 138 | 100.0% |
Housing Finances in Vanderbilt borough
Median Income by Occupancy in Vanderbilt borough
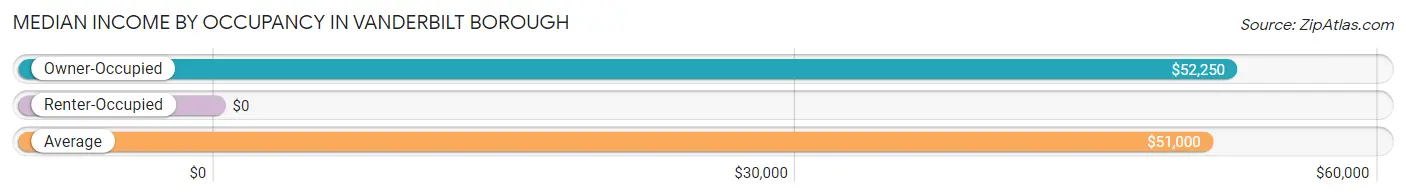
| Occupancy Type | # Households | Median Income |
| Owner-Occupied | 129 (93.5%) | $52,250 |
| Renter-Occupied | 9 (6.5%) | $0 |
| Average | 138 (100.0%) | $51,000 |
Occupancy by Householder Income Bracket in Vanderbilt borough
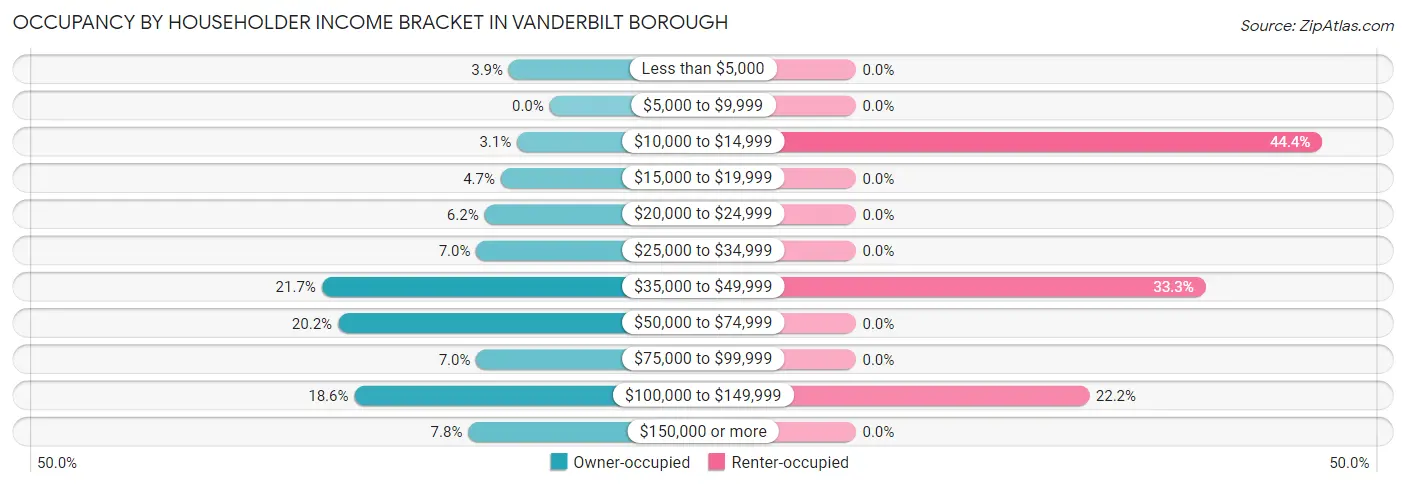
| Income Bracket | Owner-occupied | Renter-occupied |
| Less than $5,000 | 5 (3.9%) | 0 (0.0%) |
| $5,000 to $9,999 | 0 (0.0%) | 0 (0.0%) |
| $10,000 to $14,999 | 4 (3.1%) | 4 (44.4%) |
| $15,000 to $19,999 | 6 (4.6%) | 0 (0.0%) |
| $20,000 to $24,999 | 8 (6.2%) | 0 (0.0%) |
| $25,000 to $34,999 | 9 (7.0%) | 0 (0.0%) |
| $35,000 to $49,999 | 28 (21.7%) | 3 (33.3%) |
| $50,000 to $74,999 | 26 (20.2%) | 0 (0.0%) |
| $75,000 to $99,999 | 9 (7.0%) | 0 (0.0%) |
| $100,000 to $149,999 | 24 (18.6%) | 2 (22.2%) |
| $150,000 or more | 10 (7.7%) | 0 (0.0%) |
| Total | 129 (100.0%) | 9 (100.0%) |
Monthly Housing Cost Tiers in Vanderbilt borough
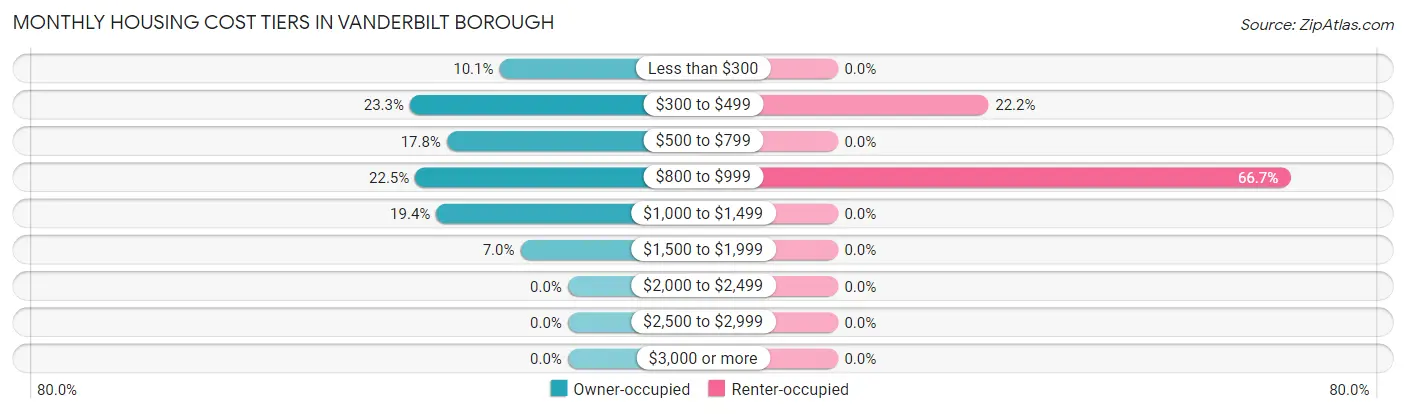
| Monthly Cost | Owner-occupied | Renter-occupied |
| Less than $300 | 13 (10.1%) | 0 (0.0%) |
| $300 to $499 | 30 (23.3%) | 2 (22.2%) |
| $500 to $799 | 23 (17.8%) | 0 (0.0%) |
| $800 to $999 | 29 (22.5%) | 6 (66.7%) |
| $1,000 to $1,499 | 25 (19.4%) | 0 (0.0%) |
| $1,500 to $1,999 | 9 (7.0%) | 0 (0.0%) |
| $2,000 to $2,499 | 0 (0.0%) | 0 (0.0%) |
| $2,500 to $2,999 | 0 (0.0%) | 0 (0.0%) |
| $3,000 or more | 0 (0.0%) | 0 (0.0%) |
| Total | 129 (100.0%) | 9 (100.0%) |
Physical Housing Characteristics in Vanderbilt borough
Housing Structures in Vanderbilt borough
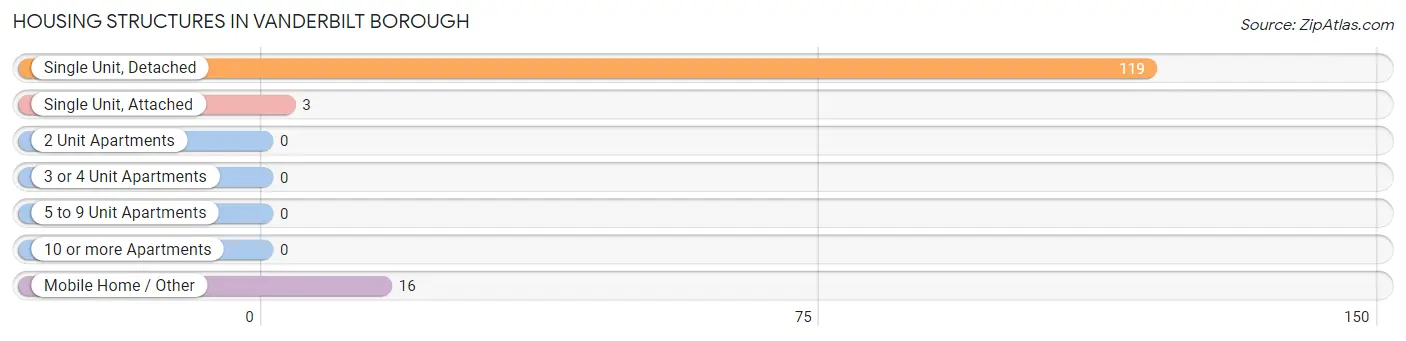
| Structure Type | # Housing Units | % Housing Units |
| Single Unit, Detached | 119 | 86.2% |
| Single Unit, Attached | 3 | 2.2% |
| 2 Unit Apartments | 0 | 0.0% |
| 3 or 4 Unit Apartments | 0 | 0.0% |
| 5 to 9 Unit Apartments | 0 | 0.0% |
| 10 or more Apartments | 0 | 0.0% |
| Mobile Home / Other | 16 | 11.6% |
| Total | 138 | 100.0% |
Housing Structures by Occupancy in Vanderbilt borough
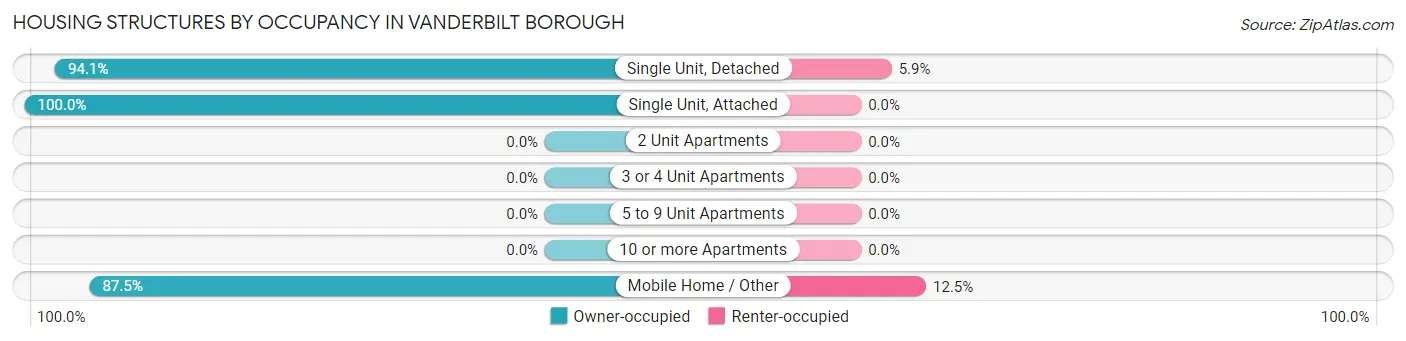
| Structure Type | Owner-occupied | Renter-occupied |
| Single Unit, Detached | 112 (94.1%) | 7 (5.9%) |
| Single Unit, Attached | 3 (100.0%) | 0 (0.0%) |
| 2 Unit Apartments | 0 (0.0%) | 0 (0.0%) |
| 3 or 4 Unit Apartments | 0 (0.0%) | 0 (0.0%) |
| 5 to 9 Unit Apartments | 0 (0.0%) | 0 (0.0%) |
| 10 or more Apartments | 0 (0.0%) | 0 (0.0%) |
| Mobile Home / Other | 14 (87.5%) | 2 (12.5%) |
| Total | 129 (93.5%) | 9 (6.5%) |
Housing Structures by Number of Rooms in Vanderbilt borough
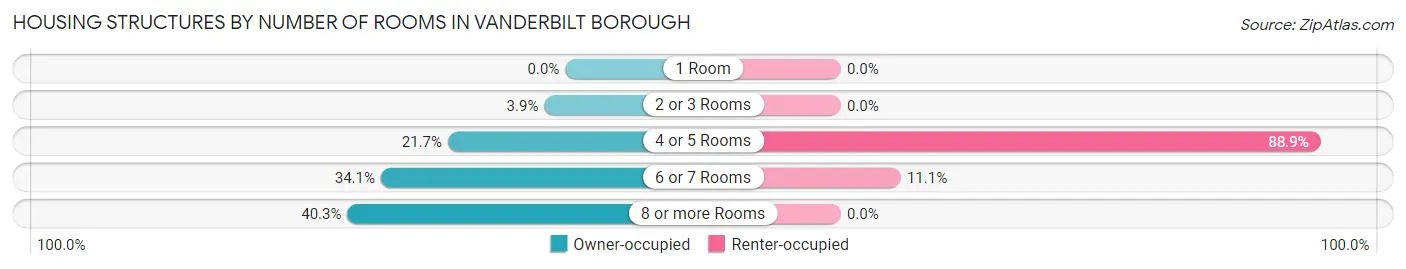
| Number of Rooms | Owner-occupied | Renter-occupied |
| 1 Room | 0 (0.0%) | 0 (0.0%) |
| 2 or 3 Rooms | 5 (3.9%) | 0 (0.0%) |
| 4 or 5 Rooms | 28 (21.7%) | 8 (88.9%) |
| 6 or 7 Rooms | 44 (34.1%) | 1 (11.1%) |
| 8 or more Rooms | 52 (40.3%) | 0 (0.0%) |
| Total | 129 (100.0%) | 9 (100.0%) |
Housing Structure by Heating Type in Vanderbilt borough
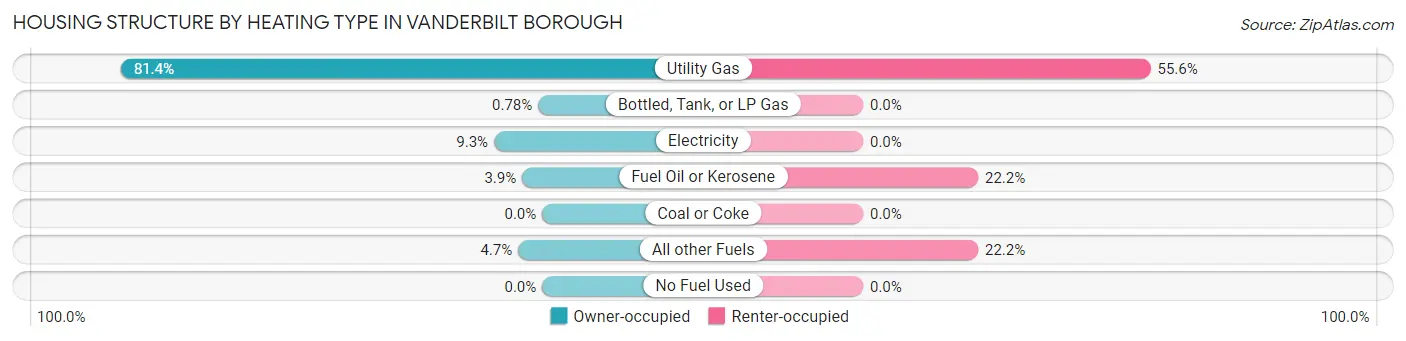
| Heating Type | Owner-occupied | Renter-occupied |
| Utility Gas | 105 (81.4%) | 5 (55.6%) |
| Bottled, Tank, or LP Gas | 1 (0.8%) | 0 (0.0%) |
| Electricity | 12 (9.3%) | 0 (0.0%) |
| Fuel Oil or Kerosene | 5 (3.9%) | 2 (22.2%) |
| Coal or Coke | 0 (0.0%) | 0 (0.0%) |
| All other Fuels | 6 (4.6%) | 2 (22.2%) |
| No Fuel Used | 0 (0.0%) | 0 (0.0%) |
| Total | 129 (100.0%) | 9 (100.0%) |
Household Vehicle Usage in Vanderbilt borough
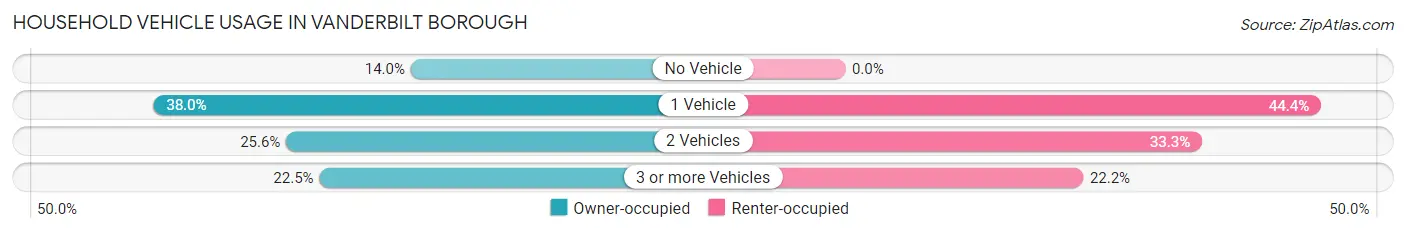
| Vehicles per Household | Owner-occupied | Renter-occupied |
| No Vehicle | 18 (14.0%) | 0 (0.0%) |
| 1 Vehicle | 49 (38.0%) | 4 (44.4%) |
| 2 Vehicles | 33 (25.6%) | 3 (33.3%) |
| 3 or more Vehicles | 29 (22.5%) | 2 (22.2%) |
| Total | 129 (100.0%) | 9 (100.0%) |
Real Estate & Mortgages in Vanderbilt borough
Real Estate and Mortgage Overview in Vanderbilt borough
| Characteristic | Without Mortgage | With Mortgage |
| Housing Units | 61 | 68 |
| Median Property Value | $76,400 | $97,000 |
| Median Household Income | $45,625 | $10 |
| Monthly Housing Costs | $396 | $0 |
| Real Estate Taxes | $493 | $9 |
Property Value by Mortgage Status in Vanderbilt borough
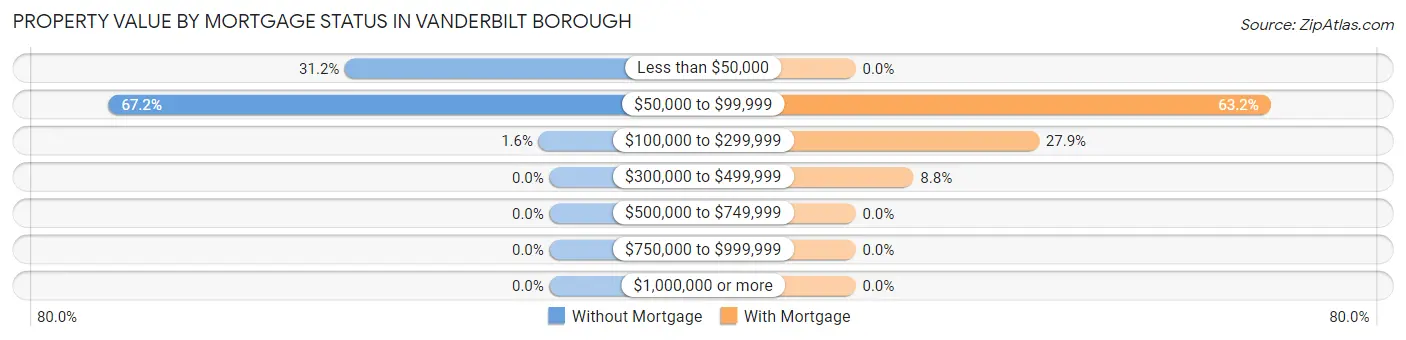
| Property Value | Without Mortgage | With Mortgage |
| Less than $50,000 | 19 (31.1%) | 0 (0.0%) |
| $50,000 to $99,999 | 41 (67.2%) | 43 (63.2%) |
| $100,000 to $299,999 | 1 (1.6%) | 19 (27.9%) |
| $300,000 to $499,999 | 0 (0.0%) | 6 (8.8%) |
| $500,000 to $749,999 | 0 (0.0%) | 0 (0.0%) |
| $750,000 to $999,999 | 0 (0.0%) | 0 (0.0%) |
| $1,000,000 or more | 0 (0.0%) | 0 (0.0%) |
| Total | 61 (100.0%) | 68 (100.0%) |
Household Income by Mortgage Status in Vanderbilt borough
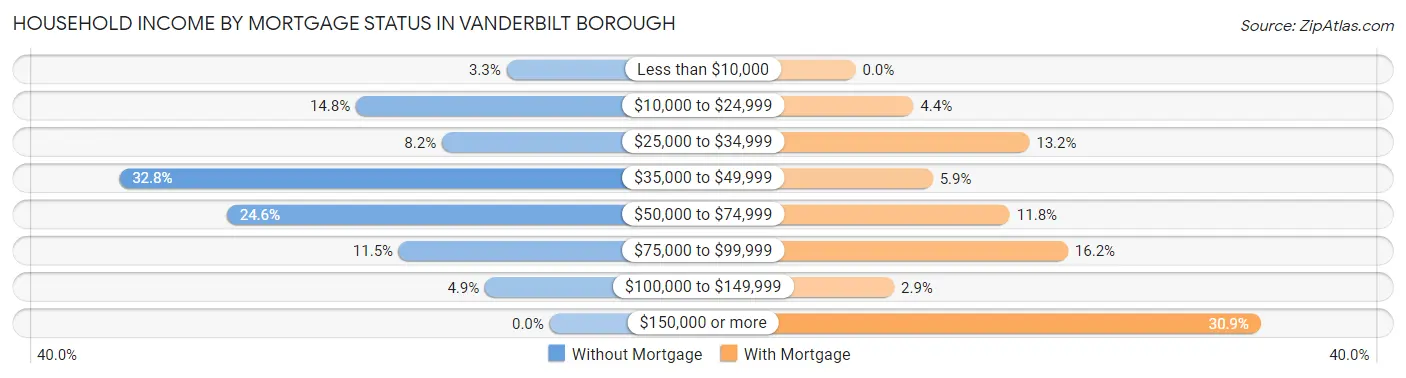
| Household Income | Without Mortgage | With Mortgage |
| Less than $10,000 | 2 (3.3%) | 0 (0.0%) |
| $10,000 to $24,999 | 9 (14.7%) | 3 (4.4%) |
| $25,000 to $34,999 | 5 (8.2%) | 9 (13.2%) |
| $35,000 to $49,999 | 20 (32.8%) | 4 (5.9%) |
| $50,000 to $74,999 | 15 (24.6%) | 8 (11.8%) |
| $75,000 to $99,999 | 7 (11.5%) | 11 (16.2%) |
| $100,000 to $149,999 | 3 (4.9%) | 2 (2.9%) |
| $150,000 or more | 0 (0.0%) | 21 (30.9%) |
| Total | 61 (100.0%) | 68 (100.0%) |
Property Value to Household Income Ratio in Vanderbilt borough
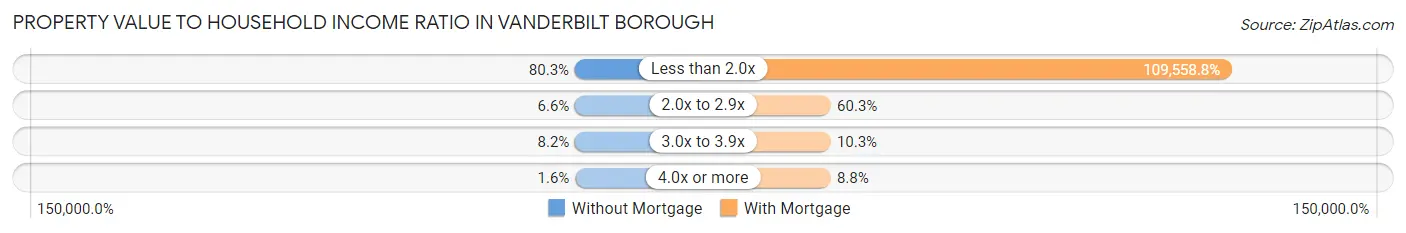
| Value-to-Income Ratio | Without Mortgage | With Mortgage |
| Less than 2.0x | 49 (80.3%) | 74,500 (109,558.8%) |
| 2.0x to 2.9x | 4 (6.6%) | 41 (60.3%) |
| 3.0x to 3.9x | 5 (8.2%) | 7 (10.3%) |
| 4.0x or more | 1 (1.6%) | 6 (8.8%) |
| Total | 61 (100.0%) | 68 (100.0%) |
Real Estate Taxes by Mortgage Status in Vanderbilt borough
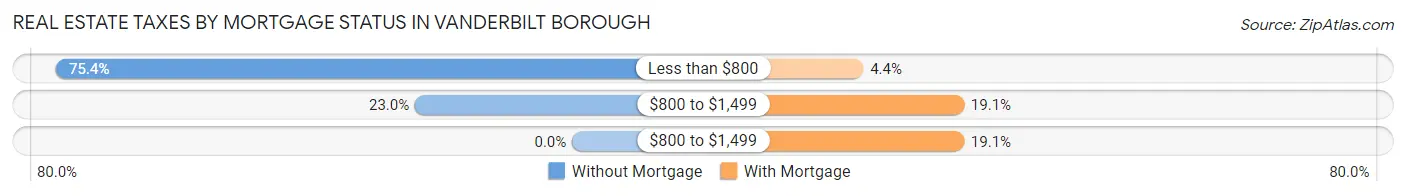
| Property Taxes | Without Mortgage | With Mortgage |
| Less than $800 | 46 (75.4%) | 3 (4.4%) |
| $800 to $1,499 | 14 (23.0%) | 13 (19.1%) |
| $800 to $1,499 | 0 (0.0%) | 13 (19.1%) |
| Total | 61 (100.0%) | 68 (100.0%) |
Health & Disability in Vanderbilt borough
Health Insurance Coverage by Age in Vanderbilt borough
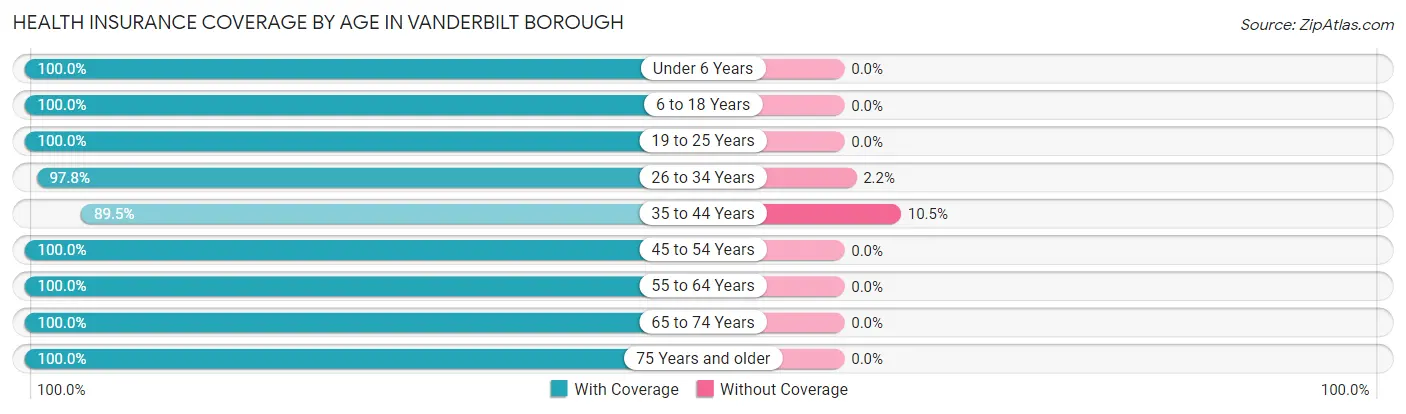
| Age Bracket | With Coverage | Without Coverage |
| Under 6 Years | 26 (100.0%) | 0 (0.0%) |
| 6 to 18 Years | 48 (100.0%) | 0 (0.0%) |
| 19 to 25 Years | 18 (100.0%) | 0 (0.0%) |
| 26 to 34 Years | 44 (97.8%) | 1 (2.2%) |
| 35 to 44 Years | 34 (89.5%) | 4 (10.5%) |
| 45 to 54 Years | 46 (100.0%) | 0 (0.0%) |
| 55 to 64 Years | 43 (100.0%) | 0 (0.0%) |
| 65 to 74 Years | 21 (100.0%) | 0 (0.0%) |
| 75 Years and older | 29 (100.0%) | 0 (0.0%) |
| Total | 309 (98.4%) | 5 (1.6%) |
Health Insurance Coverage by Citizenship Status in Vanderbilt borough
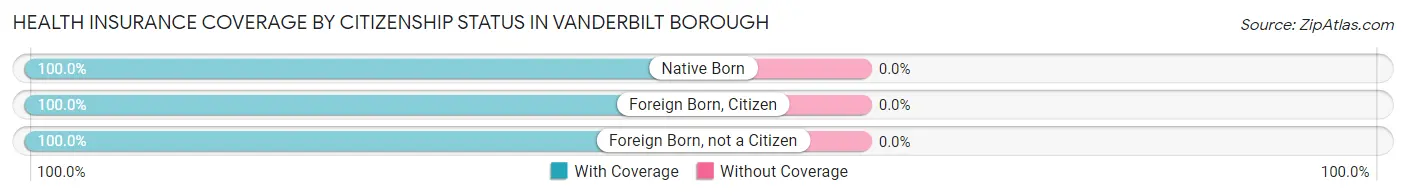
| Citizenship Status | With Coverage | Without Coverage |
| Native Born | 26 (100.0%) | 0 (0.0%) |
| Foreign Born, Citizen | 48 (100.0%) | 0 (0.0%) |
| Foreign Born, not a Citizen | 18 (100.0%) | 0 (0.0%) |
Health Insurance Coverage by Household Income in Vanderbilt borough
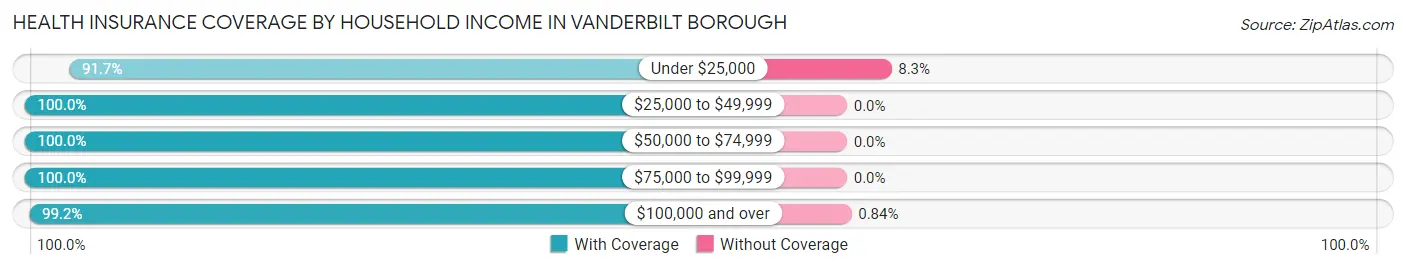
| Household Income | With Coverage | Without Coverage |
| Under $25,000 | 44 (91.7%) | 4 (8.3%) |
| $25,000 to $49,999 | 66 (100.0%) | 0 (0.0%) |
| $50,000 to $74,999 | 58 (100.0%) | 0 (0.0%) |
| $75,000 to $99,999 | 23 (100.0%) | 0 (0.0%) |
| $100,000 and over | 118 (99.2%) | 1 (0.8%) |
Public vs Private Health Insurance Coverage by Age in Vanderbilt borough
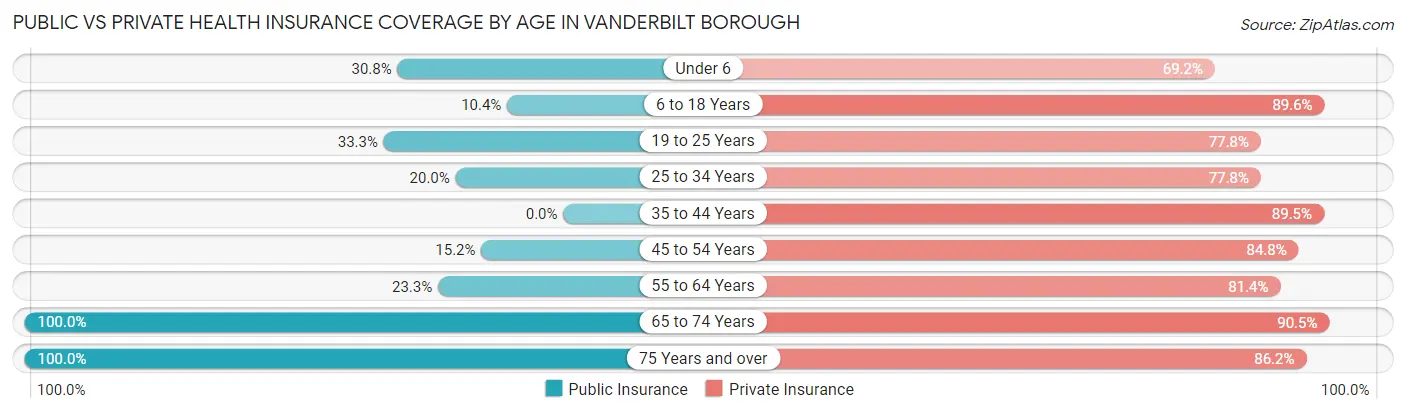
| Age Bracket | Public Insurance | Private Insurance |
| Under 6 | 8 (30.8%) | 18 (69.2%) |
| 6 to 18 Years | 5 (10.4%) | 43 (89.6%) |
| 19 to 25 Years | 6 (33.3%) | 14 (77.8%) |
| 25 to 34 Years | 9 (20.0%) | 35 (77.8%) |
| 35 to 44 Years | 0 (0.0%) | 34 (89.5%) |
| 45 to 54 Years | 7 (15.2%) | 39 (84.8%) |
| 55 to 64 Years | 10 (23.3%) | 35 (81.4%) |
| 65 to 74 Years | 21 (100.0%) | 19 (90.5%) |
| 75 Years and over | 29 (100.0%) | 25 (86.2%) |
| Total | 95 (30.2%) | 262 (83.4%) |
Disability Status by Sex by Age in Vanderbilt borough
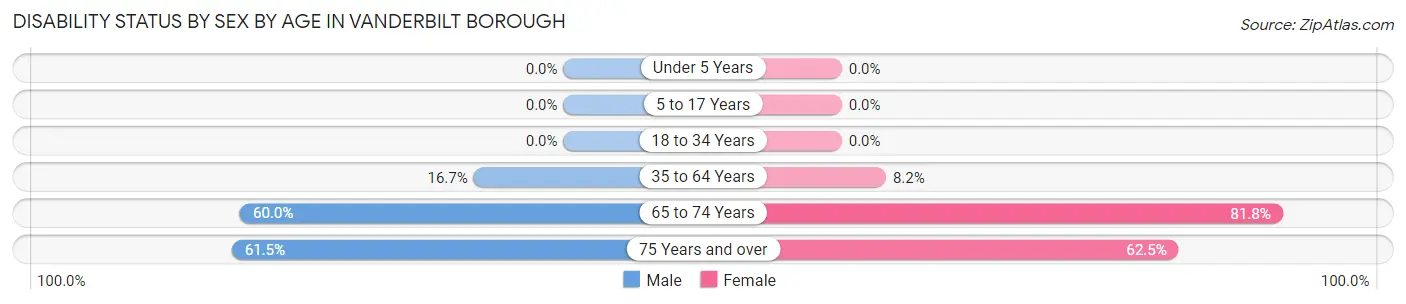
| Age Bracket | Male | Female |
| Under 5 Years | 0 (0.0%) | 0 (0.0%) |
| 5 to 17 Years | 0 (0.0%) | 0 (0.0%) |
| 18 to 34 Years | 0 (0.0%) | 0 (0.0%) |
| 35 to 64 Years | 11 (16.7%) | 5 (8.2%) |
| 65 to 74 Years | 6 (60.0%) | 9 (81.8%) |
| 75 Years and over | 8 (61.5%) | 10 (62.5%) |
Disability Class by Sex by Age in Vanderbilt borough
Disability Class: Hearing Difficulty
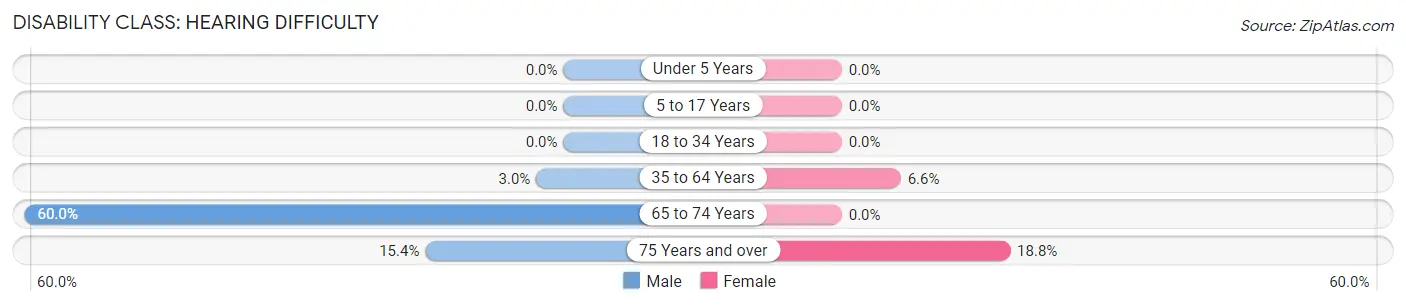
| Age Bracket | Male | Female |
| Under 5 Years | 0 (0.0%) | 0 (0.0%) |
| 5 to 17 Years | 0 (0.0%) | 0 (0.0%) |
| 18 to 34 Years | 0 (0.0%) | 0 (0.0%) |
| 35 to 64 Years | 2 (3.0%) | 4 (6.6%) |
| 65 to 74 Years | 6 (60.0%) | 0 (0.0%) |
| 75 Years and over | 2 (15.4%) | 3 (18.8%) |
Disability Class: Vision Difficulty
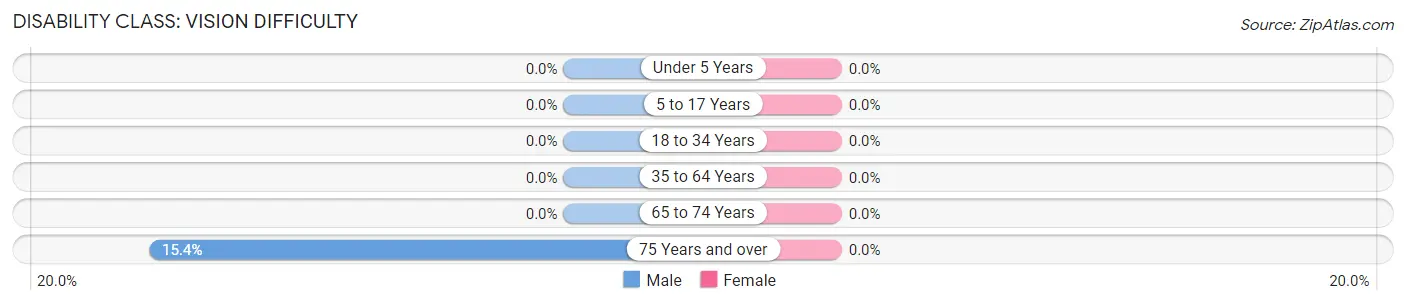
| Age Bracket | Male | Female |
| Under 5 Years | 0 (0.0%) | 0 (0.0%) |
| 5 to 17 Years | 0 (0.0%) | 0 (0.0%) |
| 18 to 34 Years | 0 (0.0%) | 0 (0.0%) |
| 35 to 64 Years | 0 (0.0%) | 0 (0.0%) |
| 65 to 74 Years | 0 (0.0%) | 0 (0.0%) |
| 75 Years and over | 2 (15.4%) | 0 (0.0%) |
Disability Class: Cognitive Difficulty
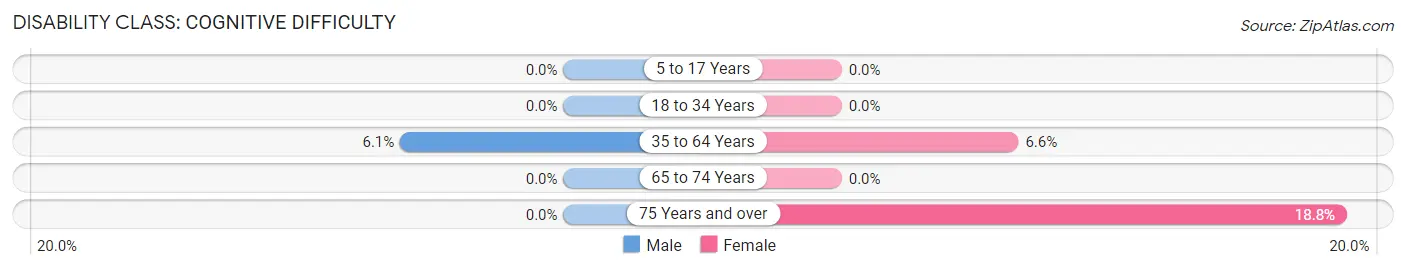
| Age Bracket | Male | Female |
| 5 to 17 Years | 0 (0.0%) | 0 (0.0%) |
| 18 to 34 Years | 0 (0.0%) | 0 (0.0%) |
| 35 to 64 Years | 4 (6.1%) | 4 (6.6%) |
| 65 to 74 Years | 0 (0.0%) | 0 (0.0%) |
| 75 Years and over | 0 (0.0%) | 3 (18.8%) |
Disability Class: Ambulatory Difficulty
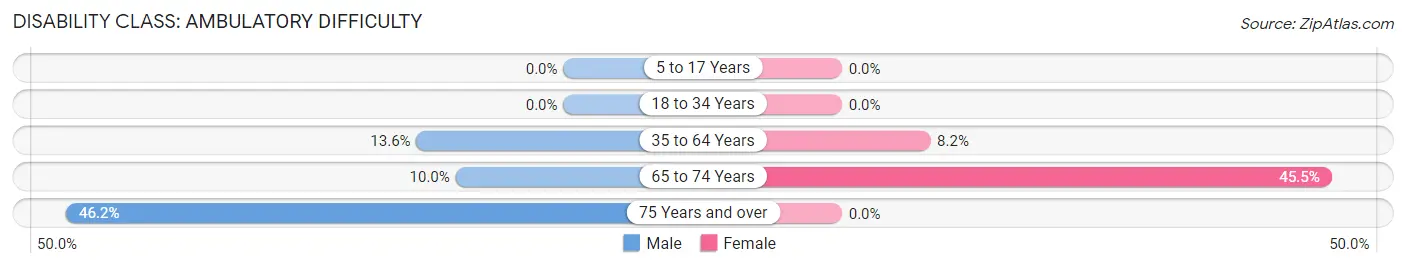
| Age Bracket | Male | Female |
| 5 to 17 Years | 0 (0.0%) | 0 (0.0%) |
| 18 to 34 Years | 0 (0.0%) | 0 (0.0%) |
| 35 to 64 Years | 9 (13.6%) | 5 (8.2%) |
| 65 to 74 Years | 1 (10.0%) | 5 (45.5%) |
| 75 Years and over | 6 (46.2%) | 0 (0.0%) |
Disability Class: Self-Care Difficulty
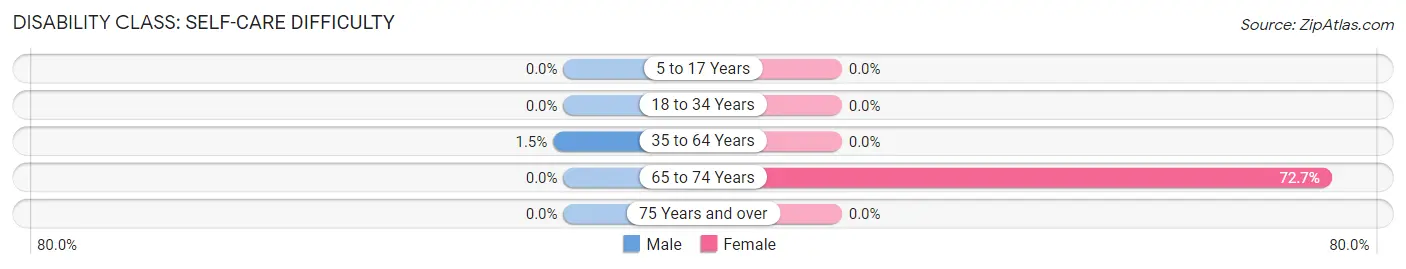
| Age Bracket | Male | Female |
| 5 to 17 Years | 0 (0.0%) | 0 (0.0%) |
| 18 to 34 Years | 0 (0.0%) | 0 (0.0%) |
| 35 to 64 Years | 1 (1.5%) | 0 (0.0%) |
| 65 to 74 Years | 0 (0.0%) | 8 (72.7%) |
| 75 Years and over | 0 (0.0%) | 0 (0.0%) |
Technology Access in Vanderbilt borough
Computing Device Access in Vanderbilt borough
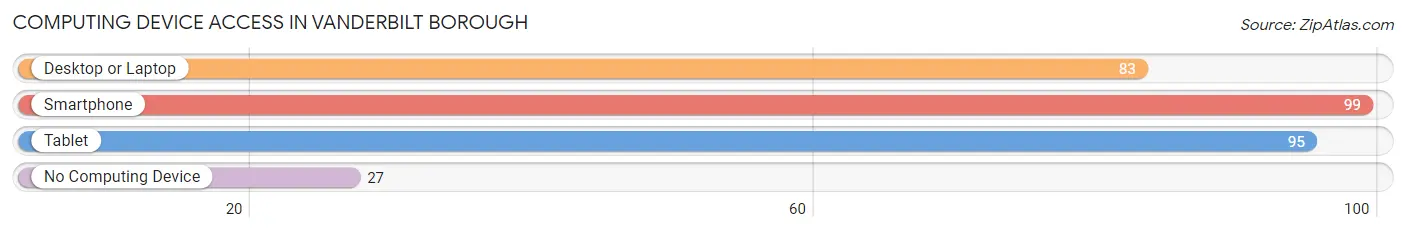
| Device Type | # Households | % Households |
| Desktop or Laptop | 83 | 60.1% |
| Smartphone | 99 | 71.7% |
| Tablet | 95 | 68.8% |
| No Computing Device | 27 | 19.6% |
| Total | 138 | 100.0% |
Internet Access in Vanderbilt borough
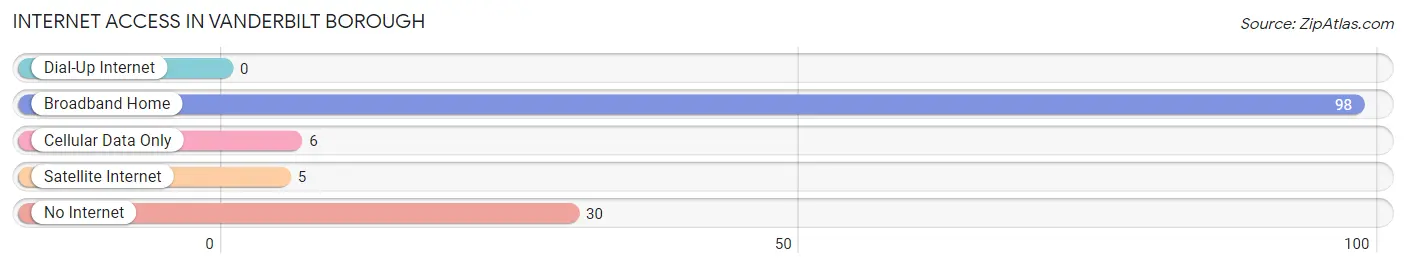
| Internet Type | # Households | % Households |
| Dial-Up Internet | 0 | 0.0% |
| Broadband Home | 98 | 71.0% |
| Cellular Data Only | 6 | 4.3% |
| Satellite Internet | 5 | 3.6% |
| No Internet | 30 | 21.7% |
| Total | 138 | 100.0% |
Vanderbilt borough Summary
Vanderbilt Borough is a small borough located in Fayette County, Pennsylvania. It is situated in the southwestern corner of the county, approximately 25 miles south of Pittsburgh. The borough was founded in 1891 and is home to a population of approximately 1,000 people.
History
Vanderbilt Borough was founded in 1891 by a group of coal miners who had recently moved to the area. The miners named the borough after Cornelius Vanderbilt, a prominent industrialist and philanthropist of the 19th century. The miners were attracted to the area due to its abundance of coal and the potential for economic growth.
The borough quickly grew in size and population, and by the early 1900s, it had become a thriving community. The town was home to several businesses, including a general store, a blacksmith shop, and a hotel. The town also had a school, a post office, and a library.
In the early 1900s, the borough was home to a large number of immigrants, primarily from Eastern Europe. These immigrants brought with them their own culture and traditions, which helped to shape the culture of the borough.
Geography
Vanderbilt Borough is located in the southwestern corner of Fayette County, Pennsylvania. It is situated in the foothills of the Allegheny Mountains, approximately 25 miles south of Pittsburgh. The borough is bordered by the towns of Dunbar, Smithfield, and Uniontown.
The borough is situated on a plateau, with an elevation of approximately 1,000 feet. The terrain is mostly flat, with some rolling hills. The borough is home to several creeks, including the Redstone Creek, which runs through the center of the borough.
Economy
The economy of Vanderbilt Borough is largely based on the coal mining industry. The borough is home to several coal mines, which provide employment for many of the borough’s residents. In addition to coal mining, the borough is also home to several small businesses, including restaurants, retail stores, and service providers.
Demographics
As of the 2010 census, the population of Vanderbilt Borough was 1,000. The racial makeup of the borough was 97.2% White, 0.7% African American, 0.3% Native American, 0.3% Asian, and 1.5% from other races. The median household income was $37,500, and the median family income was $41,250.
Conclusion
Vanderbilt Borough is a small borough located in Fayette County, Pennsylvania. It was founded in 1891 by a group of coal miners and has since grown into a thriving community. The borough is home to a population of approximately 1,000 people and is largely dependent on the coal mining industry for its economic stability. The borough is also home to a diverse population, with a variety of racial and ethnic backgrounds.
Common Questions
What is Per Capita Income in Vanderbilt borough?
Per Capita income in Vanderbilt borough is $30,996.
What is the Median Family Income in Vanderbilt borough?
Median Family Income in Vanderbilt borough is $73,000.
What is the Median Household income in Vanderbilt borough?
Median Household Income in Vanderbilt borough is $51,000.
What is Income or Wage Gap in Vanderbilt borough?
Income or Wage Gap in Vanderbilt borough is 44.6%.
Women in Vanderbilt borough earn 55.4 cents for every dollar earned by a man.
What is Inequality or Gini Index in Vanderbilt borough?
Inequality or Gini Index in Vanderbilt borough is 0.40.
What is the Total Population of Vanderbilt borough?
Total Population of Vanderbilt borough is 314.
What is the Total Male Population of Vanderbilt borough?
Total Male Population of Vanderbilt borough is 161.
What is the Total Female Population of Vanderbilt borough?
Total Female Population of Vanderbilt borough is 153.
What is the Ratio of Males per 100 Females in Vanderbilt borough?
There are 105.23 Males per 100 Females in Vanderbilt borough.
What is the Ratio of Females per 100 Males in Vanderbilt borough?
There are 95.03 Females per 100 Males in Vanderbilt borough.
What is the Median Population Age in Vanderbilt borough?
Median Population Age in Vanderbilt borough is 38.8 Years.
What is the Average Family Size in Vanderbilt borough
Average Family Size in Vanderbilt borough is 2.7 People.
What is the Average Household Size in Vanderbilt borough
Average Household Size in Vanderbilt borough is 2.3 People.
How Large is the Labor Force in Vanderbilt borough?
There are 152 People in the Labor Forcein in Vanderbilt borough.
What is the Percentage of People in the Labor Force in Vanderbilt borough?
62.8% of People are in the Labor Force in Vanderbilt borough.