Cedar Crest, PA Map & Demographics
Cedar Crest Map
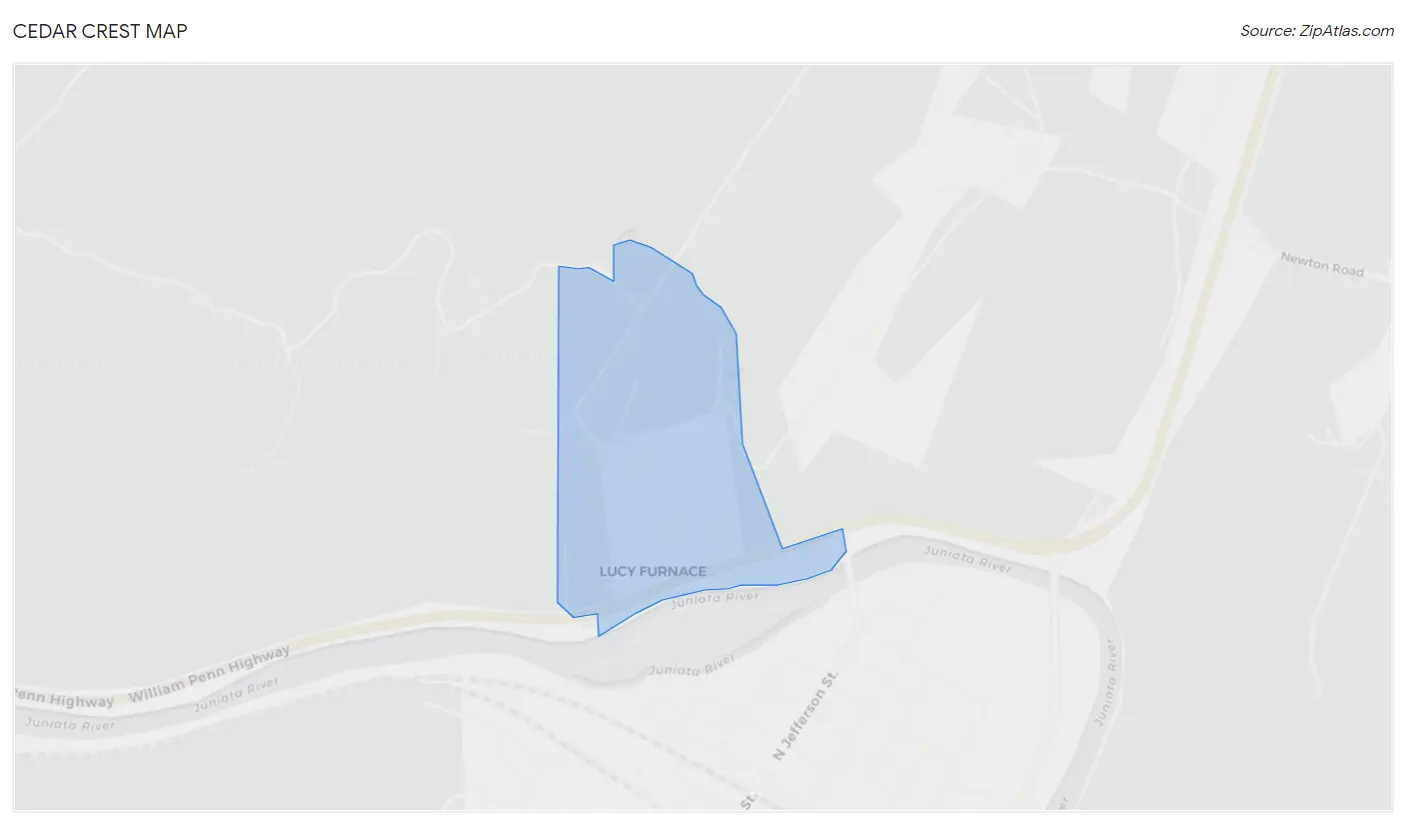
Cedar Crest Overview
$20,799
PER CAPITA INCOME
$40,714
AVG FAMILY INCOME
$23,000
AVG HOUSEHOLD INCOME
0.40
INEQUALITY / GINI INDEX
72
TOTAL POPULATION
31
MALE POPULATION
41
FEMALE POPULATION
75.61
MALES / 100 FEMALES
132.26
FEMALES / 100 MALES
57.5
MEDIAN AGE
2.2
AVG FAMILY SIZE
1.7
AVG HOUSEHOLD SIZE
27
LABOR FORCE [ PEOPLE ]
39.1%
PERCENT IN LABOR FORCE
Income in Cedar Crest
Income Overview in Cedar Crest
Per Capita Income in Cedar Crest is $20,799, while median incomes of families and households are $40,714 and $23,000 respectively.
| Characteristic | Number | Measure |
| Per Capita Income | 72 | $20,799 |
| Median Family Income | 22 | $40,714 |
| Mean Family Income | 22 | $48,086 |
| Median Household Income | 42 | $23,000 |
| Mean Household Income | 42 | $37,114 |
| Income Deficit | 22 | $0 |
| Wage / Income Gap (%) | 72 | 0.00% |
| Wage / Income Gap ($) | 72 | 100.00¢ per $1 |
| Gini / Inequality Index | 72 | 0.40 |
Earnings by Sex in Cedar Crest
| Sex | Number | Average Earnings |
| Male | 6 (22.2%) | $0 |
| Female | 21 (77.8%) | $0 |
| Total | 27 (100.0%) | $0 |
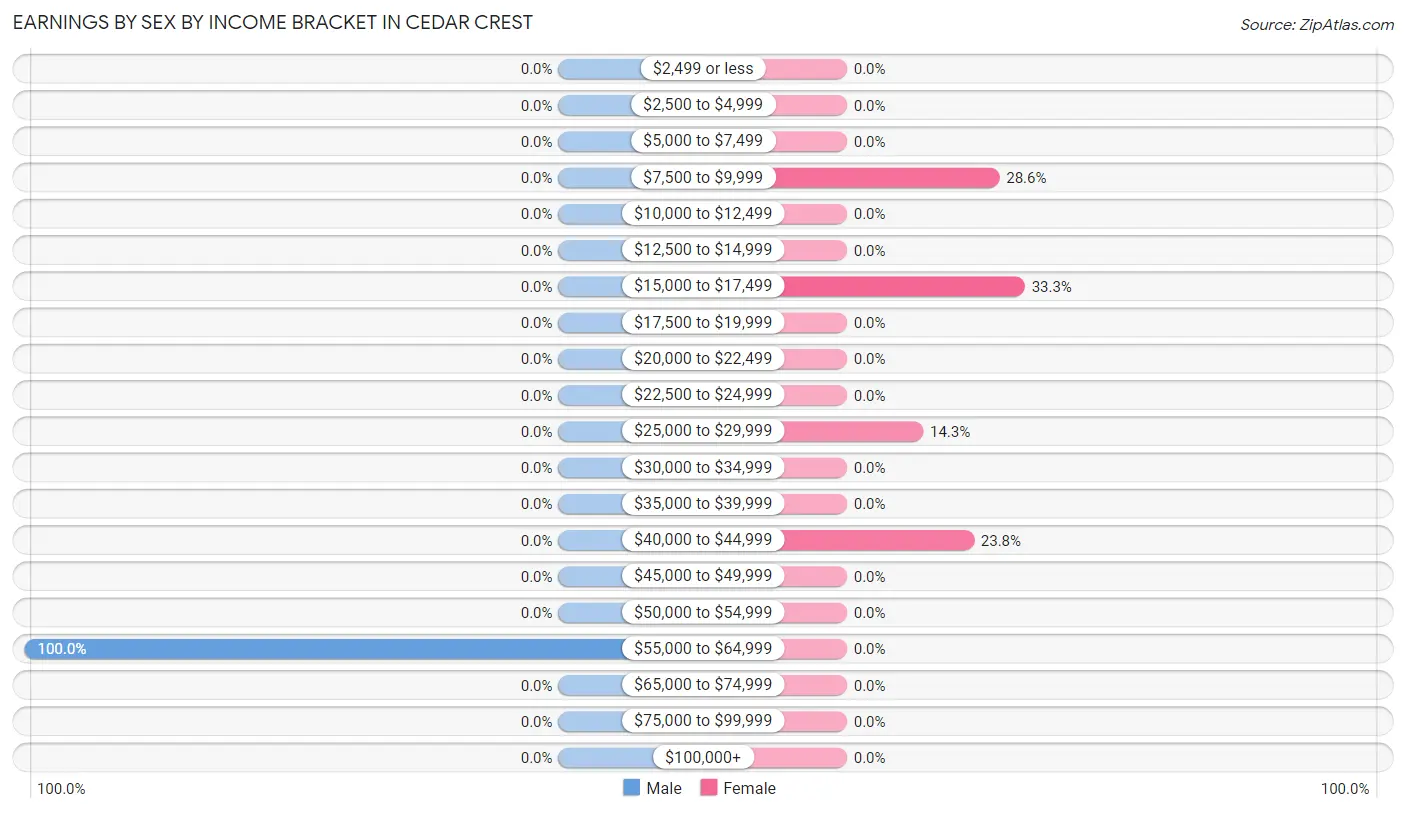
Earnings by Sex by Income Bracket in Cedar Crest
The most common earnings brackets in Cedar Crest are $55,000 to $64,999 for men (6 | 100.0%) and $15,000 to $17,499 for women (7 | 33.3%).
| Income | Male | Female |
| $2,499 or less | 0 (0.0%) | 0 (0.0%) |
| $2,500 to $4,999 | 0 (0.0%) | 0 (0.0%) |
| $5,000 to $7,499 | 0 (0.0%) | 0 (0.0%) |
| $7,500 to $9,999 | 0 (0.0%) | 6 (28.6%) |
| $10,000 to $12,499 | 0 (0.0%) | 0 (0.0%) |
| $12,500 to $14,999 | 0 (0.0%) | 0 (0.0%) |
| $15,000 to $17,499 | 0 (0.0%) | 7 (33.3%) |
| $17,500 to $19,999 | 0 (0.0%) | 0 (0.0%) |
| $20,000 to $22,499 | 0 (0.0%) | 0 (0.0%) |
| $22,500 to $24,999 | 0 (0.0%) | 0 (0.0%) |
| $25,000 to $29,999 | 0 (0.0%) | 3 (14.3%) |
| $30,000 to $34,999 | 0 (0.0%) | 0 (0.0%) |
| $35,000 to $39,999 | 0 (0.0%) | 0 (0.0%) |
| $40,000 to $44,999 | 0 (0.0%) | 5 (23.8%) |
| $45,000 to $49,999 | 0 (0.0%) | 0 (0.0%) |
| $50,000 to $54,999 | 0 (0.0%) | 0 (0.0%) |
| $55,000 to $64,999 | 6 (100.0%) | 0 (0.0%) |
| $65,000 to $74,999 | 0 (0.0%) | 0 (0.0%) |
| $75,000 to $99,999 | 0 (0.0%) | 0 (0.0%) |
| $100,000+ | 0 (0.0%) | 0 (0.0%) |
| Total | 6 (100.0%) | 21 (100.0%) |
Earnings by Sex by Educational Attainment in Cedar Crest
| Educational Attainment | Male Income | Female Income |
| Less than High School | - | - |
| High School Diploma | - | - |
| College or Associate's Degree | - | - |
| Bachelor's Degree | - | - |
| Graduate Degree | - | - |
| Total | - | - |
Family Income in Cedar Crest
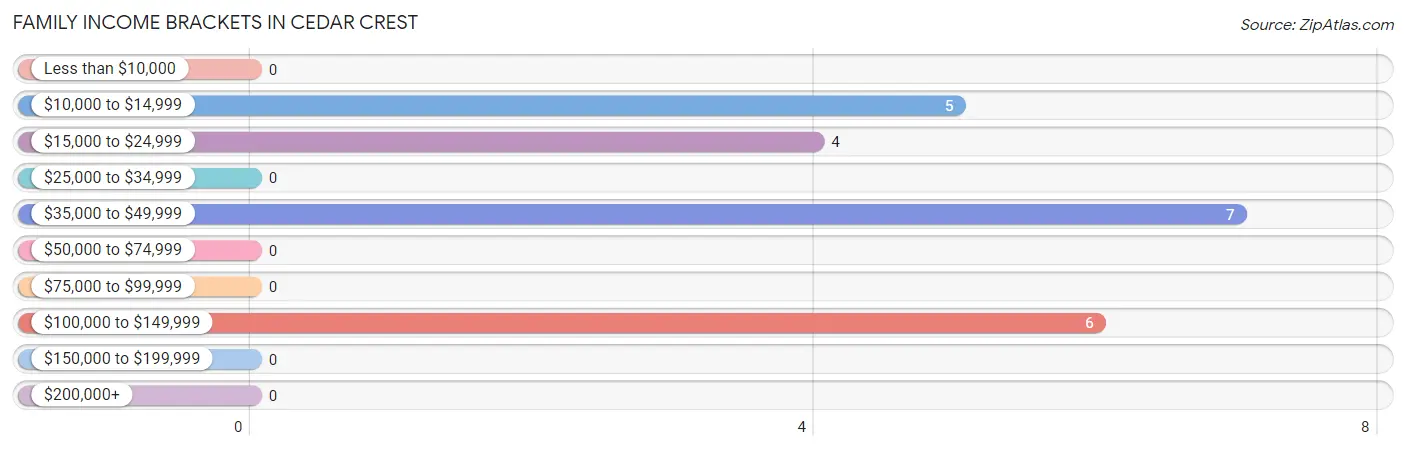
Family Income Brackets in Cedar Crest
According to the Cedar Crest family income data, there are 7 families falling into the $35,000 to $49,999 income range, which is the most common income bracket and makes up 31.8% of all families.
| Income Bracket | # Families | % Families |
| Less than $10,000 | 0 | 0.0% |
| $10,000 to $14,999 | 5 | 22.7% |
| $15,000 to $24,999 | 4 | 18.2% |
| $25,000 to $34,999 | 0 | 0.0% |
| $35,000 to $49,999 | 7 | 31.8% |
| $50,000 to $74,999 | 0 | 0.0% |
| $75,000 to $99,999 | 0 | 0.0% |
| $100,000 to $149,999 | 6 | 27.3% |
| $150,000 to $199,999 | 0 | 0.0% |
| $200,000+ | 0 | 0.0% |
Family Income by Famaliy Size in Cedar Crest
| Income Bracket | # Families | Median Income |
| 2-Person Families | 17 (77.3%) | $0 |
| 3-Person Families | 5 (22.7%) | $0 |
| 4-Person Families | 0 (0.0%) | $0 |
| 5-Person Families | 0 (0.0%) | $0 |
| 6-Person Families | 0 (0.0%) | $0 |
| 7+ Person Families | 0 (0.0%) | $0 |
| Total | 22 (100.0%) | $40,714 |
Family Income by Number of Earners in Cedar Crest
| Number of Earners | # Families | Median Income |
| No Earners | 4 (18.2%) | $0 |
| 1 Earner | 12 (54.5%) | $0 |
| 2 Earners | 6 (27.3%) | $0 |
| 3+ Earners | 0 (0.0%) | $0 |
| Total | 22 (100.0%) | $40,714 |
Household Income in Cedar Crest
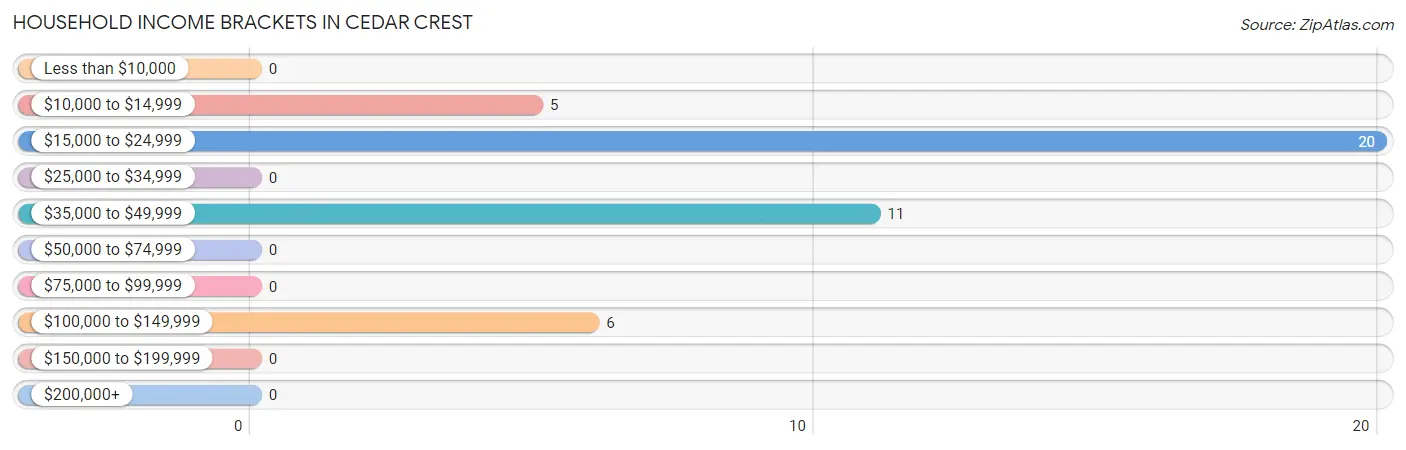
Household Income Brackets in Cedar Crest
With 20 households falling in the category, the $15,000 to $24,999 income range is the most frequent in Cedar Crest, accounting for 47.6% of all households.
| Income Bracket | # Households | % Households |
| Less than $10,000 | 0 | 0.0% |
| $10,000 to $14,999 | 5 | 11.9% |
| $15,000 to $24,999 | 20 | 47.6% |
| $25,000 to $34,999 | 0 | 0.0% |
| $35,000 to $49,999 | 11 | 26.2% |
| $50,000 to $74,999 | 0 | 0.0% |
| $75,000 to $99,999 | 0 | 0.0% |
| $100,000 to $149,999 | 6 | 14.3% |
| $150,000 to $199,999 | 0 | 0.0% |
| $200,000+ | 0 | 0.0% |
Household Income by Householder Age in Cedar Crest
The median household income in Cedar Crest is $23,000, with the highest median household income of $19,205 found in the 65+ years age bracket for the primary householder. A total of 25 households (59.5%) fall into this category.
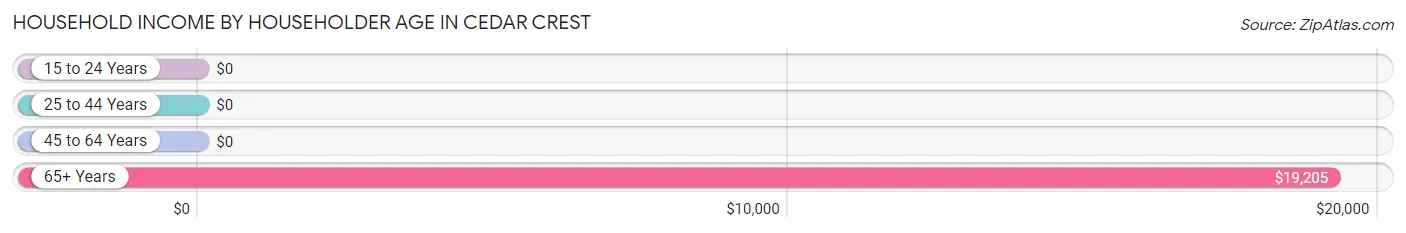
| Income Bracket | # Households | Median Income |
| 15 to 24 Years | 0 (0.0%) | $0 |
| 25 to 44 Years | 4 (9.5%) | $0 |
| 45 to 64 Years | 13 (30.9%) | $0 |
| 65+ Years | 25 (59.5%) | $19,205 |
| Total | 42 (100.0%) | $23,000 |
Poverty in Cedar Crest
Income Below Poverty by Sex and Age in Cedar Crest
With 58.1% poverty level for males and 14.6% for females among the residents of Cedar Crest, 6 to 11 year old males and 45 to 54 year old females are the most vulnerable to poverty, with 3 males (100.0%) and 6 females (100.0%) in their respective age groups living below the poverty level.
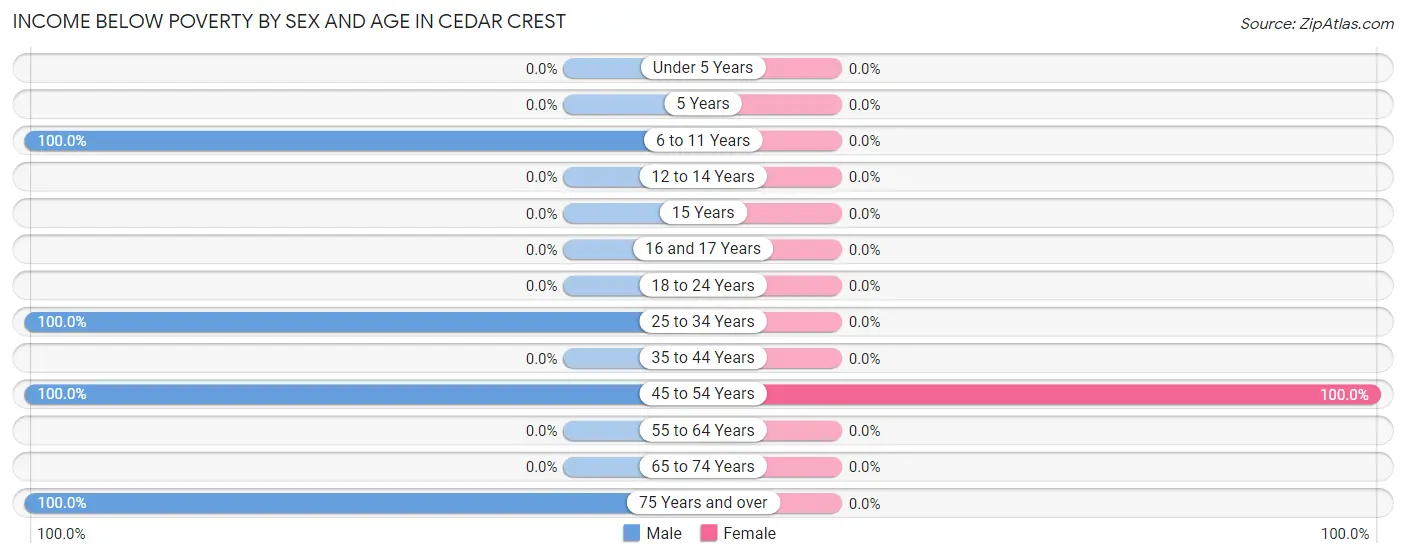
| Age Bracket | Male | Female |
| Under 5 Years | 0 (0.0%) | 0 (0.0%) |
| 5 Years | 0 (0.0%) | 0 (0.0%) |
| 6 to 11 Years | 3 (100.0%) | 0 (0.0%) |
| 12 to 14 Years | 0 (0.0%) | 0 (0.0%) |
| 15 Years | 0 (0.0%) | 0 (0.0%) |
| 16 and 17 Years | 0 (0.0%) | 0 (0.0%) |
| 18 to 24 Years | 0 (0.0%) | 0 (0.0%) |
| 25 to 34 Years | 4 (100.0%) | 0 (0.0%) |
| 35 to 44 Years | 0 (0.0%) | 0 (0.0%) |
| 45 to 54 Years | 6 (100.0%) | 6 (100.0%) |
| 55 to 64 Years | 0 (0.0%) | 0 (0.0%) |
| 65 to 74 Years | 0 (0.0%) | 0 (0.0%) |
| 75 Years and over | 5 (100.0%) | 0 (0.0%) |
| Total | 18 (58.1%) | 6 (14.6%) |
Income Above Poverty by Sex and Age in Cedar Crest
According to the poverty statistics in Cedar Crest, males aged 55 to 64 years and females aged 25 to 34 years are the age groups that are most secure financially, with 100.0% of males and 100.0% of females in these age groups living above the poverty line.
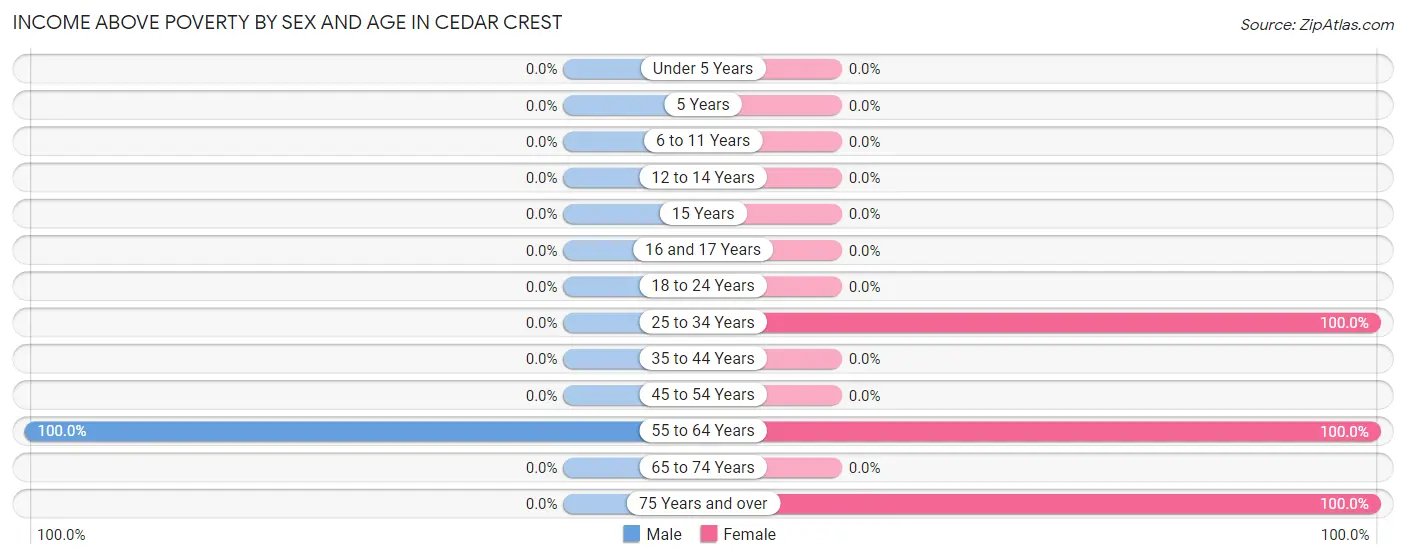
| Age Bracket | Male | Female |
| Under 5 Years | 0 (0.0%) | 0 (0.0%) |
| 5 Years | 0 (0.0%) | 0 (0.0%) |
| 6 to 11 Years | 0 (0.0%) | 0 (0.0%) |
| 12 to 14 Years | 0 (0.0%) | 0 (0.0%) |
| 15 Years | 0 (0.0%) | 0 (0.0%) |
| 16 and 17 Years | 0 (0.0%) | 0 (0.0%) |
| 18 to 24 Years | 0 (0.0%) | 0 (0.0%) |
| 25 to 34 Years | 0 (0.0%) | 3 (100.0%) |
| 35 to 44 Years | 0 (0.0%) | 0 (0.0%) |
| 45 to 54 Years | 0 (0.0%) | 0 (0.0%) |
| 55 to 64 Years | 13 (100.0%) | 12 (100.0%) |
| 65 to 74 Years | 0 (0.0%) | 0 (0.0%) |
| 75 Years and over | 0 (0.0%) | 20 (100.0%) |
| Total | 13 (41.9%) | 35 (85.4%) |
Income Below Poverty Among Married-Couple Families in Cedar Crest
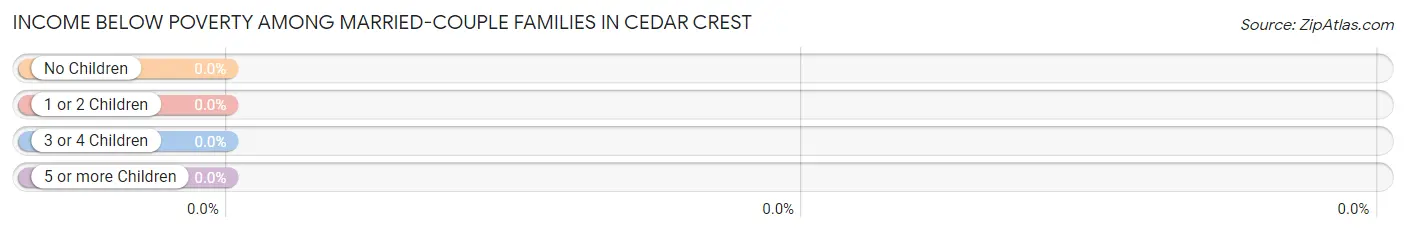
| Children | Above Poverty | Below Poverty |
| No Children | 13 (100.0%) | 0 (0.0%) |
| 1 or 2 Children | 0 (0.0%) | 0 (0.0%) |
| 3 or 4 Children | 0 (0.0%) | 0 (0.0%) |
| 5 or more Children | 0 (0.0%) | 0 (0.0%) |
| Total | 13 (100.0%) | 0 (0.0%) |
Income Below Poverty Among Single-Parent Households in Cedar Crest
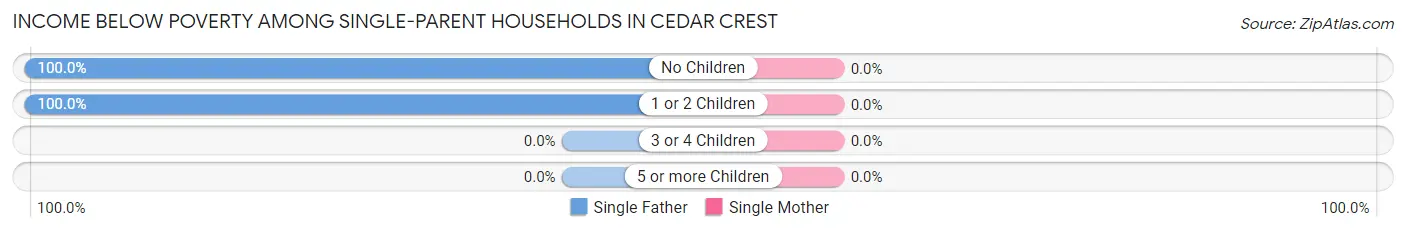
| Children | Single Father | Single Mother |
| No Children | 5 (100.0%) | 0 (0.0%) |
| 1 or 2 Children | 4 (100.0%) | 0 (0.0%) |
| 3 or 4 Children | 0 (0.0%) | 0 (0.0%) |
| 5 or more Children | 0 (0.0%) | 0 (0.0%) |
| Total | 9 (100.0%) | 0 (0.0%) |
Income Below Poverty Among Married-Couple vs Single-Parent Households in Cedar Crest
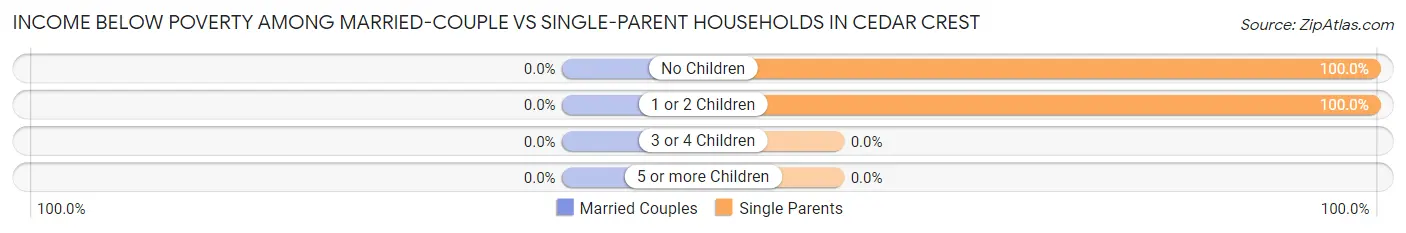
| Children | Married-Couple Families | Single-Parent Households |
| No Children | 0 (0.0%) | 5 (100.0%) |
| 1 or 2 Children | 0 (0.0%) | 4 (100.0%) |
| 3 or 4 Children | 0 (0.0%) | 0 (0.0%) |
| 5 or more Children | 0 (0.0%) | 0 (0.0%) |
| Total | 0 (0.0%) | 9 (100.0%) |
Race in Cedar Crest
The most populous races in Cedar Crest are , and White / Caucasian (72 | 100.0%).
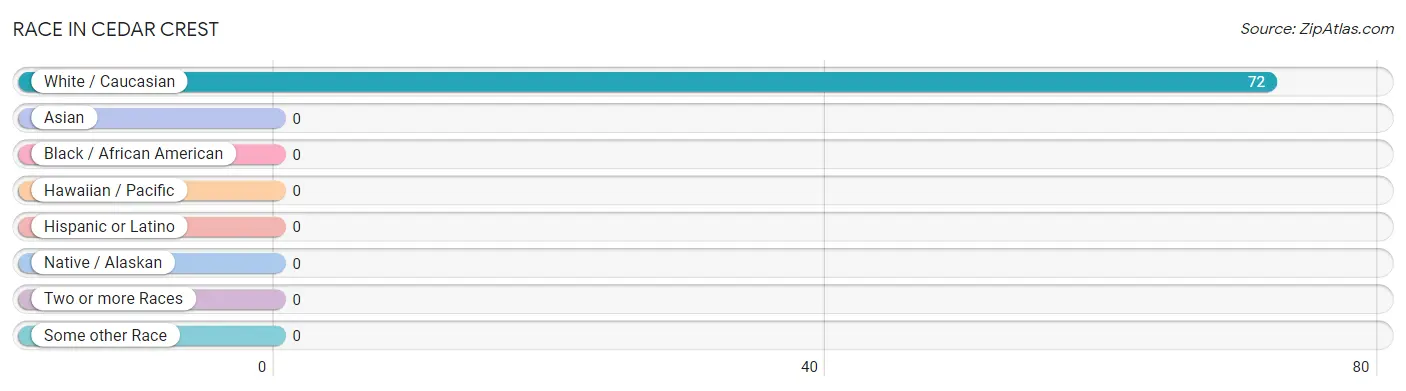
| Race | # Population | % Population |
| Asian | 0 | 0.0% |
| Black / African American | 0 | 0.0% |
| Hawaiian / Pacific | 0 | 0.0% |
| Hispanic or Latino | 0 | 0.0% |
| Native / Alaskan | 0 | 0.0% |
| White / Caucasian | 72 | 100.0% |
| Two or more Races | 0 | 0.0% |
| Some other Race | 0 | 0.0% |
| Total | 72 | 100.0% |
Ancestry in Cedar Crest
The most populous ancestries reported in Cedar Crest are German (36 | 50.0%), Dutch (7 | 9.7%), Greek (7 | 9.7%), Italian (6 | 8.3%), and Irish (5 | 6.9%), together accounting for 84.7% of all Cedar Crest residents.
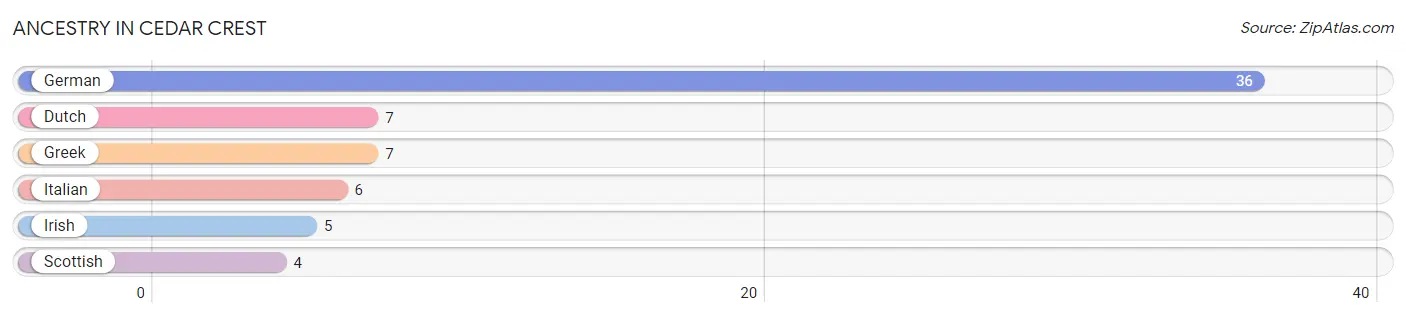
| Ancestry | # Population | % Population |
| Dutch | 7 | 9.7% |
| German | 36 | 50.0% |
| Greek | 7 | 9.7% |
| Irish | 5 | 6.9% |
| Italian | 6 | 8.3% |
| Scottish | 4 | 5.6% | View All 6 Rows |
Immigrants in Cedar Crest

| Immigration Origin | # Population | % Population | View All 0 Rows |
Sex and Age in Cedar Crest
Sex and Age in Cedar Crest
The most populous age groups in Cedar Crest are 55 to 59 Years (7 | 22.6%) for men and 55 to 59 Years (12 | 29.3%) for women.
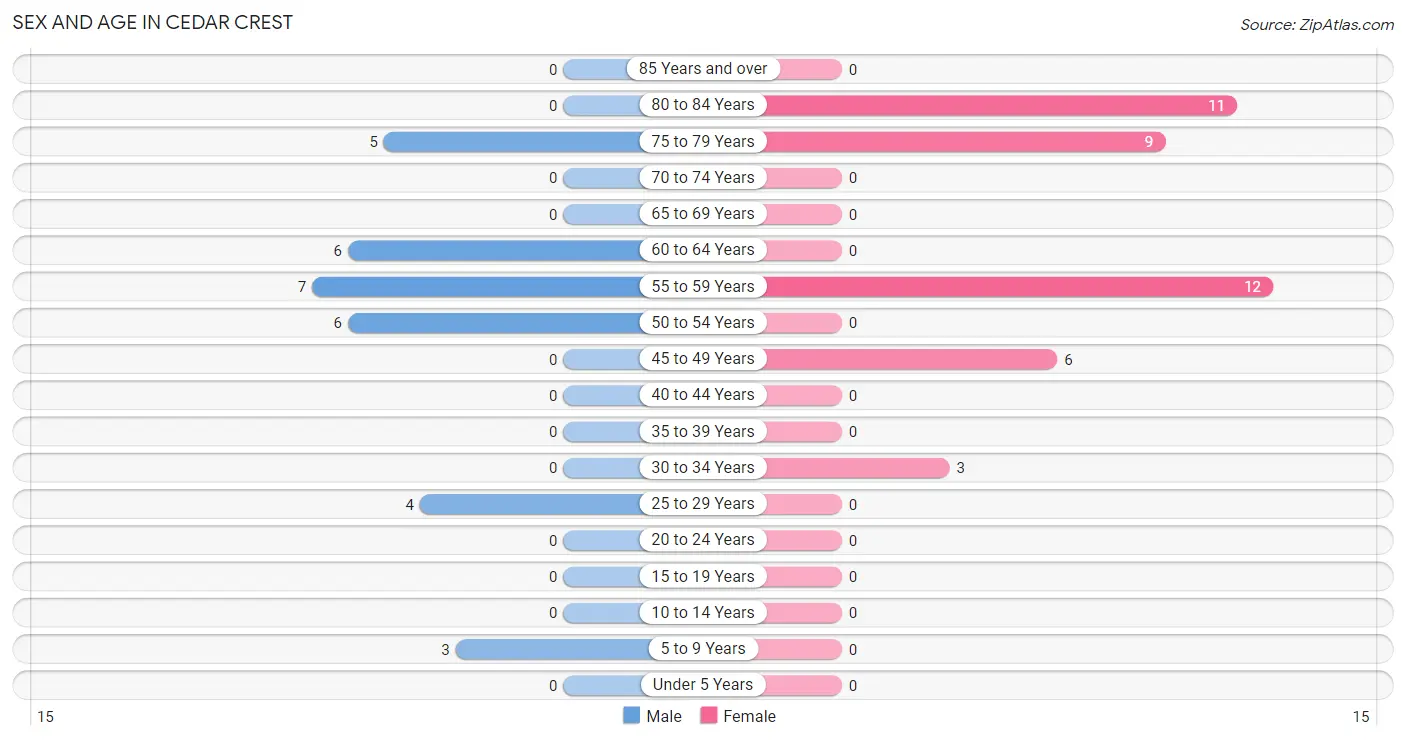
| Age Bracket | Male | Female |
| Under 5 Years | 0 (0.0%) | 0 (0.0%) |
| 5 to 9 Years | 3 (9.7%) | 0 (0.0%) |
| 10 to 14 Years | 0 (0.0%) | 0 (0.0%) |
| 15 to 19 Years | 0 (0.0%) | 0 (0.0%) |
| 20 to 24 Years | 0 (0.0%) | 0 (0.0%) |
| 25 to 29 Years | 4 (12.9%) | 0 (0.0%) |
| 30 to 34 Years | 0 (0.0%) | 3 (7.3%) |
| 35 to 39 Years | 0 (0.0%) | 0 (0.0%) |
| 40 to 44 Years | 0 (0.0%) | 0 (0.0%) |
| 45 to 49 Years | 0 (0.0%) | 6 (14.6%) |
| 50 to 54 Years | 6 (19.4%) | 0 (0.0%) |
| 55 to 59 Years | 7 (22.6%) | 12 (29.3%) |
| 60 to 64 Years | 6 (19.4%) | 0 (0.0%) |
| 65 to 69 Years | 0 (0.0%) | 0 (0.0%) |
| 70 to 74 Years | 0 (0.0%) | 0 (0.0%) |
| 75 to 79 Years | 5 (16.1%) | 9 (22.0%) |
| 80 to 84 Years | 0 (0.0%) | 11 (26.8%) |
| 85 Years and over | 0 (0.0%) | 0 (0.0%) |
| Total | 31 (100.0%) | 41 (100.0%) |
Families and Households in Cedar Crest
Median Family Size in Cedar Crest
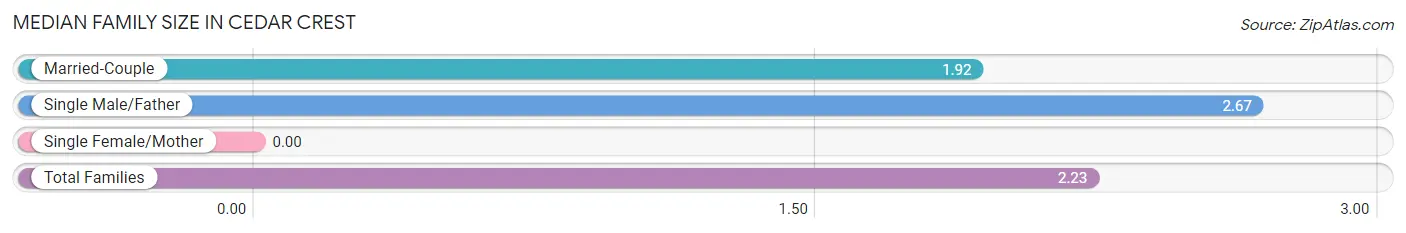
| Family Type | # Families | Family Size |
| Married-Couple | 13 (59.1%) | 1.92 |
| Single Male/Father | 9 (40.9%) | 2.67 |
| Single Female/Mother | 0 (0.0%) | - |
| Total Families | 22 (100.0%) | 2.23 |
Median Household Size in Cedar Crest
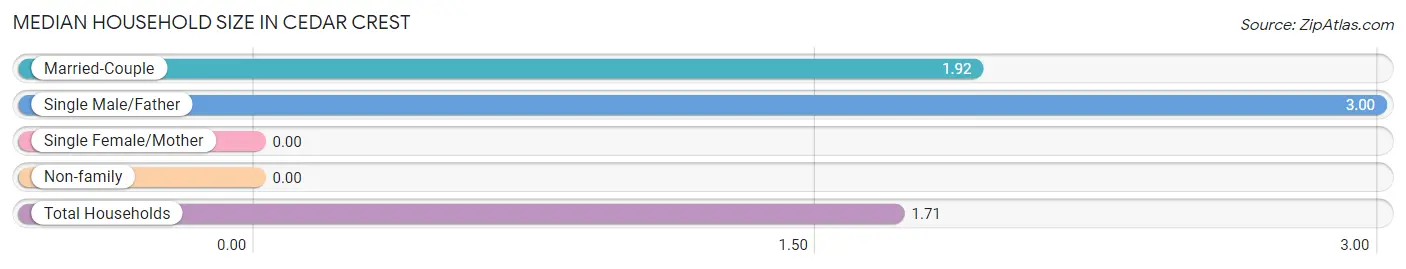
| Household Type | # Households | Household Size |
| Married-Couple | 13 (30.9%) | 1.92 |
| Single Male/Father | 9 (21.4%) | 3.00 |
| Single Female/Mother | 0 (0.0%) | - |
| Non-family | 20 (47.6%) | - |
| Total Households | 42 (100.0%) | 1.71 |
Household Size by Marriage Status in Cedar Crest
Out of a total of 42 households in Cedar Crest, 22 (52.4%) are family households, while 20 (47.6%) are nonfamily households. The most numerous type of family households are 2-person households, comprising 13, and the most common type of nonfamily households are 1-person households, comprising 20.
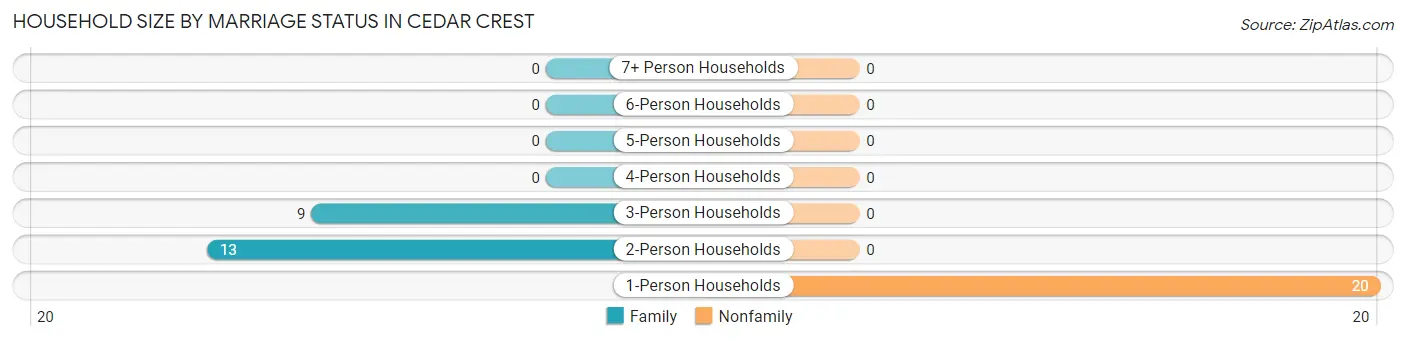
| Household Size | Family Households | Nonfamily Households |
| 1-Person Households | - | 20 (47.6%) |
| 2-Person Households | 13 (30.9%) | 0 (0.0%) |
| 3-Person Households | 9 (21.4%) | 0 (0.0%) |
| 4-Person Households | 0 (0.0%) | 0 (0.0%) |
| 5-Person Households | 0 (0.0%) | 0 (0.0%) |
| 6-Person Households | 0 (0.0%) | 0 (0.0%) |
| 7+ Person Households | 0 (0.0%) | 0 (0.0%) |
| Total | 22 (52.4%) | 20 (47.6%) |
Female Fertility in Cedar Crest
Fertility by Age in Cedar Crest
| Age Bracket | Women with Births | Births / 1,000 Women |
| 15 to 19 years | 0 (0.0%) | 0.0 |
| 20 to 34 years | 0 (0.0%) | 0.0 |
| 35 to 50 years | 0 (0.0%) | 0.0 |
| Total | 0 (0.0%) | 0.0 |
Fertility by Age by Marriage Status in Cedar Crest
| Age Bracket | Married | Unmarried |
| 15 to 19 years | 0 (0.0%) | 0 (0.0%) |
| 20 to 34 years | 0 (0.0%) | 0 (0.0%) |
| 35 to 50 years | 0 (0.0%) | 0 (0.0%) |
| Total | 0 (0.0%) | 0 (0.0%) |
Fertility by Education in Cedar Crest
| Educational Attainment | Women with Births | Births / 1,000 Women |
| Less than High School | 0 (0.0%) | 0.0 |
| High School Diploma | 0 (0.0%) | 0.0 |
| College or Associate's Degree | 0 (0.0%) | 0.0 |
| Bachelor's Degree | 0 (0.0%) | 0.0 |
| Graduate Degree | 0 (0.0%) | 0.0 |
| Total | 0 (0.0%) | 0.0 |
Fertility by Education by Marriage Status in Cedar Crest
| Educational Attainment | Married | Unmarried |
| Less than High School | 0 (0.0%) | 0 (0.0%) |
| High School Diploma | 0 (0.0%) | 0 (0.0%) |
| College or Associate's Degree | 0 (0.0%) | 0 (0.0%) |
| Bachelor's Degree | 0 (0.0%) | 0 (0.0%) |
| Graduate Degree | 0 (0.0%) | 0 (0.0%) |
| Total | 0 (0.0%) | 0 (0.0%) |
Employment Characteristics in Cedar Crest
Employment by Class of Employer in Cedar Crest
Among the 27 employed individuals in Cedar Crest, private company employees (15 | 55.6%), and not-for-profit organizations (12 | 44.4%) make up the most common classes of employment.
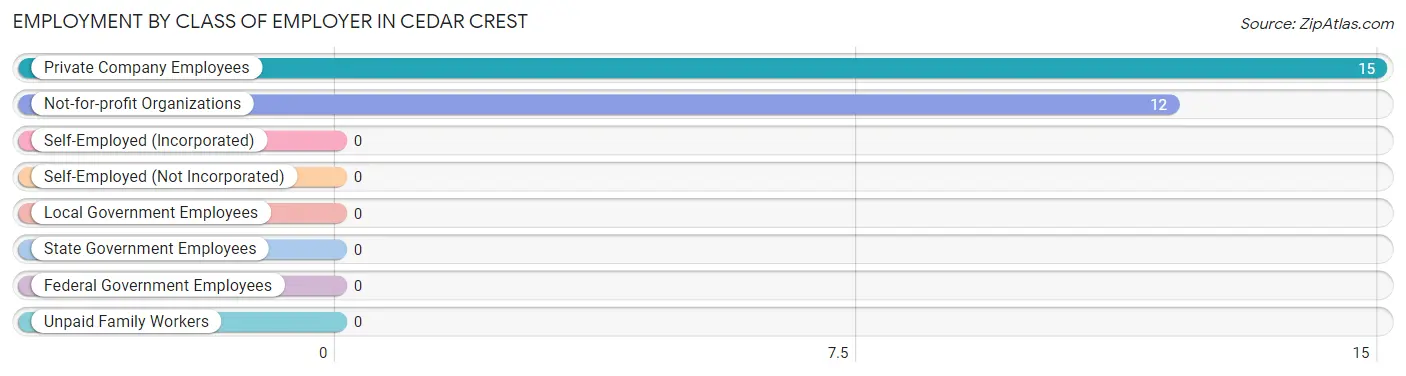
| Employer Class | # Employees | % Employees |
| Private Company Employees | 15 | 55.6% |
| Self-Employed (Incorporated) | 0 | 0.0% |
| Self-Employed (Not Incorporated) | 0 | 0.0% |
| Not-for-profit Organizations | 12 | 44.4% |
| Local Government Employees | 0 | 0.0% |
| State Government Employees | 0 | 0.0% |
| Federal Government Employees | 0 | 0.0% |
| Unpaid Family Workers | 0 | 0.0% |
| Total | 27 | 100.0% |
Employment Status by Age in Cedar Crest
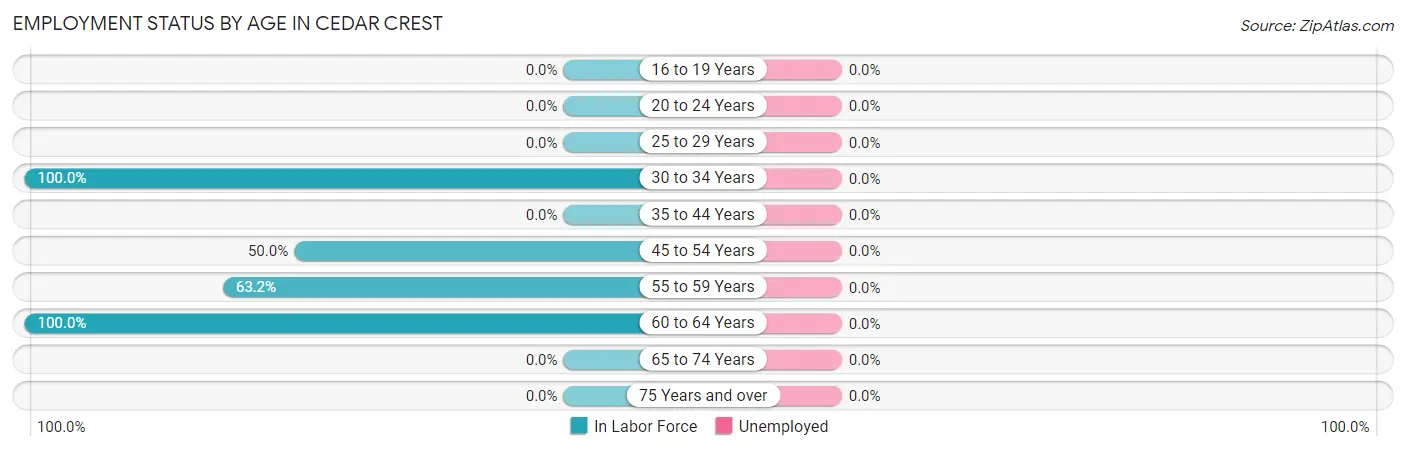
| Age Bracket | In Labor Force | Unemployed |
| 16 to 19 Years | 0 (0.0%) | 0 (0.0%) |
| 20 to 24 Years | 0 (0.0%) | 0 (0.0%) |
| 25 to 29 Years | 0 (0.0%) | 0 (0.0%) |
| 30 to 34 Years | 3 (100.0%) | 0 (0.0%) |
| 35 to 44 Years | 0 (0.0%) | 0 (0.0%) |
| 45 to 54 Years | 6 (50.0%) | 0 (0.0%) |
| 55 to 59 Years | 12 (63.2%) | 0 (0.0%) |
| 60 to 64 Years | 6 (100.0%) | 0 (0.0%) |
| 65 to 74 Years | 0 (0.0%) | 0 (0.0%) |
| 75 Years and over | 0 (0.0%) | 0 (0.0%) |
| Total | 27 (39.1%) | 0 (0.0%) |
Employment Status by Educational Attainment in Cedar Crest
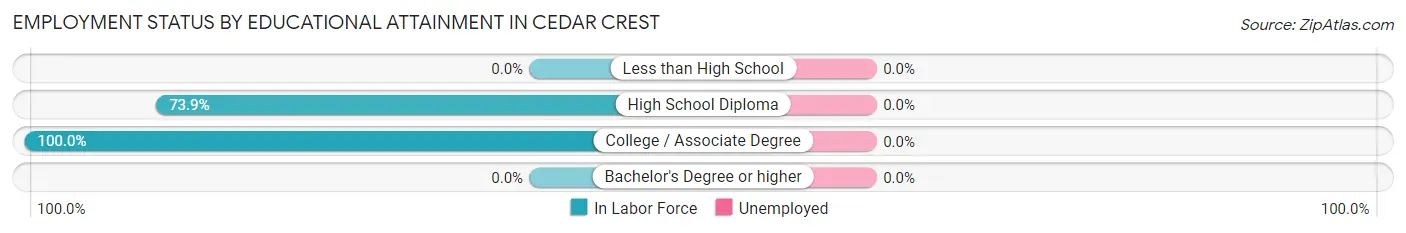
| Educational Attainment | In Labor Force | Unemployed |
| Less than High School | 0 (0.0%) | 0 (0.0%) |
| High School Diploma | 17 (73.9%) | 0 (0.0%) |
| College / Associate Degree | 10 (100.0%) | 0 (0.0%) |
| Bachelor's Degree or higher | 0 (0.0%) | 0 (0.0%) |
| Total | 27 (61.4%) | 0 (0.0%) |
Employment Occupations by Sex in Cedar Crest
Management, Business, Science and Arts Occupations
The most common Management, Business, Science and Arts occupations in Cedar Crest are Health Diagnosing & Treating (7 | 25.9%), and Health Technologists (7 | 25.9%).
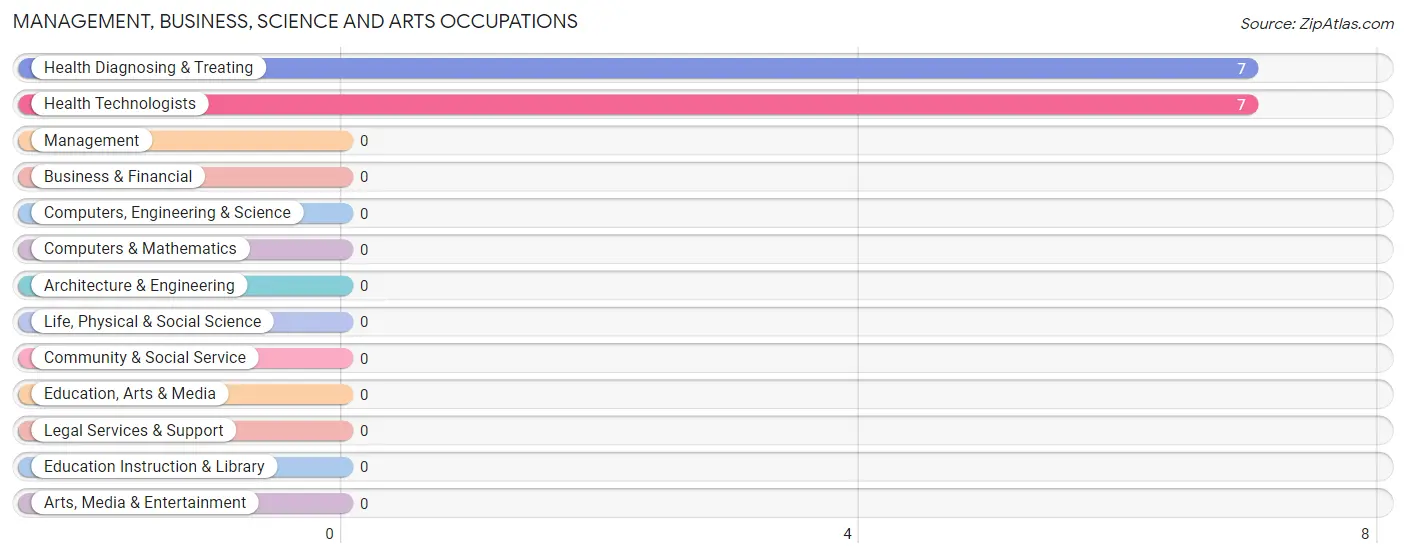
Management, Business, Science and Arts Occupations by Sex
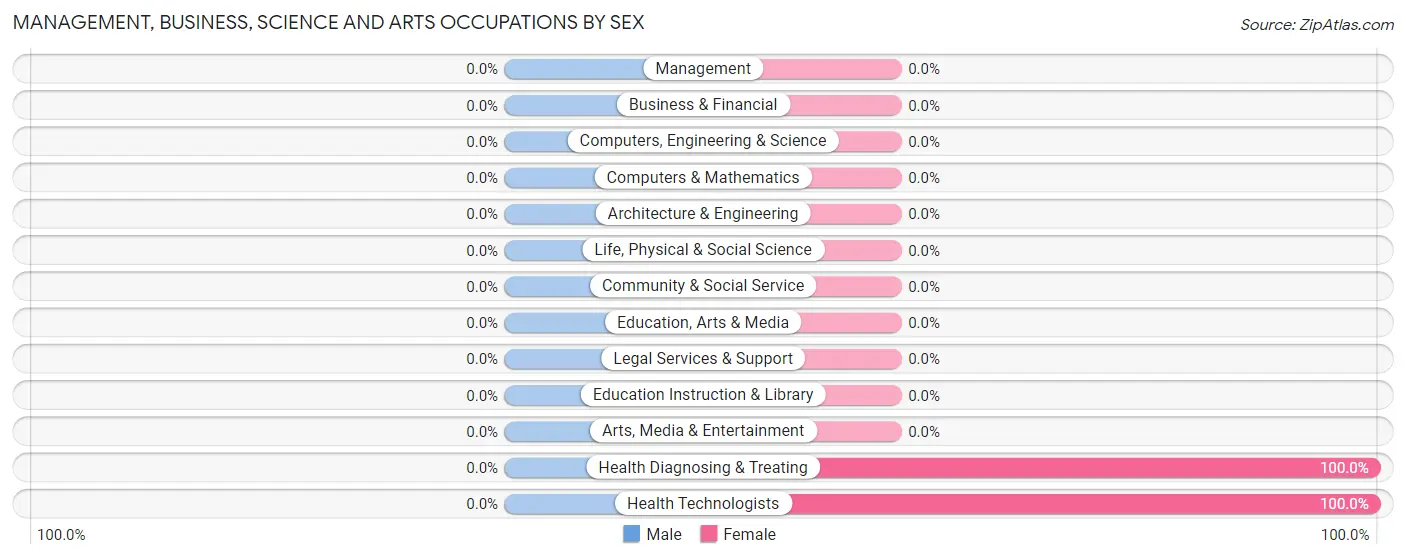
| Occupation | Male | Female |
| Management | 0 (0.0%) | 0 (0.0%) |
| Business & Financial | 0 (0.0%) | 0 (0.0%) |
| Computers, Engineering & Science | 0 (0.0%) | 0 (0.0%) |
| Computers & Mathematics | 0 (0.0%) | 0 (0.0%) |
| Architecture & Engineering | 0 (0.0%) | 0 (0.0%) |
| Life, Physical & Social Science | 0 (0.0%) | 0 (0.0%) |
| Community & Social Service | 0 (0.0%) | 0 (0.0%) |
| Education, Arts & Media | 0 (0.0%) | 0 (0.0%) |
| Legal Services & Support | 0 (0.0%) | 0 (0.0%) |
| Education Instruction & Library | 0 (0.0%) | 0 (0.0%) |
| Arts, Media & Entertainment | 0 (0.0%) | 0 (0.0%) |
| Health Diagnosing & Treating | 0 (0.0%) | 7 (100.0%) |
| Health Technologists | 0 (0.0%) | 7 (100.0%) |
| Total (Category) | 0 (0.0%) | 7 (100.0%) |
| Total (Overall) | 6 (22.2%) | 21 (77.8%) |
Services Occupations
Services Occupations by Sex
| Occupation | Male | Female |
| Healthcare Support | 0 (0.0%) | 0 (0.0%) |
| Security & Protection | 0 (0.0%) | 0 (0.0%) |
| Firefighting & Prevention | 0 (0.0%) | 0 (0.0%) |
| Law Enforcement | 0 (0.0%) | 0 (0.0%) |
| Food Preparation & Serving | 0 (0.0%) | 0 (0.0%) |
| Cleaning & Maintenance | 0 (0.0%) | 0 (0.0%) |
| Personal Care & Service | 0 (0.0%) | 0 (0.0%) |
| Total (Category) | 0 (0.0%) | 0 (0.0%) |
| Total (Overall) | 6 (22.2%) | 21 (77.8%) |
Sales and Office Occupations
The most common Sales and Office occupations in Cedar Crest are Office & Administration (5 | 18.5%), and Sales & Related (3 | 11.1%).
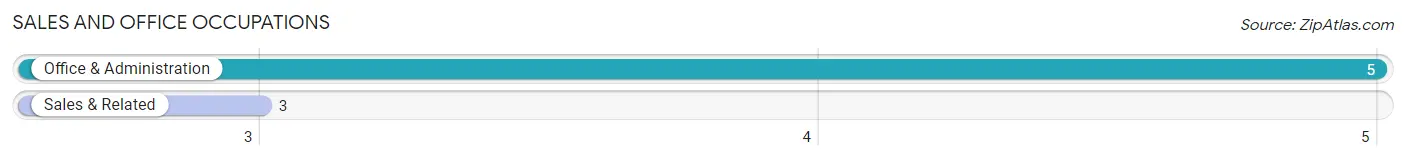
Sales and Office Occupations by Sex
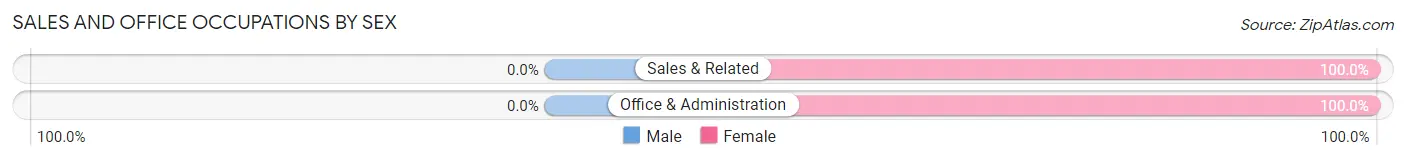
| Occupation | Male | Female |
| Sales & Related | 0 (0.0%) | 3 (100.0%) |
| Office & Administration | 0 (0.0%) | 5 (100.0%) |
| Total (Category) | 0 (0.0%) | 8 (100.0%) |
| Total (Overall) | 6 (22.2%) | 21 (77.8%) |
Natural Resources, Construction and Maintenance Occupations
The most common Natural Resources, Construction and Maintenance occupations in Cedar Crest are , and Construction & Extraction (6 | 22.2%).
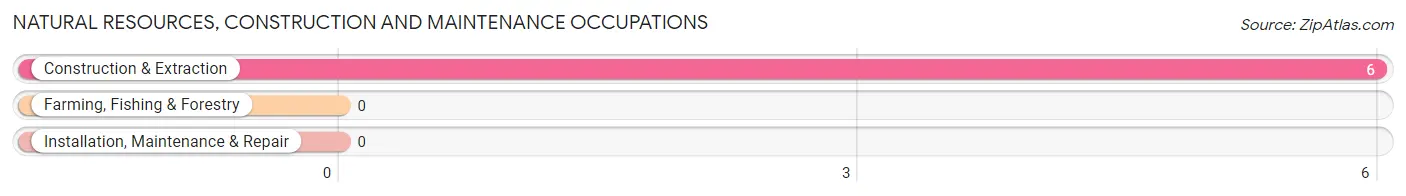
Natural Resources, Construction and Maintenance Occupations by Sex
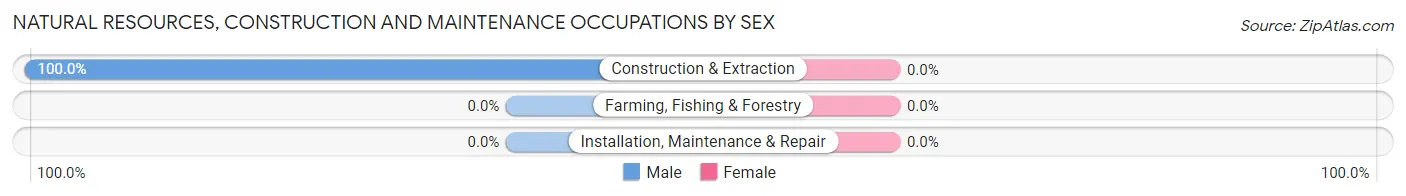
| Occupation | Male | Female |
| Farming, Fishing & Forestry | 0 (0.0%) | 0 (0.0%) |
| Construction & Extraction | 6 (100.0%) | 0 (0.0%) |
| Installation, Maintenance & Repair | 0 (0.0%) | 0 (0.0%) |
| Total (Category) | 6 (100.0%) | 0 (0.0%) |
| Total (Overall) | 6 (22.2%) | 21 (77.8%) |
Production, Transportation and Moving Occupations
The most common Production, Transportation and Moving occupations in Cedar Crest are , and Material Moving (6 | 22.2%).
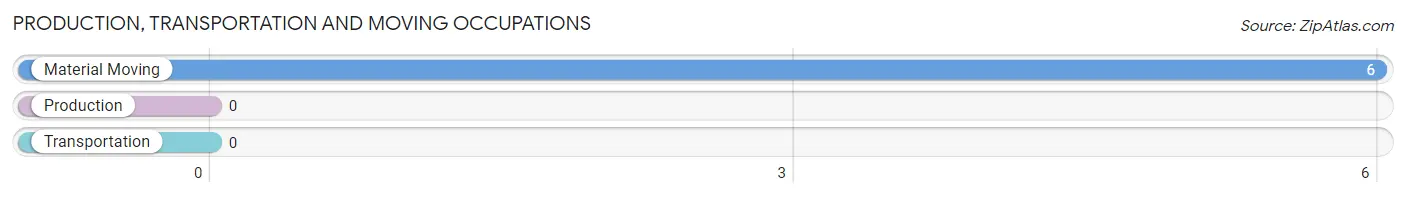
Production, Transportation and Moving Occupations by Sex
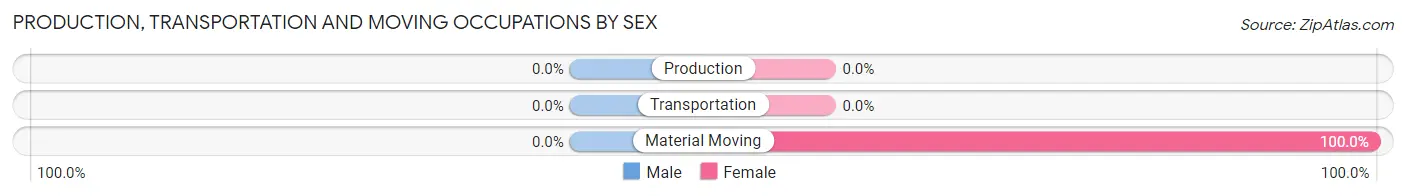
| Occupation | Male | Female |
| Production | 0 (0.0%) | 0 (0.0%) |
| Transportation | 0 (0.0%) | 0 (0.0%) |
| Material Moving | 0 (0.0%) | 6 (100.0%) |
| Total (Category) | 0 (0.0%) | 6 (100.0%) |
| Total (Overall) | 6 (22.2%) | 21 (77.8%) |
Employment Industries by Sex in Cedar Crest
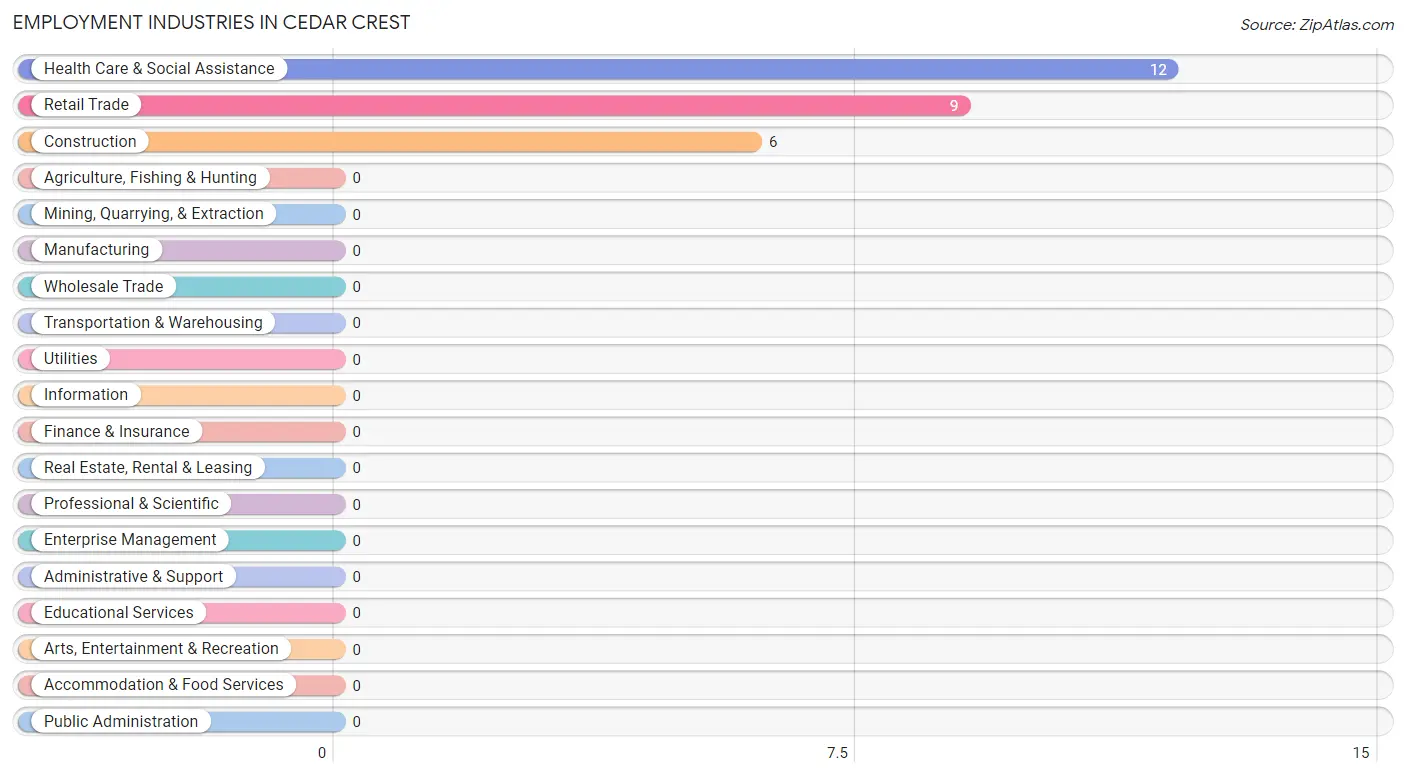
Employment Industries in Cedar Crest
The major employment industries in Cedar Crest include Health Care & Social Assistance (12 | 44.4%), Retail Trade (9 | 33.3%), and Construction (6 | 22.2%).
Employment Industries by Sex in Cedar Crest
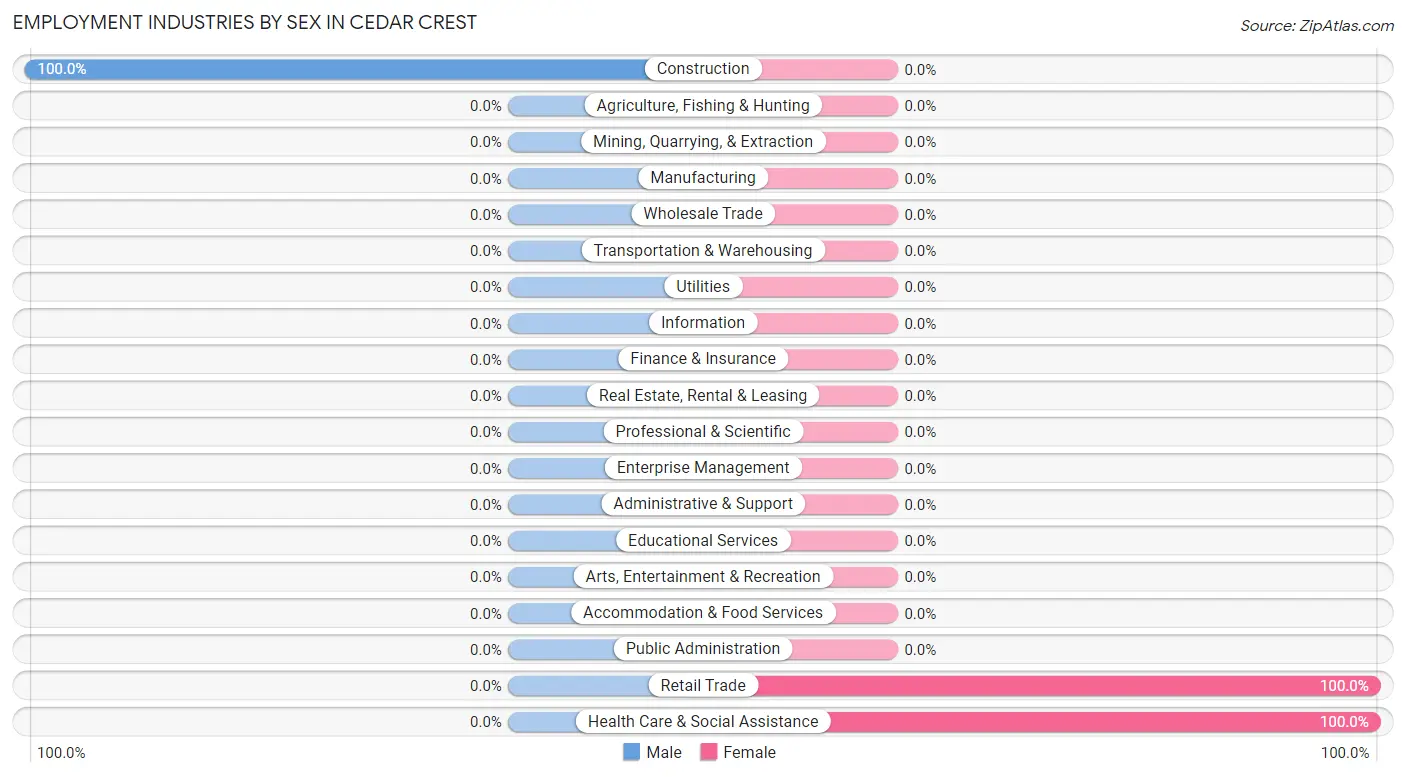
| Industry | Male | Female |
| Agriculture, Fishing & Hunting | 0 (0.0%) | 0 (0.0%) |
| Mining, Quarrying, & Extraction | 0 (0.0%) | 0 (0.0%) |
| Construction | 6 (100.0%) | 0 (0.0%) |
| Manufacturing | 0 (0.0%) | 0 (0.0%) |
| Wholesale Trade | 0 (0.0%) | 0 (0.0%) |
| Retail Trade | 0 (0.0%) | 9 (100.0%) |
| Transportation & Warehousing | 0 (0.0%) | 0 (0.0%) |
| Utilities | 0 (0.0%) | 0 (0.0%) |
| Information | 0 (0.0%) | 0 (0.0%) |
| Finance & Insurance | 0 (0.0%) | 0 (0.0%) |
| Real Estate, Rental & Leasing | 0 (0.0%) | 0 (0.0%) |
| Professional & Scientific | 0 (0.0%) | 0 (0.0%) |
| Enterprise Management | 0 (0.0%) | 0 (0.0%) |
| Administrative & Support | 0 (0.0%) | 0 (0.0%) |
| Educational Services | 0 (0.0%) | 0 (0.0%) |
| Health Care & Social Assistance | 0 (0.0%) | 12 (100.0%) |
| Arts, Entertainment & Recreation | 0 (0.0%) | 0 (0.0%) |
| Accommodation & Food Services | 0 (0.0%) | 0 (0.0%) |
| Public Administration | 0 (0.0%) | 0 (0.0%) |
| Total | 6 (22.2%) | 21 (77.8%) |
Education in Cedar Crest
School Enrollment in Cedar Crest
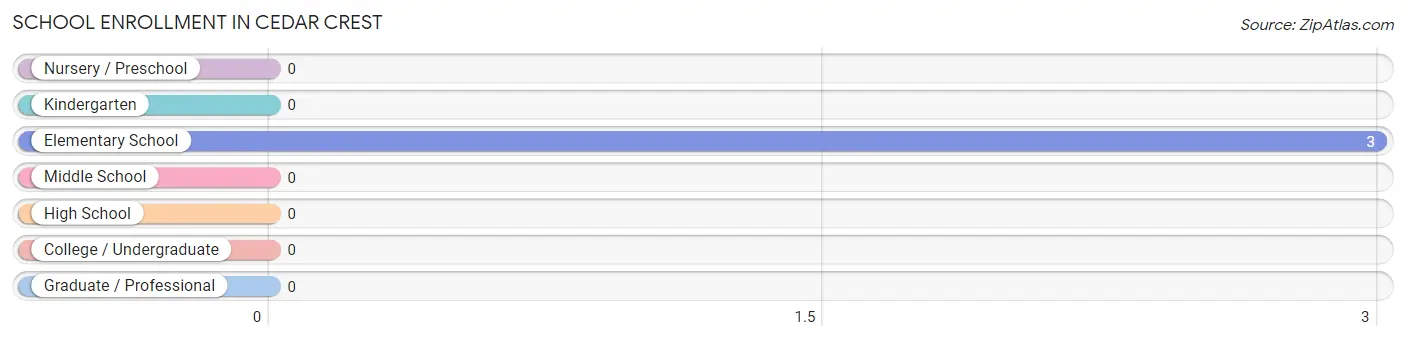
| School Level | # Students | % Students |
| Nursery / Preschool | 0 | 0.0% |
| Kindergarten | 0 | 0.0% |
| Elementary School | 3 | 100.0% |
| Middle School | 0 | 0.0% |
| High School | 0 | 0.0% |
| College / Undergraduate | 0 | 0.0% |
| Graduate / Professional | 0 | 0.0% |
| Total | 3 | 100.0% |
School Enrollment by Age by Funding Source in Cedar Crest
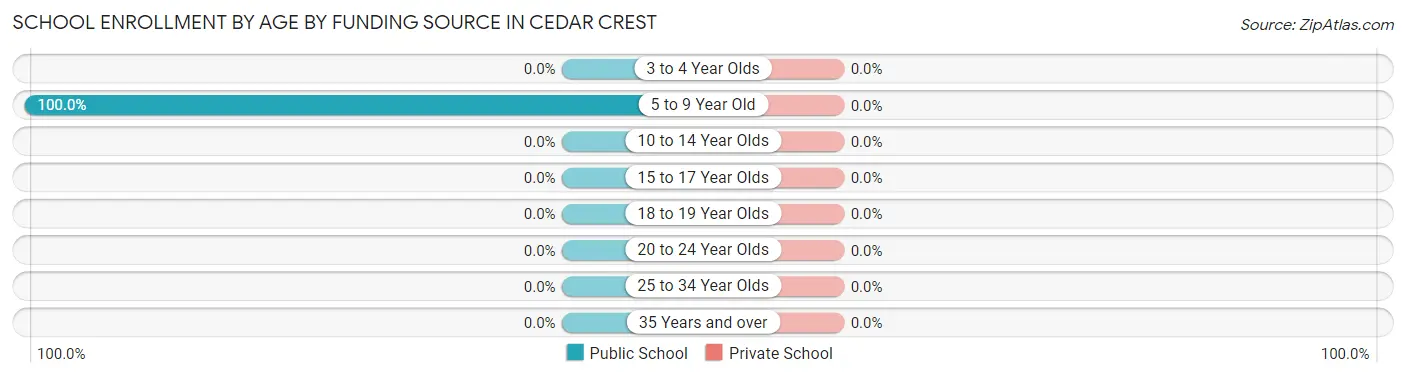
| Age Bracket | Public School | Private School |
| 3 to 4 Year Olds | 0 (0.0%) | 0 (0.0%) |
| 5 to 9 Year Old | 3 (100.0%) | 0 (0.0%) |
| 10 to 14 Year Olds | 0 (0.0%) | 0 (0.0%) |
| 15 to 17 Year Olds | 0 (0.0%) | 0 (0.0%) |
| 18 to 19 Year Olds | 0 (0.0%) | 0 (0.0%) |
| 20 to 24 Year Olds | 0 (0.0%) | 0 (0.0%) |
| 25 to 34 Year Olds | 0 (0.0%) | 0 (0.0%) |
| 35 Years and over | 0 (0.0%) | 0 (0.0%) |
| Total | 3 (100.0%) | 0 (0.0%) |
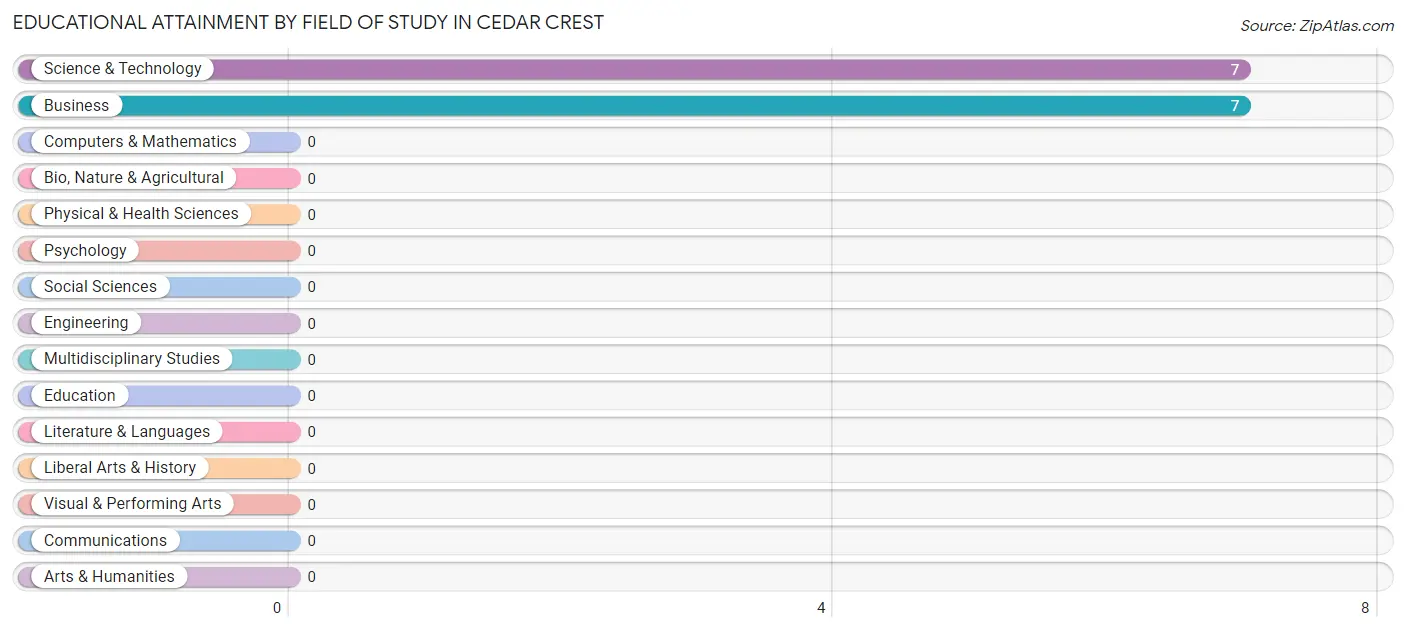
Educational Attainment by Field of Study in Cedar Crest
Science & technology (7 | 50.0%), and business (7 | 50.0%) are the most common fields of study among 14 individuals in Cedar Crest who have obtained a bachelor's degree or higher.
| Field of Study | # Graduates | % Graduates |
| Computers & Mathematics | 0 | 0.0% |
| Bio, Nature & Agricultural | 0 | 0.0% |
| Physical & Health Sciences | 0 | 0.0% |
| Psychology | 0 | 0.0% |
| Social Sciences | 0 | 0.0% |
| Engineering | 0 | 0.0% |
| Multidisciplinary Studies | 0 | 0.0% |
| Science & Technology | 7 | 50.0% |
| Business | 7 | 50.0% |
| Education | 0 | 0.0% |
| Literature & Languages | 0 | 0.0% |
| Liberal Arts & History | 0 | 0.0% |
| Visual & Performing Arts | 0 | 0.0% |
| Communications | 0 | 0.0% |
| Arts & Humanities | 0 | 0.0% |
| Total | 14 | 100.0% |
Transportation & Commute in Cedar Crest
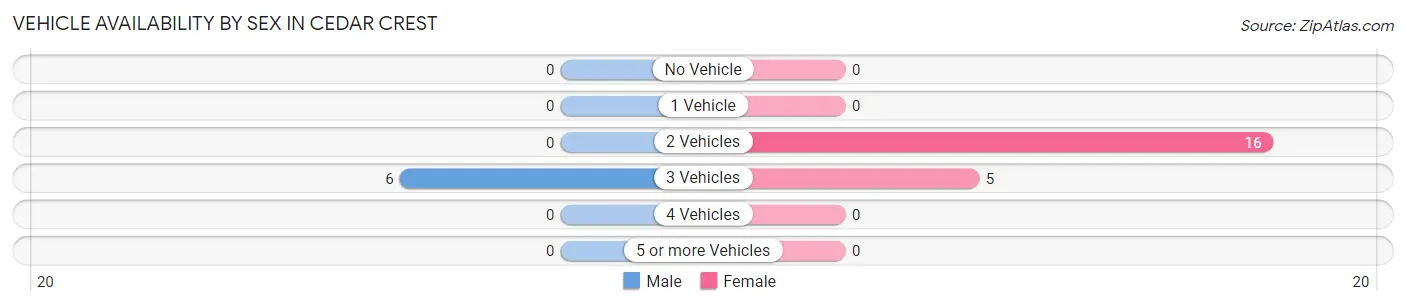
Vehicle Availability by Sex in Cedar Crest
The most prevalent vehicle ownership categories in Cedar Crest are males with 3 vehicles (6, accounting for 100.0%) and females with 3 vehicles (5, making up 28.6%).
| Vehicles Available | Male | Female |
| No Vehicle | 0 (0.0%) | 0 (0.0%) |
| 1 Vehicle | 0 (0.0%) | 0 (0.0%) |
| 2 Vehicles | 0 (0.0%) | 16 (76.2%) |
| 3 Vehicles | 6 (100.0%) | 5 (23.8%) |
| 4 Vehicles | 0 (0.0%) | 0 (0.0%) |
| 5 or more Vehicles | 0 (0.0%) | 0 (0.0%) |
| Total | 6 (100.0%) | 21 (100.0%) |
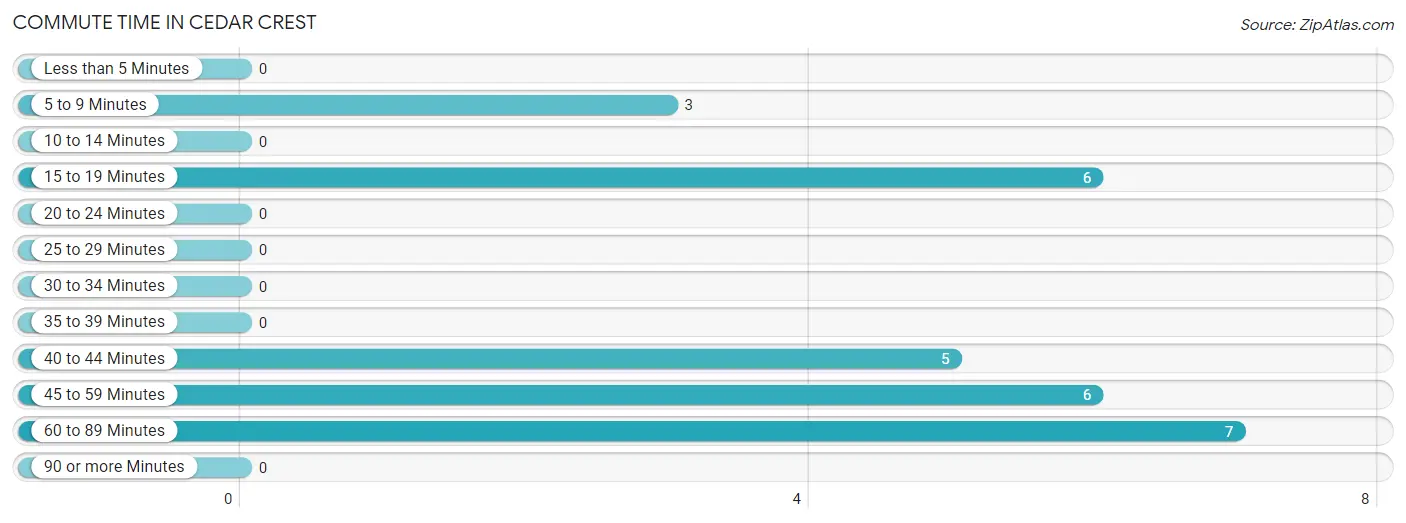
Commute Time in Cedar Crest
The most frequently occuring commute durations in Cedar Crest are 60 to 89 minutes (7 commuters, 25.9%), 15 to 19 minutes (6 commuters, 22.2%), and 45 to 59 minutes (6 commuters, 22.2%).
| Commute Time | # Commuters | % Commuters |
| Less than 5 Minutes | 0 | 0.0% |
| 5 to 9 Minutes | 3 | 11.1% |
| 10 to 14 Minutes | 0 | 0.0% |
| 15 to 19 Minutes | 6 | 22.2% |
| 20 to 24 Minutes | 0 | 0.0% |
| 25 to 29 Minutes | 0 | 0.0% |
| 30 to 34 Minutes | 0 | 0.0% |
| 35 to 39 Minutes | 0 | 0.0% |
| 40 to 44 Minutes | 5 | 18.5% |
| 45 to 59 Minutes | 6 | 22.2% |
| 60 to 89 Minutes | 7 | 25.9% |
| 90 or more Minutes | 0 | 0.0% |
Commute Time by Sex in Cedar Crest
The most common commute times in Cedar Crest are 45 to 59 minutes (6 commuters, 100.0%) for males and 60 to 89 minutes (7 commuters, 33.3%) for females.
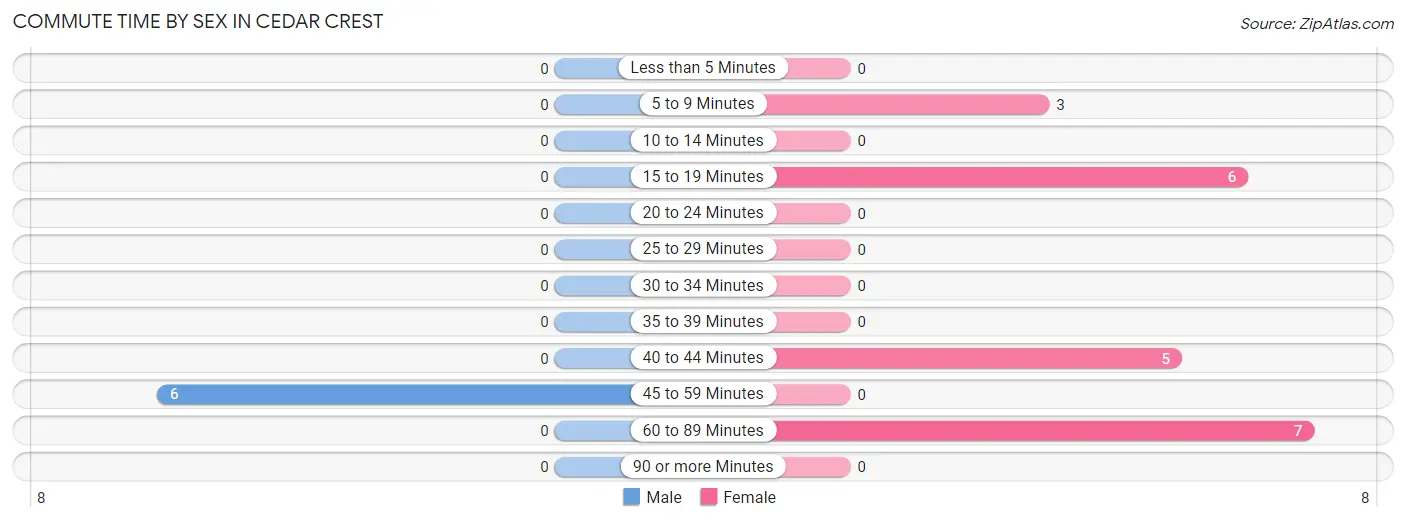
| Commute Time | Male | Female |
| Less than 5 Minutes | 0 (0.0%) | 0 (0.0%) |
| 5 to 9 Minutes | 0 (0.0%) | 3 (14.3%) |
| 10 to 14 Minutes | 0 (0.0%) | 0 (0.0%) |
| 15 to 19 Minutes | 0 (0.0%) | 6 (28.6%) |
| 20 to 24 Minutes | 0 (0.0%) | 0 (0.0%) |
| 25 to 29 Minutes | 0 (0.0%) | 0 (0.0%) |
| 30 to 34 Minutes | 0 (0.0%) | 0 (0.0%) |
| 35 to 39 Minutes | 0 (0.0%) | 0 (0.0%) |
| 40 to 44 Minutes | 0 (0.0%) | 5 (23.8%) |
| 45 to 59 Minutes | 6 (100.0%) | 0 (0.0%) |
| 60 to 89 Minutes | 0 (0.0%) | 7 (33.3%) |
| 90 or more Minutes | 0 (0.0%) | 0 (0.0%) |
Time of Departure to Work by Sex in Cedar Crest
The most frequent times of departure to work in Cedar Crest are 5:00 AM to 5:29 AM (6, 100.0%) for males and 7:00 AM to 7:29 AM (12, 57.1%) for females.
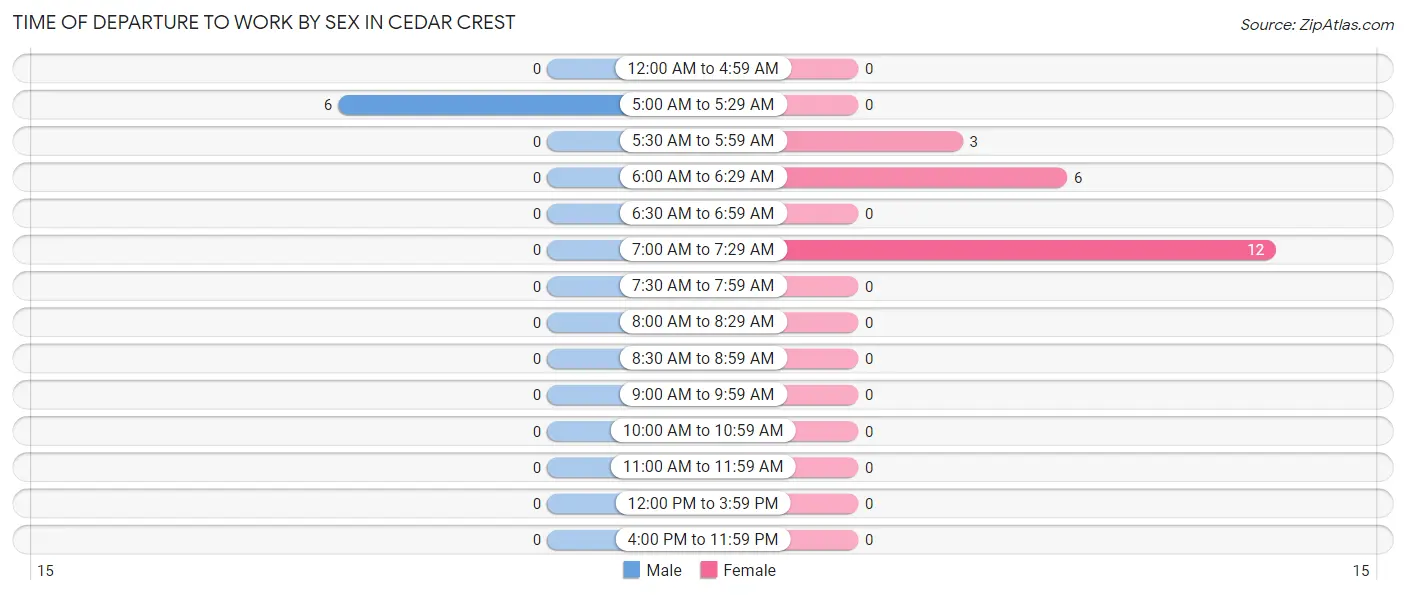
| Time of Departure | Male | Female |
| 12:00 AM to 4:59 AM | 0 (0.0%) | 0 (0.0%) |
| 5:00 AM to 5:29 AM | 6 (100.0%) | 0 (0.0%) |
| 5:30 AM to 5:59 AM | 0 (0.0%) | 3 (14.3%) |
| 6:00 AM to 6:29 AM | 0 (0.0%) | 6 (28.6%) |
| 6:30 AM to 6:59 AM | 0 (0.0%) | 0 (0.0%) |
| 7:00 AM to 7:29 AM | 0 (0.0%) | 12 (57.1%) |
| 7:30 AM to 7:59 AM | 0 (0.0%) | 0 (0.0%) |
| 8:00 AM to 8:29 AM | 0 (0.0%) | 0 (0.0%) |
| 8:30 AM to 8:59 AM | 0 (0.0%) | 0 (0.0%) |
| 9:00 AM to 9:59 AM | 0 (0.0%) | 0 (0.0%) |
| 10:00 AM to 10:59 AM | 0 (0.0%) | 0 (0.0%) |
| 11:00 AM to 11:59 AM | 0 (0.0%) | 0 (0.0%) |
| 12:00 PM to 3:59 PM | 0 (0.0%) | 0 (0.0%) |
| 4:00 PM to 11:59 PM | 0 (0.0%) | 0 (0.0%) |
| Total | 6 (100.0%) | 21 (100.0%) |
Housing Occupancy in Cedar Crest
Occupancy by Ownership in Cedar Crest
Of the total 42 dwellings in Cedar Crest, owner-occupied units account for 42 (100.0%), while renter-occupied units make up 0 (0.0%).
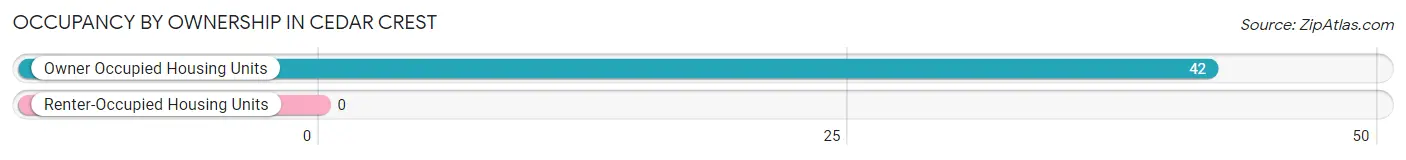
| Occupancy | # Housing Units | % Housing Units |
| Owner Occupied Housing Units | 42 | 100.0% |
| Renter-Occupied Housing Units | 0 | 0.0% |
| Total Occupied Housing Units | 42 | 100.0% |
Occupancy by Household Size in Cedar Crest
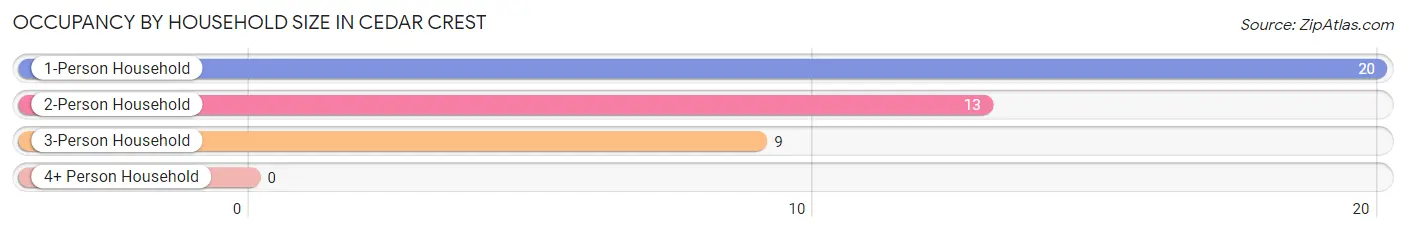
| Household Size | # Housing Units | % Housing Units |
| 1-Person Household | 20 | 47.6% |
| 2-Person Household | 13 | 30.9% |
| 3-Person Household | 9 | 21.4% |
| 4+ Person Household | 0 | 0.0% |
| Total Housing Units | 42 | 100.0% |
Occupancy by Ownership by Household Size in Cedar Crest
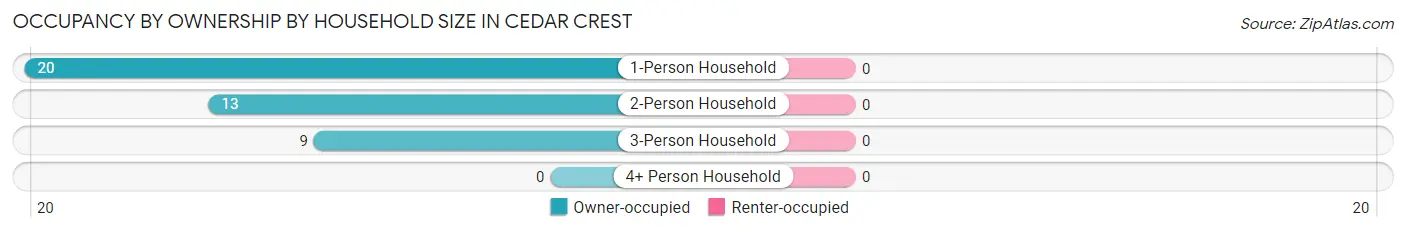
| Household Size | Owner-occupied | Renter-occupied |
| 1-Person Household | 20 (100.0%) | 0 (0.0%) |
| 2-Person Household | 13 (100.0%) | 0 (0.0%) |
| 3-Person Household | 9 (100.0%) | 0 (0.0%) |
| 4+ Person Household | 0 (0.0%) | 0 (0.0%) |
| Total Housing Units | 42 (100.0%) | 0 (0.0%) |
Occupancy by Educational Attainment in Cedar Crest
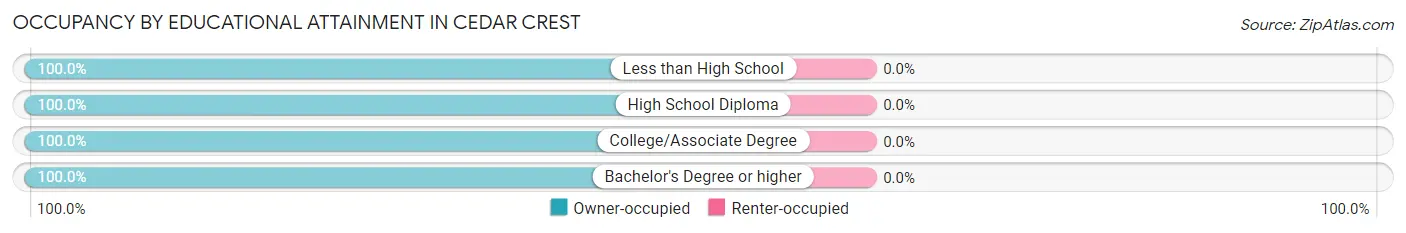
| Household Size | Owner-occupied | Renter-occupied |
| Less than High School | 19 (100.0%) | 0 (0.0%) |
| High School Diploma | 11 (100.0%) | 0 (0.0%) |
| College/Associate Degree | 5 (100.0%) | 0 (0.0%) |
| Bachelor's Degree or higher | 7 (100.0%) | 0 (0.0%) |
Occupancy by Age of Householder in Cedar Crest
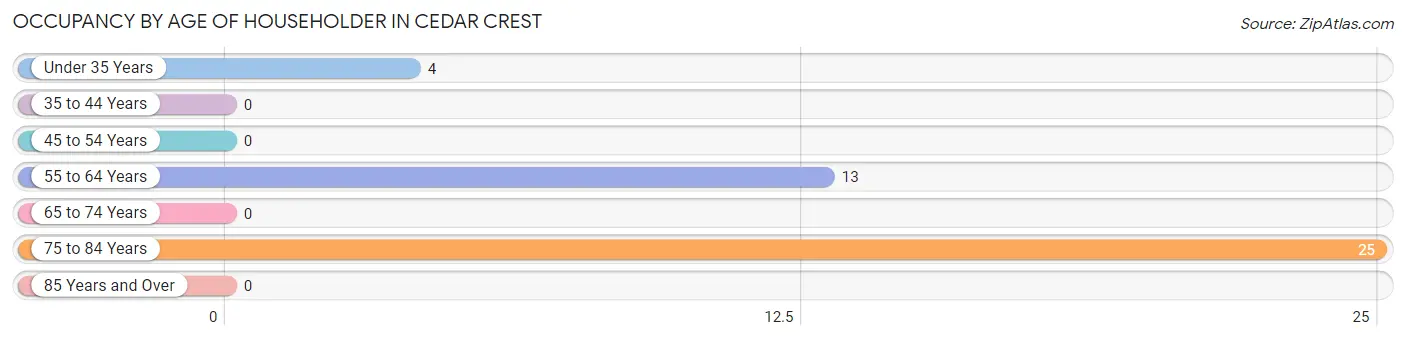
| Age Bracket | # Households | % Households |
| Under 35 Years | 4 | 9.5% |
| 35 to 44 Years | 0 | 0.0% |
| 45 to 54 Years | 0 | 0.0% |
| 55 to 64 Years | 13 | 30.9% |
| 65 to 74 Years | 0 | 0.0% |
| 75 to 84 Years | 25 | 59.5% |
| 85 Years and Over | 0 | 0.0% |
| Total | 42 | 100.0% |
Housing Finances in Cedar Crest
Median Income by Occupancy in Cedar Crest
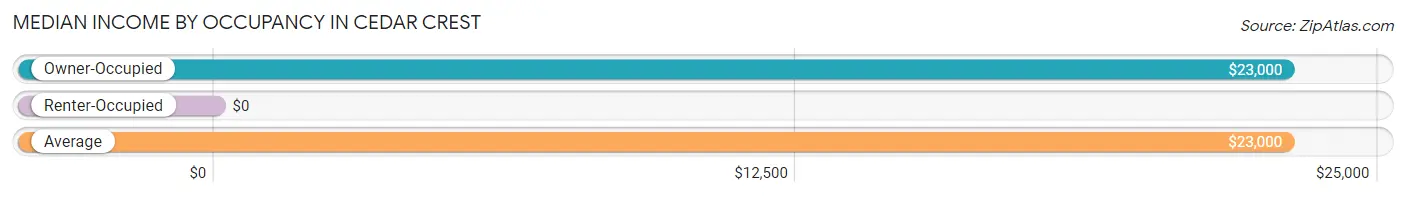
| Occupancy Type | # Households | Median Income |
| Owner-Occupied | 42 (100.0%) | $23,000 |
| Renter-Occupied | 0 (0.0%) | $0 |
| Average | 42 (100.0%) | $23,000 |
Occupancy by Householder Income Bracket in Cedar Crest
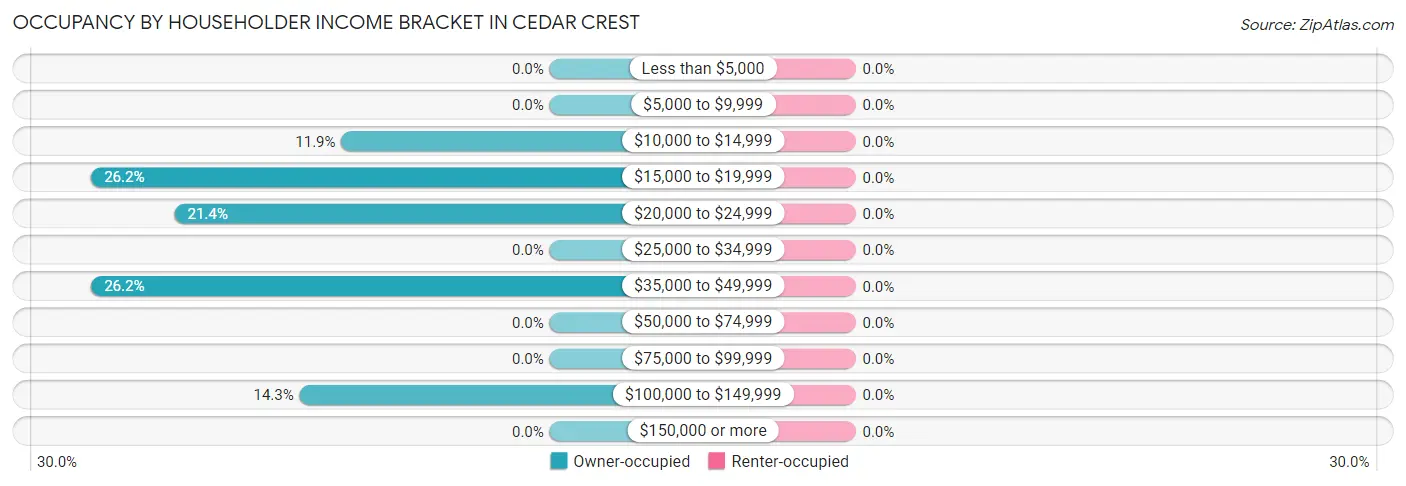
| Income Bracket | Owner-occupied | Renter-occupied |
| Less than $5,000 | 0 (0.0%) | 0 (0.0%) |
| $5,000 to $9,999 | 0 (0.0%) | 0 (0.0%) |
| $10,000 to $14,999 | 5 (11.9%) | 0 (0.0%) |
| $15,000 to $19,999 | 11 (26.2%) | 0 (0.0%) |
| $20,000 to $24,999 | 9 (21.4%) | 0 (0.0%) |
| $25,000 to $34,999 | 0 (0.0%) | 0 (0.0%) |
| $35,000 to $49,999 | 11 (26.2%) | 0 (0.0%) |
| $50,000 to $74,999 | 0 (0.0%) | 0 (0.0%) |
| $75,000 to $99,999 | 0 (0.0%) | 0 (0.0%) |
| $100,000 to $149,999 | 6 (14.3%) | 0 (0.0%) |
| $150,000 or more | 0 (0.0%) | 0 (0.0%) |
| Total | 42 (100.0%) | 0 (0.0%) |
Monthly Housing Cost Tiers in Cedar Crest
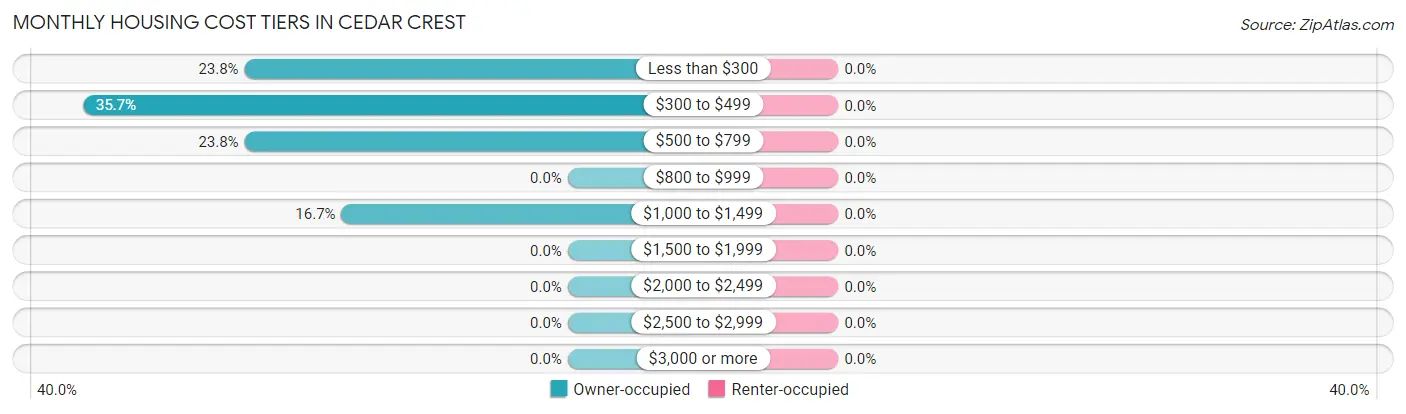
| Monthly Cost | Owner-occupied | Renter-occupied |
| Less than $300 | 10 (23.8%) | 0 (0.0%) |
| $300 to $499 | 15 (35.7%) | 0 (0.0%) |
| $500 to $799 | 10 (23.8%) | 0 (0.0%) |
| $800 to $999 | 0 (0.0%) | 0 (0.0%) |
| $1,000 to $1,499 | 7 (16.7%) | 0 (0.0%) |
| $1,500 to $1,999 | 0 (0.0%) | 0 (0.0%) |
| $2,000 to $2,499 | 0 (0.0%) | 0 (0.0%) |
| $2,500 to $2,999 | 0 (0.0%) | 0 (0.0%) |
| $3,000 or more | 0 (0.0%) | 0 (0.0%) |
| Total | 42 (100.0%) | 0 (0.0%) |
Physical Housing Characteristics in Cedar Crest
Housing Structures in Cedar Crest
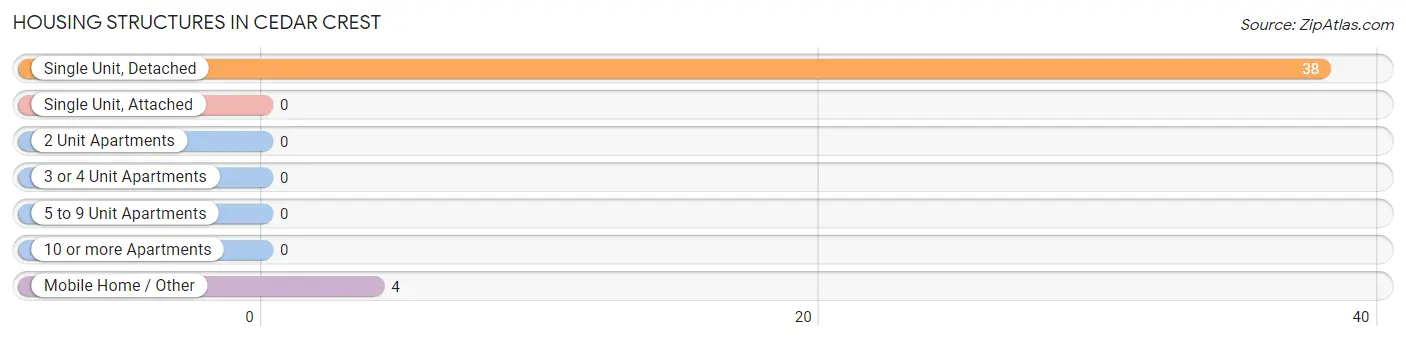
| Structure Type | # Housing Units | % Housing Units |
| Single Unit, Detached | 38 | 90.5% |
| Single Unit, Attached | 0 | 0.0% |
| 2 Unit Apartments | 0 | 0.0% |
| 3 or 4 Unit Apartments | 0 | 0.0% |
| 5 to 9 Unit Apartments | 0 | 0.0% |
| 10 or more Apartments | 0 | 0.0% |
| Mobile Home / Other | 4 | 9.5% |
| Total | 42 | 100.0% |
Housing Structures by Occupancy in Cedar Crest
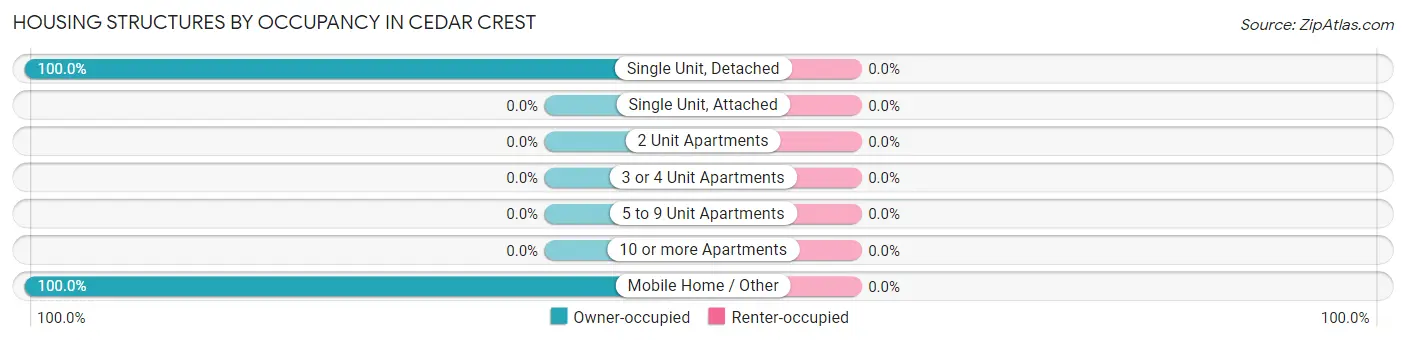
| Structure Type | Owner-occupied | Renter-occupied |
| Single Unit, Detached | 38 (100.0%) | 0 (0.0%) |
| Single Unit, Attached | 0 (0.0%) | 0 (0.0%) |
| 2 Unit Apartments | 0 (0.0%) | 0 (0.0%) |
| 3 or 4 Unit Apartments | 0 (0.0%) | 0 (0.0%) |
| 5 to 9 Unit Apartments | 0 (0.0%) | 0 (0.0%) |
| 10 or more Apartments | 0 (0.0%) | 0 (0.0%) |
| Mobile Home / Other | 4 (100.0%) | 0 (0.0%) |
| Total | 42 (100.0%) | 0 (0.0%) |
Housing Structures by Number of Rooms in Cedar Crest
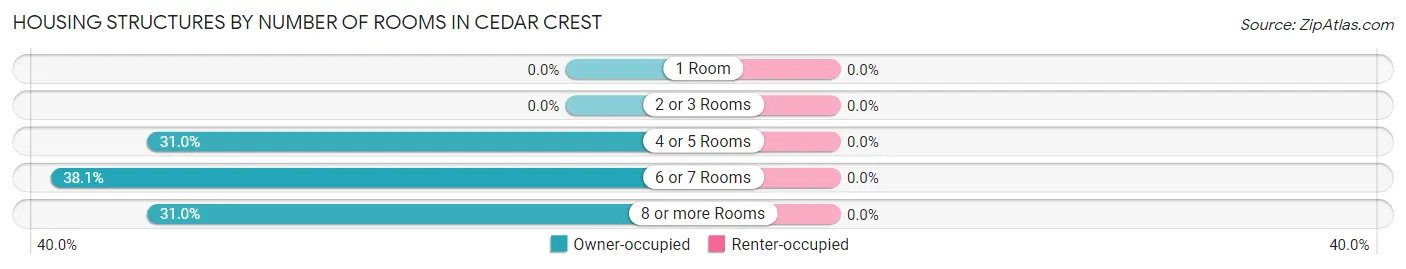
| Number of Rooms | Owner-occupied | Renter-occupied |
| 1 Room | 0 (0.0%) | 0 (0.0%) |
| 2 or 3 Rooms | 0 (0.0%) | 0 (0.0%) |
| 4 or 5 Rooms | 13 (30.9%) | 0 (0.0%) |
| 6 or 7 Rooms | 16 (38.1%) | 0 (0.0%) |
| 8 or more Rooms | 13 (30.9%) | 0 (0.0%) |
| Total | 42 (100.0%) | 0 (0.0%) |
Housing Structure by Heating Type in Cedar Crest
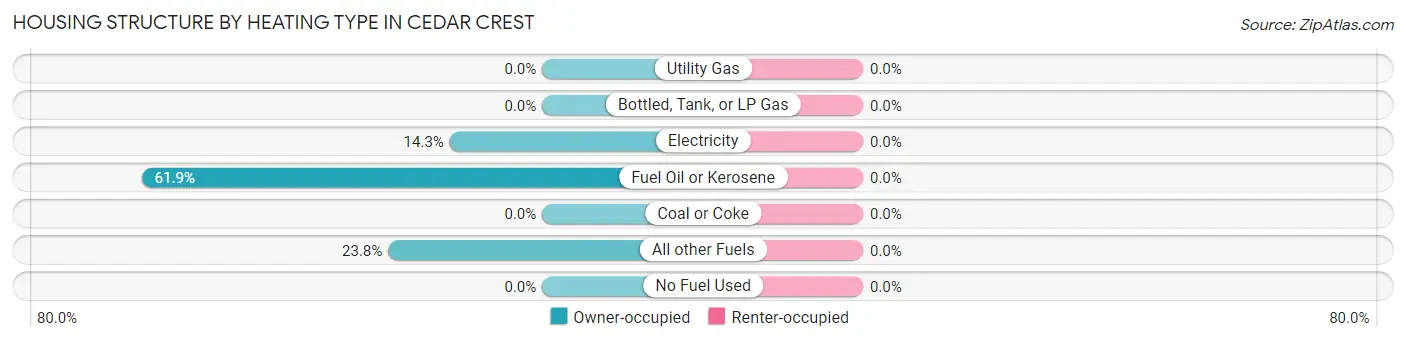
| Heating Type | Owner-occupied | Renter-occupied |
| Utility Gas | 0 (0.0%) | 0 (0.0%) |
| Bottled, Tank, or LP Gas | 0 (0.0%) | 0 (0.0%) |
| Electricity | 6 (14.3%) | 0 (0.0%) |
| Fuel Oil or Kerosene | 26 (61.9%) | 0 (0.0%) |
| Coal or Coke | 0 (0.0%) | 0 (0.0%) |
| All other Fuels | 10 (23.8%) | 0 (0.0%) |
| No Fuel Used | 0 (0.0%) | 0 (0.0%) |
| Total | 42 (100.0%) | 0 (0.0%) |
Household Vehicle Usage in Cedar Crest
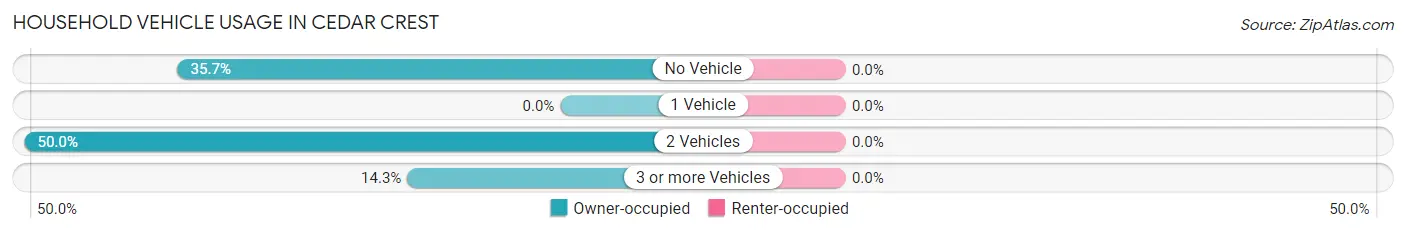
| Vehicles per Household | Owner-occupied | Renter-occupied |
| No Vehicle | 15 (35.7%) | 0 (0.0%) |
| 1 Vehicle | 0 (0.0%) | 0 (0.0%) |
| 2 Vehicles | 21 (50.0%) | 0 (0.0%) |
| 3 or more Vehicles | 6 (14.3%) | 0 (0.0%) |
| Total | 42 (100.0%) | 0 (0.0%) |
Real Estate & Mortgages in Cedar Crest
Real Estate and Mortgage Overview in Cedar Crest
| Characteristic | Without Mortgage | With Mortgage |
| Housing Units | 29 | 13 |
| Median Property Value | $83,900 | $0 |
| Median Household Income | $22,750 | $0 |
| Monthly Housing Costs | $325 | $0 |
| Real Estate Taxes | $1,150 | $0 |
Property Value by Mortgage Status in Cedar Crest
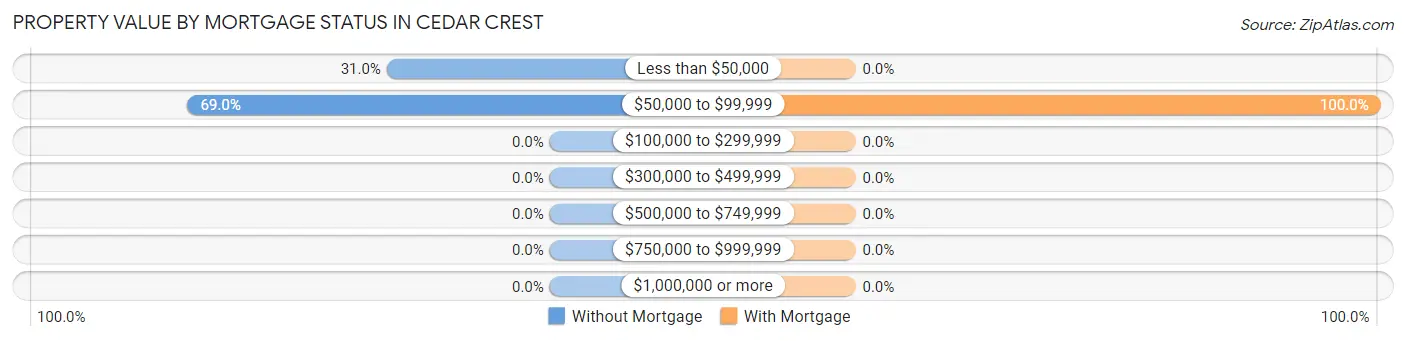
| Property Value | Without Mortgage | With Mortgage |
| Less than $50,000 | 9 (31.0%) | 0 (0.0%) |
| $50,000 to $99,999 | 20 (69.0%) | 13 (100.0%) |
| $100,000 to $299,999 | 0 (0.0%) | 0 (0.0%) |
| $300,000 to $499,999 | 0 (0.0%) | 0 (0.0%) |
| $500,000 to $749,999 | 0 (0.0%) | 0 (0.0%) |
| $750,000 to $999,999 | 0 (0.0%) | 0 (0.0%) |
| $1,000,000 or more | 0 (0.0%) | 0 (0.0%) |
| Total | 29 (100.0%) | 13 (100.0%) |
Household Income by Mortgage Status in Cedar Crest
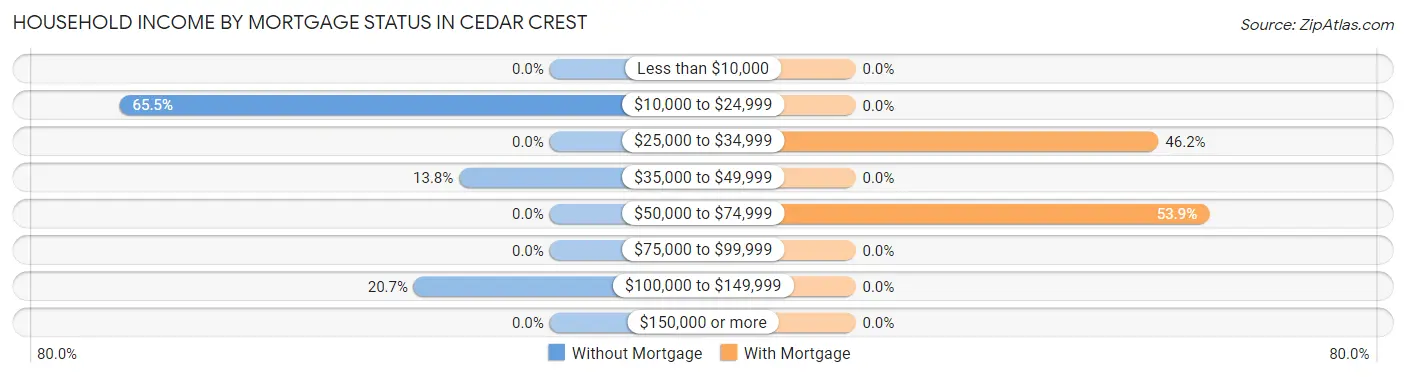
| Household Income | Without Mortgage | With Mortgage |
| Less than $10,000 | 0 (0.0%) | 0 (0.0%) |
| $10,000 to $24,999 | 19 (65.5%) | 0 (0.0%) |
| $25,000 to $34,999 | 0 (0.0%) | 6 (46.2%) |
| $35,000 to $49,999 | 4 (13.8%) | 0 (0.0%) |
| $50,000 to $74,999 | 0 (0.0%) | 7 (53.8%) |
| $75,000 to $99,999 | 0 (0.0%) | 0 (0.0%) |
| $100,000 to $149,999 | 6 (20.7%) | 0 (0.0%) |
| $150,000 or more | 0 (0.0%) | 0 (0.0%) |
| Total | 29 (100.0%) | 13 (100.0%) |
Property Value to Household Income Ratio in Cedar Crest
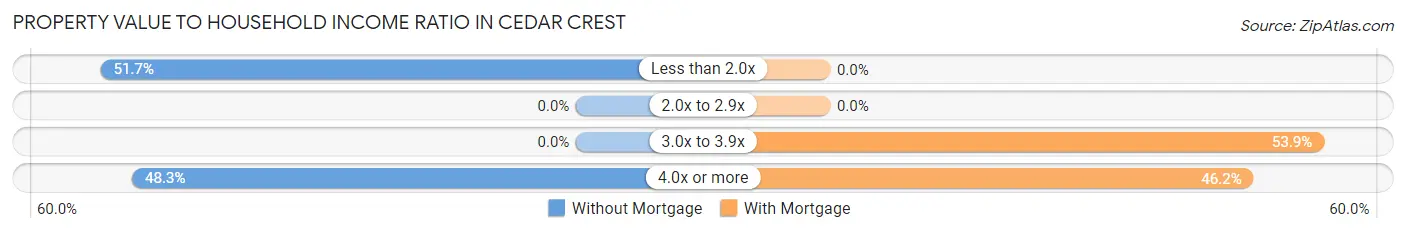
| Value-to-Income Ratio | Without Mortgage | With Mortgage |
| Less than 2.0x | 15 (51.7%) | 0 (0.0%) |
| 2.0x to 2.9x | 0 (0.0%) | 0 (0.0%) |
| 3.0x to 3.9x | 0 (0.0%) | 7 (53.8%) |
| 4.0x or more | 14 (48.3%) | 6 (46.2%) |
| Total | 29 (100.0%) | 13 (100.0%) |
Real Estate Taxes by Mortgage Status in Cedar Crest
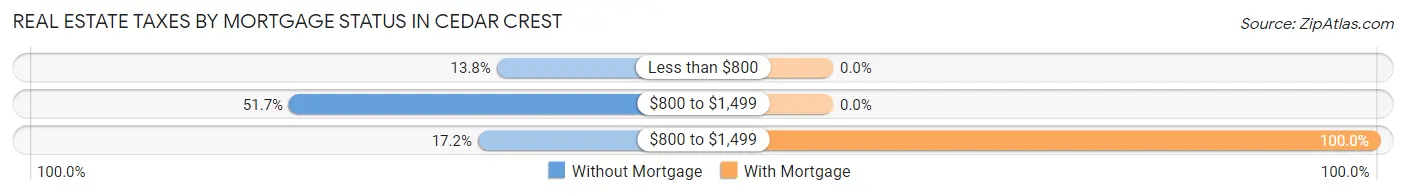
| Property Taxes | Without Mortgage | With Mortgage |
| Less than $800 | 4 (13.8%) | 0 (0.0%) |
| $800 to $1,499 | 15 (51.7%) | 0 (0.0%) |
| $800 to $1,499 | 5 (17.2%) | 13 (100.0%) |
| Total | 29 (100.0%) | 13 (100.0%) |
Health & Disability in Cedar Crest
Health Insurance Coverage by Age in Cedar Crest
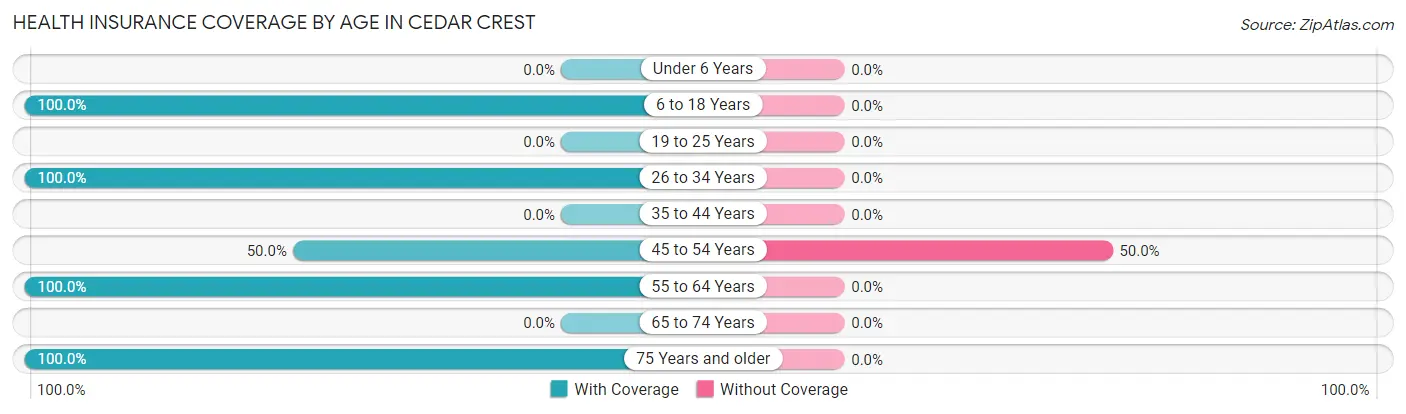
| Age Bracket | With Coverage | Without Coverage |
| Under 6 Years | 0 (0.0%) | 0 (0.0%) |
| 6 to 18 Years | 3 (100.0%) | 0 (0.0%) |
| 19 to 25 Years | 0 (0.0%) | 0 (0.0%) |
| 26 to 34 Years | 7 (100.0%) | 0 (0.0%) |
| 35 to 44 Years | 0 (0.0%) | 0 (0.0%) |
| 45 to 54 Years | 6 (50.0%) | 6 (50.0%) |
| 55 to 64 Years | 25 (100.0%) | 0 (0.0%) |
| 65 to 74 Years | 0 (0.0%) | 0 (0.0%) |
| 75 Years and older | 25 (100.0%) | 0 (0.0%) |
| Total | 66 (91.7%) | 6 (8.3%) |
Health Insurance Coverage by Citizenship Status in Cedar Crest

| Citizenship Status | With Coverage | Without Coverage |
| Native Born | 0 (0.0%) | 0 (0.0%) |
| Foreign Born, Citizen | 3 (100.0%) | 0 (0.0%) |
| Foreign Born, not a Citizen | 0 (0.0%) | 0 (0.0%) |
Health Insurance Coverage by Household Income in Cedar Crest
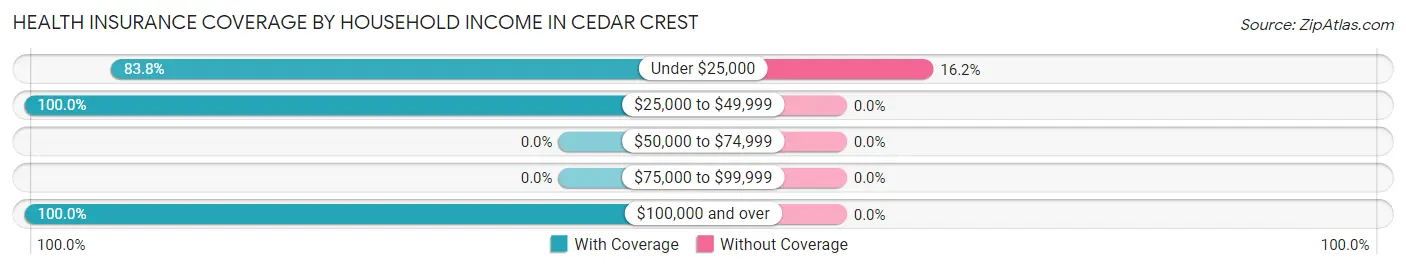
| Household Income | With Coverage | Without Coverage |
| Under $25,000 | 31 (83.8%) | 6 (16.2%) |
| $25,000 to $49,999 | 24 (100.0%) | 0 (0.0%) |
| $50,000 to $74,999 | 0 (0.0%) | 0 (0.0%) |
| $75,000 to $99,999 | 0 (0.0%) | 0 (0.0%) |
| $100,000 and over | 11 (100.0%) | 0 (0.0%) |
Public vs Private Health Insurance Coverage by Age in Cedar Crest
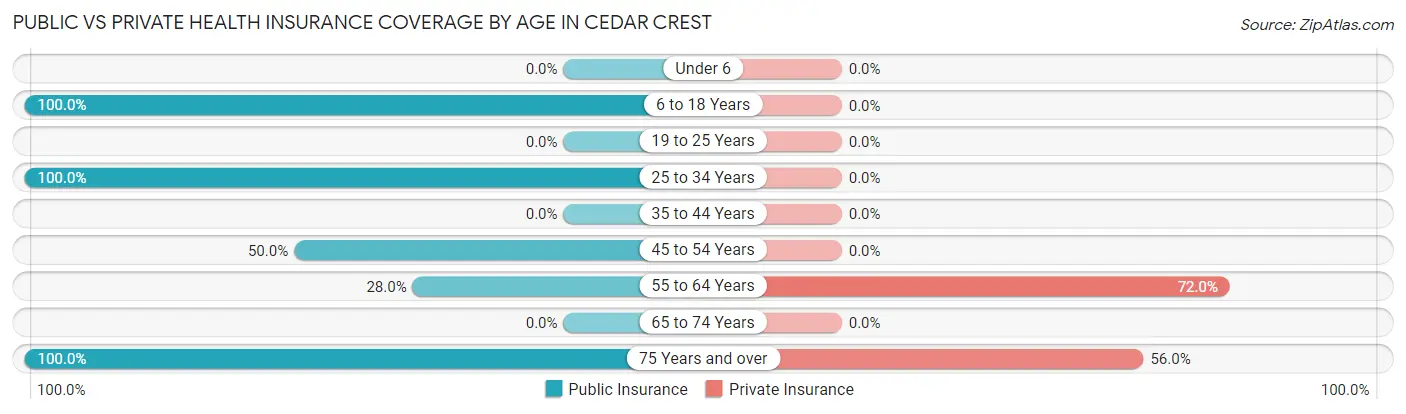
| Age Bracket | Public Insurance | Private Insurance |
| Under 6 | 0 (0.0%) | 0 (0.0%) |
| 6 to 18 Years | 3 (100.0%) | 0 (0.0%) |
| 19 to 25 Years | 0 (0.0%) | 0 (0.0%) |
| 25 to 34 Years | 7 (100.0%) | 0 (0.0%) |
| 35 to 44 Years | 0 (0.0%) | 0 (0.0%) |
| 45 to 54 Years | 6 (50.0%) | 0 (0.0%) |
| 55 to 64 Years | 7 (28.0%) | 18 (72.0%) |
| 65 to 74 Years | 0 (0.0%) | 0 (0.0%) |
| 75 Years and over | 25 (100.0%) | 14 (56.0%) |
| Total | 48 (66.7%) | 32 (44.4%) |
Disability Status by Sex by Age in Cedar Crest
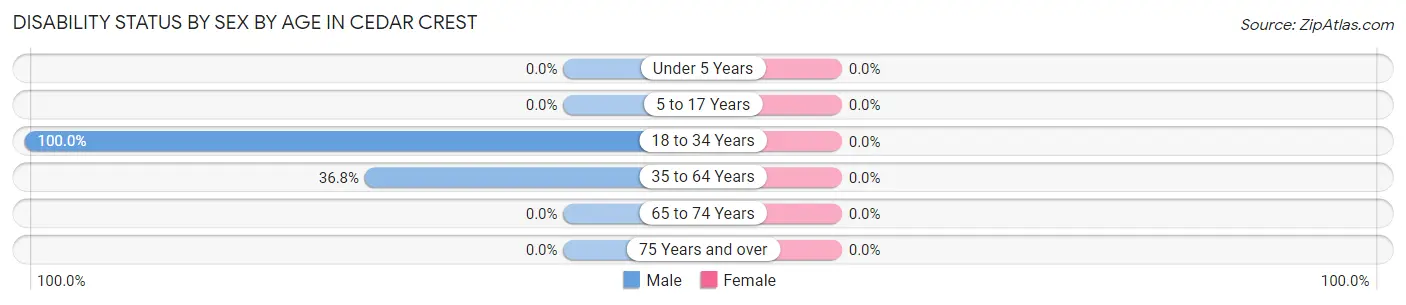
| Age Bracket | Male | Female |
| Under 5 Years | 0 (0.0%) | 0 (0.0%) |
| 5 to 17 Years | 0 (0.0%) | 0 (0.0%) |
| 18 to 34 Years | 4 (100.0%) | 0 (0.0%) |
| 35 to 64 Years | 7 (36.8%) | 0 (0.0%) |
| 65 to 74 Years | 0 (0.0%) | 0 (0.0%) |
| 75 Years and over | 0 (0.0%) | 0 (0.0%) |
Disability Class by Sex by Age in Cedar Crest
Disability Class: Hearing Difficulty
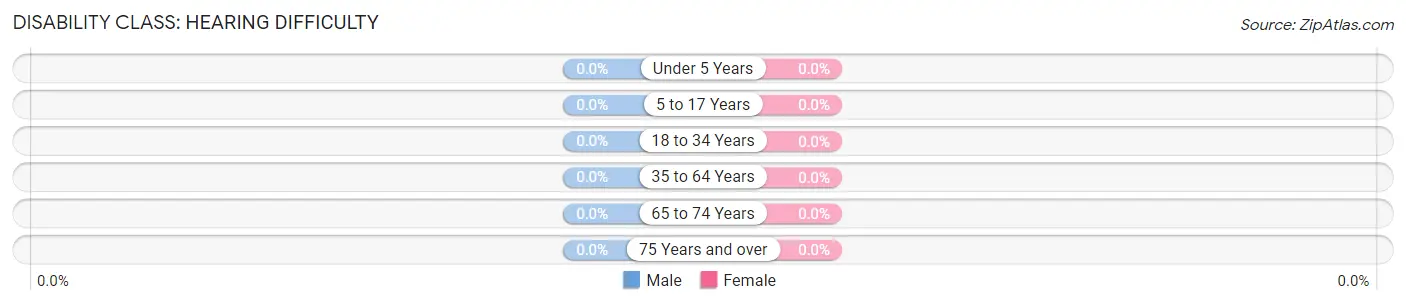
| Age Bracket | Male | Female |
| Under 5 Years | 0 (0.0%) | 0 (0.0%) |
| 5 to 17 Years | 0 (0.0%) | 0 (0.0%) |
| 18 to 34 Years | 0 (0.0%) | 0 (0.0%) |
| 35 to 64 Years | 0 (0.0%) | 0 (0.0%) |
| 65 to 74 Years | 0 (0.0%) | 0 (0.0%) |
| 75 Years and over | 0 (0.0%) | 0 (0.0%) |
Disability Class: Vision Difficulty
| Age Bracket | Male | Female |
| Under 5 Years | 0 (0.0%) | 0 (0.0%) |
| 5 to 17 Years | 0 (0.0%) | 0 (0.0%) |
| 18 to 34 Years | 0 (0.0%) | 0 (0.0%) |
| 35 to 64 Years | 0 (0.0%) | 0 (0.0%) |
| 65 to 74 Years | 0 (0.0%) | 0 (0.0%) |
| 75 Years and over | 0 (0.0%) | 0 (0.0%) |
Disability Class: Cognitive Difficulty
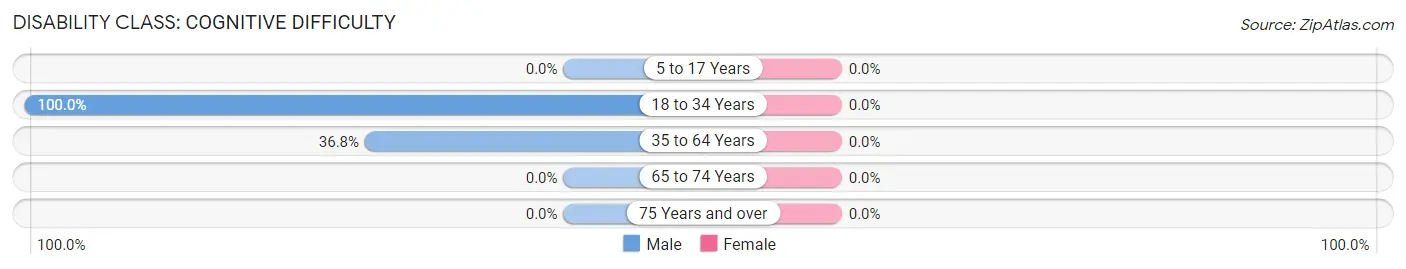
| Age Bracket | Male | Female |
| 5 to 17 Years | 0 (0.0%) | 0 (0.0%) |
| 18 to 34 Years | 4 (100.0%) | 0 (0.0%) |
| 35 to 64 Years | 7 (36.8%) | 0 (0.0%) |
| 65 to 74 Years | 0 (0.0%) | 0 (0.0%) |
| 75 Years and over | 0 (0.0%) | 0 (0.0%) |
Disability Class: Ambulatory Difficulty
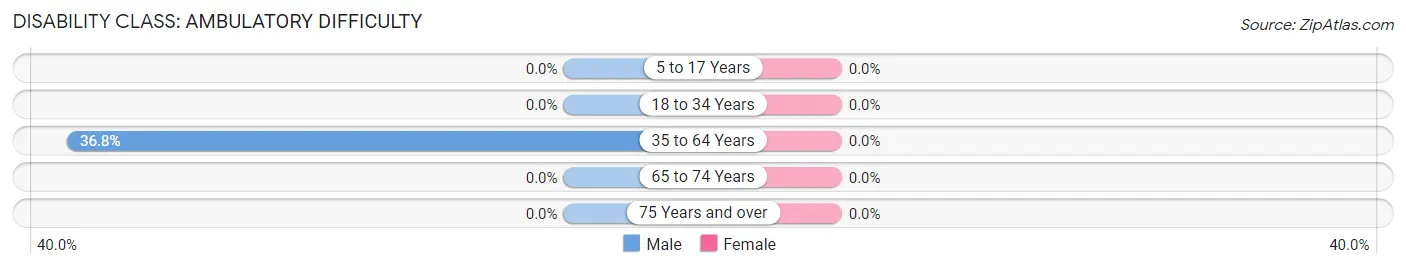
| Age Bracket | Male | Female |
| 5 to 17 Years | 0 (0.0%) | 0 (0.0%) |
| 18 to 34 Years | 0 (0.0%) | 0 (0.0%) |
| 35 to 64 Years | 7 (36.8%) | 0 (0.0%) |
| 65 to 74 Years | 0 (0.0%) | 0 (0.0%) |
| 75 Years and over | 0 (0.0%) | 0 (0.0%) |
Disability Class: Self-Care Difficulty
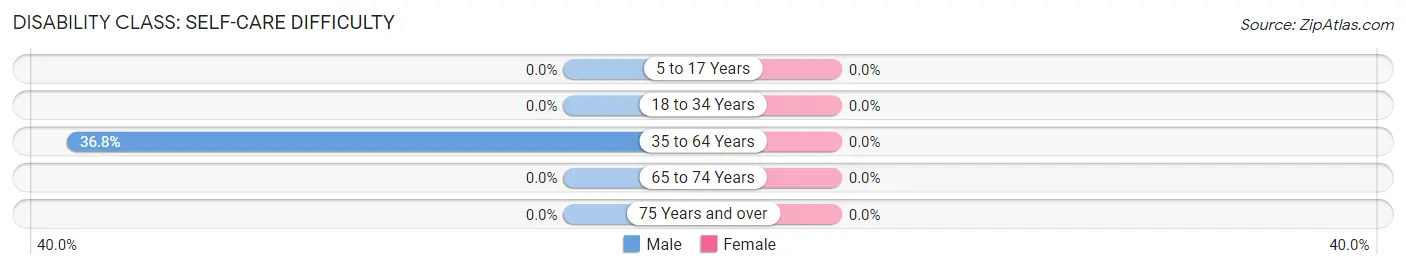
| Age Bracket | Male | Female |
| 5 to 17 Years | 0 (0.0%) | 0 (0.0%) |
| 18 to 34 Years | 0 (0.0%) | 0 (0.0%) |
| 35 to 64 Years | 7 (36.8%) | 0 (0.0%) |
| 65 to 74 Years | 0 (0.0%) | 0 (0.0%) |
| 75 Years and over | 0 (0.0%) | 0 (0.0%) |
Technology Access in Cedar Crest
Computing Device Access in Cedar Crest
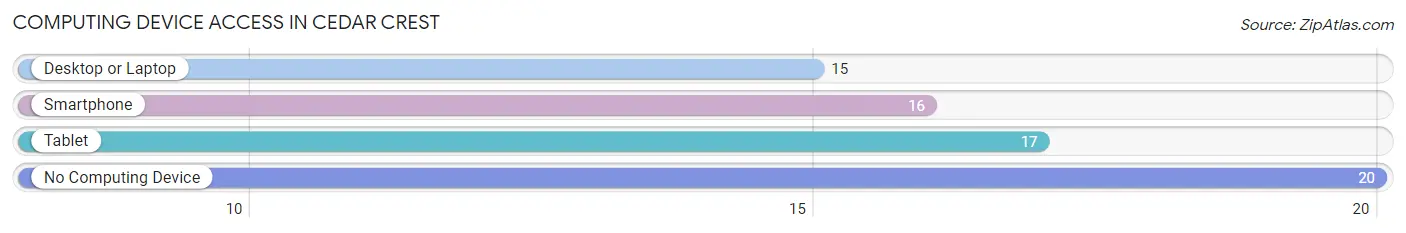
| Device Type | # Households | % Households |
| Desktop or Laptop | 15 | 35.7% |
| Smartphone | 16 | 38.1% |
| Tablet | 17 | 40.5% |
| No Computing Device | 20 | 47.6% |
| Total | 42 | 100.0% |
Internet Access in Cedar Crest
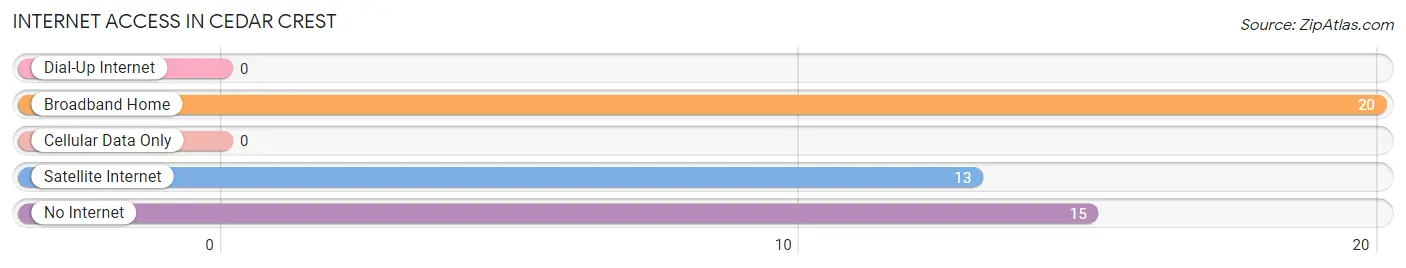
| Internet Type | # Households | % Households |
| Dial-Up Internet | 0 | 0.0% |
| Broadband Home | 20 | 47.6% |
| Cellular Data Only | 0 | 0.0% |
| Satellite Internet | 13 | 30.9% |
| No Internet | 15 | 35.7% |
| Total | 42 | 100.0% |
Cedar Crest Summary
Cedar Crest is a small unincorporated community located in Lehigh County, Pennsylvania. It is situated in the Lehigh Valley region of the state, approximately 8 miles north of Allentown and about 60 miles northwest of Philadelphia. The community is part of the Allentown-Bethlehem-Easton metropolitan area and is home to a population of approximately 1,000 people.
History
Cedar Crest was first settled in the late 1700s by German immigrants who were attracted to the area by its fertile soil and abundant natural resources. The community was originally known as “Cedar Hill” and was part of North Whitehall Township. In 1845, the name was changed to Cedar Crest and the area was incorporated as a borough. The community was home to a variety of industries, including a sawmill, a grist mill, a tannery, and a brickyard.
In the late 1800s, Cedar Crest began to experience a period of growth and development. The community was home to a variety of businesses, including a hotel, a general store, a post office, and a blacksmith shop. The population of Cedar Crest grew steadily throughout the late 19th and early 20th centuries, reaching a peak of 1,500 in the 1950s.
Geography
Cedar Crest is located in the Lehigh Valley region of Pennsylvania. The community is situated in the foothills of the Appalachian Mountains and is surrounded by rolling hills and lush forests. The area is home to a variety of wildlife, including deer, foxes, and wild turkeys. The community is located approximately 8 miles north of Allentown and about 60 miles northwest of Philadelphia.
Economy
Cedar Crest is a primarily residential community and does not have a large commercial or industrial base. The community is home to a variety of small businesses, including restaurants, retail stores, and professional services. The area is also home to a number of farms, which produce a variety of crops, including corn, soybeans, and hay.
Demographics
As of the 2010 census, the population of Cedar Crest was 1,000. The racial makeup of the community was 97.2% White, 0.7% African American, 0.3% Native American, 0.3% Asian, and 1.5% from other races. The median household income was $50,000 and the median home value was $170,000.
Conclusion
Cedar Crest is a small unincorporated community located in Lehigh County, Pennsylvania. It is situated in the Lehigh Valley region of the state and is home to a population of approximately 1,000 people. The community was first settled in the late 1700s and has a rich history of industry and agriculture. Today, Cedar Crest is a primarily residential community and is home to a variety of small businesses. The population of Cedar Crest is predominantly White and the median household income is $50,000.
Common Questions
What is Per Capita Income in Cedar Crest?
Per Capita income in Cedar Crest is $20,799.
What is the Median Family Income in Cedar Crest?
Median Family Income in Cedar Crest is $40,714.
What is the Median Household income in Cedar Crest?
Median Household Income in Cedar Crest is $23,000.
What is Inequality or Gini Index in Cedar Crest?
Inequality or Gini Index in Cedar Crest is 0.40.
What is the Total Population of Cedar Crest?
Total Population of Cedar Crest is 72.
What is the Total Male Population of Cedar Crest?
Total Male Population of Cedar Crest is 31.
What is the Total Female Population of Cedar Crest?
Total Female Population of Cedar Crest is 41.
What is the Ratio of Males per 100 Females in Cedar Crest?
There are 75.61 Males per 100 Females in Cedar Crest.
What is the Ratio of Females per 100 Males in Cedar Crest?
There are 132.26 Females per 100 Males in Cedar Crest.
What is the Median Population Age in Cedar Crest?
Median Population Age in Cedar Crest is 57.5 Years.
What is the Average Family Size in Cedar Crest
Average Family Size in Cedar Crest is 2.2 People.
What is the Average Household Size in Cedar Crest
Average Household Size in Cedar Crest is 1.7 People.
How Large is the Labor Force in Cedar Crest?
There are 27 People in the Labor Forcein in Cedar Crest.
What is the Percentage of People in the Labor Force in Cedar Crest?
39.1% of People are in the Labor Force in Cedar Crest.