Atwood borough, PA Map & Demographics
Atwood borough Overview
$25,901
PER CAPITA INCOME
$65,357
AVG FAMILY INCOME
$44,444
AVG HOUSEHOLD INCOME
51.7%
WAGE / INCOME GAP [ % ]
48.3¢/ $1
WAGE / INCOME GAP [ $ ]
0.45
INEQUALITY / GINI INDEX
179
TOTAL POPULATION
90
MALE POPULATION
89
FEMALE POPULATION
101.12
MALES / 100 FEMALES
98.89
FEMALES / 100 MALES
48.5
MEDIAN AGE
3.3
AVG FAMILY SIZE
2.7
AVG HOUSEHOLD SIZE
78
LABOR FORCE [ PEOPLE ]
56.1%
PERCENT IN LABOR FORCE
7.7%
UNEMPLOYMENT RATE
Income in Atwood borough
Income Overview in Atwood borough
Per Capita Income in Atwood borough is $25,901, while median incomes of families and households are $65,357 and $44,444 respectively.
| Characteristic | Number | Measure |
| Per Capita Income | 179 | $25,901 |
| Median Family Income | 46 | $65,357 |
| Mean Family Income | 46 | $80,343 |
| Median Household Income | 66 | $44,444 |
| Mean Household Income | 66 | $68,383 |
| Income Deficit | 46 | $0 |
| Wage / Income Gap (%) | 179 | 51.66% |
| Wage / Income Gap ($) | 179 | 48.34¢ per $1 |
| Gini / Inequality Index | 179 | 0.45 |
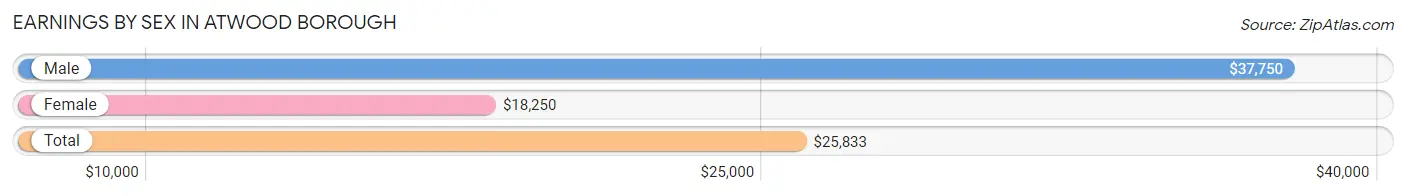
Earnings by Sex in Atwood borough
Average Earnings in Atwood borough are $25,833, $37,750 for men and $18,250 for women, a difference of 51.7%.
| Sex | Number | Average Earnings |
| Male | 41 (45.6%) | $37,750 |
| Female | 49 (54.4%) | $18,250 |
| Total | 90 (100.0%) | $25,833 |
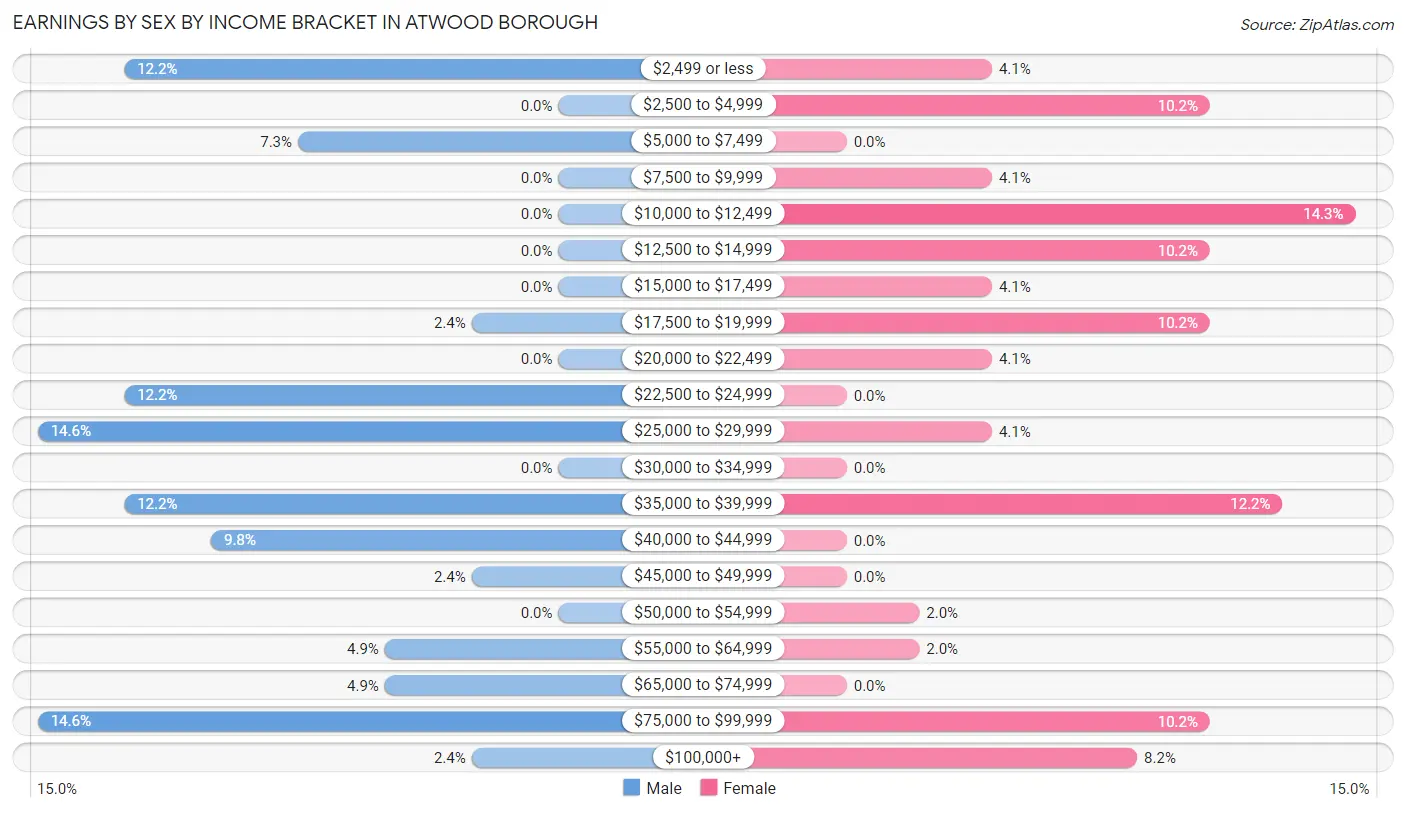
Earnings by Sex by Income Bracket in Atwood borough
The most common earnings brackets in Atwood borough are $25,000 to $29,999 for men (6 | 14.6%) and $10,000 to $12,499 for women (7 | 14.3%).
| Income | Male | Female |
| $2,499 or less | 5 (12.2%) | 2 (4.1%) |
| $2,500 to $4,999 | 0 (0.0%) | 5 (10.2%) |
| $5,000 to $7,499 | 3 (7.3%) | 0 (0.0%) |
| $7,500 to $9,999 | 0 (0.0%) | 2 (4.1%) |
| $10,000 to $12,499 | 0 (0.0%) | 7 (14.3%) |
| $12,500 to $14,999 | 0 (0.0%) | 5 (10.2%) |
| $15,000 to $17,499 | 0 (0.0%) | 2 (4.1%) |
| $17,500 to $19,999 | 1 (2.4%) | 5 (10.2%) |
| $20,000 to $22,499 | 0 (0.0%) | 2 (4.1%) |
| $22,500 to $24,999 | 5 (12.2%) | 0 (0.0%) |
| $25,000 to $29,999 | 6 (14.6%) | 2 (4.1%) |
| $30,000 to $34,999 | 0 (0.0%) | 0 (0.0%) |
| $35,000 to $39,999 | 5 (12.2%) | 6 (12.2%) |
| $40,000 to $44,999 | 4 (9.8%) | 0 (0.0%) |
| $45,000 to $49,999 | 1 (2.4%) | 0 (0.0%) |
| $50,000 to $54,999 | 0 (0.0%) | 1 (2.0%) |
| $55,000 to $64,999 | 2 (4.9%) | 1 (2.0%) |
| $65,000 to $74,999 | 2 (4.9%) | 0 (0.0%) |
| $75,000 to $99,999 | 6 (14.6%) | 5 (10.2%) |
| $100,000+ | 1 (2.4%) | 4 (8.2%) |
| Total | 41 (100.0%) | 49 (100.0%) |
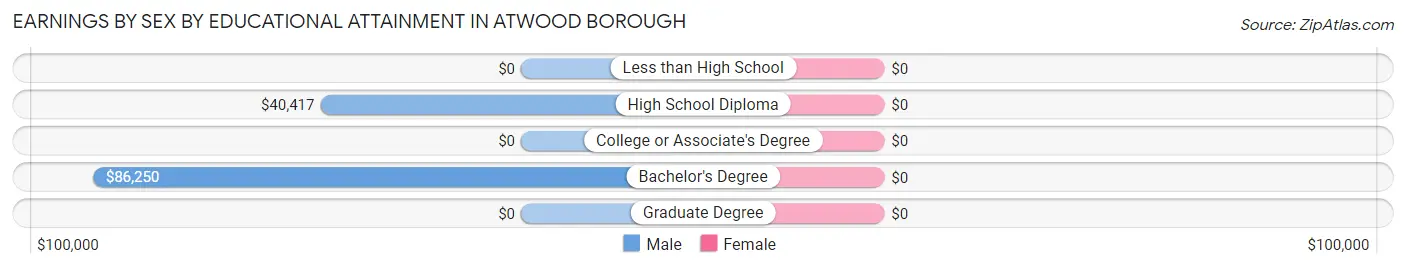
Earnings by Sex by Educational Attainment in Atwood borough
| Educational Attainment | Male Income | Female Income |
| Less than High School | - | - |
| High School Diploma | $40,417 | $0 |
| College or Associate's Degree | - | - |
| Bachelor's Degree | $86,250 | $0 |
| Graduate Degree | - | - |
| Total | $39,750 | $0 |
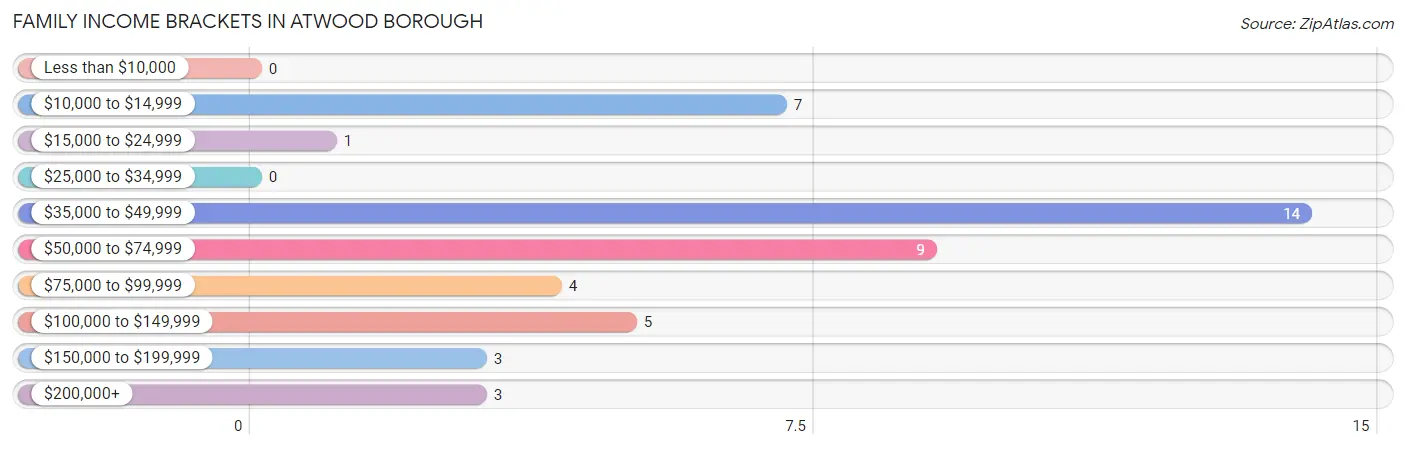
Family Income in Atwood borough
Family Income Brackets in Atwood borough
According to the Atwood borough family income data, there are 14 families falling into the $35,000 to $49,999 income range, which is the most common income bracket and makes up 30.4% of all families.
| Income Bracket | # Families | % Families |
| Less than $10,000 | 0 | 0.0% |
| $10,000 to $14,999 | 7 | 15.2% |
| $15,000 to $24,999 | 1 | 2.2% |
| $25,000 to $34,999 | 0 | 0.0% |
| $35,000 to $49,999 | 14 | 30.4% |
| $50,000 to $74,999 | 9 | 19.6% |
| $75,000 to $99,999 | 4 | 8.7% |
| $100,000 to $149,999 | 5 | 10.9% |
| $150,000 to $199,999 | 3 | 6.5% |
| $200,000+ | 3 | 6.5% |
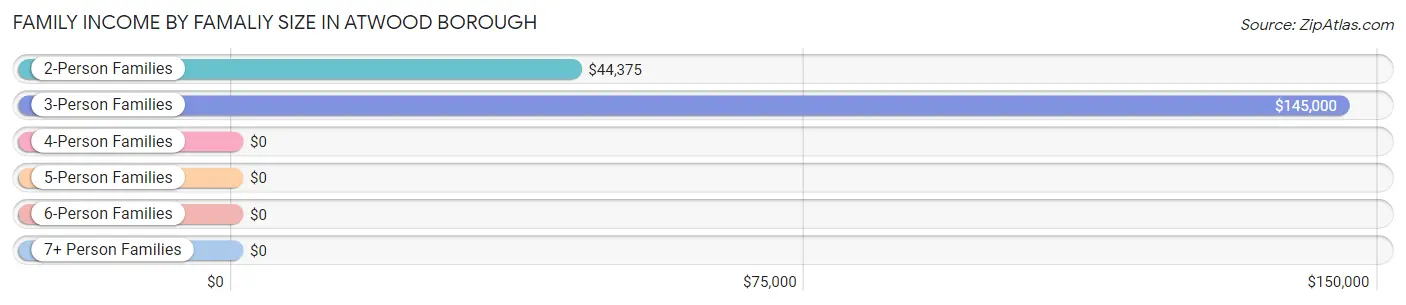
Family Income by Famaliy Size in Atwood borough
3-person families (6 | 13.0%) account for the highest median family income in Atwood borough with $145,000 per family, while 3-person families (6 | 13.0%) have the highest median income of $48,333 per family member.
| Income Bracket | # Families | Median Income |
| 2-Person Families | 24 (52.2%) | $44,375 |
| 3-Person Families | 6 (13.0%) | $145,000 |
| 4-Person Families | 7 (15.2%) | $0 |
| 5-Person Families | 4 (8.7%) | $0 |
| 6-Person Families | 5 (10.9%) | $0 |
| 7+ Person Families | 0 (0.0%) | $0 |
| Total | 46 (100.0%) | $65,357 |
Family Income by Number of Earners in Atwood borough
| Number of Earners | # Families | Median Income |
| No Earners | 10 (21.7%) | $0 |
| 1 Earner | 18 (39.1%) | $0 |
| 2 Earners | 8 (17.4%) | $0 |
| 3+ Earners | 10 (21.7%) | $0 |
| Total | 46 (100.0%) | $65,357 |
Household Income in Atwood borough
Household Income Brackets in Atwood borough
With 15 households falling in the category, the $35,000 to $49,999 income range is the most frequent in Atwood borough, accounting for 22.7% of all households.
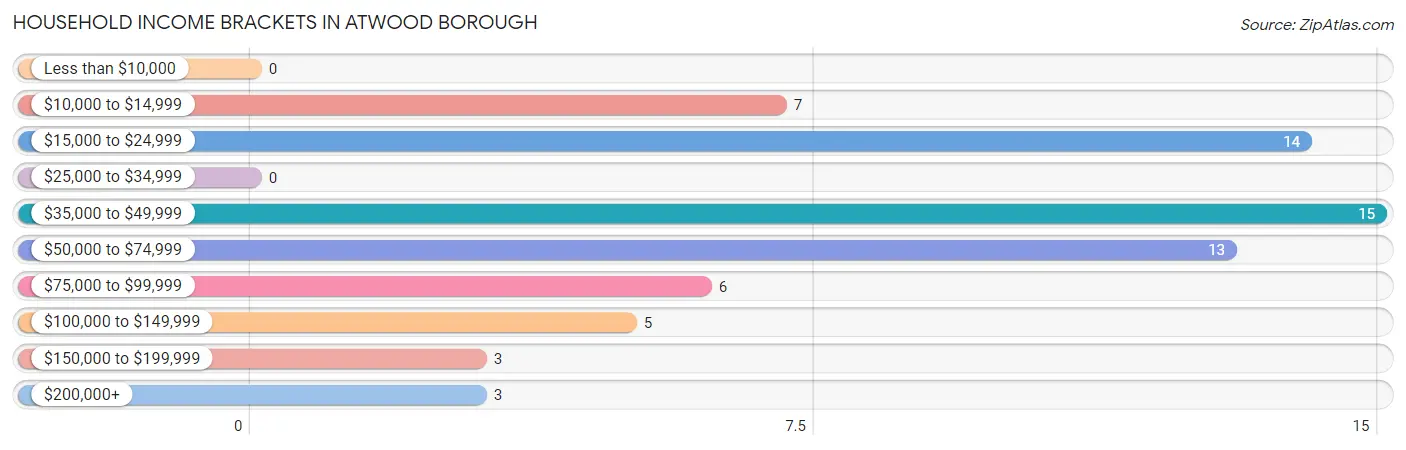
| Income Bracket | # Households | % Households |
| Less than $10,000 | 0 | 0.0% |
| $10,000 to $14,999 | 7 | 10.6% |
| $15,000 to $24,999 | 14 | 21.2% |
| $25,000 to $34,999 | 0 | 0.0% |
| $35,000 to $49,999 | 15 | 22.7% |
| $50,000 to $74,999 | 13 | 19.7% |
| $75,000 to $99,999 | 6 | 9.1% |
| $100,000 to $149,999 | 5 | 7.6% |
| $150,000 to $199,999 | 3 | 4.5% |
| $200,000+ | 3 | 4.5% |
Household Income by Householder Age in Atwood borough
| Income Bracket | # Households | Median Income |
| 15 to 24 Years | 0 (0.0%) | $0 |
| 25 to 44 Years | 16 (24.2%) | $0 |
| 45 to 64 Years | 24 (36.4%) | $0 |
| 65+ Years | 26 (39.4%) | $0 |
| Total | 66 (100.0%) | $44,444 |
Poverty in Atwood borough
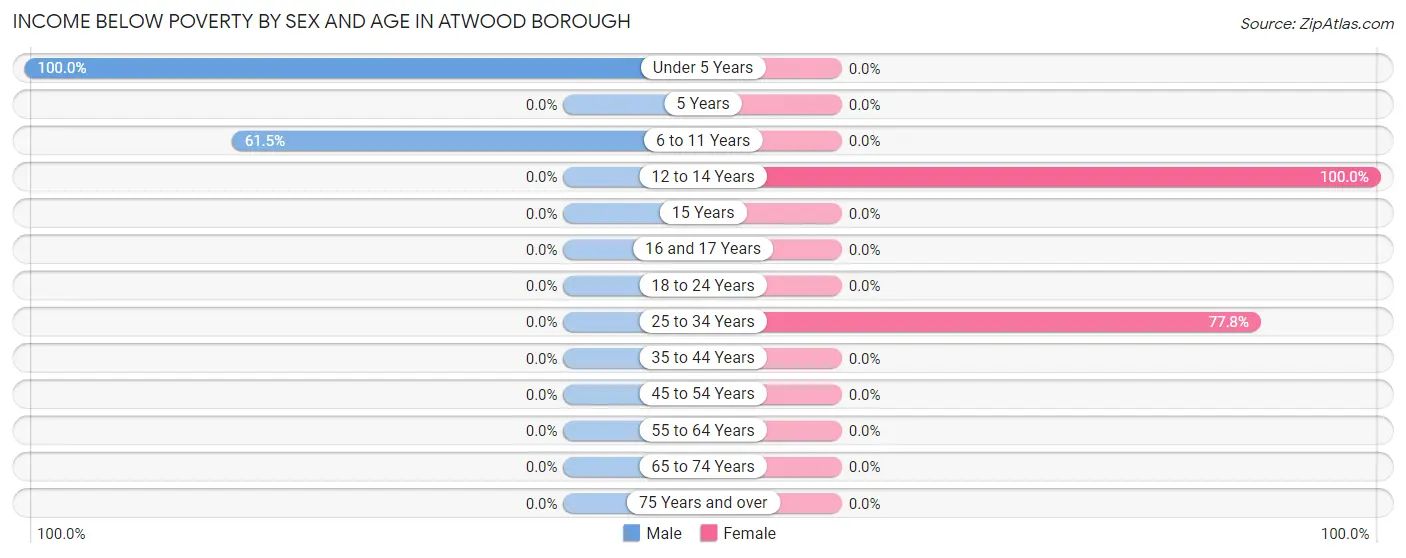
Income Below Poverty by Sex and Age in Atwood borough
With 14.4% poverty level for males and 23.6% for females among the residents of Atwood borough, under 5 year old males and 12 to 14 year old females are the most vulnerable to poverty, with 5 males (100.0%) and 14 females (100.0%) in their respective age groups living below the poverty level.
| Age Bracket | Male | Female |
| Under 5 Years | 5 (100.0%) | 0 (0.0%) |
| 5 Years | 0 (0.0%) | 0 (0.0%) |
| 6 to 11 Years | 8 (61.5%) | 0 (0.0%) |
| 12 to 14 Years | 0 (0.0%) | 14 (100.0%) |
| 15 Years | 0 (0.0%) | 0 (0.0%) |
| 16 and 17 Years | 0 (0.0%) | 0 (0.0%) |
| 18 to 24 Years | 0 (0.0%) | 0 (0.0%) |
| 25 to 34 Years | 0 (0.0%) | 7 (77.8%) |
| 35 to 44 Years | 0 (0.0%) | 0 (0.0%) |
| 45 to 54 Years | 0 (0.0%) | 0 (0.0%) |
| 55 to 64 Years | 0 (0.0%) | 0 (0.0%) |
| 65 to 74 Years | 0 (0.0%) | 0 (0.0%) |
| 75 Years and over | 0 (0.0%) | 0 (0.0%) |
| Total | 13 (14.4%) | 21 (23.6%) |
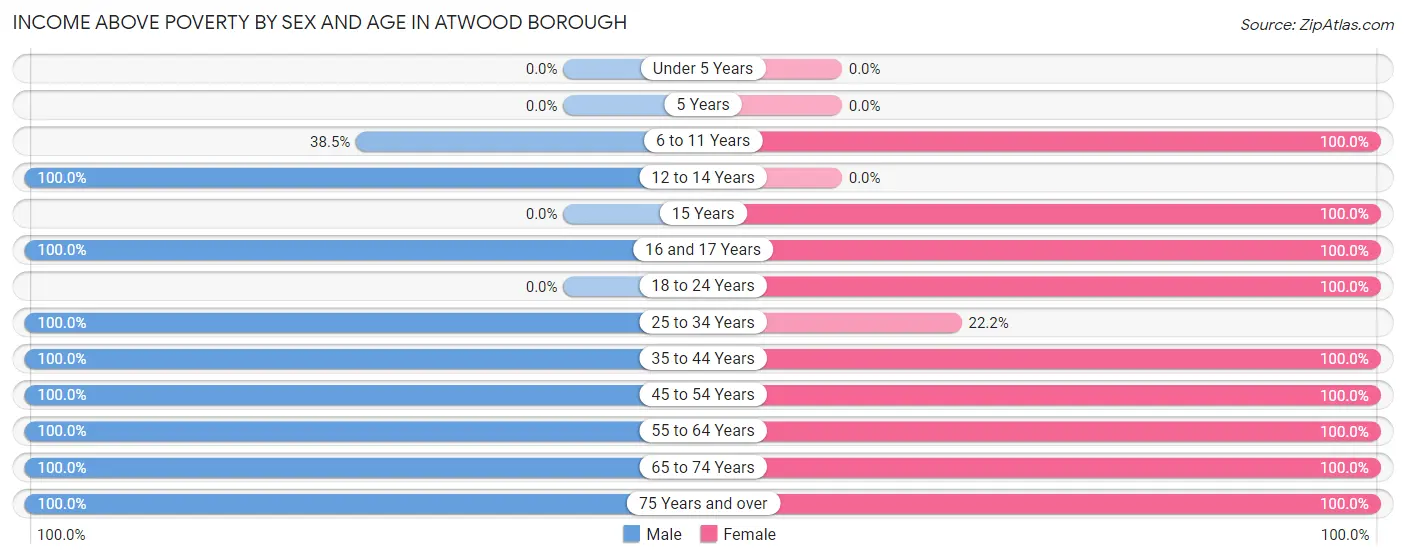
Income Above Poverty by Sex and Age in Atwood borough
According to the poverty statistics in Atwood borough, males aged 12 to 14 years and females aged 6 to 11 years are the age groups that are most secure financially, with 100.0% of males and 100.0% of females in these age groups living above the poverty line.
| Age Bracket | Male | Female |
| Under 5 Years | 0 (0.0%) | 0 (0.0%) |
| 5 Years | 0 (0.0%) | 0 (0.0%) |
| 6 to 11 Years | 5 (38.5%) | 2 (100.0%) |
| 12 to 14 Years | 5 (100.0%) | 0 (0.0%) |
| 15 Years | 0 (0.0%) | 1 (100.0%) |
| 16 and 17 Years | 8 (100.0%) | 2 (100.0%) |
| 18 to 24 Years | 0 (0.0%) | 7 (100.0%) |
| 25 to 34 Years | 3 (100.0%) | 2 (22.2%) |
| 35 to 44 Years | 9 (100.0%) | 9 (100.0%) |
| 45 to 54 Years | 9 (100.0%) | 3 (100.0%) |
| 55 to 64 Years | 18 (100.0%) | 18 (100.0%) |
| 65 to 74 Years | 8 (100.0%) | 8 (100.0%) |
| 75 Years and over | 12 (100.0%) | 16 (100.0%) |
| Total | 77 (85.6%) | 68 (76.4%) |
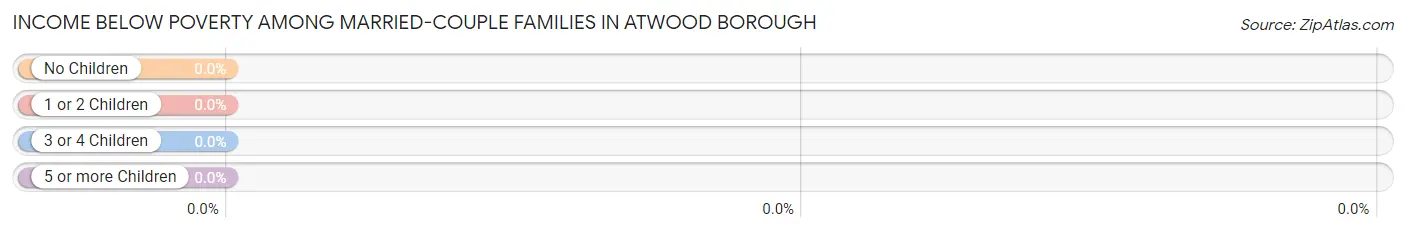
Income Below Poverty Among Married-Couple Families in Atwood borough
| Children | Above Poverty | Below Poverty |
| No Children | 26 (100.0%) | 0 (0.0%) |
| 1 or 2 Children | 4 (100.0%) | 0 (0.0%) |
| 3 or 4 Children | 7 (100.0%) | 0 (0.0%) |
| 5 or more Children | 0 (0.0%) | 0 (0.0%) |
| Total | 37 (100.0%) | 0 (0.0%) |
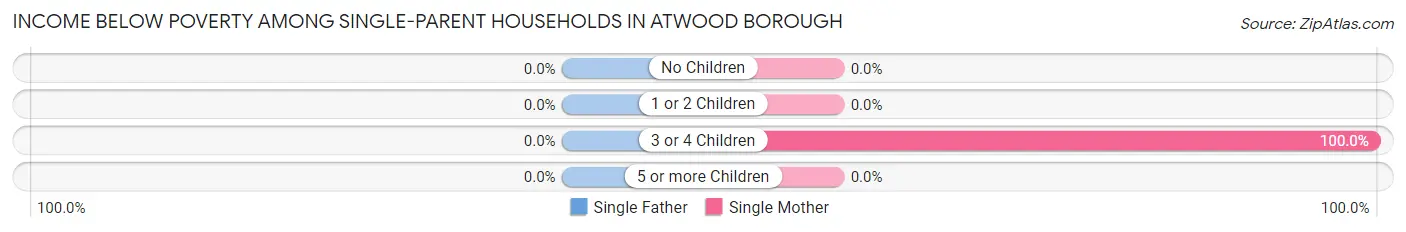
Income Below Poverty Among Single-Parent Households in Atwood borough
| Children | Single Father | Single Mother |
| No Children | 0 (0.0%) | 0 (0.0%) |
| 1 or 2 Children | 0 (0.0%) | 0 (0.0%) |
| 3 or 4 Children | 0 (0.0%) | 7 (100.0%) |
| 5 or more Children | 0 (0.0%) | 0 (0.0%) |
| Total | 0 (0.0%) | 7 (77.8%) |
Income Below Poverty Among Married-Couple vs Single-Parent Households in Atwood borough
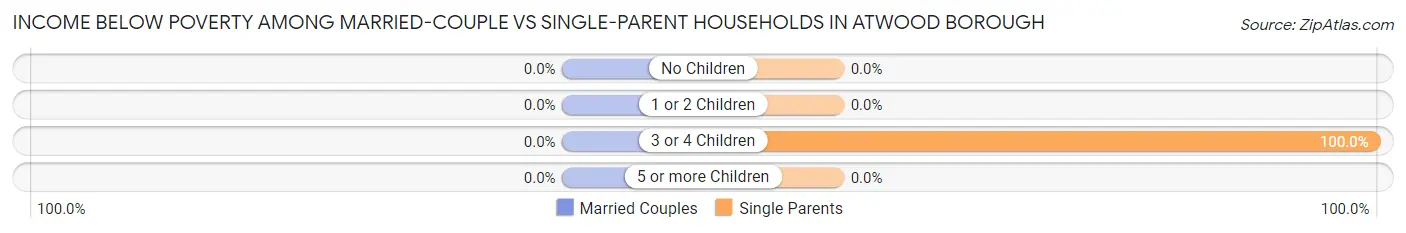
| Children | Married-Couple Families | Single-Parent Households |
| No Children | 0 (0.0%) | 0 (0.0%) |
| 1 or 2 Children | 0 (0.0%) | 0 (0.0%) |
| 3 or 4 Children | 0 (0.0%) | 7 (100.0%) |
| 5 or more Children | 0 (0.0%) | 0 (0.0%) |
| Total | 0 (0.0%) | 7 (77.8%) |
Race in Atwood borough
The most populous races in Atwood borough are , and White / Caucasian (179 | 100.0%).
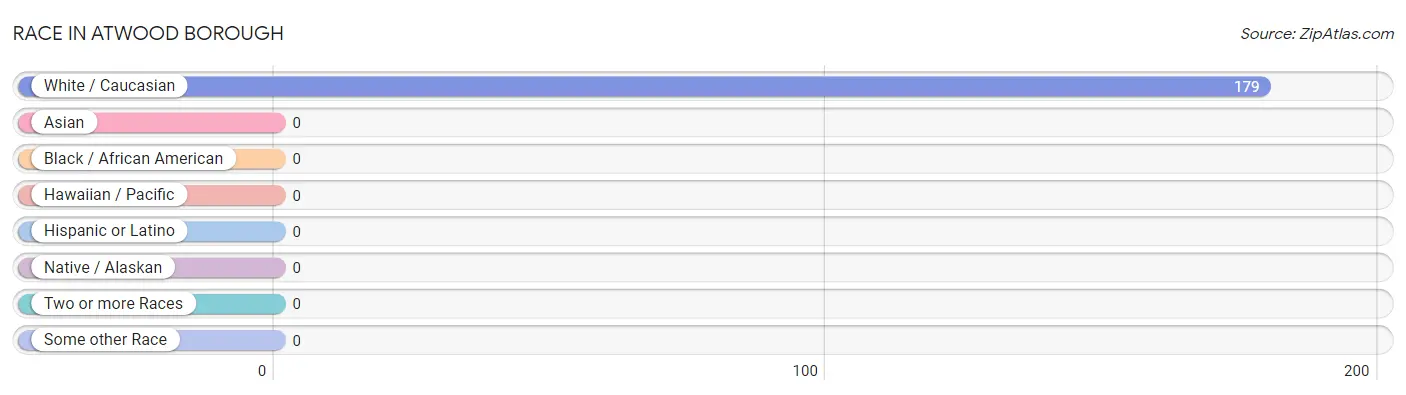
| Race | # Population | % Population |
| Asian | 0 | 0.0% |
| Black / African American | 0 | 0.0% |
| Hawaiian / Pacific | 0 | 0.0% |
| Hispanic or Latino | 0 | 0.0% |
| Native / Alaskan | 0 | 0.0% |
| White / Caucasian | 179 | 100.0% |
| Two or more Races | 0 | 0.0% |
| Some other Race | 0 | 0.0% |
| Total | 179 | 100.0% |
Ancestry in Atwood borough
The most populous ancestries reported in Atwood borough are German (81 | 45.3%), Irish (48 | 26.8%), Russian (28 | 15.6%), Polish (25 | 14.0%), and Slovak (23 | 12.9%), together accounting for 114.5% of all Atwood borough residents.
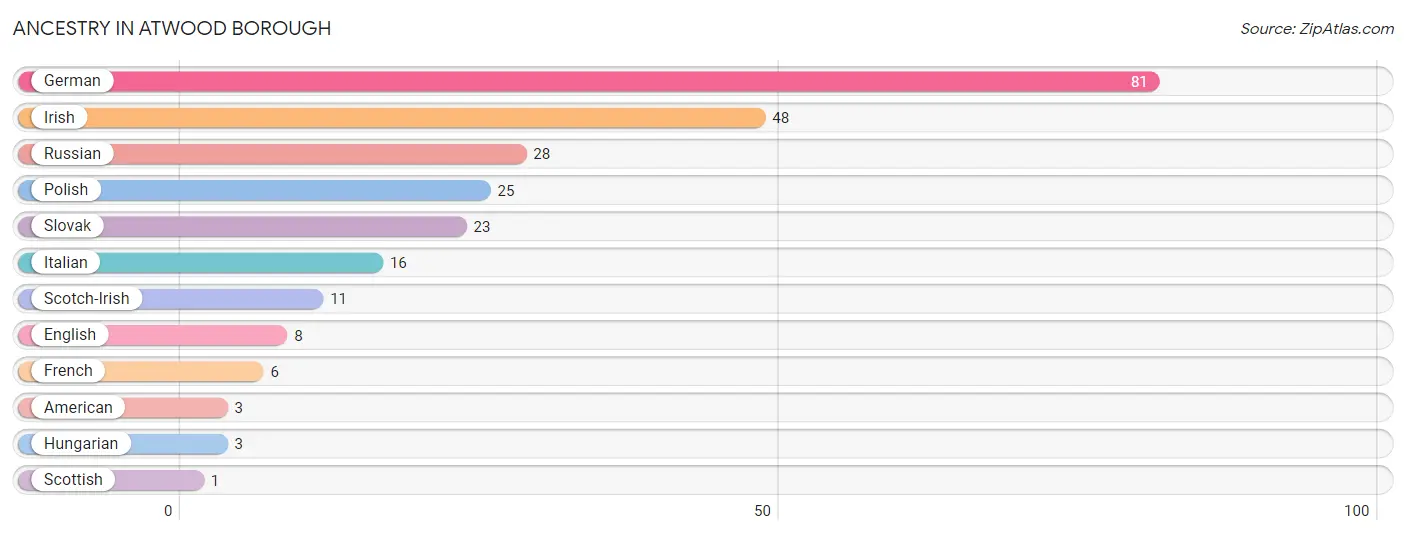
| Ancestry | # Population | % Population |
| American | 3 | 1.7% |
| English | 8 | 4.5% |
| French | 6 | 3.4% |
| German | 81 | 45.3% |
| Hungarian | 3 | 1.7% |
| Irish | 48 | 26.8% |
| Italian | 16 | 8.9% |
| Polish | 25 | 14.0% |
| Russian | 28 | 15.6% |
| Scotch-Irish | 11 | 6.1% |
| Scottish | 1 | 0.6% |
| Slovak | 23 | 12.9% | View All 12 Rows |
Immigrants in Atwood borough

| Immigration Origin | # Population | % Population | View All 0 Rows |
Sex and Age in Atwood borough
Sex and Age in Atwood borough
The most populous age groups in Atwood borough are 55 to 59 Years (12 | 13.3%) for men and 55 to 59 Years (15 | 16.9%) for women.
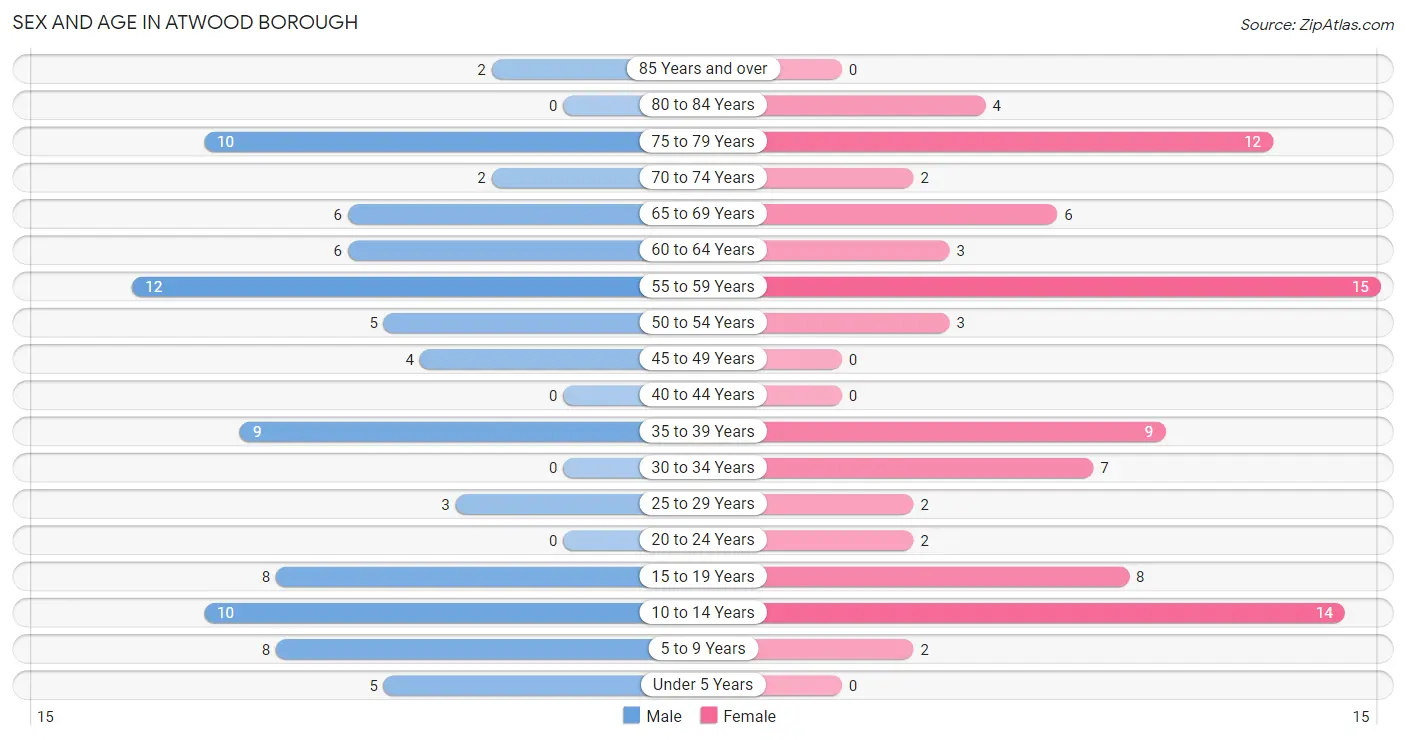
| Age Bracket | Male | Female |
| Under 5 Years | 5 (5.6%) | 0 (0.0%) |
| 5 to 9 Years | 8 (8.9%) | 2 (2.2%) |
| 10 to 14 Years | 10 (11.1%) | 14 (15.7%) |
| 15 to 19 Years | 8 (8.9%) | 8 (9.0%) |
| 20 to 24 Years | 0 (0.0%) | 2 (2.2%) |
| 25 to 29 Years | 3 (3.3%) | 2 (2.2%) |
| 30 to 34 Years | 0 (0.0%) | 7 (7.9%) |
| 35 to 39 Years | 9 (10.0%) | 9 (10.1%) |
| 40 to 44 Years | 0 (0.0%) | 0 (0.0%) |
| 45 to 49 Years | 4 (4.4%) | 0 (0.0%) |
| 50 to 54 Years | 5 (5.6%) | 3 (3.4%) |
| 55 to 59 Years | 12 (13.3%) | 15 (16.9%) |
| 60 to 64 Years | 6 (6.7%) | 3 (3.4%) |
| 65 to 69 Years | 6 (6.7%) | 6 (6.7%) |
| 70 to 74 Years | 2 (2.2%) | 2 (2.2%) |
| 75 to 79 Years | 10 (11.1%) | 12 (13.5%) |
| 80 to 84 Years | 0 (0.0%) | 4 (4.5%) |
| 85 Years and over | 2 (2.2%) | 0 (0.0%) |
| Total | 90 (100.0%) | 89 (100.0%) |
Families and Households in Atwood borough
Median Family Size in Atwood borough
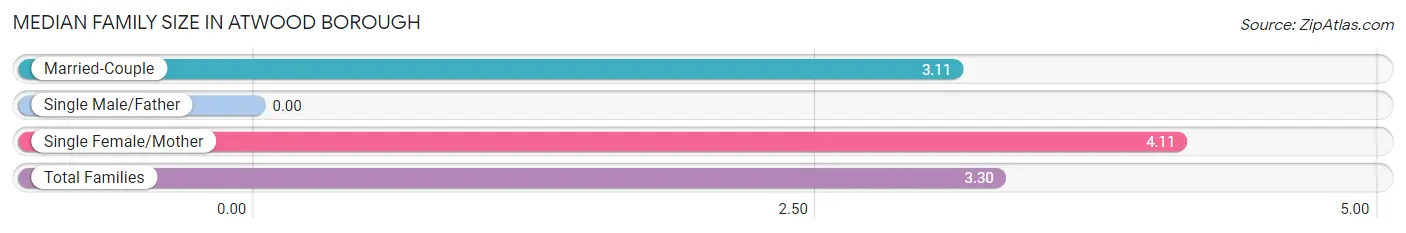
| Family Type | # Families | Family Size |
| Married-Couple | 37 (80.4%) | 3.11 |
| Single Male/Father | 0 (0.0%) | - |
| Single Female/Mother | 9 (19.6%) | 4.11 |
| Total Families | 46 (100.0%) | 3.30 |
Median Household Size in Atwood borough
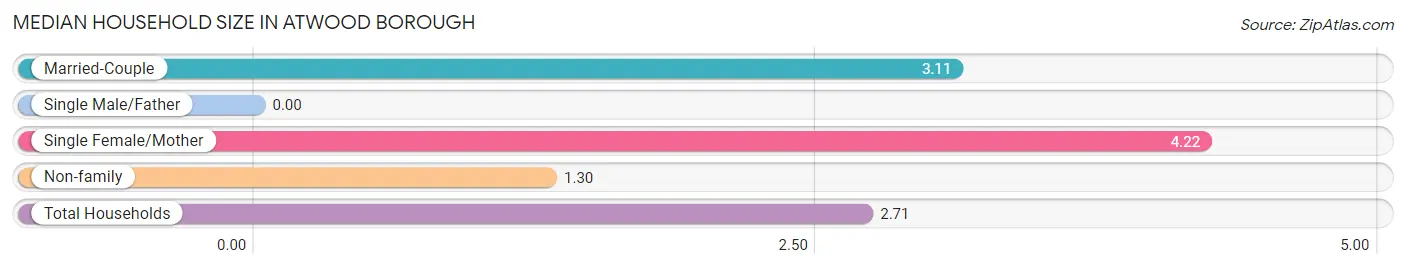
| Household Type | # Households | Household Size |
| Married-Couple | 37 (56.1%) | 3.11 |
| Single Male/Father | 0 (0.0%) | - |
| Single Female/Mother | 9 (13.6%) | 4.22 |
| Non-family | 20 (30.3%) | 1.30 |
| Total Households | 66 (100.0%) | 2.71 |
Household Size by Marriage Status in Atwood borough
Out of a total of 66 households in Atwood borough, 46 (69.7%) are family households, while 20 (30.3%) are nonfamily households. The most numerous type of family households are 2-person households, comprising 22, and the most common type of nonfamily households are 1-person households, comprising 14.
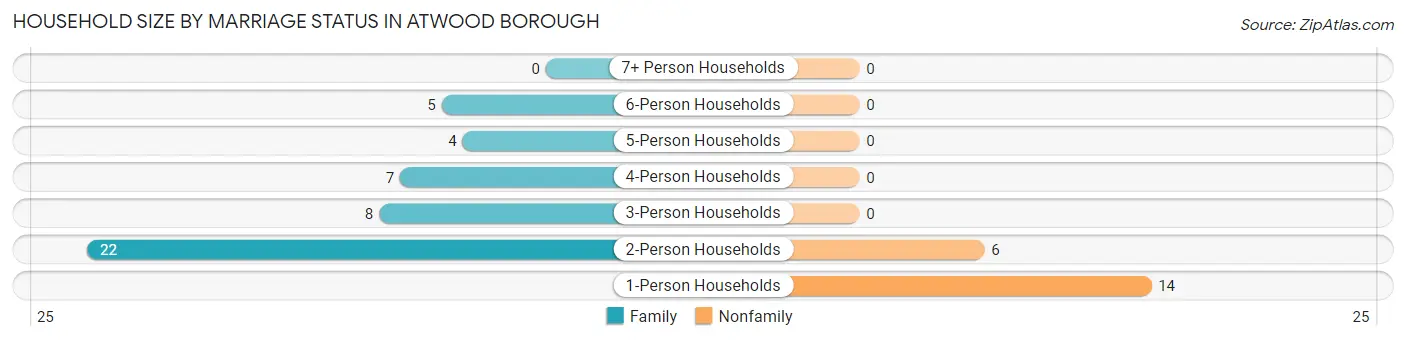
| Household Size | Family Households | Nonfamily Households |
| 1-Person Households | - | 14 (21.2%) |
| 2-Person Households | 22 (33.3%) | 6 (9.1%) |
| 3-Person Households | 8 (12.1%) | 0 (0.0%) |
| 4-Person Households | 7 (10.6%) | 0 (0.0%) |
| 5-Person Households | 4 (6.1%) | 0 (0.0%) |
| 6-Person Households | 5 (7.6%) | 0 (0.0%) |
| 7+ Person Households | 0 (0.0%) | 0 (0.0%) |
| Total | 46 (69.7%) | 20 (30.3%) |
Female Fertility in Atwood borough
Fertility by Age in Atwood borough
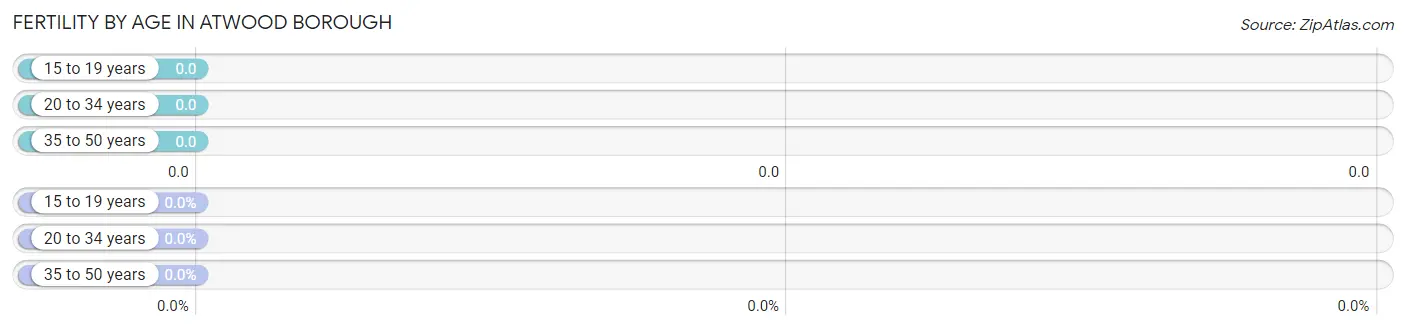
| Age Bracket | Women with Births | Births / 1,000 Women |
| 15 to 19 years | 0 (0.0%) | 0.0 |
| 20 to 34 years | 0 (0.0%) | 0.0 |
| 35 to 50 years | 0 (0.0%) | 0.0 |
| Total | 0 (0.0%) | 0.0 |
Fertility by Age by Marriage Status in Atwood borough
| Age Bracket | Married | Unmarried |
| 15 to 19 years | 0 (0.0%) | 0 (0.0%) |
| 20 to 34 years | 0 (0.0%) | 0 (0.0%) |
| 35 to 50 years | 0 (0.0%) | 0 (0.0%) |
| Total | 0 (0.0%) | 0 (0.0%) |
Fertility by Education in Atwood borough
| Educational Attainment | Women with Births | Births / 1,000 Women |
| Less than High School | 0 (0.0%) | 0.0 |
| High School Diploma | 0 (0.0%) | 0.0 |
| College or Associate's Degree | 0 (0.0%) | 0.0 |
| Bachelor's Degree | 0 (0.0%) | 0.0 |
| Graduate Degree | 0 (0.0%) | 0.0 |
| Total | 0 (0.0%) | 0.0 |
Fertility by Education by Marriage Status in Atwood borough
| Educational Attainment | Married | Unmarried |
| Less than High School | 0 (0.0%) | 0 (0.0%) |
| High School Diploma | 0 (0.0%) | 0 (0.0%) |
| College or Associate's Degree | 0 (0.0%) | 0 (0.0%) |
| Bachelor's Degree | 0 (0.0%) | 0 (0.0%) |
| Graduate Degree | 0 (0.0%) | 0 (0.0%) |
| Total | 0 (0.0%) | 0 (0.0%) |
Employment Characteristics in Atwood borough
Employment by Class of Employer in Atwood borough
Among the 72 employed individuals in Atwood borough, private company employees (49 | 68.1%), self-employed (not incorporated) (12 | 16.7%), and state government employees (6 | 8.3%) make up the most common classes of employment.
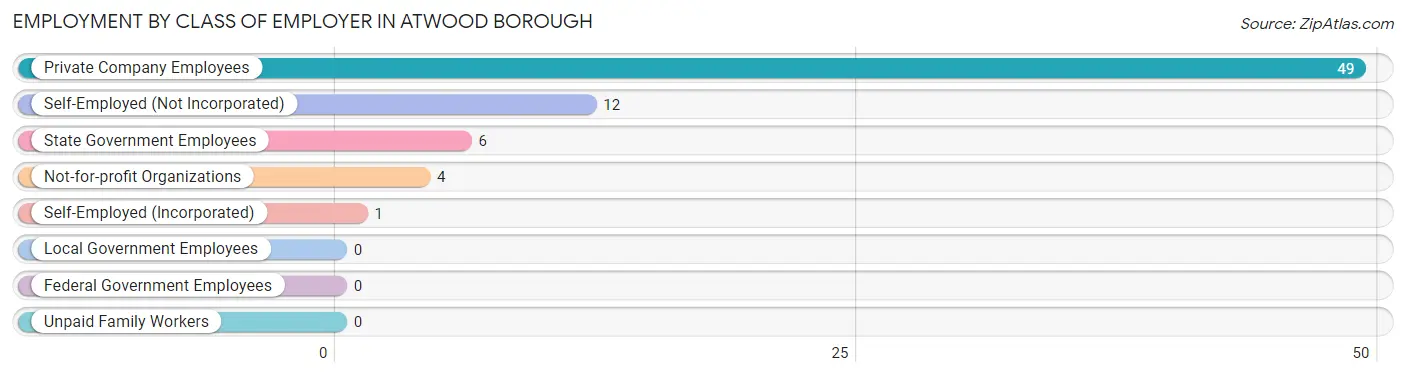
| Employer Class | # Employees | % Employees |
| Private Company Employees | 49 | 68.1% |
| Self-Employed (Incorporated) | 1 | 1.4% |
| Self-Employed (Not Incorporated) | 12 | 16.7% |
| Not-for-profit Organizations | 4 | 5.6% |
| Local Government Employees | 0 | 0.0% |
| State Government Employees | 6 | 8.3% |
| Federal Government Employees | 0 | 0.0% |
| Unpaid Family Workers | 0 | 0.0% |
| Total | 72 | 100.0% |
Employment Status by Age in Atwood borough
According to the labor force statistics for Atwood borough, out of the total population over 16 years of age (139), 56.1% or 78 individuals are in the labor force, with 7.7% or 6 of them unemployed. The age group with the highest labor force participation rate is 20 to 24 years, with 100.0% or 2 individuals in the labor force. Within the labor force, the 35 to 44 years age range has the highest percentage of unemployed individuals, with 27.8% or 5 of them being unemployed.
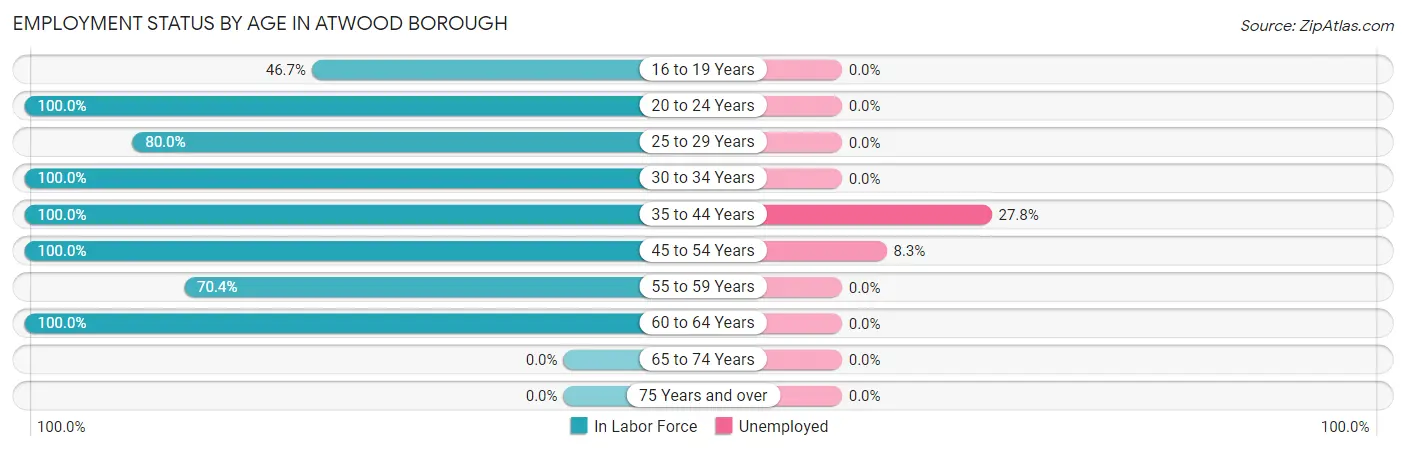
| Age Bracket | In Labor Force | Unemployed |
| 16 to 19 Years | 7 (46.7%) | 0 (0.0%) |
| 20 to 24 Years | 2 (100.0%) | 0 (0.0%) |
| 25 to 29 Years | 4 (80.0%) | 0 (0.0%) |
| 30 to 34 Years | 7 (100.0%) | 0 (0.0%) |
| 35 to 44 Years | 18 (100.0%) | 5 (27.8%) |
| 45 to 54 Years | 12 (100.0%) | 1 (8.3%) |
| 55 to 59 Years | 19 (70.4%) | 0 (0.0%) |
| 60 to 64 Years | 9 (100.0%) | 0 (0.0%) |
| 65 to 74 Years | 0 (0.0%) | 0 (0.0%) |
| 75 Years and over | 0 (0.0%) | 0 (0.0%) |
| Total | 78 (56.1%) | 6 (7.7%) |
Employment Status by Educational Attainment in Atwood borough
According to labor force statistics for Atwood borough, 88.5% of individuals (69) out of the total population between 25 and 64 years of age (78) are in the labor force, with 8.7% or 6 of them being unemployed. The group with the highest labor force participation rate are those with the educational attainment of less than high school, with 100.0% or 12 individuals in the labor force. Within the labor force, individuals with high school diploma education have the highest percentage of unemployment, with 20.7% or 6 of them being unemployed.
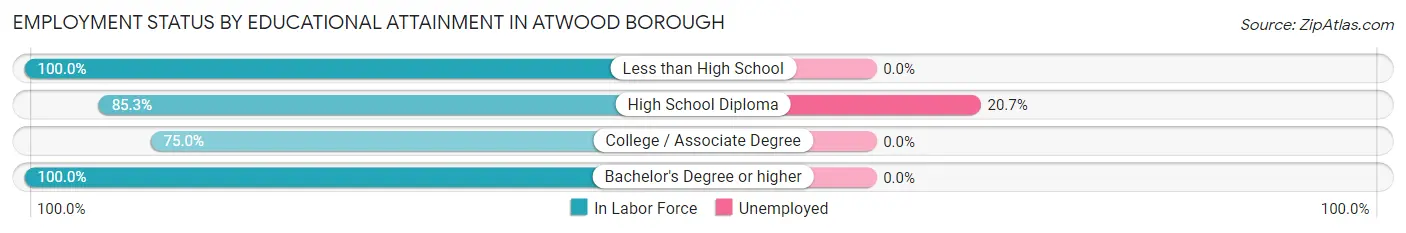
| Educational Attainment | In Labor Force | Unemployed |
| Less than High School | 12 (100.0%) | 0 (0.0%) |
| High School Diploma | 29 (85.3%) | 7 (20.7%) |
| College / Associate Degree | 12 (75.0%) | 0 (0.0%) |
| Bachelor's Degree or higher | 16 (100.0%) | 0 (0.0%) |
| Total | 69 (88.5%) | 7 (8.7%) |
Employment Occupations by Sex in Atwood borough
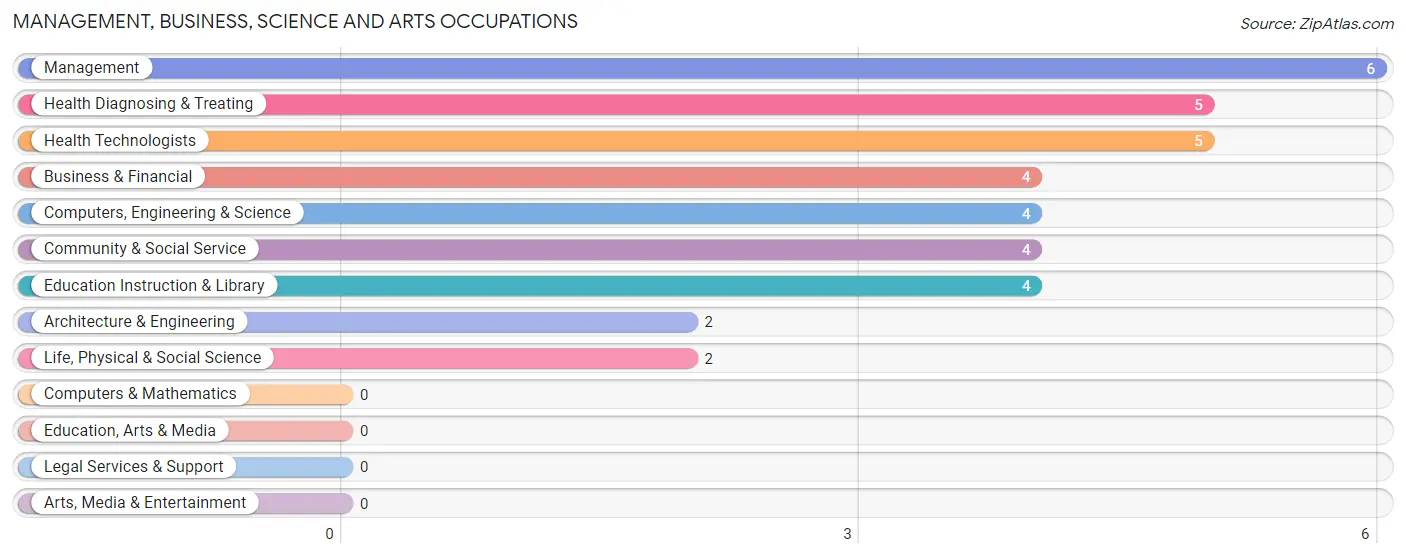
Management, Business, Science and Arts Occupations
The most common Management, Business, Science and Arts occupations in Atwood borough are Management (6 | 8.3%), Health Diagnosing & Treating (5 | 6.9%), Health Technologists (5 | 6.9%), Business & Financial (4 | 5.6%), and Computers, Engineering & Science (4 | 5.6%).
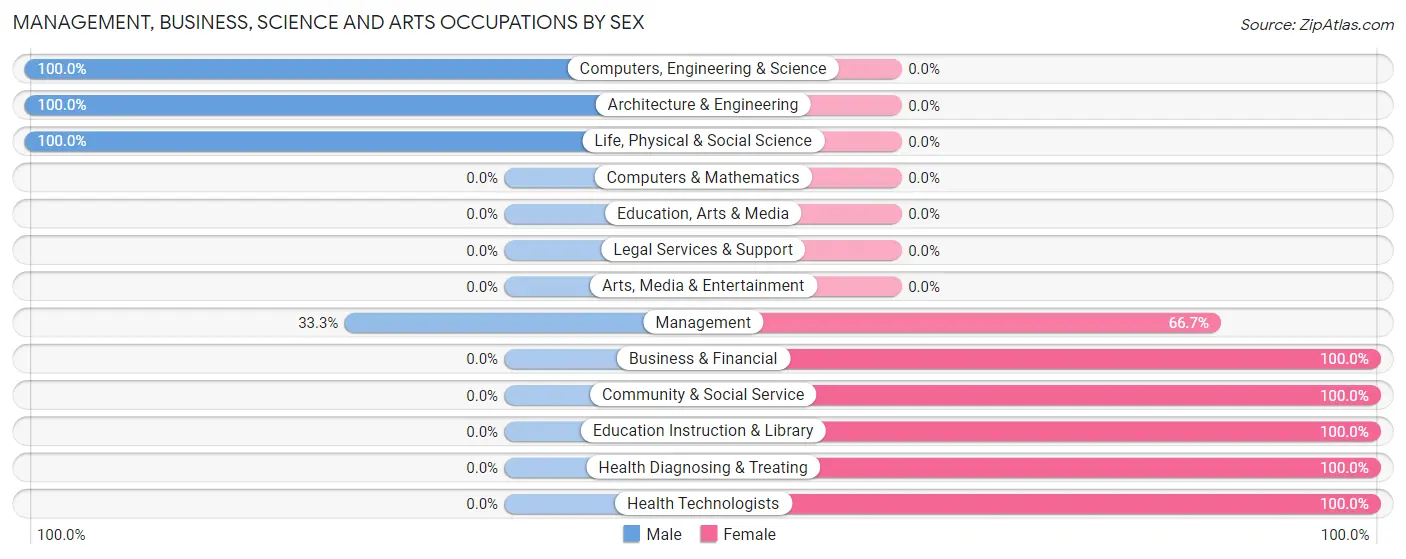
Management, Business, Science and Arts Occupations by Sex
Within the Management, Business, Science and Arts occupations in Atwood borough, the most male-oriented occupations are Computers, Engineering & Science (100.0%), Architecture & Engineering (100.0%), and Life, Physical & Social Science (100.0%), while the most female-oriented occupations are Business & Financial (100.0%), Community & Social Service (100.0%), and Education Instruction & Library (100.0%).
| Occupation | Male | Female |
| Management | 2 (33.3%) | 4 (66.7%) |
| Business & Financial | 0 (0.0%) | 4 (100.0%) |
| Computers, Engineering & Science | 4 (100.0%) | 0 (0.0%) |
| Computers & Mathematics | 0 (0.0%) | 0 (0.0%) |
| Architecture & Engineering | 2 (100.0%) | 0 (0.0%) |
| Life, Physical & Social Science | 2 (100.0%) | 0 (0.0%) |
| Community & Social Service | 0 (0.0%) | 4 (100.0%) |
| Education, Arts & Media | 0 (0.0%) | 0 (0.0%) |
| Legal Services & Support | 0 (0.0%) | 0 (0.0%) |
| Education Instruction & Library | 0 (0.0%) | 4 (100.0%) |
| Arts, Media & Entertainment | 0 (0.0%) | 0 (0.0%) |
| Health Diagnosing & Treating | 0 (0.0%) | 5 (100.0%) |
| Health Technologists | 0 (0.0%) | 5 (100.0%) |
| Total (Category) | 6 (26.1%) | 17 (73.9%) |
| Total (Overall) | 34 (47.2%) | 38 (52.8%) |
Services Occupations
The most common Services occupations in Atwood borough are Cleaning & Maintenance (8 | 11.1%), and Healthcare Support (5 | 6.9%).
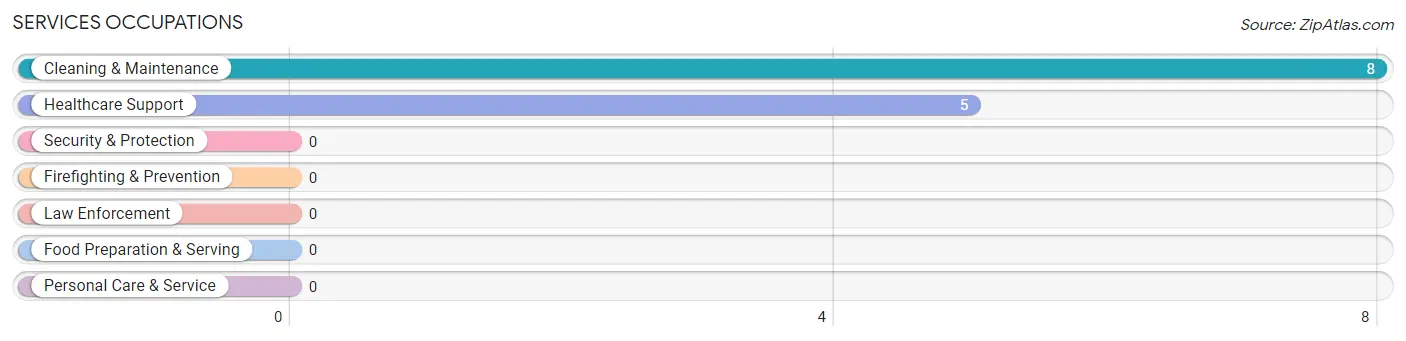
Services Occupations by Sex
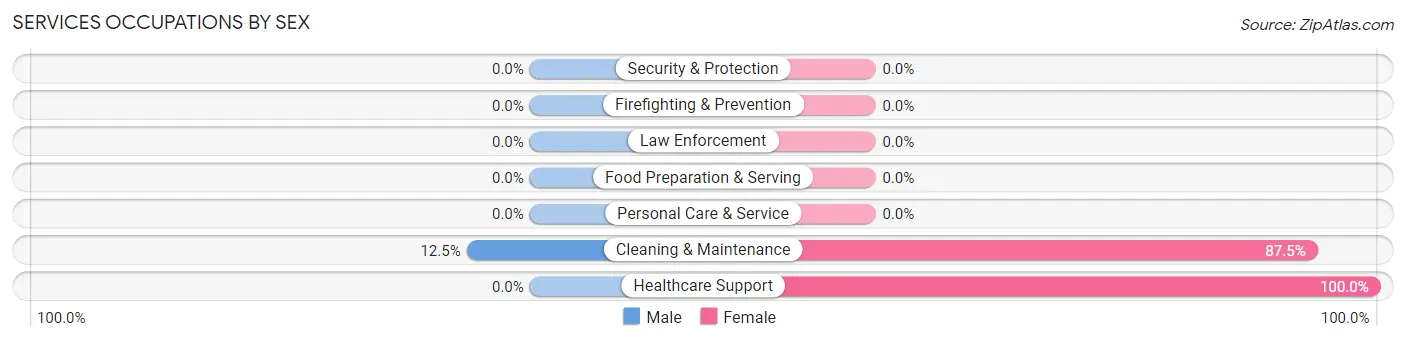
| Occupation | Male | Female |
| Healthcare Support | 0 (0.0%) | 5 (100.0%) |
| Security & Protection | 0 (0.0%) | 0 (0.0%) |
| Firefighting & Prevention | 0 (0.0%) | 0 (0.0%) |
| Law Enforcement | 0 (0.0%) | 0 (0.0%) |
| Food Preparation & Serving | 0 (0.0%) | 0 (0.0%) |
| Cleaning & Maintenance | 1 (12.5%) | 7 (87.5%) |
| Personal Care & Service | 0 (0.0%) | 0 (0.0%) |
| Total (Category) | 1 (7.7%) | 12 (92.3%) |
| Total (Overall) | 34 (47.2%) | 38 (52.8%) |
Sales and Office Occupations
The most common Sales and Office occupations in Atwood borough are Office & Administration (9 | 12.5%), and Sales & Related (7 | 9.7%).
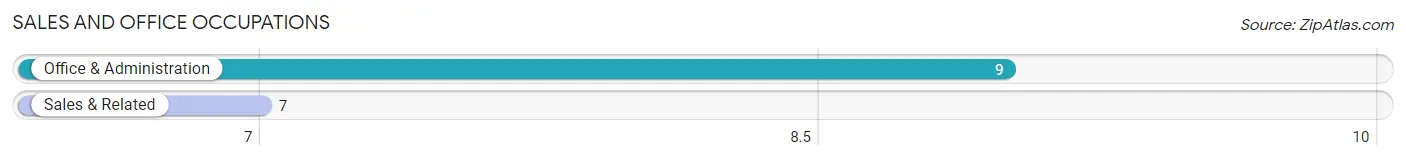
Sales and Office Occupations by Sex
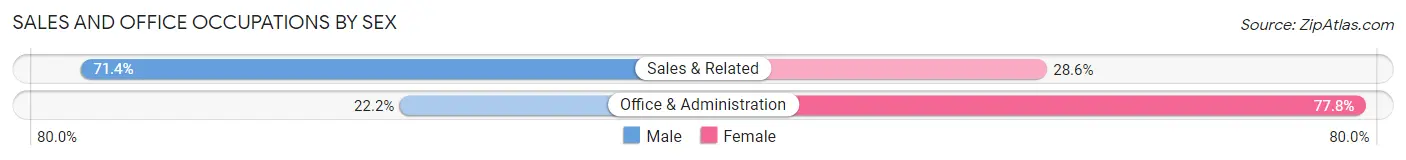
| Occupation | Male | Female |
| Sales & Related | 5 (71.4%) | 2 (28.6%) |
| Office & Administration | 2 (22.2%) | 7 (77.8%) |
| Total (Category) | 7 (43.8%) | 9 (56.2%) |
| Total (Overall) | 34 (47.2%) | 38 (52.8%) |
Natural Resources, Construction and Maintenance Occupations
The most common Natural Resources, Construction and Maintenance occupations in Atwood borough are Farming, Fishing & Forestry (3 | 4.2%), Installation, Maintenance & Repair (2 | 2.8%), and Construction & Extraction (1 | 1.4%).
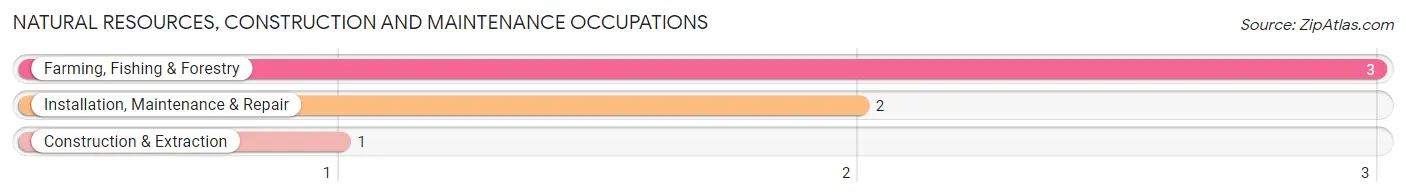
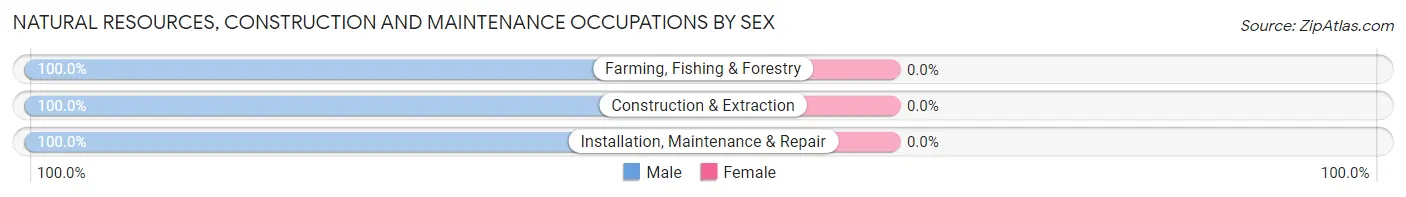
Natural Resources, Construction and Maintenance Occupations by Sex
| Occupation | Male | Female |
| Farming, Fishing & Forestry | 3 (100.0%) | 0 (0.0%) |
| Construction & Extraction | 1 (100.0%) | 0 (0.0%) |
| Installation, Maintenance & Repair | 2 (100.0%) | 0 (0.0%) |
| Total (Category) | 6 (100.0%) | 0 (0.0%) |
| Total (Overall) | 34 (47.2%) | 38 (52.8%) |
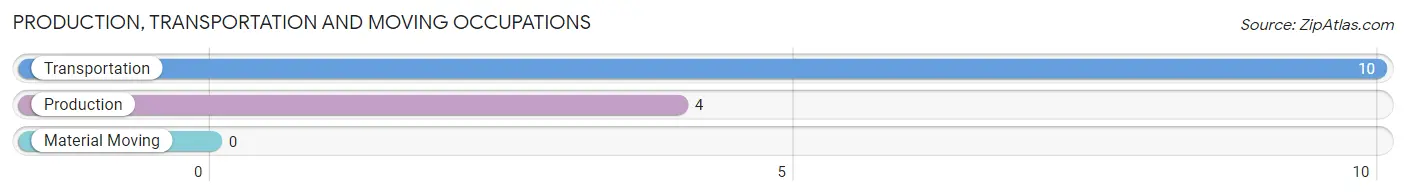
Production, Transportation and Moving Occupations
The most common Production, Transportation and Moving occupations in Atwood borough are Transportation (10 | 13.9%), and Production (4 | 5.6%).
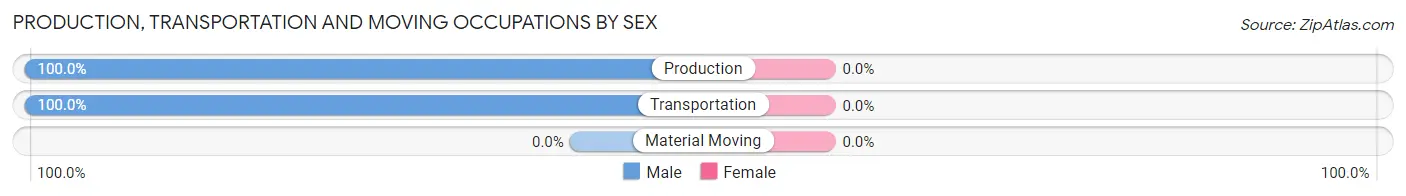
Production, Transportation and Moving Occupations by Sex
| Occupation | Male | Female |
| Production | 4 (100.0%) | 0 (0.0%) |
| Transportation | 10 (100.0%) | 0 (0.0%) |
| Material Moving | 0 (0.0%) | 0 (0.0%) |
| Total (Category) | 14 (100.0%) | 0 (0.0%) |
| Total (Overall) | 34 (47.2%) | 38 (52.8%) |
Employment Industries by Sex in Atwood borough
Employment Industries in Atwood borough
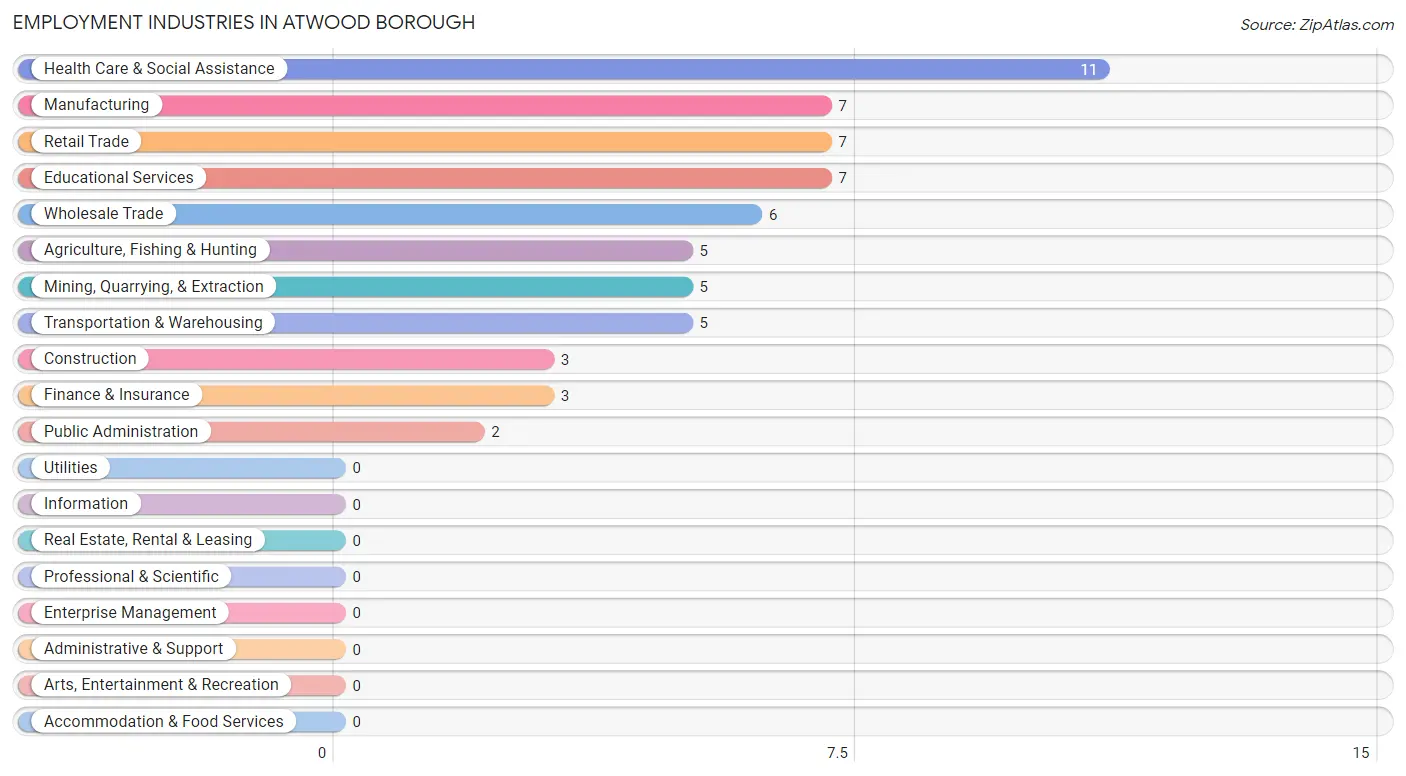
The major employment industries in Atwood borough include Health Care & Social Assistance (11 | 15.3%), Manufacturing (7 | 9.7%), Retail Trade (7 | 9.7%), Educational Services (7 | 9.7%), and Wholesale Trade (6 | 8.3%).
Employment Industries by Sex in Atwood borough
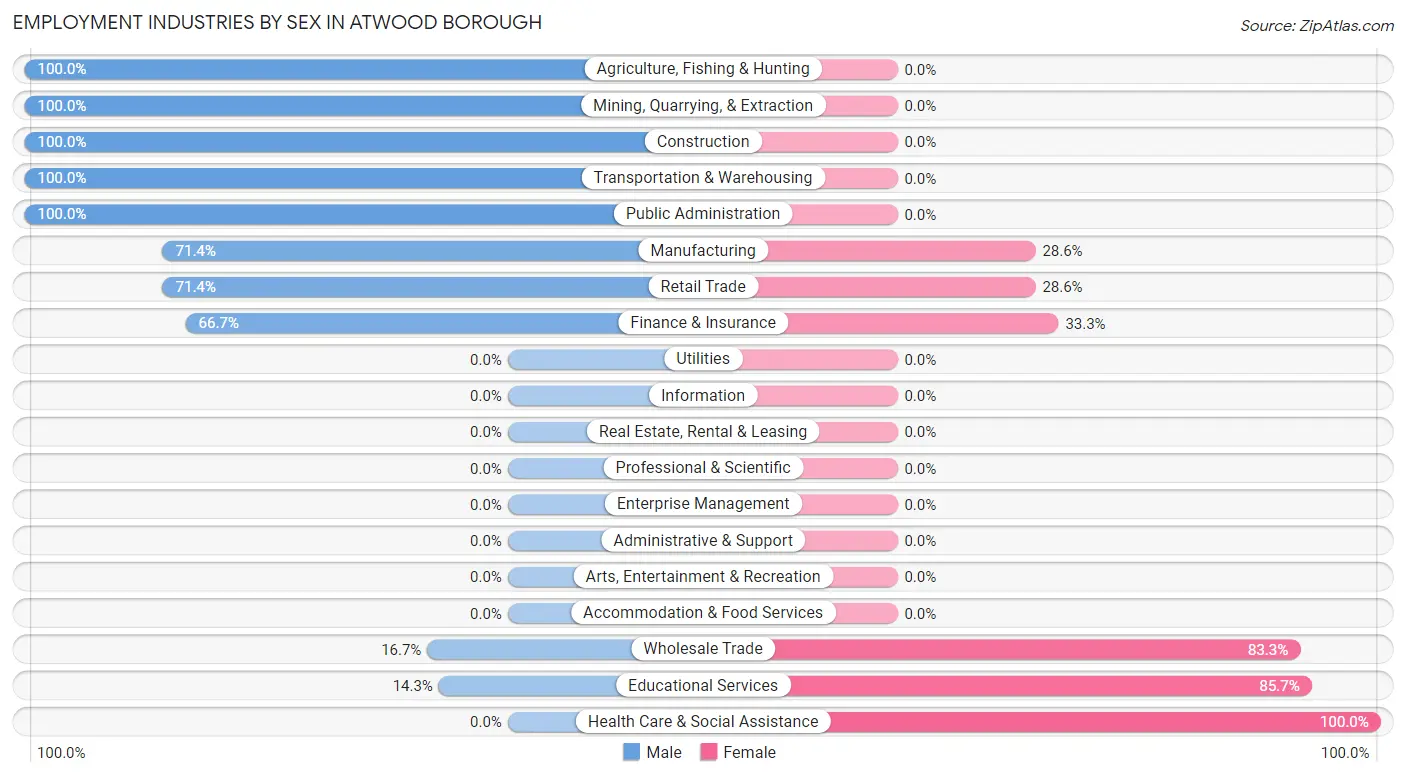
The Atwood borough industries that see more men than women are Agriculture, Fishing & Hunting (100.0%), Mining, Quarrying, & Extraction (100.0%), and Construction (100.0%), whereas the industries that tend to have a higher number of women are Health Care & Social Assistance (100.0%), Educational Services (85.7%), and Wholesale Trade (83.3%).
| Industry | Male | Female |
| Agriculture, Fishing & Hunting | 5 (100.0%) | 0 (0.0%) |
| Mining, Quarrying, & Extraction | 5 (100.0%) | 0 (0.0%) |
| Construction | 3 (100.0%) | 0 (0.0%) |
| Manufacturing | 5 (71.4%) | 2 (28.6%) |
| Wholesale Trade | 1 (16.7%) | 5 (83.3%) |
| Retail Trade | 5 (71.4%) | 2 (28.6%) |
| Transportation & Warehousing | 5 (100.0%) | 0 (0.0%) |
| Utilities | 0 (0.0%) | 0 (0.0%) |
| Information | 0 (0.0%) | 0 (0.0%) |
| Finance & Insurance | 2 (66.7%) | 1 (33.3%) |
| Real Estate, Rental & Leasing | 0 (0.0%) | 0 (0.0%) |
| Professional & Scientific | 0 (0.0%) | 0 (0.0%) |
| Enterprise Management | 0 (0.0%) | 0 (0.0%) |
| Administrative & Support | 0 (0.0%) | 0 (0.0%) |
| Educational Services | 1 (14.3%) | 6 (85.7%) |
| Health Care & Social Assistance | 0 (0.0%) | 11 (100.0%) |
| Arts, Entertainment & Recreation | 0 (0.0%) | 0 (0.0%) |
| Accommodation & Food Services | 0 (0.0%) | 0 (0.0%) |
| Public Administration | 2 (100.0%) | 0 (0.0%) |
| Total | 34 (47.2%) | 38 (52.8%) |
Education in Atwood borough
School Enrollment in Atwood borough
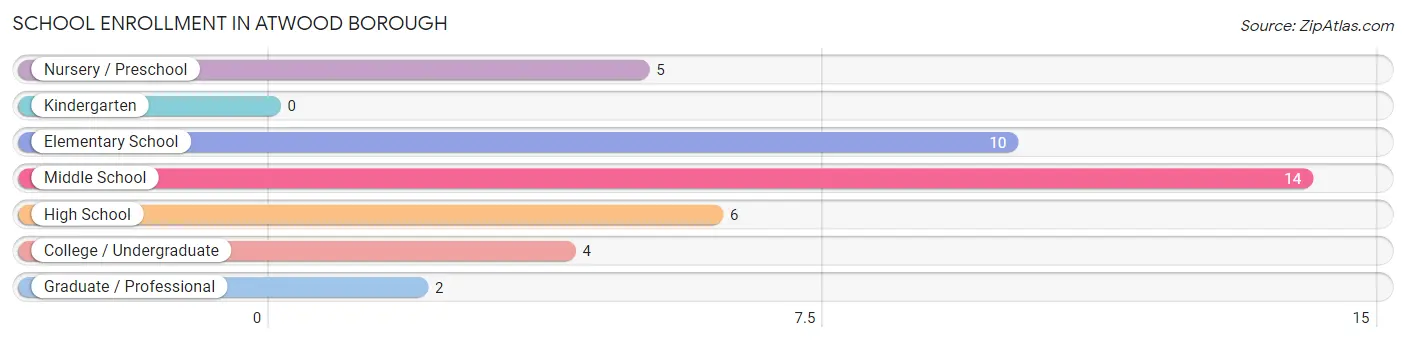
The most common levels of schooling among the 41 students in Atwood borough are middle school (14 | 34.2%), elementary school (10 | 24.4%), and high school (6 | 14.6%).
| School Level | # Students | % Students |
| Nursery / Preschool | 5 | 12.2% |
| Kindergarten | 0 | 0.0% |
| Elementary School | 10 | 24.4% |
| Middle School | 14 | 34.2% |
| High School | 6 | 14.6% |
| College / Undergraduate | 4 | 9.8% |
| Graduate / Professional | 2 | 4.9% |
| Total | 41 | 100.0% |
School Enrollment by Age by Funding Source in Atwood borough
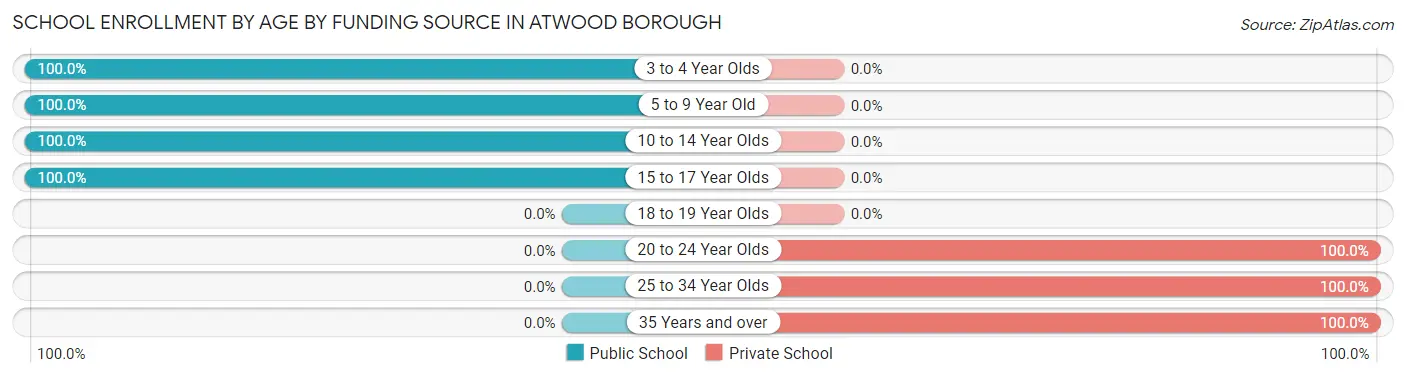
Out of a total of 41 students who are enrolled in schools in Atwood borough, 6 (14.6%) attend a private institution, while the remaining 35 (85.4%) are enrolled in public schools. The age group of 20 to 24 year olds has the highest likelihood of being enrolled in private schools, with 2 (100.0% in the age bracket) enrolled. Conversely, the age group of 3 to 4 year olds has the lowest likelihood of being enrolled in a private school, with 5 (100.0% in the age bracket) attending a public institution.
| Age Bracket | Public School | Private School |
| 3 to 4 Year Olds | 5 (100.0%) | 0 (0.0%) |
| 5 to 9 Year Old | 10 (100.0%) | 0 (0.0%) |
| 10 to 14 Year Olds | 14 (100.0%) | 0 (0.0%) |
| 15 to 17 Year Olds | 6 (100.0%) | 0 (0.0%) |
| 18 to 19 Year Olds | 0 (0.0%) | 0 (0.0%) |
| 20 to 24 Year Olds | 0 (0.0%) | 2 (100.0%) |
| 25 to 34 Year Olds | 0 (0.0%) | 2 (100.0%) |
| 35 Years and over | 0 (0.0%) | 2 (100.0%) |
| Total | 35 (85.4%) | 6 (14.6%) |
Educational Attainment by Field of Study in Atwood borough
Science & technology (6 | 33.3%), education (4 | 22.2%), physical & health sciences (2 | 11.1%), engineering (2 | 11.1%), and liberal arts & history (2 | 11.1%) are the most common fields of study among 18 individuals in Atwood borough who have obtained a bachelor's degree or higher.
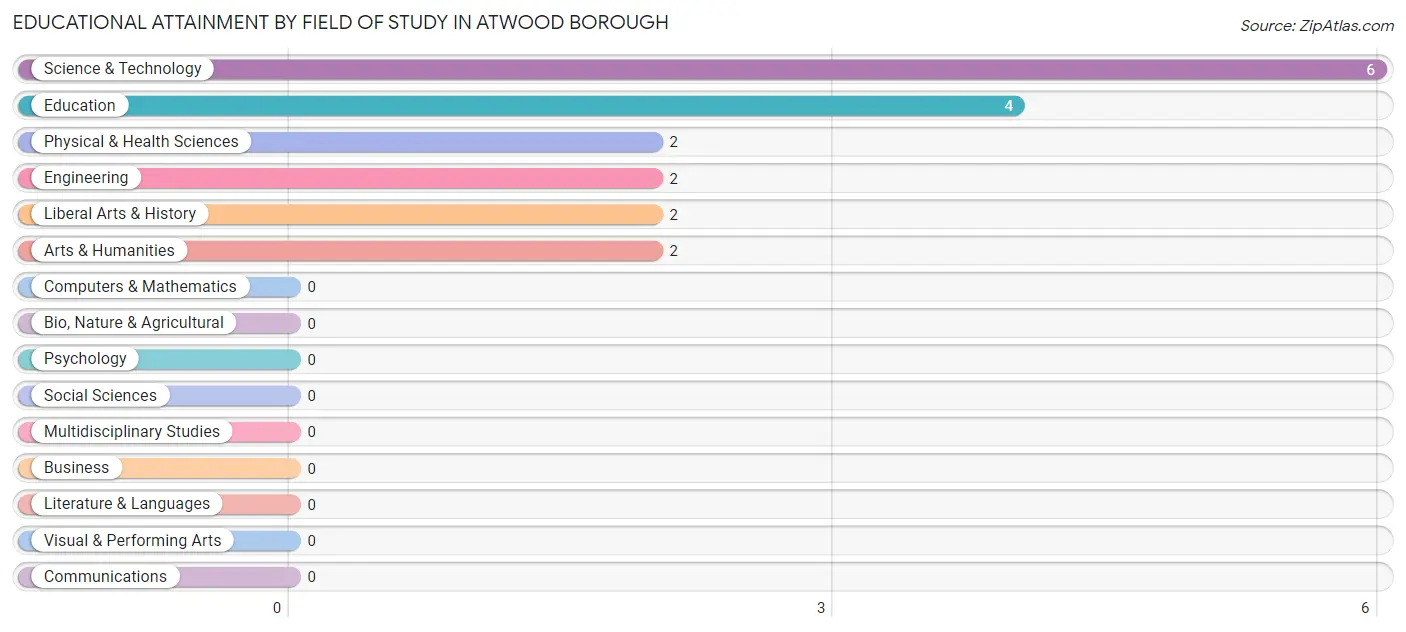
| Field of Study | # Graduates | % Graduates |
| Computers & Mathematics | 0 | 0.0% |
| Bio, Nature & Agricultural | 0 | 0.0% |
| Physical & Health Sciences | 2 | 11.1% |
| Psychology | 0 | 0.0% |
| Social Sciences | 0 | 0.0% |
| Engineering | 2 | 11.1% |
| Multidisciplinary Studies | 0 | 0.0% |
| Science & Technology | 6 | 33.3% |
| Business | 0 | 0.0% |
| Education | 4 | 22.2% |
| Literature & Languages | 0 | 0.0% |
| Liberal Arts & History | 2 | 11.1% |
| Visual & Performing Arts | 0 | 0.0% |
| Communications | 0 | 0.0% |
| Arts & Humanities | 2 | 11.1% |
| Total | 18 | 100.0% |
Transportation & Commute in Atwood borough
Vehicle Availability by Sex in Atwood borough
The most prevalent vehicle ownership categories in Atwood borough are males with 3 vehicles (13, accounting for 38.2%) and females with 3 vehicles (10, making up 34.2%).
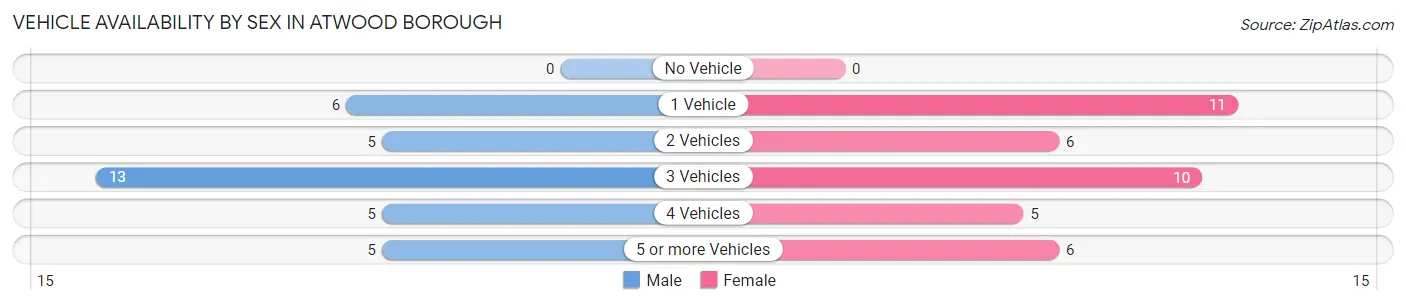
| Vehicles Available | Male | Female |
| No Vehicle | 0 (0.0%) | 0 (0.0%) |
| 1 Vehicle | 6 (17.6%) | 11 (28.9%) |
| 2 Vehicles | 5 (14.7%) | 6 (15.8%) |
| 3 Vehicles | 13 (38.2%) | 10 (26.3%) |
| 4 Vehicles | 5 (14.7%) | 5 (13.2%) |
| 5 or more Vehicles | 5 (14.7%) | 6 (15.8%) |
| Total | 34 (100.0%) | 38 (100.0%) |
Commute Time in Atwood borough
The most frequently occuring commute durations in Atwood borough are 45 to 59 minutes (14 commuters, 23.7%), 25 to 29 minutes (11 commuters, 18.6%), and 60 to 89 minutes (9 commuters, 15.2%).
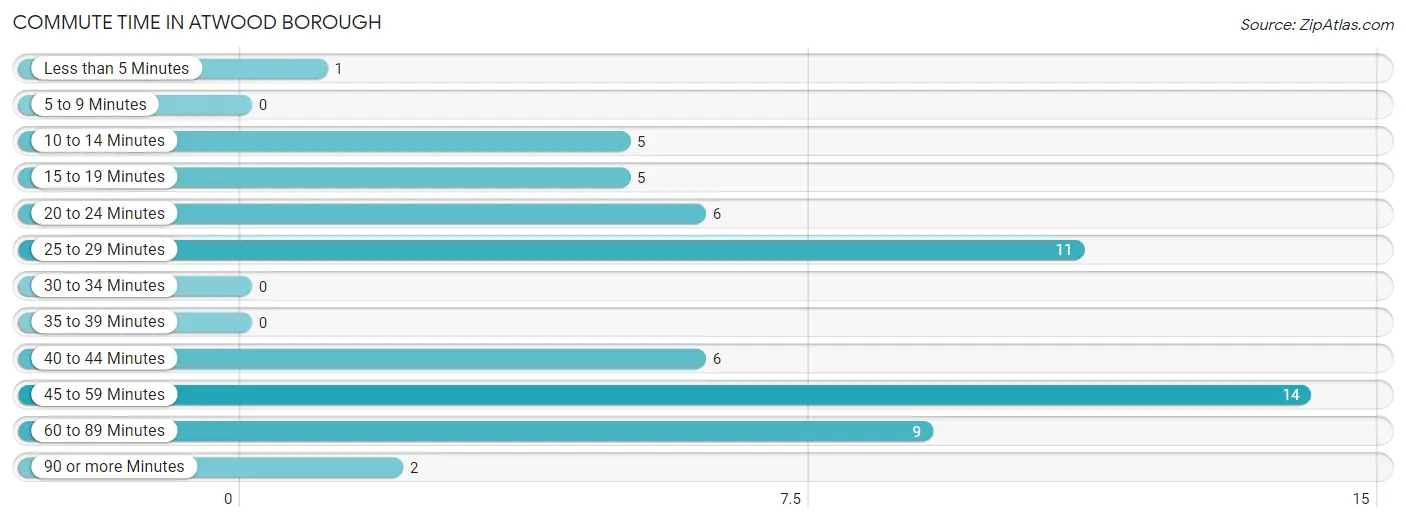
| Commute Time | # Commuters | % Commuters |
| Less than 5 Minutes | 1 | 1.7% |
| 5 to 9 Minutes | 0 | 0.0% |
| 10 to 14 Minutes | 5 | 8.5% |
| 15 to 19 Minutes | 5 | 8.5% |
| 20 to 24 Minutes | 6 | 10.2% |
| 25 to 29 Minutes | 11 | 18.6% |
| 30 to 34 Minutes | 0 | 0.0% |
| 35 to 39 Minutes | 0 | 0.0% |
| 40 to 44 Minutes | 6 | 10.2% |
| 45 to 59 Minutes | 14 | 23.7% |
| 60 to 89 Minutes | 9 | 15.2% |
| 90 or more Minutes | 2 | 3.4% |
Commute Time by Sex in Atwood borough
The most common commute times in Atwood borough are 45 to 59 minutes (8 commuters, 25.8%) for males and 25 to 29 minutes (11 commuters, 39.3%) for females.
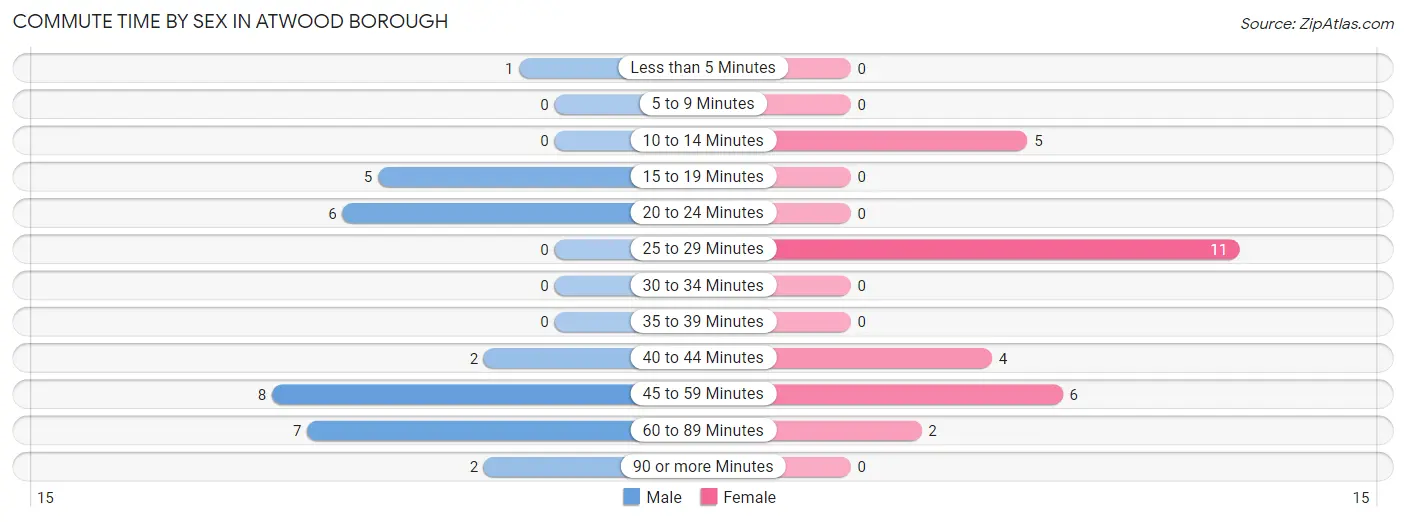
| Commute Time | Male | Female |
| Less than 5 Minutes | 1 (3.2%) | 0 (0.0%) |
| 5 to 9 Minutes | 0 (0.0%) | 0 (0.0%) |
| 10 to 14 Minutes | 0 (0.0%) | 5 (17.9%) |
| 15 to 19 Minutes | 5 (16.1%) | 0 (0.0%) |
| 20 to 24 Minutes | 6 (19.4%) | 0 (0.0%) |
| 25 to 29 Minutes | 0 (0.0%) | 11 (39.3%) |
| 30 to 34 Minutes | 0 (0.0%) | 0 (0.0%) |
| 35 to 39 Minutes | 0 (0.0%) | 0 (0.0%) |
| 40 to 44 Minutes | 2 (6.5%) | 4 (14.3%) |
| 45 to 59 Minutes | 8 (25.8%) | 6 (21.4%) |
| 60 to 89 Minutes | 7 (22.6%) | 2 (7.1%) |
| 90 or more Minutes | 2 (6.5%) | 0 (0.0%) |
Time of Departure to Work by Sex in Atwood borough
The most frequent times of departure to work in Atwood borough are 12:00 AM to 4:59 AM (10, 32.3%) for males and 7:00 AM to 7:29 AM (12, 42.9%) for females.
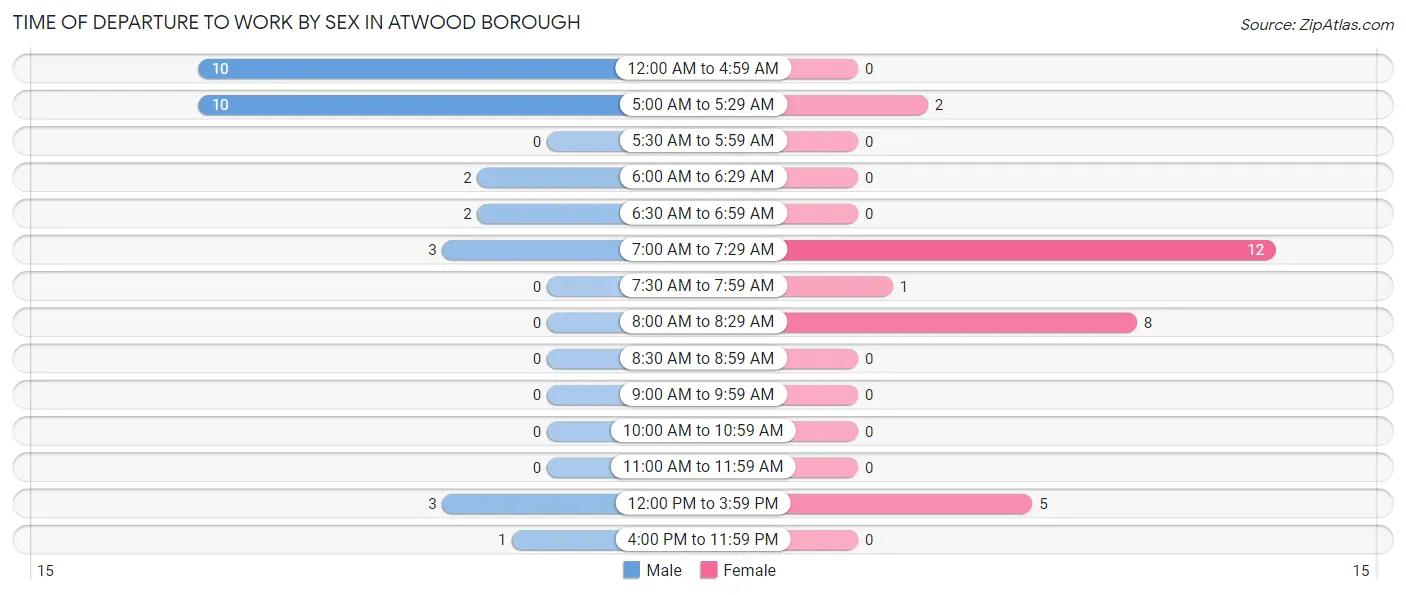
| Time of Departure | Male | Female |
| 12:00 AM to 4:59 AM | 10 (32.3%) | 0 (0.0%) |
| 5:00 AM to 5:29 AM | 10 (32.3%) | 2 (7.1%) |
| 5:30 AM to 5:59 AM | 0 (0.0%) | 0 (0.0%) |
| 6:00 AM to 6:29 AM | 2 (6.5%) | 0 (0.0%) |
| 6:30 AM to 6:59 AM | 2 (6.5%) | 0 (0.0%) |
| 7:00 AM to 7:29 AM | 3 (9.7%) | 12 (42.9%) |
| 7:30 AM to 7:59 AM | 0 (0.0%) | 1 (3.6%) |
| 8:00 AM to 8:29 AM | 0 (0.0%) | 8 (28.6%) |
| 8:30 AM to 8:59 AM | 0 (0.0%) | 0 (0.0%) |
| 9:00 AM to 9:59 AM | 0 (0.0%) | 0 (0.0%) |
| 10:00 AM to 10:59 AM | 0 (0.0%) | 0 (0.0%) |
| 11:00 AM to 11:59 AM | 0 (0.0%) | 0 (0.0%) |
| 12:00 PM to 3:59 PM | 3 (9.7%) | 5 (17.9%) |
| 4:00 PM to 11:59 PM | 1 (3.2%) | 0 (0.0%) |
| Total | 31 (100.0%) | 28 (100.0%) |
Housing Occupancy in Atwood borough
Occupancy by Ownership in Atwood borough
Of the total 66 dwellings in Atwood borough, owner-occupied units account for 57 (86.4%), while renter-occupied units make up 9 (13.6%).
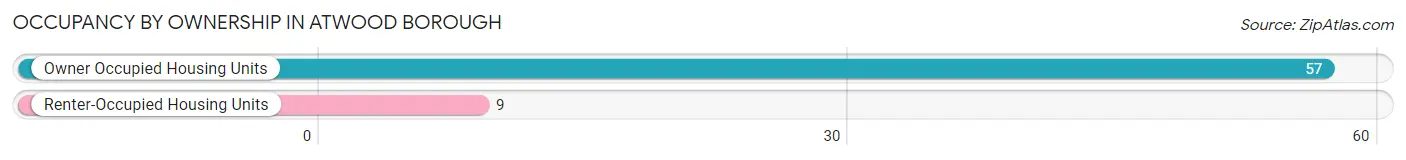
| Occupancy | # Housing Units | % Housing Units |
| Owner Occupied Housing Units | 57 | 86.4% |
| Renter-Occupied Housing Units | 9 | 13.6% |
| Total Occupied Housing Units | 66 | 100.0% |
Occupancy by Household Size in Atwood borough
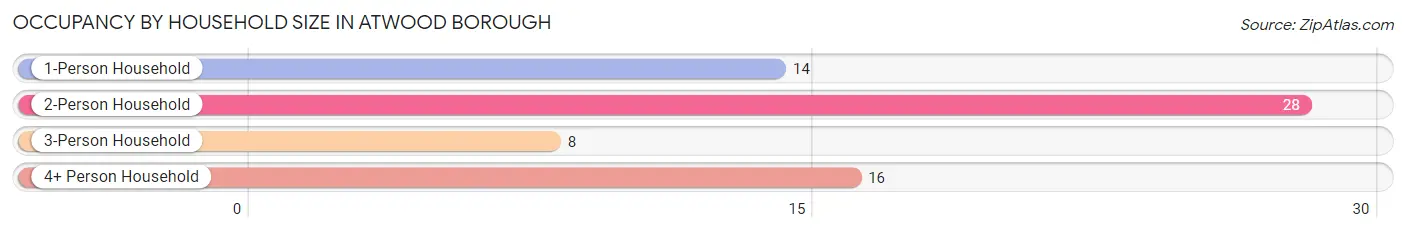
| Household Size | # Housing Units | % Housing Units |
| 1-Person Household | 14 | 21.2% |
| 2-Person Household | 28 | 42.4% |
| 3-Person Household | 8 | 12.1% |
| 4+ Person Household | 16 | 24.2% |
| Total Housing Units | 66 | 100.0% |
Occupancy by Ownership by Household Size in Atwood borough
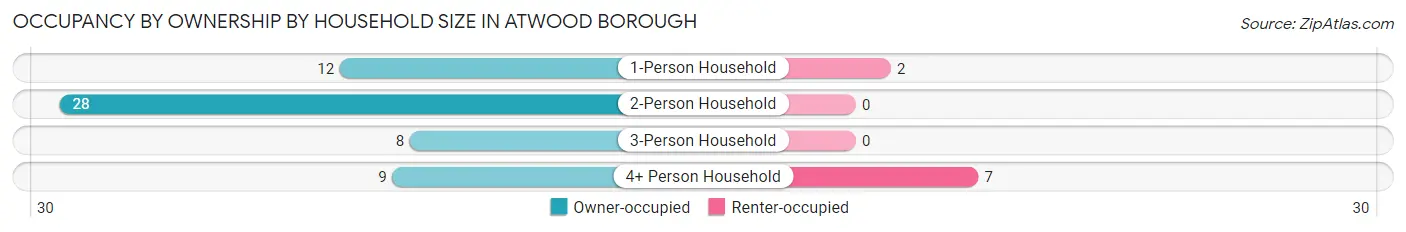
| Household Size | Owner-occupied | Renter-occupied |
| 1-Person Household | 12 (85.7%) | 2 (14.3%) |
| 2-Person Household | 28 (100.0%) | 0 (0.0%) |
| 3-Person Household | 8 (100.0%) | 0 (0.0%) |
| 4+ Person Household | 9 (56.2%) | 7 (43.8%) |
| Total Housing Units | 57 (86.4%) | 9 (13.6%) |
Occupancy by Educational Attainment in Atwood borough
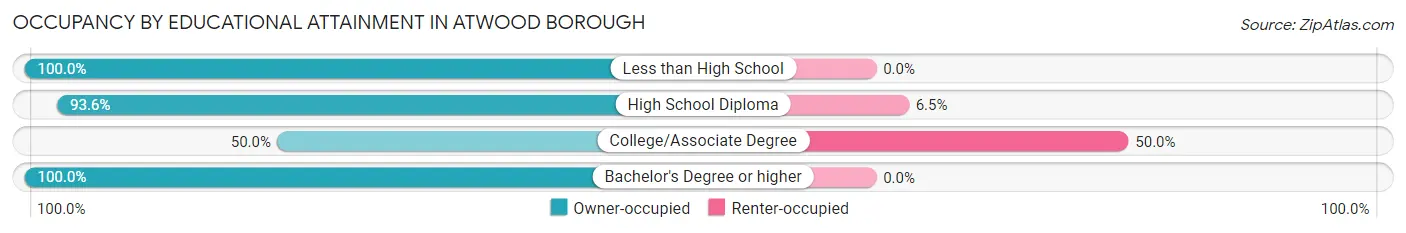
| Household Size | Owner-occupied | Renter-occupied |
| Less than High School | 13 (100.0%) | 0 (0.0%) |
| High School Diploma | 29 (93.5%) | 2 (6.5%) |
| College/Associate Degree | 7 (50.0%) | 7 (50.0%) |
| Bachelor's Degree or higher | 8 (100.0%) | 0 (0.0%) |
Occupancy by Age of Householder in Atwood borough
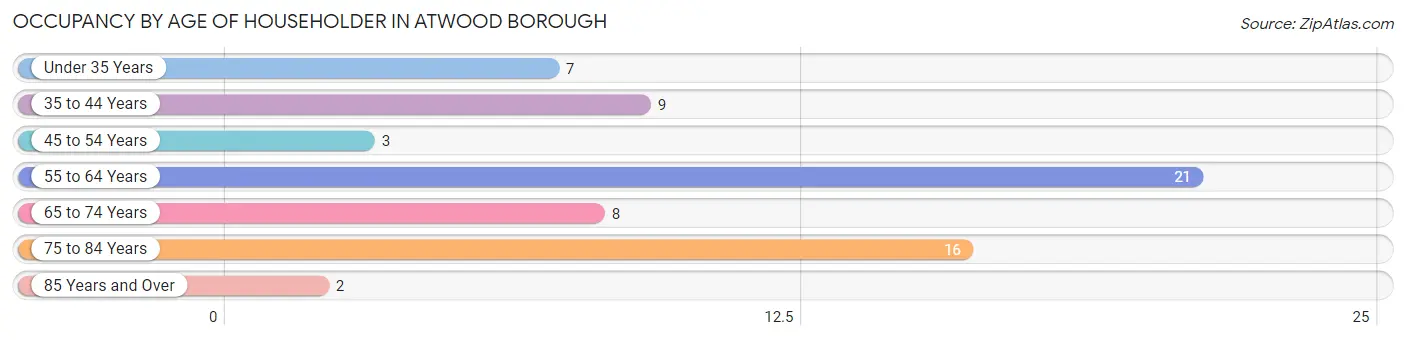
| Age Bracket | # Households | % Households |
| Under 35 Years | 7 | 10.6% |
| 35 to 44 Years | 9 | 13.6% |
| 45 to 54 Years | 3 | 4.5% |
| 55 to 64 Years | 21 | 31.8% |
| 65 to 74 Years | 8 | 12.1% |
| 75 to 84 Years | 16 | 24.2% |
| 85 Years and Over | 2 | 3.0% |
| Total | 66 | 100.0% |
Housing Finances in Atwood borough
Median Income by Occupancy in Atwood borough
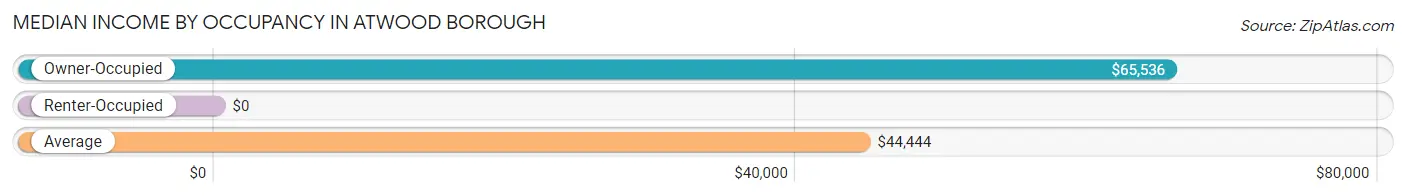
| Occupancy Type | # Households | Median Income |
| Owner-Occupied | 57 (86.4%) | $65,536 |
| Renter-Occupied | 9 (13.6%) | $0 |
| Average | 66 (100.0%) | $44,444 |
Occupancy by Householder Income Bracket in Atwood borough
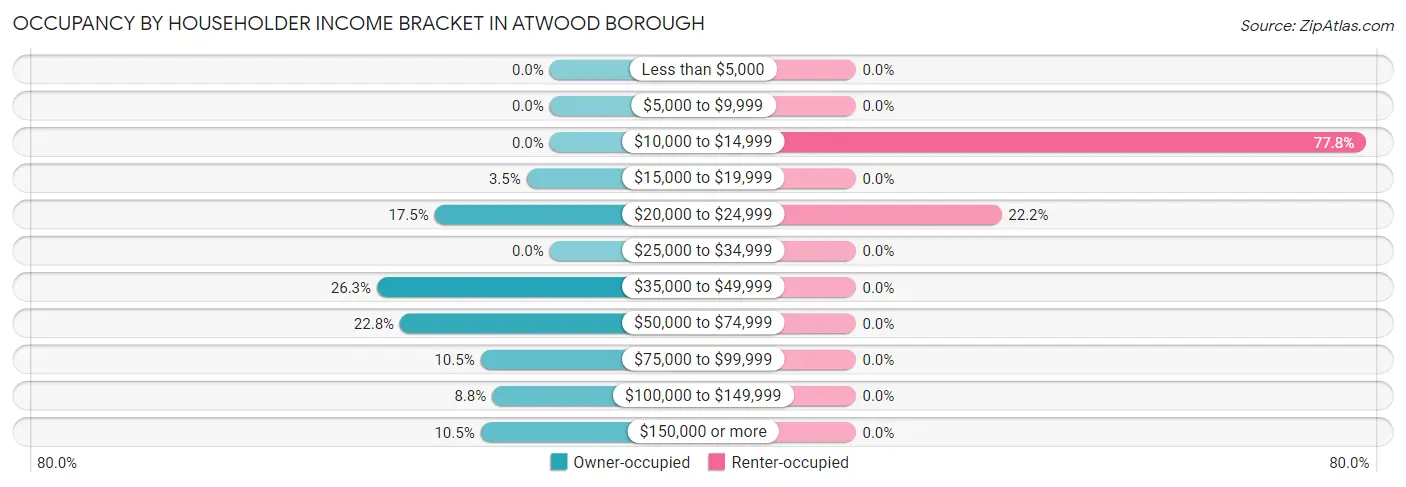
| Income Bracket | Owner-occupied | Renter-occupied |
| Less than $5,000 | 0 (0.0%) | 0 (0.0%) |
| $5,000 to $9,999 | 0 (0.0%) | 0 (0.0%) |
| $10,000 to $14,999 | 0 (0.0%) | 7 (77.8%) |
| $15,000 to $19,999 | 2 (3.5%) | 0 (0.0%) |
| $20,000 to $24,999 | 10 (17.5%) | 2 (22.2%) |
| $25,000 to $34,999 | 0 (0.0%) | 0 (0.0%) |
| $35,000 to $49,999 | 15 (26.3%) | 0 (0.0%) |
| $50,000 to $74,999 | 13 (22.8%) | 0 (0.0%) |
| $75,000 to $99,999 | 6 (10.5%) | 0 (0.0%) |
| $100,000 to $149,999 | 5 (8.8%) | 0 (0.0%) |
| $150,000 or more | 6 (10.5%) | 0 (0.0%) |
| Total | 57 (100.0%) | 9 (100.0%) |
Monthly Housing Cost Tiers in Atwood borough
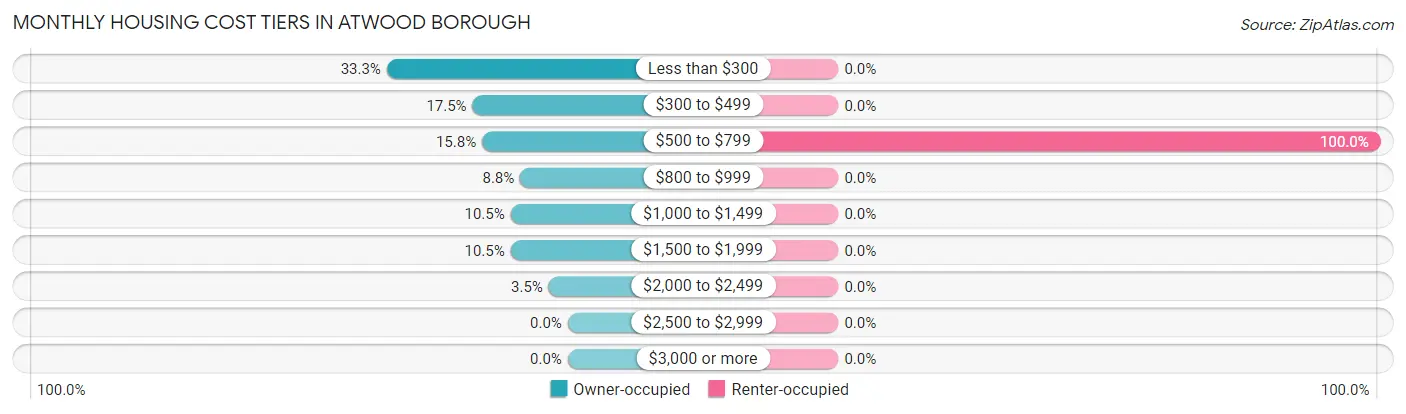
| Monthly Cost | Owner-occupied | Renter-occupied |
| Less than $300 | 19 (33.3%) | 0 (0.0%) |
| $300 to $499 | 10 (17.5%) | 0 (0.0%) |
| $500 to $799 | 9 (15.8%) | 9 (100.0%) |
| $800 to $999 | 5 (8.8%) | 0 (0.0%) |
| $1,000 to $1,499 | 6 (10.5%) | 0 (0.0%) |
| $1,500 to $1,999 | 6 (10.5%) | 0 (0.0%) |
| $2,000 to $2,499 | 2 (3.5%) | 0 (0.0%) |
| $2,500 to $2,999 | 0 (0.0%) | 0 (0.0%) |
| $3,000 or more | 0 (0.0%) | 0 (0.0%) |
| Total | 57 (100.0%) | 9 (100.0%) |
Physical Housing Characteristics in Atwood borough
Housing Structures in Atwood borough
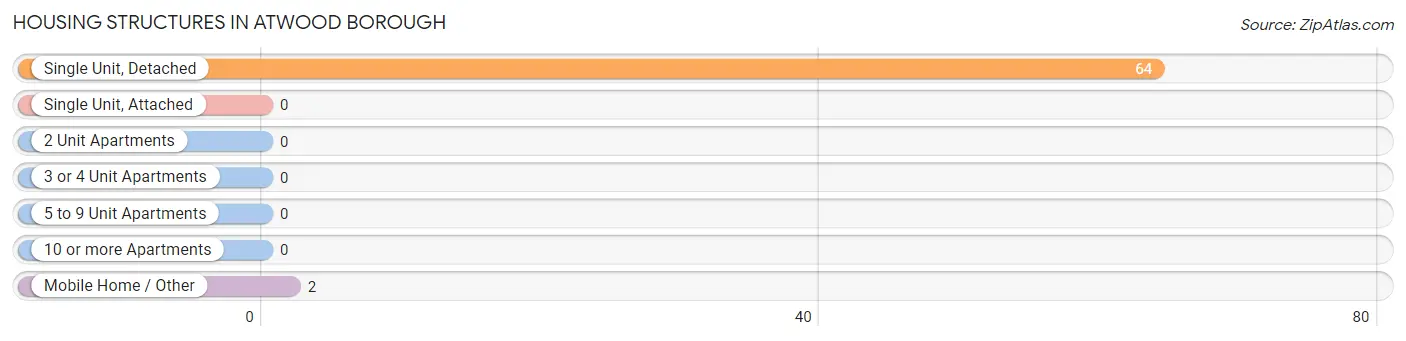
| Structure Type | # Housing Units | % Housing Units |
| Single Unit, Detached | 64 | 97.0% |
| Single Unit, Attached | 0 | 0.0% |
| 2 Unit Apartments | 0 | 0.0% |
| 3 or 4 Unit Apartments | 0 | 0.0% |
| 5 to 9 Unit Apartments | 0 | 0.0% |
| 10 or more Apartments | 0 | 0.0% |
| Mobile Home / Other | 2 | 3.0% |
| Total | 66 | 100.0% |
Housing Structures by Occupancy in Atwood borough
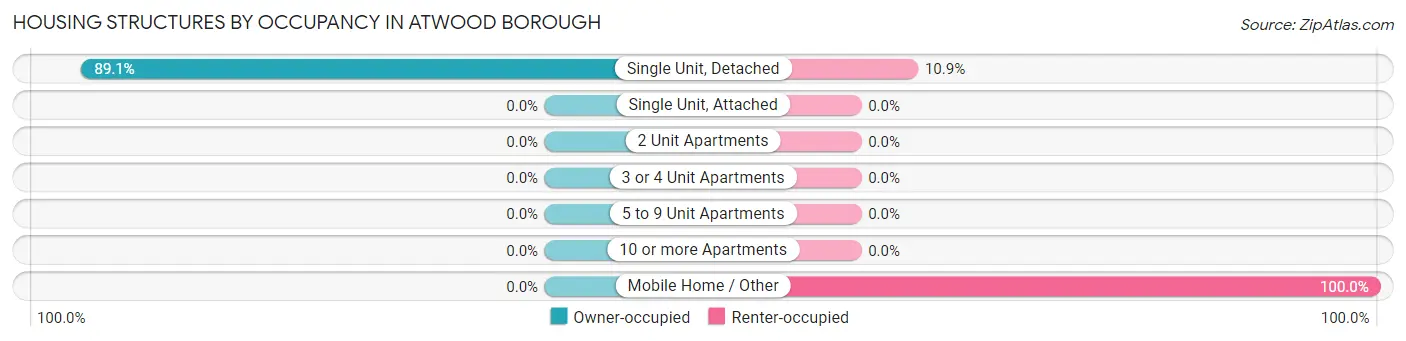
| Structure Type | Owner-occupied | Renter-occupied |
| Single Unit, Detached | 57 (89.1%) | 7 (10.9%) |
| Single Unit, Attached | 0 (0.0%) | 0 (0.0%) |
| 2 Unit Apartments | 0 (0.0%) | 0 (0.0%) |
| 3 or 4 Unit Apartments | 0 (0.0%) | 0 (0.0%) |
| 5 to 9 Unit Apartments | 0 (0.0%) | 0 (0.0%) |
| 10 or more Apartments | 0 (0.0%) | 0 (0.0%) |
| Mobile Home / Other | 0 (0.0%) | 2 (100.0%) |
| Total | 57 (86.4%) | 9 (13.6%) |
Housing Structures by Number of Rooms in Atwood borough
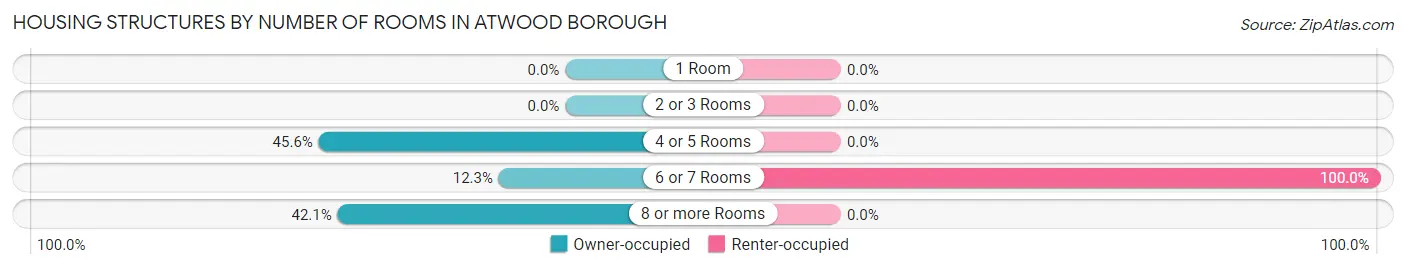
| Number of Rooms | Owner-occupied | Renter-occupied |
| 1 Room | 0 (0.0%) | 0 (0.0%) |
| 2 or 3 Rooms | 0 (0.0%) | 0 (0.0%) |
| 4 or 5 Rooms | 26 (45.6%) | 0 (0.0%) |
| 6 or 7 Rooms | 7 (12.3%) | 9 (100.0%) |
| 8 or more Rooms | 24 (42.1%) | 0 (0.0%) |
| Total | 57 (100.0%) | 9 (100.0%) |
Housing Structure by Heating Type in Atwood borough
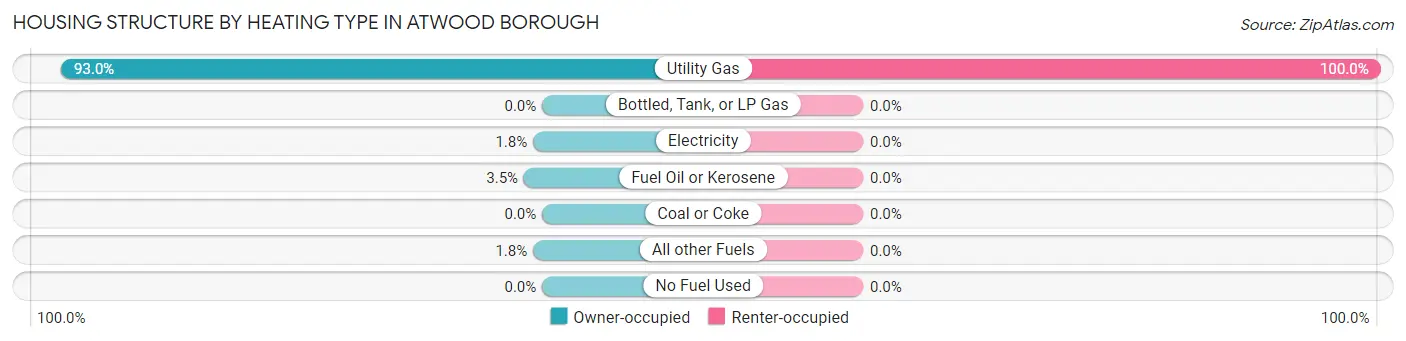
| Heating Type | Owner-occupied | Renter-occupied |
| Utility Gas | 53 (93.0%) | 9 (100.0%) |
| Bottled, Tank, or LP Gas | 0 (0.0%) | 0 (0.0%) |
| Electricity | 1 (1.8%) | 0 (0.0%) |
| Fuel Oil or Kerosene | 2 (3.5%) | 0 (0.0%) |
| Coal or Coke | 0 (0.0%) | 0 (0.0%) |
| All other Fuels | 1 (1.8%) | 0 (0.0%) |
| No Fuel Used | 0 (0.0%) | 0 (0.0%) |
| Total | 57 (100.0%) | 9 (100.0%) |
Household Vehicle Usage in Atwood borough
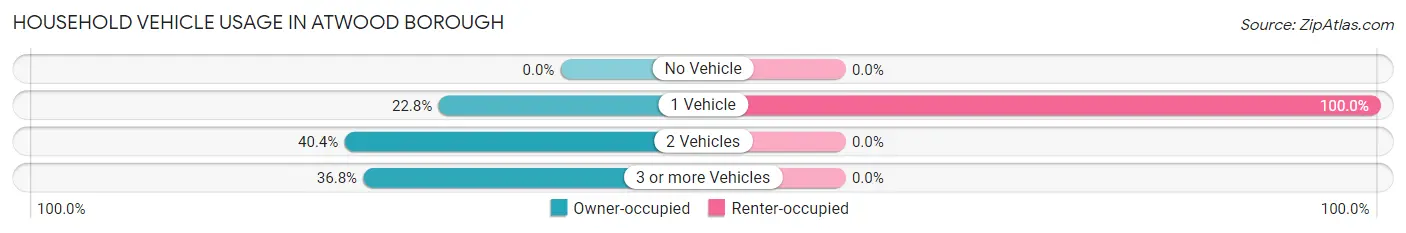
| Vehicles per Household | Owner-occupied | Renter-occupied |
| No Vehicle | 0 (0.0%) | 0 (0.0%) |
| 1 Vehicle | 13 (22.8%) | 9 (100.0%) |
| 2 Vehicles | 23 (40.4%) | 0 (0.0%) |
| 3 or more Vehicles | 21 (36.8%) | 0 (0.0%) |
| Total | 57 (100.0%) | 9 (100.0%) |
Real Estate & Mortgages in Atwood borough
Real Estate and Mortgage Overview in Atwood borough
| Characteristic | Without Mortgage | With Mortgage |
| Housing Units | 31 | 26 |
| Median Property Value | $205,000 | $171,900 |
| Median Household Income | $42,639 | $5 |
| Monthly Housing Costs | $281 | $0 |
| Real Estate Taxes | $1,139 | $0 |
Property Value by Mortgage Status in Atwood borough
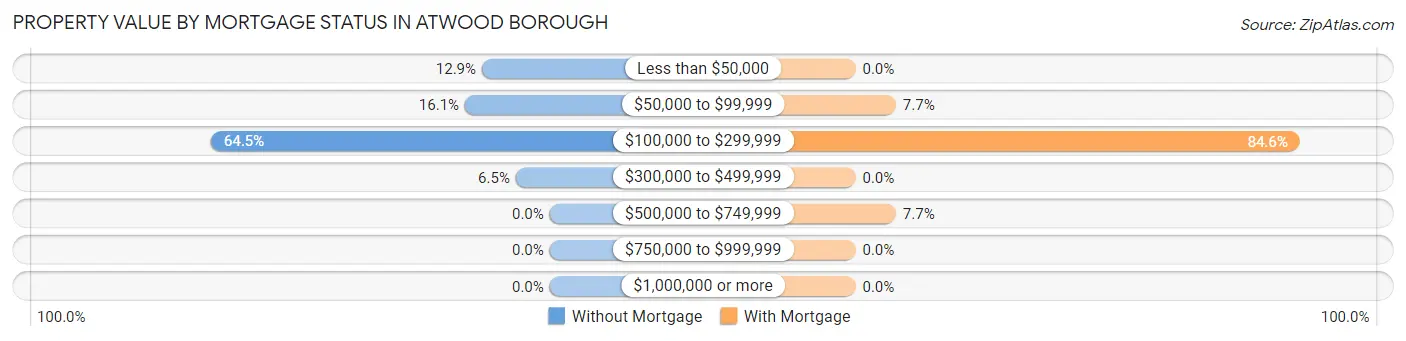
| Property Value | Without Mortgage | With Mortgage |
| Less than $50,000 | 4 (12.9%) | 0 (0.0%) |
| $50,000 to $99,999 | 5 (16.1%) | 2 (7.7%) |
| $100,000 to $299,999 | 20 (64.5%) | 22 (84.6%) |
| $300,000 to $499,999 | 2 (6.5%) | 0 (0.0%) |
| $500,000 to $749,999 | 0 (0.0%) | 2 (7.7%) |
| $750,000 to $999,999 | 0 (0.0%) | 0 (0.0%) |
| $1,000,000 or more | 0 (0.0%) | 0 (0.0%) |
| Total | 31 (100.0%) | 26 (100.0%) |
Household Income by Mortgage Status in Atwood borough
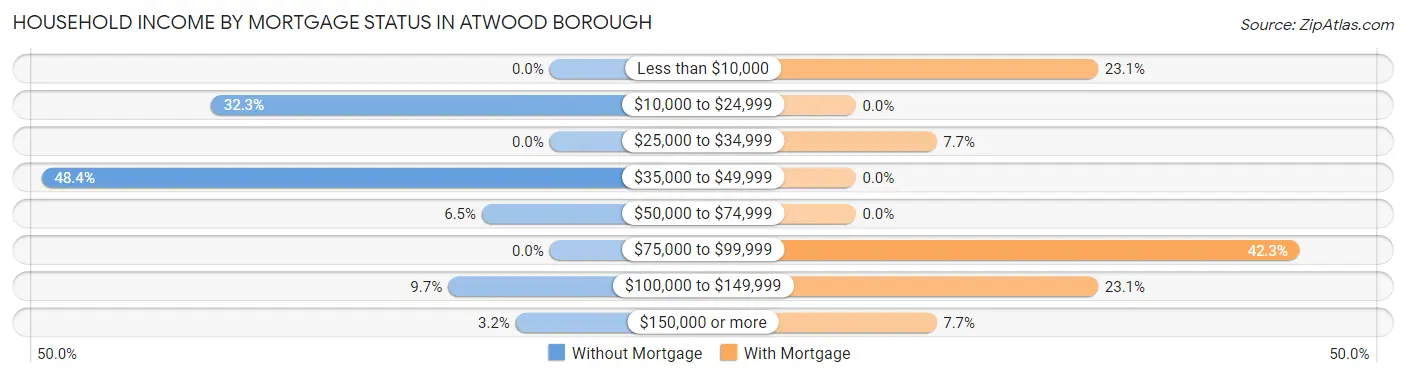
| Household Income | Without Mortgage | With Mortgage |
| Less than $10,000 | 0 (0.0%) | 6 (23.1%) |
| $10,000 to $24,999 | 10 (32.3%) | 0 (0.0%) |
| $25,000 to $34,999 | 0 (0.0%) | 2 (7.7%) |
| $35,000 to $49,999 | 15 (48.4%) | 0 (0.0%) |
| $50,000 to $74,999 | 2 (6.5%) | 0 (0.0%) |
| $75,000 to $99,999 | 0 (0.0%) | 11 (42.3%) |
| $100,000 to $149,999 | 3 (9.7%) | 6 (23.1%) |
| $150,000 or more | 1 (3.2%) | 2 (7.7%) |
| Total | 31 (100.0%) | 26 (100.0%) |
Property Value to Household Income Ratio in Atwood borough
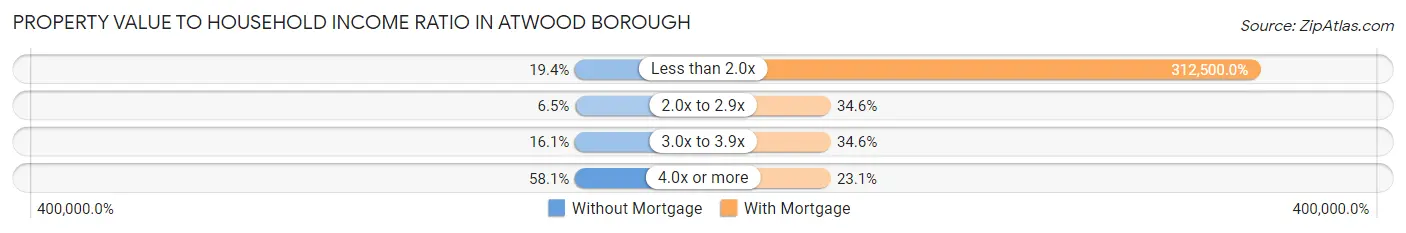
| Value-to-Income Ratio | Without Mortgage | With Mortgage |
| Less than 2.0x | 6 (19.4%) | 81,250 (312,500.0%) |
| 2.0x to 2.9x | 2 (6.5%) | 9 (34.6%) |
| 3.0x to 3.9x | 5 (16.1%) | 9 (34.6%) |
| 4.0x or more | 18 (58.1%) | 6 (23.1%) |
| Total | 31 (100.0%) | 26 (100.0%) |
Real Estate Taxes by Mortgage Status in Atwood borough
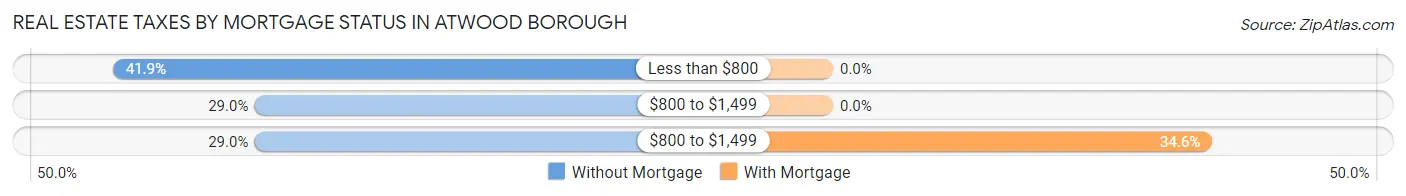
| Property Taxes | Without Mortgage | With Mortgage |
| Less than $800 | 13 (41.9%) | 0 (0.0%) |
| $800 to $1,499 | 9 (29.0%) | 0 (0.0%) |
| $800 to $1,499 | 9 (29.0%) | 9 (34.6%) |
| Total | 31 (100.0%) | 26 (100.0%) |
Health & Disability in Atwood borough
Health Insurance Coverage by Age in Atwood borough
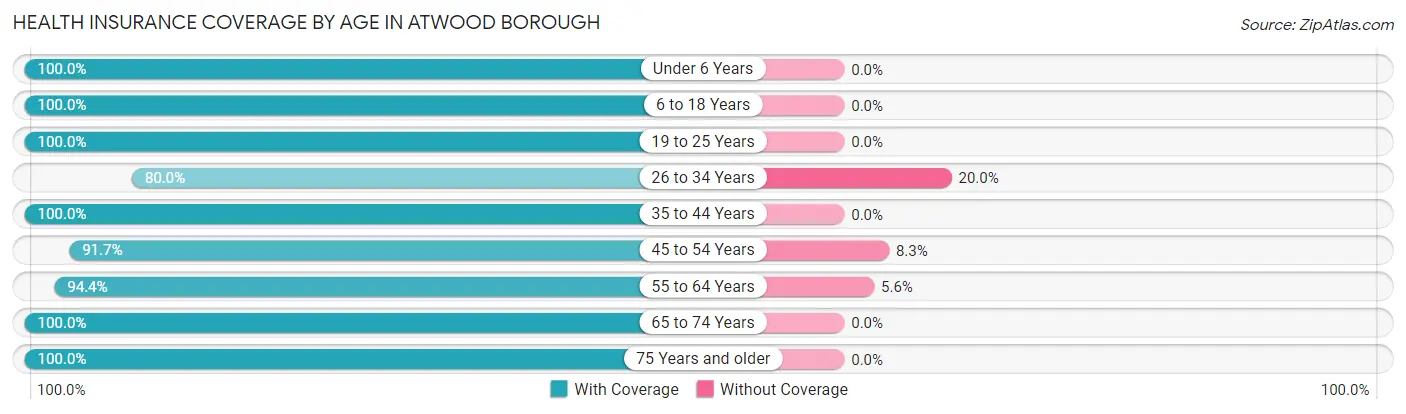
| Age Bracket | With Coverage | Without Coverage |
| Under 6 Years | 5 (100.0%) | 0 (0.0%) |
| 6 to 18 Years | 45 (100.0%) | 0 (0.0%) |
| 19 to 25 Years | 9 (100.0%) | 0 (0.0%) |
| 26 to 34 Years | 8 (80.0%) | 2 (20.0%) |
| 35 to 44 Years | 18 (100.0%) | 0 (0.0%) |
| 45 to 54 Years | 11 (91.7%) | 1 (8.3%) |
| 55 to 64 Years | 34 (94.4%) | 2 (5.6%) |
| 65 to 74 Years | 16 (100.0%) | 0 (0.0%) |
| 75 Years and older | 28 (100.0%) | 0 (0.0%) |
| Total | 174 (97.2%) | 5 (2.8%) |
Health Insurance Coverage by Citizenship Status in Atwood borough
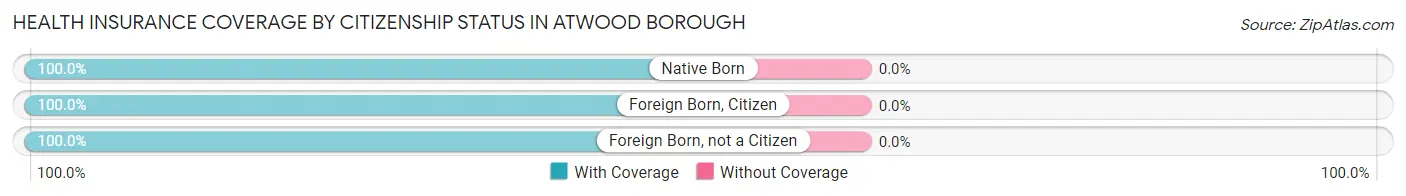
| Citizenship Status | With Coverage | Without Coverage |
| Native Born | 5 (100.0%) | 0 (0.0%) |
| Foreign Born, Citizen | 45 (100.0%) | 0 (0.0%) |
| Foreign Born, not a Citizen | 9 (100.0%) | 0 (0.0%) |
Health Insurance Coverage by Household Income in Atwood borough
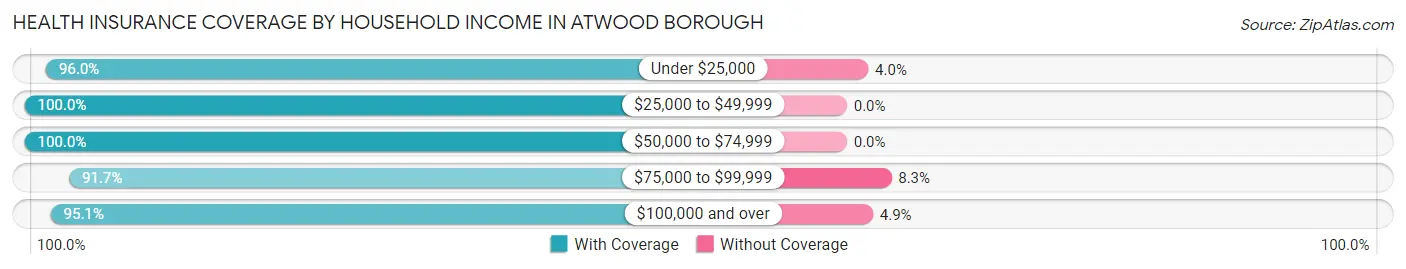
| Household Income | With Coverage | Without Coverage |
| Under $25,000 | 48 (96.0%) | 2 (4.0%) |
| $25,000 to $49,999 | 30 (100.0%) | 0 (0.0%) |
| $50,000 to $74,999 | 46 (100.0%) | 0 (0.0%) |
| $75,000 to $99,999 | 11 (91.7%) | 1 (8.3%) |
| $100,000 and over | 39 (95.1%) | 2 (4.9%) |
Public vs Private Health Insurance Coverage by Age in Atwood borough
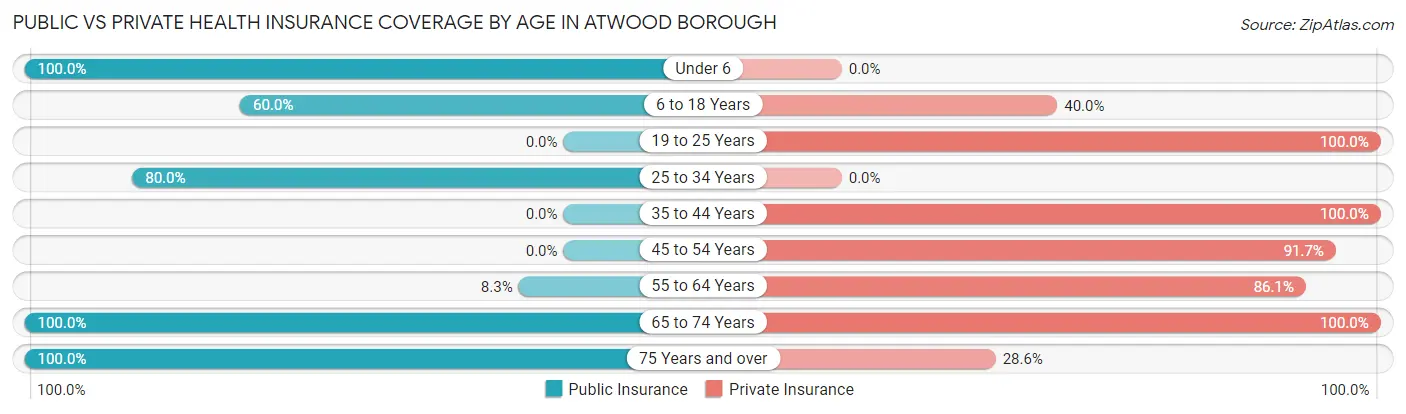
| Age Bracket | Public Insurance | Private Insurance |
| Under 6 | 5 (100.0%) | 0 (0.0%) |
| 6 to 18 Years | 27 (60.0%) | 18 (40.0%) |
| 19 to 25 Years | 0 (0.0%) | 9 (100.0%) |
| 25 to 34 Years | 8 (80.0%) | 0 (0.0%) |
| 35 to 44 Years | 0 (0.0%) | 18 (100.0%) |
| 45 to 54 Years | 0 (0.0%) | 11 (91.7%) |
| 55 to 64 Years | 3 (8.3%) | 31 (86.1%) |
| 65 to 74 Years | 16 (100.0%) | 16 (100.0%) |
| 75 Years and over | 28 (100.0%) | 8 (28.6%) |
| Total | 87 (48.6%) | 111 (62.0%) |
Disability Status by Sex by Age in Atwood borough
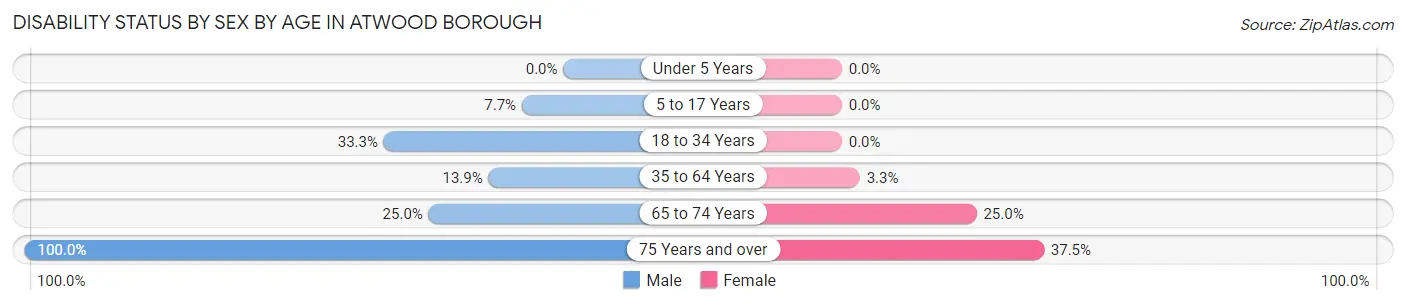
| Age Bracket | Male | Female |
| Under 5 Years | 0 (0.0%) | 0 (0.0%) |
| 5 to 17 Years | 2 (7.7%) | 0 (0.0%) |
| 18 to 34 Years | 1 (33.3%) | 0 (0.0%) |
| 35 to 64 Years | 5 (13.9%) | 1 (3.3%) |
| 65 to 74 Years | 2 (25.0%) | 2 (25.0%) |
| 75 Years and over | 12 (100.0%) | 6 (37.5%) |
Disability Class by Sex by Age in Atwood borough
Disability Class: Hearing Difficulty
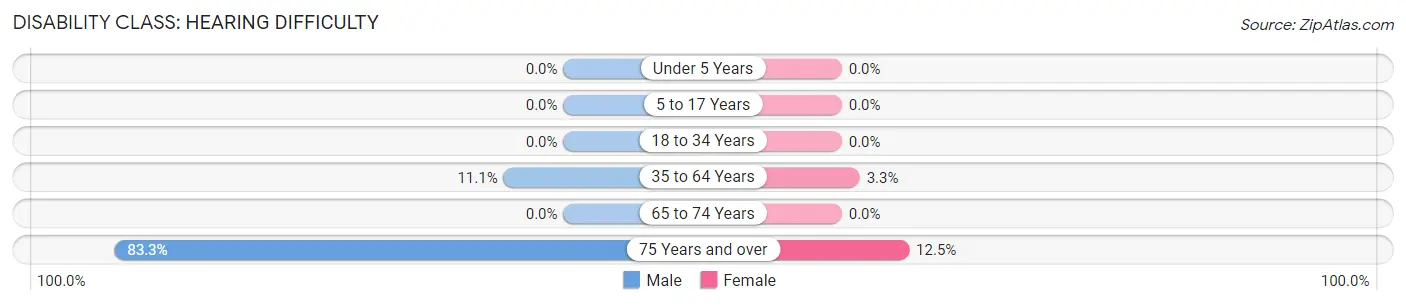
| Age Bracket | Male | Female |
| Under 5 Years | 0 (0.0%) | 0 (0.0%) |
| 5 to 17 Years | 0 (0.0%) | 0 (0.0%) |
| 18 to 34 Years | 0 (0.0%) | 0 (0.0%) |
| 35 to 64 Years | 4 (11.1%) | 1 (3.3%) |
| 65 to 74 Years | 0 (0.0%) | 0 (0.0%) |
| 75 Years and over | 10 (83.3%) | 2 (12.5%) |
Disability Class: Vision Difficulty
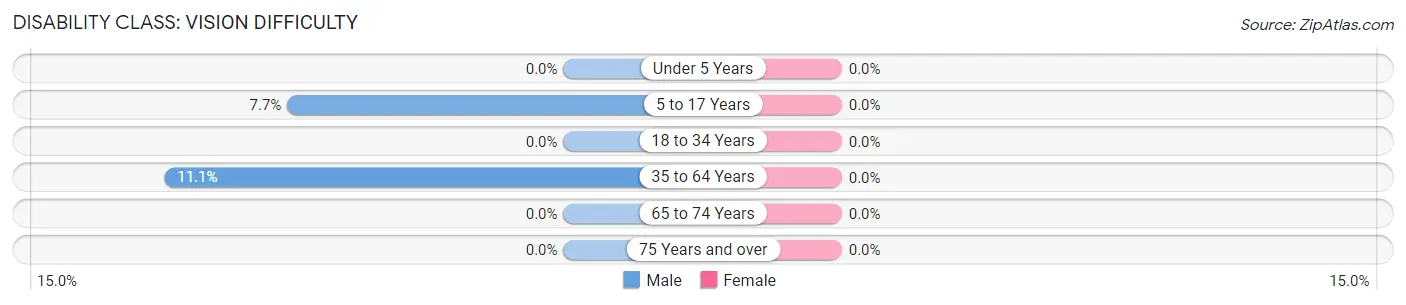
| Age Bracket | Male | Female |
| Under 5 Years | 0 (0.0%) | 0 (0.0%) |
| 5 to 17 Years | 2 (7.7%) | 0 (0.0%) |
| 18 to 34 Years | 0 (0.0%) | 0 (0.0%) |
| 35 to 64 Years | 4 (11.1%) | 0 (0.0%) |
| 65 to 74 Years | 0 (0.0%) | 0 (0.0%) |
| 75 Years and over | 0 (0.0%) | 0 (0.0%) |
Disability Class: Cognitive Difficulty
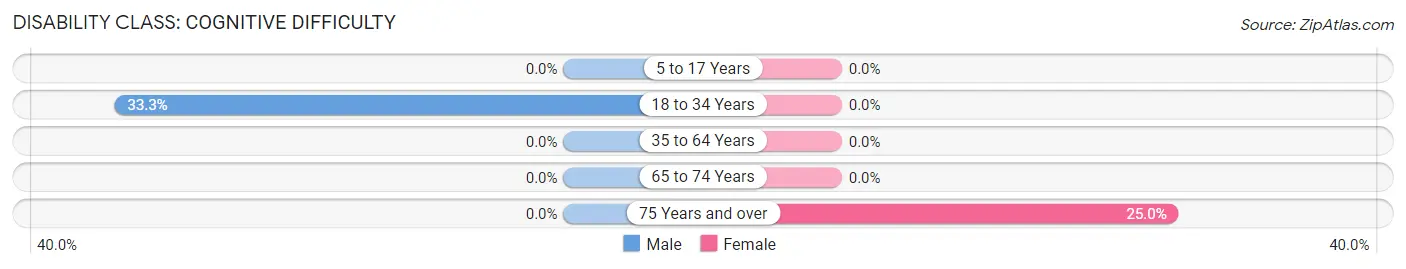
| Age Bracket | Male | Female |
| 5 to 17 Years | 0 (0.0%) | 0 (0.0%) |
| 18 to 34 Years | 1 (33.3%) | 0 (0.0%) |
| 35 to 64 Years | 0 (0.0%) | 0 (0.0%) |
| 65 to 74 Years | 0 (0.0%) | 0 (0.0%) |
| 75 Years and over | 0 (0.0%) | 4 (25.0%) |
Disability Class: Ambulatory Difficulty
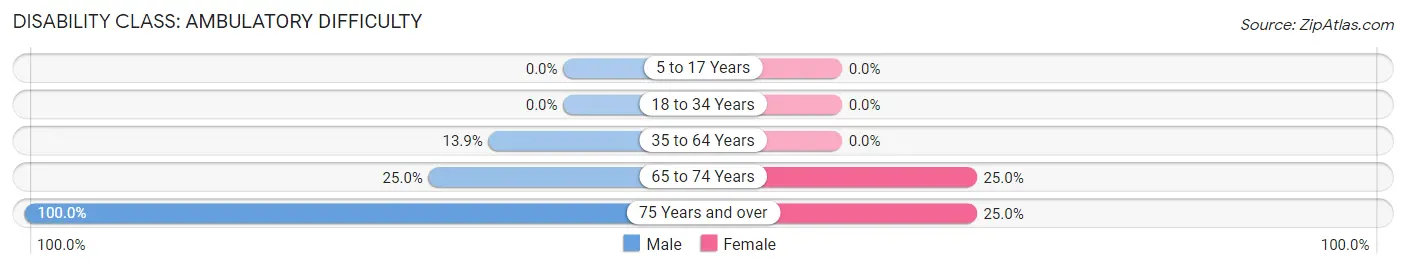
| Age Bracket | Male | Female |
| 5 to 17 Years | 0 (0.0%) | 0 (0.0%) |
| 18 to 34 Years | 0 (0.0%) | 0 (0.0%) |
| 35 to 64 Years | 5 (13.9%) | 0 (0.0%) |
| 65 to 74 Years | 2 (25.0%) | 2 (25.0%) |
| 75 Years and over | 12 (100.0%) | 4 (25.0%) |
Disability Class: Self-Care Difficulty
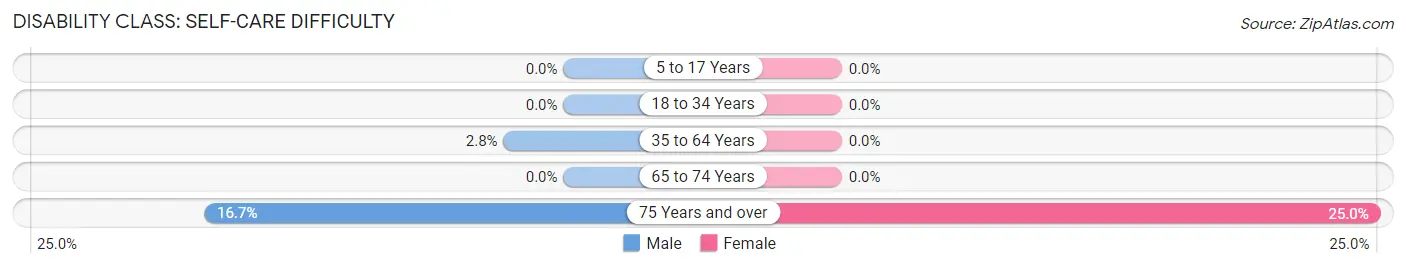
| Age Bracket | Male | Female |
| 5 to 17 Years | 0 (0.0%) | 0 (0.0%) |
| 18 to 34 Years | 0 (0.0%) | 0 (0.0%) |
| 35 to 64 Years | 1 (2.8%) | 0 (0.0%) |
| 65 to 74 Years | 0 (0.0%) | 0 (0.0%) |
| 75 Years and over | 2 (16.7%) | 4 (25.0%) |
Technology Access in Atwood borough
Computing Device Access in Atwood borough
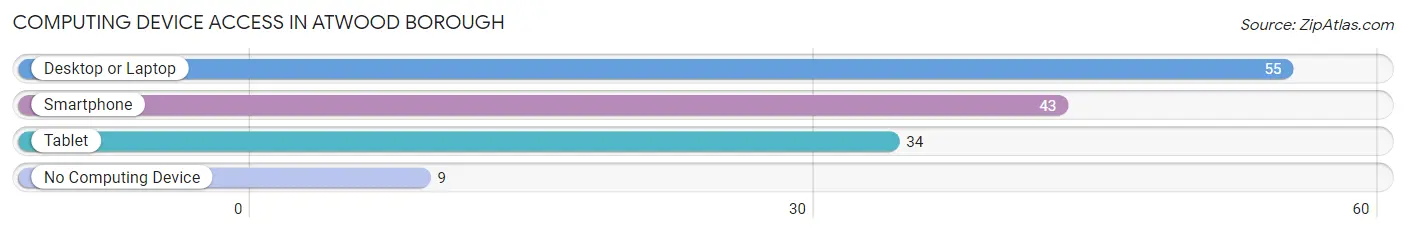
| Device Type | # Households | % Households |
| Desktop or Laptop | 55 | 83.3% |
| Smartphone | 43 | 65.1% |
| Tablet | 34 | 51.5% |
| No Computing Device | 9 | 13.6% |
| Total | 66 | 100.0% |
Internet Access in Atwood borough
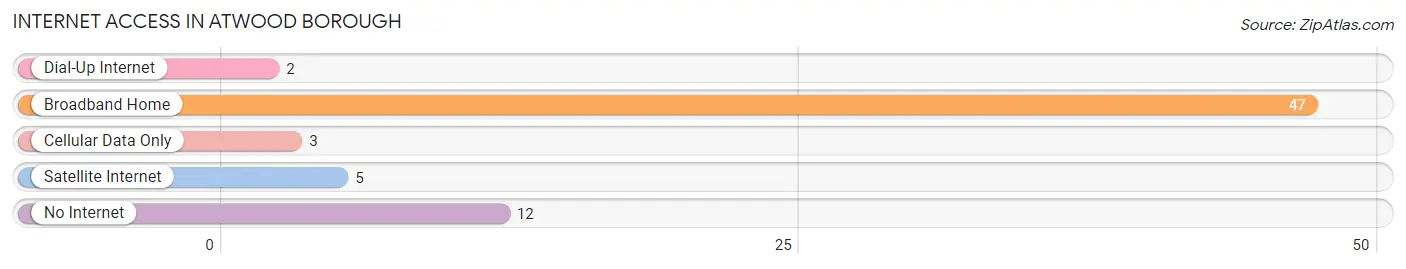
| Internet Type | # Households | % Households |
| Dial-Up Internet | 2 | 3.0% |
| Broadband Home | 47 | 71.2% |
| Cellular Data Only | 3 | 4.5% |
| Satellite Internet | 5 | 7.6% |
| No Internet | 12 | 18.2% |
| Total | 66 | 100.0% |
Atwood borough Summary
Atwood Borough is a small borough located in the state of Pennsylvania. It is situated in the northern part of the state, in the county of Crawford. The borough is located in the foothills of the Allegheny Mountains and is bordered by the boroughs of Cambridge Springs, Centerville, and Saegertown. The population of Atwood Borough was 1,845 as of the 2010 census.
Geography
Atwood Borough is located at 41°37'N 79°51'W (41.6167, -79.85). It has a total area of 0.7 square miles, all of which is land. The borough is situated in the foothills of the Allegheny Mountains and is bordered by the boroughs of Cambridge Springs, Centerville, and Saegertown. The terrain is mostly flat with some rolling hills. The borough is located in the French Creek watershed.
Economy
Atwood Borough has a small but diverse economy. The main industries in the borough are manufacturing, retail, and services. The largest employers in the borough are the Atwood Manufacturing Company, which produces industrial machinery, and the Atwood Retail Center, which is a shopping center. Other businesses in the borough include a variety of restaurants, a grocery store, a hardware store, and a few small businesses.
Demographics
As of the 2010 census, the population of Atwood Borough was 1,845. The racial makeup of the borough was 97.3% White, 0.7% African American, 0.2% Native American, 0.3% Asian, 0.2% from other races, and 1.5% from two or more races. Hispanic or Latino of any race were 0.7% of the population.
The median income for a household in the borough was $37,917, and the median income for a family was $45,000. The per capita income for the borough was $18,945. About 11.2% of families and 13.2% of the population were below the poverty line, including 17.2% of those under age 18 and 8.2% of those age 65 or over.
Education
Atwood Borough is served by the Crawford Central School District. The district operates two elementary schools, one middle school, and one high school. The district also operates a vocational-technical school.
Conclusion
Atwood Borough is a small borough located in the state of Pennsylvania. It is situated in the northern part of the state, in the county of Crawford. The borough is located in the foothills of the Allegheny Mountains and is bordered by the boroughs of Cambridge Springs, Centerville, and Saegertown. The population of Atwood Borough was 1,845 as of the 2010 census. The borough has a small but diverse economy, with the main industries being manufacturing, retail, and services. The median income for a household in the borough was $37,917, and the median income for a family was $45,000. The borough is served by the Crawford Central School District, which operates two elementary schools, one middle school, and one high school.
Common Questions
What is Per Capita Income in Atwood borough?
Per Capita income in Atwood borough is $25,901.
What is the Median Family Income in Atwood borough?
Median Family Income in Atwood borough is $65,357.
What is the Median Household income in Atwood borough?
Median Household Income in Atwood borough is $44,444.
What is Income or Wage Gap in Atwood borough?
Income or Wage Gap in Atwood borough is 51.7%.
Women in Atwood borough earn 48.3 cents for every dollar earned by a man.
What is Inequality or Gini Index in Atwood borough?
Inequality or Gini Index in Atwood borough is 0.45.
What is the Total Population of Atwood borough?
Total Population of Atwood borough is 179.
What is the Total Male Population of Atwood borough?
Total Male Population of Atwood borough is 90.
What is the Total Female Population of Atwood borough?
Total Female Population of Atwood borough is 89.
What is the Ratio of Males per 100 Females in Atwood borough?
There are 101.12 Males per 100 Females in Atwood borough.
What is the Ratio of Females per 100 Males in Atwood borough?
There are 98.89 Females per 100 Males in Atwood borough.
What is the Median Population Age in Atwood borough?
Median Population Age in Atwood borough is 48.5 Years.
What is the Average Family Size in Atwood borough
Average Family Size in Atwood borough is 3.3 People.
What is the Average Household Size in Atwood borough
Average Household Size in Atwood borough is 2.7 People.
How Large is the Labor Force in Atwood borough?
There are 78 People in the Labor Forcein in Atwood borough.
What is the Percentage of People in the Labor Force in Atwood borough?
56.1% of People are in the Labor Force in Atwood borough.
What is the Unemployment Rate in Atwood borough?
Unemployment Rate in Atwood borough is 7.7%.