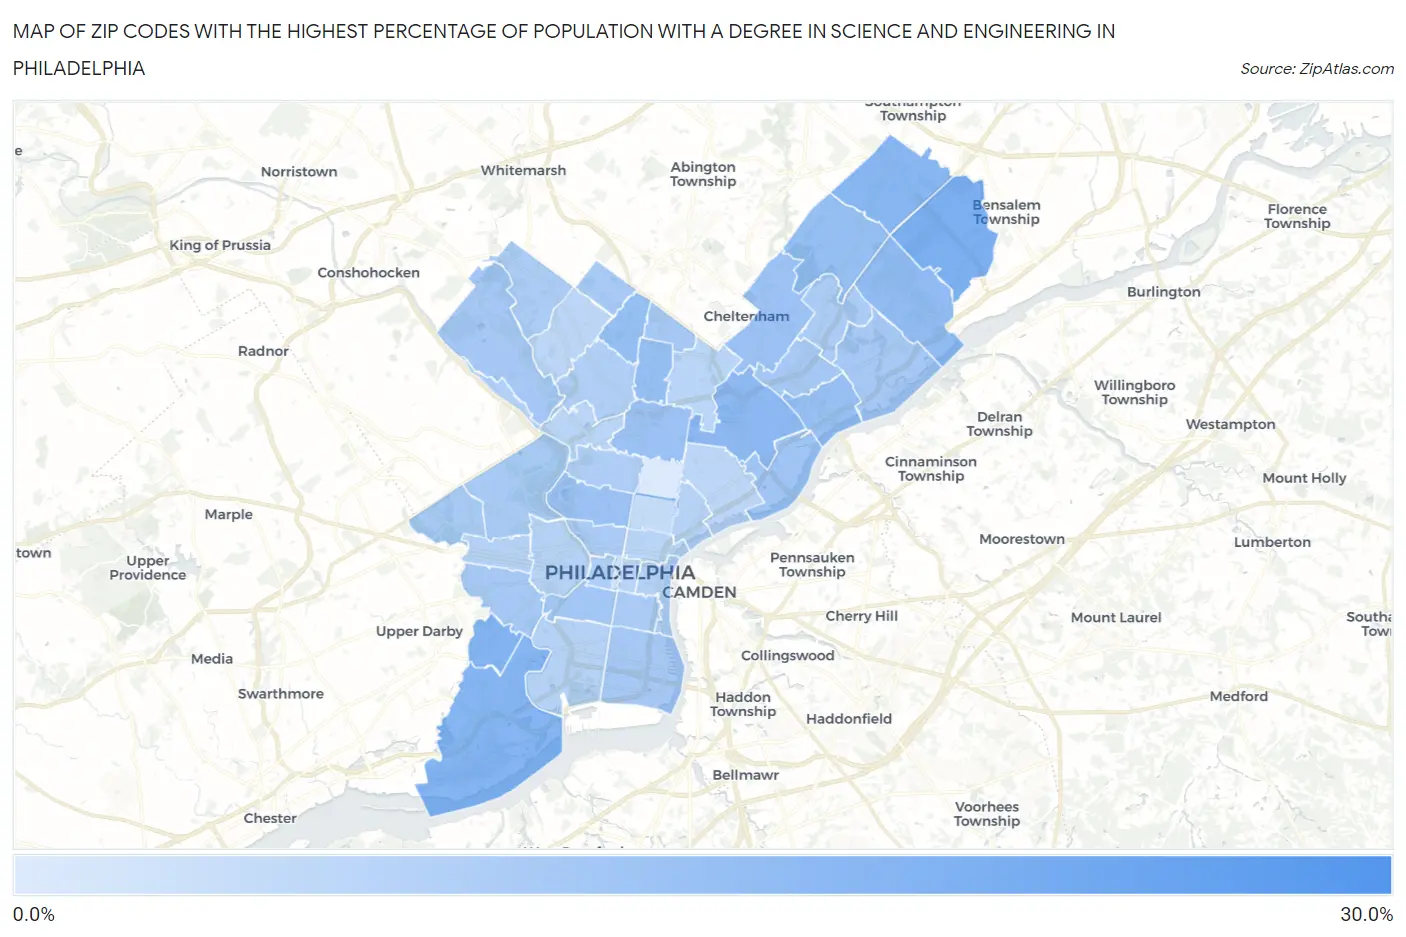
Zip Codes with the Highest Percentage of Population with a Degree in Science and Engineering in Philadelphia, PA
RELATED REPORTS & OPTIONS
Science and Engineering
Philadelphia
Compare Zip Codes
Map of Zip Codes with the Highest Percentage of Population with a Degree in Science and Engineering in Philadelphia
0.55%
29.0%

Zip Codes with the Highest Percentage of Population with a Degree in Science and Engineering in Philadelphia, PA
| Zip Code | % Graduates | vs State | vs National | |
| 1. | 19108 | 29.0% | 10.9%(+18.1)#96 | 9.8%(+19.2)#1,414 |
| 2. | 19154 | 18.2% | 10.9%(+7.34)#303 | 9.8%(+8.42)#4,187 |
| 3. | 19142 | 17.0% | 10.9%(+6.10)#365 | 9.8%(+7.18)#4,983 |
| 4. | 19153 | 16.2% | 10.9%(+5.37)#400 | 9.8%(+6.45)#5,551 |
| 5. | 19116 | 16.0% | 10.9%(+5.14)#413 | 9.8%(+6.22)#5,742 |
| 6. | 19124 | 14.8% | 10.9%(+3.95)#489 | 9.8%(+5.03)#6,901 |
| 7. | 19114 | 14.3% | 10.9%(+3.39)#539 | 9.8%(+4.47)#7,559 |
| 8. | 19141 | 13.4% | 10.9%(+2.55)#613 | 9.8%(+3.63)#8,618 |
| 9. | 19138 | 13.4% | 10.9%(+2.50)#616 | 9.8%(+3.58)#8,688 |
| 10. | 19115 | 13.4% | 10.9%(+2.49)#617 | 9.8%(+3.57)#8,693 |
| 11. | 19135 | 12.9% | 10.9%(+2.08)#653 | 9.8%(+3.16)#9,329 |
| 12. | 19111 | 12.4% | 10.9%(+1.51)#701 | 9.8%(+2.59)#10,240 |
| 13. | 19121 | 12.1% | 10.9%(+1.29)#722 | 9.8%(+2.37)#10,637 |
| 14. | 19140 | 12.0% | 10.9%(+1.13)#737 | 9.8%(+2.21)#10,921 |
| 15. | 19137 | 11.1% | 10.9%(+0.283)#825 | 9.8%(+1.36)#12,533 |
| 16. | 19146 | 10.6% | 10.9%(-0.216)#889 | 9.8%(+0.864)#13,644 |
| 17. | 19149 | 10.4% | 10.9%(-0.446)#920 | 9.8%(+0.633)#14,167 |
| 18. | 19136 | 10.4% | 10.9%(-0.447)#921 | 9.8%(+0.633)#14,168 |
| 19. | 19148 | 10.3% | 10.9%(-0.558)#936 | 9.8%(+0.522)#14,380 |
| 20. | 19143 | 10.3% | 10.9%(-0.591)#939 | 9.8%(+0.489)#14,449 |
| 21. | 19126 | 10.1% | 10.9%(-0.742)#960 | 9.8%(+0.338)#14,770 |
| 22. | 19128 | 10.0% | 10.9%(-0.831)#969 | 9.8%(+0.249)#14,957 |
| 23. | 19131 | 10.0% | 10.9%(-0.857)#972 | 9.8%(+0.223)#14,989 |
| 24. | 19151 | 10.0% | 10.9%(-0.872)#974 | 9.8%(+0.207)#15,056 |
| 25. | 19150 | 9.9% | 10.9%(-0.987)#989 | 9.8%(+0.093)#15,318 |
| 26. | 19147 | 9.3% | 10.9%(-1.51)#1,053 | 9.8%(-0.435)#16,519 |
| 27. | 19130 | 9.3% | 10.9%(-1.59)#1,062 | 9.8%(-0.509)#16,707 |
| 28. | 19118 | 8.9% | 10.9%(-1.96)#1,094 | 9.8%(-0.878)#17,548 |
| 29. | 19152 | 8.9% | 10.9%(-1.99)#1,102 | 9.8%(-0.910)#17,618 |
| 30. | 19132 | 8.8% | 10.9%(-2.10)#1,116 | 9.8%(-1.02)#17,886 |
| 31. | 19103 | 8.1% | 10.9%(-2.73)#1,177 | 9.8%(-1.65)#19,350 |
| 32. | 19144 | 8.0% | 10.9%(-2.87)#1,196 | 9.8%(-1.79)#19,652 |
| 33. | 19127 | 7.8% | 10.9%(-3.08)#1,216 | 9.8%(-2.00)#20,118 |
| 34. | 19145 | 7.3% | 10.9%(-3.52)#1,256 | 9.8%(-2.44)#21,046 |
| 35. | 19125 | 7.2% | 10.9%(-3.64)#1,264 | 9.8%(-2.56)#21,300 |
| 36. | 19106 | 7.2% | 10.9%(-3.66)#1,265 | 9.8%(-2.58)#21,327 |
| 37. | 19139 | 7.2% | 10.9%(-3.71)#1,274 | 9.8%(-2.63)#21,422 |
| 38. | 19104 | 7.1% | 10.9%(-3.74)#1,282 | 9.8%(-2.66)#21,494 |
| 39. | 19129 | 6.6% | 10.9%(-4.29)#1,317 | 9.8%(-3.21)#22,465 |
| 40. | 19120 | 6.6% | 10.9%(-4.30)#1,318 | 9.8%(-3.22)#22,482 |
| 41. | 19123 | 6.4% | 10.9%(-4.43)#1,326 | 9.8%(-3.35)#22,714 |
| 42. | 19107 | 6.3% | 10.9%(-4.53)#1,333 | 9.8%(-3.45)#22,874 |
| 43. | 19119 | 6.0% | 10.9%(-4.85)#1,344 | 9.8%(-3.77)#23,428 |
| 44. | 19134 | 5.9% | 10.9%(-4.96)#1,348 | 9.8%(-3.88)#23,594 |
| 45. | 19122 | 4.6% | 10.9%(-6.26)#1,401 | 9.8%(-5.18)#25,188 |
| 46. | 19102 | 2.6% | 10.9%(-8.26)#1,436 | 9.8%(-7.18)#26,697 |
| 47. | 19133 | 0.55% | 10.9%(-10.3)#1,452 | 9.8%(-9.23)#27,430 |
1
Common Questions
What are the Top 10 Zip Codes with the Highest Percentage of Population with a Degree in Science and Engineering in Philadelphia, PA?
Top 10 Zip Codes with the Highest Percentage of Population with a Degree in Science and Engineering in Philadelphia, PA are:
What zip code has the Highest Percentage of Population with a Degree in Science and Engineering in Philadelphia, PA?
19108 has the Highest Percentage of Population with a Degree in Science and Engineering in Philadelphia, PA with 29.0%.
What is the Percentage of Population with a Degree in Science and Engineering in Philadelphia, PA?
Percentage of Population with a Degree in Science and Engineering in Philadelphia is 9.5%.
What is the Percentage of Population with a Degree in Science and Engineering in Pennsylvania?
Percentage of Population with a Degree in Science and Engineering in Pennsylvania is 10.9%.
What is the Percentage of Population with a Degree in Science and Engineering in the United States?
Percentage of Population with a Degree in Science and Engineering in the United States is 9.8%.