Zip Codes with the Highest Percentage of Population with a Degree in Science and Engineering in Easton, PA
RELATED REPORTS & OPTIONS
Science and Engineering
Easton
Compare Zip Codes
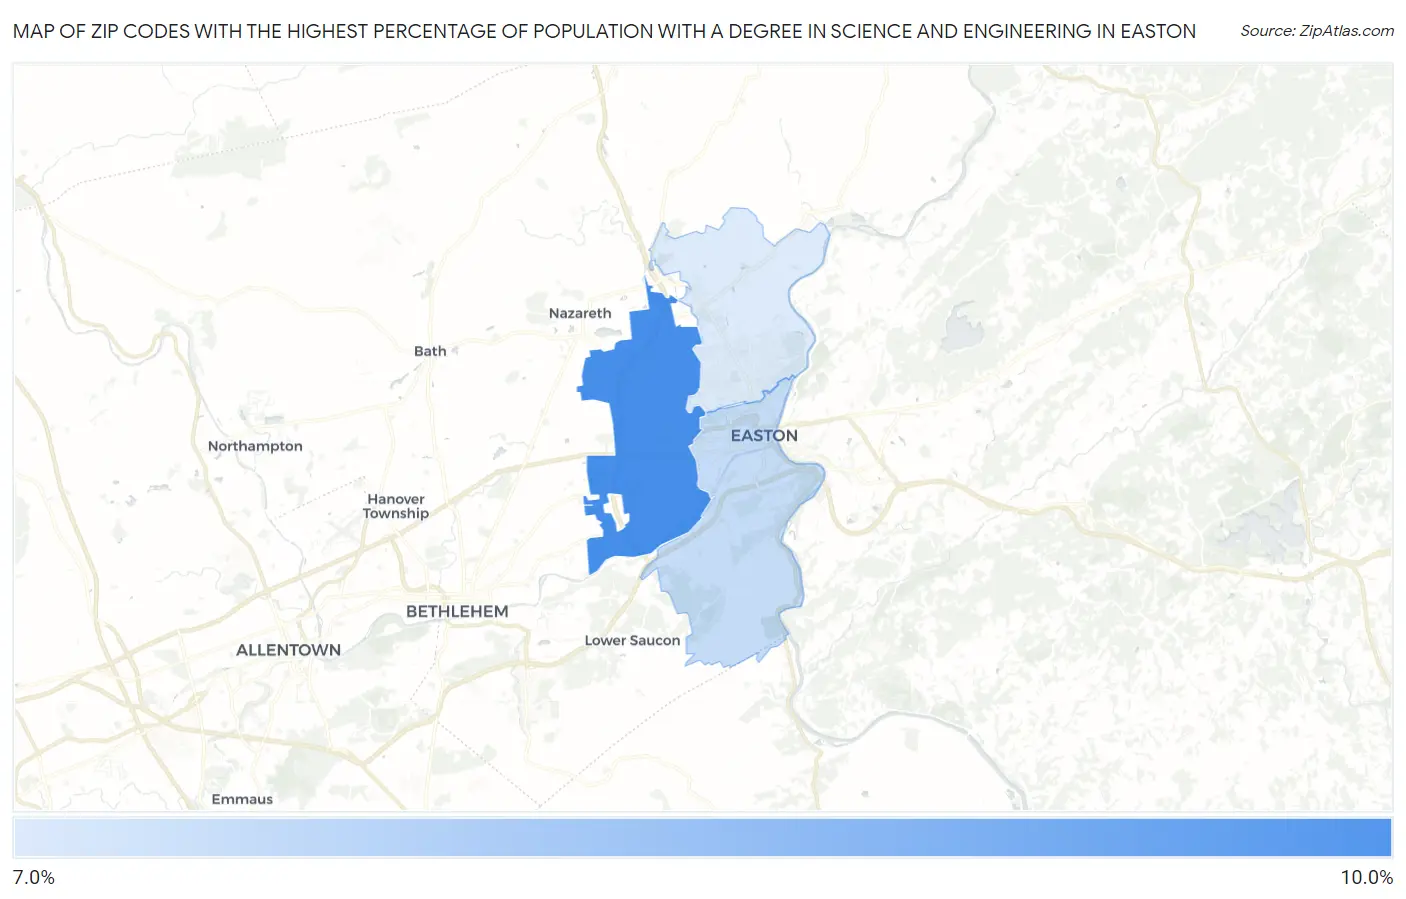
Map of Zip Codes with the Highest Percentage of Population with a Degree in Science and Engineering in Easton
7.1%
9.0%
Zip Codes with the Highest Percentage of Population with a Degree in Science and Engineering in Easton, PA
| Zip Code | % Graduates | vs State | vs National | |
| 1. | 18045 | 9.0% | 10.9%(-1.86)#1,085 | 9.8%(-0.778)#17,344 |
| 2. | 18042 | 7.4% | 10.9%(-3.50)#1,254 | 9.8%(-2.42)#21,015 |
| 3. | 18040 | 7.1% | 10.9%(-3.81)#1,287 | 9.8%(-2.73)#21,618 |
1
Common Questions
What are the Top Zip Codes with the Highest Percentage of Population with a Degree in Science and Engineering in Easton, PA?
Top Zip Codes with the Highest Percentage of Population with a Degree in Science and Engineering in Easton, PA are:
What zip code has the Highest Percentage of Population with a Degree in Science and Engineering in Easton, PA?
18045 has the Highest Percentage of Population with a Degree in Science and Engineering in Easton, PA with 9.0%.
What is the Percentage of Population with a Degree in Science and Engineering in Easton, PA?
Percentage of Population with a Degree in Science and Engineering in Easton is 9.2%.
What is the Percentage of Population with a Degree in Science and Engineering in Pennsylvania?
Percentage of Population with a Degree in Science and Engineering in Pennsylvania is 10.9%.
What is the Percentage of Population with a Degree in Science and Engineering in the United States?
Percentage of Population with a Degree in Science and Engineering in the United States is 9.8%.