Weigelstown, PA Map & Demographics
Weigelstown Map
Weigelstown Overview
$37,548
PER CAPITA INCOME
$85,641
AVG FAMILY INCOME
$65,022
AVG HOUSEHOLD INCOME
32.3%
WAGE / INCOME GAP [ % ]
67.7¢/ $1
WAGE / INCOME GAP [ $ ]
0.44
INEQUALITY / GINI INDEX
14,960
TOTAL POPULATION
6,632
MALE POPULATION
8,328
FEMALE POPULATION
79.63
MALES / 100 FEMALES
125.57
FEMALES / 100 MALES
43.2
MEDIAN AGE
3.0
AVG FAMILY SIZE
2.3
AVG HOUSEHOLD SIZE
7,634
LABOR FORCE [ PEOPLE ]
64.4%
PERCENT IN LABOR FORCE
1.5%
UNEMPLOYMENT RATE
Income in Weigelstown
Income Overview in Weigelstown
Per Capita Income in Weigelstown is $37,548, while median incomes of families and households are $85,641 and $65,022 respectively.
| Characteristic | Number | Measure |
| Per Capita Income | 14,960 | $37,548 |
| Median Family Income | 3,945 | $85,641 |
| Mean Family Income | 3,945 | $99,554 |
| Median Household Income | 6,376 | $65,022 |
| Mean Household Income | 6,376 | $87,475 |
| Income Deficit | 3,945 | $0 |
| Wage / Income Gap (%) | 14,960 | 32.34% |
| Wage / Income Gap ($) | 14,960 | 67.66¢ per $1 |
| Gini / Inequality Index | 14,960 | 0.44 |
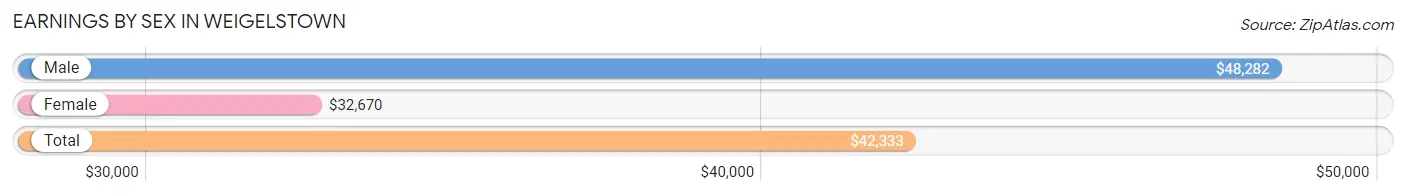
Earnings by Sex in Weigelstown
Average Earnings in Weigelstown are $42,333, $48,282 for men and $32,670 for women, a difference of 32.3%.
| Sex | Number | Average Earnings |
| Male | 3,979 (50.9%) | $48,282 |
| Female | 3,837 (49.1%) | $32,670 |
| Total | 7,816 (100.0%) | $42,333 |
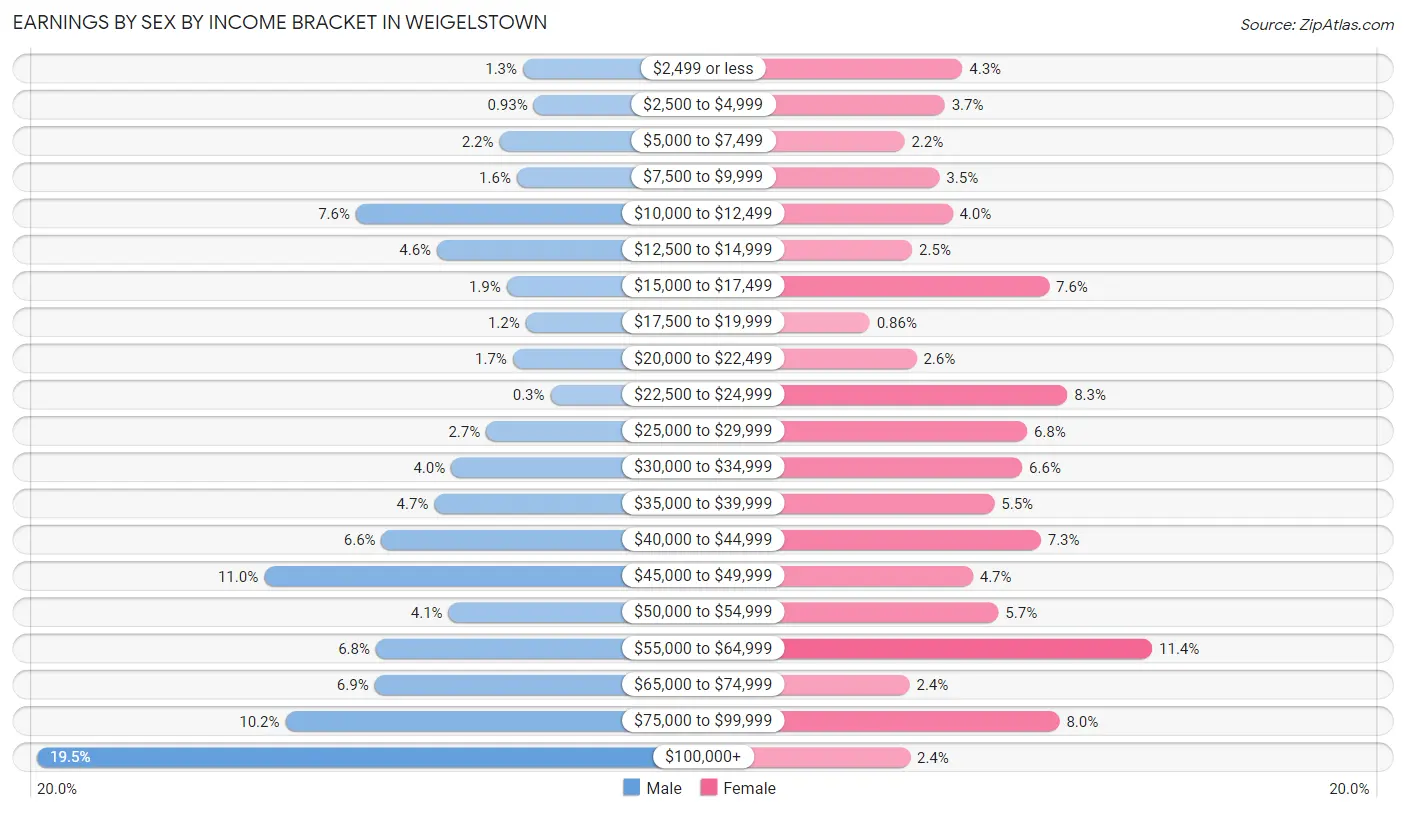
Earnings by Sex by Income Bracket in Weigelstown
The most common earnings brackets in Weigelstown are $100,000+ for men (777 | 19.5%) and $55,000 to $64,999 for women (439 | 11.4%).
| Income | Male | Female |
| $2,499 or less | 53 (1.3%) | 166 (4.3%) |
| $2,500 to $4,999 | 37 (0.9%) | 141 (3.7%) |
| $5,000 to $7,499 | 88 (2.2%) | 83 (2.2%) |
| $7,500 to $9,999 | 62 (1.6%) | 133 (3.5%) |
| $10,000 to $12,499 | 302 (7.6%) | 152 (4.0%) |
| $12,500 to $14,999 | 181 (4.5%) | 94 (2.5%) |
| $15,000 to $17,499 | 77 (1.9%) | 291 (7.6%) |
| $17,500 to $19,999 | 49 (1.2%) | 33 (0.9%) |
| $20,000 to $22,499 | 68 (1.7%) | 100 (2.6%) |
| $22,500 to $24,999 | 12 (0.3%) | 317 (8.3%) |
| $25,000 to $29,999 | 108 (2.7%) | 259 (6.8%) |
| $30,000 to $34,999 | 160 (4.0%) | 252 (6.6%) |
| $35,000 to $39,999 | 185 (4.6%) | 212 (5.5%) |
| $40,000 to $44,999 | 264 (6.6%) | 279 (7.3%) |
| $45,000 to $49,999 | 439 (11.0%) | 181 (4.7%) |
| $50,000 to $54,999 | 164 (4.1%) | 218 (5.7%) |
| $55,000 to $64,999 | 272 (6.8%) | 439 (11.4%) |
| $65,000 to $74,999 | 274 (6.9%) | 90 (2.4%) |
| $75,000 to $99,999 | 407 (10.2%) | 306 (8.0%) |
| $100,000+ | 777 (19.5%) | 91 (2.4%) |
| Total | 3,979 (100.0%) | 3,837 (100.0%) |
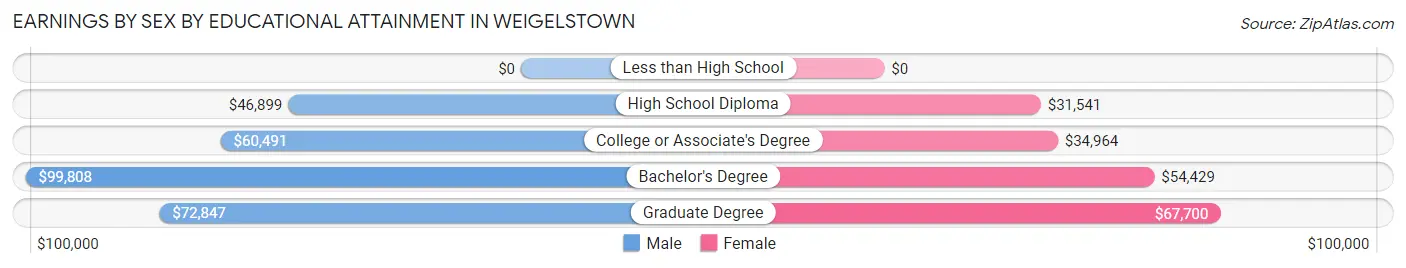
Earnings by Sex by Educational Attainment in Weigelstown
Average earnings in Weigelstown are $51,906 for men and $36,049 for women, a difference of 30.5%. Men with an educational attainment of bachelor's degree enjoy the highest average annual earnings of $99,808, while those with high school diploma education earn the least with $46,899. Women with an educational attainment of graduate degree earn the most with the average annual earnings of $67,700, while those with high school diploma education have the smallest earnings of $31,541.
| Educational Attainment | Male Income | Female Income |
| Less than High School | - | - |
| High School Diploma | $46,899 | $31,541 |
| College or Associate's Degree | $60,491 | $34,964 |
| Bachelor's Degree | $99,808 | $54,429 |
| Graduate Degree | $72,847 | $67,700 |
| Total | $51,906 | $36,049 |
Family Income in Weigelstown
Family Income Brackets in Weigelstown
According to the Weigelstown family income data, there are 876 families falling into the $100,000 to $149,999 income range, which is the most common income bracket and makes up 22.2% of all families. Conversely, the less than $10,000 income bracket is the least frequent group with only 28 families (0.7%) belonging to this category.
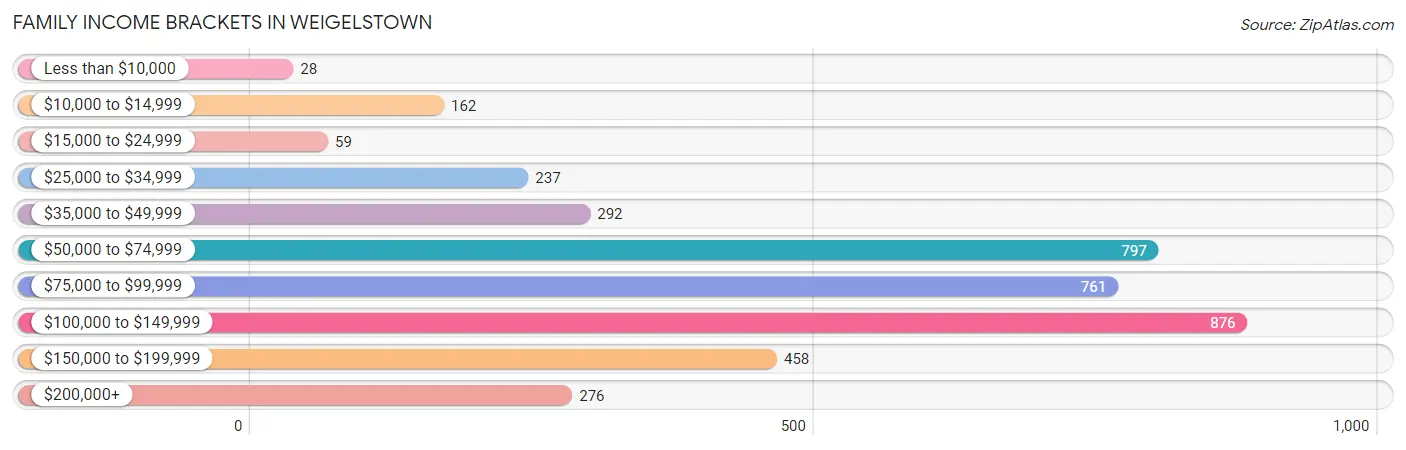
| Income Bracket | # Families | % Families |
| Less than $10,000 | 28 | 0.7% |
| $10,000 to $14,999 | 162 | 4.1% |
| $15,000 to $24,999 | 59 | 1.5% |
| $25,000 to $34,999 | 237 | 6.0% |
| $35,000 to $49,999 | 292 | 7.4% |
| $50,000 to $74,999 | 797 | 20.2% |
| $75,000 to $99,999 | 761 | 19.3% |
| $100,000 to $149,999 | 876 | 22.2% |
| $150,000 to $199,999 | 458 | 11.6% |
| $200,000+ | 276 | 7.0% |
Family Income by Famaliy Size in Weigelstown
5-person families (333 | 8.4%) account for the highest median family income in Weigelstown with $160,236 per family, while 2-person families (1,861 | 47.2%) have the highest median income of $40,356 per family member.
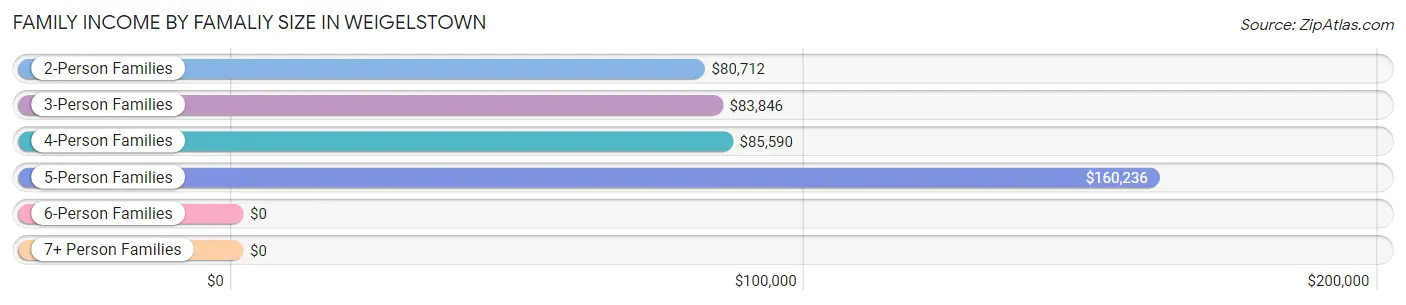
| Income Bracket | # Families | Median Income |
| 2-Person Families | 1,861 (47.2%) | $80,712 |
| 3-Person Families | 834 (21.1%) | $83,846 |
| 4-Person Families | 755 (19.1%) | $85,590 |
| 5-Person Families | 333 (8.4%) | $160,236 |
| 6-Person Families | 125 (3.2%) | $0 |
| 7+ Person Families | 37 (0.9%) | $0 |
| Total | 3,945 (100.0%) | $85,641 |
Family Income by Number of Earners in Weigelstown
The median family income in Weigelstown is $85,641, with families comprising 3+ earners (432) having the highest median family income of $142,778, while families with 1 earner (809) have the lowest median family income of $52,620, accounting for 11.0% and 20.5% of families, respectively.
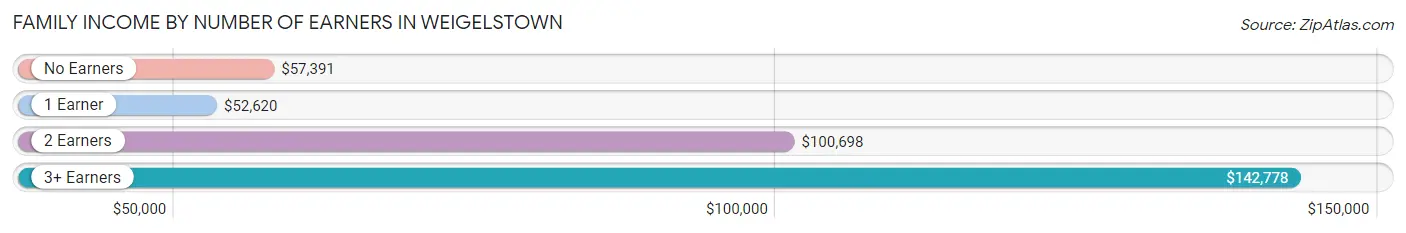
| Number of Earners | # Families | Median Income |
| No Earners | 730 (18.5%) | $57,391 |
| 1 Earner | 809 (20.5%) | $52,620 |
| 2 Earners | 1,974 (50.0%) | $100,698 |
| 3+ Earners | 432 (11.0%) | $142,778 |
| Total | 3,945 (100.0%) | $85,641 |
Household Income in Weigelstown
Household Income Brackets in Weigelstown
With 1,237 households falling in the category, the $50,000 to $74,999 income range is the most frequent in Weigelstown, accounting for 19.4% of all households. In contrast, only 223 households (3.5%) fall into the less than $10,000 income bracket, making it the least populous group.
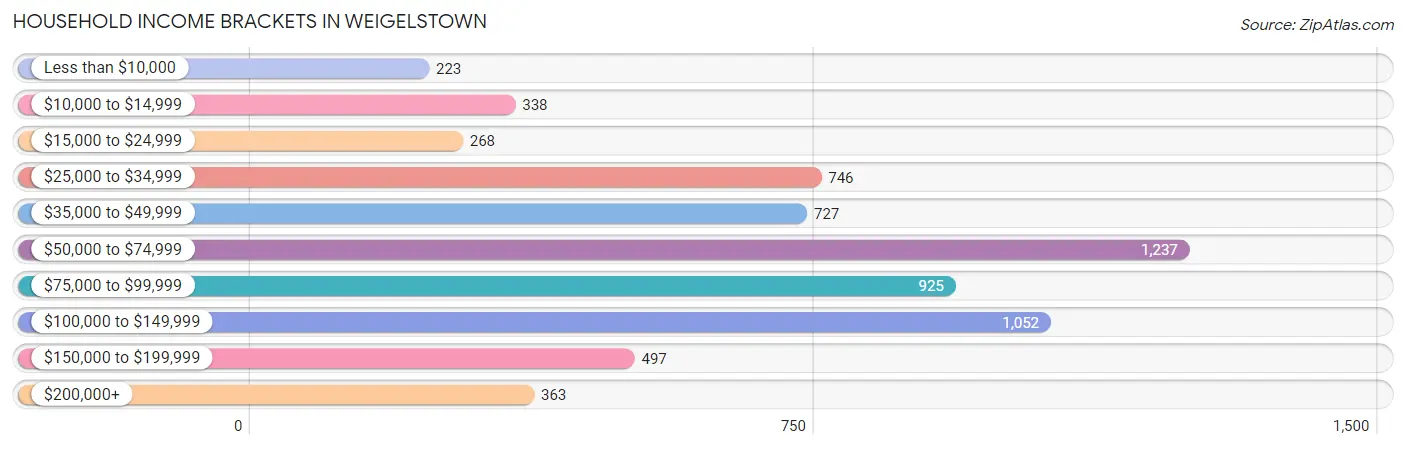
| Income Bracket | # Households | % Households |
| Less than $10,000 | 223 | 3.5% |
| $10,000 to $14,999 | 338 | 5.3% |
| $15,000 to $24,999 | 268 | 4.2% |
| $25,000 to $34,999 | 746 | 11.7% |
| $35,000 to $49,999 | 727 | 11.4% |
| $50,000 to $74,999 | 1,237 | 19.4% |
| $75,000 to $99,999 | 925 | 14.5% |
| $100,000 to $149,999 | 1,052 | 16.5% |
| $150,000 to $199,999 | 497 | 7.8% |
| $200,000+ | 363 | 5.7% |
Household Income by Householder Age in Weigelstown
The median household income in Weigelstown is $65,022, with the highest median household income of $92,184 found in the 25 to 44 years age bracket for the primary householder. A total of 1,616 households (25.4%) fall into this category. Meanwhile, the 15 to 24 years age bracket for the primary householder has the lowest median household income of $28,693, with 82 households (1.3%) in this group.
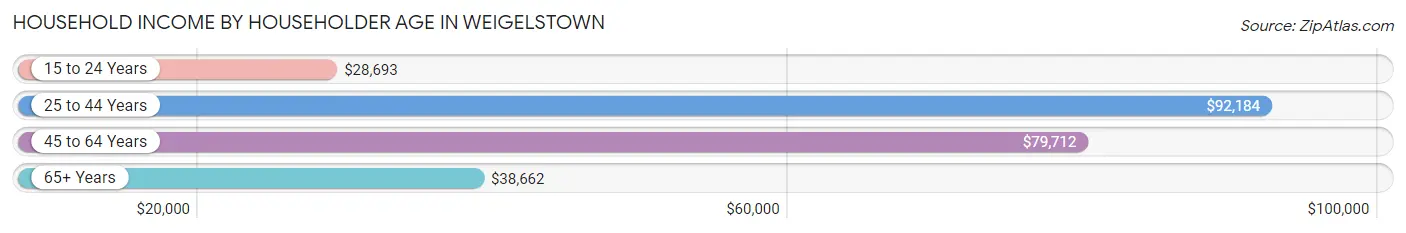
| Income Bracket | # Households | Median Income |
| 15 to 24 Years | 82 (1.3%) | $28,693 |
| 25 to 44 Years | 1,616 (25.4%) | $92,184 |
| 45 to 64 Years | 2,319 (36.4%) | $79,712 |
| 65+ Years | 2,359 (37.0%) | $38,662 |
| Total | 6,376 (100.0%) | $65,022 |
Poverty in Weigelstown
Income Below Poverty by Sex and Age in Weigelstown
With 7.4% poverty level for males and 9.2% for females among the residents of Weigelstown, under 5 year old males and under 5 year old females are the most vulnerable to poverty, with 109 males (18.0%) and 114 females (27.2%) in their respective age groups living below the poverty level.
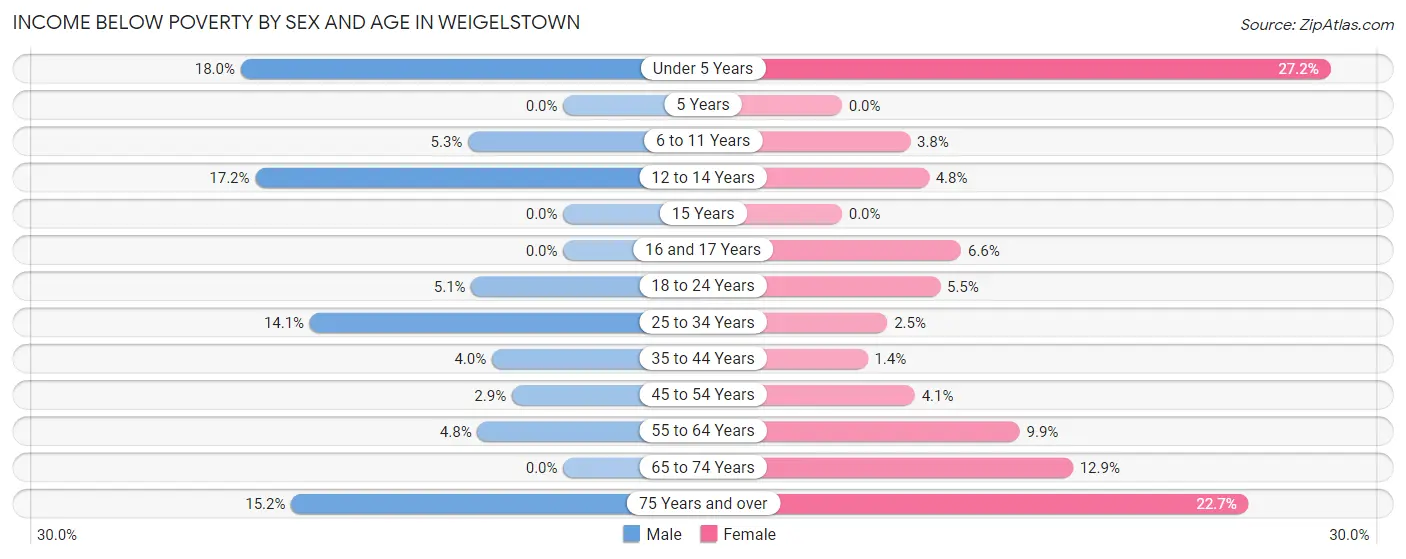
| Age Bracket | Male | Female |
| Under 5 Years | 109 (18.0%) | 114 (27.2%) |
| 5 Years | 0 (0.0%) | 0 (0.0%) |
| 6 to 11 Years | 22 (5.3%) | 20 (3.8%) |
| 12 to 14 Years | 59 (17.2%) | 21 (4.8%) |
| 15 Years | 0 (0.0%) | 0 (0.0%) |
| 16 and 17 Years | 0 (0.0%) | 18 (6.6%) |
| 18 to 24 Years | 20 (5.1%) | 31 (5.5%) |
| 25 to 34 Years | 116 (14.1%) | 21 (2.5%) |
| 35 to 44 Years | 38 (4.0%) | 10 (1.4%) |
| 45 to 54 Years | 22 (2.9%) | 35 (4.1%) |
| 55 to 64 Years | 47 (4.8%) | 110 (9.9%) |
| 65 to 74 Years | 0 (0.0%) | 185 (12.9%) |
| 75 Years and over | 55 (15.1%) | 200 (22.7%) |
| Total | 488 (7.4%) | 765 (9.2%) |
Income Above Poverty by Sex and Age in Weigelstown
According to the poverty statistics in Weigelstown, males aged 5 years and females aged 5 years are the age groups that are most secure financially, with 100.0% of males and 100.0% of females in these age groups living above the poverty line.
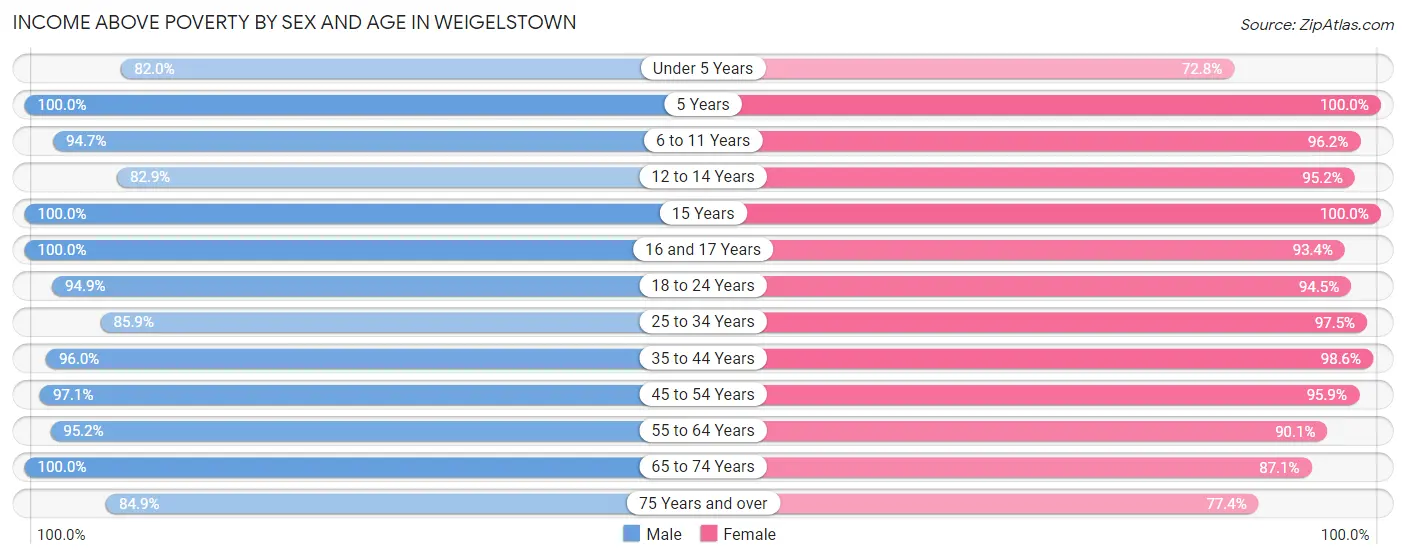
| Age Bracket | Male | Female |
| Under 5 Years | 498 (82.0%) | 305 (72.8%) |
| 5 Years | 58 (100.0%) | 86 (100.0%) |
| 6 to 11 Years | 393 (94.7%) | 506 (96.2%) |
| 12 to 14 Years | 285 (82.9%) | 413 (95.2%) |
| 15 Years | 36 (100.0%) | 181 (100.0%) |
| 16 and 17 Years | 90 (100.0%) | 253 (93.4%) |
| 18 to 24 Years | 371 (94.9%) | 536 (94.5%) |
| 25 to 34 Years | 706 (85.9%) | 810 (97.5%) |
| 35 to 44 Years | 920 (96.0%) | 689 (98.6%) |
| 45 to 54 Years | 747 (97.1%) | 827 (95.9%) |
| 55 to 64 Years | 936 (95.2%) | 1,001 (90.1%) |
| 65 to 74 Years | 786 (100.0%) | 1,254 (87.1%) |
| 75 Years and over | 308 (84.9%) | 683 (77.3%) |
| Total | 6,134 (92.6%) | 7,544 (90.8%) |
Income Below Poverty Among Married-Couple Families in Weigelstown
The poverty statistics for married-couple families in Weigelstown show that 2.8% or 91 of the total 3,287 families live below the poverty line. Families with 1 or 2 children have the highest poverty rate of 6.1%, comprising of 51 families. On the other hand, families with 3 or 4 children have the lowest poverty rate of 0.0%, which includes 0 families.
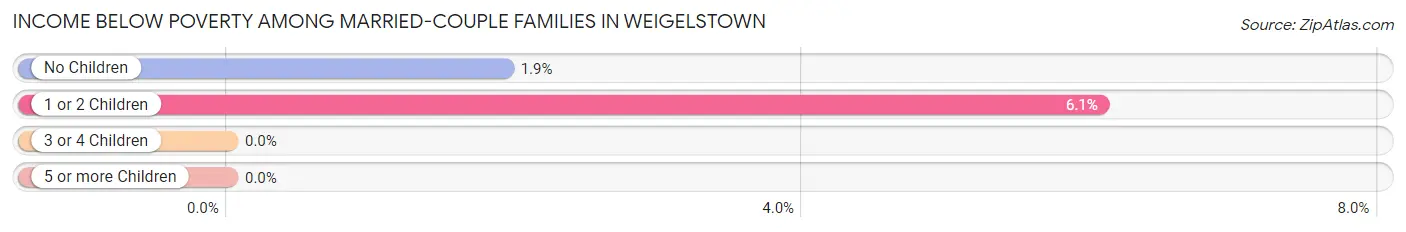
| Children | Above Poverty | Below Poverty |
| No Children | 2,046 (98.1%) | 40 (1.9%) |
| 1 or 2 Children | 789 (93.9%) | 51 (6.1%) |
| 3 or 4 Children | 324 (100.0%) | 0 (0.0%) |
| 5 or more Children | 37 (100.0%) | 0 (0.0%) |
| Total | 3,196 (97.2%) | 91 (2.8%) |
Income Below Poverty Among Single-Parent Households in Weigelstown
According to the poverty data in Weigelstown, 61.8% or 115 single-father households and 8.7% or 41 single-mother households are living below the poverty line. Among single-father households, those with 1 or 2 children have the highest poverty rate, with 115 households (70.6%) experiencing poverty. Likewise, among single-mother households, those with 3 or 4 children have the highest poverty rate, with 21 households (19.4%) falling below the poverty line.
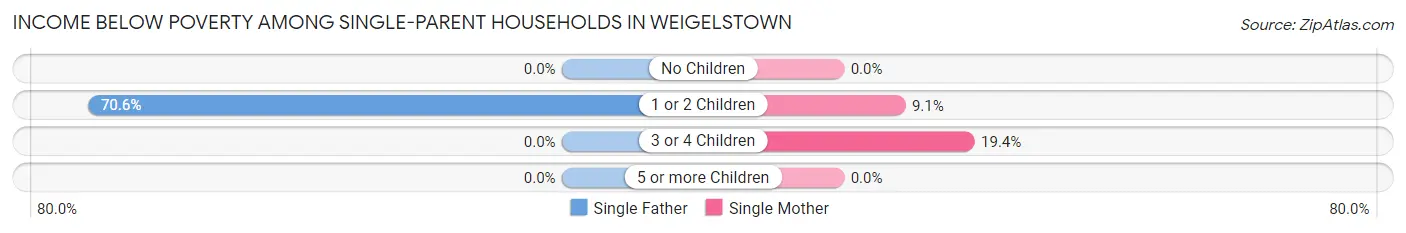
| Children | Single Father | Single Mother |
| No Children | 0 (0.0%) | 0 (0.0%) |
| 1 or 2 Children | 115 (70.6%) | 20 (9.1%) |
| 3 or 4 Children | 0 (0.0%) | 21 (19.4%) |
| 5 or more Children | 0 (0.0%) | 0 (0.0%) |
| Total | 115 (61.8%) | 41 (8.7%) |
Income Below Poverty Among Married-Couple vs Single-Parent Households in Weigelstown
The poverty data for Weigelstown shows that 91 of the married-couple family households (2.8%) and 156 of the single-parent households (23.7%) are living below the poverty level. Within the married-couple family households, those with 1 or 2 children have the highest poverty rate, with 51 households (6.1%) falling below the poverty line. Among the single-parent households, those with 1 or 2 children have the highest poverty rate, with 135 household (35.3%) living below poverty.
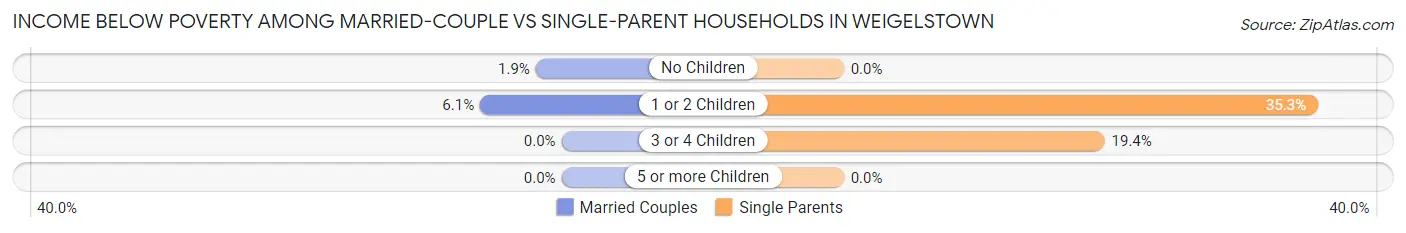
| Children | Married-Couple Families | Single-Parent Households |
| No Children | 40 (1.9%) | 0 (0.0%) |
| 1 or 2 Children | 51 (6.1%) | 135 (35.3%) |
| 3 or 4 Children | 0 (0.0%) | 21 (19.4%) |
| 5 or more Children | 0 (0.0%) | 0 (0.0%) |
| Total | 91 (2.8%) | 156 (23.7%) |
Race in Weigelstown
The most populous races in Weigelstown are White / Caucasian (13,098 | 87.5%), Hispanic or Latino (801 | 5.3%), and Two or more Races (797 | 5.3%).
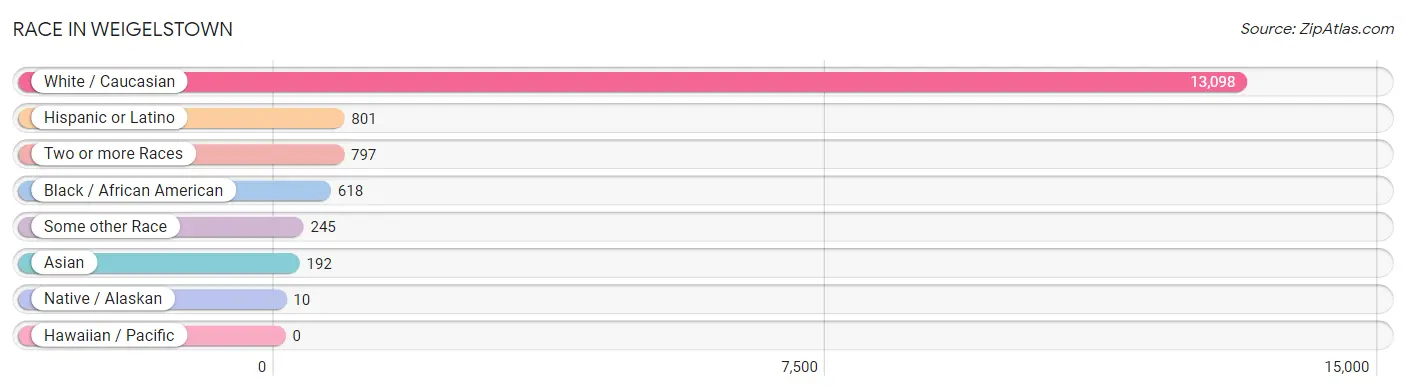
| Race | # Population | % Population |
| Asian | 192 | 1.3% |
| Black / African American | 618 | 4.1% |
| Hawaiian / Pacific | 0 | 0.0% |
| Hispanic or Latino | 801 | 5.3% |
| Native / Alaskan | 10 | 0.1% |
| White / Caucasian | 13,098 | 87.5% |
| Two or more Races | 797 | 5.3% |
| Some other Race | 245 | 1.6% |
| Total | 14,960 | 100.0% |
Ancestry in Weigelstown
The most populous ancestries reported in Weigelstown are German (5,075 | 33.9%), Italian (1,614 | 10.8%), Irish (1,247 | 8.3%), American (1,240 | 8.3%), and English (842 | 5.6%), together accounting for 67.0% of all Weigelstown residents.
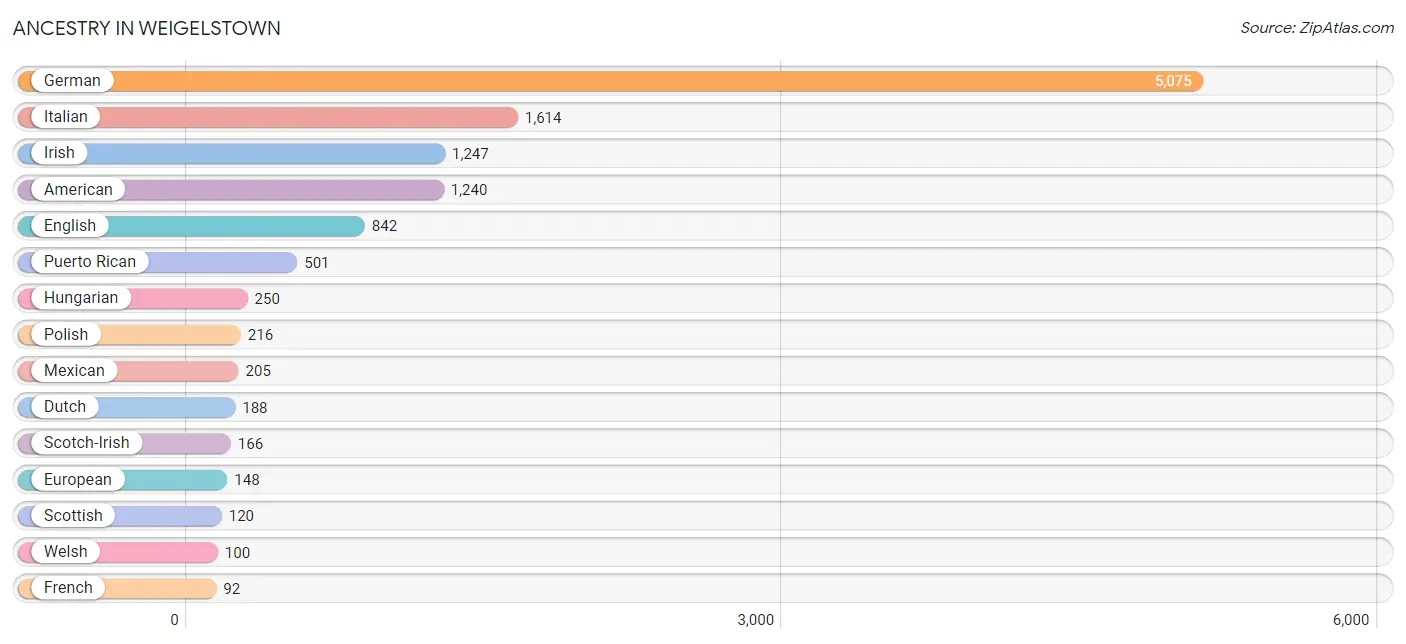
| Ancestry | # Population | % Population |
| American | 1,240 | 8.3% |
| British | 35 | 0.2% |
| Central American | 11 | 0.1% |
| Croatian | 16 | 0.1% |
| Czech | 76 | 0.5% |
| Dominican | 34 | 0.2% |
| Dutch | 188 | 1.3% |
| Eastern European | 16 | 0.1% |
| Ecuadorian | 11 | 0.1% |
| English | 842 | 5.6% |
| European | 148 | 1.0% |
| Finnish | 63 | 0.4% |
| French | 92 | 0.6% |
| French Canadian | 7 | 0.1% |
| German | 5,075 | 33.9% |
| Greek | 21 | 0.1% |
| Hungarian | 250 | 1.7% |
| Indian (Asian) | 86 | 0.6% |
| Irish | 1,247 | 8.3% |
| Italian | 1,614 | 10.8% |
| Korean | 60 | 0.4% |
| Mexican | 205 | 1.4% |
| Panamanian | 11 | 0.1% |
| Pennsylvania German | 57 | 0.4% |
| Polish | 216 | 1.4% |
| Puerto Rican | 501 | 3.4% |
| Romanian | 27 | 0.2% |
| Russian | 83 | 0.5% |
| Scandinavian | 21 | 0.1% |
| Scotch-Irish | 166 | 1.1% |
| Scottish | 120 | 0.8% |
| Seminole | 10 | 0.1% |
| Slovak | 54 | 0.4% |
| South American | 11 | 0.1% |
| Spanish | 23 | 0.2% |
| Spanish American | 16 | 0.1% |
| Subsaharan African | 52 | 0.4% |
| Swedish | 27 | 0.2% |
| Swiss | 59 | 0.4% |
| Thai | 59 | 0.4% |
| Welsh | 100 | 0.7% | View All 41 Rows |
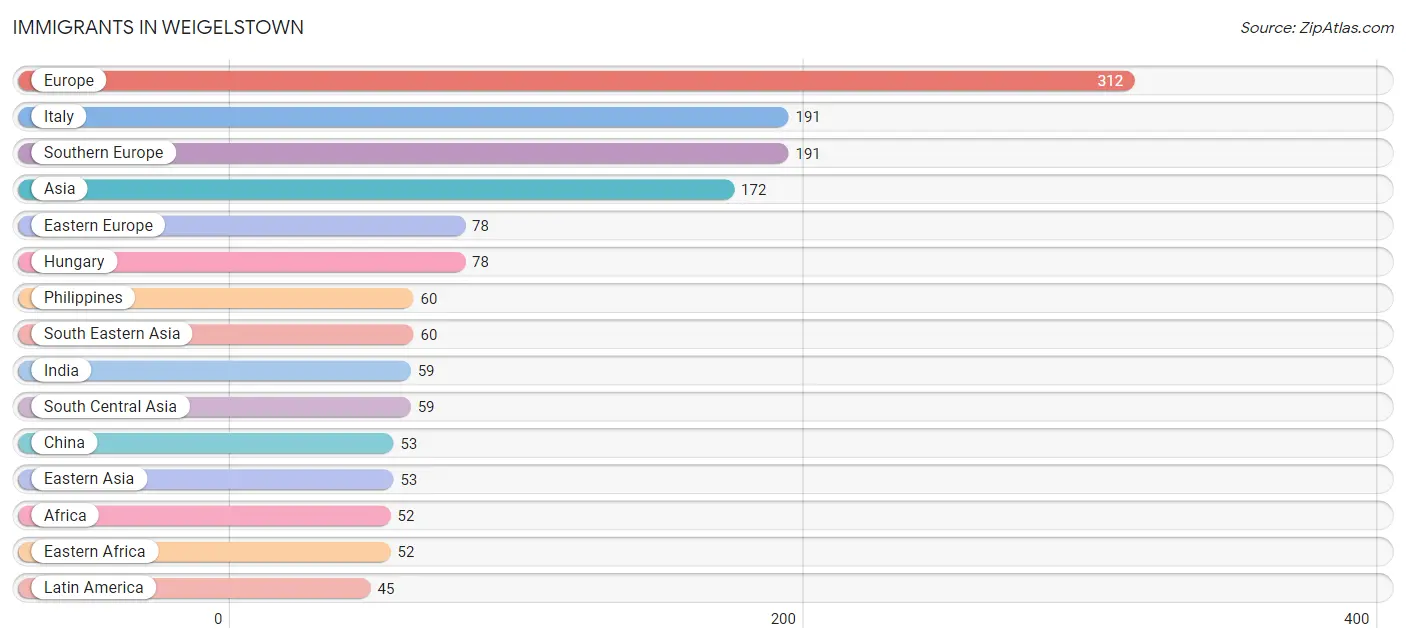
Immigrants in Weigelstown
The most numerous immigrant groups reported in Weigelstown came from Europe (312 | 2.1%), Italy (191 | 1.3%), Southern Europe (191 | 1.3%), Asia (172 | 1.1%), and Eastern Europe (78 | 0.5%), together accounting for 6.3% of all Weigelstown residents.
| Immigration Origin | # Population | % Population |
| Africa | 52 | 0.4% |
| Asia | 172 | 1.1% |
| Caribbean | 34 | 0.2% |
| Central America | 11 | 0.1% |
| China | 53 | 0.4% |
| Dominican Republic | 34 | 0.2% |
| Eastern Africa | 52 | 0.4% |
| Eastern Asia | 53 | 0.4% |
| Eastern Europe | 78 | 0.5% |
| Europe | 312 | 2.1% |
| Germany | 43 | 0.3% |
| Hungary | 78 | 0.5% |
| India | 59 | 0.4% |
| Italy | 191 | 1.3% |
| Latin America | 45 | 0.3% |
| Mexico | 11 | 0.1% |
| Philippines | 60 | 0.4% |
| South Central Asia | 59 | 0.4% |
| South Eastern Asia | 60 | 0.4% |
| Southern Europe | 191 | 1.3% |
| Western Europe | 43 | 0.3% | View All 21 Rows |
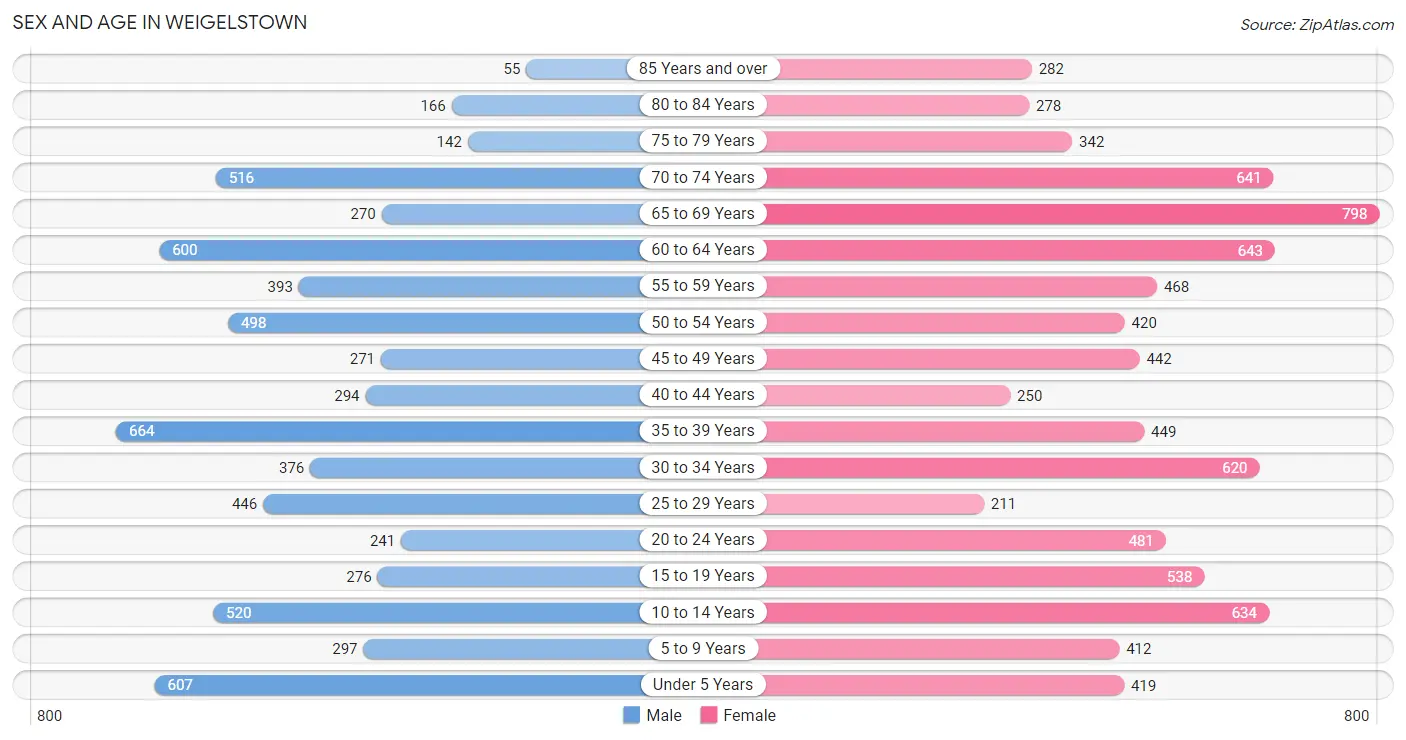
Sex and Age in Weigelstown
Sex and Age in Weigelstown
The most populous age groups in Weigelstown are 35 to 39 Years (664 | 10.0%) for men and 65 to 69 Years (798 | 9.6%) for women.
| Age Bracket | Male | Female |
| Under 5 Years | 607 (9.1%) | 419 (5.0%) |
| 5 to 9 Years | 297 (4.5%) | 412 (5.0%) |
| 10 to 14 Years | 520 (7.8%) | 634 (7.6%) |
| 15 to 19 Years | 276 (4.2%) | 538 (6.5%) |
| 20 to 24 Years | 241 (3.6%) | 481 (5.8%) |
| 25 to 29 Years | 446 (6.7%) | 211 (2.5%) |
| 30 to 34 Years | 376 (5.7%) | 620 (7.4%) |
| 35 to 39 Years | 664 (10.0%) | 449 (5.4%) |
| 40 to 44 Years | 294 (4.4%) | 250 (3.0%) |
| 45 to 49 Years | 271 (4.1%) | 442 (5.3%) |
| 50 to 54 Years | 498 (7.5%) | 420 (5.0%) |
| 55 to 59 Years | 393 (5.9%) | 468 (5.6%) |
| 60 to 64 Years | 600 (9.0%) | 643 (7.7%) |
| 65 to 69 Years | 270 (4.1%) | 798 (9.6%) |
| 70 to 74 Years | 516 (7.8%) | 641 (7.7%) |
| 75 to 79 Years | 142 (2.1%) | 342 (4.1%) |
| 80 to 84 Years | 166 (2.5%) | 278 (3.3%) |
| 85 Years and over | 55 (0.8%) | 282 (3.4%) |
| Total | 6,632 (100.0%) | 8,328 (100.0%) |
Families and Households in Weigelstown
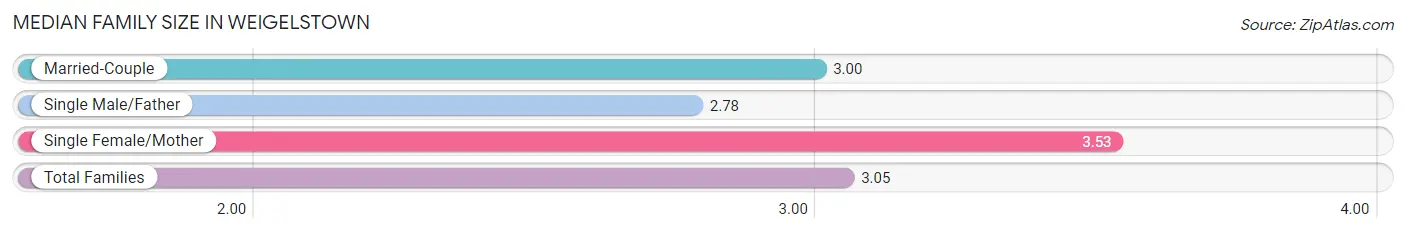
Median Family Size in Weigelstown
The median family size in Weigelstown is 3.05 persons per family, with single female/mother families (472 | 12.0%) accounting for the largest median family size of 3.53 persons per family. On the other hand, single male/father families (186 | 4.7%) represent the smallest median family size with 2.78 persons per family.
| Family Type | # Families | Family Size |
| Married-Couple | 3,287 (83.3%) | 3.00 |
| Single Male/Father | 186 (4.7%) | 2.78 |
| Single Female/Mother | 472 (12.0%) | 3.53 |
| Total Families | 3,945 (100.0%) | 3.05 |
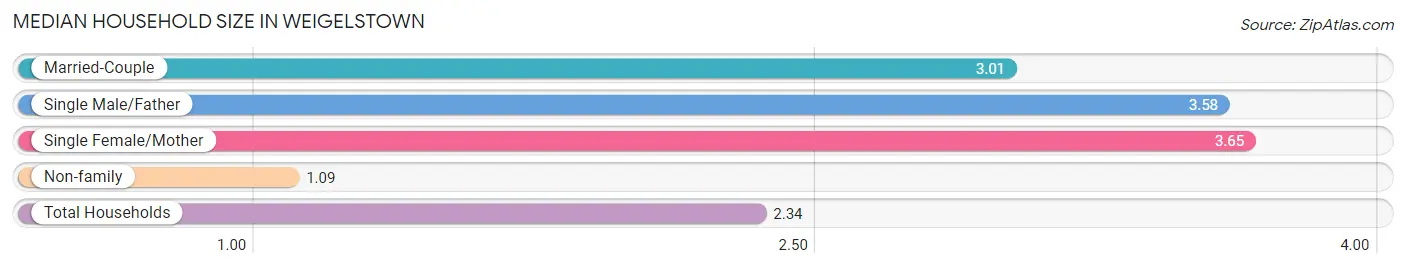
Median Household Size in Weigelstown
The median household size in Weigelstown is 2.34 persons per household, with single female/mother households (472 | 7.4%) accounting for the largest median household size of 3.65 persons per household. non-family households (2,431 | 38.1%) represent the smallest median household size with 1.09 persons per household.
| Household Type | # Households | Household Size |
| Married-Couple | 3,287 (51.5%) | 3.01 |
| Single Male/Father | 186 (2.9%) | 3.58 |
| Single Female/Mother | 472 (7.4%) | 3.65 |
| Non-family | 2,431 (38.1%) | 1.09 |
| Total Households | 6,376 (100.0%) | 2.34 |
Household Size by Marriage Status in Weigelstown
Out of a total of 6,376 households in Weigelstown, 3,945 (61.9%) are family households, while 2,431 (38.1%) are nonfamily households. The most numerous type of family households are 2-person households, comprising 1,826, and the most common type of nonfamily households are 1-person households, comprising 2,174.
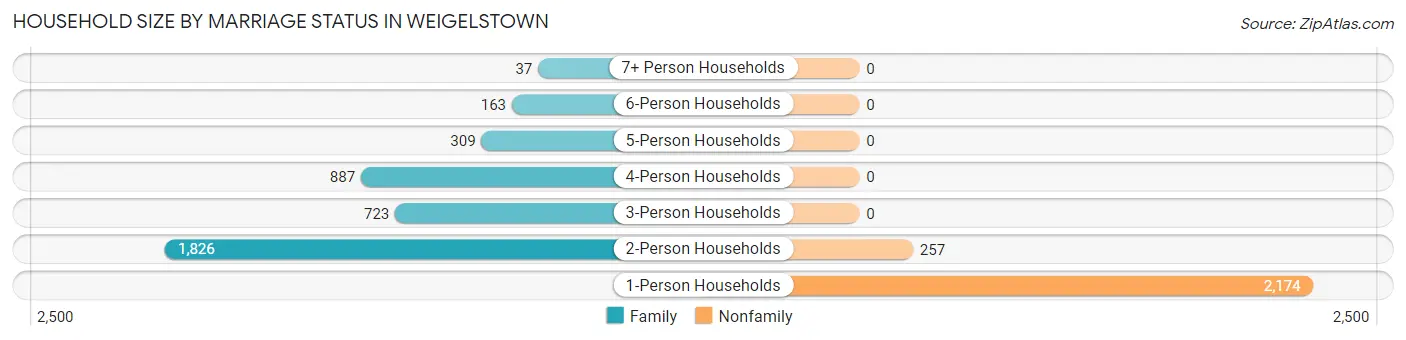
| Household Size | Family Households | Nonfamily Households |
| 1-Person Households | - | 2,174 (34.1%) |
| 2-Person Households | 1,826 (28.6%) | 257 (4.0%) |
| 3-Person Households | 723 (11.3%) | 0 (0.0%) |
| 4-Person Households | 887 (13.9%) | 0 (0.0%) |
| 5-Person Households | 309 (4.9%) | 0 (0.0%) |
| 6-Person Households | 163 (2.6%) | 0 (0.0%) |
| 7+ Person Households | 37 (0.6%) | 0 (0.0%) |
| Total | 3,945 (61.9%) | 2,431 (38.1%) |
Female Fertility in Weigelstown
Fertility by Age in Weigelstown
Average fertility rate in Weigelstown is 38.0 births per 1,000 women. Women in the age bracket of 20 to 34 years have the highest fertility rate with 89.0 births per 1,000 women. Women in the age bracket of 20 to 34 years acount for 100.0% of all women with births.
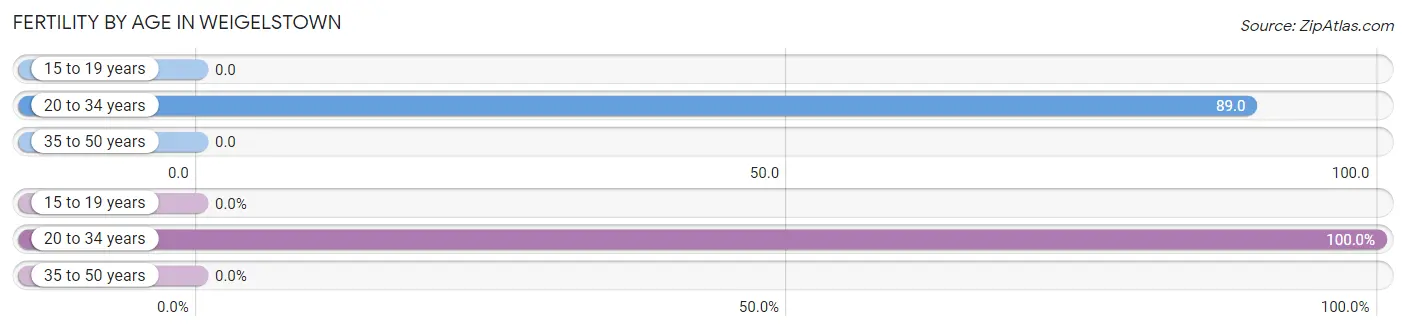
| Age Bracket | Women with Births | Births / 1,000 Women |
| 15 to 19 years | 0 (0.0%) | 0.0 |
| 20 to 34 years | 117 (100.0%) | 89.0 |
| 35 to 50 years | 0 (0.0%) | 0.0 |
| Total | 117 (100.0%) | 38.0 |
Fertility by Age by Marriage Status in Weigelstown
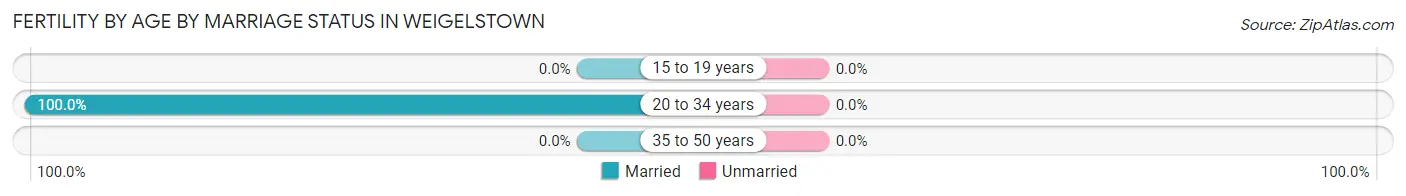
| Age Bracket | Married | Unmarried |
| 15 to 19 years | 0 (0.0%) | 0 (0.0%) |
| 20 to 34 years | 117 (100.0%) | 0 (0.0%) |
| 35 to 50 years | 0 (0.0%) | 0 (0.0%) |
| Total | 117 (100.0%) | 0 (0.0%) |
Fertility by Education in Weigelstown
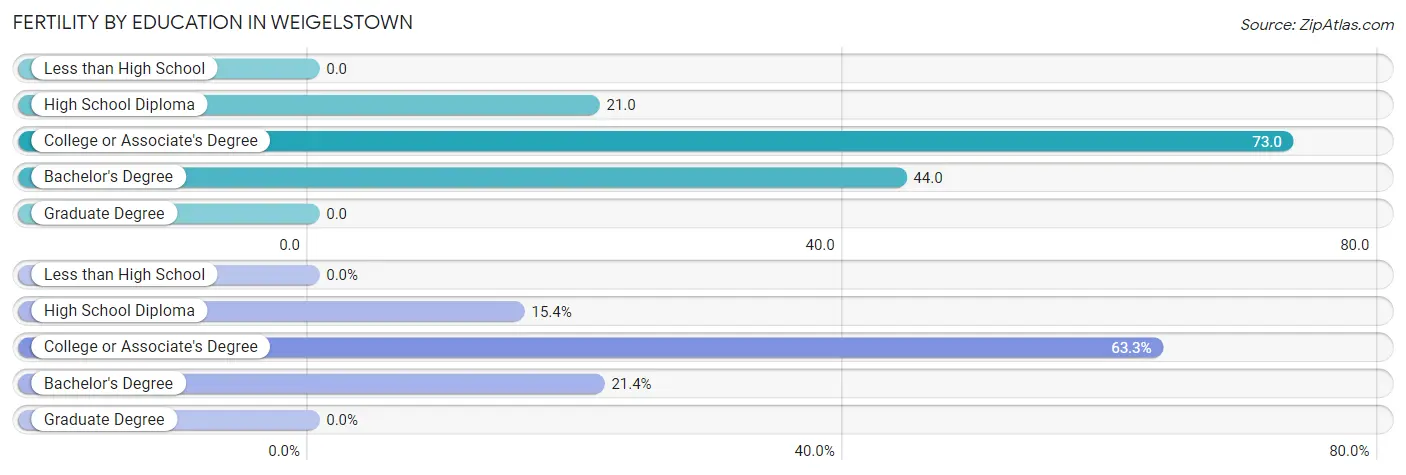
| Educational Attainment | Women with Births | Births / 1,000 Women |
| Less than High School | 0 (0.0%) | 0.0 |
| High School Diploma | 18 (15.4%) | 21.0 |
| College or Associate's Degree | 74 (63.2%) | 73.0 |
| Bachelor's Degree | 25 (21.4%) | 44.0 |
| Graduate Degree | 0 (0.0%) | 0.0 |
| Total | 117 (100.0%) | 38.0 |
Fertility by Education by Marriage Status in Weigelstown
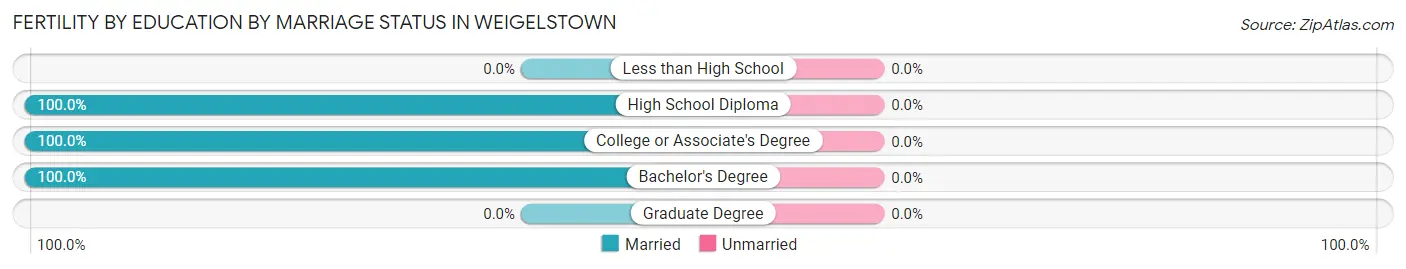
| Educational Attainment | Married | Unmarried |
| Less than High School | 0 (0.0%) | 0 (0.0%) |
| High School Diploma | 18 (100.0%) | 0 (0.0%) |
| College or Associate's Degree | 74 (100.0%) | 0 (0.0%) |
| Bachelor's Degree | 25 (100.0%) | 0 (0.0%) |
| Graduate Degree | 0 (0.0%) | 0 (0.0%) |
| Total | 117 (100.0%) | 0 (0.0%) |
Employment Characteristics in Weigelstown
Employment by Class of Employer in Weigelstown
Among the 7,425 employed individuals in Weigelstown, private company employees (5,290 | 71.3%), not-for-profit organizations (789 | 10.6%), and self-employed (not incorporated) (329 | 4.4%) make up the most common classes of employment.
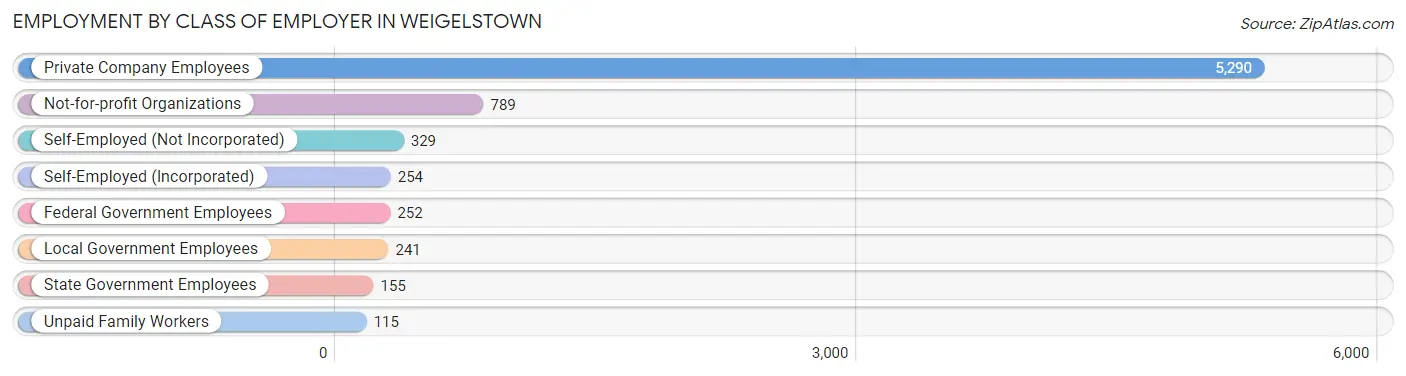
| Employer Class | # Employees | % Employees |
| Private Company Employees | 5,290 | 71.3% |
| Self-Employed (Incorporated) | 254 | 3.4% |
| Self-Employed (Not Incorporated) | 329 | 4.4% |
| Not-for-profit Organizations | 789 | 10.6% |
| Local Government Employees | 241 | 3.3% |
| State Government Employees | 155 | 2.1% |
| Federal Government Employees | 252 | 3.4% |
| Unpaid Family Workers | 115 | 1.5% |
| Total | 7,425 | 100.0% |
Employment Status by Age in Weigelstown
According to the labor force statistics for Weigelstown, out of the total population over 16 years of age (11,854), 64.4% or 7,634 individuals are in the labor force, with 1.5% or 115 of them unemployed. The age group with the highest labor force participation rate is 35 to 44 years, with 95.2% or 1,577 individuals in the labor force. Within the labor force, the 60 to 64 years age range has the highest percentage of unemployed individuals, with 6.2% or 61 of them being unemployed.
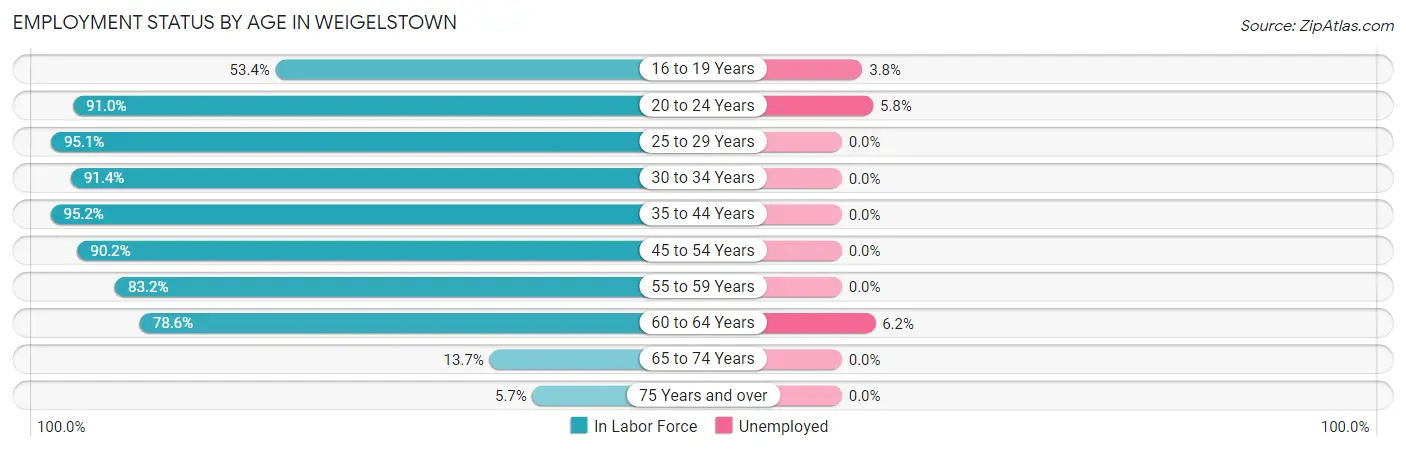
| Age Bracket | In Labor Force | Unemployed |
| 16 to 19 Years | 319 (53.4%) | 12 (3.8%) |
| 20 to 24 Years | 657 (91.0%) | 38 (5.8%) |
| 25 to 29 Years | 625 (95.1%) | 0 (0.0%) |
| 30 to 34 Years | 910 (91.4%) | 0 (0.0%) |
| 35 to 44 Years | 1,577 (95.2%) | 0 (0.0%) |
| 45 to 54 Years | 1,471 (90.2%) | 0 (0.0%) |
| 55 to 59 Years | 716 (83.2%) | 0 (0.0%) |
| 60 to 64 Years | 977 (78.6%) | 61 (6.2%) |
| 65 to 74 Years | 305 (13.7%) | 0 (0.0%) |
| 75 Years and over | 72 (5.7%) | 0 (0.0%) |
| Total | 7,634 (64.4%) | 115 (1.5%) |
Employment Status by Educational Attainment in Weigelstown
According to labor force statistics for Weigelstown, 89.1% of individuals (6,277) out of the total population between 25 and 64 years of age (7,045) are in the labor force, with 1.0% or 63 of them being unemployed. The group with the highest labor force participation rate are those with the educational attainment of bachelor's degree or higher, with 92.8% or 1,389 individuals in the labor force. Within the labor force, individuals with less than high school education have the highest percentage of unemployment, with 9.3% or 24 of them being unemployed.
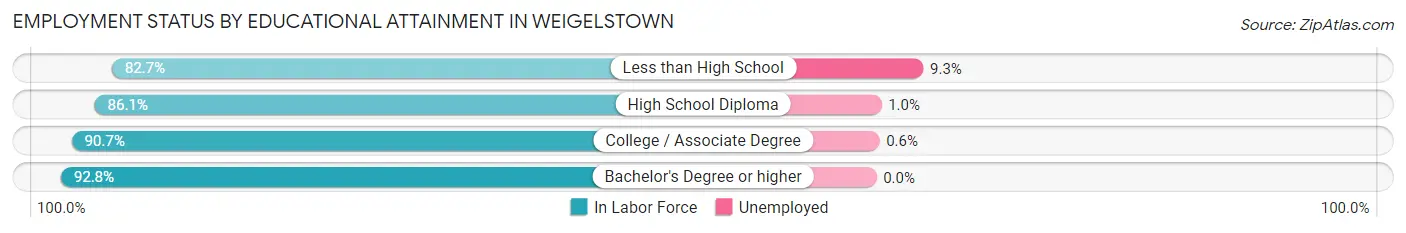
| Educational Attainment | In Labor Force | Unemployed |
| Less than High School | 259 (82.7%) | 29 (9.3%) |
| High School Diploma | 2,205 (86.1%) | 26 (1.0%) |
| College / Associate Degree | 2,425 (90.7%) | 16 (0.6%) |
| Bachelor's Degree or higher | 1,389 (92.8%) | 0 (0.0%) |
| Total | 6,277 (89.1%) | 70 (1.0%) |
Employment Occupations by Sex in Weigelstown
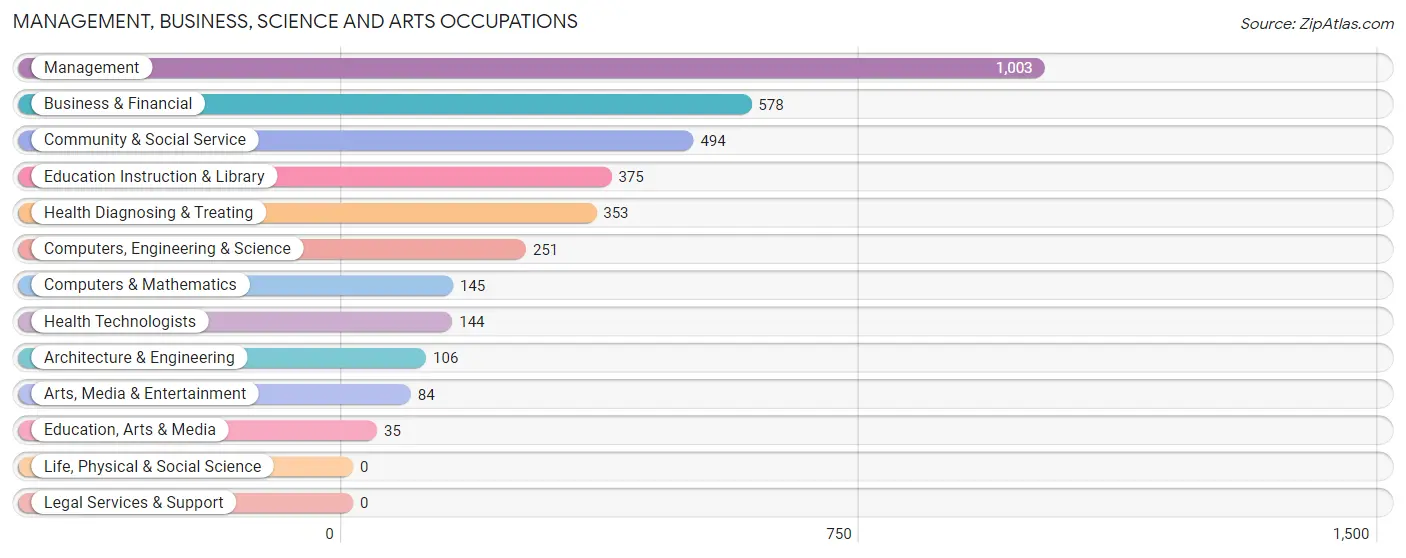
Management, Business, Science and Arts Occupations
The most common Management, Business, Science and Arts occupations in Weigelstown are Management (1,003 | 13.3%), Business & Financial (578 | 7.7%), Community & Social Service (494 | 6.6%), Education Instruction & Library (375 | 5.0%), and Health Diagnosing & Treating (353 | 4.7%).
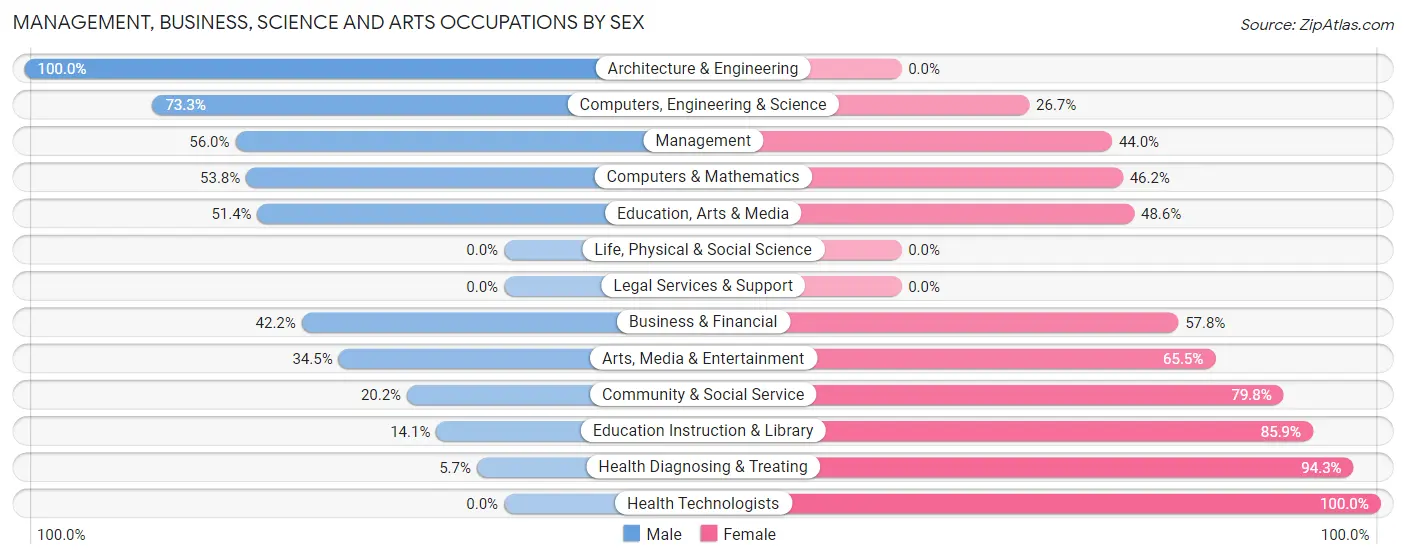
Management, Business, Science and Arts Occupations by Sex
Within the Management, Business, Science and Arts occupations in Weigelstown, the most male-oriented occupations are Architecture & Engineering (100.0%), Computers, Engineering & Science (73.3%), and Management (56.0%), while the most female-oriented occupations are Health Technologists (100.0%), Health Diagnosing & Treating (94.3%), and Education Instruction & Library (85.9%).
| Occupation | Male | Female |
| Management | 562 (56.0%) | 441 (44.0%) |
| Business & Financial | 244 (42.2%) | 334 (57.8%) |
| Computers, Engineering & Science | 184 (73.3%) | 67 (26.7%) |
| Computers & Mathematics | 78 (53.8%) | 67 (46.2%) |
| Architecture & Engineering | 106 (100.0%) | 0 (0.0%) |
| Life, Physical & Social Science | 0 (0.0%) | 0 (0.0%) |
| Community & Social Service | 100 (20.2%) | 394 (79.8%) |
| Education, Arts & Media | 18 (51.4%) | 17 (48.6%) |
| Legal Services & Support | 0 (0.0%) | 0 (0.0%) |
| Education Instruction & Library | 53 (14.1%) | 322 (85.9%) |
| Arts, Media & Entertainment | 29 (34.5%) | 55 (65.5%) |
| Health Diagnosing & Treating | 20 (5.7%) | 333 (94.3%) |
| Health Technologists | 0 (0.0%) | 144 (100.0%) |
| Total (Category) | 1,110 (41.4%) | 1,569 (58.6%) |
| Total (Overall) | 3,862 (51.4%) | 3,657 (48.6%) |
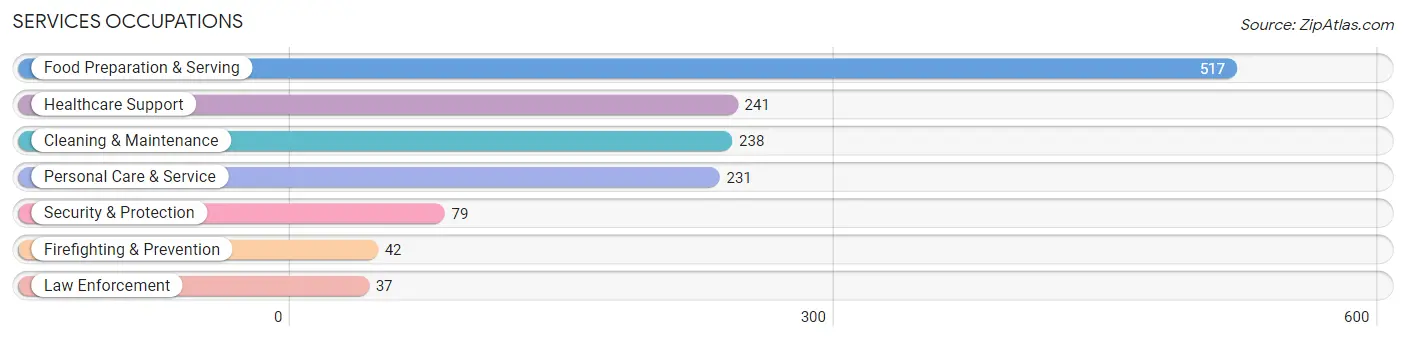
Services Occupations
The most common Services occupations in Weigelstown are Food Preparation & Serving (517 | 6.9%), Healthcare Support (241 | 3.2%), Cleaning & Maintenance (238 | 3.2%), Personal Care & Service (231 | 3.1%), and Security & Protection (79 | 1.1%).
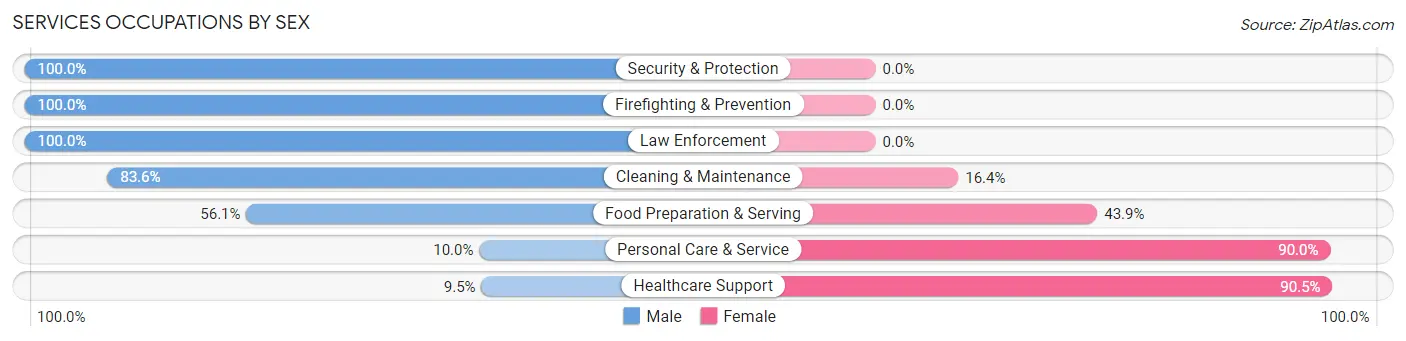
Services Occupations by Sex
Within the Services occupations in Weigelstown, the most male-oriented occupations are Security & Protection (100.0%), Firefighting & Prevention (100.0%), and Law Enforcement (100.0%), while the most female-oriented occupations are Healthcare Support (90.5%), Personal Care & Service (90.0%), and Food Preparation & Serving (43.9%).
| Occupation | Male | Female |
| Healthcare Support | 23 (9.5%) | 218 (90.5%) |
| Security & Protection | 79 (100.0%) | 0 (0.0%) |
| Firefighting & Prevention | 42 (100.0%) | 0 (0.0%) |
| Law Enforcement | 37 (100.0%) | 0 (0.0%) |
| Food Preparation & Serving | 290 (56.1%) | 227 (43.9%) |
| Cleaning & Maintenance | 199 (83.6%) | 39 (16.4%) |
| Personal Care & Service | 23 (10.0%) | 208 (90.0%) |
| Total (Category) | 614 (47.0%) | 692 (53.0%) |
| Total (Overall) | 3,862 (51.4%) | 3,657 (48.6%) |
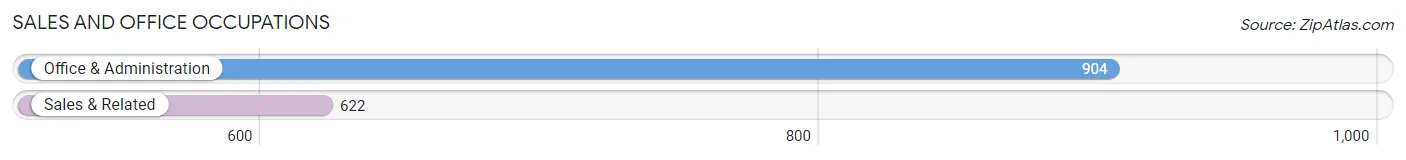
Sales and Office Occupations
The most common Sales and Office occupations in Weigelstown are Office & Administration (904 | 12.0%), and Sales & Related (622 | 8.3%).
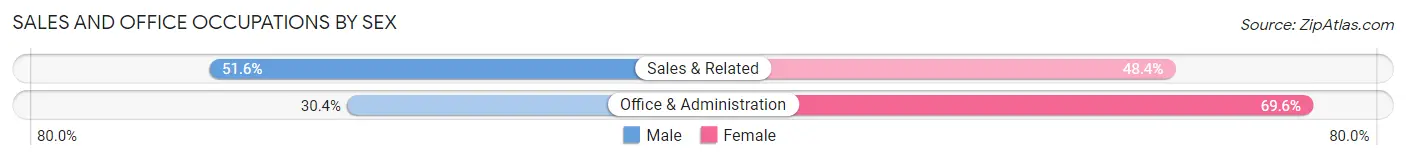
Sales and Office Occupations by Sex
| Occupation | Male | Female |
| Sales & Related | 321 (51.6%) | 301 (48.4%) |
| Office & Administration | 275 (30.4%) | 629 (69.6%) |
| Total (Category) | 596 (39.1%) | 930 (60.9%) |
| Total (Overall) | 3,862 (51.4%) | 3,657 (48.6%) |
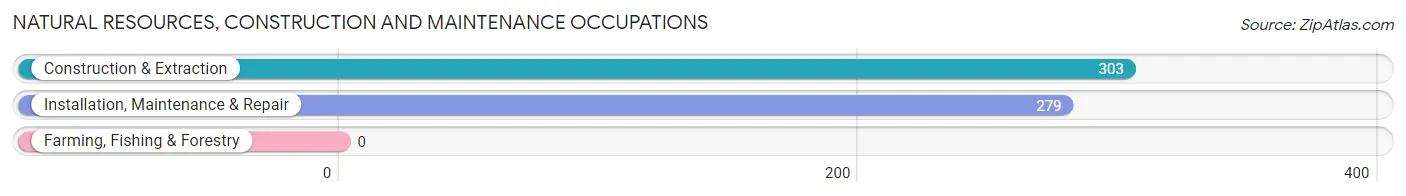
Natural Resources, Construction and Maintenance Occupations
The most common Natural Resources, Construction and Maintenance occupations in Weigelstown are Construction & Extraction (303 | 4.0%), and Installation, Maintenance & Repair (279 | 3.7%).
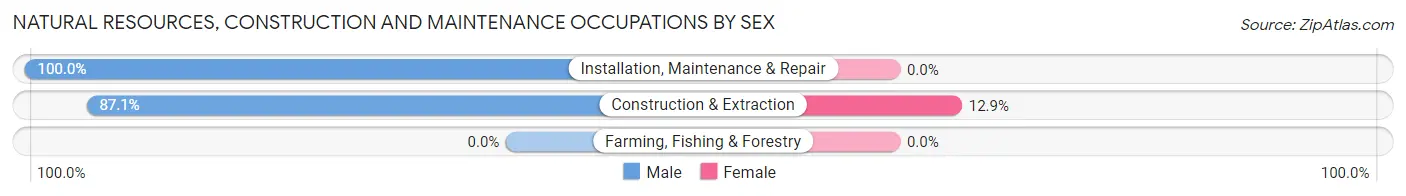
Natural Resources, Construction and Maintenance Occupations by Sex
| Occupation | Male | Female |
| Farming, Fishing & Forestry | 0 (0.0%) | 0 (0.0%) |
| Construction & Extraction | 264 (87.1%) | 39 (12.9%) |
| Installation, Maintenance & Repair | 279 (100.0%) | 0 (0.0%) |
| Total (Category) | 543 (93.3%) | 39 (6.7%) |
| Total (Overall) | 3,862 (51.4%) | 3,657 (48.6%) |
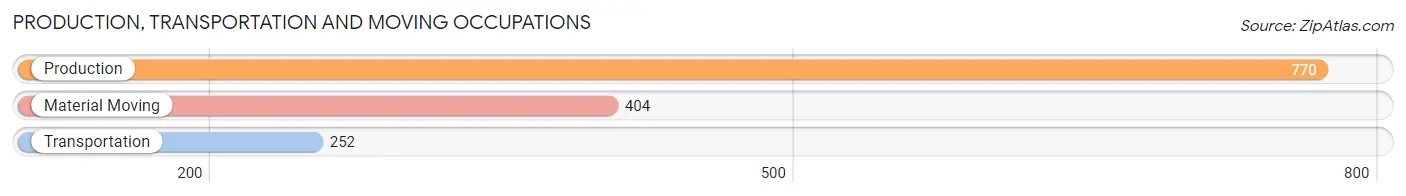
Production, Transportation and Moving Occupations
The most common Production, Transportation and Moving occupations in Weigelstown are Production (770 | 10.2%), Material Moving (404 | 5.4%), and Transportation (252 | 3.4%).
Production, Transportation and Moving Occupations by Sex
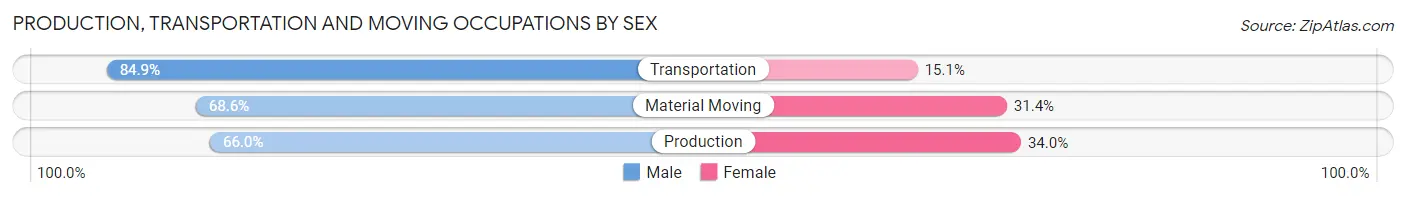
| Occupation | Male | Female |
| Production | 508 (66.0%) | 262 (34.0%) |
| Transportation | 214 (84.9%) | 38 (15.1%) |
| Material Moving | 277 (68.6%) | 127 (31.4%) |
| Total (Category) | 999 (70.1%) | 427 (29.9%) |
| Total (Overall) | 3,862 (51.4%) | 3,657 (48.6%) |
Employment Industries by Sex in Weigelstown
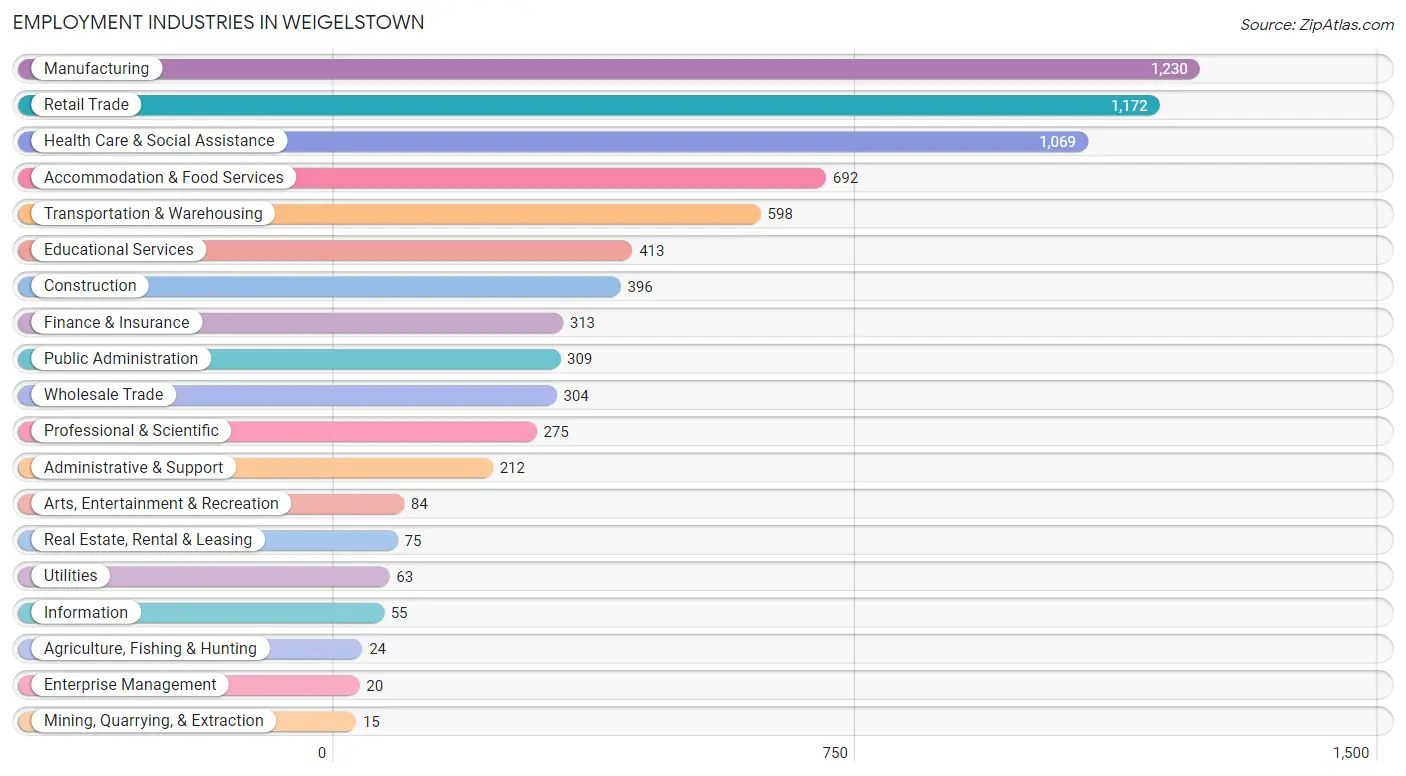
Employment Industries in Weigelstown
The major employment industries in Weigelstown include Manufacturing (1,230 | 16.4%), Retail Trade (1,172 | 15.6%), Health Care & Social Assistance (1,069 | 14.2%), Accommodation & Food Services (692 | 9.2%), and Transportation & Warehousing (598 | 8.0%).
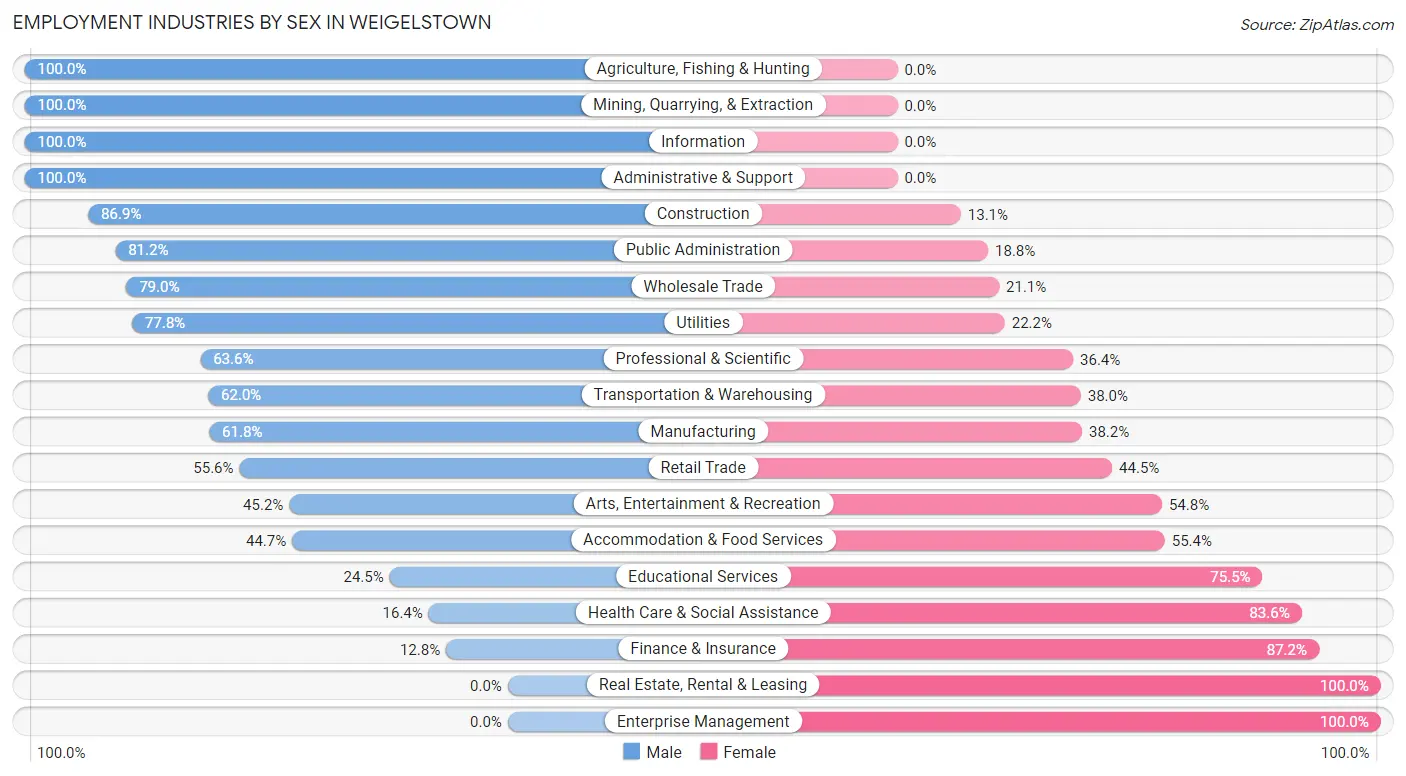
Employment Industries by Sex in Weigelstown
The Weigelstown industries that see more men than women are Agriculture, Fishing & Hunting (100.0%), Mining, Quarrying, & Extraction (100.0%), and Information (100.0%), whereas the industries that tend to have a higher number of women are Real Estate, Rental & Leasing (100.0%), Enterprise Management (100.0%), and Finance & Insurance (87.2%).
| Industry | Male | Female |
| Agriculture, Fishing & Hunting | 24 (100.0%) | 0 (0.0%) |
| Mining, Quarrying, & Extraction | 15 (100.0%) | 0 (0.0%) |
| Construction | 344 (86.9%) | 52 (13.1%) |
| Manufacturing | 760 (61.8%) | 470 (38.2%) |
| Wholesale Trade | 240 (78.9%) | 64 (21.0%) |
| Retail Trade | 651 (55.5%) | 521 (44.5%) |
| Transportation & Warehousing | 371 (62.0%) | 227 (38.0%) |
| Utilities | 49 (77.8%) | 14 (22.2%) |
| Information | 55 (100.0%) | 0 (0.0%) |
| Finance & Insurance | 40 (12.8%) | 273 (87.2%) |
| Real Estate, Rental & Leasing | 0 (0.0%) | 75 (100.0%) |
| Professional & Scientific | 175 (63.6%) | 100 (36.4%) |
| Enterprise Management | 0 (0.0%) | 20 (100.0%) |
| Administrative & Support | 212 (100.0%) | 0 (0.0%) |
| Educational Services | 101 (24.5%) | 312 (75.5%) |
| Health Care & Social Assistance | 175 (16.4%) | 894 (83.6%) |
| Arts, Entertainment & Recreation | 38 (45.2%) | 46 (54.8%) |
| Accommodation & Food Services | 309 (44.7%) | 383 (55.3%) |
| Public Administration | 251 (81.2%) | 58 (18.8%) |
| Total | 3,862 (51.4%) | 3,657 (48.6%) |
Education in Weigelstown
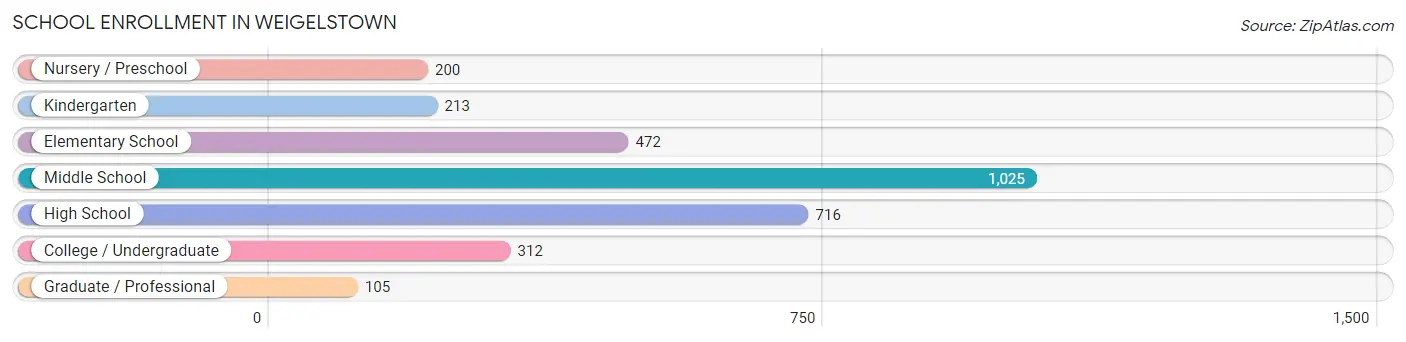
School Enrollment in Weigelstown
The most common levels of schooling among the 3,043 students in Weigelstown are middle school (1,025 | 33.7%), high school (716 | 23.5%), and elementary school (472 | 15.5%).
| School Level | # Students | % Students |
| Nursery / Preschool | 200 | 6.6% |
| Kindergarten | 213 | 7.0% |
| Elementary School | 472 | 15.5% |
| Middle School | 1,025 | 33.7% |
| High School | 716 | 23.5% |
| College / Undergraduate | 312 | 10.2% |
| Graduate / Professional | 105 | 3.5% |
| Total | 3,043 | 100.0% |
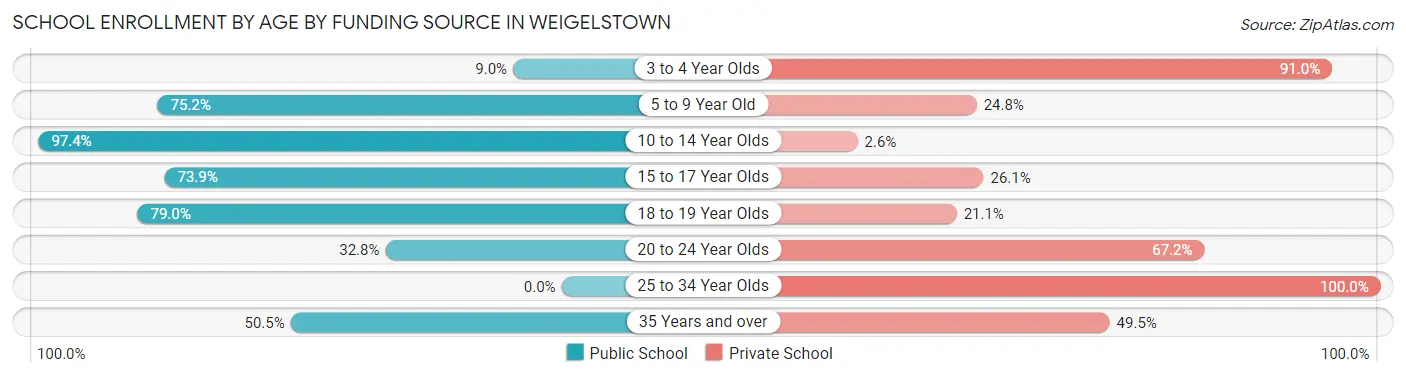
School Enrollment by Age by Funding Source in Weigelstown
Out of a total of 3,043 students who are enrolled in schools in Weigelstown, 788 (25.9%) attend a private institution, while the remaining 2,255 (74.1%) are enrolled in public schools. The age group of 25 to 34 year olds has the highest likelihood of being enrolled in private schools, with 59 (100.0% in the age bracket) enrolled. Conversely, the age group of 10 to 14 year olds has the lowest likelihood of being enrolled in a private school, with 1,092 (97.4% in the age bracket) attending a public institution.
| Age Bracket | Public School | Private School |
| 3 to 4 Year Olds | 17 (9.0%) | 171 (91.0%) |
| 5 to 9 Year Old | 513 (75.2%) | 169 (24.8%) |
| 10 to 14 Year Olds | 1,092 (97.4%) | 29 (2.6%) |
| 15 to 17 Year Olds | 420 (73.9%) | 148 (26.1%) |
| 18 to 19 Year Olds | 60 (78.9%) | 16 (21.0%) |
| 20 to 24 Year Olds | 43 (32.8%) | 88 (67.2%) |
| 25 to 34 Year Olds | 0 (0.0%) | 59 (100.0%) |
| 35 Years and over | 110 (50.5%) | 108 (49.5%) |
| Total | 2,255 (74.1%) | 788 (25.9%) |
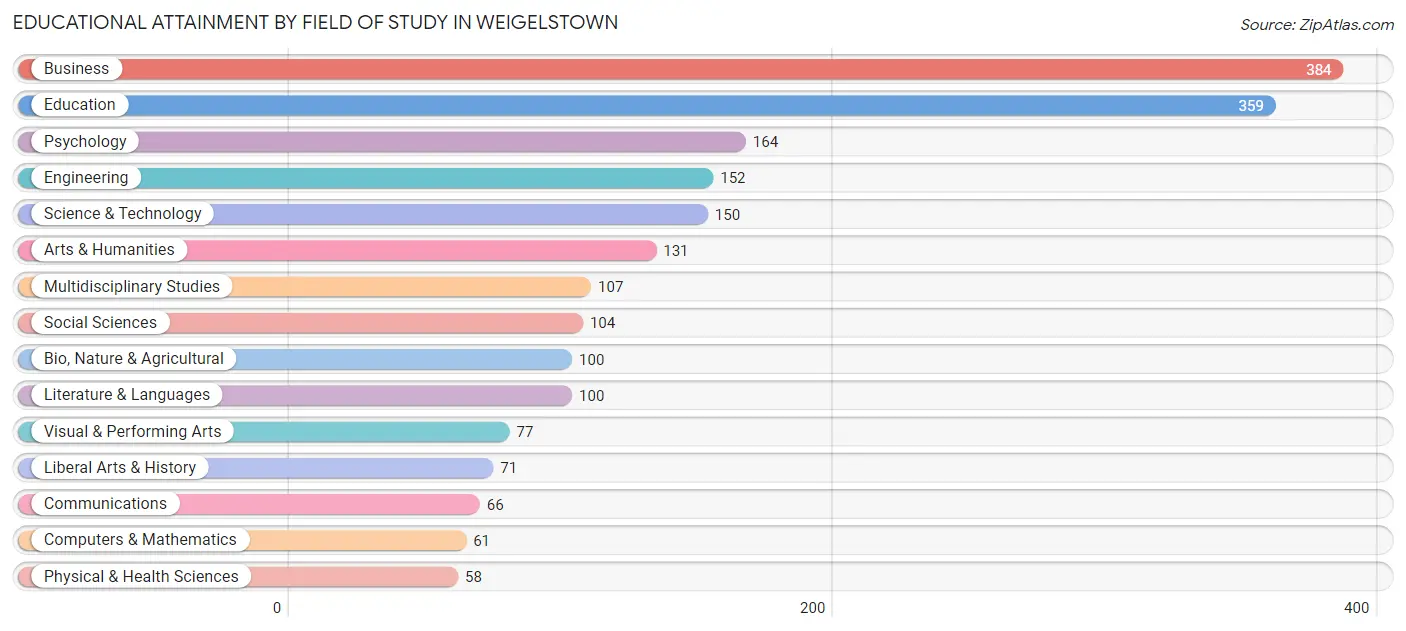
Educational Attainment by Field of Study in Weigelstown
Business (384 | 18.4%), education (359 | 17.2%), psychology (164 | 7.9%), engineering (152 | 7.3%), and science & technology (150 | 7.2%) are the most common fields of study among 2,084 individuals in Weigelstown who have obtained a bachelor's degree or higher.
| Field of Study | # Graduates | % Graduates |
| Computers & Mathematics | 61 | 2.9% |
| Bio, Nature & Agricultural | 100 | 4.8% |
| Physical & Health Sciences | 58 | 2.8% |
| Psychology | 164 | 7.9% |
| Social Sciences | 104 | 5.0% |
| Engineering | 152 | 7.3% |
| Multidisciplinary Studies | 107 | 5.1% |
| Science & Technology | 150 | 7.2% |
| Business | 384 | 18.4% |
| Education | 359 | 17.2% |
| Literature & Languages | 100 | 4.8% |
| Liberal Arts & History | 71 | 3.4% |
| Visual & Performing Arts | 77 | 3.7% |
| Communications | 66 | 3.2% |
| Arts & Humanities | 131 | 6.3% |
| Total | 2,084 | 100.0% |
Transportation & Commute in Weigelstown
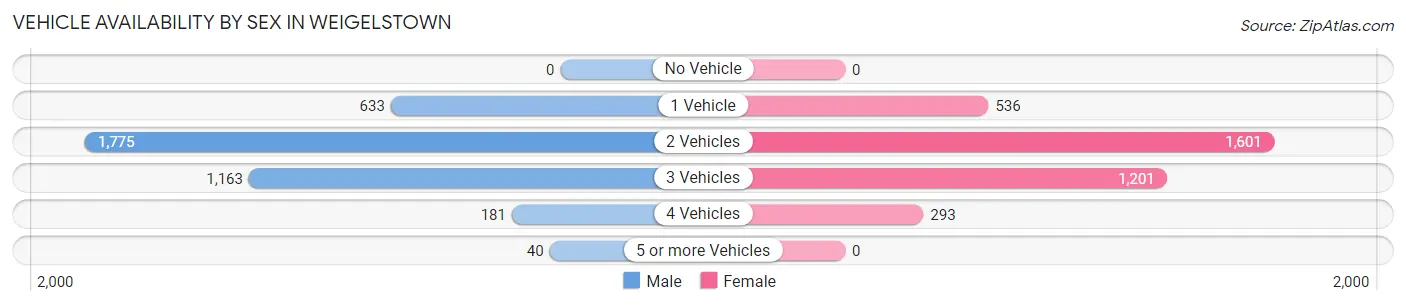
Vehicle Availability by Sex in Weigelstown
The most prevalent vehicle ownership categories in Weigelstown are males with 2 vehicles (1,775, accounting for 46.8%) and females with 2 vehicles (1,601, making up 48.9%).
| Vehicles Available | Male | Female |
| No Vehicle | 0 (0.0%) | 0 (0.0%) |
| 1 Vehicle | 633 (16.7%) | 536 (14.8%) |
| 2 Vehicles | 1,775 (46.8%) | 1,601 (44.1%) |
| 3 Vehicles | 1,163 (30.7%) | 1,201 (33.1%) |
| 4 Vehicles | 181 (4.8%) | 293 (8.1%) |
| 5 or more Vehicles | 40 (1.1%) | 0 (0.0%) |
| Total | 3,792 (100.0%) | 3,631 (100.0%) |
Commute Time in Weigelstown
The most frequently occuring commute durations in Weigelstown are 20 to 24 minutes (1,452 commuters, 21.6%), 15 to 19 minutes (1,024 commuters, 15.2%), and 30 to 34 minutes (784 commuters, 11.7%).
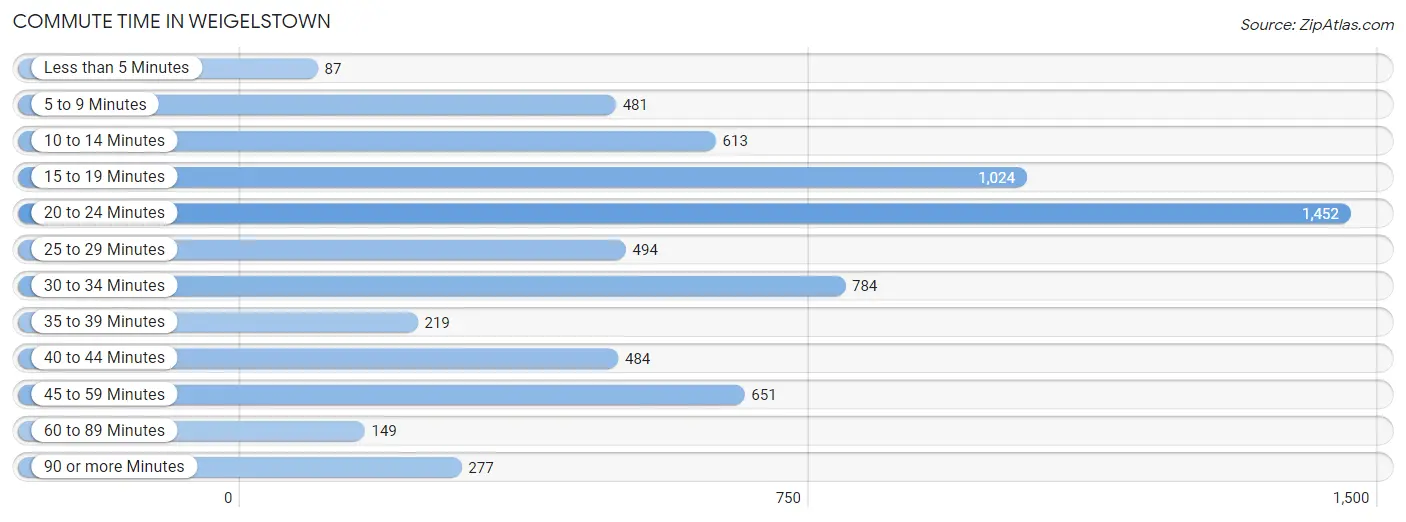
| Commute Time | # Commuters | % Commuters |
| Less than 5 Minutes | 87 | 1.3% |
| 5 to 9 Minutes | 481 | 7.2% |
| 10 to 14 Minutes | 613 | 9.1% |
| 15 to 19 Minutes | 1,024 | 15.2% |
| 20 to 24 Minutes | 1,452 | 21.6% |
| 25 to 29 Minutes | 494 | 7.4% |
| 30 to 34 Minutes | 784 | 11.7% |
| 35 to 39 Minutes | 219 | 3.3% |
| 40 to 44 Minutes | 484 | 7.2% |
| 45 to 59 Minutes | 651 | 9.7% |
| 60 to 89 Minutes | 149 | 2.2% |
| 90 or more Minutes | 277 | 4.1% |
Commute Time by Sex in Weigelstown
The most common commute times in Weigelstown are 20 to 24 minutes (605 commuters, 17.4%) for males and 20 to 24 minutes (847 commuters, 26.1%) for females.
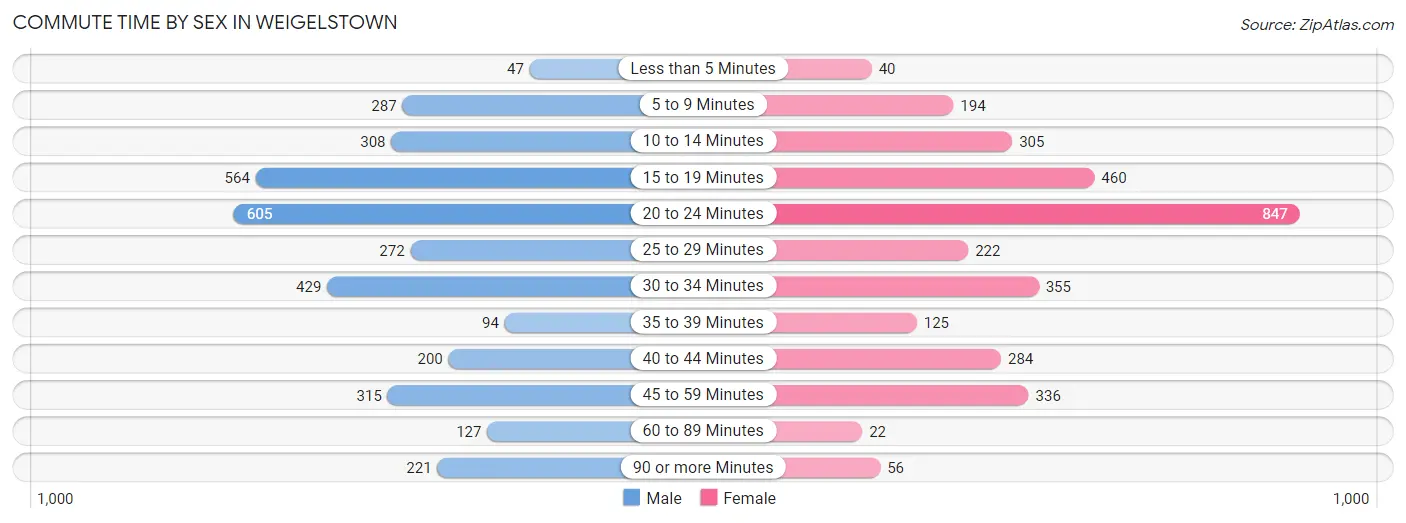
| Commute Time | Male | Female |
| Less than 5 Minutes | 47 (1.3%) | 40 (1.2%) |
| 5 to 9 Minutes | 287 (8.3%) | 194 (6.0%) |
| 10 to 14 Minutes | 308 (8.9%) | 305 (9.4%) |
| 15 to 19 Minutes | 564 (16.3%) | 460 (14.2%) |
| 20 to 24 Minutes | 605 (17.4%) | 847 (26.1%) |
| 25 to 29 Minutes | 272 (7.8%) | 222 (6.8%) |
| 30 to 34 Minutes | 429 (12.4%) | 355 (10.9%) |
| 35 to 39 Minutes | 94 (2.7%) | 125 (3.8%) |
| 40 to 44 Minutes | 200 (5.8%) | 284 (8.7%) |
| 45 to 59 Minutes | 315 (9.1%) | 336 (10.3%) |
| 60 to 89 Minutes | 127 (3.7%) | 22 (0.7%) |
| 90 or more Minutes | 221 (6.4%) | 56 (1.7%) |
Time of Departure to Work by Sex in Weigelstown
The most frequent times of departure to work in Weigelstown are 6:30 AM to 6:59 AM (439, 12.7%) for males and 8:00 AM to 8:29 AM (488, 15.0%) for females.
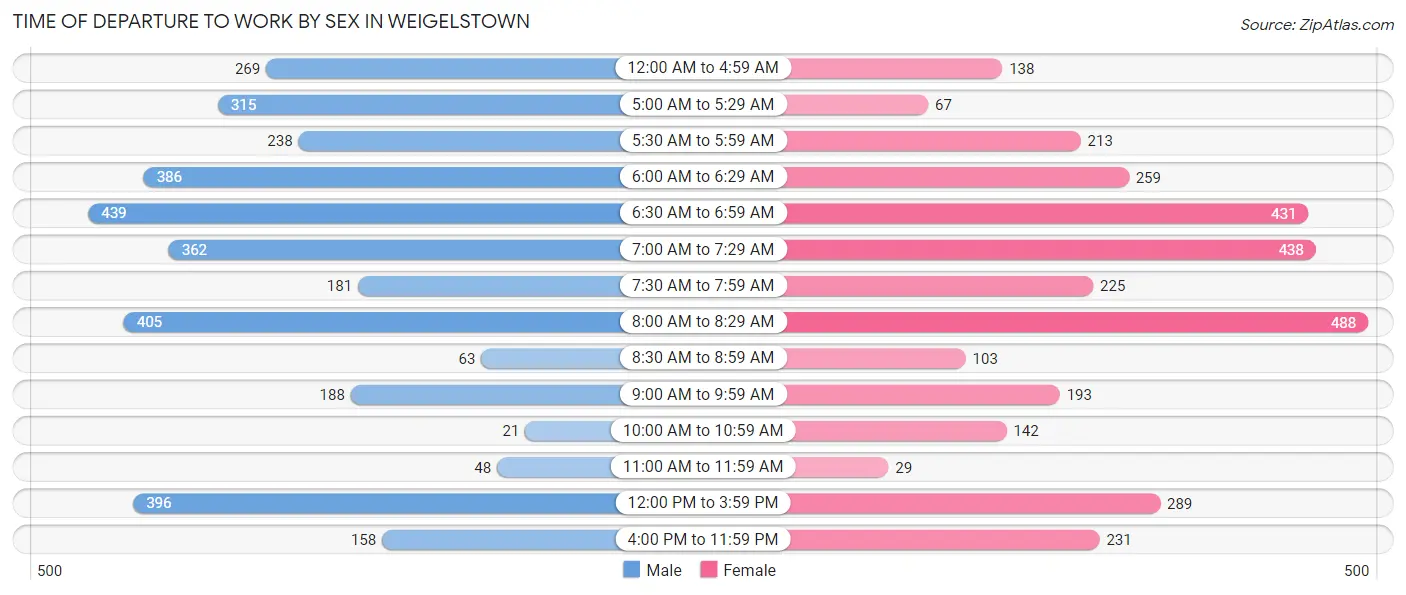
| Time of Departure | Male | Female |
| 12:00 AM to 4:59 AM | 269 (7.7%) | 138 (4.3%) |
| 5:00 AM to 5:29 AM | 315 (9.1%) | 67 (2.1%) |
| 5:30 AM to 5:59 AM | 238 (6.9%) | 213 (6.6%) |
| 6:00 AM to 6:29 AM | 386 (11.1%) | 259 (8.0%) |
| 6:30 AM to 6:59 AM | 439 (12.7%) | 431 (13.3%) |
| 7:00 AM to 7:29 AM | 362 (10.4%) | 438 (13.5%) |
| 7:30 AM to 7:59 AM | 181 (5.2%) | 225 (6.9%) |
| 8:00 AM to 8:29 AM | 405 (11.7%) | 488 (15.0%) |
| 8:30 AM to 8:59 AM | 63 (1.8%) | 103 (3.2%) |
| 9:00 AM to 9:59 AM | 188 (5.4%) | 193 (5.9%) |
| 10:00 AM to 10:59 AM | 21 (0.6%) | 142 (4.4%) |
| 11:00 AM to 11:59 AM | 48 (1.4%) | 29 (0.9%) |
| 12:00 PM to 3:59 PM | 396 (11.4%) | 289 (8.9%) |
| 4:00 PM to 11:59 PM | 158 (4.5%) | 231 (7.1%) |
| Total | 3,469 (100.0%) | 3,246 (100.0%) |
Housing Occupancy in Weigelstown
Occupancy by Ownership in Weigelstown
Of the total 6,376 dwellings in Weigelstown, owner-occupied units account for 5,398 (84.7%), while renter-occupied units make up 978 (15.3%).
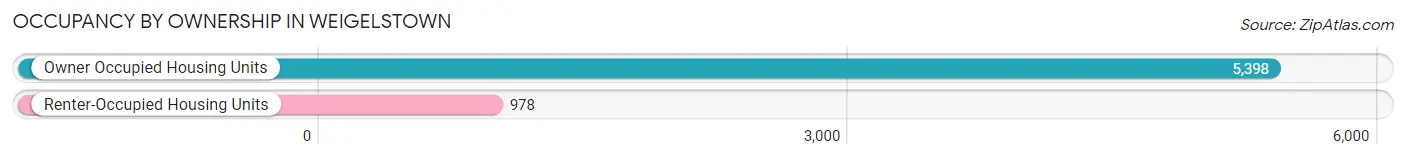
| Occupancy | # Housing Units | % Housing Units |
| Owner Occupied Housing Units | 5,398 | 84.7% |
| Renter-Occupied Housing Units | 978 | 15.3% |
| Total Occupied Housing Units | 6,376 | 100.0% |
Occupancy by Household Size in Weigelstown
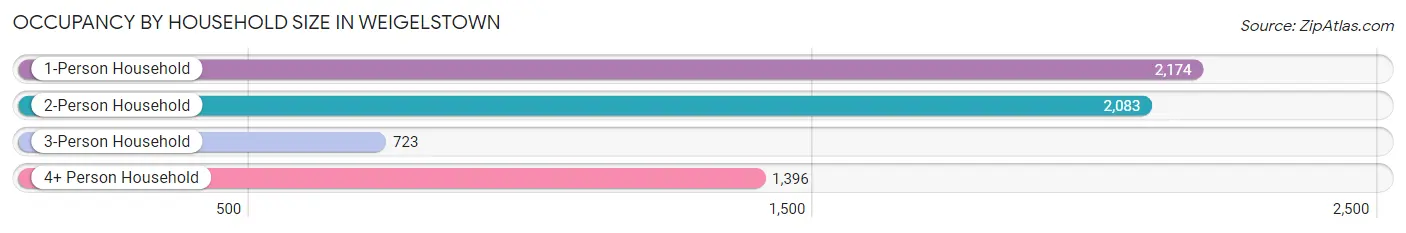
| Household Size | # Housing Units | % Housing Units |
| 1-Person Household | 2,174 | 34.1% |
| 2-Person Household | 2,083 | 32.7% |
| 3-Person Household | 723 | 11.3% |
| 4+ Person Household | 1,396 | 21.9% |
| Total Housing Units | 6,376 | 100.0% |
Occupancy by Ownership by Household Size in Weigelstown
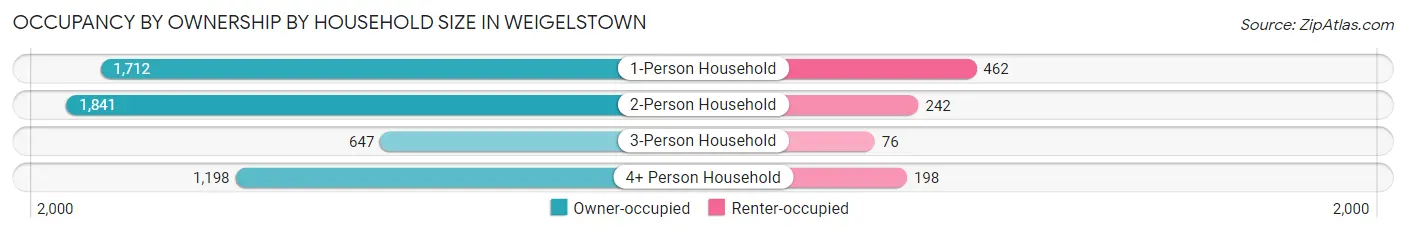
| Household Size | Owner-occupied | Renter-occupied |
| 1-Person Household | 1,712 (78.7%) | 462 (21.2%) |
| 2-Person Household | 1,841 (88.4%) | 242 (11.6%) |
| 3-Person Household | 647 (89.5%) | 76 (10.5%) |
| 4+ Person Household | 1,198 (85.8%) | 198 (14.2%) |
| Total Housing Units | 5,398 (84.7%) | 978 (15.3%) |
Occupancy by Educational Attainment in Weigelstown
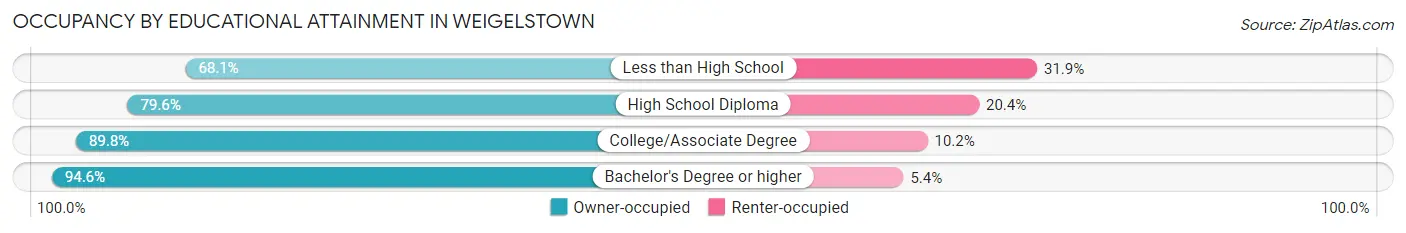
| Household Size | Owner-occupied | Renter-occupied |
| Less than High School | 286 (68.1%) | 134 (31.9%) |
| High School Diploma | 2,236 (79.6%) | 573 (20.4%) |
| College/Associate Degree | 1,897 (89.8%) | 215 (10.2%) |
| Bachelor's Degree or higher | 979 (94.6%) | 56 (5.4%) |
Occupancy by Age of Householder in Weigelstown
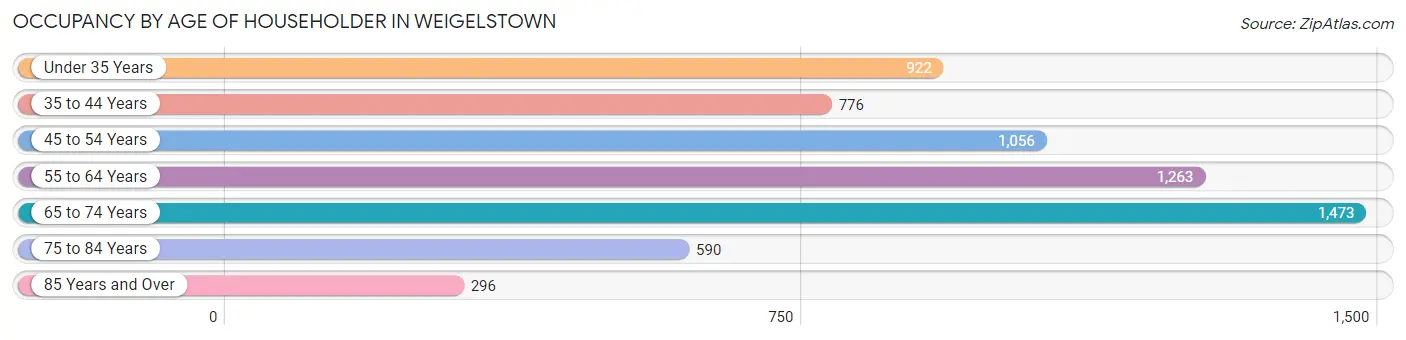
| Age Bracket | # Households | % Households |
| Under 35 Years | 922 | 14.5% |
| 35 to 44 Years | 776 | 12.2% |
| 45 to 54 Years | 1,056 | 16.6% |
| 55 to 64 Years | 1,263 | 19.8% |
| 65 to 74 Years | 1,473 | 23.1% |
| 75 to 84 Years | 590 | 9.2% |
| 85 Years and Over | 296 | 4.6% |
| Total | 6,376 | 100.0% |
Housing Finances in Weigelstown
Median Income by Occupancy in Weigelstown
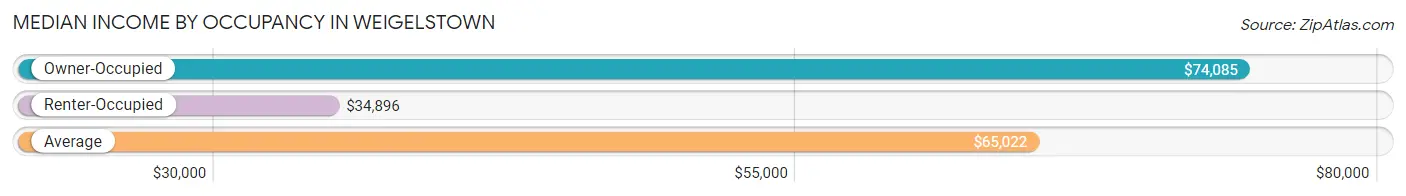
| Occupancy Type | # Households | Median Income |
| Owner-Occupied | 5,398 (84.7%) | $74,085 |
| Renter-Occupied | 978 (15.3%) | $34,896 |
| Average | 6,376 (100.0%) | $65,022 |
Occupancy by Householder Income Bracket in Weigelstown
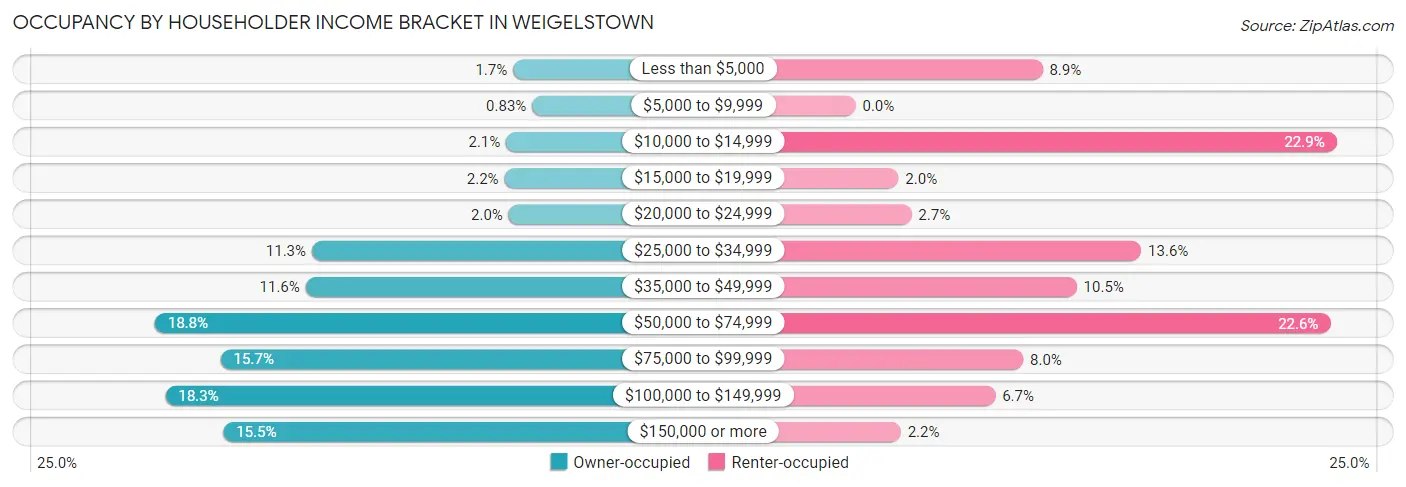
| Income Bracket | Owner-occupied | Renter-occupied |
| Less than $5,000 | 94 (1.7%) | 87 (8.9%) |
| $5,000 to $9,999 | 45 (0.8%) | 0 (0.0%) |
| $10,000 to $14,999 | 112 (2.1%) | 224 (22.9%) |
| $15,000 to $19,999 | 116 (2.1%) | 20 (2.0%) |
| $20,000 to $24,999 | 105 (1.9%) | 26 (2.7%) |
| $25,000 to $34,999 | 611 (11.3%) | 133 (13.6%) |
| $35,000 to $49,999 | 627 (11.6%) | 103 (10.5%) |
| $50,000 to $74,999 | 1,015 (18.8%) | 221 (22.6%) |
| $75,000 to $99,999 | 846 (15.7%) | 78 (8.0%) |
| $100,000 to $149,999 | 988 (18.3%) | 65 (6.7%) |
| $150,000 or more | 839 (15.5%) | 21 (2.1%) |
| Total | 5,398 (100.0%) | 978 (100.0%) |
Monthly Housing Cost Tiers in Weigelstown
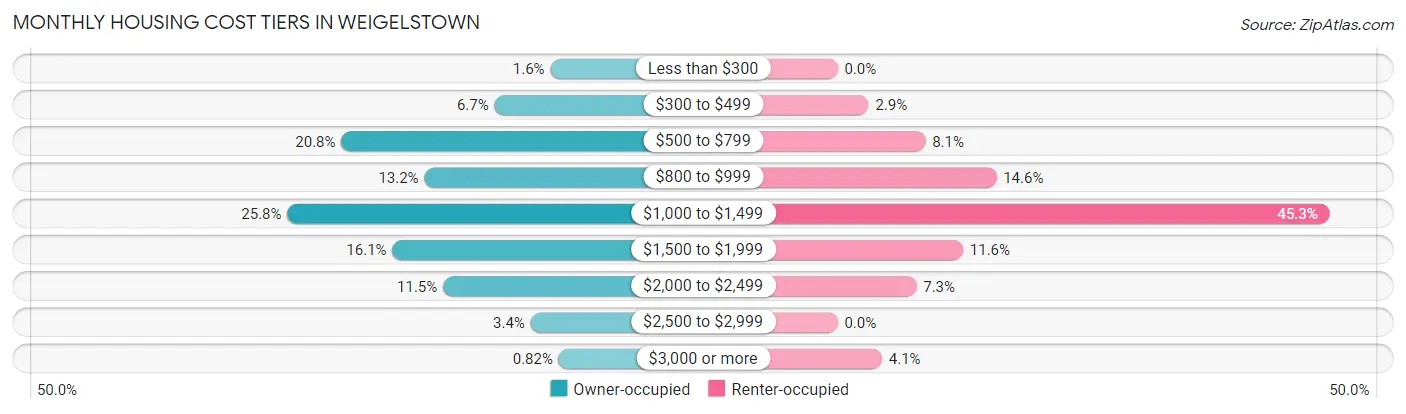
| Monthly Cost | Owner-occupied | Renter-occupied |
| Less than $300 | 86 (1.6%) | 0 (0.0%) |
| $300 to $499 | 364 (6.7%) | 28 (2.9%) |
| $500 to $799 | 1,125 (20.8%) | 79 (8.1%) |
| $800 to $999 | 712 (13.2%) | 143 (14.6%) |
| $1,000 to $1,499 | 1,393 (25.8%) | 443 (45.3%) |
| $1,500 to $1,999 | 871 (16.1%) | 113 (11.6%) |
| $2,000 to $2,499 | 619 (11.5%) | 71 (7.3%) |
| $2,500 to $2,999 | 184 (3.4%) | 0 (0.0%) |
| $3,000 or more | 44 (0.8%) | 40 (4.1%) |
| Total | 5,398 (100.0%) | 978 (100.0%) |
Physical Housing Characteristics in Weigelstown
Housing Structures in Weigelstown
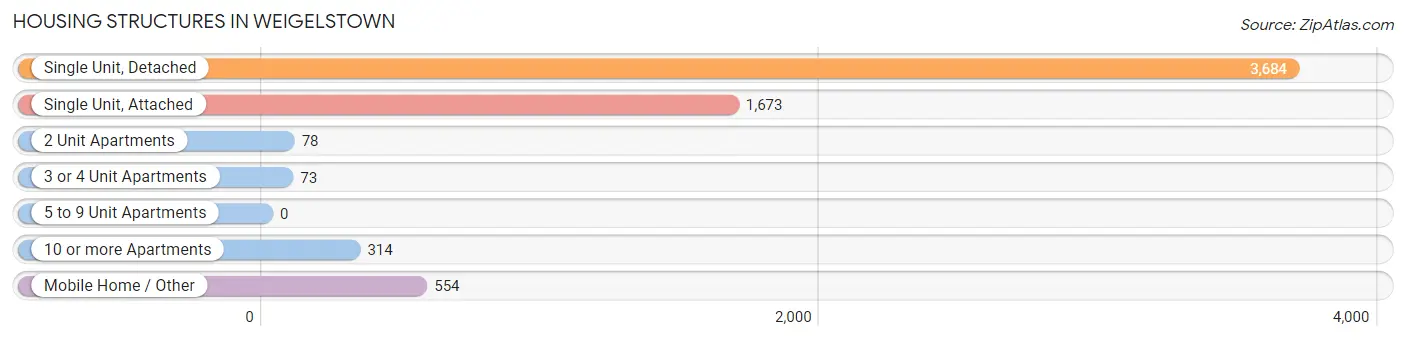
| Structure Type | # Housing Units | % Housing Units |
| Single Unit, Detached | 3,684 | 57.8% |
| Single Unit, Attached | 1,673 | 26.2% |
| 2 Unit Apartments | 78 | 1.2% |
| 3 or 4 Unit Apartments | 73 | 1.1% |
| 5 to 9 Unit Apartments | 0 | 0.0% |
| 10 or more Apartments | 314 | 4.9% |
| Mobile Home / Other | 554 | 8.7% |
| Total | 6,376 | 100.0% |
Housing Structures by Occupancy in Weigelstown
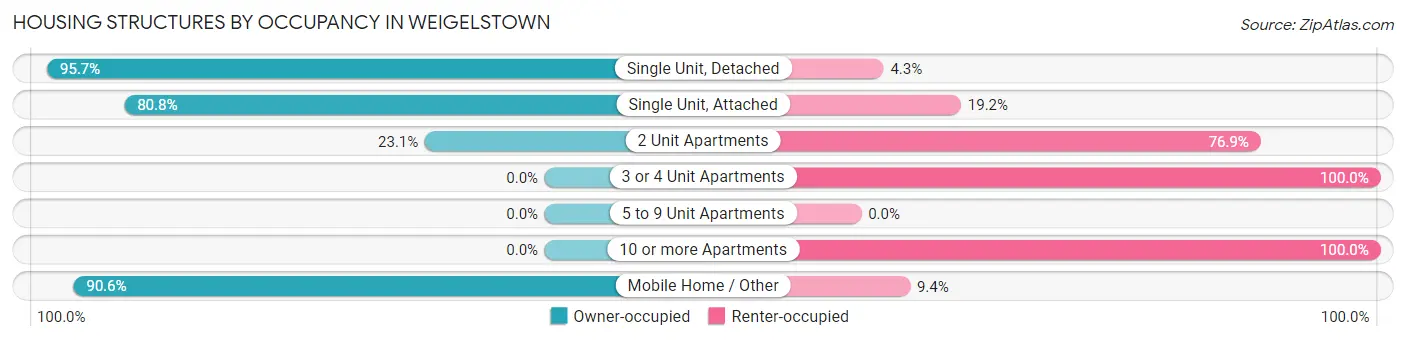
| Structure Type | Owner-occupied | Renter-occupied |
| Single Unit, Detached | 3,526 (95.7%) | 158 (4.3%) |
| Single Unit, Attached | 1,352 (80.8%) | 321 (19.2%) |
| 2 Unit Apartments | 18 (23.1%) | 60 (76.9%) |
| 3 or 4 Unit Apartments | 0 (0.0%) | 73 (100.0%) |
| 5 to 9 Unit Apartments | 0 (0.0%) | 0 (0.0%) |
| 10 or more Apartments | 0 (0.0%) | 314 (100.0%) |
| Mobile Home / Other | 502 (90.6%) | 52 (9.4%) |
| Total | 5,398 (84.7%) | 978 (15.3%) |
Housing Structures by Number of Rooms in Weigelstown
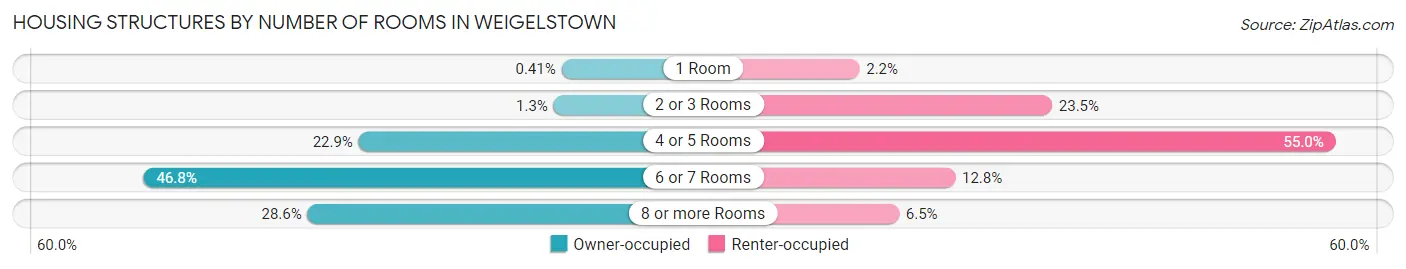
| Number of Rooms | Owner-occupied | Renter-occupied |
| 1 Room | 22 (0.4%) | 21 (2.1%) |
| 2 or 3 Rooms | 69 (1.3%) | 230 (23.5%) |
| 4 or 5 Rooms | 1,237 (22.9%) | 538 (55.0%) |
| 6 or 7 Rooms | 2,526 (46.8%) | 125 (12.8%) |
| 8 or more Rooms | 1,544 (28.6%) | 64 (6.5%) |
| Total | 5,398 (100.0%) | 978 (100.0%) |
Housing Structure by Heating Type in Weigelstown
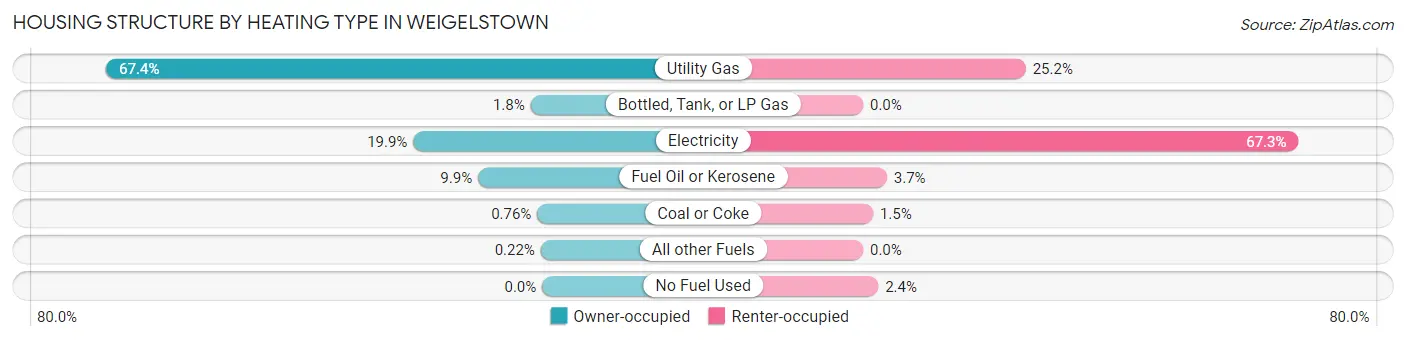
| Heating Type | Owner-occupied | Renter-occupied |
| Utility Gas | 3,638 (67.4%) | 246 (25.2%) |
| Bottled, Tank, or LP Gas | 96 (1.8%) | 0 (0.0%) |
| Electricity | 1,076 (19.9%) | 658 (67.3%) |
| Fuel Oil or Kerosene | 535 (9.9%) | 36 (3.7%) |
| Coal or Coke | 41 (0.8%) | 15 (1.5%) |
| All other Fuels | 12 (0.2%) | 0 (0.0%) |
| No Fuel Used | 0 (0.0%) | 23 (2.4%) |
| Total | 5,398 (100.0%) | 978 (100.0%) |
Household Vehicle Usage in Weigelstown
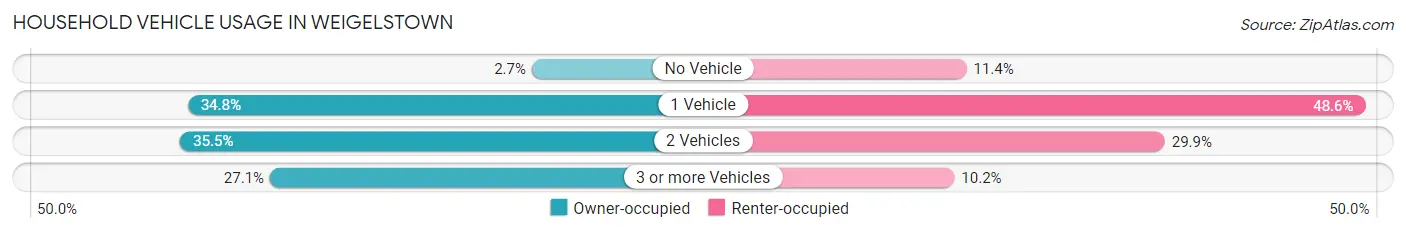
| Vehicles per Household | Owner-occupied | Renter-occupied |
| No Vehicle | 143 (2.6%) | 111 (11.4%) |
| 1 Vehicle | 1,877 (34.8%) | 475 (48.6%) |
| 2 Vehicles | 1,915 (35.5%) | 292 (29.9%) |
| 3 or more Vehicles | 1,463 (27.1%) | 100 (10.2%) |
| Total | 5,398 (100.0%) | 978 (100.0%) |
Real Estate & Mortgages in Weigelstown
Real Estate and Mortgage Overview in Weigelstown
| Characteristic | Without Mortgage | With Mortgage |
| Housing Units | 2,205 | 3,193 |
| Median Property Value | $169,400 | $209,200 |
| Median Household Income | $48,017 | $680 |
| Monthly Housing Costs | $660 | $44 |
| Real Estate Taxes | $3,395 | $41 |
Property Value by Mortgage Status in Weigelstown
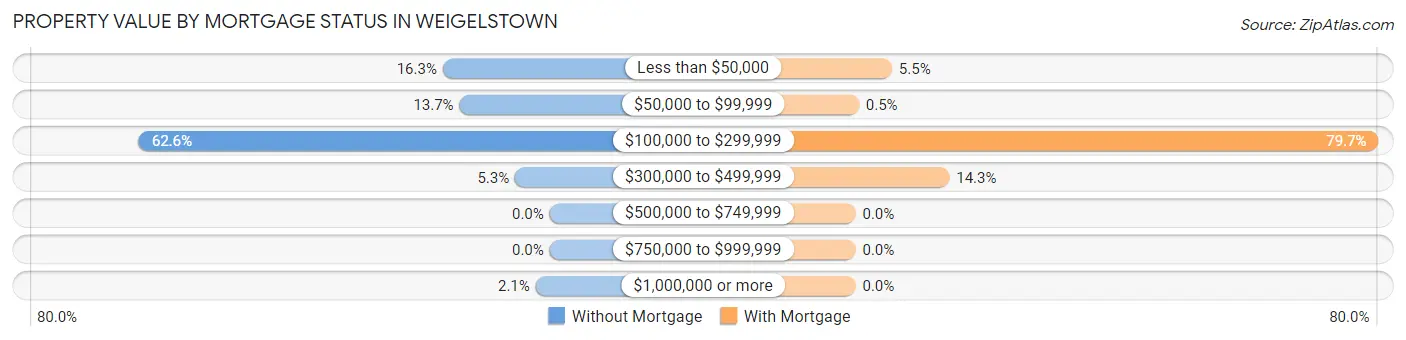
| Property Value | Without Mortgage | With Mortgage |
| Less than $50,000 | 359 (16.3%) | 177 (5.5%) |
| $50,000 to $99,999 | 303 (13.7%) | 16 (0.5%) |
| $100,000 to $299,999 | 1,380 (62.6%) | 2,544 (79.7%) |
| $300,000 to $499,999 | 116 (5.3%) | 456 (14.3%) |
| $500,000 to $749,999 | 0 (0.0%) | 0 (0.0%) |
| $750,000 to $999,999 | 0 (0.0%) | 0 (0.0%) |
| $1,000,000 or more | 47 (2.1%) | 0 (0.0%) |
| Total | 2,205 (100.0%) | 3,193 (100.0%) |
Household Income by Mortgage Status in Weigelstown
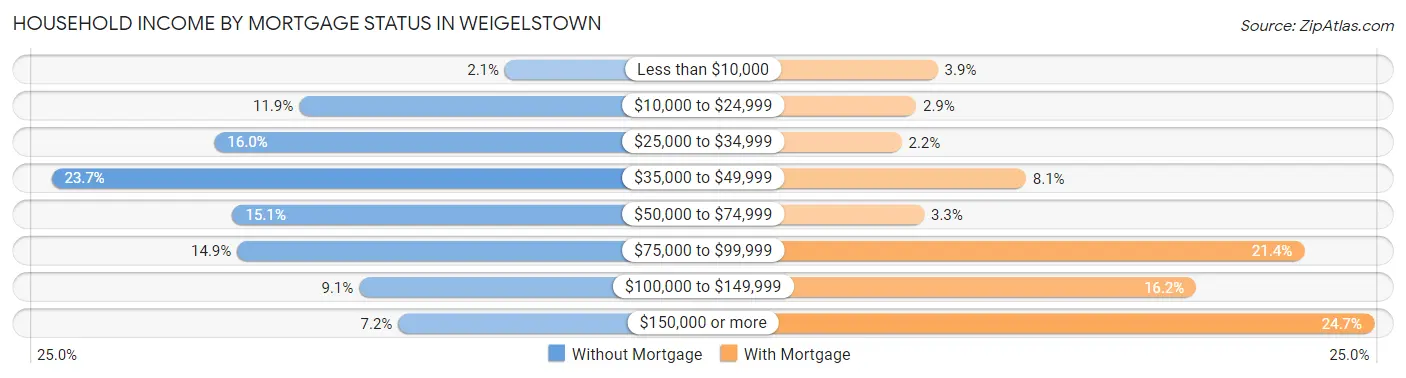
| Household Income | Without Mortgage | With Mortgage |
| Less than $10,000 | 47 (2.1%) | 125 (3.9%) |
| $10,000 to $24,999 | 263 (11.9%) | 92 (2.9%) |
| $25,000 to $34,999 | 352 (16.0%) | 70 (2.2%) |
| $35,000 to $49,999 | 523 (23.7%) | 259 (8.1%) |
| $50,000 to $74,999 | 333 (15.1%) | 104 (3.3%) |
| $75,000 to $99,999 | 328 (14.9%) | 682 (21.4%) |
| $100,000 to $149,999 | 200 (9.1%) | 518 (16.2%) |
| $150,000 or more | 159 (7.2%) | 788 (24.7%) |
| Total | 2,205 (100.0%) | 3,193 (100.0%) |
Property Value to Household Income Ratio in Weigelstown
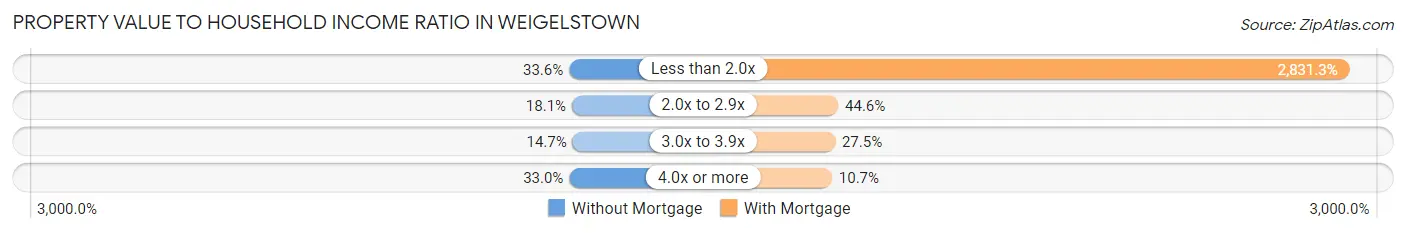
| Value-to-Income Ratio | Without Mortgage | With Mortgage |
| Less than 2.0x | 741 (33.6%) | 90,404 (2,831.3%) |
| 2.0x to 2.9x | 399 (18.1%) | 1,425 (44.6%) |
| 3.0x to 3.9x | 323 (14.6%) | 878 (27.5%) |
| 4.0x or more | 727 (33.0%) | 343 (10.7%) |
| Total | 2,205 (100.0%) | 3,193 (100.0%) |
Real Estate Taxes by Mortgage Status in Weigelstown
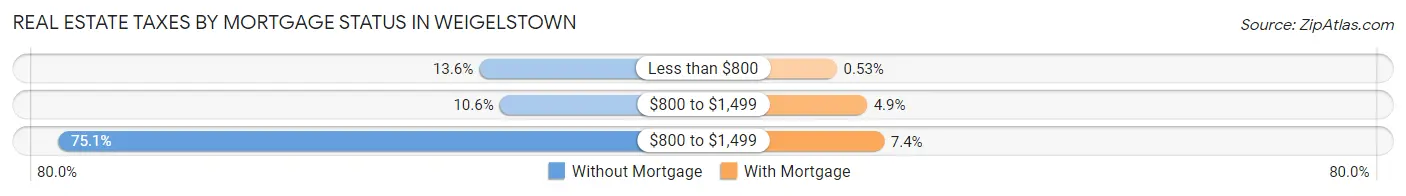
| Property Taxes | Without Mortgage | With Mortgage |
| Less than $800 | 300 (13.6%) | 17 (0.5%) |
| $800 to $1,499 | 234 (10.6%) | 157 (4.9%) |
| $800 to $1,499 | 1,656 (75.1%) | 237 (7.4%) |
| Total | 2,205 (100.0%) | 3,193 (100.0%) |
Health & Disability in Weigelstown
Health Insurance Coverage by Age in Weigelstown
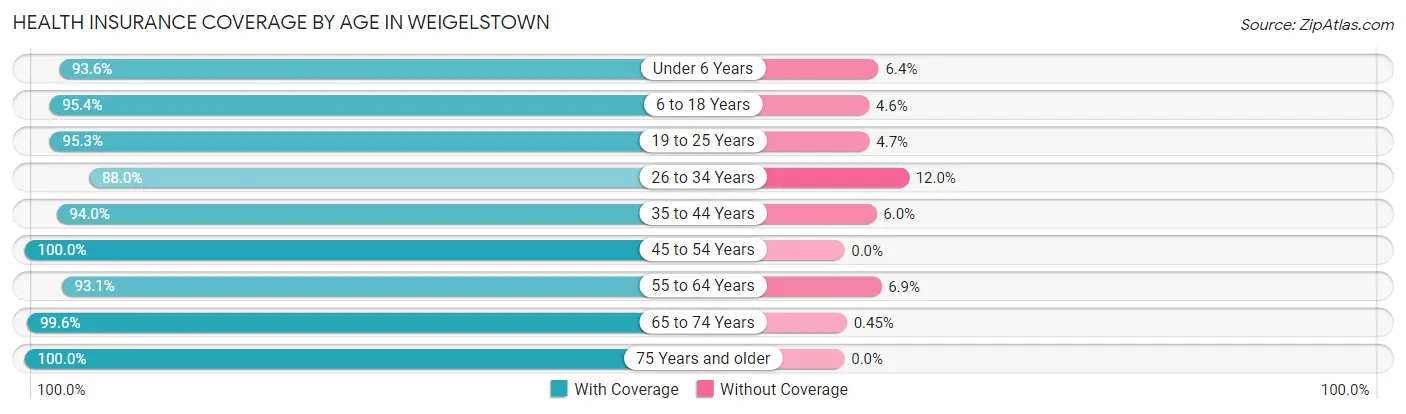
| Age Bracket | With Coverage | Without Coverage |
| Under 6 Years | 1,095 (93.6%) | 75 (6.4%) |
| 6 to 18 Years | 2,289 (95.4%) | 110 (4.6%) |
| 19 to 25 Years | 899 (95.3%) | 44 (4.7%) |
| 26 to 34 Years | 1,378 (88.0%) | 188 (12.0%) |
| 35 to 44 Years | 1,558 (94.0%) | 99 (6.0%) |
| 45 to 54 Years | 1,631 (100.0%) | 0 (0.0%) |
| 55 to 64 Years | 1,950 (93.1%) | 144 (6.9%) |
| 65 to 74 Years | 2,215 (99.6%) | 10 (0.4%) |
| 75 Years and older | 1,246 (100.0%) | 0 (0.0%) |
| Total | 14,261 (95.5%) | 670 (4.5%) |
Health Insurance Coverage by Citizenship Status in Weigelstown
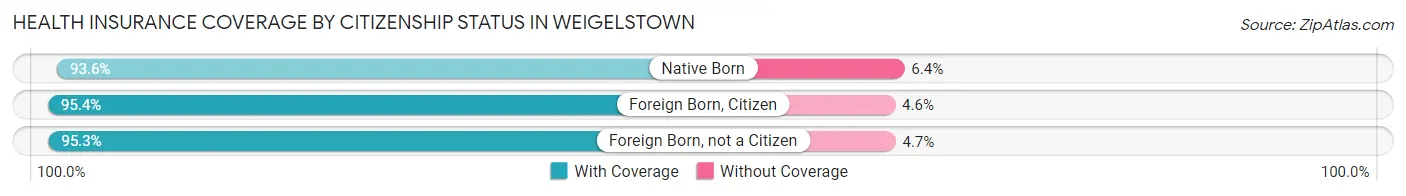
| Citizenship Status | With Coverage | Without Coverage |
| Native Born | 1,095 (93.6%) | 75 (6.4%) |
| Foreign Born, Citizen | 2,289 (95.4%) | 110 (4.6%) |
| Foreign Born, not a Citizen | 899 (95.3%) | 44 (4.7%) |
Health Insurance Coverage by Household Income in Weigelstown
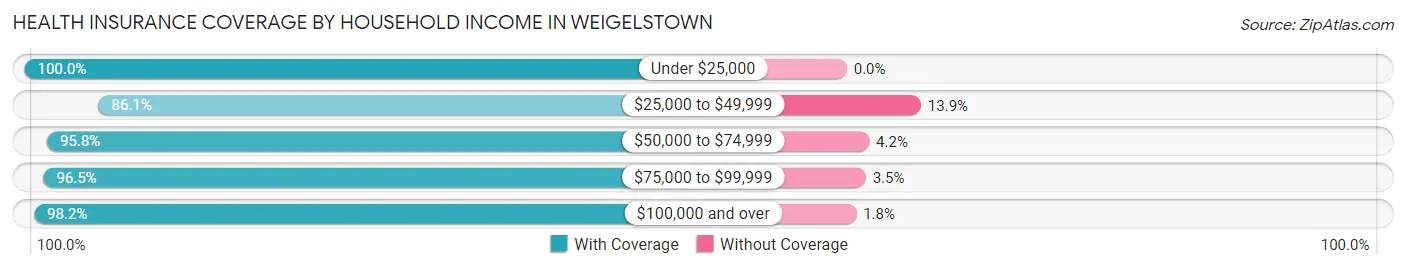
| Household Income | With Coverage | Without Coverage |
| Under $25,000 | 1,013 (100.0%) | 0 (0.0%) |
| $25,000 to $49,999 | 2,177 (86.1%) | 351 (13.9%) |
| $50,000 to $74,999 | 2,952 (95.8%) | 129 (4.2%) |
| $75,000 to $99,999 | 2,177 (96.5%) | 80 (3.5%) |
| $100,000 and over | 5,928 (98.2%) | 107 (1.8%) |
Public vs Private Health Insurance Coverage by Age in Weigelstown
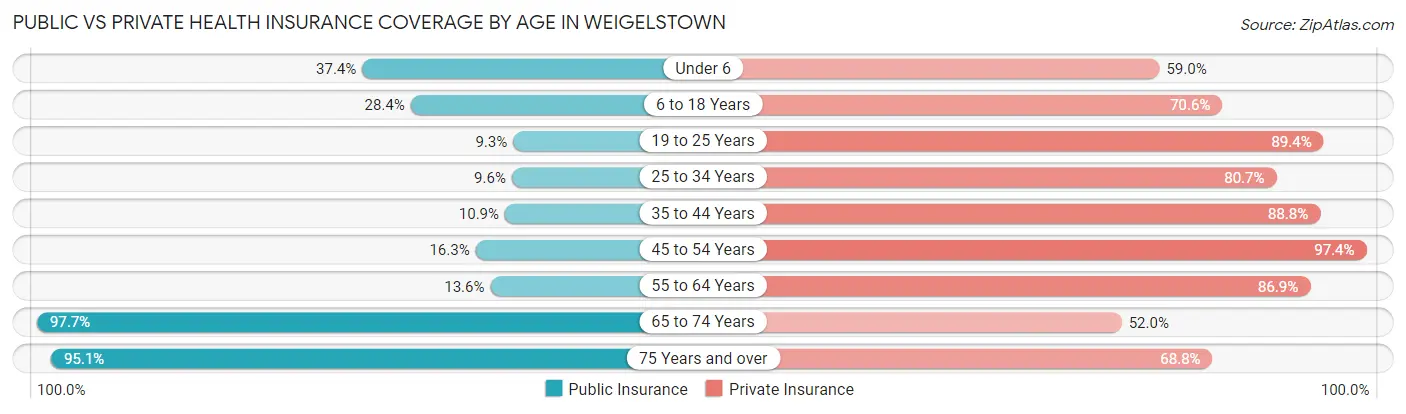
| Age Bracket | Public Insurance | Private Insurance |
| Under 6 | 437 (37.3%) | 690 (59.0%) |
| 6 to 18 Years | 680 (28.3%) | 1,694 (70.6%) |
| 19 to 25 Years | 88 (9.3%) | 843 (89.4%) |
| 25 to 34 Years | 150 (9.6%) | 1,263 (80.6%) |
| 35 to 44 Years | 180 (10.9%) | 1,471 (88.8%) |
| 45 to 54 Years | 266 (16.3%) | 1,588 (97.4%) |
| 55 to 64 Years | 284 (13.6%) | 1,820 (86.9%) |
| 65 to 74 Years | 2,174 (97.7%) | 1,156 (52.0%) |
| 75 Years and over | 1,185 (95.1%) | 857 (68.8%) |
| Total | 5,444 (36.5%) | 11,382 (76.2%) |
Disability Status by Sex by Age in Weigelstown
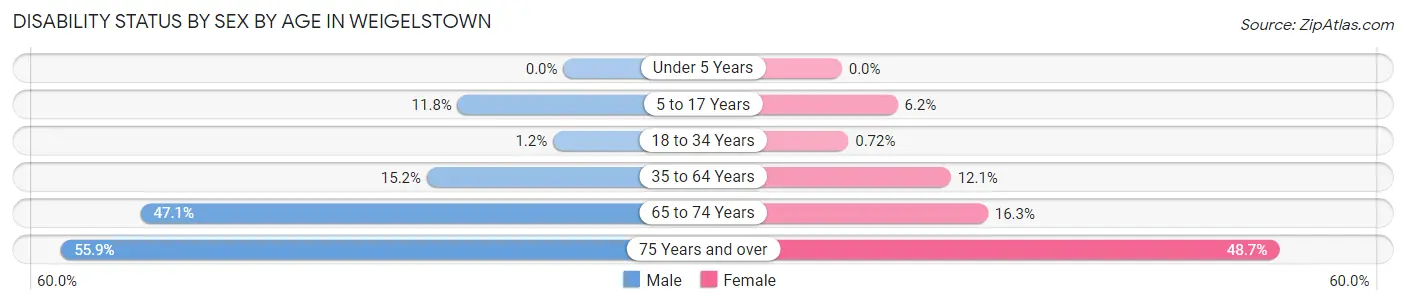
| Age Bracket | Male | Female |
| Under 5 Years | 0 (0.0%) | 0 (0.0%) |
| 5 to 17 Years | 111 (11.8%) | 93 (6.2%) |
| 18 to 34 Years | 14 (1.1%) | 10 (0.7%) |
| 35 to 64 Years | 412 (15.2%) | 324 (12.1%) |
| 65 to 74 Years | 370 (47.1%) | 234 (16.3%) |
| 75 Years and over | 203 (55.9%) | 430 (48.7%) |
Disability Class by Sex by Age in Weigelstown
Disability Class: Hearing Difficulty
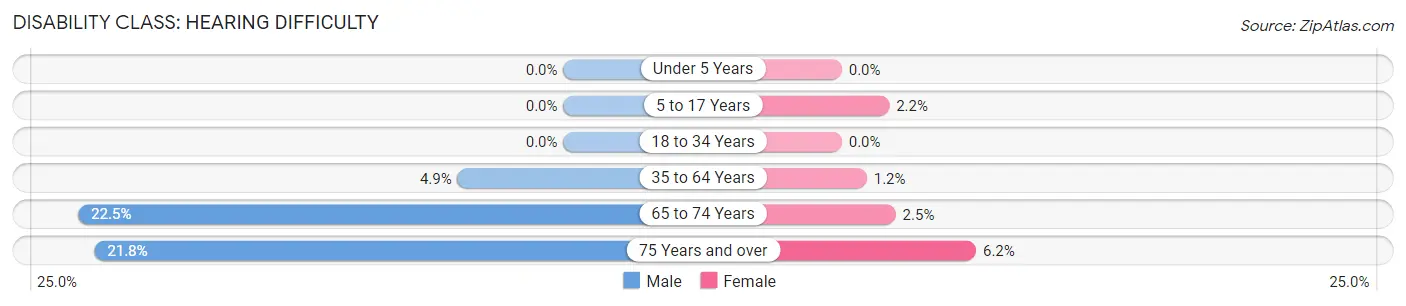
| Age Bracket | Male | Female |
| Under 5 Years | 0 (0.0%) | 0 (0.0%) |
| 5 to 17 Years | 0 (0.0%) | 33 (2.2%) |
| 18 to 34 Years | 0 (0.0%) | 0 (0.0%) |
| 35 to 64 Years | 133 (4.9%) | 31 (1.2%) |
| 65 to 74 Years | 177 (22.5%) | 36 (2.5%) |
| 75 Years and over | 79 (21.8%) | 55 (6.2%) |
Disability Class: Vision Difficulty
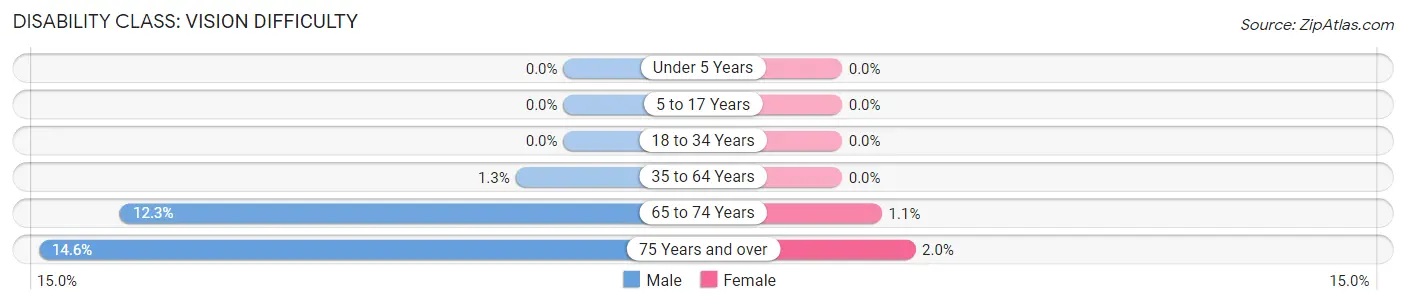
| Age Bracket | Male | Female |
| Under 5 Years | 0 (0.0%) | 0 (0.0%) |
| 5 to 17 Years | 0 (0.0%) | 0 (0.0%) |
| 18 to 34 Years | 0 (0.0%) | 0 (0.0%) |
| 35 to 64 Years | 36 (1.3%) | 0 (0.0%) |
| 65 to 74 Years | 97 (12.3%) | 16 (1.1%) |
| 75 Years and over | 53 (14.6%) | 18 (2.0%) |
Disability Class: Cognitive Difficulty
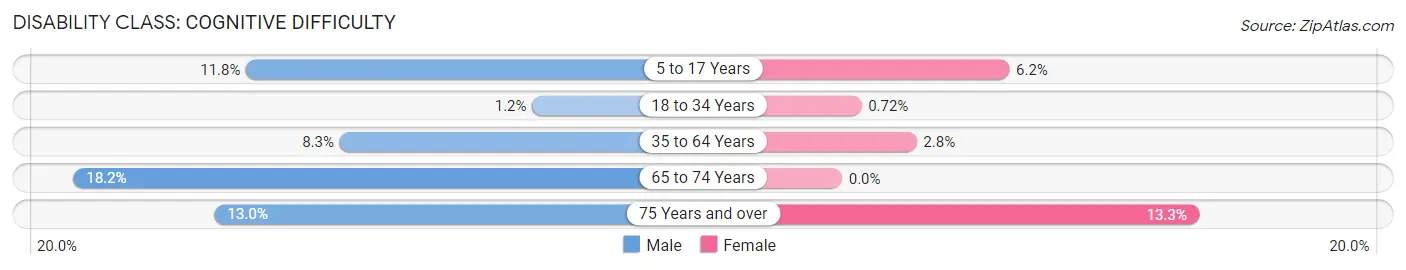
| Age Bracket | Male | Female |
| 5 to 17 Years | 111 (11.8%) | 93 (6.2%) |
| 18 to 34 Years | 14 (1.1%) | 10 (0.7%) |
| 35 to 64 Years | 225 (8.3%) | 74 (2.8%) |
| 65 to 74 Years | 143 (18.2%) | 0 (0.0%) |
| 75 Years and over | 47 (13.0%) | 117 (13.3%) |
Disability Class: Ambulatory Difficulty
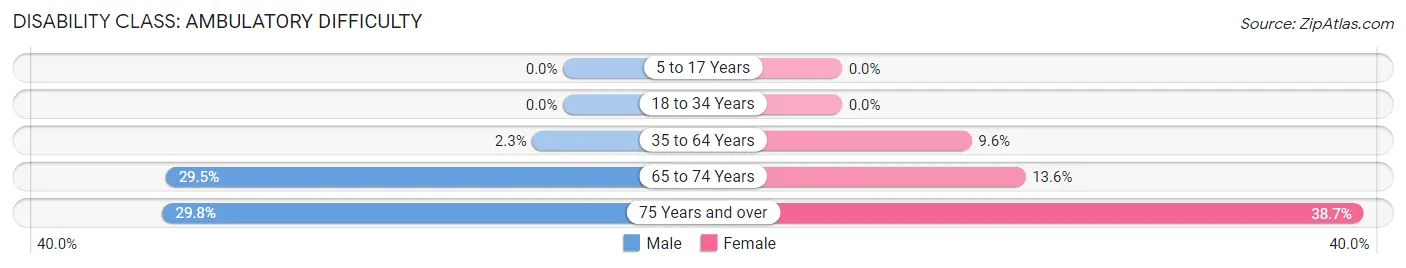
| Age Bracket | Male | Female |
| 5 to 17 Years | 0 (0.0%) | 0 (0.0%) |
| 18 to 34 Years | 0 (0.0%) | 0 (0.0%) |
| 35 to 64 Years | 62 (2.3%) | 257 (9.6%) |
| 65 to 74 Years | 232 (29.5%) | 196 (13.6%) |
| 75 Years and over | 108 (29.7%) | 342 (38.7%) |
Disability Class: Self-Care Difficulty
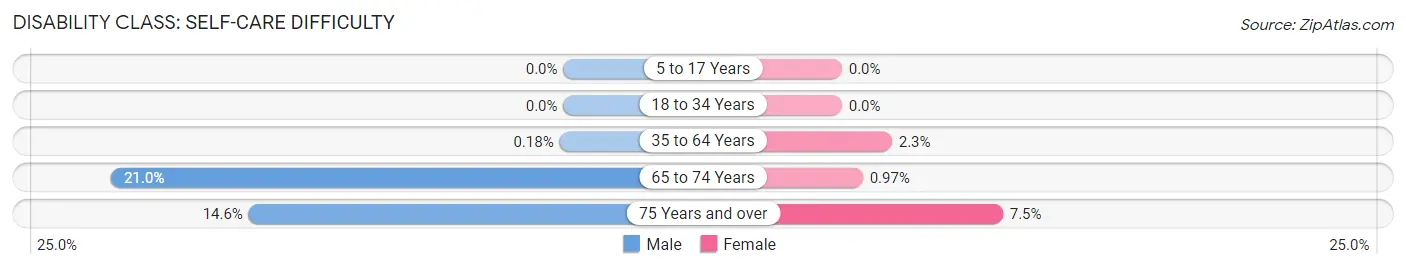
| Age Bracket | Male | Female |
| 5 to 17 Years | 0 (0.0%) | 0 (0.0%) |
| 18 to 34 Years | 0 (0.0%) | 0 (0.0%) |
| 35 to 64 Years | 5 (0.2%) | 62 (2.3%) |
| 65 to 74 Years | 165 (21.0%) | 14 (1.0%) |
| 75 Years and over | 53 (14.6%) | 66 (7.5%) |
Technology Access in Weigelstown
Computing Device Access in Weigelstown
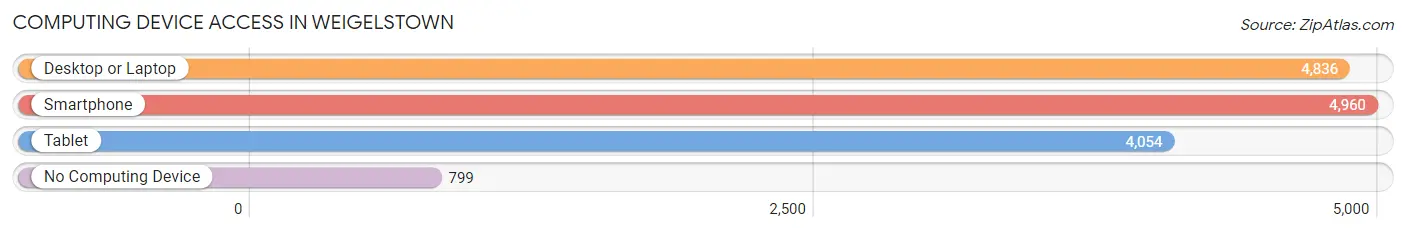
| Device Type | # Households | % Households |
| Desktop or Laptop | 4,836 | 75.8% |
| Smartphone | 4,960 | 77.8% |
| Tablet | 4,054 | 63.6% |
| No Computing Device | 799 | 12.5% |
| Total | 6,376 | 100.0% |
Internet Access in Weigelstown
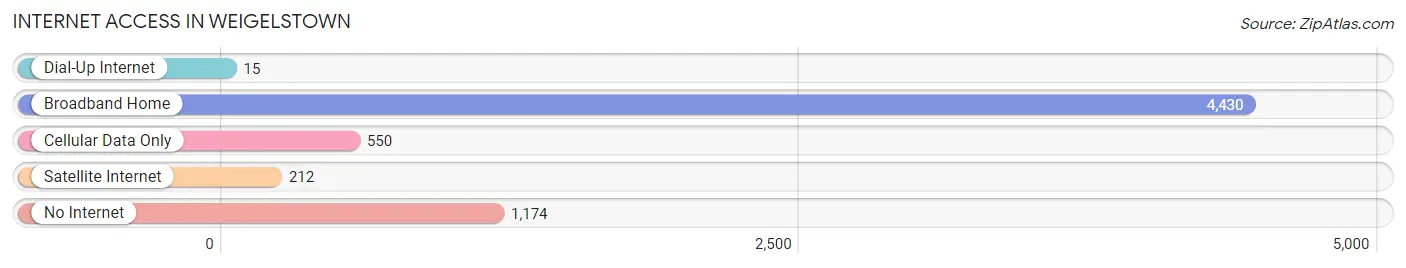
| Internet Type | # Households | % Households |
| Dial-Up Internet | 15 | 0.2% |
| Broadband Home | 4,430 | 69.5% |
| Cellular Data Only | 550 | 8.6% |
| Satellite Internet | 212 | 3.3% |
| No Internet | 1,174 | 18.4% |
| Total | 6,376 | 100.0% |
Weigelstown Summary
Weigelstown is a small unincorporated community located in the northern part of York County, Pennsylvania. It is situated along the Susquehanna River, just south of the city of York. The community is part of the York-Hanover Metropolitan Statistical Area.
History
Weigelstown was first settled in the late 1700s by German immigrants. The community was named after the Weigel family, who were among the first settlers. The Weigel family owned a large tract of land in the area, which was used for farming and other agricultural activities.
The community grew slowly over the years, and by the early 1900s, it had become a small village. The village was home to a post office, a general store, a blacksmith shop, and a few other businesses.
Geography
Weigelstown is located in northern York County, Pennsylvania. It is situated along the Susquehanna River, just south of the city of York. The community is part of the York-Hanover Metropolitan Statistical Area.
The terrain of Weigelstown is mostly flat, with some rolling hills. The area is mostly rural, with some small farms and residential areas. The climate is humid continental, with hot summers and cold winters.
Economy
The economy of Weigelstown is largely based on agriculture. The area is home to several small farms, which produce a variety of crops, including corn, soybeans, and wheat. The community also has a few small businesses, including a general store and a post office.
Demographics
As of the 2010 census, the population of Weigelstown was 1,845. The racial makeup of the community was 97.3% White, 0.9% African American, 0.3% Native American, 0.2% Asian, and 0.3% from other races. The median household income was $50,938, and the median family income was $60,938.
Conclusion
Weigelstown is a small unincorporated community located in the northern part of York County, Pennsylvania. It is situated along the Susquehanna River, just south of the city of York. The community is part of the York-Hanover Metropolitan Statistical Area. The economy of Weigelstown is largely based on agriculture, and the population of the community was 1,845 as of the 2010 census. Weigelstown is a small, rural community with a rich history and a bright future.
Common Questions
What is Per Capita Income in Weigelstown?
Per Capita income in Weigelstown is $37,548.
What is the Median Family Income in Weigelstown?
Median Family Income in Weigelstown is $85,641.
What is the Median Household income in Weigelstown?
Median Household Income in Weigelstown is $65,022.
What is Income or Wage Gap in Weigelstown?
Income or Wage Gap in Weigelstown is 32.3%.
Women in Weigelstown earn 67.7 cents for every dollar earned by a man.
What is Inequality or Gini Index in Weigelstown?
Inequality or Gini Index in Weigelstown is 0.44.
What is the Total Population of Weigelstown?
Total Population of Weigelstown is 14,960.
What is the Total Male Population of Weigelstown?
Total Male Population of Weigelstown is 6,632.
What is the Total Female Population of Weigelstown?
Total Female Population of Weigelstown is 8,328.
What is the Ratio of Males per 100 Females in Weigelstown?
There are 79.63 Males per 100 Females in Weigelstown.
What is the Ratio of Females per 100 Males in Weigelstown?
There are 125.57 Females per 100 Males in Weigelstown.
What is the Median Population Age in Weigelstown?
Median Population Age in Weigelstown is 43.2 Years.
What is the Average Family Size in Weigelstown
Average Family Size in Weigelstown is 3.0 People.
What is the Average Household Size in Weigelstown
Average Household Size in Weigelstown is 2.3 People.
How Large is the Labor Force in Weigelstown?
There are 7,634 People in the Labor Forcein in Weigelstown.
What is the Percentage of People in the Labor Force in Weigelstown?
64.4% of People are in the Labor Force in Weigelstown.
What is the Unemployment Rate in Weigelstown?
Unemployment Rate in Weigelstown is 1.5%.