Middletown borough, PA Map & Demographics
Middletown borough Overview
$30,035
PER CAPITA INCOME
$62,747
AVG FAMILY INCOME
$50,599
AVG HOUSEHOLD INCOME
17.6%
WAGE / INCOME GAP [ % ]
82.4¢/ $1
WAGE / INCOME GAP [ $ ]
0.43
INEQUALITY / GINI INDEX
9,525
TOTAL POPULATION
4,649
MALE POPULATION
4,876
FEMALE POPULATION
95.34
MALES / 100 FEMALES
104.88
FEMALES / 100 MALES
32.7
MEDIAN AGE
2.9
AVG FAMILY SIZE
2.2
AVG HOUSEHOLD SIZE
4,958
LABOR FORCE [ PEOPLE ]
64.1%
PERCENT IN LABOR FORCE
4.3%
UNEMPLOYMENT RATE
Income in Middletown borough
Income Overview in Middletown borough
Per Capita Income in Middletown borough is $30,035, while median incomes of families and households are $62,747 and $50,599 respectively.
| Characteristic | Number | Measure |
| Per Capita Income | 9,525 | $30,035 |
| Median Family Income | 2,243 | $62,747 |
| Mean Family Income | 2,243 | $78,144 |
| Median Household Income | 4,292 | $50,599 |
| Mean Household Income | 4,292 | $65,971 |
| Income Deficit | 2,243 | $0 |
| Wage / Income Gap (%) | 9,525 | 17.62% |
| Wage / Income Gap ($) | 9,525 | 82.38¢ per $1 |
| Gini / Inequality Index | 9,525 | 0.43 |
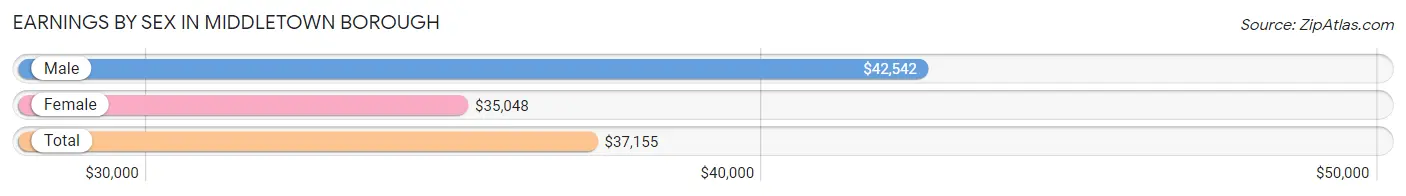
Earnings by Sex in Middletown borough
Average Earnings in Middletown borough are $37,155, $42,542 for men and $35,048 for women, a difference of 17.6%.
| Sex | Number | Average Earnings |
| Male | 2,486 (48.4%) | $42,542 |
| Female | 2,651 (51.6%) | $35,048 |
| Total | 5,137 (100.0%) | $37,155 |
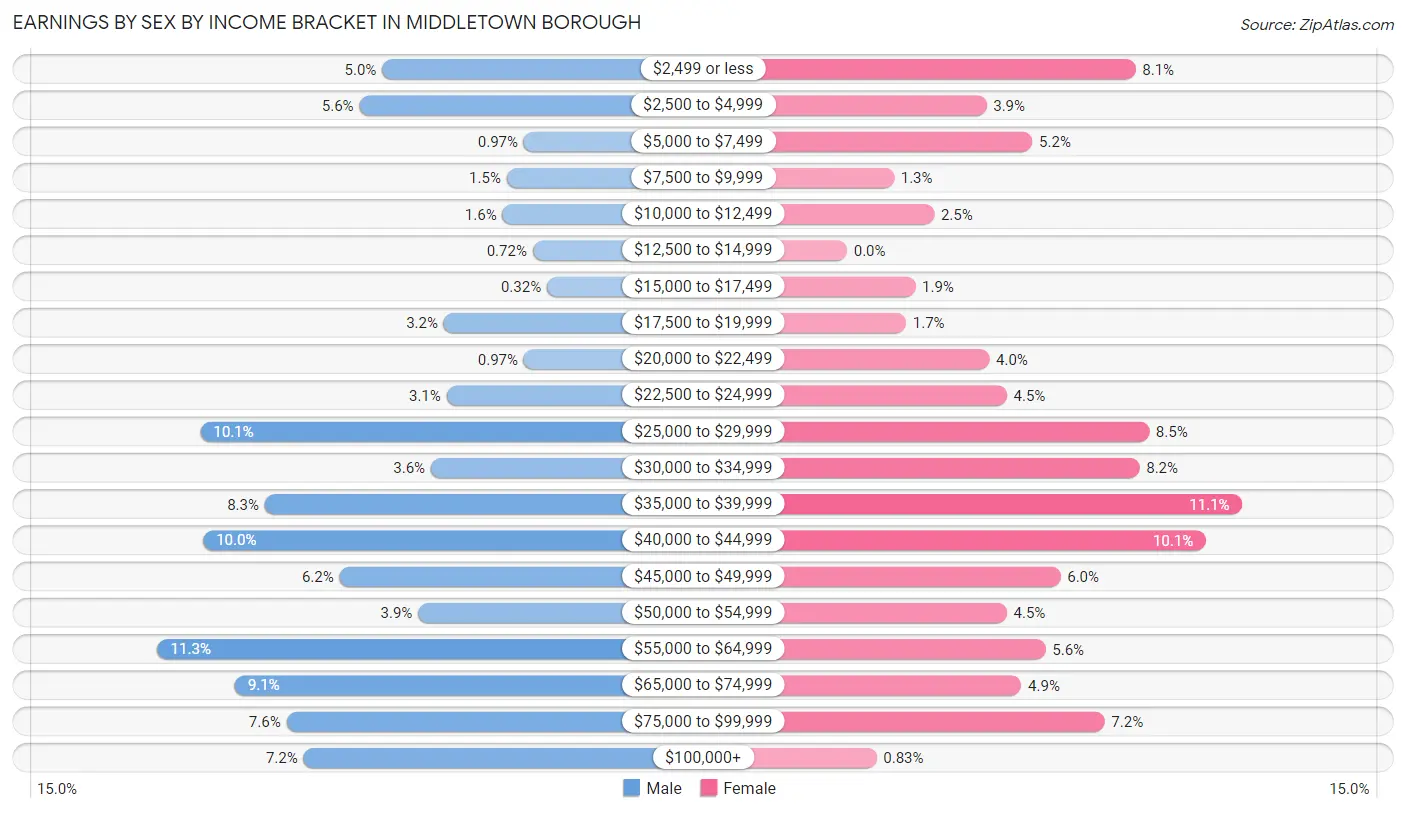
Earnings by Sex by Income Bracket in Middletown borough
The most common earnings brackets in Middletown borough are $55,000 to $64,999 for men (280 | 11.3%) and $35,000 to $39,999 for women (294 | 11.1%).
| Income | Male | Female |
| $2,499 or less | 123 (5.0%) | 215 (8.1%) |
| $2,500 to $4,999 | 139 (5.6%) | 104 (3.9%) |
| $5,000 to $7,499 | 24 (1.0%) | 138 (5.2%) |
| $7,500 to $9,999 | 36 (1.5%) | 35 (1.3%) |
| $10,000 to $12,499 | 39 (1.6%) | 65 (2.5%) |
| $12,500 to $14,999 | 18 (0.7%) | 0 (0.0%) |
| $15,000 to $17,499 | 8 (0.3%) | 51 (1.9%) |
| $17,500 to $19,999 | 80 (3.2%) | 44 (1.7%) |
| $20,000 to $22,499 | 24 (1.0%) | 106 (4.0%) |
| $22,500 to $24,999 | 78 (3.1%) | 119 (4.5%) |
| $25,000 to $29,999 | 250 (10.1%) | 225 (8.5%) |
| $30,000 to $34,999 | 89 (3.6%) | 218 (8.2%) |
| $35,000 to $39,999 | 205 (8.3%) | 294 (11.1%) |
| $40,000 to $44,999 | 248 (10.0%) | 267 (10.1%) |
| $45,000 to $49,999 | 153 (6.1%) | 159 (6.0%) |
| $50,000 to $54,999 | 98 (3.9%) | 119 (4.5%) |
| $55,000 to $64,999 | 280 (11.3%) | 148 (5.6%) |
| $65,000 to $74,999 | 226 (9.1%) | 130 (4.9%) |
| $75,000 to $99,999 | 190 (7.6%) | 192 (7.2%) |
| $100,000+ | 178 (7.2%) | 22 (0.8%) |
| Total | 2,486 (100.0%) | 2,651 (100.0%) |
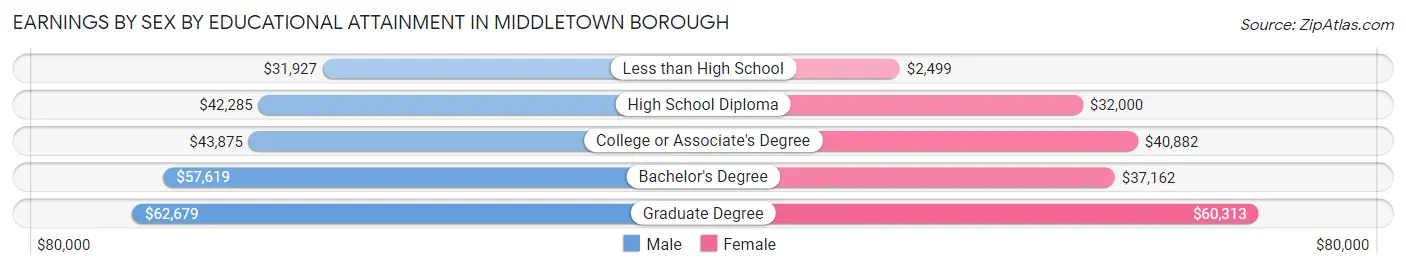
Earnings by Sex by Educational Attainment in Middletown borough
Average earnings in Middletown borough are $45,613 for men and $36,703 for women, a difference of 19.5%. Men with an educational attainment of graduate degree enjoy the highest average annual earnings of $62,679, while those with less than high school education earn the least with $31,927. Women with an educational attainment of graduate degree earn the most with the average annual earnings of $60,313, while those with less than high school education have the smallest earnings of $2,499.
| Educational Attainment | Male Income | Female Income |
| Less than High School | $31,927 | $2,499 |
| High School Diploma | $42,285 | $32,000 |
| College or Associate's Degree | $43,875 | $40,882 |
| Bachelor's Degree | $57,619 | $37,162 |
| Graduate Degree | $62,679 | $60,313 |
| Total | $45,613 | $36,703 |
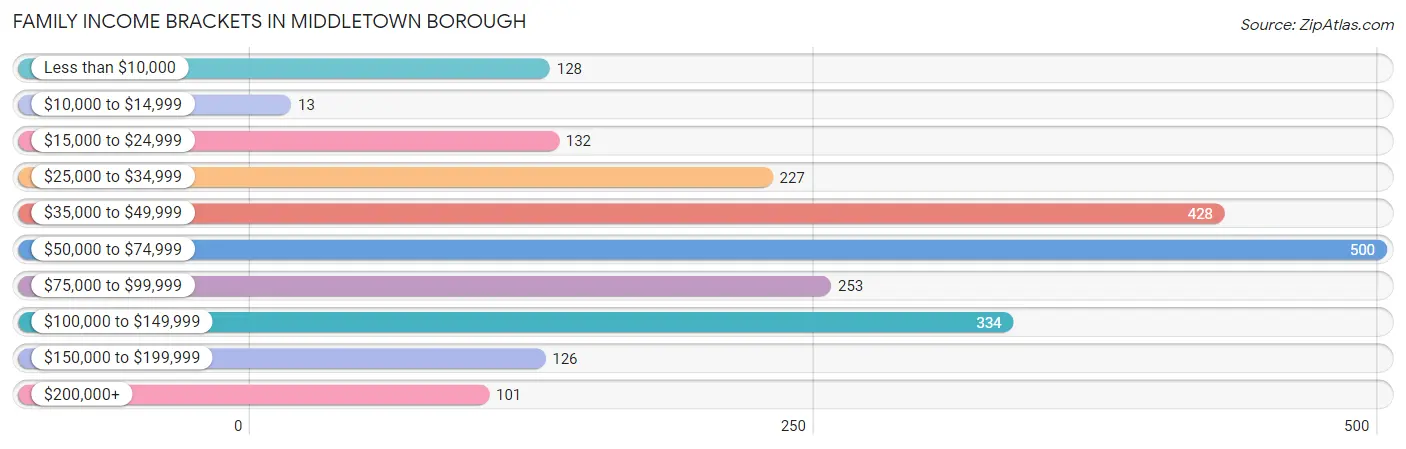
Family Income in Middletown borough
Family Income Brackets in Middletown borough
According to the Middletown borough family income data, there are 500 families falling into the $50,000 to $74,999 income range, which is the most common income bracket and makes up 22.3% of all families. Conversely, the $10,000 to $14,999 income bracket is the least frequent group with only 13 families (0.6%) belonging to this category.
| Income Bracket | # Families | % Families |
| Less than $10,000 | 128 | 5.7% |
| $10,000 to $14,999 | 13 | 0.6% |
| $15,000 to $24,999 | 132 | 5.9% |
| $25,000 to $34,999 | 227 | 10.1% |
| $35,000 to $49,999 | 428 | 19.1% |
| $50,000 to $74,999 | 500 | 22.3% |
| $75,000 to $99,999 | 253 | 11.3% |
| $100,000 to $149,999 | 334 | 14.9% |
| $150,000 to $199,999 | 126 | 5.6% |
| $200,000+ | 101 | 4.5% |
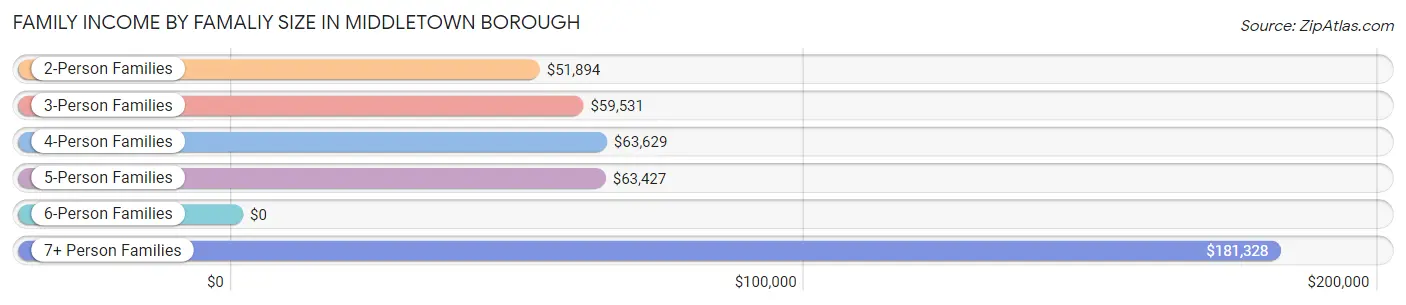
Family Income by Famaliy Size in Middletown borough
7+ person families (33 | 1.5%) account for the highest median family income in Middletown borough with $181,328 per family, while 2-person families (1,214 | 54.1%) have the highest median income of $25,947 per family member.
| Income Bracket | # Families | Median Income |
| 2-Person Families | 1,214 (54.1%) | $51,894 |
| 3-Person Families | 397 (17.7%) | $59,531 |
| 4-Person Families | 464 (20.7%) | $63,629 |
| 5-Person Families | 81 (3.6%) | $63,427 |
| 6-Person Families | 54 (2.4%) | $0 |
| 7+ Person Families | 33 (1.5%) | $181,328 |
| Total | 2,243 (100.0%) | $62,747 |
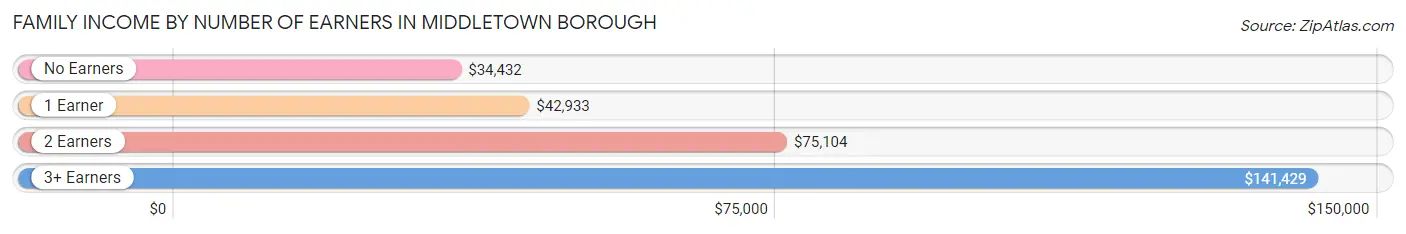
Family Income by Number of Earners in Middletown borough
The median family income in Middletown borough is $62,747, with families comprising 3+ earners (226) having the highest median family income of $141,429, while families with no earners (351) have the lowest median family income of $34,432, accounting for 10.1% and 15.7% of families, respectively.
| Number of Earners | # Families | Median Income |
| No Earners | 351 (15.7%) | $34,432 |
| 1 Earner | 816 (36.4%) | $42,933 |
| 2 Earners | 850 (37.9%) | $75,104 |
| 3+ Earners | 226 (10.1%) | $141,429 |
| Total | 2,243 (100.0%) | $62,747 |
Household Income in Middletown borough
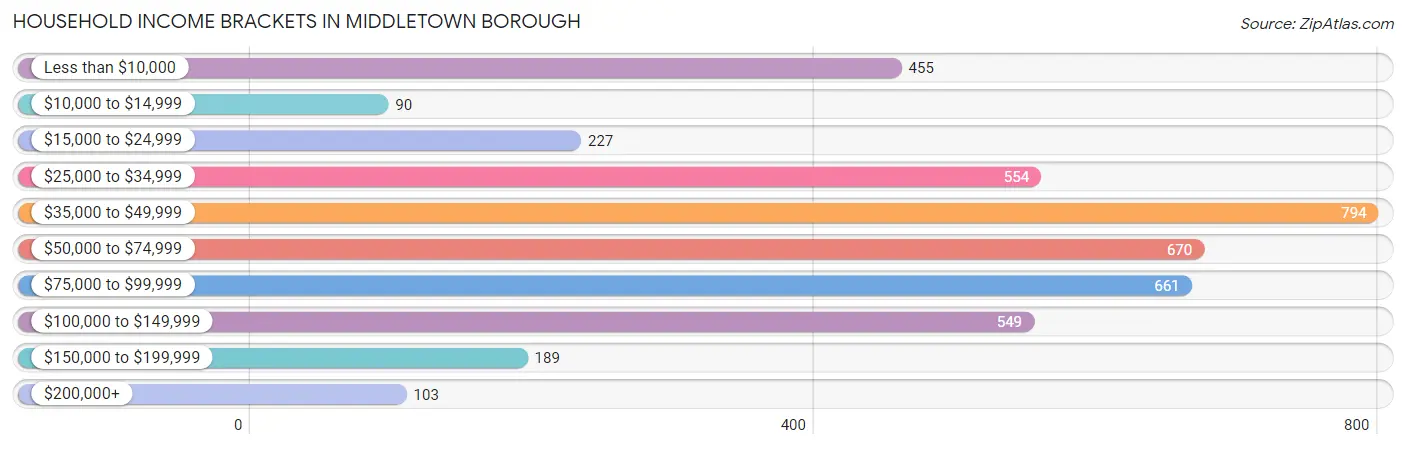
Household Income Brackets in Middletown borough
With 794 households falling in the category, the $35,000 to $49,999 income range is the most frequent in Middletown borough, accounting for 18.5% of all households. In contrast, only 90 households (2.1%) fall into the $10,000 to $14,999 income bracket, making it the least populous group.
| Income Bracket | # Households | % Households |
| Less than $10,000 | 455 | 10.6% |
| $10,000 to $14,999 | 90 | 2.1% |
| $15,000 to $24,999 | 227 | 5.3% |
| $25,000 to $34,999 | 554 | 12.9% |
| $35,000 to $49,999 | 794 | 18.5% |
| $50,000 to $74,999 | 670 | 15.6% |
| $75,000 to $99,999 | 661 | 15.4% |
| $100,000 to $149,999 | 549 | 12.8% |
| $150,000 to $199,999 | 189 | 4.4% |
| $200,000+ | 103 | 2.4% |
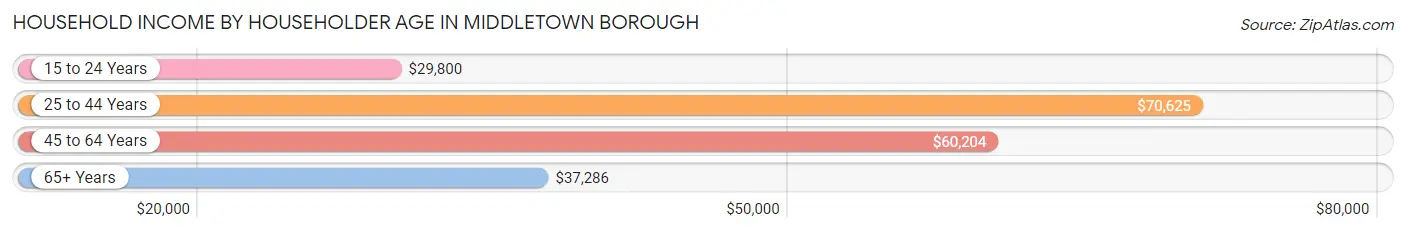
Household Income by Householder Age in Middletown borough
The median household income in Middletown borough is $50,599, with the highest median household income of $70,625 found in the 25 to 44 years age bracket for the primary householder. A total of 1,554 households (36.2%) fall into this category. Meanwhile, the 15 to 24 years age bracket for the primary householder has the lowest median household income of $29,800, with 458 households (10.7%) in this group.
| Income Bracket | # Households | Median Income |
| 15 to 24 Years | 458 (10.7%) | $29,800 |
| 25 to 44 Years | 1,554 (36.2%) | $70,625 |
| 45 to 64 Years | 1,324 (30.8%) | $60,204 |
| 65+ Years | 956 (22.3%) | $37,286 |
| Total | 4,292 (100.0%) | $50,599 |
Poverty in Middletown borough
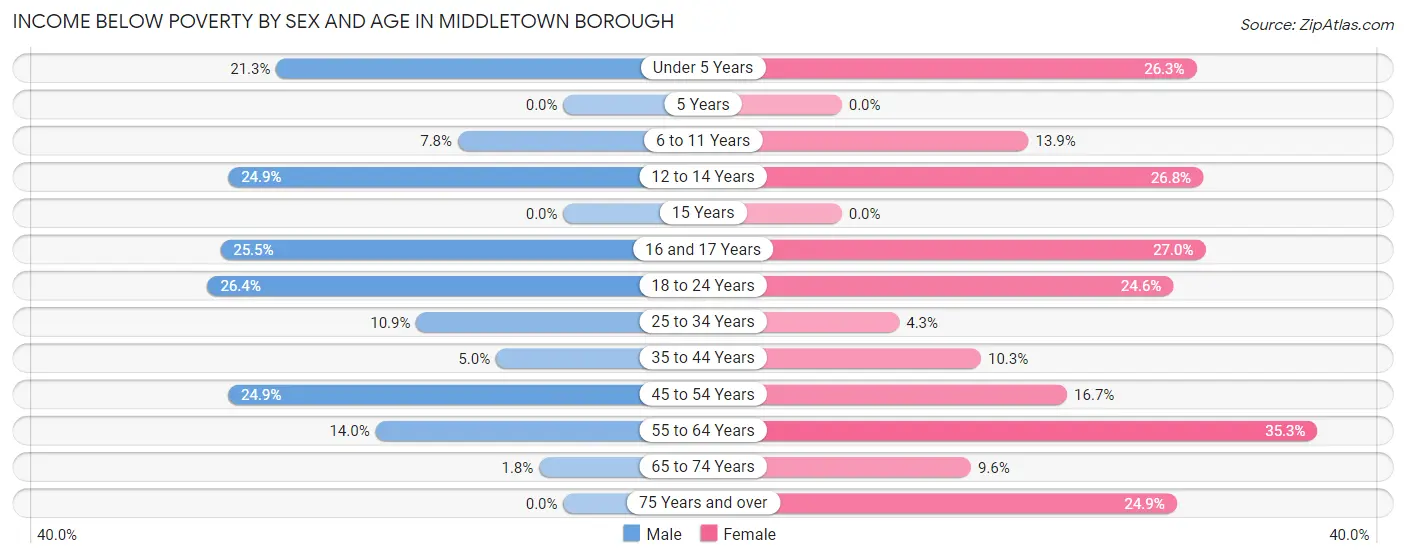
Income Below Poverty by Sex and Age in Middletown borough
With 14.1% poverty level for males and 17.8% for females among the residents of Middletown borough, 18 to 24 year old males and 55 to 64 year old females are the most vulnerable to poverty, with 135 males (26.4%) and 209 females (35.3%) in their respective age groups living below the poverty level.
| Age Bracket | Male | Female |
| Under 5 Years | 91 (21.3%) | 75 (26.3%) |
| 5 Years | 0 (0.0%) | 0 (0.0%) |
| 6 to 11 Years | 31 (7.8%) | 24 (13.9%) |
| 12 to 14 Years | 51 (24.9%) | 37 (26.8%) |
| 15 Years | 0 (0.0%) | 0 (0.0%) |
| 16 and 17 Years | 27 (25.5%) | 17 (27.0%) |
| 18 to 24 Years | 135 (26.4%) | 183 (24.6%) |
| 25 to 34 Years | 104 (10.9%) | 36 (4.3%) |
| 35 to 44 Years | 18 (5.0%) | 58 (10.3%) |
| 45 to 54 Years | 113 (24.9%) | 93 (16.7%) |
| 55 to 64 Years | 66 (14.0%) | 209 (35.3%) |
| 65 to 74 Years | 7 (1.8%) | 33 (9.6%) |
| 75 Years and over | 0 (0.0%) | 83 (24.8%) |
| Total | 643 (14.1%) | 848 (17.8%) |
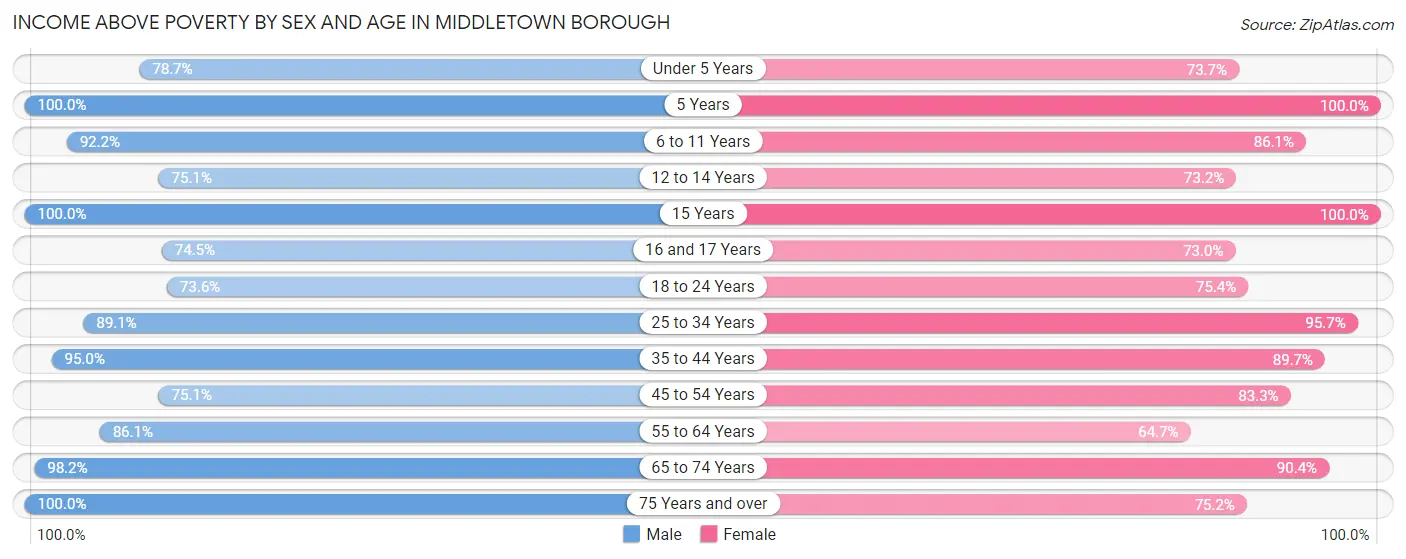
Income Above Poverty by Sex and Age in Middletown borough
According to the poverty statistics in Middletown borough, males aged 5 years and females aged 5 years are the age groups that are most secure financially, with 100.0% of males and 100.0% of females in these age groups living above the poverty line.
| Age Bracket | Male | Female |
| Under 5 Years | 336 (78.7%) | 210 (73.7%) |
| 5 Years | 30 (100.0%) | 39 (100.0%) |
| 6 to 11 Years | 365 (92.2%) | 149 (86.1%) |
| 12 to 14 Years | 154 (75.1%) | 101 (73.2%) |
| 15 Years | 8 (100.0%) | 77 (100.0%) |
| 16 and 17 Years | 79 (74.5%) | 46 (73.0%) |
| 18 to 24 Years | 376 (73.6%) | 561 (75.4%) |
| 25 to 34 Years | 848 (89.1%) | 808 (95.7%) |
| 35 to 44 Years | 342 (95.0%) | 503 (89.7%) |
| 45 to 54 Years | 341 (75.1%) | 463 (83.3%) |
| 55 to 64 Years | 407 (86.1%) | 383 (64.7%) |
| 65 to 74 Years | 382 (98.2%) | 311 (90.4%) |
| 75 Years and over | 251 (100.0%) | 251 (75.1%) |
| Total | 3,919 (85.9%) | 3,902 (82.2%) |
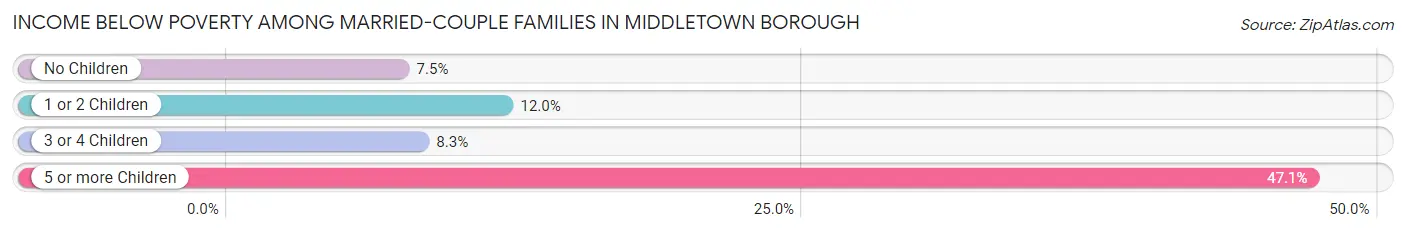
Income Below Poverty Among Married-Couple Families in Middletown borough
The poverty statistics for married-couple families in Middletown borough show that 9.4% or 125 of the total 1,324 families live below the poverty line. Families with 5 or more children have the highest poverty rate of 47.1%, comprising of 8 families. On the other hand, families with no children have the lowest poverty rate of 7.5%, which includes 62 families.
| Children | Above Poverty | Below Poverty |
| No Children | 768 (92.5%) | 62 (7.5%) |
| 1 or 2 Children | 367 (88.0%) | 50 (12.0%) |
| 3 or 4 Children | 55 (91.7%) | 5 (8.3%) |
| 5 or more Children | 9 (52.9%) | 8 (47.1%) |
| Total | 1,199 (90.6%) | 125 (9.4%) |
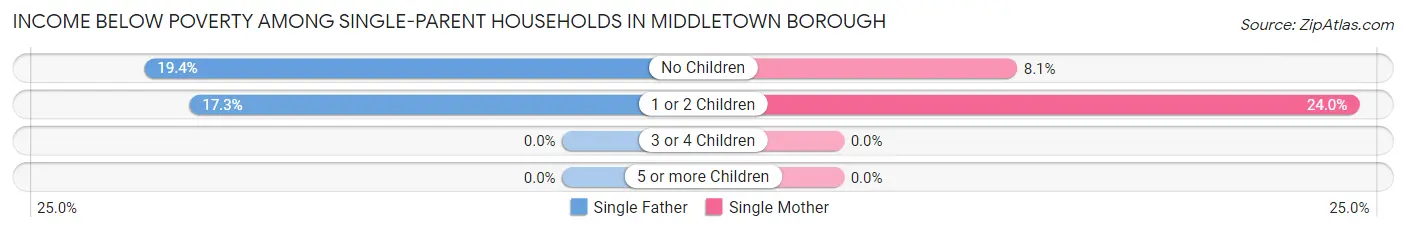
Income Below Poverty Among Single-Parent Households in Middletown borough
According to the poverty data in Middletown borough, 15.8% or 33 single-father households and 19.0% or 135 single-mother households are living below the poverty line. Among single-father households, those with no children have the highest poverty rate, with 20 households (19.4%) experiencing poverty. Likewise, among single-mother households, those with 1 or 2 children have the highest poverty rate, with 120 households (24.0%) falling below the poverty line.
| Children | Single Father | Single Mother |
| No Children | 20 (19.4%) | 15 (8.1%) |
| 1 or 2 Children | 13 (17.3%) | 120 (24.0%) |
| 3 or 4 Children | 0 (0.0%) | 0 (0.0%) |
| 5 or more Children | 0 (0.0%) | 0 (0.0%) |
| Total | 33 (15.8%) | 135 (19.0%) |
Income Below Poverty Among Married-Couple vs Single-Parent Households in Middletown borough
The poverty data for Middletown borough shows that 125 of the married-couple family households (9.4%) and 168 of the single-parent households (18.3%) are living below the poverty level. Within the married-couple family households, those with 5 or more children have the highest poverty rate, with 8 households (47.1%) falling below the poverty line. Among the single-parent households, those with 1 or 2 children have the highest poverty rate, with 133 household (23.1%) living below poverty.
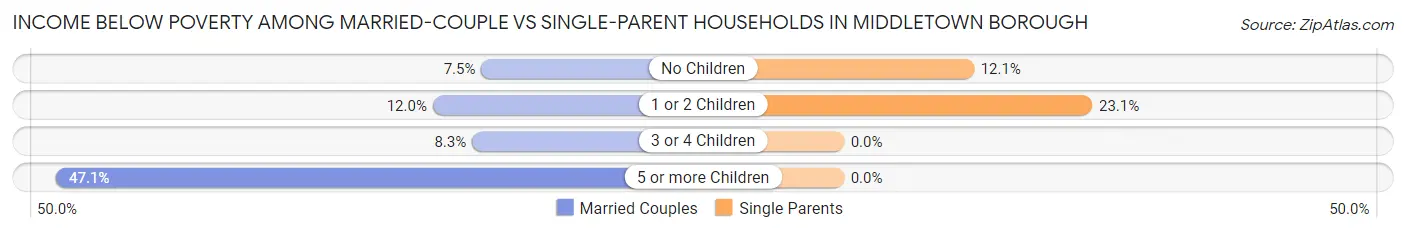
| Children | Married-Couple Families | Single-Parent Households |
| No Children | 62 (7.5%) | 35 (12.1%) |
| 1 or 2 Children | 50 (12.0%) | 133 (23.1%) |
| 3 or 4 Children | 5 (8.3%) | 0 (0.0%) |
| 5 or more Children | 8 (47.1%) | 0 (0.0%) |
| Total | 125 (9.4%) | 168 (18.3%) |
Race in Middletown borough
The most populous races in Middletown borough are White / Caucasian (7,279 | 76.4%), Hispanic or Latino (966 | 10.1%), and Black / African American (962 | 10.1%).
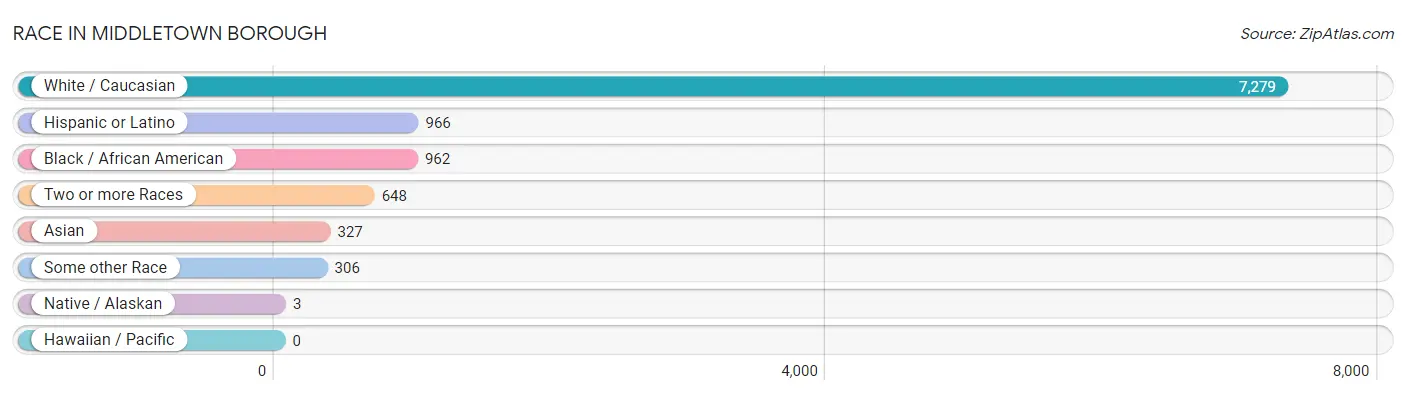
| Race | # Population | % Population |
| Asian | 327 | 3.4% |
| Black / African American | 962 | 10.1% |
| Hawaiian / Pacific | 0 | 0.0% |
| Hispanic or Latino | 966 | 10.1% |
| Native / Alaskan | 3 | 0.0% |
| White / Caucasian | 7,279 | 76.4% |
| Two or more Races | 648 | 6.8% |
| Some other Race | 306 | 3.2% |
| Total | 9,525 | 100.0% |
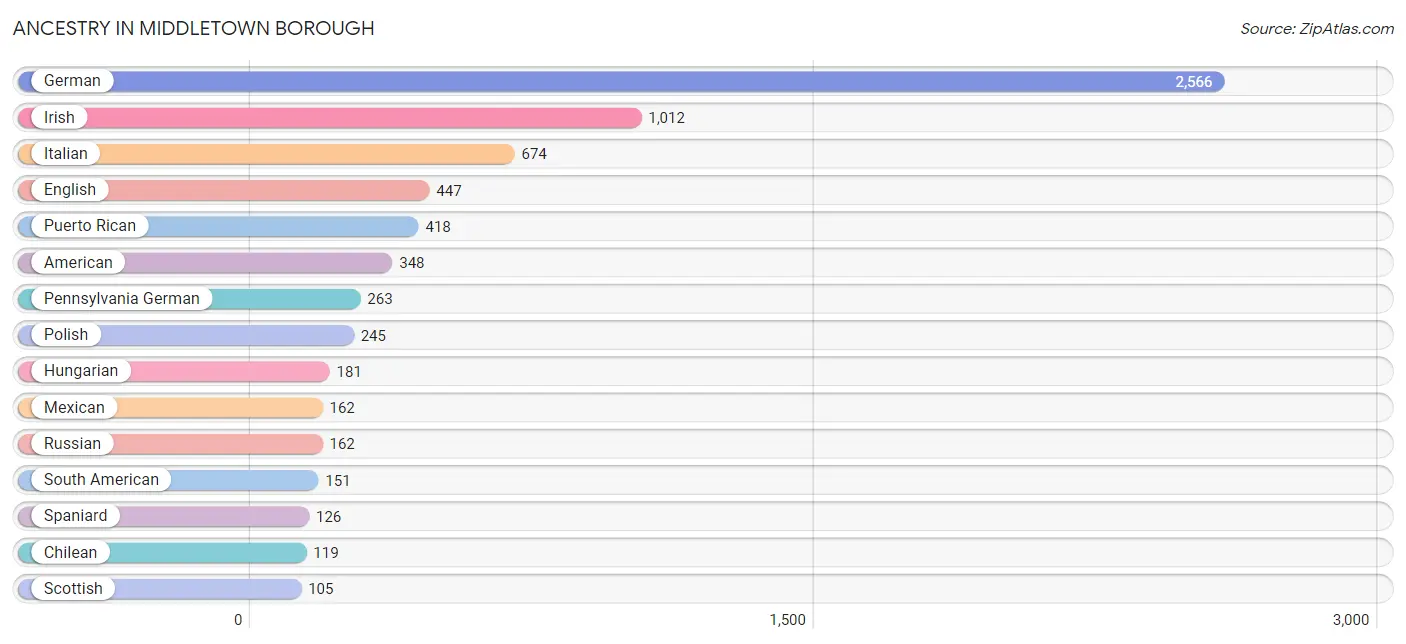
Ancestry in Middletown borough
The most populous ancestries reported in Middletown borough are German (2,566 | 26.9%), Irish (1,012 | 10.6%), Italian (674 | 7.1%), English (447 | 4.7%), and Puerto Rican (418 | 4.4%), together accounting for 53.7% of all Middletown borough residents.
| Ancestry | # Population | % Population |
| American | 348 | 3.6% |
| Arab | 59 | 0.6% |
| Australian | 16 | 0.2% |
| Austrian | 48 | 0.5% |
| Blackfeet | 7 | 0.1% |
| British | 78 | 0.8% |
| Burmese | 52 | 0.5% |
| Central American | 26 | 0.3% |
| Cherokee | 67 | 0.7% |
| Chilean | 119 | 1.3% |
| Croatian | 15 | 0.2% |
| Cuban | 47 | 0.5% |
| Czech | 19 | 0.2% |
| Czechoslovakian | 17 | 0.2% |
| Danish | 37 | 0.4% |
| Dutch | 71 | 0.7% |
| Eastern European | 11 | 0.1% |
| Ecuadorian | 23 | 0.2% |
| English | 447 | 4.7% |
| European | 29 | 0.3% |
| French | 88 | 0.9% |
| French Canadian | 27 | 0.3% |
| German | 2,566 | 26.9% |
| Hungarian | 181 | 1.9% |
| Indian (Asian) | 29 | 0.3% |
| Iraqi | 19 | 0.2% |
| Irish | 1,012 | 10.6% |
| Italian | 674 | 7.1% |
| Jamaican | 45 | 0.5% |
| Korean | 7 | 0.1% |
| Lithuanian | 15 | 0.2% |
| Mexican | 162 | 1.7% |
| Nigerian | 15 | 0.2% |
| Northern European | 59 | 0.6% |
| Norwegian | 27 | 0.3% |
| Pennsylvania German | 263 | 2.8% |
| Peruvian | 9 | 0.1% |
| Polish | 245 | 2.6% |
| Portuguese | 18 | 0.2% |
| Puerto Rican | 418 | 4.4% |
| Romanian | 13 | 0.1% |
| Russian | 162 | 1.7% |
| Salvadoran | 26 | 0.3% |
| Scandinavian | 47 | 0.5% |
| Scotch-Irish | 104 | 1.1% |
| Scottish | 105 | 1.1% |
| Sioux | 8 | 0.1% |
| Slovak | 10 | 0.1% |
| Slovene | 12 | 0.1% |
| South American | 151 | 1.6% |
| Spaniard | 126 | 1.3% |
| Spanish | 26 | 0.3% |
| Subsaharan African | 15 | 0.2% |
| Swedish | 65 | 0.7% |
| Swiss | 40 | 0.4% |
| Thai | 64 | 0.7% |
| Ukrainian | 19 | 0.2% |
| Welsh | 74 | 0.8% |
| Yaqui | 5 | 0.1% | View All 59 Rows |
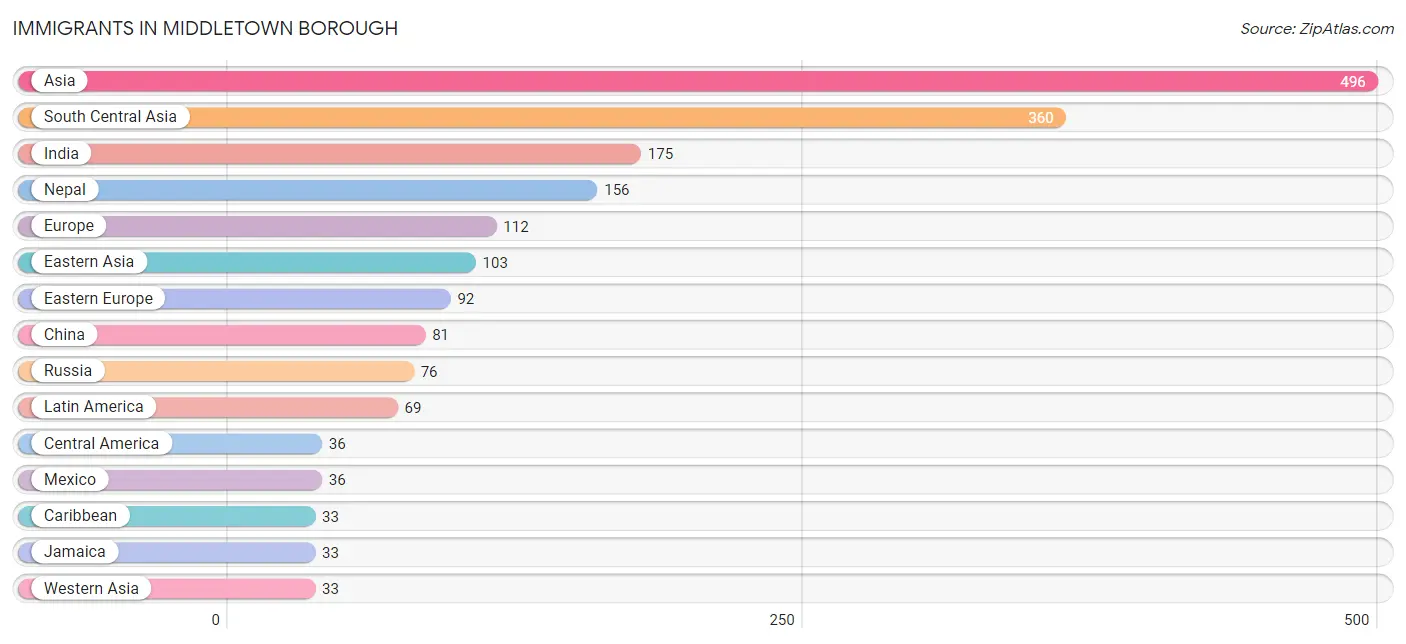
Immigrants in Middletown borough
The most numerous immigrant groups reported in Middletown borough came from Asia (496 | 5.2%), South Central Asia (360 | 3.8%), India (175 | 1.8%), Nepal (156 | 1.6%), and Europe (112 | 1.2%), together accounting for 13.7% of all Middletown borough residents.
| Immigration Origin | # Population | % Population |
| Africa | 11 | 0.1% |
| Asia | 496 | 5.2% |
| Caribbean | 33 | 0.4% |
| Central America | 36 | 0.4% |
| China | 81 | 0.9% |
| Eastern Asia | 103 | 1.1% |
| Eastern Europe | 92 | 1.0% |
| England | 14 | 0.2% |
| Europe | 112 | 1.2% |
| India | 175 | 1.8% |
| Iraq | 19 | 0.2% |
| Jamaica | 33 | 0.4% |
| Korea | 22 | 0.2% |
| Latin America | 69 | 0.7% |
| Mexico | 36 | 0.4% |
| Nepal | 156 | 1.6% |
| Nigeria | 11 | 0.1% |
| Northern Europe | 20 | 0.2% |
| Poland | 16 | 0.2% |
| Russia | 76 | 0.8% |
| Saudi Arabia | 14 | 0.2% |
| South Central Asia | 360 | 3.8% |
| Western Africa | 11 | 0.1% |
| Western Asia | 33 | 0.4% | View All 24 Rows |
Sex and Age in Middletown borough
Sex and Age in Middletown borough
The most populous age groups in Middletown borough are 25 to 29 Years (508 | 10.9%) for men and 20 to 24 Years (614 | 12.6%) for women.
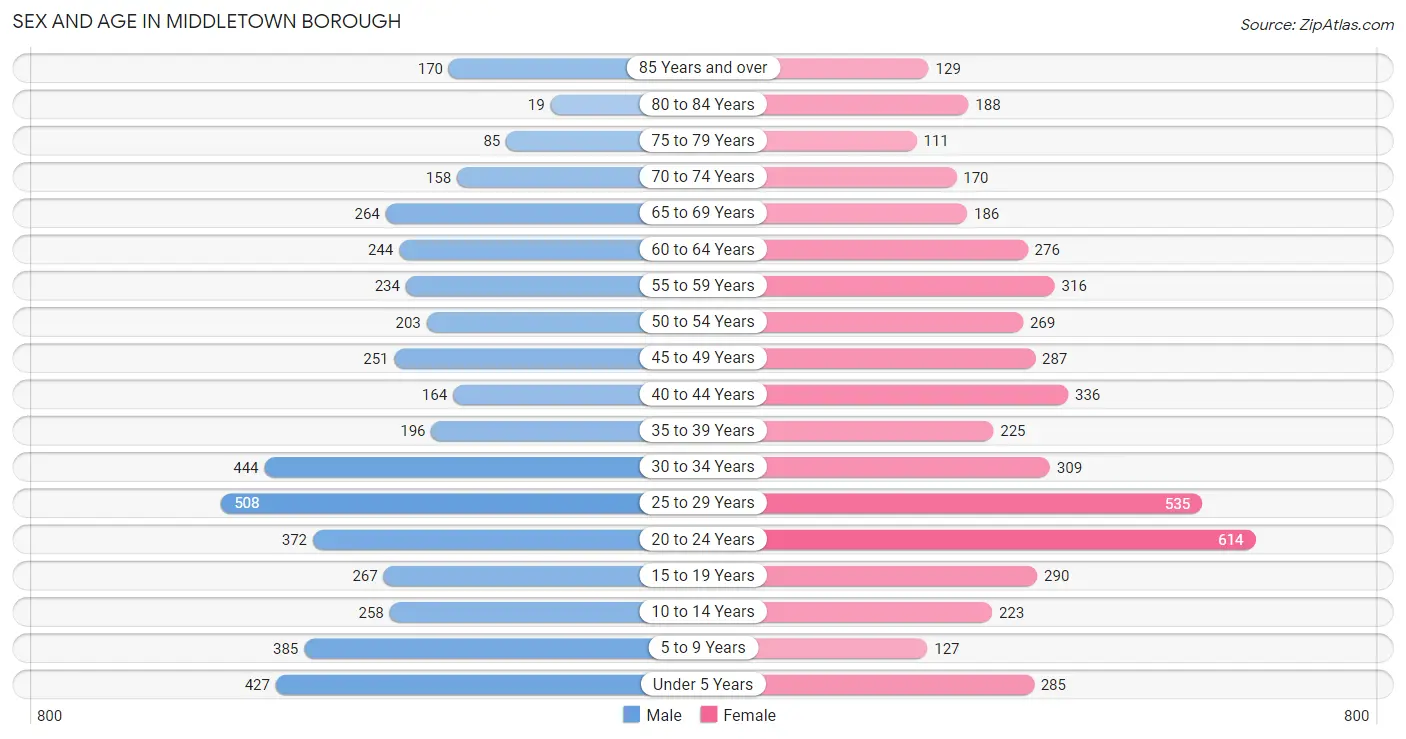
| Age Bracket | Male | Female |
| Under 5 Years | 427 (9.2%) | 285 (5.8%) |
| 5 to 9 Years | 385 (8.3%) | 127 (2.6%) |
| 10 to 14 Years | 258 (5.6%) | 223 (4.6%) |
| 15 to 19 Years | 267 (5.7%) | 290 (5.9%) |
| 20 to 24 Years | 372 (8.0%) | 614 (12.6%) |
| 25 to 29 Years | 508 (10.9%) | 535 (11.0%) |
| 30 to 34 Years | 444 (9.6%) | 309 (6.3%) |
| 35 to 39 Years | 196 (4.2%) | 225 (4.6%) |
| 40 to 44 Years | 164 (3.5%) | 336 (6.9%) |
| 45 to 49 Years | 251 (5.4%) | 287 (5.9%) |
| 50 to 54 Years | 203 (4.4%) | 269 (5.5%) |
| 55 to 59 Years | 234 (5.0%) | 316 (6.5%) |
| 60 to 64 Years | 244 (5.2%) | 276 (5.7%) |
| 65 to 69 Years | 264 (5.7%) | 186 (3.8%) |
| 70 to 74 Years | 158 (3.4%) | 170 (3.5%) |
| 75 to 79 Years | 85 (1.8%) | 111 (2.3%) |
| 80 to 84 Years | 19 (0.4%) | 188 (3.9%) |
| 85 Years and over | 170 (3.7%) | 129 (2.6%) |
| Total | 4,649 (100.0%) | 4,876 (100.0%) |
Families and Households in Middletown borough
Median Family Size in Middletown borough
The median family size in Middletown borough is 2.90 persons per family, with married-couple families (1,324 | 59.0%) accounting for the largest median family size of 3.07 persons per family. On the other hand, single male/father families (209 | 9.3%) represent the smallest median family size with 2.56 persons per family.
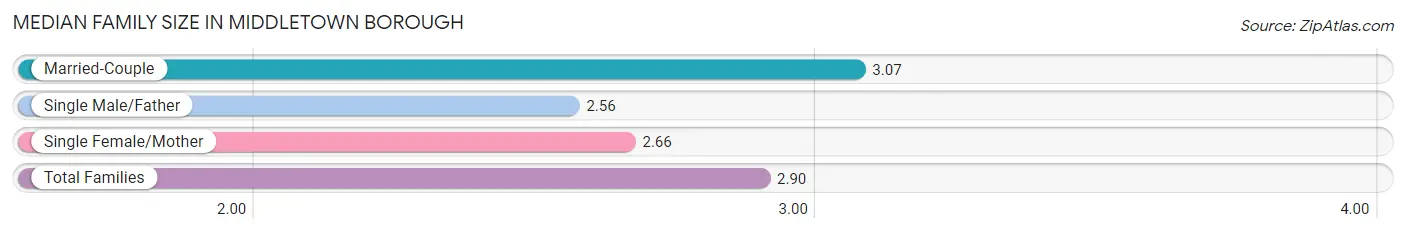
| Family Type | # Families | Family Size |
| Married-Couple | 1,324 (59.0%) | 3.07 |
| Single Male/Father | 209 (9.3%) | 2.56 |
| Single Female/Mother | 710 (31.7%) | 2.66 |
| Total Families | 2,243 (100.0%) | 2.90 |
Median Household Size in Middletown borough
The median household size in Middletown borough is 2.17 persons per household, with married-couple households (1,324 | 30.8%) accounting for the largest median household size of 3.1 persons per household. non-family households (2,049 | 47.7%) represent the smallest median household size with 1.25 persons per household.
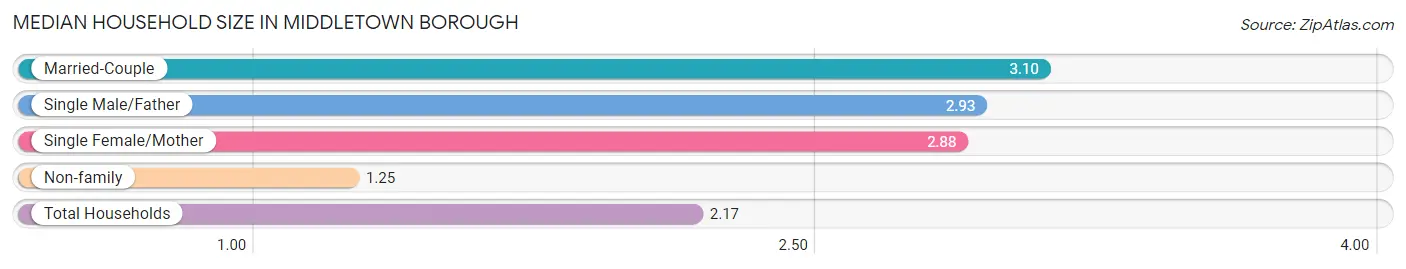
| Household Type | # Households | Household Size |
| Married-Couple | 1,324 (30.8%) | 3.10 |
| Single Male/Father | 209 (4.9%) | 2.93 |
| Single Female/Mother | 710 (16.5%) | 2.88 |
| Non-family | 2,049 (47.7%) | 1.25 |
| Total Households | 4,292 (100.0%) | 2.17 |
Household Size by Marriage Status in Middletown borough
Out of a total of 4,292 households in Middletown borough, 2,243 (52.3%) are family households, while 2,049 (47.7%) are nonfamily households. The most numerous type of family households are 2-person households, comprising 1,099, and the most common type of nonfamily households are 1-person households, comprising 1,598.
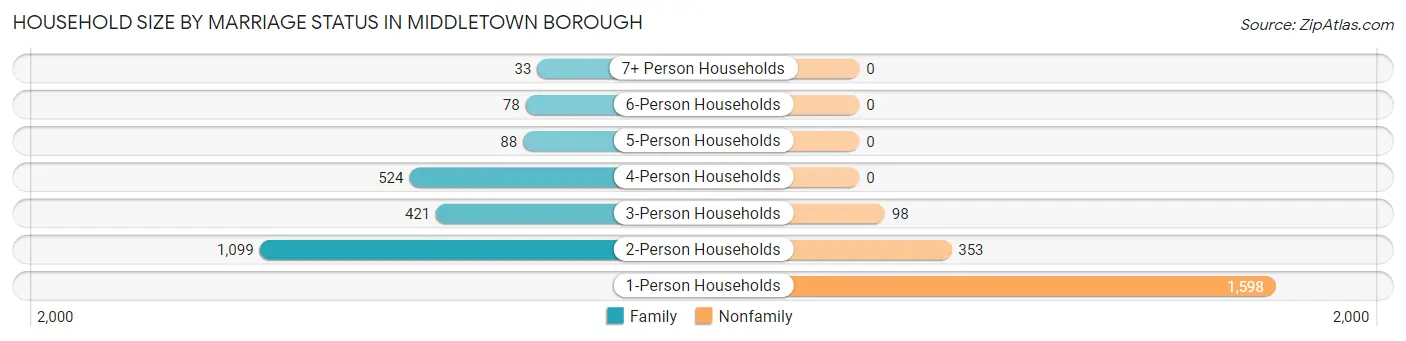
| Household Size | Family Households | Nonfamily Households |
| 1-Person Households | - | 1,598 (37.2%) |
| 2-Person Households | 1,099 (25.6%) | 353 (8.2%) |
| 3-Person Households | 421 (9.8%) | 98 (2.3%) |
| 4-Person Households | 524 (12.2%) | 0 (0.0%) |
| 5-Person Households | 88 (2.1%) | 0 (0.0%) |
| 6-Person Households | 78 (1.8%) | 0 (0.0%) |
| 7+ Person Households | 33 (0.8%) | 0 (0.0%) |
| Total | 2,243 (52.3%) | 2,049 (47.7%) |
Female Fertility in Middletown borough
Fertility by Age in Middletown borough
Average fertility rate in Middletown borough is 22.0 births per 1,000 women. Women in the age bracket of 20 to 34 years have the highest fertility rate with 36.0 births per 1,000 women. Women in the age bracket of 20 to 34 years acount for 93.0% of all women with births.
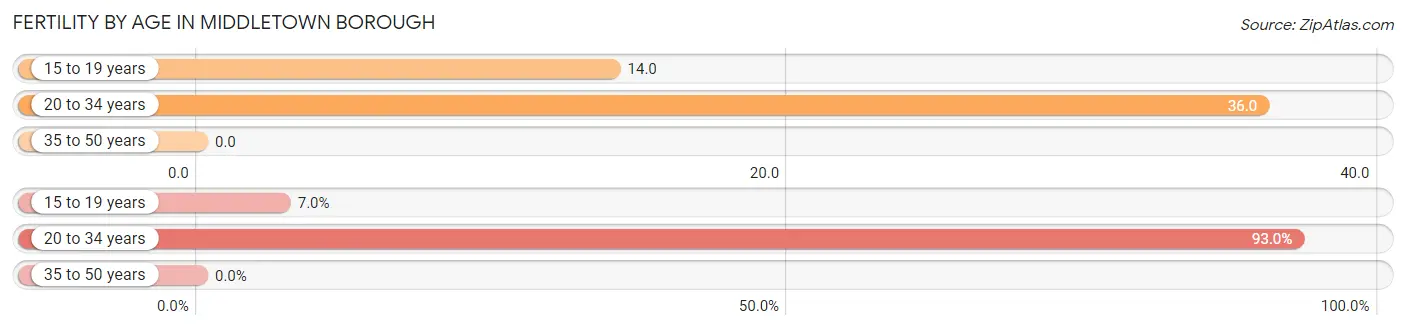
| Age Bracket | Women with Births | Births / 1,000 Women |
| 15 to 19 years | 4 (7.0%) | 14.0 |
| 20 to 34 years | 53 (93.0%) | 36.0 |
| 35 to 50 years | 0 (0.0%) | 0.0 |
| Total | 57 (100.0%) | 22.0 |
Fertility by Age by Marriage Status in Middletown borough
93.0% of women with births (57) in Middletown borough are married. The highest percentage of unmarried women with births falls into 15 to 19 years age bracket with 100.0% of them unmarried at the time of birth, while the lowest percentage of unmarried women with births belong to 20 to 34 years age bracket with 0.0% of them unmarried.
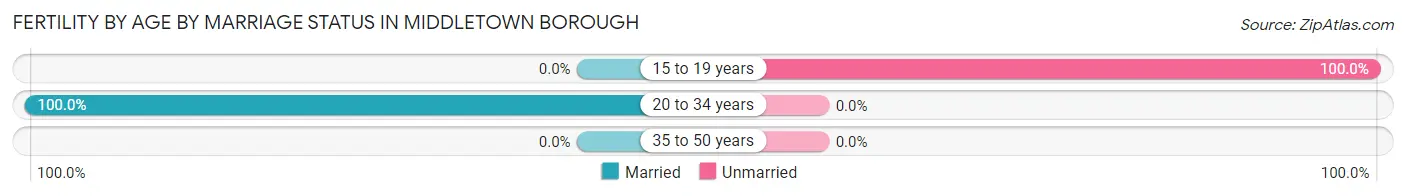
| Age Bracket | Married | Unmarried |
| 15 to 19 years | 0 (0.0%) | 4 (100.0%) |
| 20 to 34 years | 53 (100.0%) | 0 (0.0%) |
| 35 to 50 years | 0 (0.0%) | 0 (0.0%) |
| Total | 53 (93.0%) | 4 (7.0%) |
Fertility by Education in Middletown borough
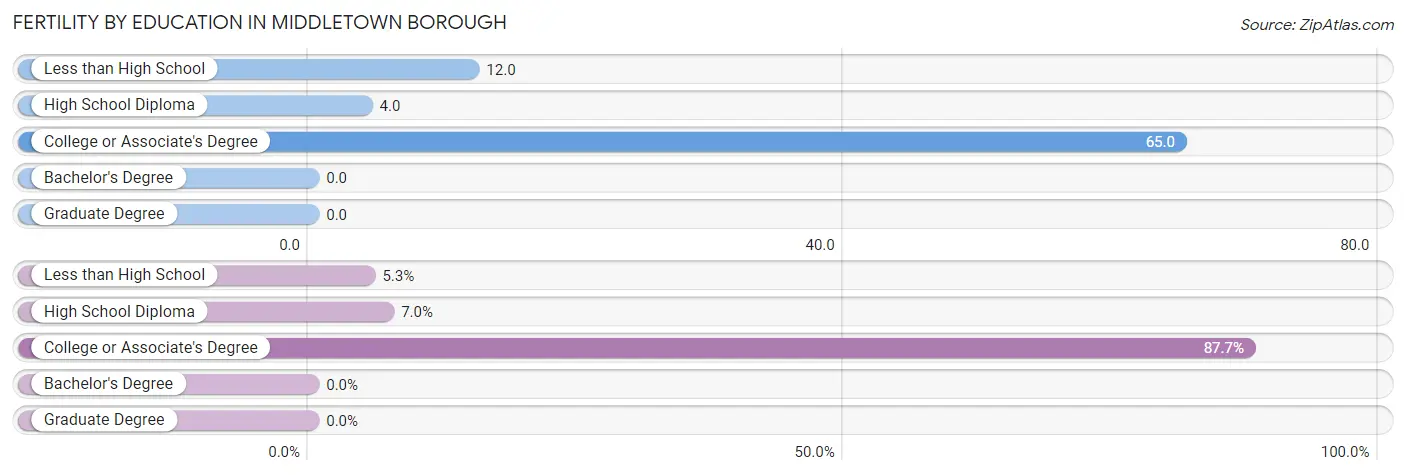
| Educational Attainment | Women with Births | Births / 1,000 Women |
| Less than High School | 3 (5.3%) | 12.0 |
| High School Diploma | 4 (7.0%) | 4.0 |
| College or Associate's Degree | 50 (87.7%) | 65.0 |
| Bachelor's Degree | 0 (0.0%) | 0.0 |
| Graduate Degree | 0 (0.0%) | 0.0 |
| Total | 57 (100.0%) | 22.0 |
Fertility by Education by Marriage Status in Middletown borough
7.0% of women with births in Middletown borough are unmarried. Women with the educational attainment of less than high school are most likely to be married with 100.0% of them married at childbirth, while women with the educational attainment of high school diploma are least likely to be married with 100.0% of them unmarried at childbirth.
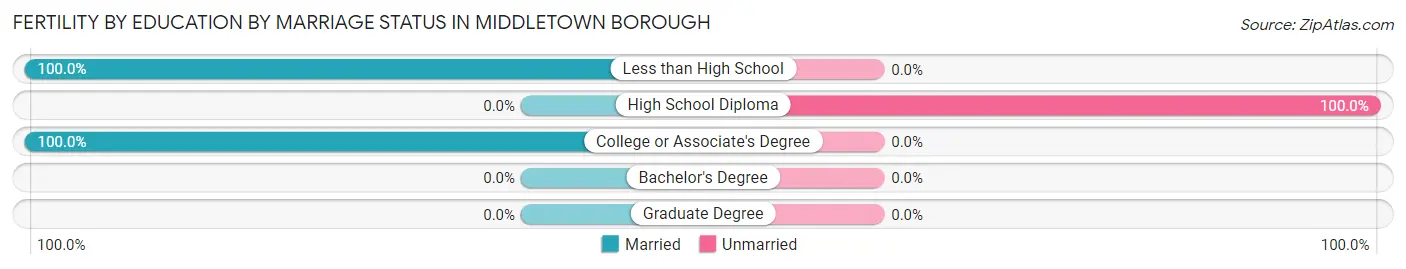
| Educational Attainment | Married | Unmarried |
| Less than High School | 3 (100.0%) | 0 (0.0%) |
| High School Diploma | 0 (0.0%) | 4 (100.0%) |
| College or Associate's Degree | 50 (100.0%) | 0 (0.0%) |
| Bachelor's Degree | 0 (0.0%) | 0 (0.0%) |
| Graduate Degree | 0 (0.0%) | 0 (0.0%) |
| Total | 53 (93.0%) | 4 (7.0%) |
Employment Characteristics in Middletown borough
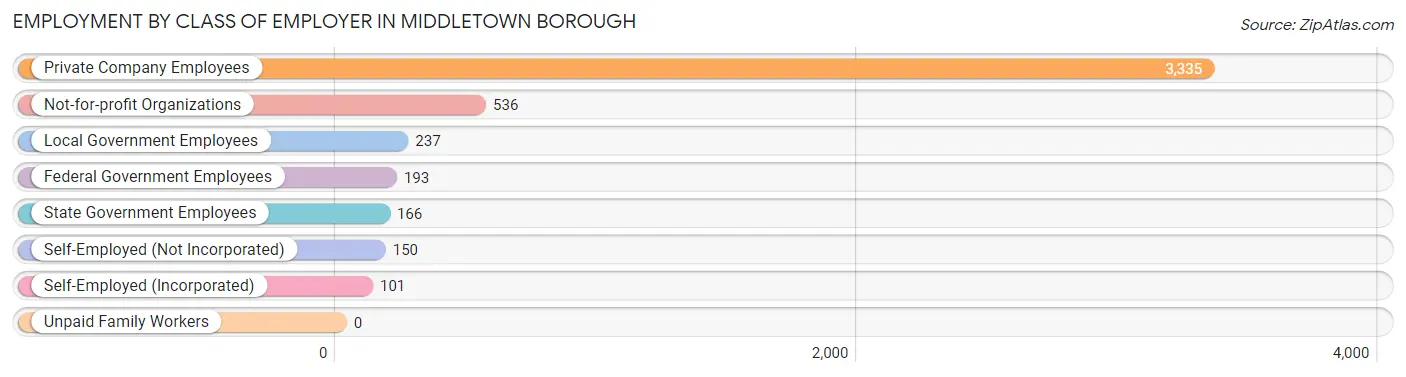
Employment by Class of Employer in Middletown borough
Among the 4,718 employed individuals in Middletown borough, private company employees (3,335 | 70.7%), not-for-profit organizations (536 | 11.4%), and local government employees (237 | 5.0%) make up the most common classes of employment.
| Employer Class | # Employees | % Employees |
| Private Company Employees | 3,335 | 70.7% |
| Self-Employed (Incorporated) | 101 | 2.1% |
| Self-Employed (Not Incorporated) | 150 | 3.2% |
| Not-for-profit Organizations | 536 | 11.4% |
| Local Government Employees | 237 | 5.0% |
| State Government Employees | 166 | 3.5% |
| Federal Government Employees | 193 | 4.1% |
| Unpaid Family Workers | 0 | 0.0% |
| Total | 4,718 | 100.0% |
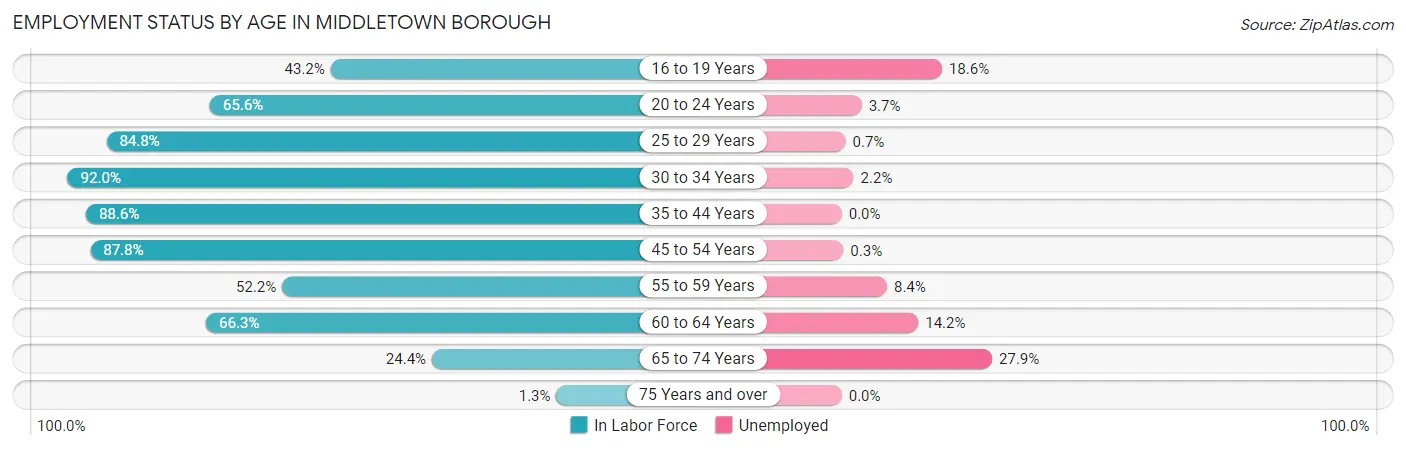
Employment Status by Age in Middletown borough
According to the labor force statistics for Middletown borough, out of the total population over 16 years of age (7,735), 64.1% or 4,958 individuals are in the labor force, with 4.3% or 213 of them unemployed. The age group with the highest labor force participation rate is 30 to 34 years, with 92.0% or 693 individuals in the labor force. Within the labor force, the 65 to 74 years age range has the highest percentage of unemployed individuals, with 27.9% or 53 of them being unemployed.
| Age Bracket | In Labor Force | Unemployed |
| 16 to 19 Years | 204 (43.2%) | 38 (18.6%) |
| 20 to 24 Years | 647 (65.6%) | 24 (3.7%) |
| 25 to 29 Years | 884 (84.8%) | 6 (0.7%) |
| 30 to 34 Years | 693 (92.0%) | 15 (2.2%) |
| 35 to 44 Years | 816 (88.6%) | 0 (0.0%) |
| 45 to 54 Years | 887 (87.8%) | 3 (0.3%) |
| 55 to 59 Years | 287 (52.2%) | 24 (8.4%) |
| 60 to 64 Years | 345 (66.3%) | 49 (14.2%) |
| 65 to 74 Years | 190 (24.4%) | 53 (27.9%) |
| 75 Years and over | 9 (1.3%) | 0 (0.0%) |
| Total | 4,958 (64.1%) | 213 (4.3%) |
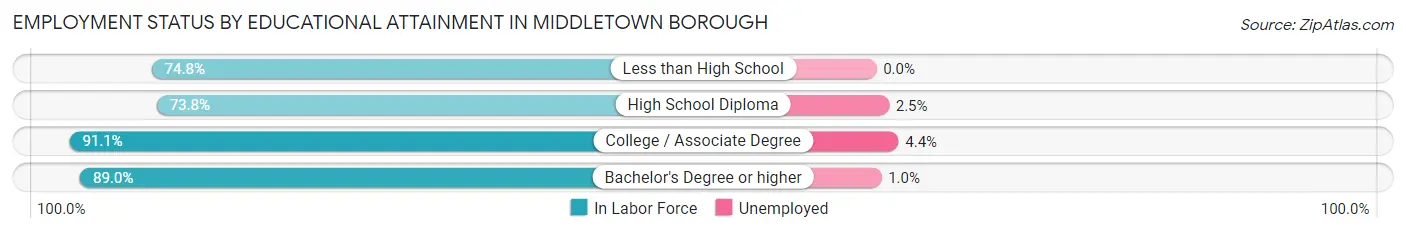
Employment Status by Educational Attainment in Middletown borough
According to labor force statistics for Middletown borough, 81.6% of individuals (3,914) out of the total population between 25 and 64 years of age (4,797) are in the labor force, with 2.5% or 98 of them being unemployed. The group with the highest labor force participation rate are those with the educational attainment of college / associate degree, with 91.1% or 1,061 individuals in the labor force. Within the labor force, individuals with college / associate degree education have the highest percentage of unemployment, with 4.4% or 47 of them being unemployed.
| Educational Attainment | In Labor Force | Unemployed |
| Less than High School | 249 (74.8%) | 0 (0.0%) |
| High School Diploma | 1,618 (73.8%) | 55 (2.5%) |
| College / Associate Degree | 1,061 (91.1%) | 51 (4.4%) |
| Bachelor's Degree or higher | 984 (89.0%) | 11 (1.0%) |
| Total | 3,914 (81.6%) | 120 (2.5%) |
Employment Occupations by Sex in Middletown borough
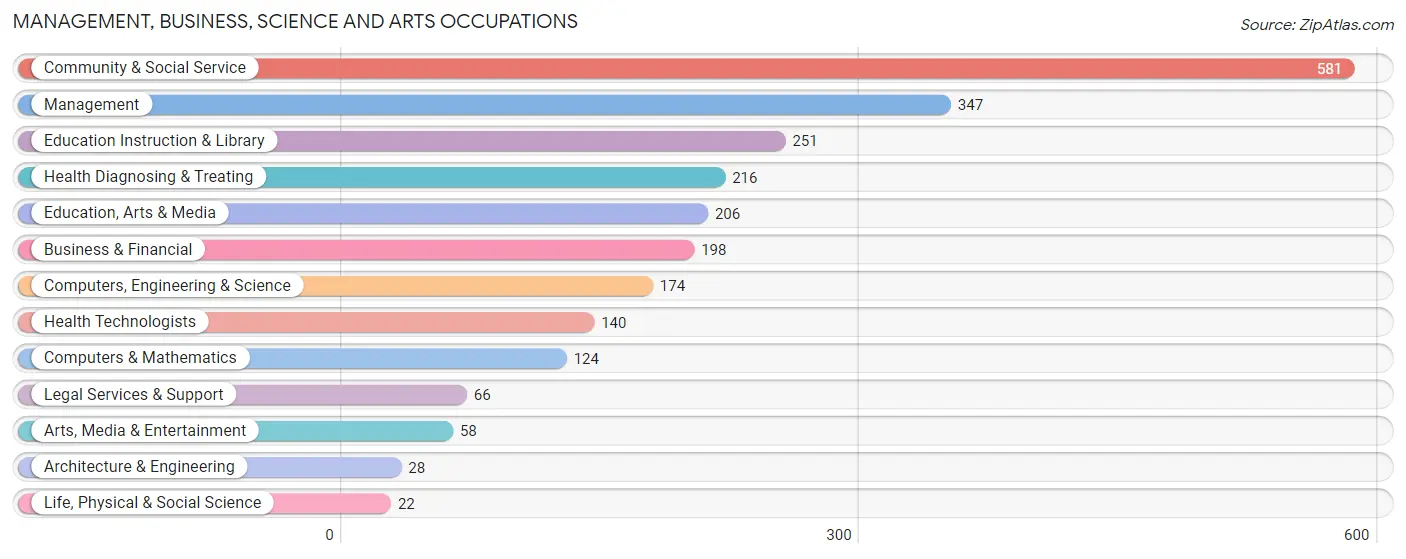
Management, Business, Science and Arts Occupations
The most common Management, Business, Science and Arts occupations in Middletown borough are Community & Social Service (581 | 12.2%), Management (347 | 7.3%), Education Instruction & Library (251 | 5.3%), Health Diagnosing & Treating (216 | 4.5%), and Education, Arts & Media (206 | 4.3%).
Management, Business, Science and Arts Occupations by Sex
Within the Management, Business, Science and Arts occupations in Middletown borough, the most male-oriented occupations are Architecture & Engineering (100.0%), Life, Physical & Social Science (100.0%), and Arts, Media & Entertainment (67.2%), while the most female-oriented occupations are Education, Arts & Media (80.1%), Health Diagnosing & Treating (77.8%), and Health Technologists (70.7%).
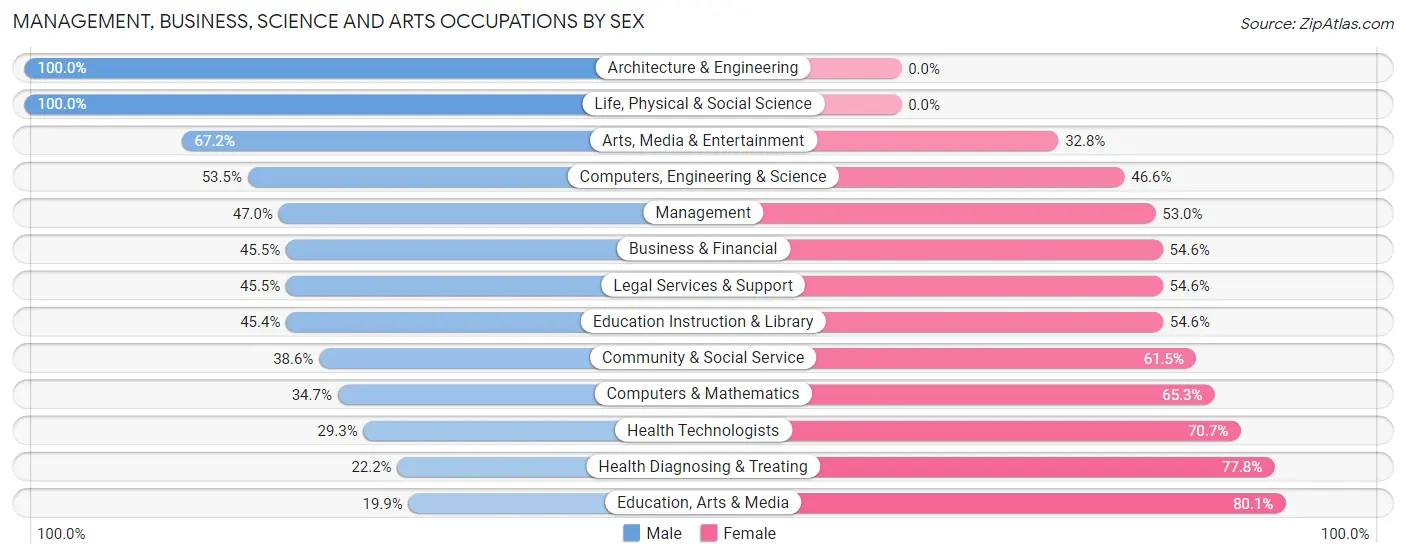
| Occupation | Male | Female |
| Management | 163 (47.0%) | 184 (53.0%) |
| Business & Financial | 90 (45.5%) | 108 (54.5%) |
| Computers, Engineering & Science | 93 (53.4%) | 81 (46.6%) |
| Computers & Mathematics | 43 (34.7%) | 81 (65.3%) |
| Architecture & Engineering | 28 (100.0%) | 0 (0.0%) |
| Life, Physical & Social Science | 22 (100.0%) | 0 (0.0%) |
| Community & Social Service | 224 (38.6%) | 357 (61.5%) |
| Education, Arts & Media | 41 (19.9%) | 165 (80.1%) |
| Legal Services & Support | 30 (45.5%) | 36 (54.5%) |
| Education Instruction & Library | 114 (45.4%) | 137 (54.6%) |
| Arts, Media & Entertainment | 39 (67.2%) | 19 (32.8%) |
| Health Diagnosing & Treating | 48 (22.2%) | 168 (77.8%) |
| Health Technologists | 41 (29.3%) | 99 (70.7%) |
| Total (Category) | 618 (40.8%) | 898 (59.2%) |
| Total (Overall) | 2,320 (48.8%) | 2,430 (51.2%) |
Services Occupations
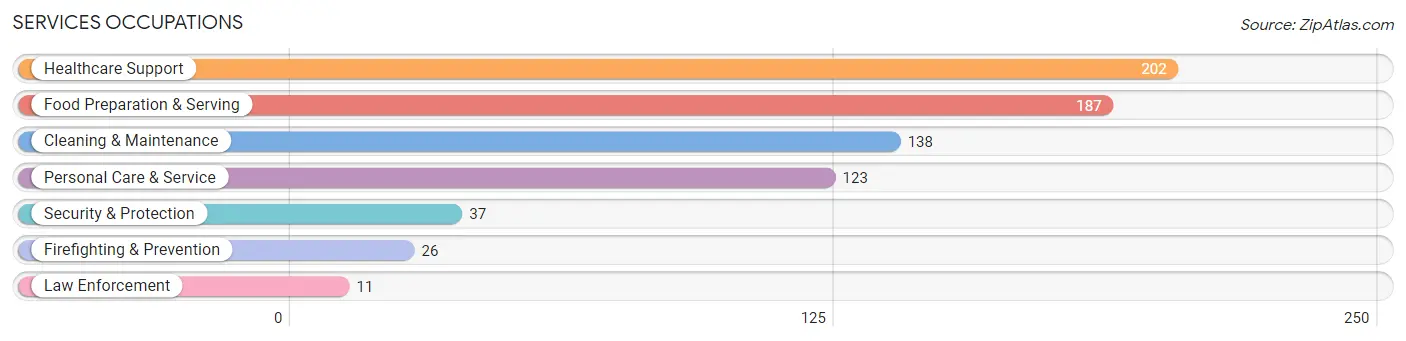
The most common Services occupations in Middletown borough are Healthcare Support (202 | 4.3%), Food Preparation & Serving (187 | 3.9%), Cleaning & Maintenance (138 | 2.9%), Personal Care & Service (123 | 2.6%), and Security & Protection (37 | 0.8%).
Services Occupations by Sex
Within the Services occupations in Middletown borough, the most male-oriented occupations are Security & Protection (100.0%), Firefighting & Prevention (100.0%), and Law Enforcement (100.0%), while the most female-oriented occupations are Healthcare Support (100.0%), Personal Care & Service (80.5%), and Food Preparation & Serving (57.8%).
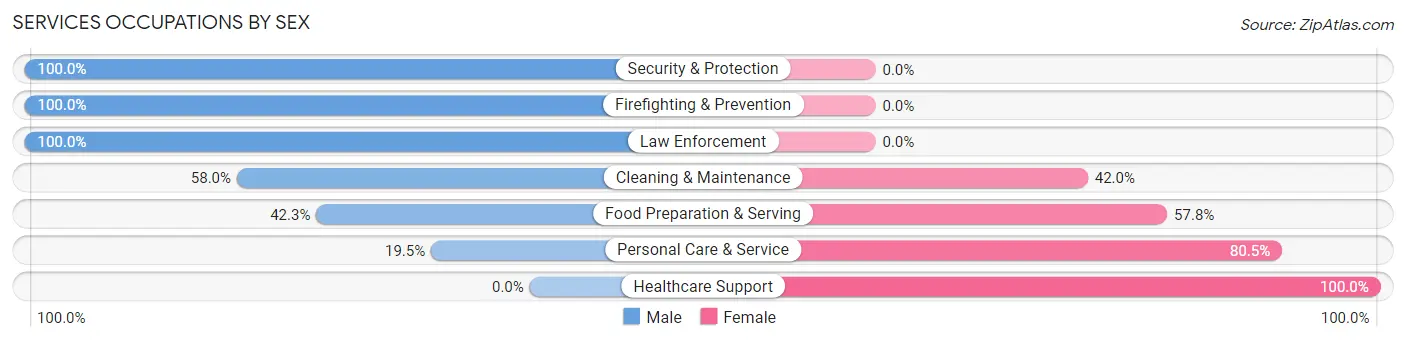
| Occupation | Male | Female |
| Healthcare Support | 0 (0.0%) | 202 (100.0%) |
| Security & Protection | 37 (100.0%) | 0 (0.0%) |
| Firefighting & Prevention | 26 (100.0%) | 0 (0.0%) |
| Law Enforcement | 11 (100.0%) | 0 (0.0%) |
| Food Preparation & Serving | 79 (42.2%) | 108 (57.8%) |
| Cleaning & Maintenance | 80 (58.0%) | 58 (42.0%) |
| Personal Care & Service | 24 (19.5%) | 99 (80.5%) |
| Total (Category) | 220 (32.0%) | 467 (68.0%) |
| Total (Overall) | 2,320 (48.8%) | 2,430 (51.2%) |
Sales and Office Occupations
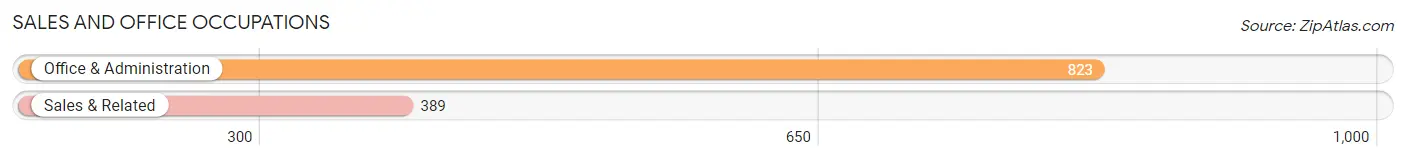
The most common Sales and Office occupations in Middletown borough are Office & Administration (823 | 17.3%), and Sales & Related (389 | 8.2%).
Sales and Office Occupations by Sex
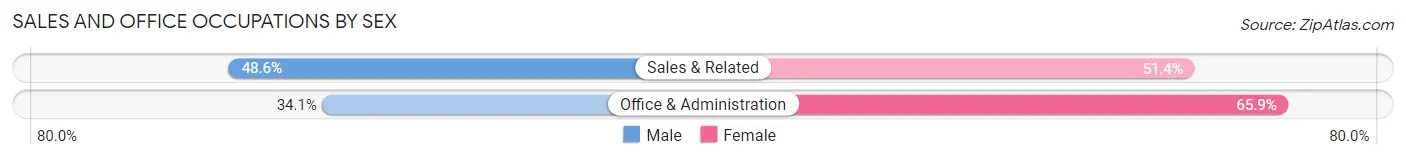
| Occupation | Male | Female |
| Sales & Related | 189 (48.6%) | 200 (51.4%) |
| Office & Administration | 281 (34.1%) | 542 (65.9%) |
| Total (Category) | 470 (38.8%) | 742 (61.2%) |
| Total (Overall) | 2,320 (48.8%) | 2,430 (51.2%) |
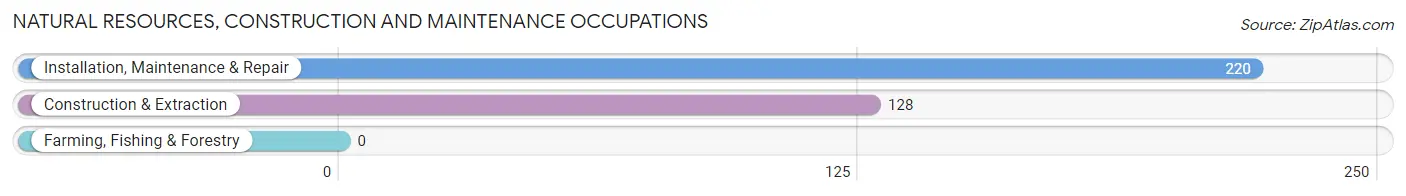
Natural Resources, Construction and Maintenance Occupations
The most common Natural Resources, Construction and Maintenance occupations in Middletown borough are Installation, Maintenance & Repair (220 | 4.6%), and Construction & Extraction (128 | 2.7%).
Natural Resources, Construction and Maintenance Occupations by Sex
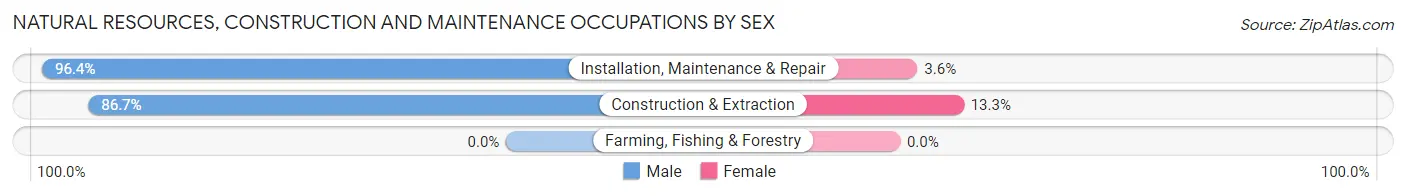
| Occupation | Male | Female |
| Farming, Fishing & Forestry | 0 (0.0%) | 0 (0.0%) |
| Construction & Extraction | 111 (86.7%) | 17 (13.3%) |
| Installation, Maintenance & Repair | 212 (96.4%) | 8 (3.6%) |
| Total (Category) | 323 (92.8%) | 25 (7.2%) |
| Total (Overall) | 2,320 (48.8%) | 2,430 (51.2%) |
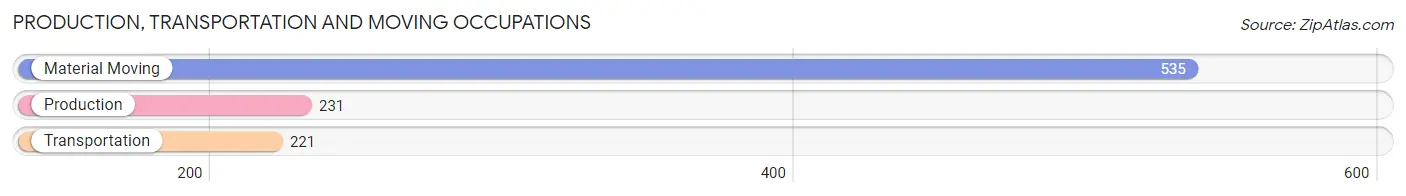
Production, Transportation and Moving Occupations
The most common Production, Transportation and Moving occupations in Middletown borough are Material Moving (535 | 11.3%), Production (231 | 4.9%), and Transportation (221 | 4.6%).
Production, Transportation and Moving Occupations by Sex
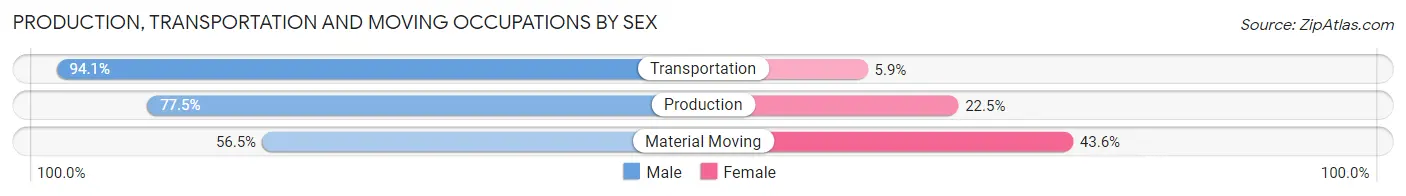
| Occupation | Male | Female |
| Production | 179 (77.5%) | 52 (22.5%) |
| Transportation | 208 (94.1%) | 13 (5.9%) |
| Material Moving | 302 (56.5%) | 233 (43.5%) |
| Total (Category) | 689 (69.8%) | 298 (30.2%) |
| Total (Overall) | 2,320 (48.8%) | 2,430 (51.2%) |
Employment Industries by Sex in Middletown borough
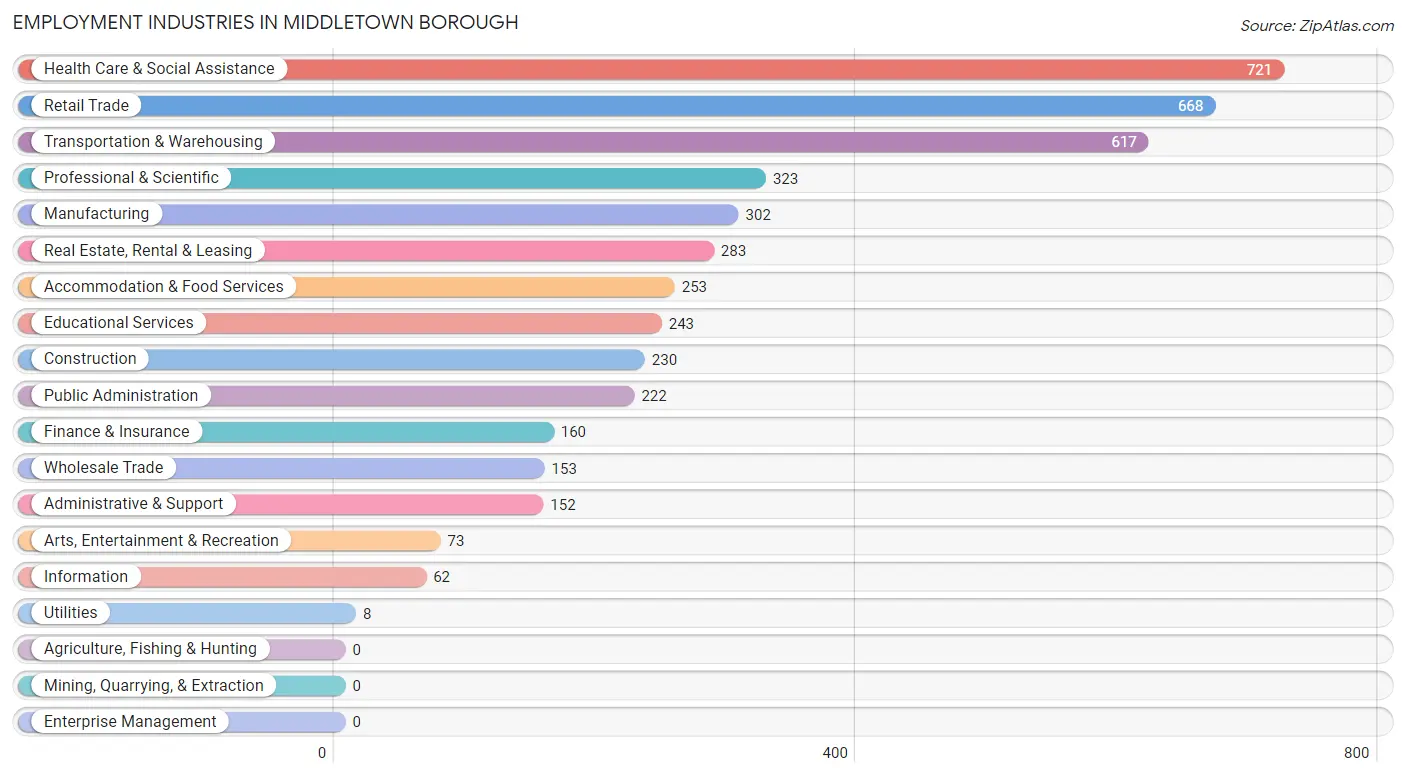
Employment Industries in Middletown borough
The major employment industries in Middletown borough include Health Care & Social Assistance (721 | 15.2%), Retail Trade (668 | 14.1%), Transportation & Warehousing (617 | 13.0%), Professional & Scientific (323 | 6.8%), and Manufacturing (302 | 6.4%).
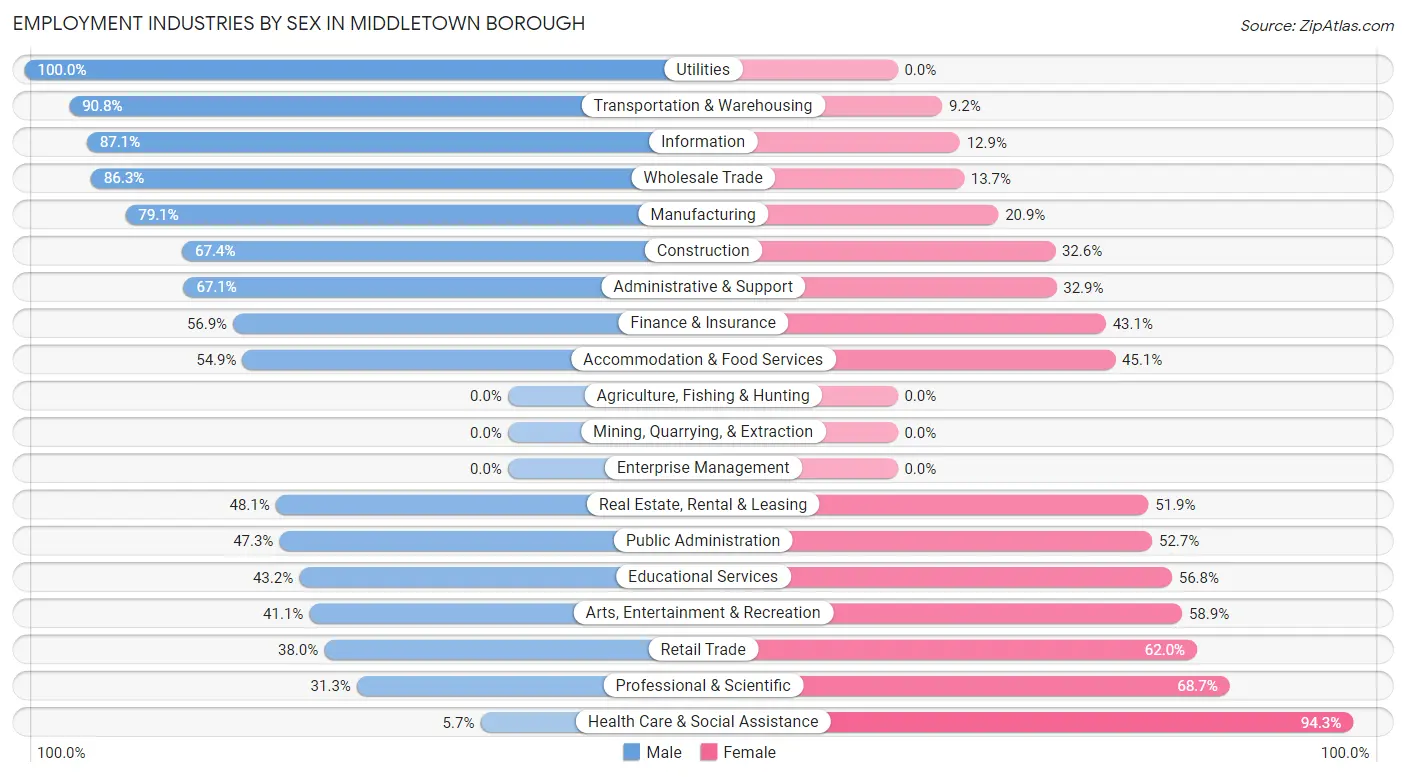
Employment Industries by Sex in Middletown borough
The Middletown borough industries that see more men than women are Utilities (100.0%), Transportation & Warehousing (90.8%), and Information (87.1%), whereas the industries that tend to have a higher number of women are Health Care & Social Assistance (94.3%), Professional & Scientific (68.7%), and Retail Trade (62.0%).
| Industry | Male | Female |
| Agriculture, Fishing & Hunting | 0 (0.0%) | 0 (0.0%) |
| Mining, Quarrying, & Extraction | 0 (0.0%) | 0 (0.0%) |
| Construction | 155 (67.4%) | 75 (32.6%) |
| Manufacturing | 239 (79.1%) | 63 (20.9%) |
| Wholesale Trade | 132 (86.3%) | 21 (13.7%) |
| Retail Trade | 254 (38.0%) | 414 (62.0%) |
| Transportation & Warehousing | 560 (90.8%) | 57 (9.2%) |
| Utilities | 8 (100.0%) | 0 (0.0%) |
| Information | 54 (87.1%) | 8 (12.9%) |
| Finance & Insurance | 91 (56.9%) | 69 (43.1%) |
| Real Estate, Rental & Leasing | 136 (48.1%) | 147 (51.9%) |
| Professional & Scientific | 101 (31.3%) | 222 (68.7%) |
| Enterprise Management | 0 (0.0%) | 0 (0.0%) |
| Administrative & Support | 102 (67.1%) | 50 (32.9%) |
| Educational Services | 105 (43.2%) | 138 (56.8%) |
| Health Care & Social Assistance | 41 (5.7%) | 680 (94.3%) |
| Arts, Entertainment & Recreation | 30 (41.1%) | 43 (58.9%) |
| Accommodation & Food Services | 139 (54.9%) | 114 (45.1%) |
| Public Administration | 105 (47.3%) | 117 (52.7%) |
| Total | 2,320 (48.8%) | 2,430 (51.2%) |
Education in Middletown borough
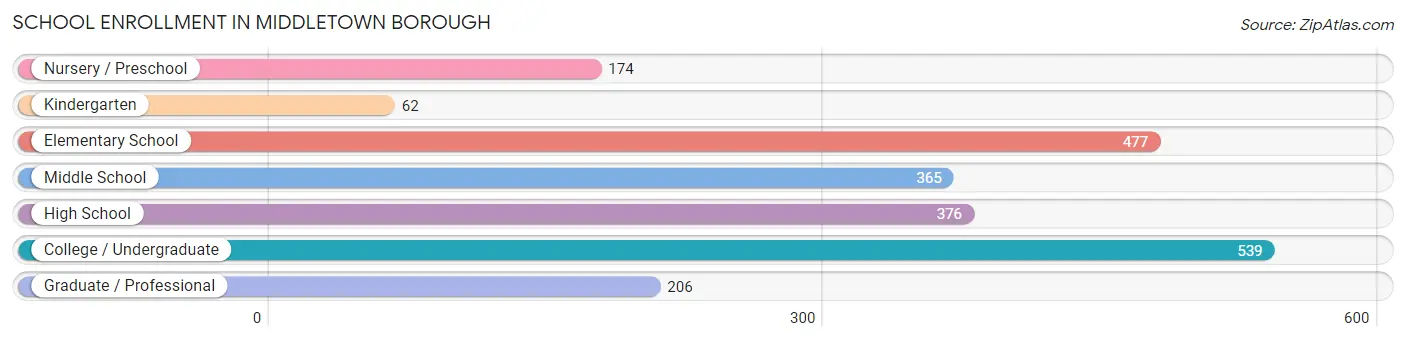
School Enrollment in Middletown borough
The most common levels of schooling among the 2,199 students in Middletown borough are college / undergraduate (539 | 24.5%), elementary school (477 | 21.7%), and high school (376 | 17.1%).
| School Level | # Students | % Students |
| Nursery / Preschool | 174 | 7.9% |
| Kindergarten | 62 | 2.8% |
| Elementary School | 477 | 21.7% |
| Middle School | 365 | 16.6% |
| High School | 376 | 17.1% |
| College / Undergraduate | 539 | 24.5% |
| Graduate / Professional | 206 | 9.4% |
| Total | 2,199 | 100.0% |
School Enrollment by Age by Funding Source in Middletown borough
Out of a total of 2,199 students who are enrolled in schools in Middletown borough, 385 (17.5%) attend a private institution, while the remaining 1,814 (82.5%) are enrolled in public schools. The age group of 25 to 34 year olds has the highest likelihood of being enrolled in private schools, with 104 (51.0% in the age bracket) enrolled. Conversely, the age group of 35 years and over has the lowest likelihood of being enrolled in a private school, with 24 (100.0% in the age bracket) attending a public institution.
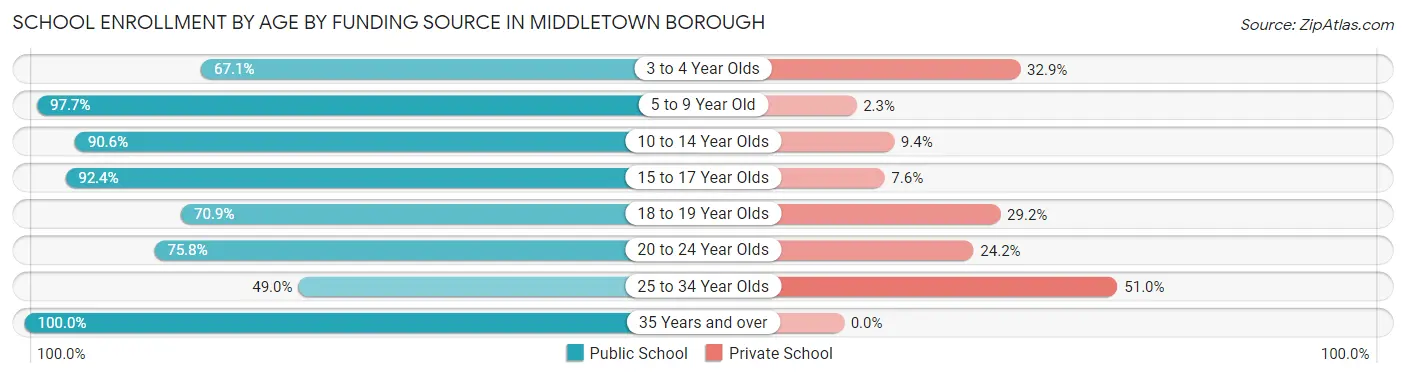
| Age Bracket | Public School | Private School |
| 3 to 4 Year Olds | 96 (67.1%) | 47 (32.9%) |
| 5 to 9 Year Old | 500 (97.7%) | 12 (2.3%) |
| 10 to 14 Year Olds | 436 (90.6%) | 45 (9.4%) |
| 15 to 17 Year Olds | 219 (92.4%) | 18 (7.6%) |
| 18 to 19 Year Olds | 192 (70.9%) | 79 (29.1%) |
| 20 to 24 Year Olds | 248 (75.8%) | 79 (24.2%) |
| 25 to 34 Year Olds | 100 (49.0%) | 104 (51.0%) |
| 35 Years and over | 24 (100.0%) | 0 (0.0%) |
| Total | 1,814 (82.5%) | 385 (17.5%) |
Educational Attainment by Field of Study in Middletown borough
Psychology (200 | 13.3%), education (200 | 13.3%), business (196 | 13.1%), science & technology (167 | 11.1%), and social sciences (158 | 10.5%) are the most common fields of study among 1,501 individuals in Middletown borough who have obtained a bachelor's degree or higher.
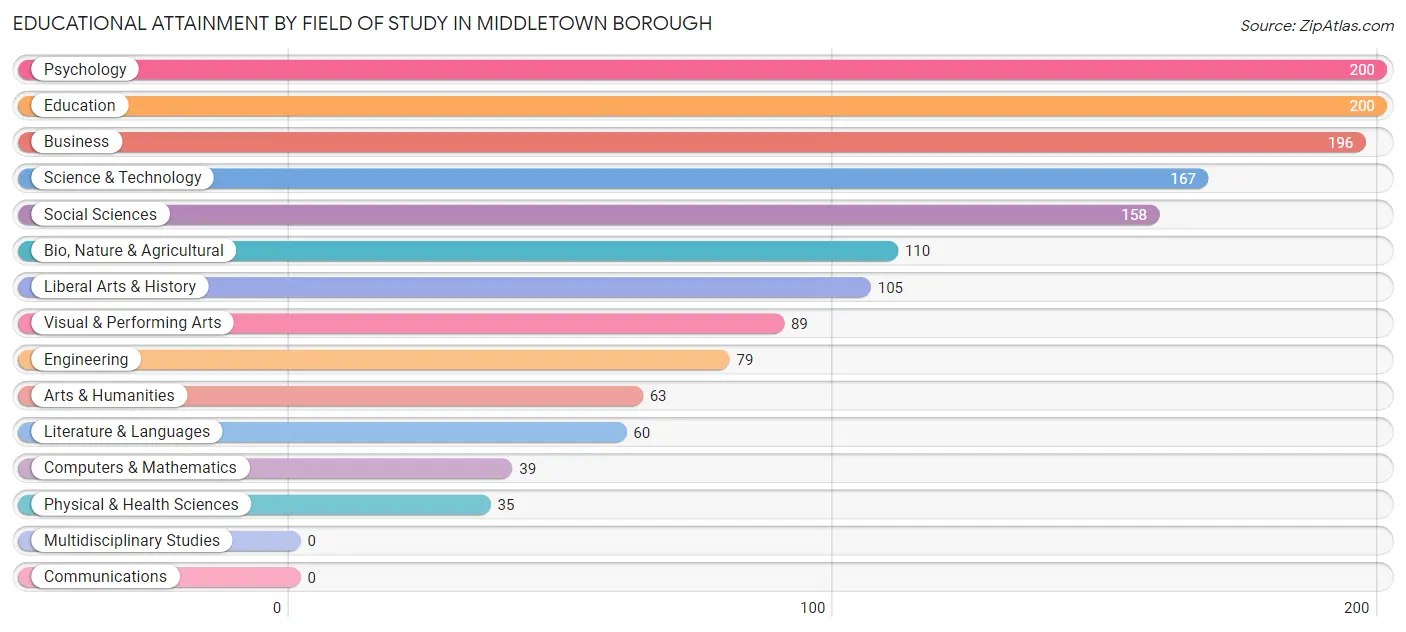
| Field of Study | # Graduates | % Graduates |
| Computers & Mathematics | 39 | 2.6% |
| Bio, Nature & Agricultural | 110 | 7.3% |
| Physical & Health Sciences | 35 | 2.3% |
| Psychology | 200 | 13.3% |
| Social Sciences | 158 | 10.5% |
| Engineering | 79 | 5.3% |
| Multidisciplinary Studies | 0 | 0.0% |
| Science & Technology | 167 | 11.1% |
| Business | 196 | 13.1% |
| Education | 200 | 13.3% |
| Literature & Languages | 60 | 4.0% |
| Liberal Arts & History | 105 | 7.0% |
| Visual & Performing Arts | 89 | 5.9% |
| Communications | 0 | 0.0% |
| Arts & Humanities | 63 | 4.2% |
| Total | 1,501 | 100.0% |
Transportation & Commute in Middletown borough
Vehicle Availability by Sex in Middletown borough
The most prevalent vehicle ownership categories in Middletown borough are males with 2 vehicles (1,049, accounting for 45.6%) and females with 2 vehicles (935, making up 43.5%).
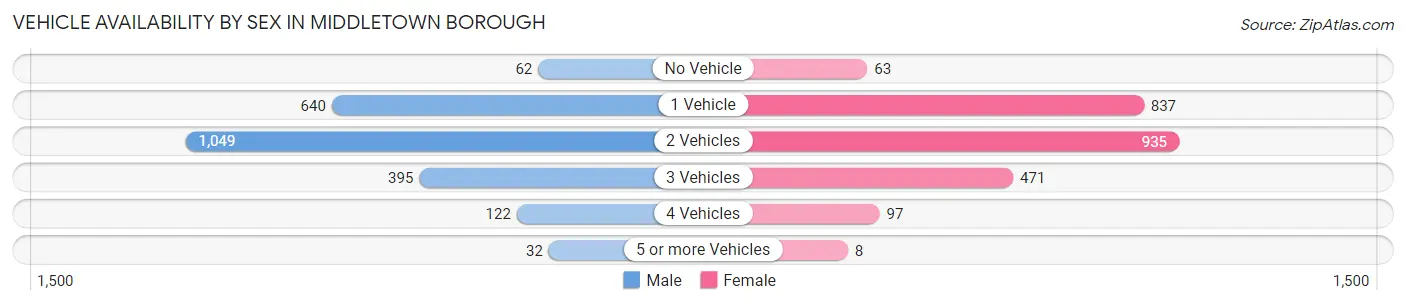
| Vehicles Available | Male | Female |
| No Vehicle | 62 (2.7%) | 63 (2.6%) |
| 1 Vehicle | 640 (27.8%) | 837 (34.7%) |
| 2 Vehicles | 1,049 (45.6%) | 935 (38.8%) |
| 3 Vehicles | 395 (17.2%) | 471 (19.5%) |
| 4 Vehicles | 122 (5.3%) | 97 (4.0%) |
| 5 or more Vehicles | 32 (1.4%) | 8 (0.3%) |
| Total | 2,300 (100.0%) | 2,411 (100.0%) |
Commute Time in Middletown borough
The most frequently occuring commute durations in Middletown borough are 15 to 19 minutes (1,022 commuters, 22.8%), 20 to 24 minutes (871 commuters, 19.5%), and 30 to 34 minutes (700 commuters, 15.6%).
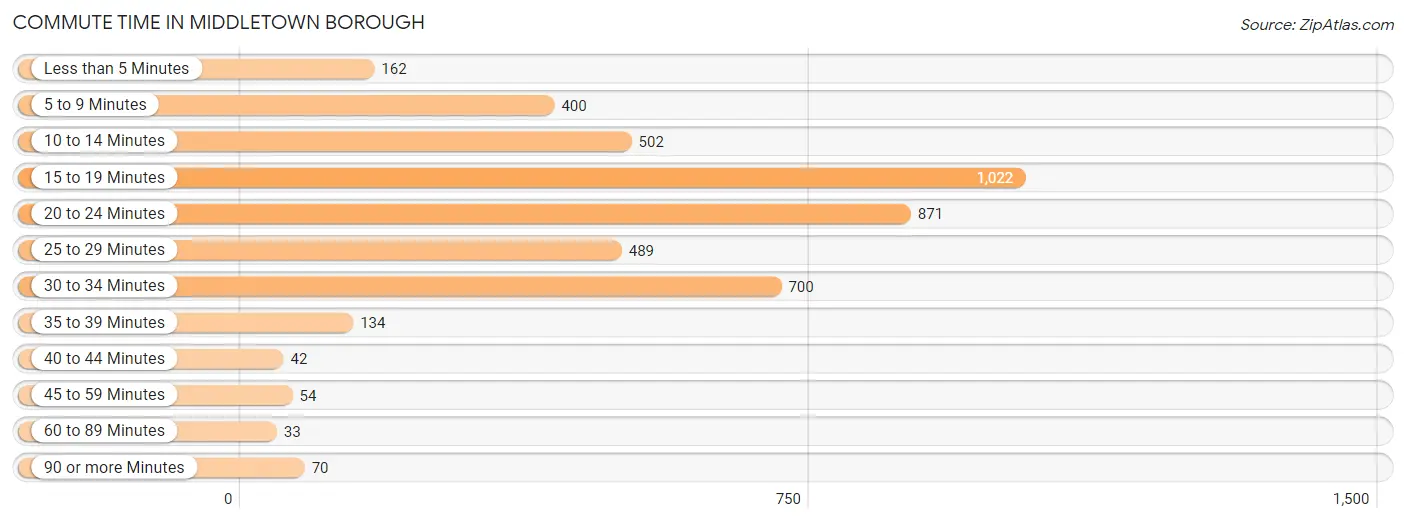
| Commute Time | # Commuters | % Commuters |
| Less than 5 Minutes | 162 | 3.6% |
| 5 to 9 Minutes | 400 | 8.9% |
| 10 to 14 Minutes | 502 | 11.2% |
| 15 to 19 Minutes | 1,022 | 22.8% |
| 20 to 24 Minutes | 871 | 19.5% |
| 25 to 29 Minutes | 489 | 10.9% |
| 30 to 34 Minutes | 700 | 15.6% |
| 35 to 39 Minutes | 134 | 3.0% |
| 40 to 44 Minutes | 42 | 0.9% |
| 45 to 59 Minutes | 54 | 1.2% |
| 60 to 89 Minutes | 33 | 0.7% |
| 90 or more Minutes | 70 | 1.6% |
Commute Time by Sex in Middletown borough
The most common commute times in Middletown borough are 15 to 19 minutes (459 commuters, 20.9%) for males and 15 to 19 minutes (563 commuters, 24.7%) for females.
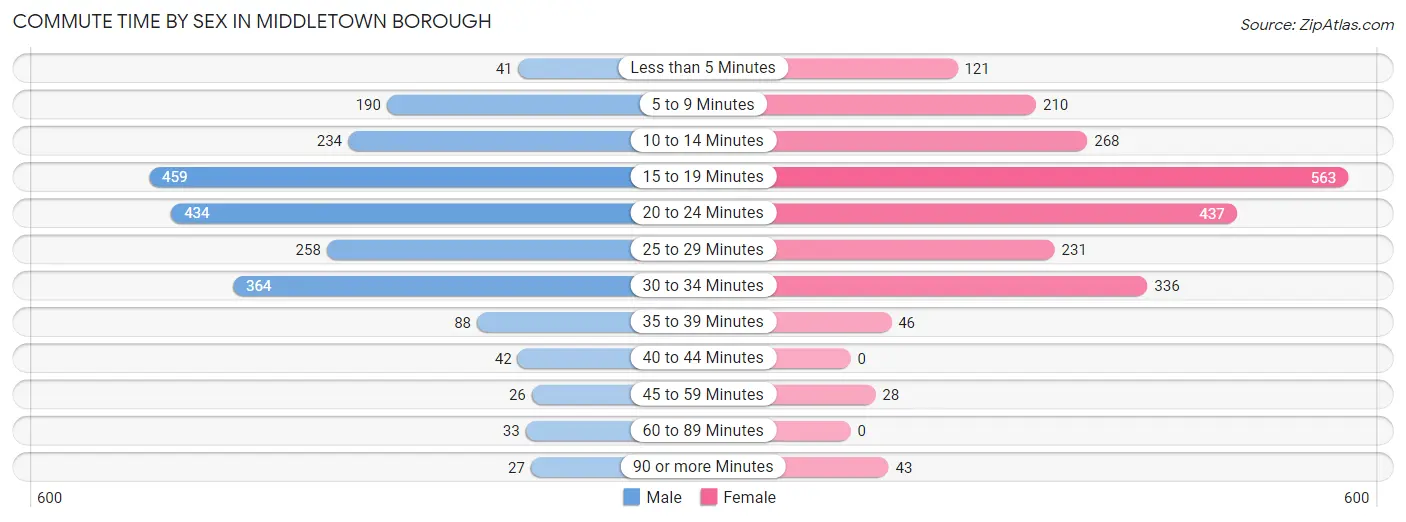
| Commute Time | Male | Female |
| Less than 5 Minutes | 41 (1.9%) | 121 (5.3%) |
| 5 to 9 Minutes | 190 (8.6%) | 210 (9.2%) |
| 10 to 14 Minutes | 234 (10.7%) | 268 (11.7%) |
| 15 to 19 Minutes | 459 (20.9%) | 563 (24.7%) |
| 20 to 24 Minutes | 434 (19.8%) | 437 (19.1%) |
| 25 to 29 Minutes | 258 (11.7%) | 231 (10.1%) |
| 30 to 34 Minutes | 364 (16.6%) | 336 (14.7%) |
| 35 to 39 Minutes | 88 (4.0%) | 46 (2.0%) |
| 40 to 44 Minutes | 42 (1.9%) | 0 (0.0%) |
| 45 to 59 Minutes | 26 (1.2%) | 28 (1.2%) |
| 60 to 89 Minutes | 33 (1.5%) | 0 (0.0%) |
| 90 or more Minutes | 27 (1.2%) | 43 (1.9%) |
Time of Departure to Work by Sex in Middletown borough
The most frequent times of departure to work in Middletown borough are 4:00 PM to 11:59 PM (309, 14.1%) for males and 7:30 AM to 7:59 AM (432, 18.9%) for females.
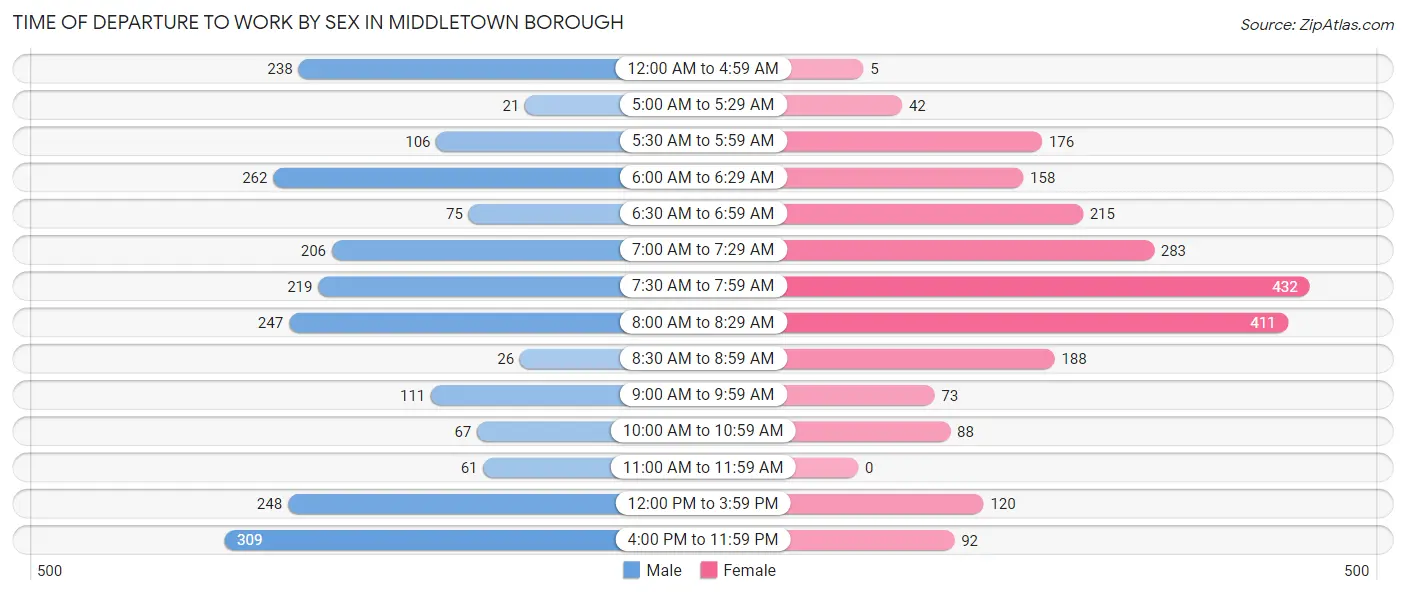
| Time of Departure | Male | Female |
| 12:00 AM to 4:59 AM | 238 (10.8%) | 5 (0.2%) |
| 5:00 AM to 5:29 AM | 21 (1.0%) | 42 (1.8%) |
| 5:30 AM to 5:59 AM | 106 (4.8%) | 176 (7.7%) |
| 6:00 AM to 6:29 AM | 262 (11.9%) | 158 (6.9%) |
| 6:30 AM to 6:59 AM | 75 (3.4%) | 215 (9.4%) |
| 7:00 AM to 7:29 AM | 206 (9.4%) | 283 (12.4%) |
| 7:30 AM to 7:59 AM | 219 (10.0%) | 432 (18.9%) |
| 8:00 AM to 8:29 AM | 247 (11.3%) | 411 (18.0%) |
| 8:30 AM to 8:59 AM | 26 (1.2%) | 188 (8.2%) |
| 9:00 AM to 9:59 AM | 111 (5.1%) | 73 (3.2%) |
| 10:00 AM to 10:59 AM | 67 (3.0%) | 88 (3.8%) |
| 11:00 AM to 11:59 AM | 61 (2.8%) | 0 (0.0%) |
| 12:00 PM to 3:59 PM | 248 (11.3%) | 120 (5.3%) |
| 4:00 PM to 11:59 PM | 309 (14.1%) | 92 (4.0%) |
| Total | 2,196 (100.0%) | 2,283 (100.0%) |
Housing Occupancy in Middletown borough
Occupancy by Ownership in Middletown borough
Of the total 4,292 dwellings in Middletown borough, owner-occupied units account for 1,938 (45.2%), while renter-occupied units make up 2,354 (54.8%).
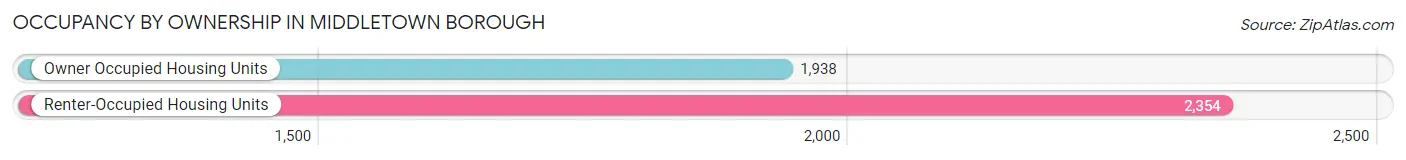
| Occupancy | # Housing Units | % Housing Units |
| Owner Occupied Housing Units | 1,938 | 45.2% |
| Renter-Occupied Housing Units | 2,354 | 54.8% |
| Total Occupied Housing Units | 4,292 | 100.0% |
Occupancy by Household Size in Middletown borough
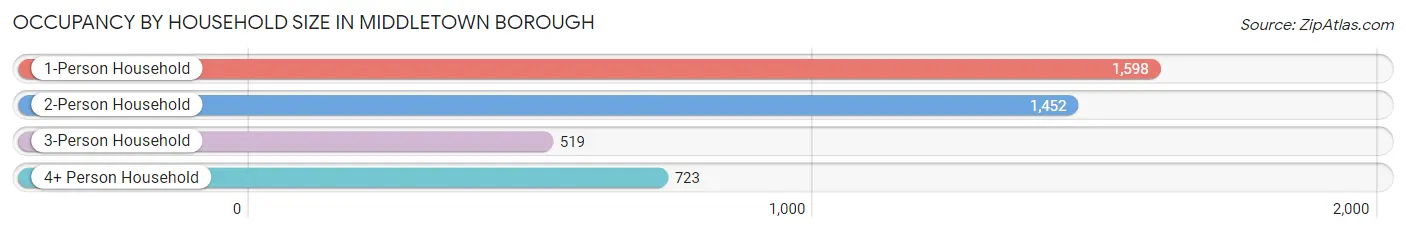
| Household Size | # Housing Units | % Housing Units |
| 1-Person Household | 1,598 | 37.2% |
| 2-Person Household | 1,452 | 33.8% |
| 3-Person Household | 519 | 12.1% |
| 4+ Person Household | 723 | 16.9% |
| Total Housing Units | 4,292 | 100.0% |
Occupancy by Ownership by Household Size in Middletown borough
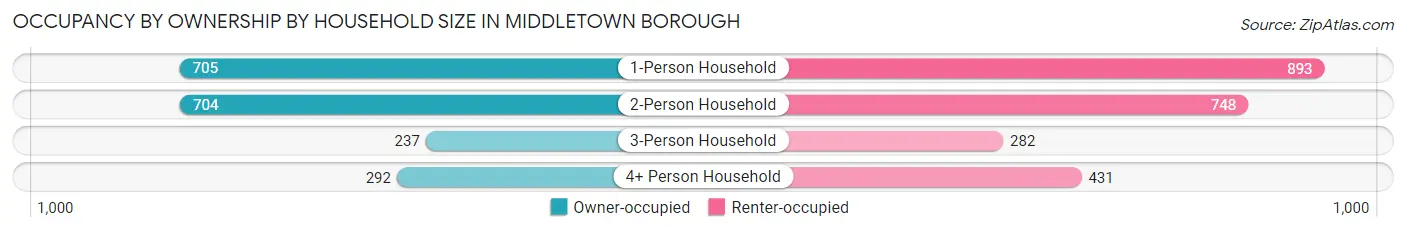
| Household Size | Owner-occupied | Renter-occupied |
| 1-Person Household | 705 (44.1%) | 893 (55.9%) |
| 2-Person Household | 704 (48.5%) | 748 (51.5%) |
| 3-Person Household | 237 (45.7%) | 282 (54.3%) |
| 4+ Person Household | 292 (40.4%) | 431 (59.6%) |
| Total Housing Units | 1,938 (45.2%) | 2,354 (54.8%) |
Occupancy by Educational Attainment in Middletown borough
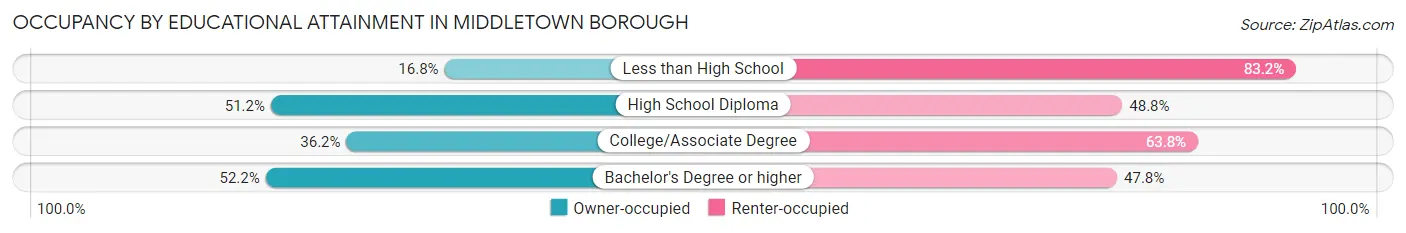
| Household Size | Owner-occupied | Renter-occupied |
| Less than High School | 56 (16.8%) | 278 (83.2%) |
| High School Diploma | 970 (51.2%) | 925 (48.8%) |
| College/Associate Degree | 374 (36.2%) | 659 (63.8%) |
| Bachelor's Degree or higher | 538 (52.2%) | 492 (47.8%) |
Occupancy by Age of Householder in Middletown borough
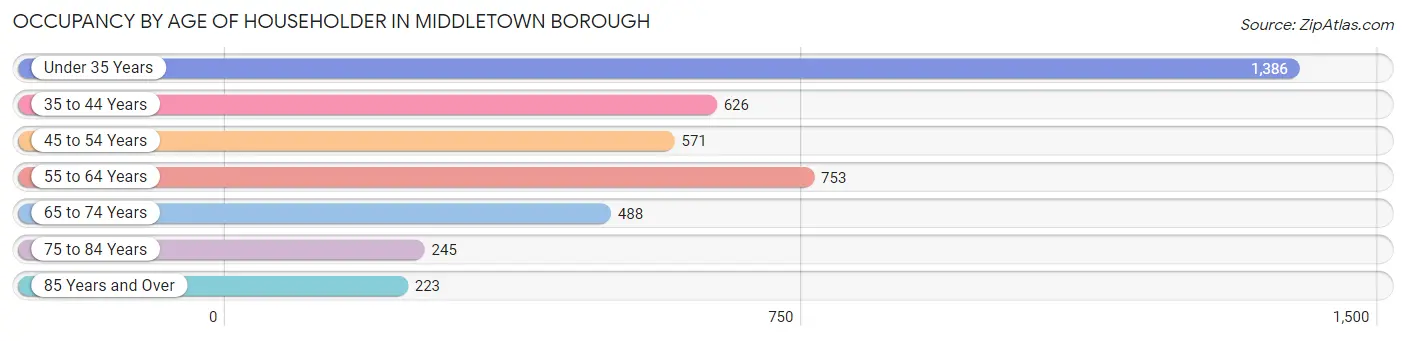
| Age Bracket | # Households | % Households |
| Under 35 Years | 1,386 | 32.3% |
| 35 to 44 Years | 626 | 14.6% |
| 45 to 54 Years | 571 | 13.3% |
| 55 to 64 Years | 753 | 17.5% |
| 65 to 74 Years | 488 | 11.4% |
| 75 to 84 Years | 245 | 5.7% |
| 85 Years and Over | 223 | 5.2% |
| Total | 4,292 | 100.0% |
Housing Finances in Middletown borough
Median Income by Occupancy in Middletown borough
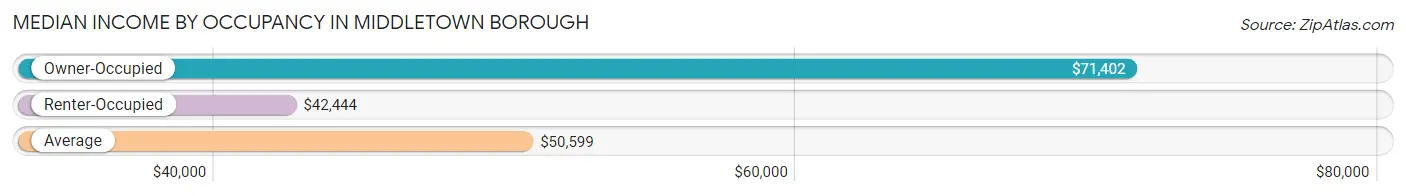
| Occupancy Type | # Households | Median Income |
| Owner-Occupied | 1,938 (45.2%) | $71,402 |
| Renter-Occupied | 2,354 (54.8%) | $42,444 |
| Average | 4,292 (100.0%) | $50,599 |
Occupancy by Householder Income Bracket in Middletown borough
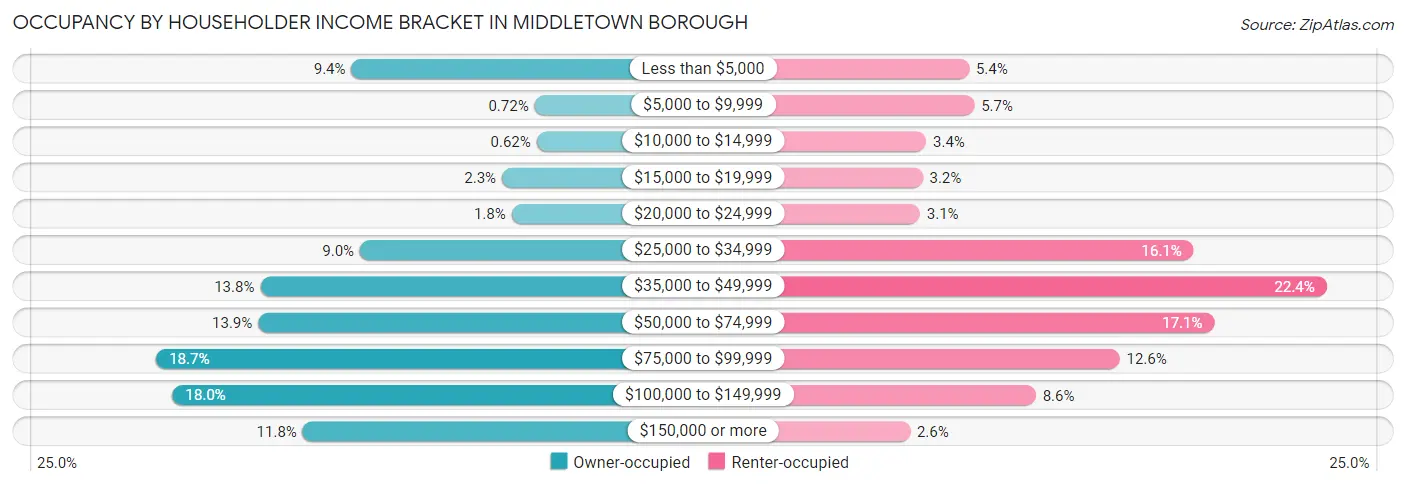
| Income Bracket | Owner-occupied | Renter-occupied |
| Less than $5,000 | 183 (9.4%) | 127 (5.4%) |
| $5,000 to $9,999 | 14 (0.7%) | 133 (5.7%) |
| $10,000 to $14,999 | 12 (0.6%) | 79 (3.4%) |
| $15,000 to $19,999 | 44 (2.3%) | 75 (3.2%) |
| $20,000 to $24,999 | 35 (1.8%) | 72 (3.1%) |
| $25,000 to $34,999 | 175 (9.0%) | 379 (16.1%) |
| $35,000 to $49,999 | 267 (13.8%) | 528 (22.4%) |
| $50,000 to $74,999 | 269 (13.9%) | 402 (17.1%) |
| $75,000 to $99,999 | 363 (18.7%) | 296 (12.6%) |
| $100,000 to $149,999 | 348 (18.0%) | 202 (8.6%) |
| $150,000 or more | 228 (11.8%) | 61 (2.6%) |
| Total | 1,938 (100.0%) | 2,354 (100.0%) |
Monthly Housing Cost Tiers in Middletown borough
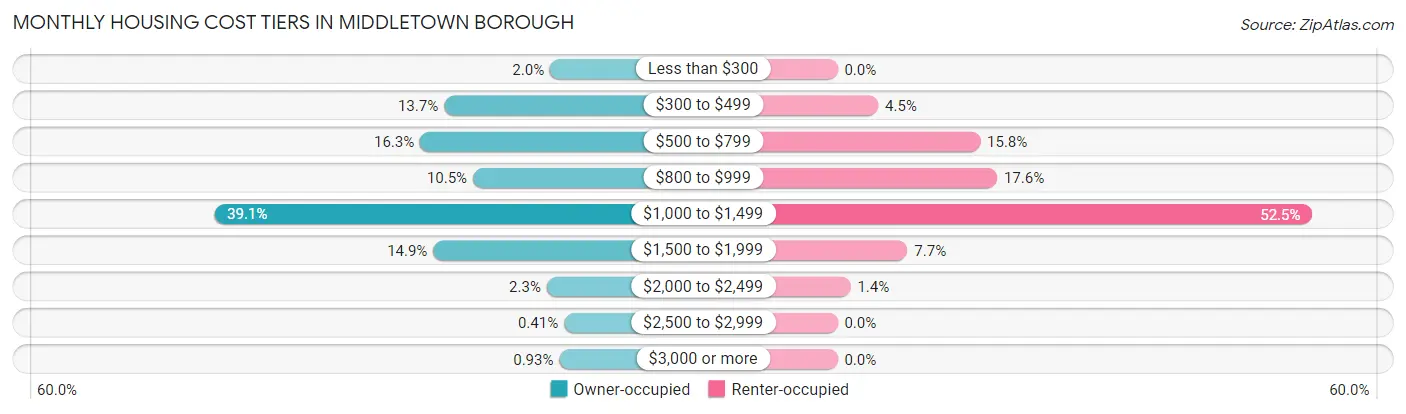
| Monthly Cost | Owner-occupied | Renter-occupied |
| Less than $300 | 38 (2.0%) | 0 (0.0%) |
| $300 to $499 | 265 (13.7%) | 106 (4.5%) |
| $500 to $799 | 316 (16.3%) | 371 (15.8%) |
| $800 to $999 | 203 (10.5%) | 415 (17.6%) |
| $1,000 to $1,499 | 757 (39.1%) | 1,235 (52.5%) |
| $1,500 to $1,999 | 288 (14.9%) | 182 (7.7%) |
| $2,000 to $2,499 | 45 (2.3%) | 34 (1.4%) |
| $2,500 to $2,999 | 8 (0.4%) | 0 (0.0%) |
| $3,000 or more | 18 (0.9%) | 0 (0.0%) |
| Total | 1,938 (100.0%) | 2,354 (100.0%) |
Physical Housing Characteristics in Middletown borough
Housing Structures in Middletown borough
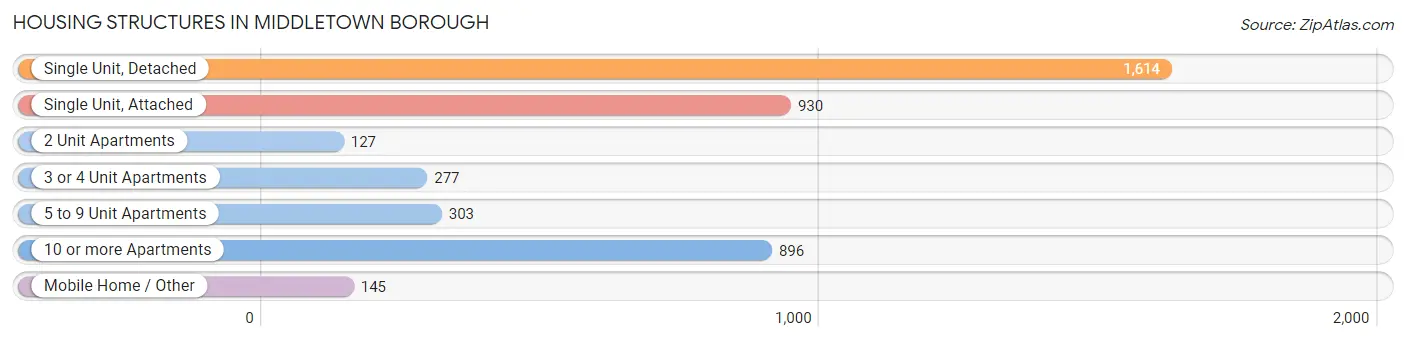
| Structure Type | # Housing Units | % Housing Units |
| Single Unit, Detached | 1,614 | 37.6% |
| Single Unit, Attached | 930 | 21.7% |
| 2 Unit Apartments | 127 | 3.0% |
| 3 or 4 Unit Apartments | 277 | 6.5% |
| 5 to 9 Unit Apartments | 303 | 7.1% |
| 10 or more Apartments | 896 | 20.9% |
| Mobile Home / Other | 145 | 3.4% |
| Total | 4,292 | 100.0% |
Housing Structures by Occupancy in Middletown borough
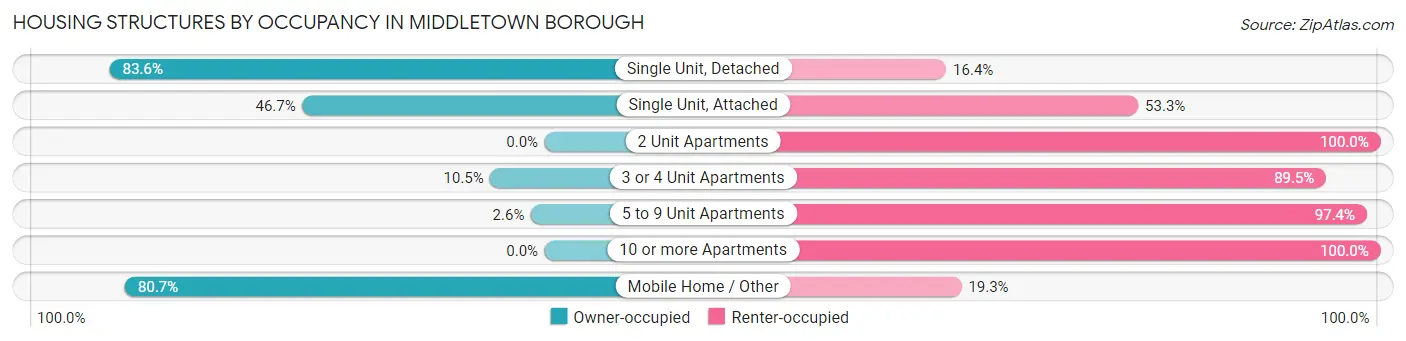
| Structure Type | Owner-occupied | Renter-occupied |
| Single Unit, Detached | 1,350 (83.6%) | 264 (16.4%) |
| Single Unit, Attached | 434 (46.7%) | 496 (53.3%) |
| 2 Unit Apartments | 0 (0.0%) | 127 (100.0%) |
| 3 or 4 Unit Apartments | 29 (10.5%) | 248 (89.5%) |
| 5 to 9 Unit Apartments | 8 (2.6%) | 295 (97.4%) |
| 10 or more Apartments | 0 (0.0%) | 896 (100.0%) |
| Mobile Home / Other | 117 (80.7%) | 28 (19.3%) |
| Total | 1,938 (45.2%) | 2,354 (54.8%) |
Housing Structures by Number of Rooms in Middletown borough
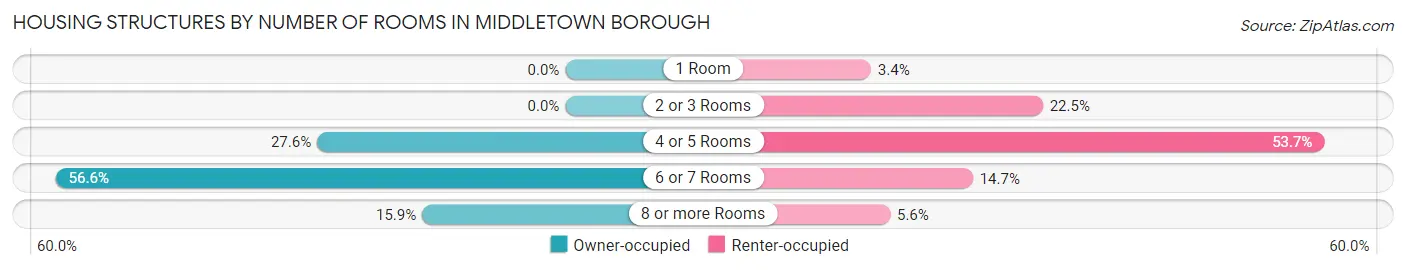
| Number of Rooms | Owner-occupied | Renter-occupied |
| 1 Room | 0 (0.0%) | 81 (3.4%) |
| 2 or 3 Rooms | 0 (0.0%) | 530 (22.5%) |
| 4 or 5 Rooms | 534 (27.6%) | 1,265 (53.7%) |
| 6 or 7 Rooms | 1,096 (56.6%) | 347 (14.7%) |
| 8 or more Rooms | 308 (15.9%) | 131 (5.6%) |
| Total | 1,938 (100.0%) | 2,354 (100.0%) |
Housing Structure by Heating Type in Middletown borough
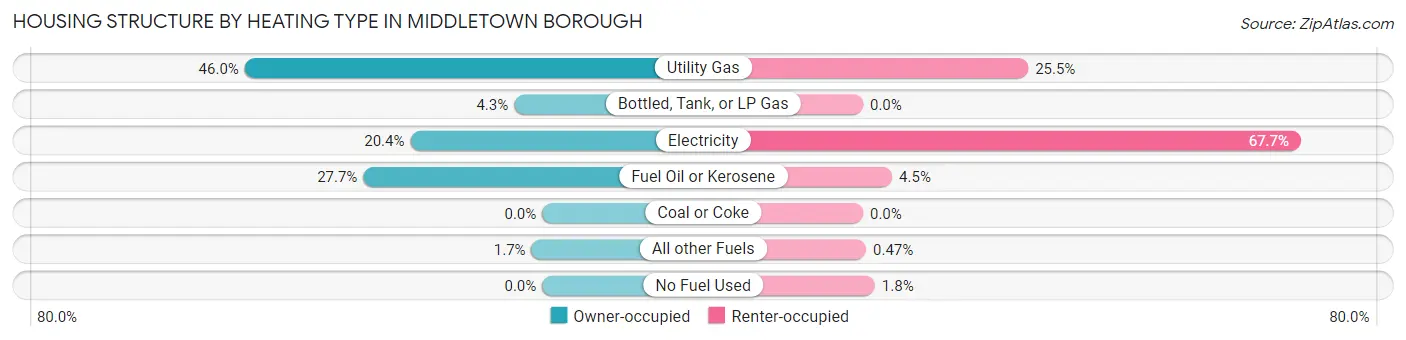
| Heating Type | Owner-occupied | Renter-occupied |
| Utility Gas | 891 (46.0%) | 601 (25.5%) |
| Bottled, Tank, or LP Gas | 84 (4.3%) | 0 (0.0%) |
| Electricity | 395 (20.4%) | 1,593 (67.7%) |
| Fuel Oil or Kerosene | 536 (27.7%) | 106 (4.5%) |
| Coal or Coke | 0 (0.0%) | 0 (0.0%) |
| All other Fuels | 32 (1.7%) | 11 (0.5%) |
| No Fuel Used | 0 (0.0%) | 43 (1.8%) |
| Total | 1,938 (100.0%) | 2,354 (100.0%) |
Household Vehicle Usage in Middletown borough
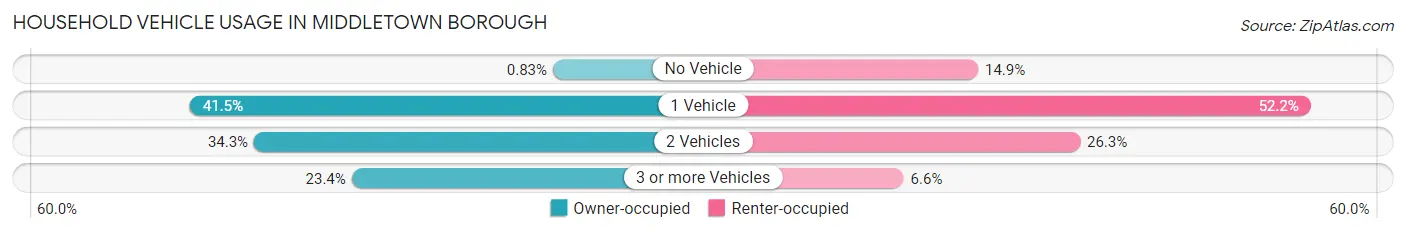
| Vehicles per Household | Owner-occupied | Renter-occupied |
| No Vehicle | 16 (0.8%) | 351 (14.9%) |
| 1 Vehicle | 804 (41.5%) | 1,228 (52.2%) |
| 2 Vehicles | 665 (34.3%) | 620 (26.3%) |
| 3 or more Vehicles | 453 (23.4%) | 155 (6.6%) |
| Total | 1,938 (100.0%) | 2,354 (100.0%) |
Real Estate & Mortgages in Middletown borough
Real Estate and Mortgage Overview in Middletown borough
| Characteristic | Without Mortgage | With Mortgage |
| Housing Units | 618 | 1,320 |
| Median Property Value | $134,700 | $147,800 |
| Median Household Income | $47,500 | $196 |
| Monthly Housing Costs | $545 | $18 |
| Real Estate Taxes | $2,236 | $0 |
Property Value by Mortgage Status in Middletown borough
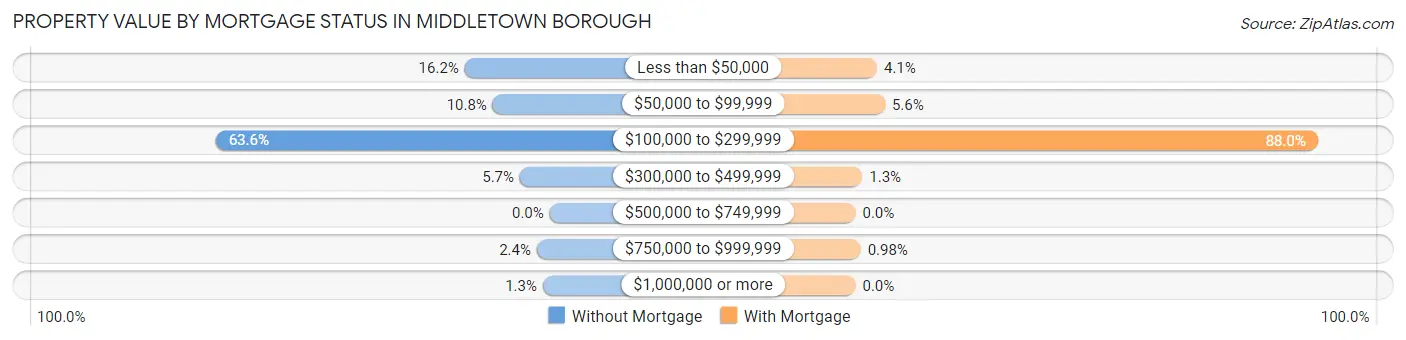
| Property Value | Without Mortgage | With Mortgage |
| Less than $50,000 | 100 (16.2%) | 54 (4.1%) |
| $50,000 to $99,999 | 67 (10.8%) | 74 (5.6%) |
| $100,000 to $299,999 | 393 (63.6%) | 1,162 (88.0%) |
| $300,000 to $499,999 | 35 (5.7%) | 17 (1.3%) |
| $500,000 to $749,999 | 0 (0.0%) | 0 (0.0%) |
| $750,000 to $999,999 | 15 (2.4%) | 13 (1.0%) |
| $1,000,000 or more | 8 (1.3%) | 0 (0.0%) |
| Total | 618 (100.0%) | 1,320 (100.0%) |
Household Income by Mortgage Status in Middletown borough
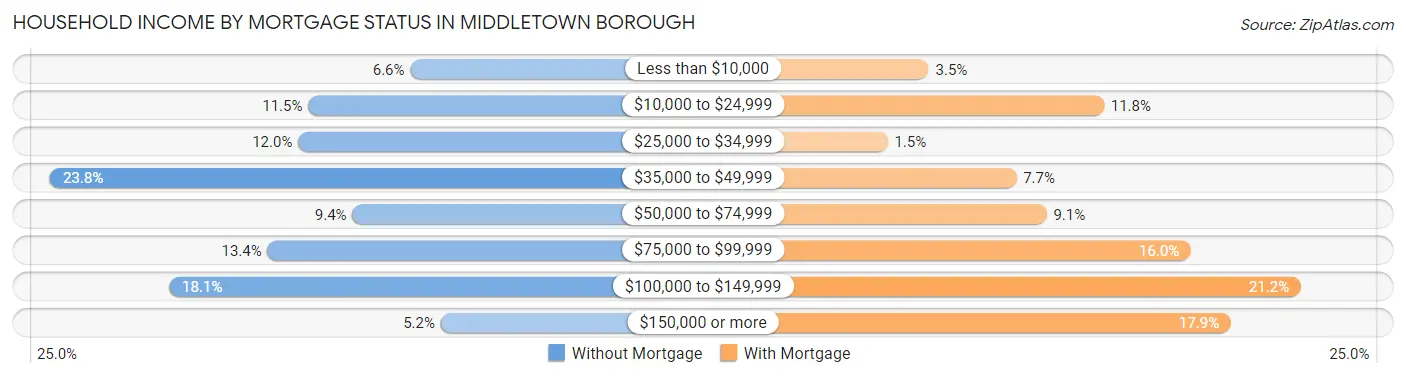
| Household Income | Without Mortgage | With Mortgage |
| Less than $10,000 | 41 (6.6%) | 46 (3.5%) |
| $10,000 to $24,999 | 71 (11.5%) | 156 (11.8%) |
| $25,000 to $34,999 | 74 (12.0%) | 20 (1.5%) |
| $35,000 to $49,999 | 147 (23.8%) | 101 (7.6%) |
| $50,000 to $74,999 | 58 (9.4%) | 120 (9.1%) |
| $75,000 to $99,999 | 83 (13.4%) | 211 (16.0%) |
| $100,000 to $149,999 | 112 (18.1%) | 280 (21.2%) |
| $150,000 or more | 32 (5.2%) | 236 (17.9%) |
| Total | 618 (100.0%) | 1,320 (100.0%) |
Property Value to Household Income Ratio in Middletown borough
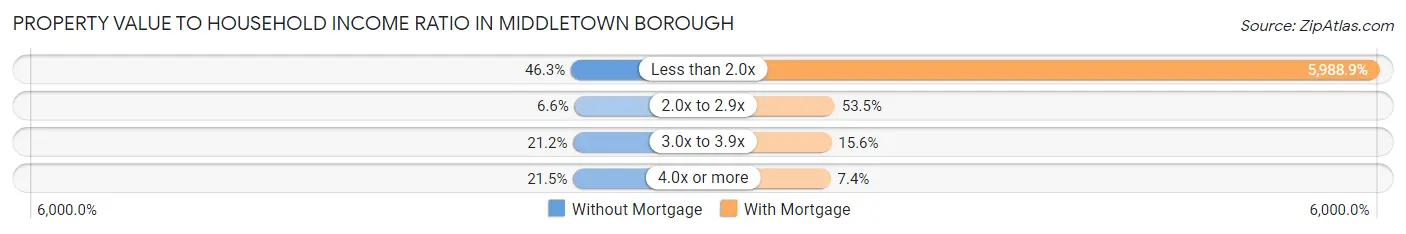
| Value-to-Income Ratio | Without Mortgage | With Mortgage |
| Less than 2.0x | 286 (46.3%) | 79,054 (5,988.9%) |
| 2.0x to 2.9x | 41 (6.6%) | 706 (53.5%) |
| 3.0x to 3.9x | 131 (21.2%) | 206 (15.6%) |
| 4.0x or more | 133 (21.5%) | 97 (7.3%) |
| Total | 618 (100.0%) | 1,320 (100.0%) |
Real Estate Taxes by Mortgage Status in Middletown borough
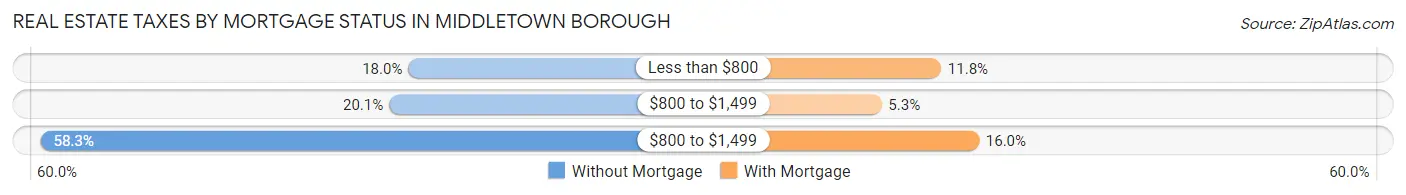
| Property Taxes | Without Mortgage | With Mortgage |
| Less than $800 | 111 (18.0%) | 156 (11.8%) |
| $800 to $1,499 | 124 (20.1%) | 70 (5.3%) |
| $800 to $1,499 | 360 (58.3%) | 211 (16.0%) |
| Total | 618 (100.0%) | 1,320 (100.0%) |
Health & Disability in Middletown borough
Health Insurance Coverage by Age in Middletown borough
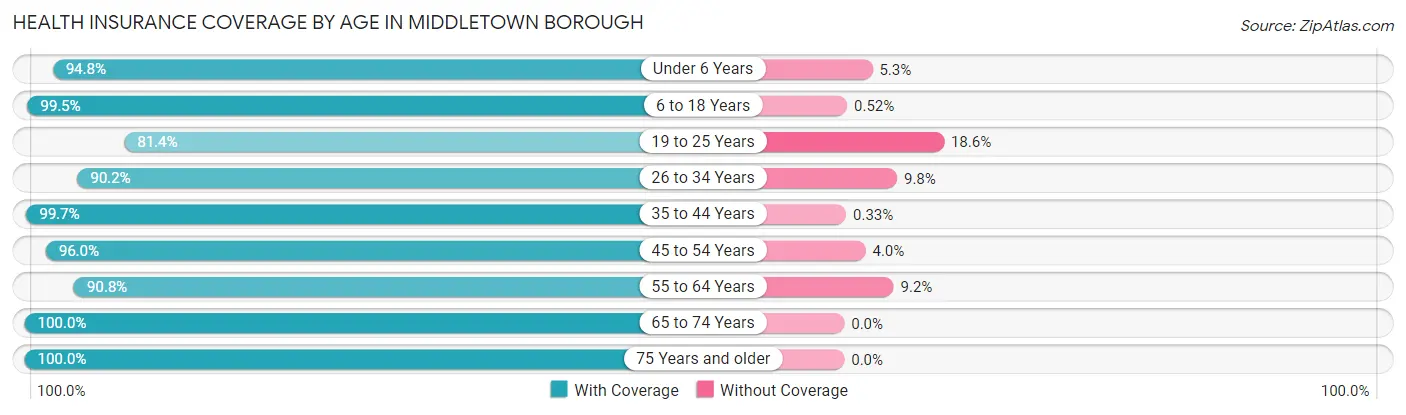
| Age Bracket | With Coverage | Without Coverage |
| Under 6 Years | 740 (94.8%) | 41 (5.2%) |
| 6 to 18 Years | 1,346 (99.5%) | 7 (0.5%) |
| 19 to 25 Years | 1,112 (81.4%) | 254 (18.6%) |
| 26 to 34 Years | 1,392 (90.2%) | 152 (9.8%) |
| 35 to 44 Years | 918 (99.7%) | 3 (0.3%) |
| 45 to 54 Years | 970 (96.0%) | 40 (4.0%) |
| 55 to 64 Years | 967 (90.8%) | 98 (9.2%) |
| 65 to 74 Years | 733 (100.0%) | 0 (0.0%) |
| 75 Years and older | 585 (100.0%) | 0 (0.0%) |
| Total | 8,763 (93.6%) | 595 (6.4%) |
Health Insurance Coverage by Citizenship Status in Middletown borough
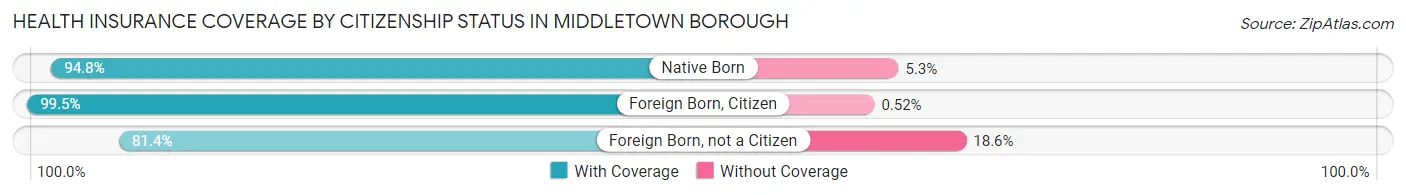
| Citizenship Status | With Coverage | Without Coverage |
| Native Born | 740 (94.8%) | 41 (5.2%) |
| Foreign Born, Citizen | 1,346 (99.5%) | 7 (0.5%) |
| Foreign Born, not a Citizen | 1,112 (81.4%) | 254 (18.6%) |
Health Insurance Coverage by Household Income in Middletown borough
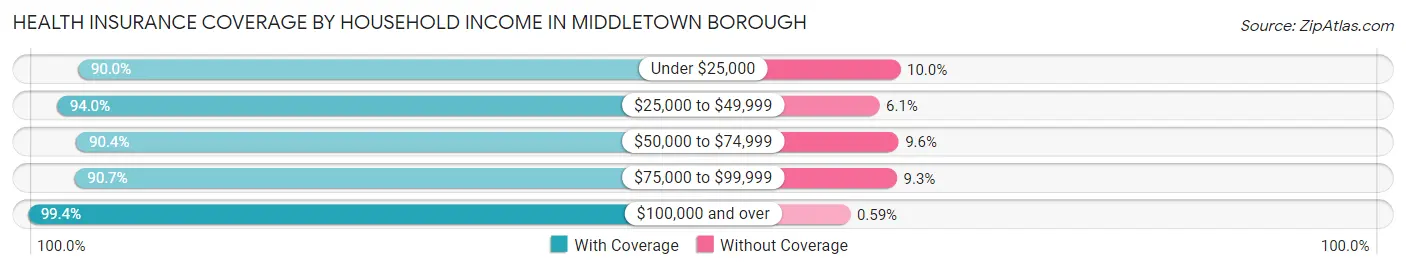
| Household Income | With Coverage | Without Coverage |
| Under $25,000 | 1,173 (90.0%) | 130 (10.0%) |
| $25,000 to $49,999 | 2,298 (94.0%) | 148 (6.0%) |
| $50,000 to $74,999 | 1,499 (90.4%) | 160 (9.6%) |
| $75,000 to $99,999 | 1,390 (90.7%) | 143 (9.3%) |
| $100,000 and over | 2,369 (99.4%) | 14 (0.6%) |
Public vs Private Health Insurance Coverage by Age in Middletown borough
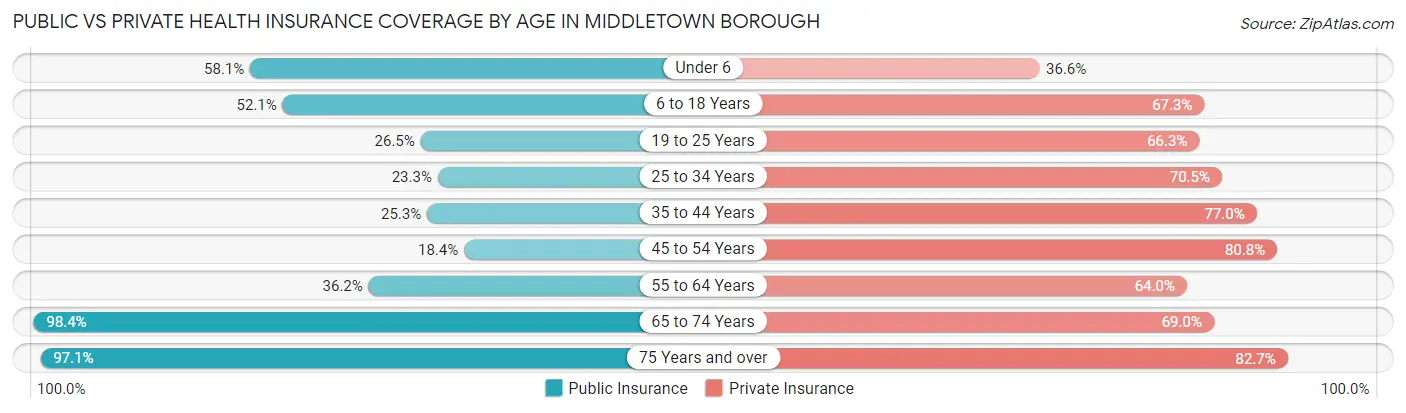
| Age Bracket | Public Insurance | Private Insurance |
| Under 6 | 454 (58.1%) | 286 (36.6%) |
| 6 to 18 Years | 705 (52.1%) | 910 (67.3%) |
| 19 to 25 Years | 362 (26.5%) | 906 (66.3%) |
| 25 to 34 Years | 360 (23.3%) | 1,089 (70.5%) |
| 35 to 44 Years | 233 (25.3%) | 709 (77.0%) |
| 45 to 54 Years | 186 (18.4%) | 816 (80.8%) |
| 55 to 64 Years | 385 (36.1%) | 682 (64.0%) |
| 65 to 74 Years | 721 (98.4%) | 506 (69.0%) |
| 75 Years and over | 568 (97.1%) | 484 (82.7%) |
| Total | 3,974 (42.5%) | 6,388 (68.3%) |
Disability Status by Sex by Age in Middletown borough
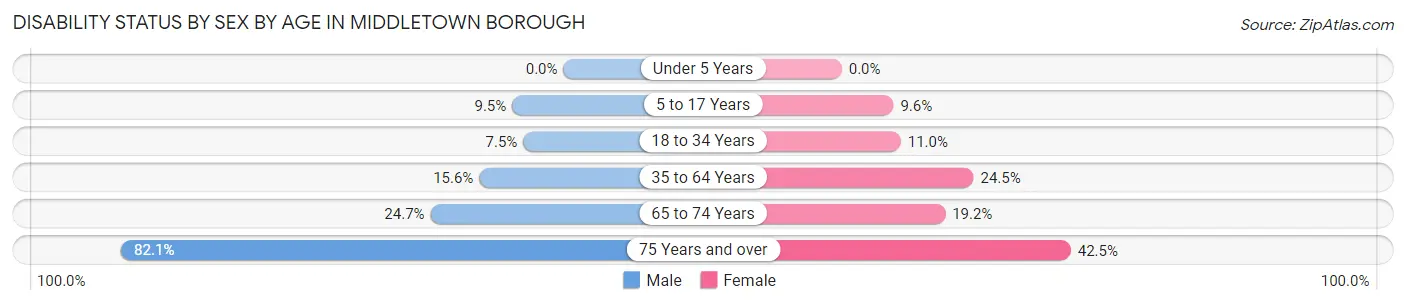
| Age Bracket | Male | Female |
| Under 5 Years | 0 (0.0%) | 0 (0.0%) |
| 5 to 17 Years | 72 (9.5%) | 47 (9.6%) |
| 18 to 34 Years | 110 (7.4%) | 176 (11.0%) |
| 35 to 64 Years | 201 (15.6%) | 418 (24.5%) |
| 65 to 74 Years | 96 (24.7%) | 66 (19.2%) |
| 75 Years and over | 206 (82.1%) | 142 (42.5%) |
Disability Class by Sex by Age in Middletown borough
Disability Class: Hearing Difficulty
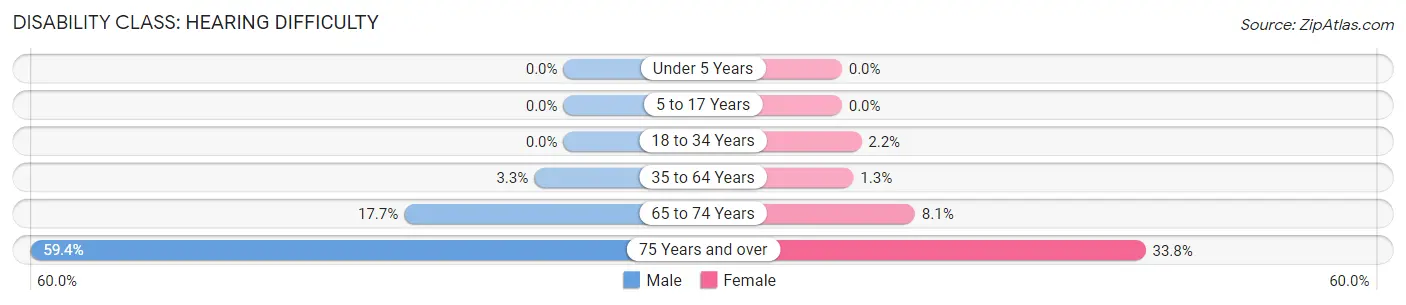
| Age Bracket | Male | Female |
| Under 5 Years | 0 (0.0%) | 0 (0.0%) |
| 5 to 17 Years | 0 (0.0%) | 0 (0.0%) |
| 18 to 34 Years | 0 (0.0%) | 35 (2.2%) |
| 35 to 64 Years | 42 (3.3%) | 22 (1.3%) |
| 65 to 74 Years | 69 (17.7%) | 28 (8.1%) |
| 75 Years and over | 149 (59.4%) | 113 (33.8%) |
Disability Class: Vision Difficulty
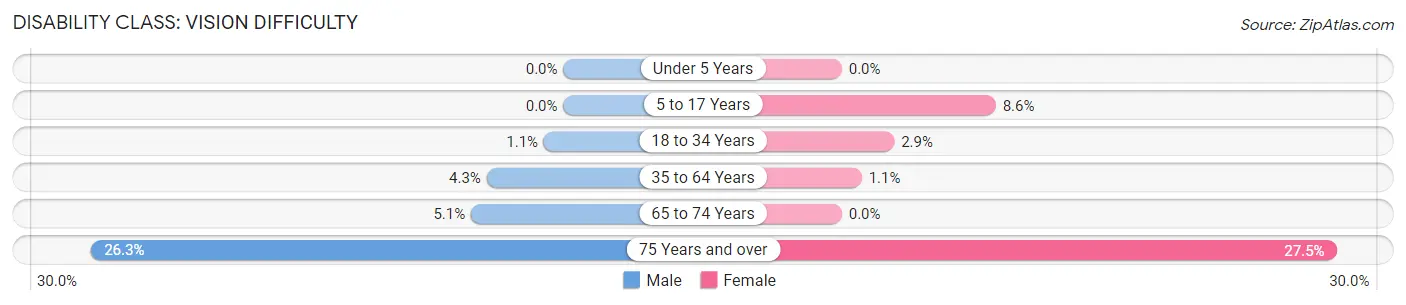
| Age Bracket | Male | Female |
| Under 5 Years | 0 (0.0%) | 0 (0.0%) |
| 5 to 17 Years | 0 (0.0%) | 42 (8.6%) |
| 18 to 34 Years | 16 (1.1%) | 47 (2.9%) |
| 35 to 64 Years | 55 (4.3%) | 19 (1.1%) |
| 65 to 74 Years | 20 (5.1%) | 0 (0.0%) |
| 75 Years and over | 66 (26.3%) | 92 (27.5%) |
Disability Class: Cognitive Difficulty
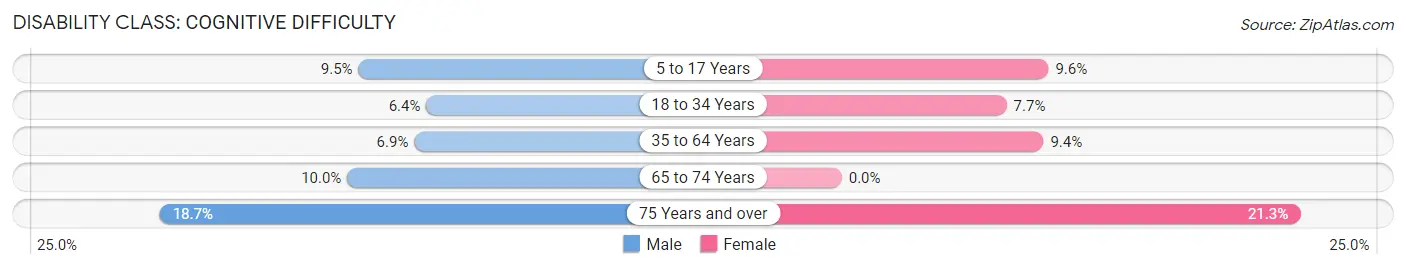
| Age Bracket | Male | Female |
| 5 to 17 Years | 72 (9.5%) | 47 (9.6%) |
| 18 to 34 Years | 94 (6.4%) | 123 (7.6%) |
| 35 to 64 Years | 89 (6.9%) | 160 (9.4%) |
| 65 to 74 Years | 39 (10.0%) | 0 (0.0%) |
| 75 Years and over | 47 (18.7%) | 71 (21.3%) |
Disability Class: Ambulatory Difficulty
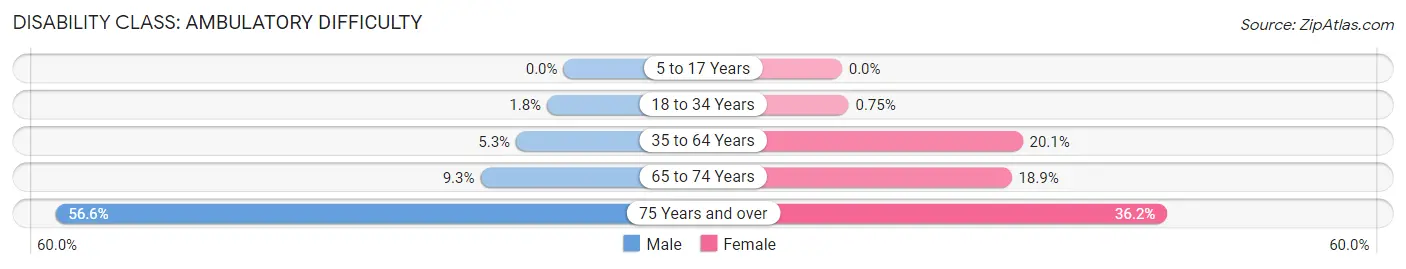
| Age Bracket | Male | Female |
| 5 to 17 Years | 0 (0.0%) | 0 (0.0%) |
| 18 to 34 Years | 27 (1.8%) | 12 (0.7%) |
| 35 to 64 Years | 68 (5.3%) | 344 (20.1%) |
| 65 to 74 Years | 36 (9.2%) | 65 (18.9%) |
| 75 Years and over | 142 (56.6%) | 121 (36.2%) |
Disability Class: Self-Care Difficulty
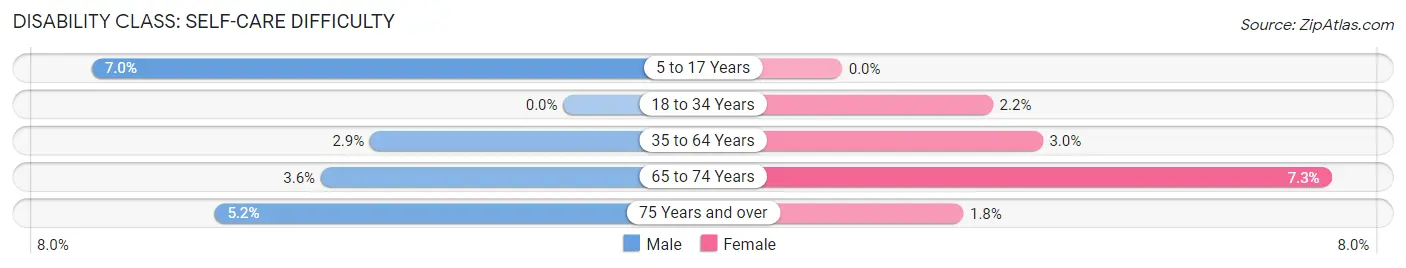
| Age Bracket | Male | Female |
| 5 to 17 Years | 53 (7.0%) | 0 (0.0%) |
| 18 to 34 Years | 0 (0.0%) | 36 (2.2%) |
| 35 to 64 Years | 37 (2.9%) | 51 (3.0%) |
| 65 to 74 Years | 14 (3.6%) | 25 (7.3%) |
| 75 Years and over | 13 (5.2%) | 6 (1.8%) |
Technology Access in Middletown borough
Computing Device Access in Middletown borough
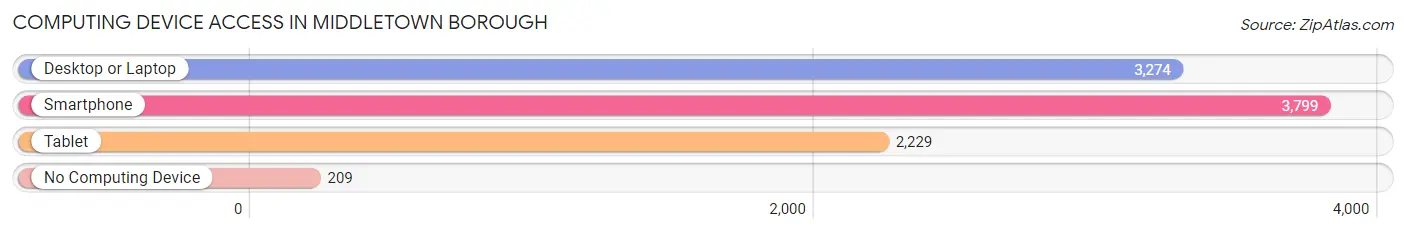
| Device Type | # Households | % Households |
| Desktop or Laptop | 3,274 | 76.3% |
| Smartphone | 3,799 | 88.5% |
| Tablet | 2,229 | 51.9% |
| No Computing Device | 209 | 4.9% |
| Total | 4,292 | 100.0% |
Internet Access in Middletown borough
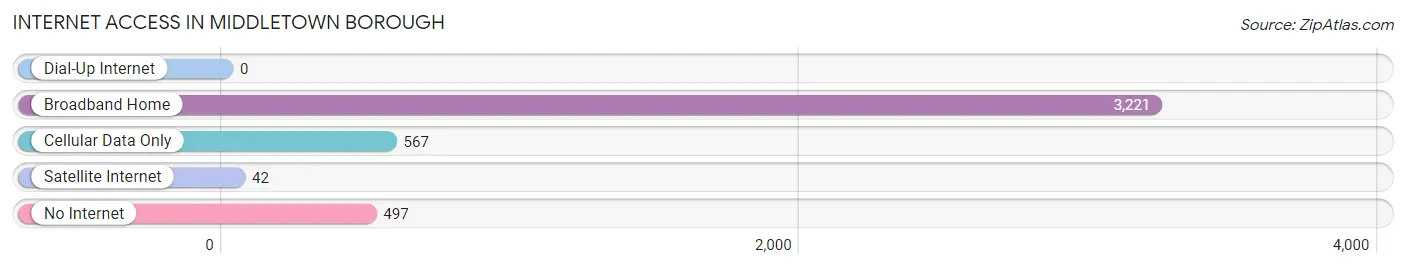
| Internet Type | # Households | % Households |
| Dial-Up Internet | 0 | 0.0% |
| Broadband Home | 3,221 | 75.0% |
| Cellular Data Only | 567 | 13.2% |
| Satellite Internet | 42 | 1.0% |
| No Internet | 497 | 11.6% |
| Total | 4,292 | 100.0% |
Middletown borough Summary
Middletown Borough is a small borough located in Dauphin County, Pennsylvania. It is situated in the Susquehanna Valley, approximately 10 miles south of Harrisburg, the state capital. The borough is home to approximately 8,000 people and is part of the Harrisburg-Carlisle Metropolitan Statistical Area.
History
Middletown Borough was founded in 1755 by a group of German settlers. The town was originally known as Middle's Town, named after the Middle family who owned the land. The town was officially incorporated in 1828 and was renamed Middletown.
The town was an important stop on the Underground Railroad, with many of the town's residents helping to hide and transport escaped slaves. During the Civil War, Middletown was a major supply center for the Union Army.
In the late 19th century, Middletown was a major industrial center, with several factories producing textiles, paper, and other goods. The town was also home to several breweries, including the Middletown Brewing Company, which was founded in 1876 and operated until the early 20th century.
Geography
Middletown Borough is located in the Susquehanna Valley, approximately 10 miles south of Harrisburg. The borough is situated on the east bank of the Susquehanna River, and is bordered by Lower Swatara Township to the north, Londonderry Township to the east, and Royalton Borough to the south.
The borough has a total area of 1.3 square miles, all of which is land. The borough is located in the humid continental climate zone, with hot, humid summers and cold, snowy winters.
Economy
Middletown Borough's economy is largely based on manufacturing and retail. The borough is home to several factories, including a paper mill, a plastics factory, and a metal fabrication plant. The borough is also home to several retail stores, including a grocery store, a hardware store, and several restaurants.
The borough is also home to several small businesses, including a law firm, a real estate agency, and a printing company. The borough is also home to several medical facilities, including a hospital and several medical offices.
Demographics
As of the 2010 census, Middletown Borough had a population of 8,000. The racial makeup of the borough was 87.3% White, 8.2% African American, 0.7% Asian, 0.3% Native American, and 3.5% from other races. Hispanic or Latino of any race were 2.2% of the population.
The median household income in Middletown Borough was $45,000, and the median family income was $51,000. The per capita income was $20,000. About 11.3% of families and 14.2% of the population were below the poverty line.
Middletown Borough is served by the Middletown Area School District, which includes four elementary schools, one middle school, and one high school. The borough is also home to several churches, including the Middletown United Methodist Church, the Middletown Presbyterian Church, and the Middletown Baptist Church.
Common Questions
What is Per Capita Income in Middletown borough?
Per Capita income in Middletown borough is $30,035.
What is the Median Family Income in Middletown borough?
Median Family Income in Middletown borough is $62,747.
What is the Median Household income in Middletown borough?
Median Household Income in Middletown borough is $50,599.
What is Income or Wage Gap in Middletown borough?
Income or Wage Gap in Middletown borough is 17.6%.
Women in Middletown borough earn 82.4 cents for every dollar earned by a man.
What is Inequality or Gini Index in Middletown borough?
Inequality or Gini Index in Middletown borough is 0.43.
What is the Total Population of Middletown borough?
Total Population of Middletown borough is 9,525.
What is the Total Male Population of Middletown borough?
Total Male Population of Middletown borough is 4,649.
What is the Total Female Population of Middletown borough?
Total Female Population of Middletown borough is 4,876.
What is the Ratio of Males per 100 Females in Middletown borough?
There are 95.34 Males per 100 Females in Middletown borough.
What is the Ratio of Females per 100 Males in Middletown borough?
There are 104.88 Females per 100 Males in Middletown borough.
What is the Median Population Age in Middletown borough?
Median Population Age in Middletown borough is 32.7 Years.
What is the Average Family Size in Middletown borough
Average Family Size in Middletown borough is 2.9 People.
What is the Average Household Size in Middletown borough
Average Household Size in Middletown borough is 2.2 People.
How Large is the Labor Force in Middletown borough?
There are 4,958 People in the Labor Forcein in Middletown borough.
What is the Percentage of People in the Labor Force in Middletown borough?
64.1% of People are in the Labor Force in Middletown borough.
What is the Unemployment Rate in Middletown borough?
Unemployment Rate in Middletown borough is 4.3%.