Hanover borough, PA Map & Demographics
Hanover borough Overview
$33,481
PER CAPITA INCOME
$77,077
AVG FAMILY INCOME
$60,050
AVG HOUSEHOLD INCOME
32.3%
WAGE / INCOME GAP [ % ]
67.7¢/ $1
WAGE / INCOME GAP [ $ ]
$8,274
FAMILY INCOME DEFICIT
0.43
INEQUALITY / GINI INDEX
16,411
TOTAL POPULATION
8,055
MALE POPULATION
8,356
FEMALE POPULATION
96.40
MALES / 100 FEMALES
103.74
FEMALES / 100 MALES
40.4
MEDIAN AGE
2.9
AVG FAMILY SIZE
2.3
AVG HOUSEHOLD SIZE
8,609
LABOR FORCE [ PEOPLE ]
64.8%
PERCENT IN LABOR FORCE
6.9%
UNEMPLOYMENT RATE
Income in Hanover borough
Income Overview in Hanover borough
Per Capita Income in Hanover borough is $33,481, while median incomes of families and households are $77,077 and $60,050 respectively.
| Characteristic | Number | Measure |
| Per Capita Income | 16,411 | $33,481 |
| Median Family Income | 4,161 | $77,077 |
| Mean Family Income | 4,161 | $94,691 |
| Median Household Income | 7,169 | $60,050 |
| Mean Household Income | 7,169 | $75,356 |
| Income Deficit | 4,161 | $8,274 |
| Wage / Income Gap (%) | 16,411 | 32.29% |
| Wage / Income Gap ($) | 16,411 | 67.71¢ per $1 |
| Gini / Inequality Index | 16,411 | 0.43 |
Earnings by Sex in Hanover borough
Average Earnings in Hanover borough are $37,614, $46,105 for men and $31,220 for women, a difference of 32.3%.
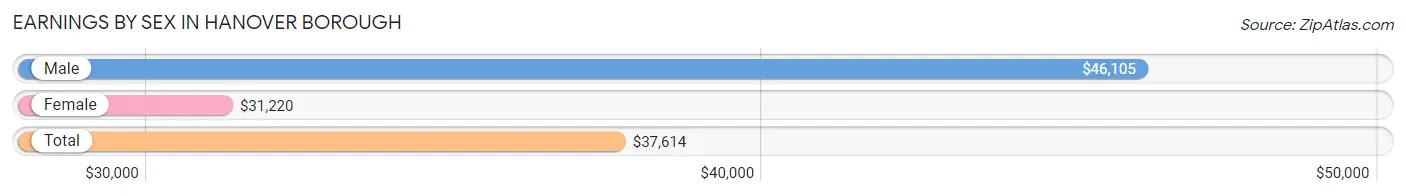
| Sex | Number | Average Earnings |
| Male | 4,640 (52.0%) | $46,105 |
| Female | 4,289 (48.0%) | $31,220 |
| Total | 8,929 (100.0%) | $37,614 |
Earnings by Sex by Income Bracket in Hanover borough
The most common earnings brackets in Hanover borough are $100,000+ for men (561 | 12.1%) and $25,000 to $29,999 for women (485 | 11.3%).
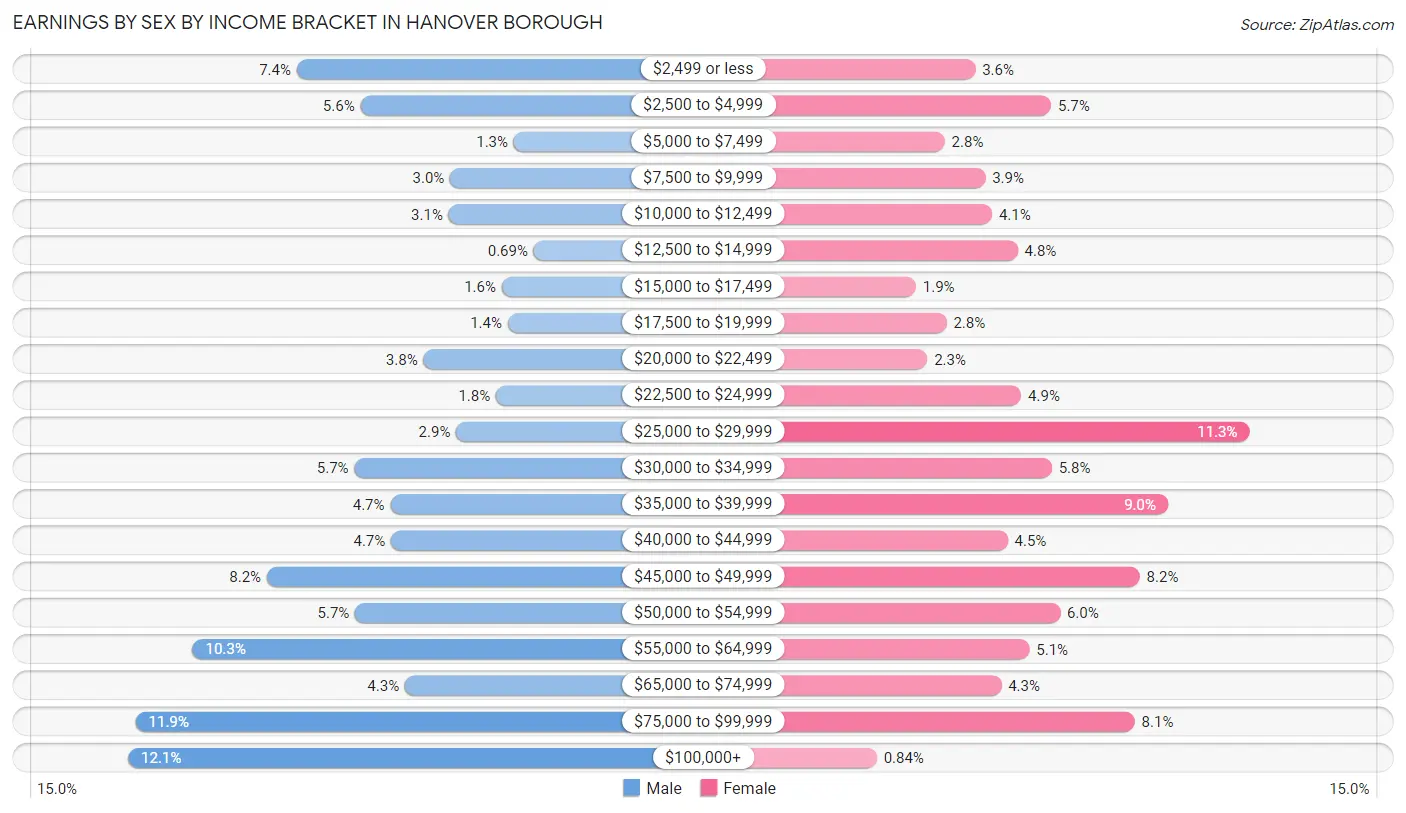
| Income | Male | Female |
| $2,499 or less | 341 (7.3%) | 155 (3.6%) |
| $2,500 to $4,999 | 258 (5.6%) | 246 (5.7%) |
| $5,000 to $7,499 | 58 (1.3%) | 118 (2.8%) |
| $7,500 to $9,999 | 141 (3.0%) | 167 (3.9%) |
| $10,000 to $12,499 | 143 (3.1%) | 175 (4.1%) |
| $12,500 to $14,999 | 32 (0.7%) | 206 (4.8%) |
| $15,000 to $17,499 | 74 (1.6%) | 83 (1.9%) |
| $17,500 to $19,999 | 66 (1.4%) | 120 (2.8%) |
| $20,000 to $22,499 | 176 (3.8%) | 97 (2.3%) |
| $22,500 to $24,999 | 81 (1.8%) | 210 (4.9%) |
| $25,000 to $29,999 | 133 (2.9%) | 485 (11.3%) |
| $30,000 to $34,999 | 266 (5.7%) | 247 (5.8%) |
| $35,000 to $39,999 | 219 (4.7%) | 387 (9.0%) |
| $40,000 to $44,999 | 218 (4.7%) | 194 (4.5%) |
| $45,000 to $49,999 | 380 (8.2%) | 353 (8.2%) |
| $50,000 to $54,999 | 265 (5.7%) | 257 (6.0%) |
| $55,000 to $64,999 | 477 (10.3%) | 220 (5.1%) |
| $65,000 to $74,999 | 200 (4.3%) | 186 (4.3%) |
| $75,000 to $99,999 | 551 (11.9%) | 347 (8.1%) |
| $100,000+ | 561 (12.1%) | 36 (0.8%) |
| Total | 4,640 (100.0%) | 4,289 (100.0%) |
Earnings by Sex by Educational Attainment in Hanover borough
Average earnings in Hanover borough are $52,030 for men and $35,389 for women, a difference of 32.0%. Men with an educational attainment of graduate degree enjoy the highest average annual earnings of $81,615, while those with less than high school education earn the least with $41,211. Women with an educational attainment of graduate degree earn the most with the average annual earnings of $47,614, while those with high school diploma education have the smallest earnings of $35,000.
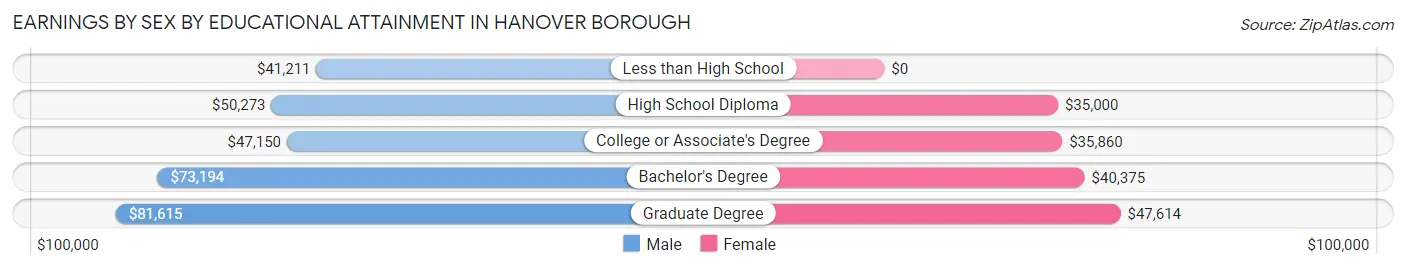
| Educational Attainment | Male Income | Female Income |
| Less than High School | $41,211 | $0 |
| High School Diploma | $50,273 | $35,000 |
| College or Associate's Degree | $47,150 | $35,860 |
| Bachelor's Degree | $73,194 | $40,375 |
| Graduate Degree | $81,615 | $47,614 |
| Total | $52,030 | $35,389 |
Family Income in Hanover borough
Family Income Brackets in Hanover borough
According to the Hanover borough family income data, there are 1,032 families falling into the $100,000 to $149,999 income range, which is the most common income bracket and makes up 24.8% of all families. Conversely, the less than $10,000 income bracket is the least frequent group with only 79 families (1.9%) belonging to this category.
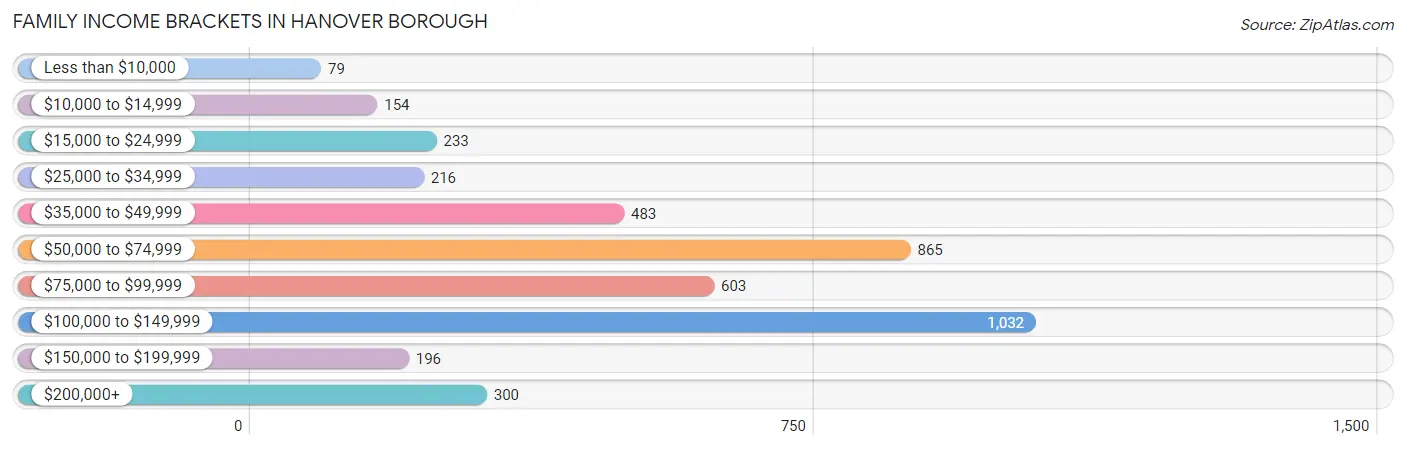
| Income Bracket | # Families | % Families |
| Less than $10,000 | 79 | 1.9% |
| $10,000 to $14,999 | 154 | 3.7% |
| $15,000 to $24,999 | 233 | 5.6% |
| $25,000 to $34,999 | 216 | 5.2% |
| $35,000 to $49,999 | 483 | 11.6% |
| $50,000 to $74,999 | 865 | 20.8% |
| $75,000 to $99,999 | 603 | 14.5% |
| $100,000 to $149,999 | 1,032 | 24.8% |
| $150,000 to $199,999 | 196 | 4.7% |
| $200,000+ | 300 | 7.2% |
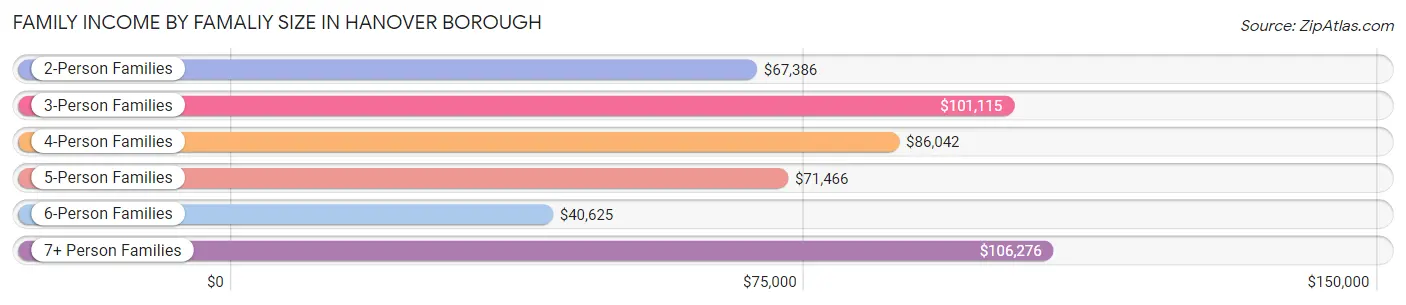
Family Income by Famaliy Size in Hanover borough
7+ person families (81 | 1.9%) account for the highest median family income in Hanover borough with $106,276 per family, while 3-person families (770 | 18.5%) have the highest median income of $33,705 per family member.
| Income Bracket | # Families | Median Income |
| 2-Person Families | 2,330 (56.0%) | $67,386 |
| 3-Person Families | 770 (18.5%) | $101,115 |
| 4-Person Families | 642 (15.4%) | $86,042 |
| 5-Person Families | 282 (6.8%) | $71,466 |
| 6-Person Families | 56 (1.3%) | $40,625 |
| 7+ Person Families | 81 (1.9%) | $106,276 |
| Total | 4,161 (100.0%) | $77,077 |
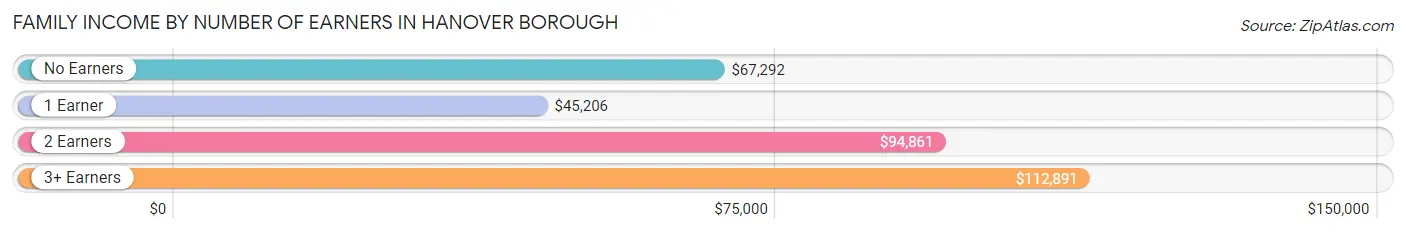
Family Income by Number of Earners in Hanover borough
The median family income in Hanover borough is $77,077, with families comprising 3+ earners (380) having the highest median family income of $112,891, while families with 1 earner (1,298) have the lowest median family income of $45,206, accounting for 9.1% and 31.2% of families, respectively.
| Number of Earners | # Families | Median Income |
| No Earners | 498 (12.0%) | $67,292 |
| 1 Earner | 1,298 (31.2%) | $45,206 |
| 2 Earners | 1,985 (47.7%) | $94,861 |
| 3+ Earners | 380 (9.1%) | $112,891 |
| Total | 4,161 (100.0%) | $77,077 |
Household Income in Hanover borough
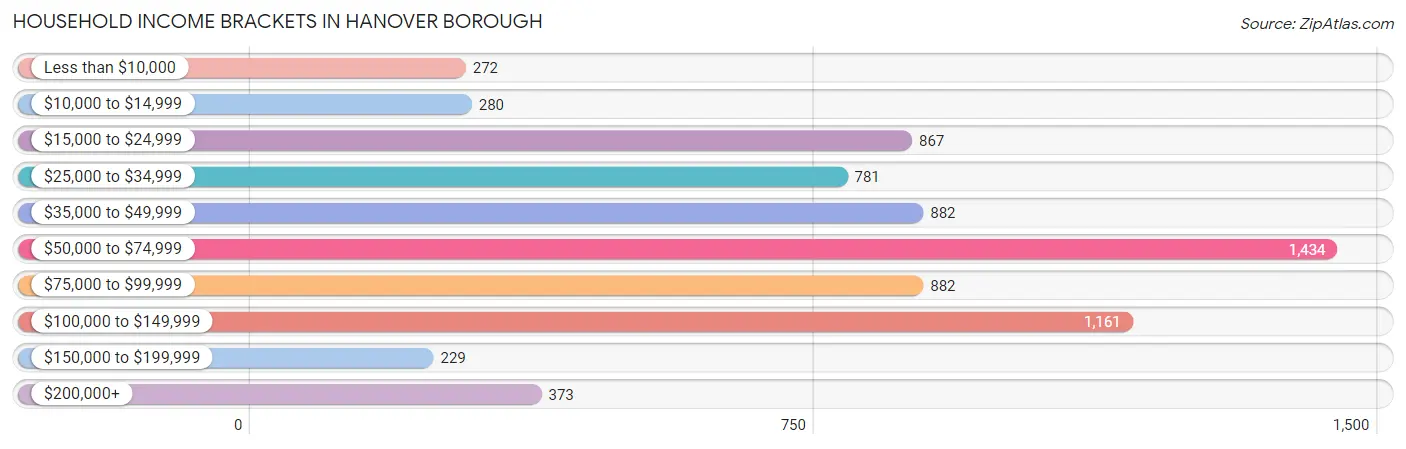
Household Income Brackets in Hanover borough
With 1,434 households falling in the category, the $50,000 to $74,999 income range is the most frequent in Hanover borough, accounting for 20.0% of all households. In contrast, only 229 households (3.2%) fall into the $150,000 to $199,999 income bracket, making it the least populous group.
| Income Bracket | # Households | % Households |
| Less than $10,000 | 272 | 3.8% |
| $10,000 to $14,999 | 280 | 3.9% |
| $15,000 to $24,999 | 867 | 12.1% |
| $25,000 to $34,999 | 781 | 10.9% |
| $35,000 to $49,999 | 882 | 12.3% |
| $50,000 to $74,999 | 1,434 | 20.0% |
| $75,000 to $99,999 | 882 | 12.3% |
| $100,000 to $149,999 | 1,161 | 16.2% |
| $150,000 to $199,999 | 229 | 3.2% |
| $200,000+ | 373 | 5.2% |
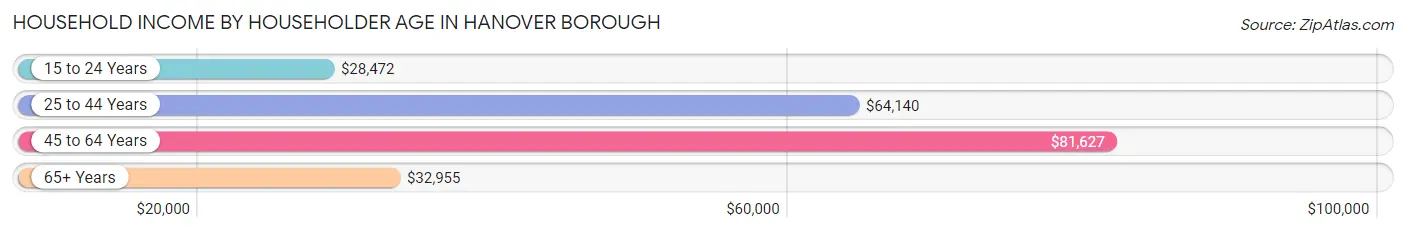
Household Income by Householder Age in Hanover borough
The median household income in Hanover borough is $60,050, with the highest median household income of $81,627 found in the 45 to 64 years age bracket for the primary householder. A total of 2,420 households (33.8%) fall into this category. Meanwhile, the 15 to 24 years age bracket for the primary householder has the lowest median household income of $28,472, with 285 households (4.0%) in this group.
| Income Bracket | # Households | Median Income |
| 15 to 24 Years | 285 (4.0%) | $28,472 |
| 25 to 44 Years | 2,200 (30.7%) | $64,140 |
| 45 to 64 Years | 2,420 (33.8%) | $81,627 |
| 65+ Years | 2,264 (31.6%) | $32,955 |
| Total | 7,169 (100.0%) | $60,050 |
Poverty in Hanover borough
Income Below Poverty by Sex and Age in Hanover borough
With 10.1% poverty level for males and 14.9% for females among the residents of Hanover borough, 15 year old males and 15 year old females are the most vulnerable to poverty, with 26 males (23.4%) and 20 females (66.7%) in their respective age groups living below the poverty level.
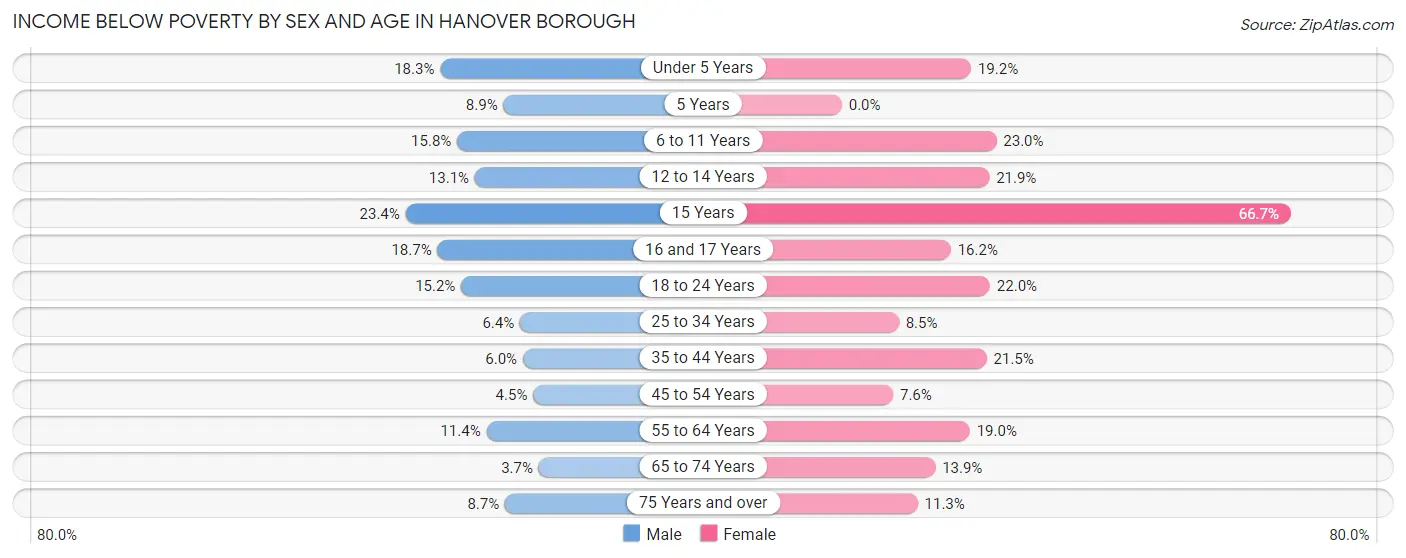
| Age Bracket | Male | Female |
| Under 5 Years | 81 (18.3%) | 70 (19.2%) |
| 5 Years | 8 (8.9%) | 0 (0.0%) |
| 6 to 11 Years | 76 (15.8%) | 134 (23.0%) |
| 12 to 14 Years | 65 (13.1%) | 44 (21.9%) |
| 15 Years | 26 (23.4%) | 20 (66.7%) |
| 16 and 17 Years | 60 (18.7%) | 33 (16.2%) |
| 18 to 24 Years | 127 (15.2%) | 128 (22.0%) |
| 25 to 34 Years | 68 (6.4%) | 111 (8.5%) |
| 35 to 44 Years | 52 (6.0%) | 175 (21.5%) |
| 45 to 54 Years | 46 (4.5%) | 85 (7.6%) |
| 55 to 64 Years | 116 (11.4%) | 178 (19.0%) |
| 65 to 74 Years | 21 (3.6%) | 104 (13.9%) |
| 75 Years and over | 44 (8.7%) | 136 (11.3%) |
| Total | 790 (10.1%) | 1,218 (14.9%) |
Income Above Poverty by Sex and Age in Hanover borough
According to the poverty statistics in Hanover borough, males aged 65 to 74 years and females aged 5 years are the age groups that are most secure financially, with 96.4% of males and 100.0% of females in these age groups living above the poverty line.
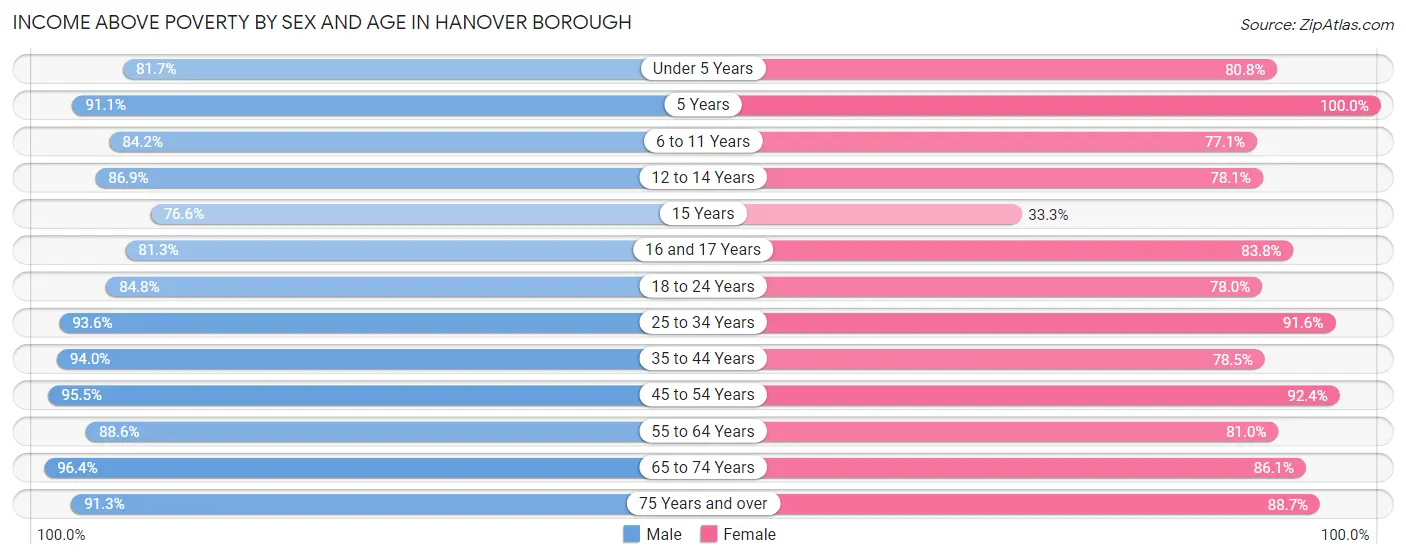
| Age Bracket | Male | Female |
| Under 5 Years | 362 (81.7%) | 295 (80.8%) |
| 5 Years | 82 (91.1%) | 78 (100.0%) |
| 6 to 11 Years | 406 (84.2%) | 450 (77.0%) |
| 12 to 14 Years | 430 (86.9%) | 157 (78.1%) |
| 15 Years | 85 (76.6%) | 10 (33.3%) |
| 16 and 17 Years | 261 (81.3%) | 171 (83.8%) |
| 18 to 24 Years | 710 (84.8%) | 454 (78.0%) |
| 25 to 34 Years | 990 (93.6%) | 1,203 (91.5%) |
| 35 to 44 Years | 815 (94.0%) | 639 (78.5%) |
| 45 to 54 Years | 983 (95.5%) | 1,032 (92.4%) |
| 55 to 64 Years | 901 (88.6%) | 759 (81.0%) |
| 65 to 74 Years | 555 (96.4%) | 646 (86.1%) |
| 75 Years and over | 464 (91.3%) | 1,072 (88.7%) |
| Total | 7,044 (89.9%) | 6,966 (85.1%) |
Income Below Poverty Among Married-Couple Families in Hanover borough
The poverty statistics for married-couple families in Hanover borough show that 4.3% or 113 of the total 2,648 families live below the poverty line. Families with 3 or 4 children have the highest poverty rate of 11.0%, comprising of 26 families. On the other hand, families with 5 or more children have the lowest poverty rate of 0.0%, which includes 0 families.
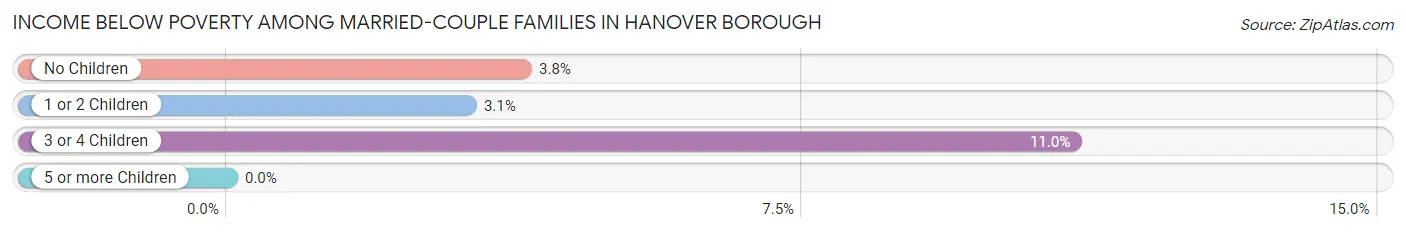
| Children | Above Poverty | Below Poverty |
| No Children | 1,652 (96.2%) | 66 (3.8%) |
| 1 or 2 Children | 651 (96.9%) | 21 (3.1%) |
| 3 or 4 Children | 210 (89.0%) | 26 (11.0%) |
| 5 or more Children | 22 (100.0%) | 0 (0.0%) |
| Total | 2,535 (95.7%) | 113 (4.3%) |
Income Below Poverty Among Single-Parent Households in Hanover borough
According to the poverty data in Hanover borough, 6.9% or 26 single-father households and 21.3% or 242 single-mother households are living below the poverty line. Among single-father households, those with 3 or 4 children have the highest poverty rate, with 6 households (35.3%) experiencing poverty. Likewise, among single-mother households, those with 3 or 4 children have the highest poverty rate, with 78 households (47.8%) falling below the poverty line.
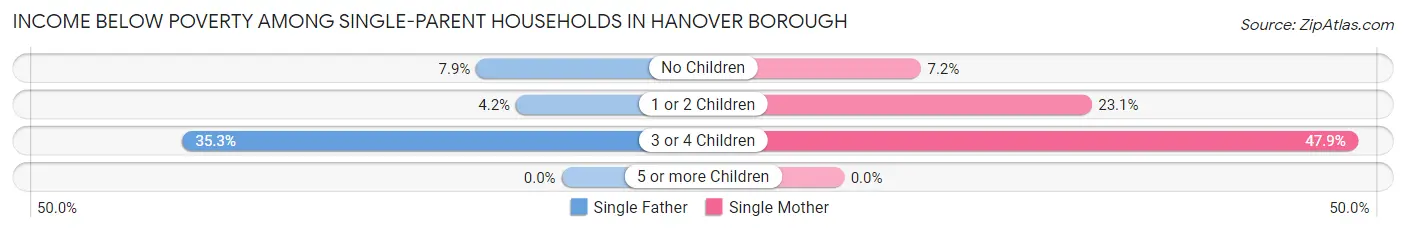
| Children | Single Father | Single Mother |
| No Children | 10 (7.9%) | 27 (7.2%) |
| 1 or 2 Children | 10 (4.2%) | 137 (23.1%) |
| 3 or 4 Children | 6 (35.3%) | 78 (47.8%) |
| 5 or more Children | 0 (0.0%) | 0 (0.0%) |
| Total | 26 (6.9%) | 242 (21.3%) |
Income Below Poverty Among Married-Couple vs Single-Parent Households in Hanover borough
The poverty data for Hanover borough shows that 113 of the married-couple family households (4.3%) and 268 of the single-parent households (17.7%) are living below the poverty level. Within the married-couple family households, those with 3 or 4 children have the highest poverty rate, with 26 households (11.0%) falling below the poverty line. Among the single-parent households, those with 3 or 4 children have the highest poverty rate, with 84 household (46.7%) living below poverty.
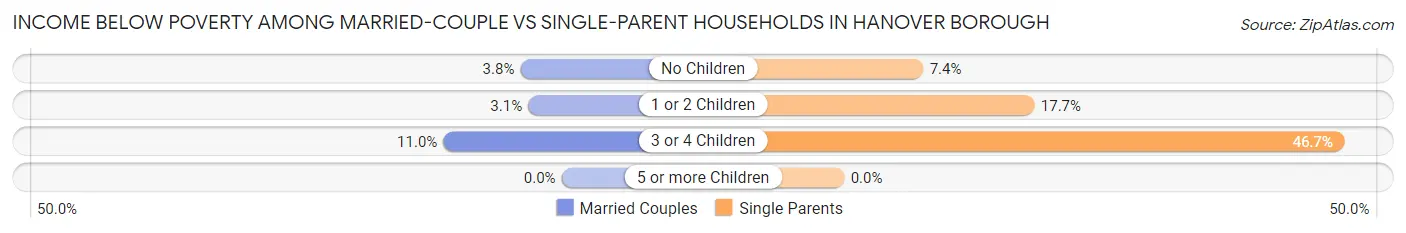
| Children | Married-Couple Families | Single-Parent Households |
| No Children | 66 (3.8%) | 37 (7.4%) |
| 1 or 2 Children | 21 (3.1%) | 147 (17.7%) |
| 3 or 4 Children | 26 (11.0%) | 84 (46.7%) |
| 5 or more Children | 0 (0.0%) | 0 (0.0%) |
| Total | 113 (4.3%) | 268 (17.7%) |
Race in Hanover borough
The most populous races in Hanover borough are White / Caucasian (13,850 | 84.4%), Hispanic or Latino (1,981 | 12.1%), and Two or more Races (1,134 | 6.9%).
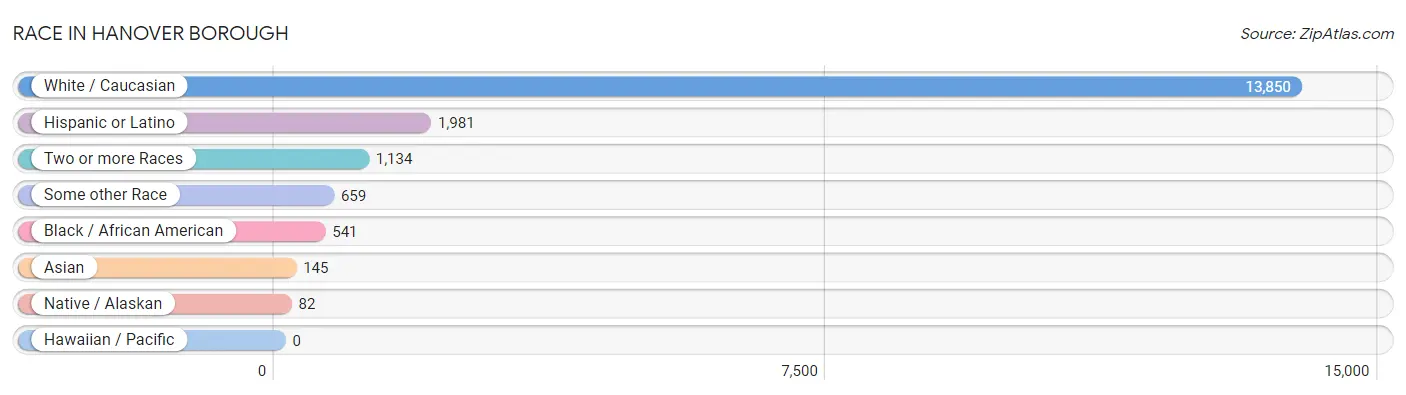
| Race | # Population | % Population |
| Asian | 145 | 0.9% |
| Black / African American | 541 | 3.3% |
| Hawaiian / Pacific | 0 | 0.0% |
| Hispanic or Latino | 1,981 | 12.1% |
| Native / Alaskan | 82 | 0.5% |
| White / Caucasian | 13,850 | 84.4% |
| Two or more Races | 1,134 | 6.9% |
| Some other Race | 659 | 4.0% |
| Total | 16,411 | 100.0% |
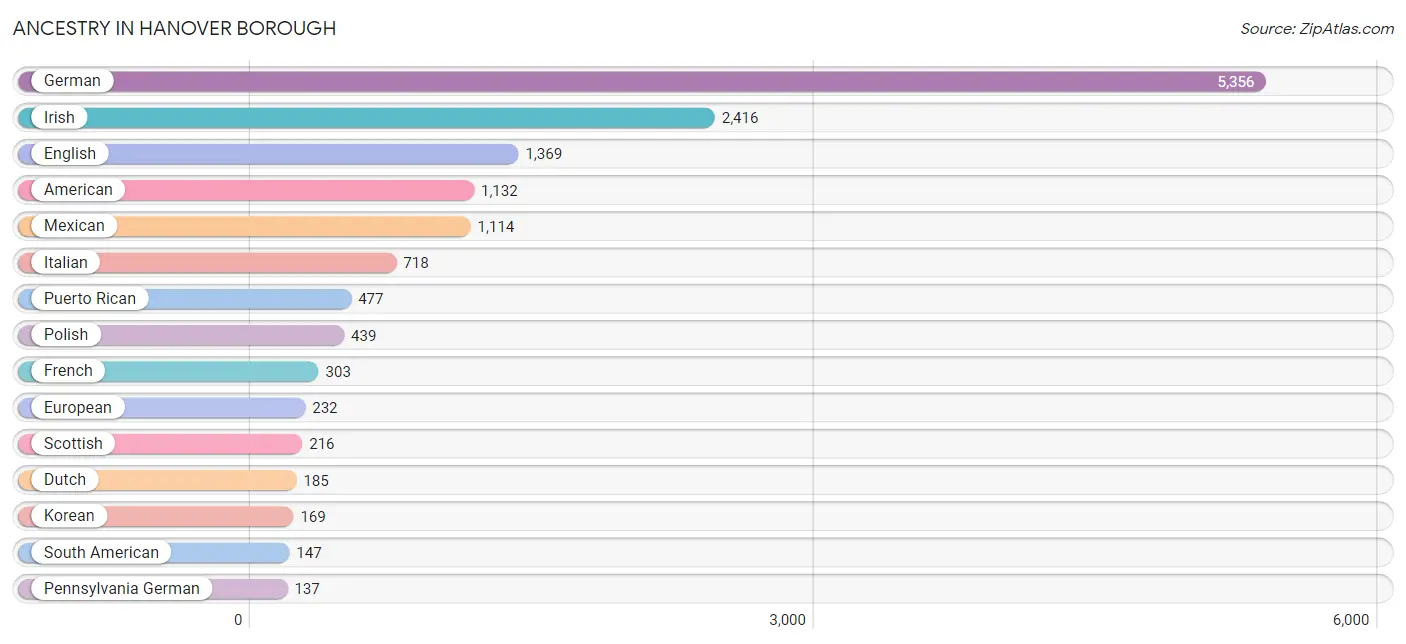
Ancestry in Hanover borough
The most populous ancestries reported in Hanover borough are German (5,356 | 32.6%), Irish (2,416 | 14.7%), English (1,369 | 8.3%), American (1,132 | 6.9%), and Mexican (1,114 | 6.8%), together accounting for 69.4% of all Hanover borough residents.
| Ancestry | # Population | % Population |
| American | 1,132 | 6.9% |
| Apache | 4 | 0.0% |
| Arab | 10 | 0.1% |
| Australian | 12 | 0.1% |
| Austrian | 8 | 0.1% |
| Barbadian | 8 | 0.1% |
| Bhutanese | 15 | 0.1% |
| British | 84 | 0.5% |
| British West Indian | 8 | 0.1% |
| Bulgarian | 19 | 0.1% |
| Burmese | 60 | 0.4% |
| Central American | 105 | 0.6% |
| Central American Indian | 15 | 0.1% |
| Cherokee | 109 | 0.7% |
| Cuban | 15 | 0.1% |
| Czech | 43 | 0.3% |
| Danish | 15 | 0.1% |
| Delaware | 15 | 0.1% |
| Dominican | 51 | 0.3% |
| Dutch | 185 | 1.1% |
| Eastern European | 15 | 0.1% |
| Ecuadorian | 92 | 0.6% |
| English | 1,369 | 8.3% |
| European | 232 | 1.4% |
| French | 303 | 1.8% |
| French Canadian | 41 | 0.3% |
| German | 5,356 | 32.6% |
| German Russian | 10 | 0.1% |
| Greek | 50 | 0.3% |
| Hungarian | 40 | 0.2% |
| Indian (Asian) | 31 | 0.2% |
| Irish | 2,416 | 14.7% |
| Iroquois | 3 | 0.0% |
| Italian | 718 | 4.4% |
| Korean | 169 | 1.0% |
| Lithuanian | 31 | 0.2% |
| Luxembourger | 12 | 0.1% |
| Mexican | 1,114 | 6.8% |
| Nicaraguan | 40 | 0.2% |
| Northern European | 11 | 0.1% |
| Norwegian | 111 | 0.7% |
| Panamanian | 65 | 0.4% |
| Pennsylvania German | 137 | 0.8% |
| Peruvian | 55 | 0.3% |
| Polish | 439 | 2.7% |
| Portuguese | 9 | 0.1% |
| Puerto Rican | 477 | 2.9% |
| Russian | 91 | 0.5% |
| Scandinavian | 57 | 0.4% |
| Scotch-Irish | 58 | 0.4% |
| Scottish | 216 | 1.3% |
| Slovene | 10 | 0.1% |
| South American | 147 | 0.9% |
| Spaniard | 1 | 0.0% |
| Spanish American Indian | 67 | 0.4% |
| Subsaharan African | 8 | 0.1% |
| Swedish | 14 | 0.1% |
| Swiss | 7 | 0.0% |
| Thai | 6 | 0.0% |
| Welsh | 102 | 0.6% |
| Yugoslavian | 17 | 0.1% | View All 61 Rows |
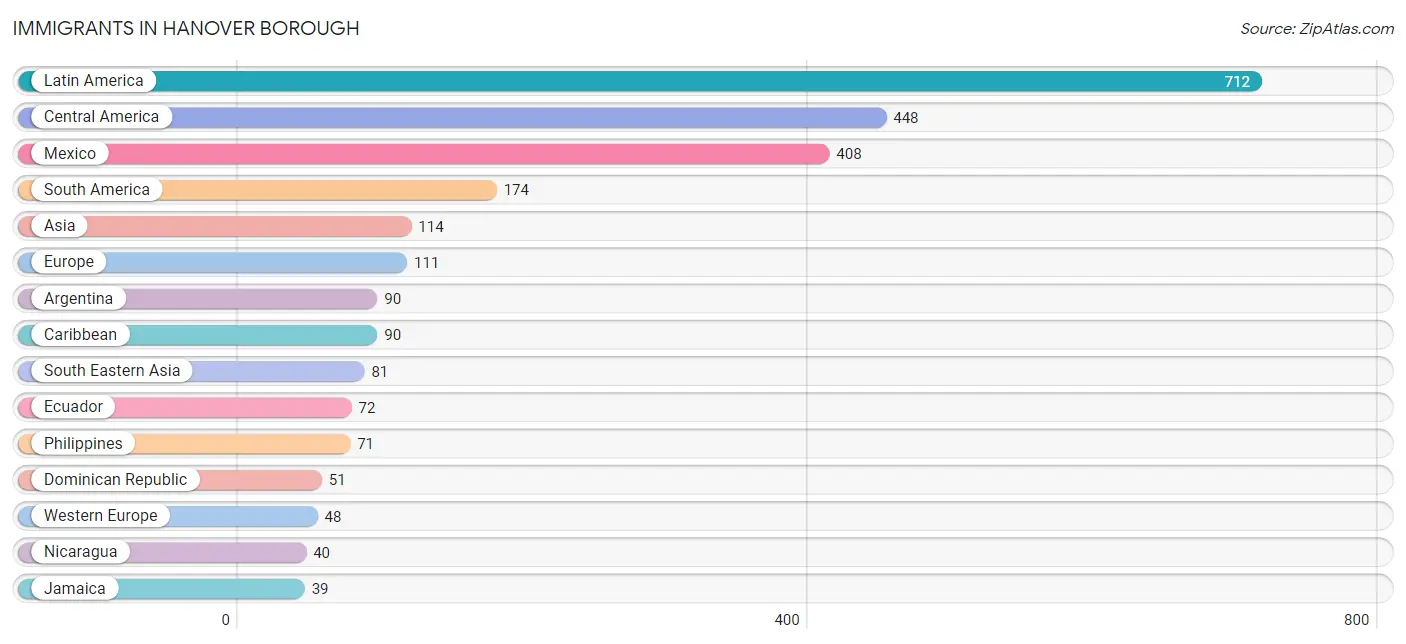
Immigrants in Hanover borough
The most numerous immigrant groups reported in Hanover borough came from Latin America (712 | 4.3%), Central America (448 | 2.7%), Mexico (408 | 2.5%), South America (174 | 1.1%), and Asia (114 | 0.7%), together accounting for 11.3% of all Hanover borough residents.
| Immigration Origin | # Population | % Population |
| Africa | 8 | 0.1% |
| Argentina | 90 | 0.5% |
| Asia | 114 | 0.7% |
| Bulgaria | 19 | 0.1% |
| Cameroon | 8 | 0.1% |
| Caribbean | 90 | 0.5% |
| Central America | 448 | 2.7% |
| China | 5 | 0.0% |
| Dominican Republic | 51 | 0.3% |
| Eastern Asia | 33 | 0.2% |
| Eastern Europe | 29 | 0.2% |
| Ecuador | 72 | 0.4% |
| Europe | 111 | 0.7% |
| France | 36 | 0.2% |
| Germany | 12 | 0.1% |
| Indonesia | 10 | 0.1% |
| Ireland | 25 | 0.2% |
| Jamaica | 39 | 0.2% |
| Japan | 15 | 0.1% |
| Korea | 13 | 0.1% |
| Latin America | 712 | 4.3% |
| Mexico | 408 | 2.5% |
| Middle Africa | 8 | 0.1% |
| Nicaragua | 40 | 0.2% |
| Northern Europe | 34 | 0.2% |
| Peru | 12 | 0.1% |
| Philippines | 71 | 0.4% |
| Poland | 10 | 0.1% |
| South America | 174 | 1.1% |
| South Eastern Asia | 81 | 0.5% |
| Western Europe | 48 | 0.3% | View All 31 Rows |
Sex and Age in Hanover borough
Sex and Age in Hanover borough
The most populous age groups in Hanover borough are 15 to 19 Years (824 | 10.2%) for men and 50 to 54 Years (751 | 9.0%) for women.
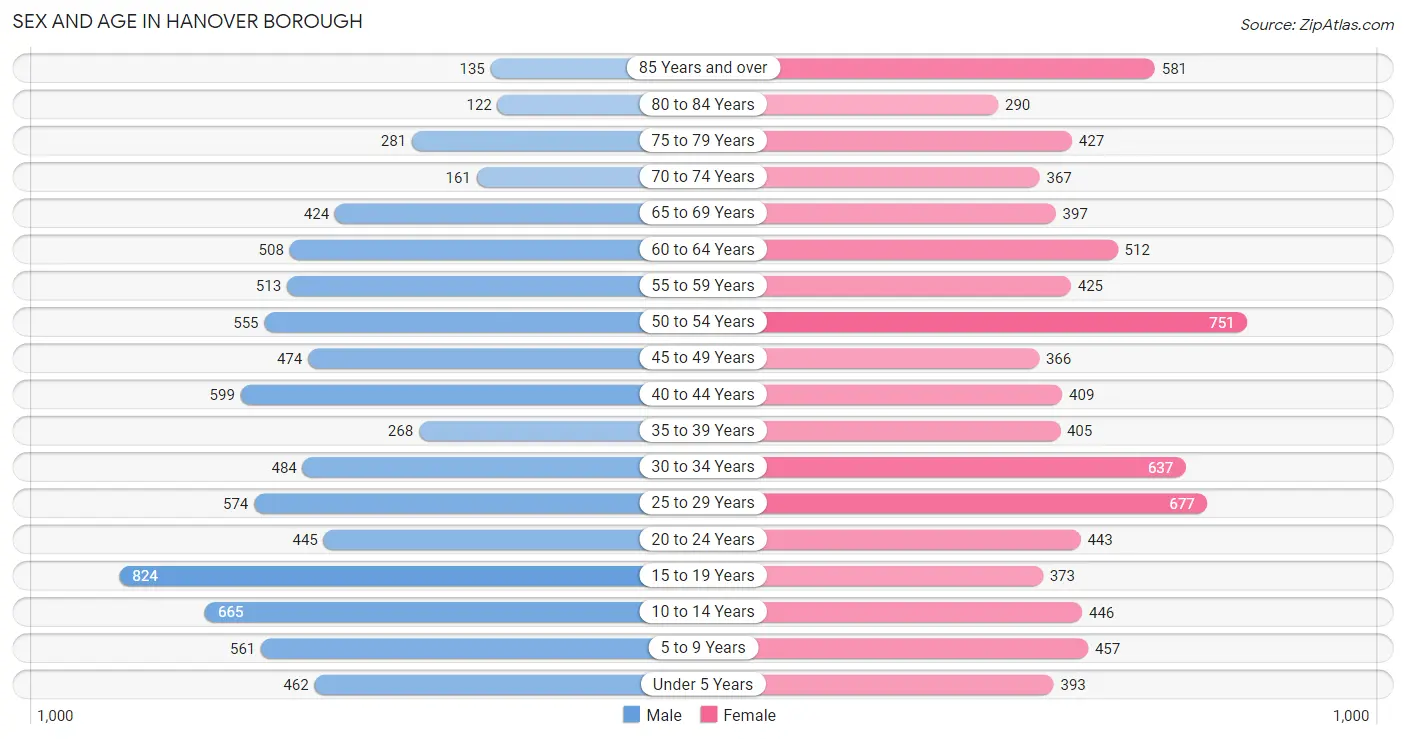
| Age Bracket | Male | Female |
| Under 5 Years | 462 (5.7%) | 393 (4.7%) |
| 5 to 9 Years | 561 (7.0%) | 457 (5.5%) |
| 10 to 14 Years | 665 (8.3%) | 446 (5.3%) |
| 15 to 19 Years | 824 (10.2%) | 373 (4.5%) |
| 20 to 24 Years | 445 (5.5%) | 443 (5.3%) |
| 25 to 29 Years | 574 (7.1%) | 677 (8.1%) |
| 30 to 34 Years | 484 (6.0%) | 637 (7.6%) |
| 35 to 39 Years | 268 (3.3%) | 405 (4.9%) |
| 40 to 44 Years | 599 (7.4%) | 409 (4.9%) |
| 45 to 49 Years | 474 (5.9%) | 366 (4.4%) |
| 50 to 54 Years | 555 (6.9%) | 751 (9.0%) |
| 55 to 59 Years | 513 (6.4%) | 425 (5.1%) |
| 60 to 64 Years | 508 (6.3%) | 512 (6.1%) |
| 65 to 69 Years | 424 (5.3%) | 397 (4.8%) |
| 70 to 74 Years | 161 (2.0%) | 367 (4.4%) |
| 75 to 79 Years | 281 (3.5%) | 427 (5.1%) |
| 80 to 84 Years | 122 (1.5%) | 290 (3.5%) |
| 85 Years and over | 135 (1.7%) | 581 (7.0%) |
| Total | 8,055 (100.0%) | 8,356 (100.0%) |
Families and Households in Hanover borough
Median Family Size in Hanover borough
The median family size in Hanover borough is 2.89 persons per family, with single female/mother families (1,134 | 27.3%) accounting for the largest median family size of 2.95 persons per family. On the other hand, single male/father families (379 | 9.1%) represent the smallest median family size with 2.54 persons per family.
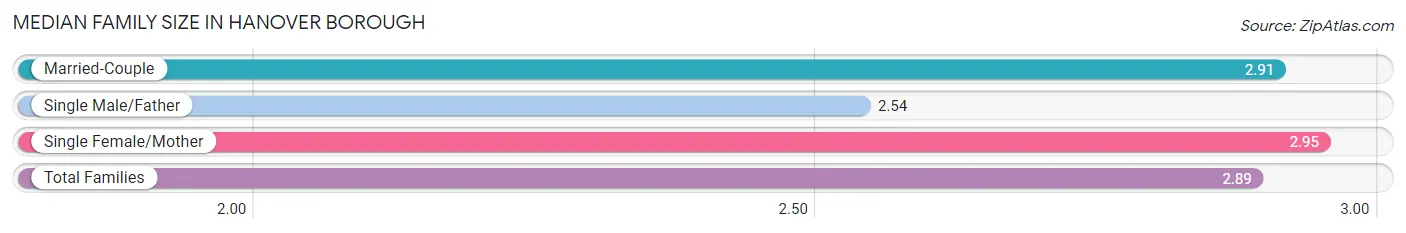
| Family Type | # Families | Family Size |
| Married-Couple | 2,648 (63.6%) | 2.91 |
| Single Male/Father | 379 (9.1%) | 2.54 |
| Single Female/Mother | 1,134 (27.3%) | 2.95 |
| Total Families | 4,161 (100.0%) | 2.89 |
Median Household Size in Hanover borough
The median household size in Hanover borough is 2.27 persons per household, with single female/mother households (1,134 | 15.8%) accounting for the largest median household size of 3.26 persons per household. non-family households (3,008 | 42.0%) represent the smallest median household size with 1.21 persons per household.
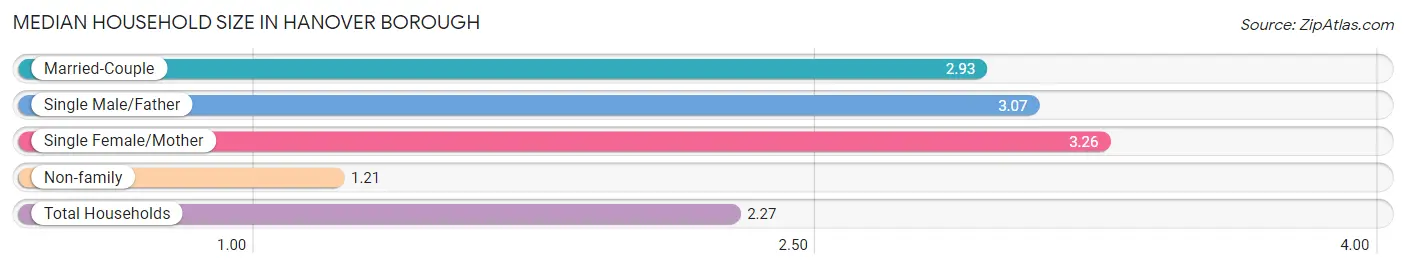
| Household Type | # Households | Household Size |
| Married-Couple | 2,648 (36.9%) | 2.93 |
| Single Male/Father | 379 (5.3%) | 3.07 |
| Single Female/Mother | 1,134 (15.8%) | 3.26 |
| Non-family | 3,008 (42.0%) | 1.21 |
| Total Households | 7,169 (100.0%) | 2.27 |
Household Size by Marriage Status in Hanover borough
Out of a total of 7,169 households in Hanover borough, 4,161 (58.0%) are family households, while 3,008 (42.0%) are nonfamily households. The most numerous type of family households are 2-person households, comprising 2,137, and the most common type of nonfamily households are 1-person households, comprising 2,557.
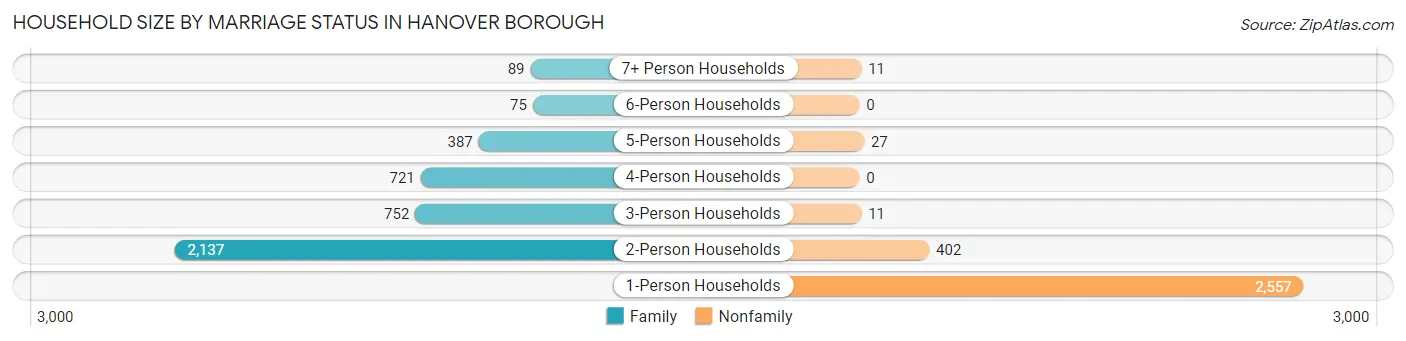
| Household Size | Family Households | Nonfamily Households |
| 1-Person Households | - | 2,557 (35.7%) |
| 2-Person Households | 2,137 (29.8%) | 402 (5.6%) |
| 3-Person Households | 752 (10.5%) | 11 (0.2%) |
| 4-Person Households | 721 (10.1%) | 0 (0.0%) |
| 5-Person Households | 387 (5.4%) | 27 (0.4%) |
| 6-Person Households | 75 (1.1%) | 0 (0.0%) |
| 7+ Person Households | 89 (1.2%) | 11 (0.2%) |
| Total | 4,161 (58.0%) | 3,008 (42.0%) |
Female Fertility in Hanover borough
Fertility by Age in Hanover borough
Average fertility rate in Hanover borough is 37.0 births per 1,000 women. Women in the age bracket of 20 to 34 years have the highest fertility rate with 72.0 births per 1,000 women. Women in the age bracket of 20 to 34 years acount for 100.0% of all women with births.
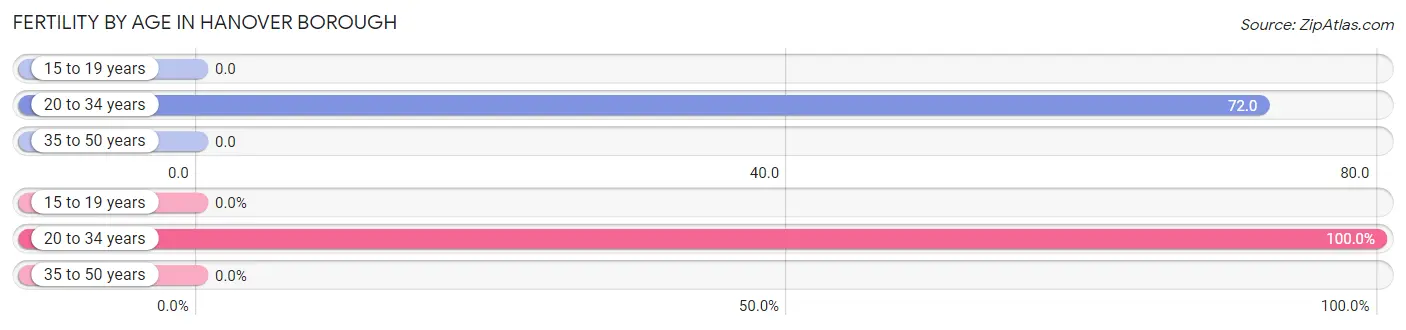
| Age Bracket | Women with Births | Births / 1,000 Women |
| 15 to 19 years | 0 (0.0%) | 0.0 |
| 20 to 34 years | 127 (100.0%) | 72.0 |
| 35 to 50 years | 0 (0.0%) | 0.0 |
| Total | 127 (100.0%) | 37.0 |
Fertility by Age by Marriage Status in Hanover borough
91.3% of women with births (127) in Hanover borough are married. The highest percentage of unmarried women with births falls into 20 to 34 years age bracket with 8.7% of them unmarried at the time of birth, while the lowest percentage of unmarried women with births belong to 20 to 34 years age bracket with 8.7% of them unmarried.
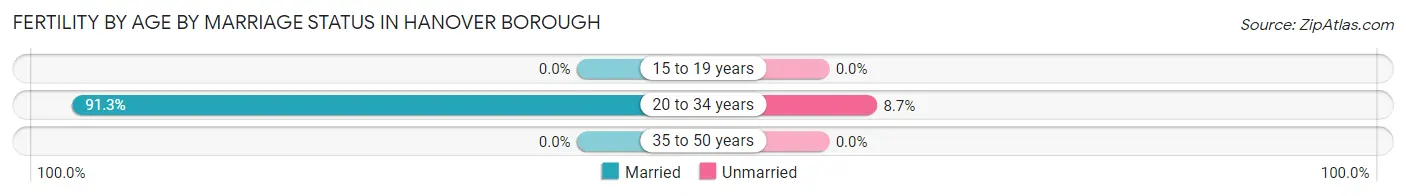
| Age Bracket | Married | Unmarried |
| 15 to 19 years | 0 (0.0%) | 0 (0.0%) |
| 20 to 34 years | 116 (91.3%) | 11 (8.7%) |
| 35 to 50 years | 0 (0.0%) | 0 (0.0%) |
| Total | 116 (91.3%) | 11 (8.7%) |
Fertility by Education in Hanover borough
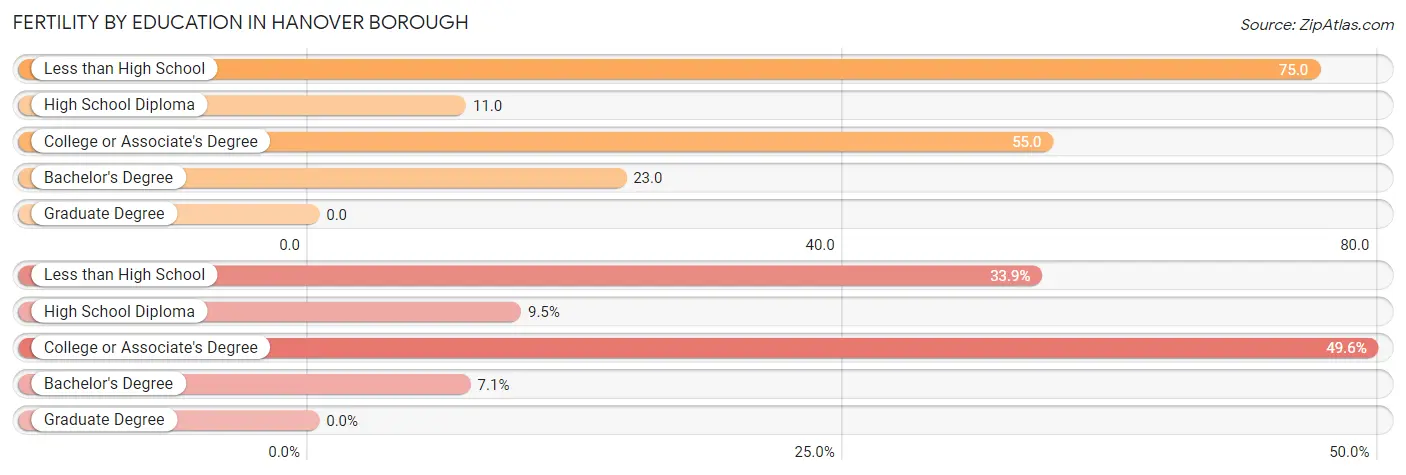
| Educational Attainment | Women with Births | Births / 1,000 Women |
| Less than High School | 43 (33.9%) | 75.0 |
| High School Diploma | 12 (9.5%) | 11.0 |
| College or Associate's Degree | 63 (49.6%) | 55.0 |
| Bachelor's Degree | 9 (7.1%) | 23.0 |
| Graduate Degree | 0 (0.0%) | 0.0 |
| Total | 127 (100.0%) | 37.0 |
Fertility by Education by Marriage Status in Hanover borough
8.7% of women with births in Hanover borough are unmarried. Women with the educational attainment of less than high school are most likely to be married with 100.0% of them married at childbirth, while women with the educational attainment of college or associate's degree are least likely to be married with 17.5% of them unmarried at childbirth.
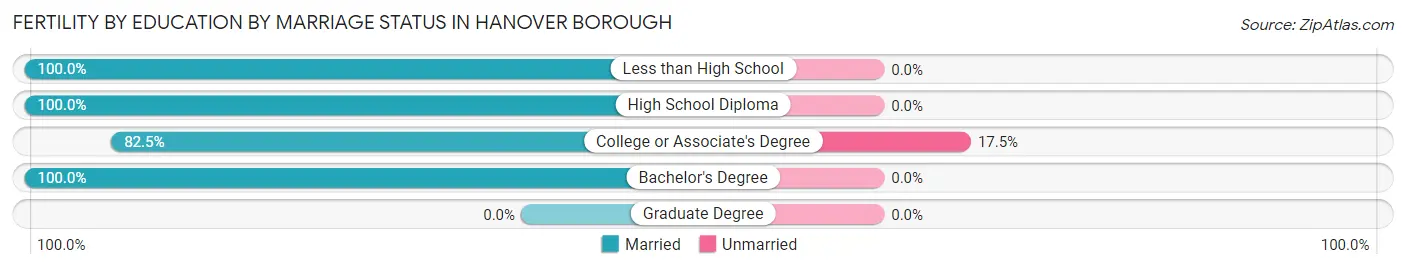
| Educational Attainment | Married | Unmarried |
| Less than High School | 43 (100.0%) | 0 (0.0%) |
| High School Diploma | 12 (100.0%) | 0 (0.0%) |
| College or Associate's Degree | 52 (82.5%) | 11 (17.5%) |
| Bachelor's Degree | 9 (100.0%) | 0 (0.0%) |
| Graduate Degree | 0 (0.0%) | 0 (0.0%) |
| Total | 116 (91.3%) | 11 (8.7%) |
Employment Characteristics in Hanover borough
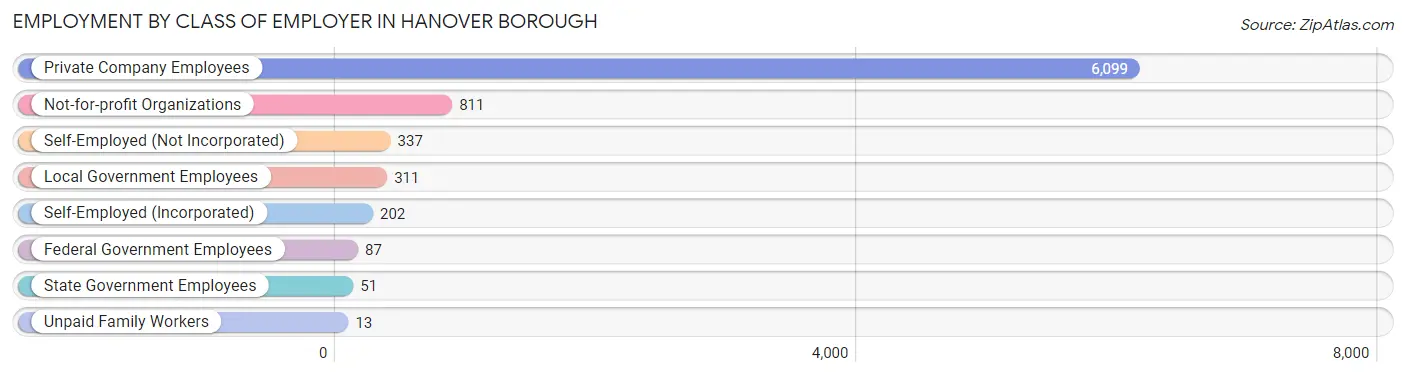
Employment by Class of Employer in Hanover borough
Among the 7,911 employed individuals in Hanover borough, private company employees (6,099 | 77.1%), not-for-profit organizations (811 | 10.2%), and self-employed (not incorporated) (337 | 4.3%) make up the most common classes of employment.
| Employer Class | # Employees | % Employees |
| Private Company Employees | 6,099 | 77.1% |
| Self-Employed (Incorporated) | 202 | 2.5% |
| Self-Employed (Not Incorporated) | 337 | 4.3% |
| Not-for-profit Organizations | 811 | 10.2% |
| Local Government Employees | 311 | 3.9% |
| State Government Employees | 51 | 0.6% |
| Federal Government Employees | 87 | 1.1% |
| Unpaid Family Workers | 13 | 0.2% |
| Total | 7,911 | 100.0% |
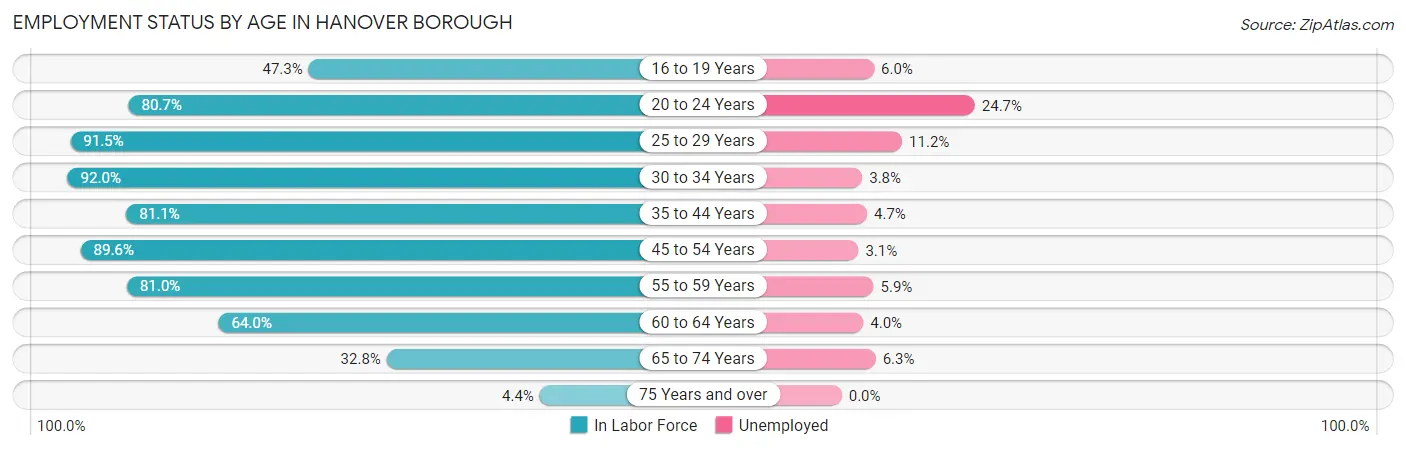
Employment Status by Age in Hanover borough
According to the labor force statistics for Hanover borough, out of the total population over 16 years of age (13,286), 64.8% or 8,609 individuals are in the labor force, with 6.9% or 594 of them unemployed. The age group with the highest labor force participation rate is 30 to 34 years, with 92.0% or 1,031 individuals in the labor force. Within the labor force, the 20 to 24 years age range has the highest percentage of unemployed individuals, with 24.7% or 177 of them being unemployed.
| Age Bracket | In Labor Force | Unemployed |
| 16 to 19 Years | 499 (47.3%) | 30 (6.0%) |
| 20 to 24 Years | 717 (80.7%) | 177 (24.7%) |
| 25 to 29 Years | 1,145 (91.5%) | 128 (11.2%) |
| 30 to 34 Years | 1,031 (92.0%) | 39 (3.8%) |
| 35 to 44 Years | 1,363 (81.1%) | 64 (4.7%) |
| 45 to 54 Years | 1,923 (89.6%) | 60 (3.1%) |
| 55 to 59 Years | 760 (81.0%) | 45 (5.9%) |
| 60 to 64 Years | 653 (64.0%) | 26 (4.0%) |
| 65 to 74 Years | 442 (32.8%) | 28 (6.3%) |
| 75 Years and over | 81 (4.4%) | 0 (0.0%) |
| Total | 8,609 (64.8%) | 594 (6.9%) |
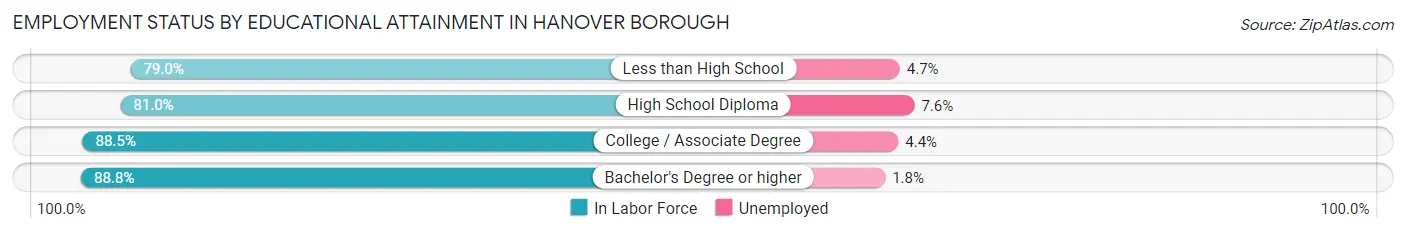
Employment Status by Educational Attainment in Hanover borough
According to labor force statistics for Hanover borough, 84.3% of individuals (6,876) out of the total population between 25 and 64 years of age (8,157) are in the labor force, with 5.3% or 364 of them being unemployed. The group with the highest labor force participation rate are those with the educational attainment of bachelor's degree or higher, with 88.8% or 1,263 individuals in the labor force. Within the labor force, individuals with high school diploma education have the highest percentage of unemployment, with 7.6% or 211 of them being unemployed.
| Educational Attainment | In Labor Force | Unemployed |
| Less than High School | 766 (79.0%) | 46 (4.7%) |
| High School Diploma | 2,776 (81.0%) | 260 (7.6%) |
| College / Associate Degree | 2,069 (88.5%) | 103 (4.4%) |
| Bachelor's Degree or higher | 1,263 (88.8%) | 26 (1.8%) |
| Total | 6,876 (84.3%) | 432 (5.3%) |
Employment Occupations by Sex in Hanover borough
Management, Business, Science and Arts Occupations
The most common Management, Business, Science and Arts occupations in Hanover borough are Management (786 | 9.8%), Community & Social Service (576 | 7.2%), Health Diagnosing & Treating (455 | 5.7%), Education Instruction & Library (372 | 4.6%), and Computers, Engineering & Science (319 | 4.0%).
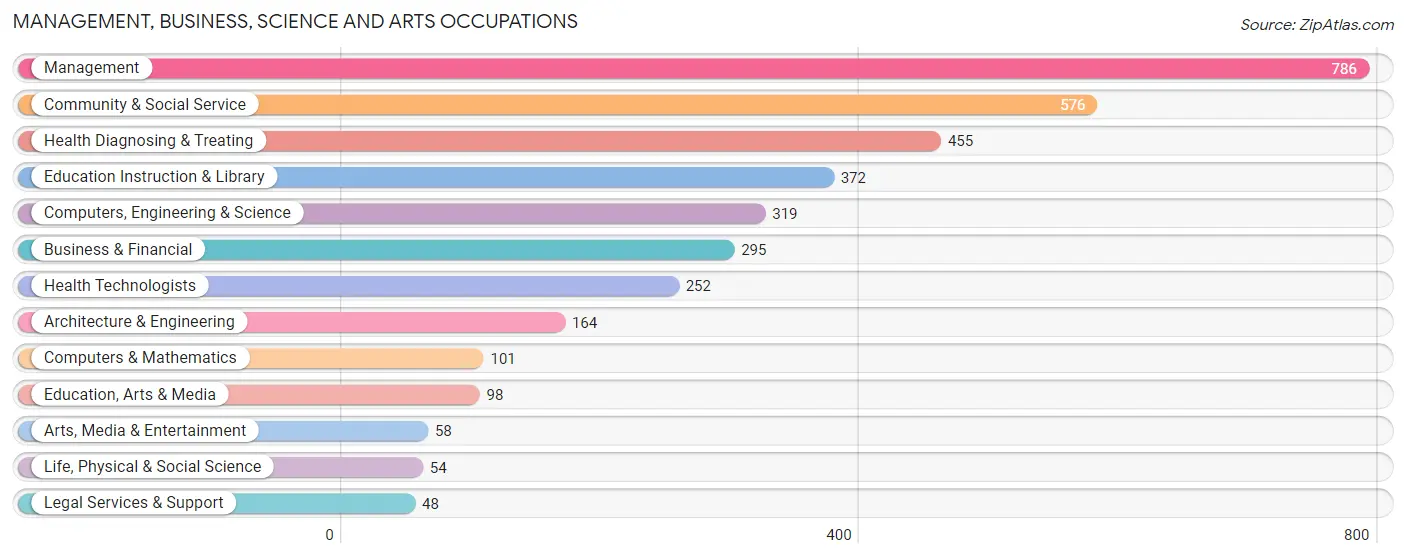
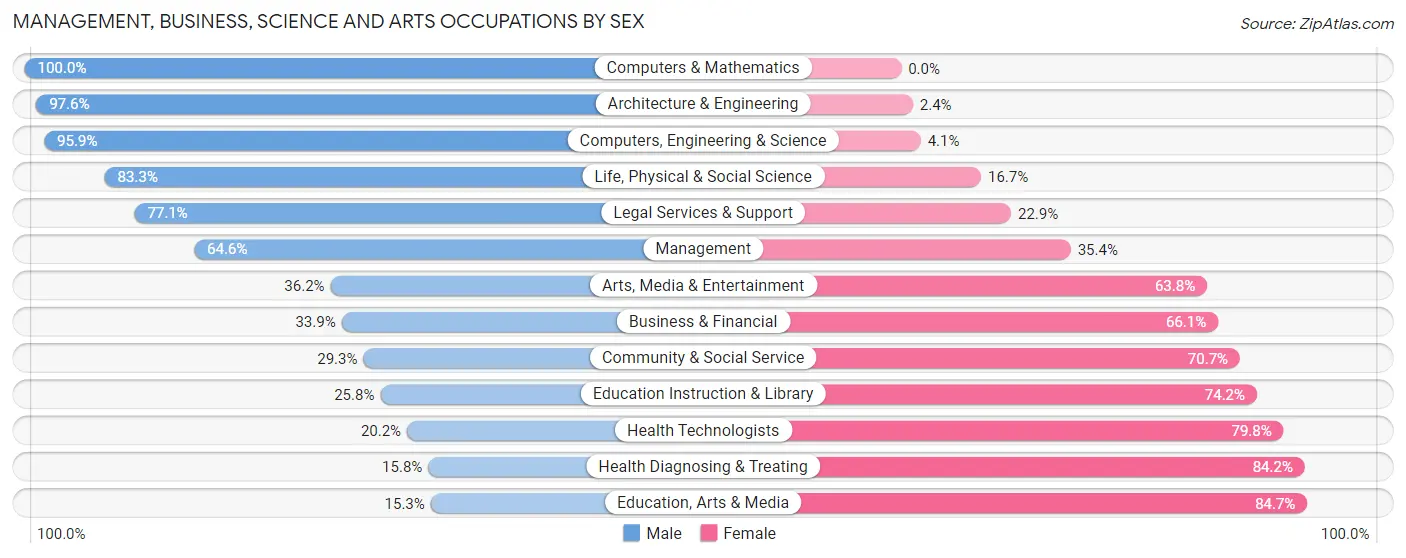
Management, Business, Science and Arts Occupations by Sex
Within the Management, Business, Science and Arts occupations in Hanover borough, the most male-oriented occupations are Computers & Mathematics (100.0%), Architecture & Engineering (97.6%), and Computers, Engineering & Science (95.9%), while the most female-oriented occupations are Education, Arts & Media (84.7%), Health Diagnosing & Treating (84.2%), and Health Technologists (79.8%).
| Occupation | Male | Female |
| Management | 508 (64.6%) | 278 (35.4%) |
| Business & Financial | 100 (33.9%) | 195 (66.1%) |
| Computers, Engineering & Science | 306 (95.9%) | 13 (4.1%) |
| Computers & Mathematics | 101 (100.0%) | 0 (0.0%) |
| Architecture & Engineering | 160 (97.6%) | 4 (2.4%) |
| Life, Physical & Social Science | 45 (83.3%) | 9 (16.7%) |
| Community & Social Service | 169 (29.3%) | 407 (70.7%) |
| Education, Arts & Media | 15 (15.3%) | 83 (84.7%) |
| Legal Services & Support | 37 (77.1%) | 11 (22.9%) |
| Education Instruction & Library | 96 (25.8%) | 276 (74.2%) |
| Arts, Media & Entertainment | 21 (36.2%) | 37 (63.8%) |
| Health Diagnosing & Treating | 72 (15.8%) | 383 (84.2%) |
| Health Technologists | 51 (20.2%) | 201 (79.8%) |
| Total (Category) | 1,155 (47.5%) | 1,276 (52.5%) |
| Total (Overall) | 4,087 (51.0%) | 3,919 (48.9%) |
Services Occupations
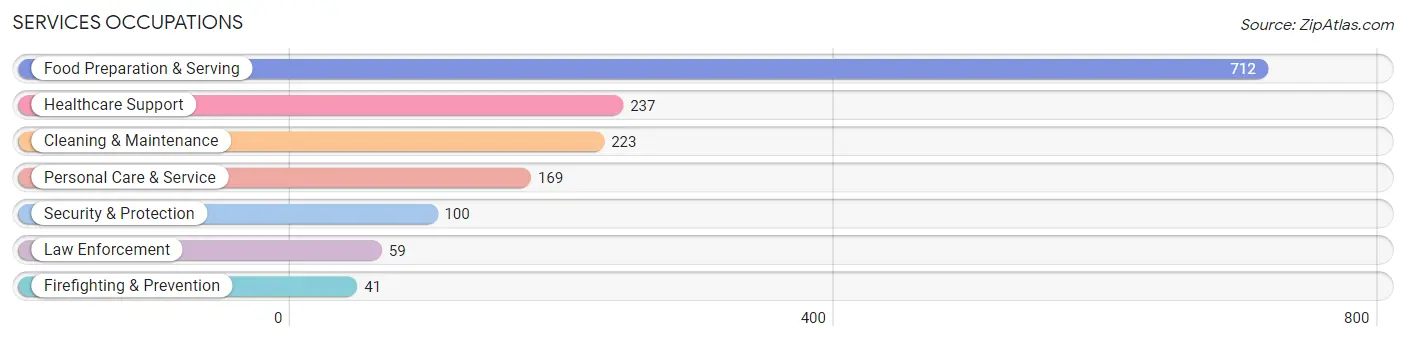
The most common Services occupations in Hanover borough are Food Preparation & Serving (712 | 8.9%), Healthcare Support (237 | 3.0%), Cleaning & Maintenance (223 | 2.8%), Personal Care & Service (169 | 2.1%), and Security & Protection (100 | 1.3%).
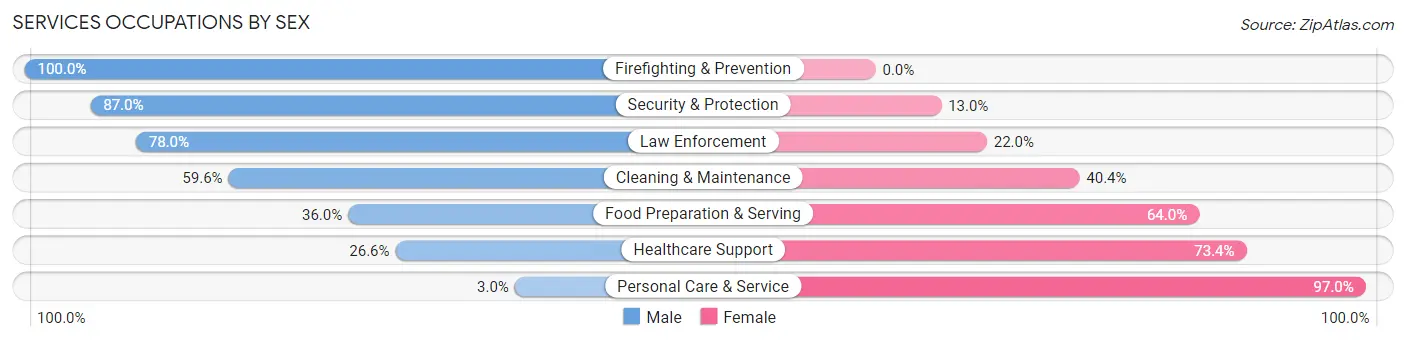
Services Occupations by Sex
Within the Services occupations in Hanover borough, the most male-oriented occupations are Firefighting & Prevention (100.0%), Security & Protection (87.0%), and Law Enforcement (78.0%), while the most female-oriented occupations are Personal Care & Service (97.0%), Healthcare Support (73.4%), and Food Preparation & Serving (64.0%).
| Occupation | Male | Female |
| Healthcare Support | 63 (26.6%) | 174 (73.4%) |
| Security & Protection | 87 (87.0%) | 13 (13.0%) |
| Firefighting & Prevention | 41 (100.0%) | 0 (0.0%) |
| Law Enforcement | 46 (78.0%) | 13 (22.0%) |
| Food Preparation & Serving | 256 (36.0%) | 456 (64.0%) |
| Cleaning & Maintenance | 133 (59.6%) | 90 (40.4%) |
| Personal Care & Service | 5 (3.0%) | 164 (97.0%) |
| Total (Category) | 544 (37.8%) | 897 (62.3%) |
| Total (Overall) | 4,087 (51.0%) | 3,919 (48.9%) |
Sales and Office Occupations
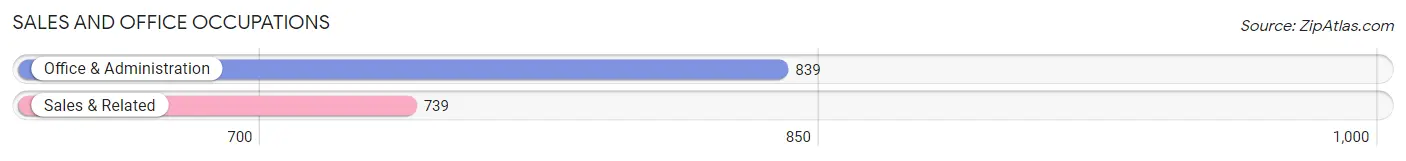
The most common Sales and Office occupations in Hanover borough are Office & Administration (839 | 10.5%), and Sales & Related (739 | 9.2%).
Sales and Office Occupations by Sex

| Occupation | Male | Female |
| Sales & Related | 403 (54.5%) | 336 (45.5%) |
| Office & Administration | 165 (19.7%) | 674 (80.3%) |
| Total (Category) | 568 (36.0%) | 1,010 (64.0%) |
| Total (Overall) | 4,087 (51.0%) | 3,919 (48.9%) |
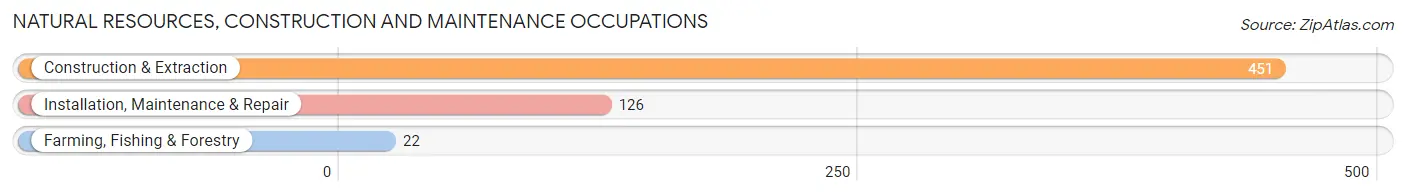
Natural Resources, Construction and Maintenance Occupations
The most common Natural Resources, Construction and Maintenance occupations in Hanover borough are Construction & Extraction (451 | 5.6%), Installation, Maintenance & Repair (126 | 1.6%), and Farming, Fishing & Forestry (22 | 0.3%).
Natural Resources, Construction and Maintenance Occupations by Sex
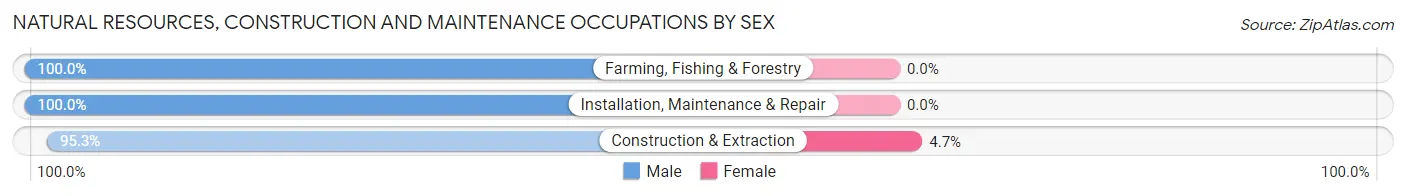
| Occupation | Male | Female |
| Farming, Fishing & Forestry | 22 (100.0%) | 0 (0.0%) |
| Construction & Extraction | 430 (95.3%) | 21 (4.7%) |
| Installation, Maintenance & Repair | 126 (100.0%) | 0 (0.0%) |
| Total (Category) | 578 (96.5%) | 21 (3.5%) |
| Total (Overall) | 4,087 (51.0%) | 3,919 (48.9%) |
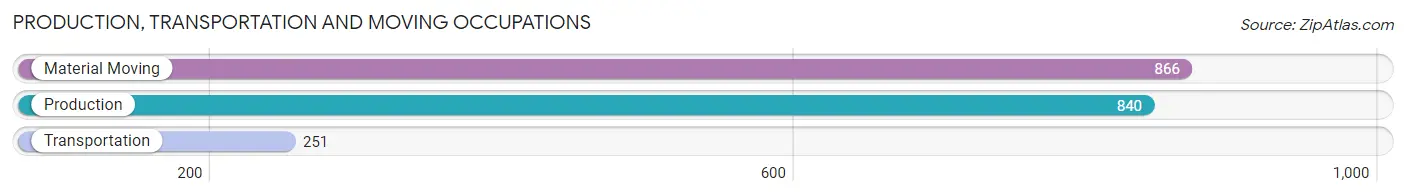
Production, Transportation and Moving Occupations
The most common Production, Transportation and Moving occupations in Hanover borough are Material Moving (866 | 10.8%), Production (840 | 10.5%), and Transportation (251 | 3.1%).
Production, Transportation and Moving Occupations by Sex
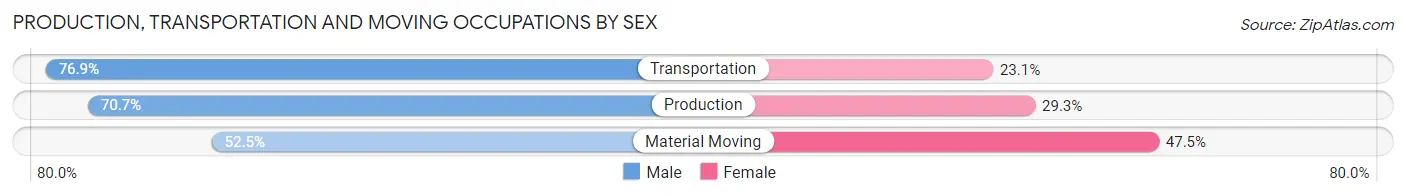
| Occupation | Male | Female |
| Production | 594 (70.7%) | 246 (29.3%) |
| Transportation | 193 (76.9%) | 58 (23.1%) |
| Material Moving | 455 (52.5%) | 411 (47.5%) |
| Total (Category) | 1,242 (63.5%) | 715 (36.5%) |
| Total (Overall) | 4,087 (51.0%) | 3,919 (48.9%) |
Employment Industries by Sex in Hanover borough
Employment Industries in Hanover borough
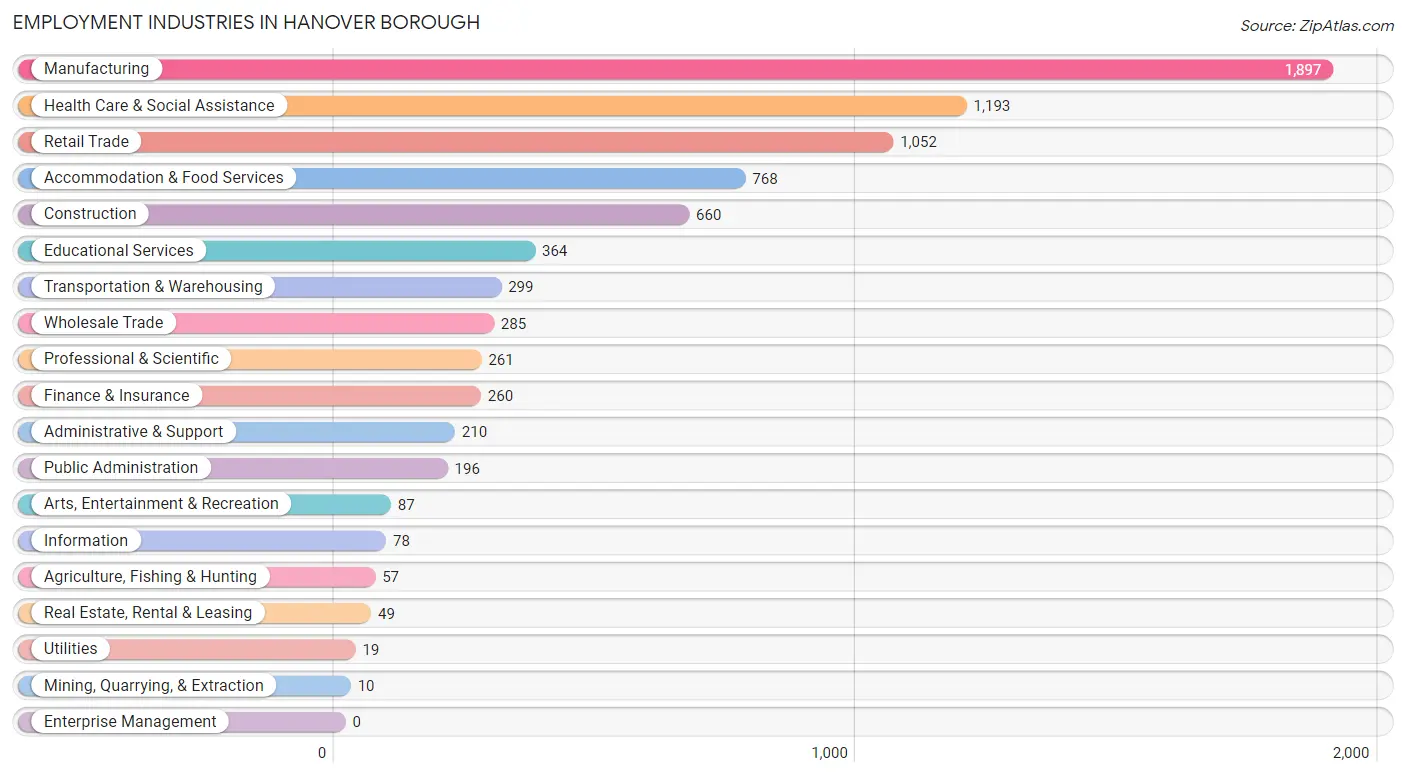
The major employment industries in Hanover borough include Manufacturing (1,897 | 23.7%), Health Care & Social Assistance (1,193 | 14.9%), Retail Trade (1,052 | 13.1%), Accommodation & Food Services (768 | 9.6%), and Construction (660 | 8.2%).
Employment Industries by Sex in Hanover borough
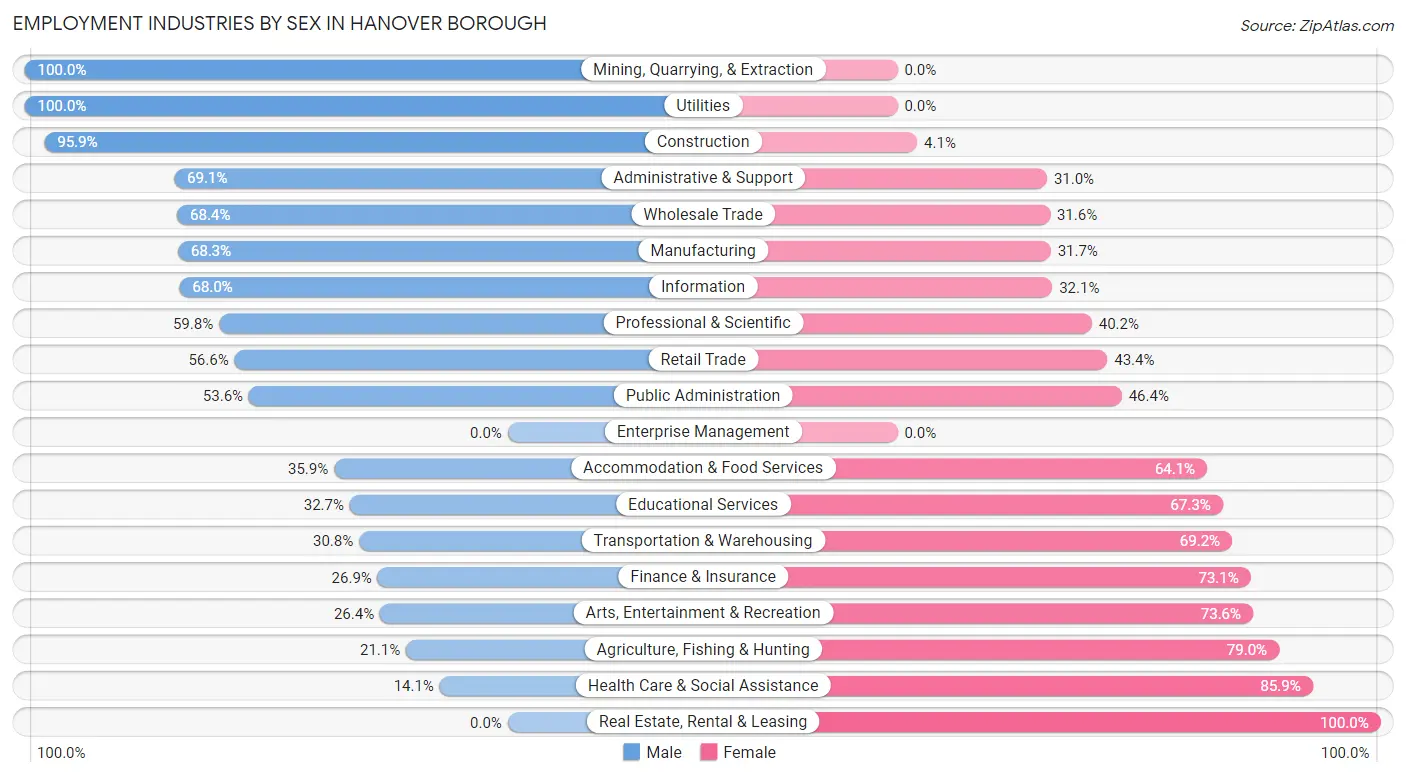
The Hanover borough industries that see more men than women are Mining, Quarrying, & Extraction (100.0%), Utilities (100.0%), and Construction (95.9%), whereas the industries that tend to have a higher number of women are Real Estate, Rental & Leasing (100.0%), Health Care & Social Assistance (85.9%), and Agriculture, Fishing & Hunting (78.9%).
| Industry | Male | Female |
| Agriculture, Fishing & Hunting | 12 (21.0%) | 45 (78.9%) |
| Mining, Quarrying, & Extraction | 10 (100.0%) | 0 (0.0%) |
| Construction | 633 (95.9%) | 27 (4.1%) |
| Manufacturing | 1,295 (68.3%) | 602 (31.7%) |
| Wholesale Trade | 195 (68.4%) | 90 (31.6%) |
| Retail Trade | 595 (56.6%) | 457 (43.4%) |
| Transportation & Warehousing | 92 (30.8%) | 207 (69.2%) |
| Utilities | 19 (100.0%) | 0 (0.0%) |
| Information | 53 (67.9%) | 25 (32.1%) |
| Finance & Insurance | 70 (26.9%) | 190 (73.1%) |
| Real Estate, Rental & Leasing | 0 (0.0%) | 49 (100.0%) |
| Professional & Scientific | 156 (59.8%) | 105 (40.2%) |
| Enterprise Management | 0 (0.0%) | 0 (0.0%) |
| Administrative & Support | 145 (69.1%) | 65 (30.9%) |
| Educational Services | 119 (32.7%) | 245 (67.3%) |
| Health Care & Social Assistance | 168 (14.1%) | 1,025 (85.9%) |
| Arts, Entertainment & Recreation | 23 (26.4%) | 64 (73.6%) |
| Accommodation & Food Services | 276 (35.9%) | 492 (64.1%) |
| Public Administration | 105 (53.6%) | 91 (46.4%) |
| Total | 4,087 (51.0%) | 3,919 (48.9%) |
Education in Hanover borough
School Enrollment in Hanover borough
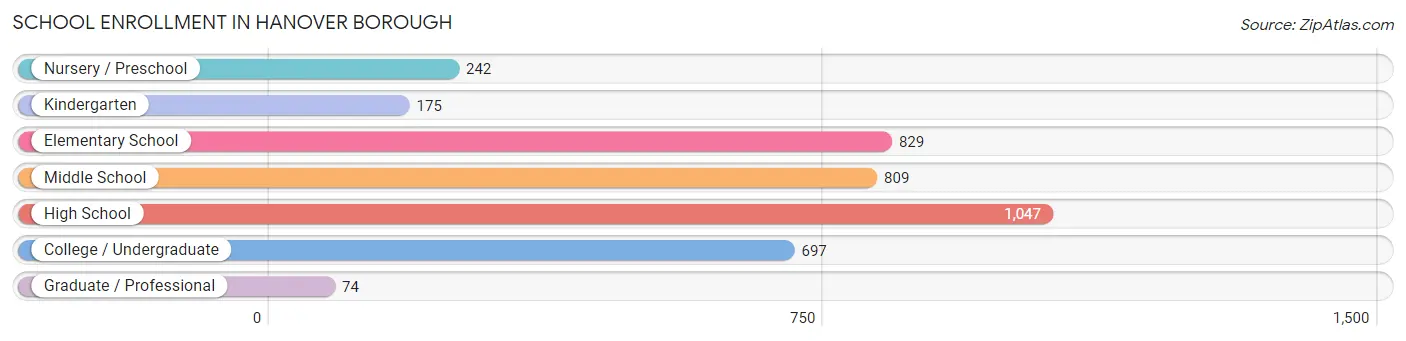
The most common levels of schooling among the 3,873 students in Hanover borough are high school (1,047 | 27.0%), elementary school (829 | 21.4%), and middle school (809 | 20.9%).
| School Level | # Students | % Students |
| Nursery / Preschool | 242 | 6.2% |
| Kindergarten | 175 | 4.5% |
| Elementary School | 829 | 21.4% |
| Middle School | 809 | 20.9% |
| High School | 1,047 | 27.0% |
| College / Undergraduate | 697 | 18.0% |
| Graduate / Professional | 74 | 1.9% |
| Total | 3,873 | 100.0% |
School Enrollment by Age by Funding Source in Hanover borough
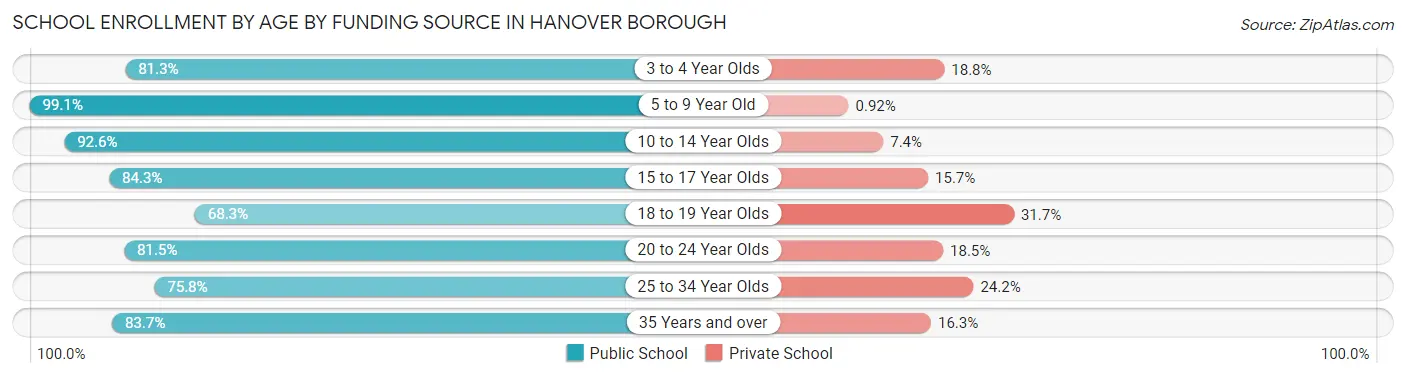
Out of a total of 3,873 students who are enrolled in schools in Hanover borough, 442 (11.4%) attend a private institution, while the remaining 3,431 (88.6%) are enrolled in public schools. The age group of 18 to 19 year olds has the highest likelihood of being enrolled in private schools, with 72 (31.7% in the age bracket) enrolled. Conversely, the age group of 5 to 9 year old has the lowest likelihood of being enrolled in a private school, with 966 (99.1% in the age bracket) attending a public institution.
| Age Bracket | Public School | Private School |
| 3 to 4 Year Olds | 130 (81.2%) | 30 (18.8%) |
| 5 to 9 Year Old | 966 (99.1%) | 9 (0.9%) |
| 10 to 14 Year Olds | 1,029 (92.6%) | 82 (7.4%) |
| 15 to 17 Year Olds | 552 (84.3%) | 103 (15.7%) |
| 18 to 19 Year Olds | 155 (68.3%) | 72 (31.7%) |
| 20 to 24 Year Olds | 198 (81.5%) | 45 (18.5%) |
| 25 to 34 Year Olds | 185 (75.8%) | 59 (24.2%) |
| 35 Years and over | 216 (83.7%) | 42 (16.3%) |
| Total | 3,431 (88.6%) | 442 (11.4%) |
Educational Attainment by Field of Study in Hanover borough
Education (374 | 17.3%), science & technology (358 | 16.6%), business (339 | 15.7%), literature & languages (182 | 8.4%), and arts & humanities (121 | 5.6%) are the most common fields of study among 2,160 individuals in Hanover borough who have obtained a bachelor's degree or higher.
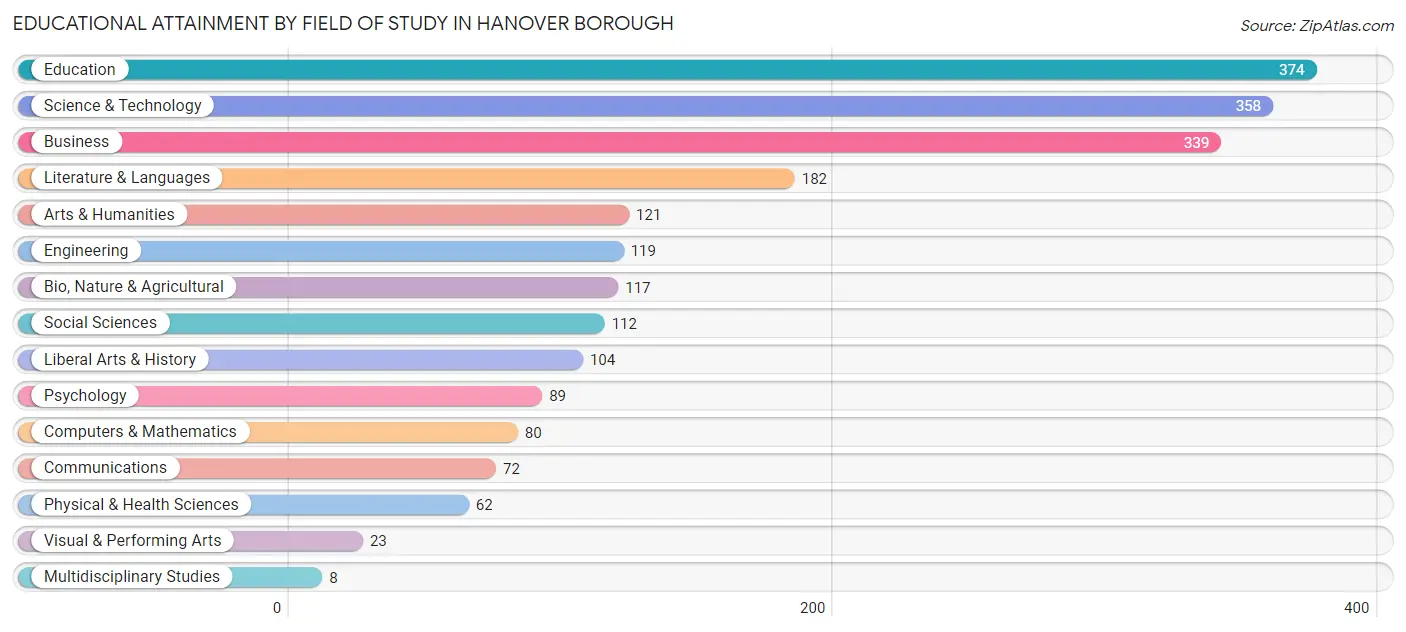
| Field of Study | # Graduates | % Graduates |
| Computers & Mathematics | 80 | 3.7% |
| Bio, Nature & Agricultural | 117 | 5.4% |
| Physical & Health Sciences | 62 | 2.9% |
| Psychology | 89 | 4.1% |
| Social Sciences | 112 | 5.2% |
| Engineering | 119 | 5.5% |
| Multidisciplinary Studies | 8 | 0.4% |
| Science & Technology | 358 | 16.6% |
| Business | 339 | 15.7% |
| Education | 374 | 17.3% |
| Literature & Languages | 182 | 8.4% |
| Liberal Arts & History | 104 | 4.8% |
| Visual & Performing Arts | 23 | 1.1% |
| Communications | 72 | 3.3% |
| Arts & Humanities | 121 | 5.6% |
| Total | 2,160 | 100.0% |
Transportation & Commute in Hanover borough
Vehicle Availability by Sex in Hanover borough
The most prevalent vehicle ownership categories in Hanover borough are males with 2 vehicles (1,582, accounting for 39.0%) and females with 2 vehicles (1,484, making up 41.1%).
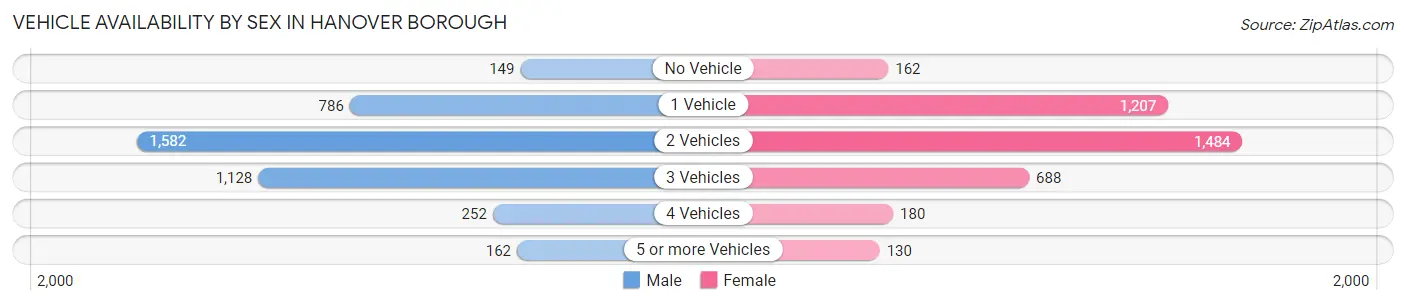
| Vehicles Available | Male | Female |
| No Vehicle | 149 (3.7%) | 162 (4.2%) |
| 1 Vehicle | 786 (19.4%) | 1,207 (31.3%) |
| 2 Vehicles | 1,582 (39.0%) | 1,484 (38.5%) |
| 3 Vehicles | 1,128 (27.8%) | 688 (17.9%) |
| 4 Vehicles | 252 (6.2%) | 180 (4.7%) |
| 5 or more Vehicles | 162 (4.0%) | 130 (3.4%) |
| Total | 4,059 (100.0%) | 3,851 (100.0%) |
Commute Time in Hanover borough
The most frequently occuring commute durations in Hanover borough are 5 to 9 minutes (1,731 commuters, 22.9%), 10 to 14 minutes (1,558 commuters, 20.6%), and 15 to 19 minutes (746 commuters, 9.9%).
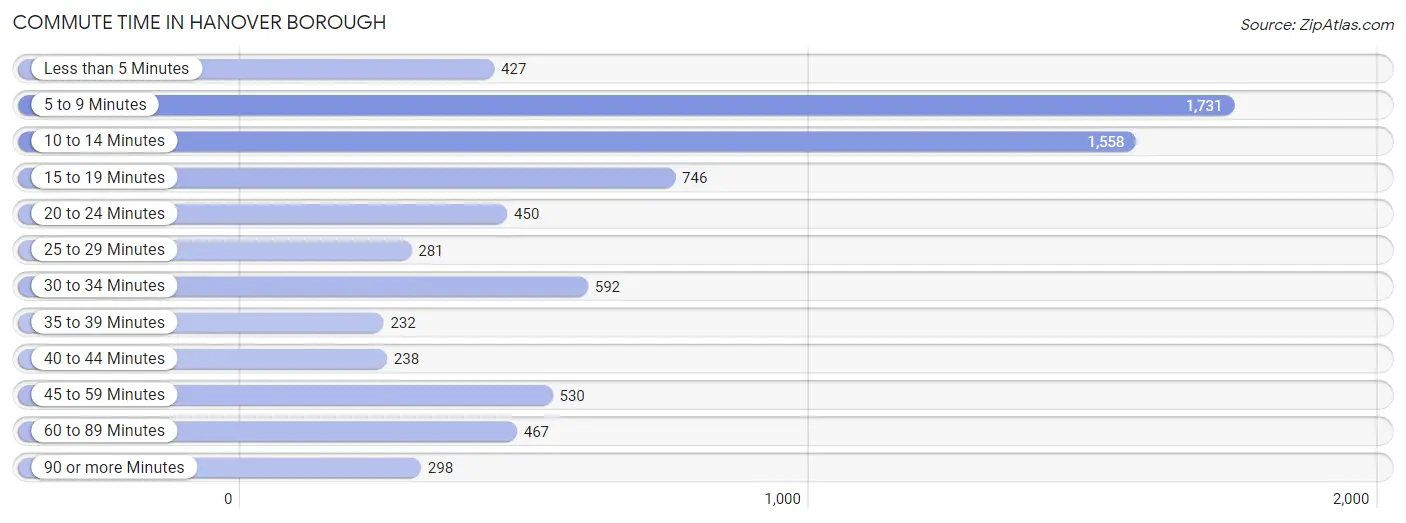
| Commute Time | # Commuters | % Commuters |
| Less than 5 Minutes | 427 | 5.7% |
| 5 to 9 Minutes | 1,731 | 22.9% |
| 10 to 14 Minutes | 1,558 | 20.6% |
| 15 to 19 Minutes | 746 | 9.9% |
| 20 to 24 Minutes | 450 | 6.0% |
| 25 to 29 Minutes | 281 | 3.7% |
| 30 to 34 Minutes | 592 | 7.8% |
| 35 to 39 Minutes | 232 | 3.1% |
| 40 to 44 Minutes | 238 | 3.2% |
| 45 to 59 Minutes | 530 | 7.0% |
| 60 to 89 Minutes | 467 | 6.2% |
| 90 or more Minutes | 298 | 4.0% |
Commute Time by Sex in Hanover borough
The most common commute times in Hanover borough are 5 to 9 minutes (748 commuters, 18.9%) for males and 5 to 9 minutes (983 commuters, 27.4%) for females.
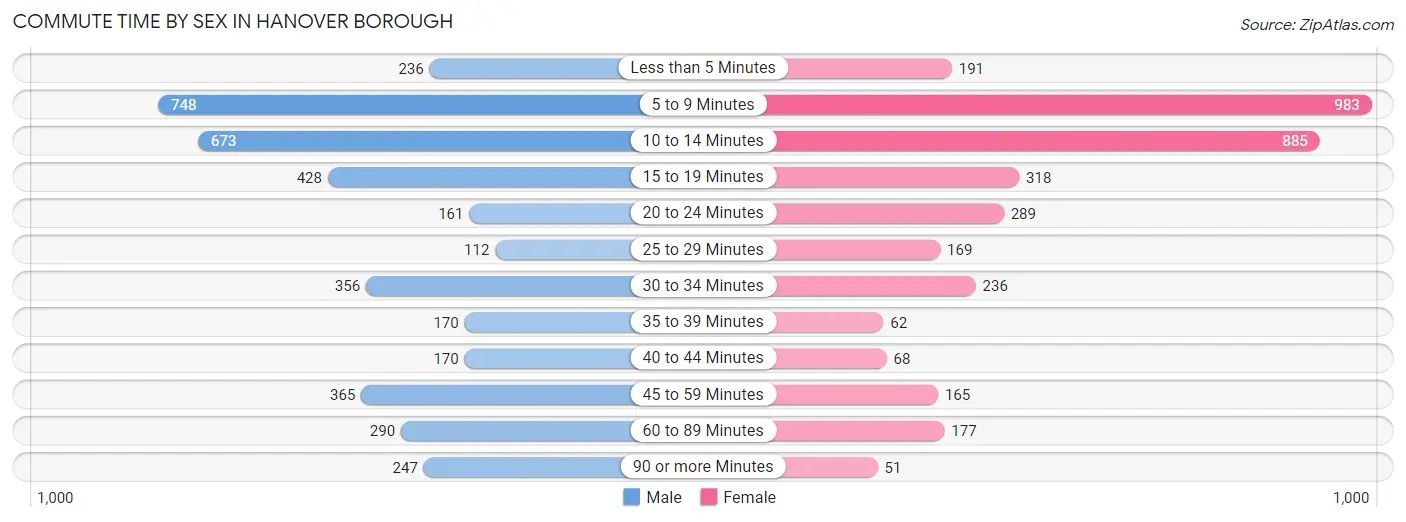
| Commute Time | Male | Female |
| Less than 5 Minutes | 236 (6.0%) | 191 (5.3%) |
| 5 to 9 Minutes | 748 (18.9%) | 983 (27.4%) |
| 10 to 14 Minutes | 673 (17.0%) | 885 (24.6%) |
| 15 to 19 Minutes | 428 (10.8%) | 318 (8.8%) |
| 20 to 24 Minutes | 161 (4.1%) | 289 (8.0%) |
| 25 to 29 Minutes | 112 (2.8%) | 169 (4.7%) |
| 30 to 34 Minutes | 356 (9.0%) | 236 (6.6%) |
| 35 to 39 Minutes | 170 (4.3%) | 62 (1.7%) |
| 40 to 44 Minutes | 170 (4.3%) | 68 (1.9%) |
| 45 to 59 Minutes | 365 (9.2%) | 165 (4.6%) |
| 60 to 89 Minutes | 290 (7.3%) | 177 (4.9%) |
| 90 or more Minutes | 247 (6.2%) | 51 (1.4%) |
Time of Departure to Work by Sex in Hanover borough
The most frequent times of departure to work in Hanover borough are 12:00 AM to 4:59 AM (595, 15.0%) for males and 12:00 PM to 3:59 PM (471, 13.1%) for females.
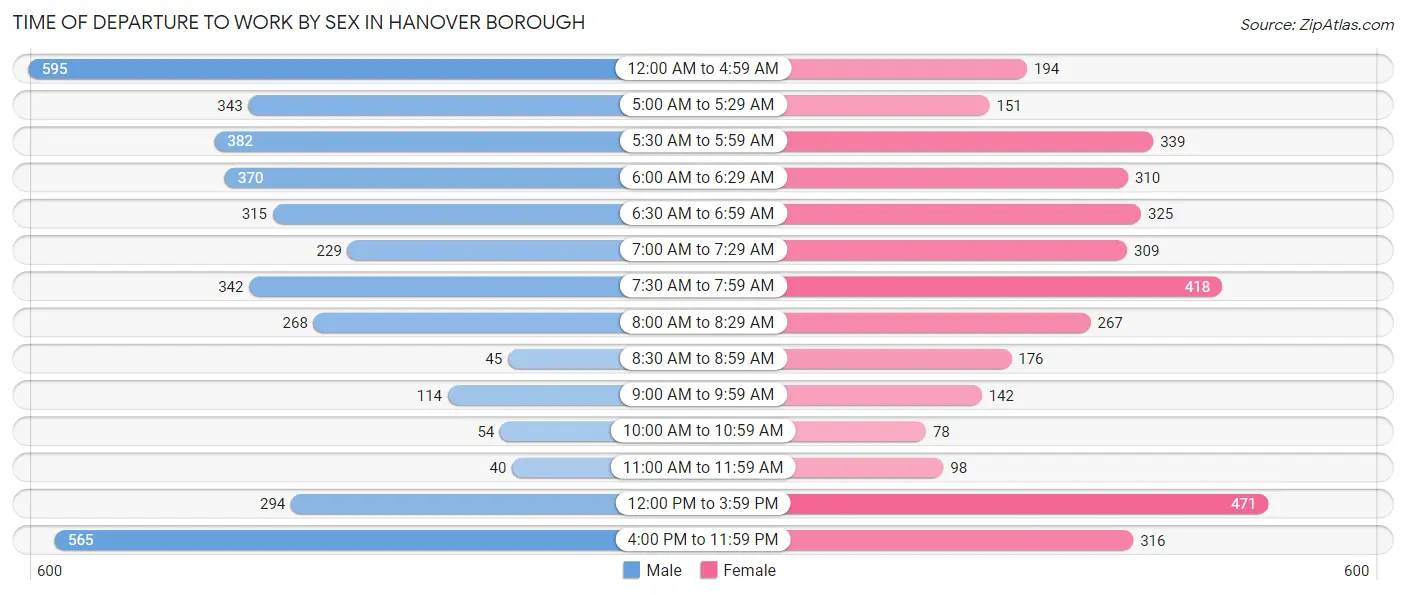
| Time of Departure | Male | Female |
| 12:00 AM to 4:59 AM | 595 (15.0%) | 194 (5.4%) |
| 5:00 AM to 5:29 AM | 343 (8.7%) | 151 (4.2%) |
| 5:30 AM to 5:59 AM | 382 (9.7%) | 339 (9.4%) |
| 6:00 AM to 6:29 AM | 370 (9.3%) | 310 (8.6%) |
| 6:30 AM to 6:59 AM | 315 (8.0%) | 325 (9.0%) |
| 7:00 AM to 7:29 AM | 229 (5.8%) | 309 (8.6%) |
| 7:30 AM to 7:59 AM | 342 (8.6%) | 418 (11.6%) |
| 8:00 AM to 8:29 AM | 268 (6.8%) | 267 (7.4%) |
| 8:30 AM to 8:59 AM | 45 (1.1%) | 176 (4.9%) |
| 9:00 AM to 9:59 AM | 114 (2.9%) | 142 (4.0%) |
| 10:00 AM to 10:59 AM | 54 (1.4%) | 78 (2.2%) |
| 11:00 AM to 11:59 AM | 40 (1.0%) | 98 (2.7%) |
| 12:00 PM to 3:59 PM | 294 (7.4%) | 471 (13.1%) |
| 4:00 PM to 11:59 PM | 565 (14.3%) | 316 (8.8%) |
| Total | 3,956 (100.0%) | 3,594 (100.0%) |
Housing Occupancy in Hanover borough
Occupancy by Ownership in Hanover borough
Of the total 7,169 dwellings in Hanover borough, owner-occupied units account for 4,116 (57.4%), while renter-occupied units make up 3,053 (42.6%).
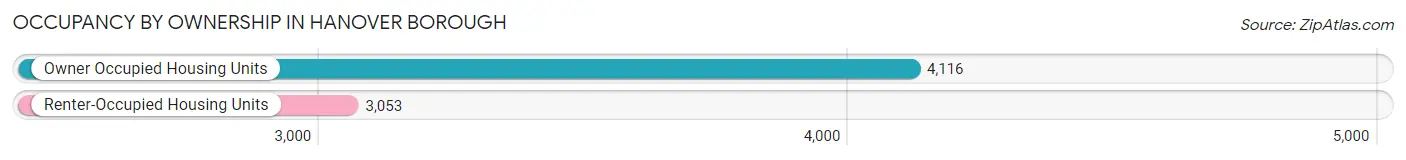
| Occupancy | # Housing Units | % Housing Units |
| Owner Occupied Housing Units | 4,116 | 57.4% |
| Renter-Occupied Housing Units | 3,053 | 42.6% |
| Total Occupied Housing Units | 7,169 | 100.0% |
Occupancy by Household Size in Hanover borough
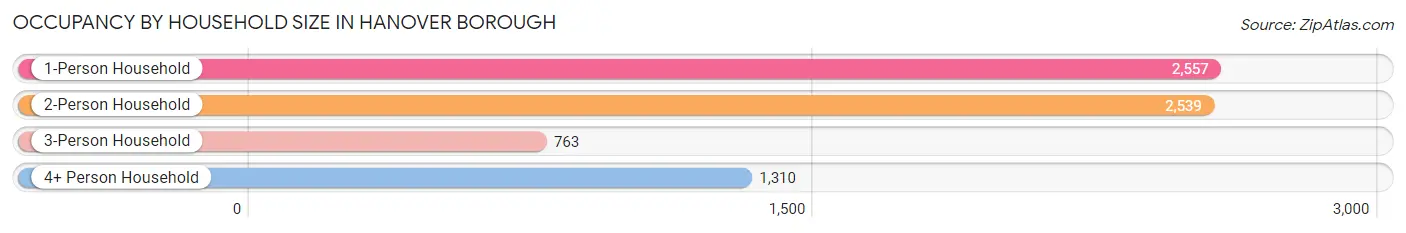
| Household Size | # Housing Units | % Housing Units |
| 1-Person Household | 2,557 | 35.7% |
| 2-Person Household | 2,539 | 35.4% |
| 3-Person Household | 763 | 10.6% |
| 4+ Person Household | 1,310 | 18.3% |
| Total Housing Units | 7,169 | 100.0% |
Occupancy by Ownership by Household Size in Hanover borough
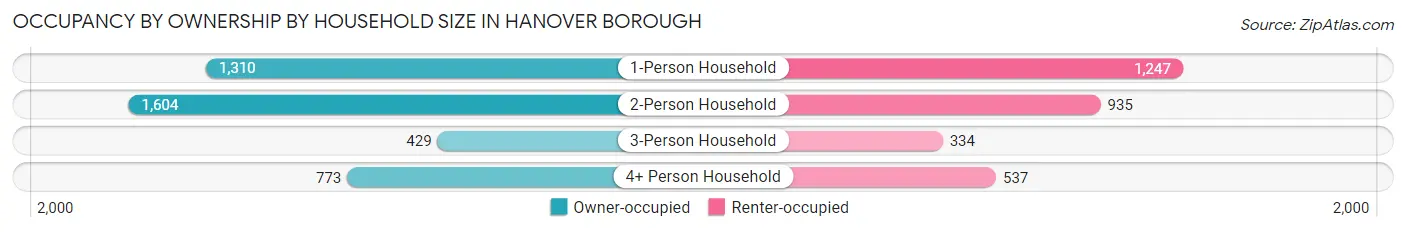
| Household Size | Owner-occupied | Renter-occupied |
| 1-Person Household | 1,310 (51.2%) | 1,247 (48.8%) |
| 2-Person Household | 1,604 (63.2%) | 935 (36.8%) |
| 3-Person Household | 429 (56.2%) | 334 (43.8%) |
| 4+ Person Household | 773 (59.0%) | 537 (41.0%) |
| Total Housing Units | 4,116 (57.4%) | 3,053 (42.6%) |
Occupancy by Educational Attainment in Hanover borough
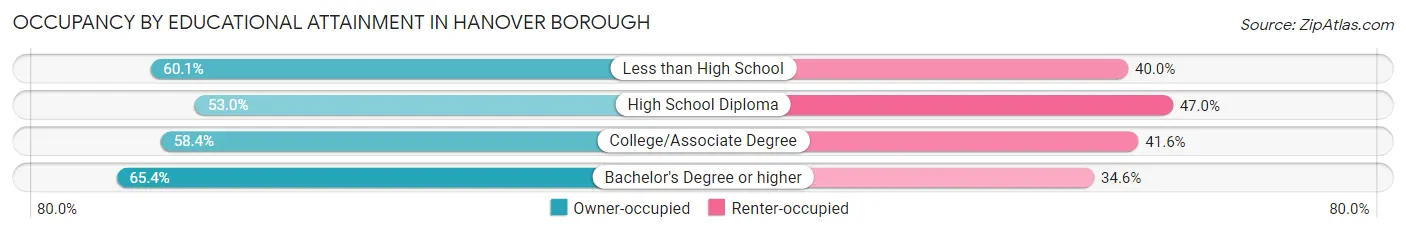
| Household Size | Owner-occupied | Renter-occupied |
| Less than High School | 502 (60.1%) | 334 (40.0%) |
| High School Diploma | 1,715 (53.0%) | 1,523 (47.0%) |
| College/Associate Degree | 1,049 (58.4%) | 747 (41.6%) |
| Bachelor's Degree or higher | 850 (65.4%) | 449 (34.6%) |
Occupancy by Age of Householder in Hanover borough
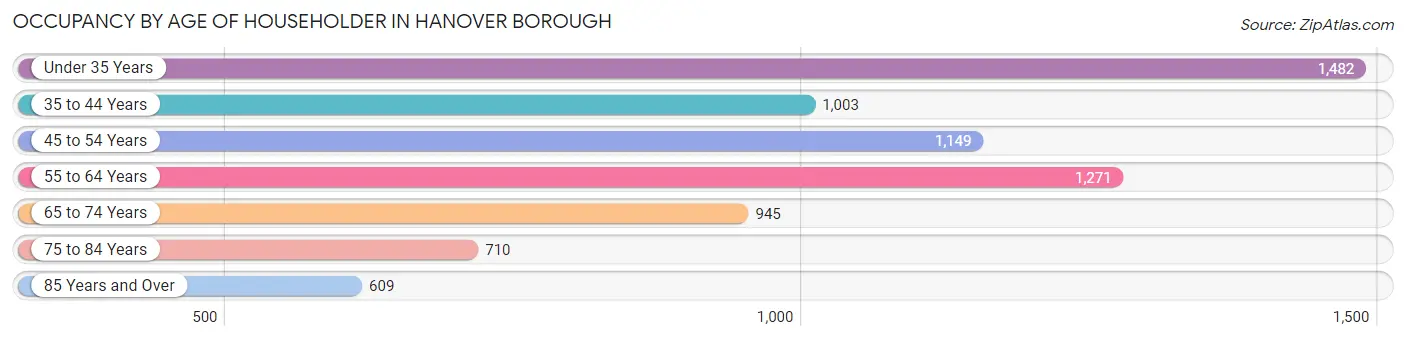
| Age Bracket | # Households | % Households |
| Under 35 Years | 1,482 | 20.7% |
| 35 to 44 Years | 1,003 | 14.0% |
| 45 to 54 Years | 1,149 | 16.0% |
| 55 to 64 Years | 1,271 | 17.7% |
| 65 to 74 Years | 945 | 13.2% |
| 75 to 84 Years | 710 | 9.9% |
| 85 Years and Over | 609 | 8.5% |
| Total | 7,169 | 100.0% |
Housing Finances in Hanover borough
Median Income by Occupancy in Hanover borough
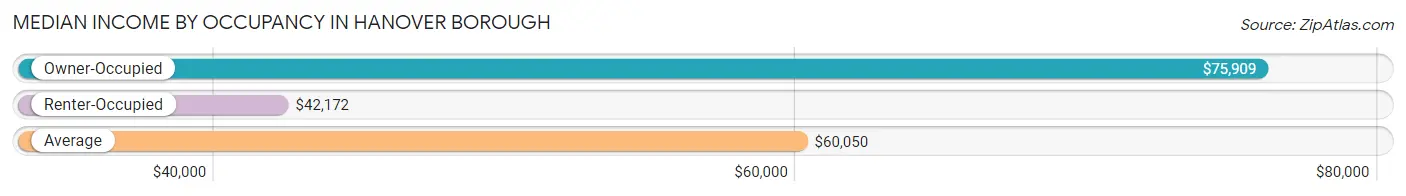
| Occupancy Type | # Households | Median Income |
| Owner-Occupied | 4,116 (57.4%) | $75,909 |
| Renter-Occupied | 3,053 (42.6%) | $42,172 |
| Average | 7,169 (100.0%) | $60,050 |
Occupancy by Householder Income Bracket in Hanover borough
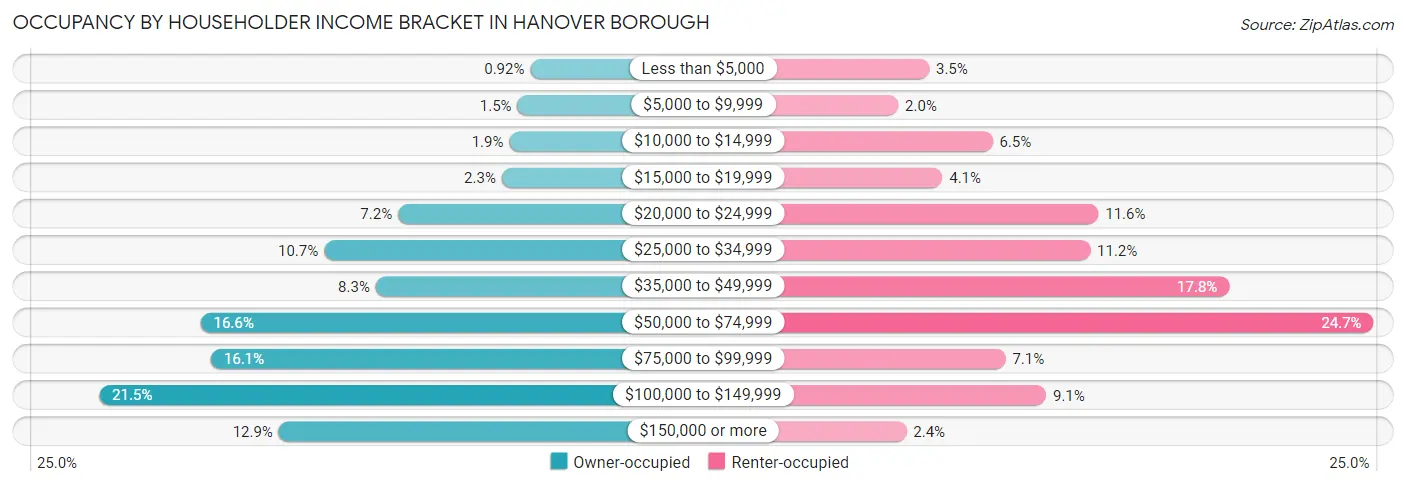
| Income Bracket | Owner-occupied | Renter-occupied |
| Less than $5,000 | 38 (0.9%) | 107 (3.5%) |
| $5,000 to $9,999 | 63 (1.5%) | 62 (2.0%) |
| $10,000 to $14,999 | 79 (1.9%) | 199 (6.5%) |
| $15,000 to $19,999 | 94 (2.3%) | 126 (4.1%) |
| $20,000 to $24,999 | 297 (7.2%) | 353 (11.6%) |
| $25,000 to $34,999 | 442 (10.7%) | 341 (11.2%) |
| $35,000 to $49,999 | 341 (8.3%) | 543 (17.8%) |
| $50,000 to $74,999 | 684 (16.6%) | 753 (24.7%) |
| $75,000 to $99,999 | 664 (16.1%) | 218 (7.1%) |
| $100,000 to $149,999 | 883 (21.4%) | 277 (9.1%) |
| $150,000 or more | 531 (12.9%) | 74 (2.4%) |
| Total | 4,116 (100.0%) | 3,053 (100.0%) |
Monthly Housing Cost Tiers in Hanover borough
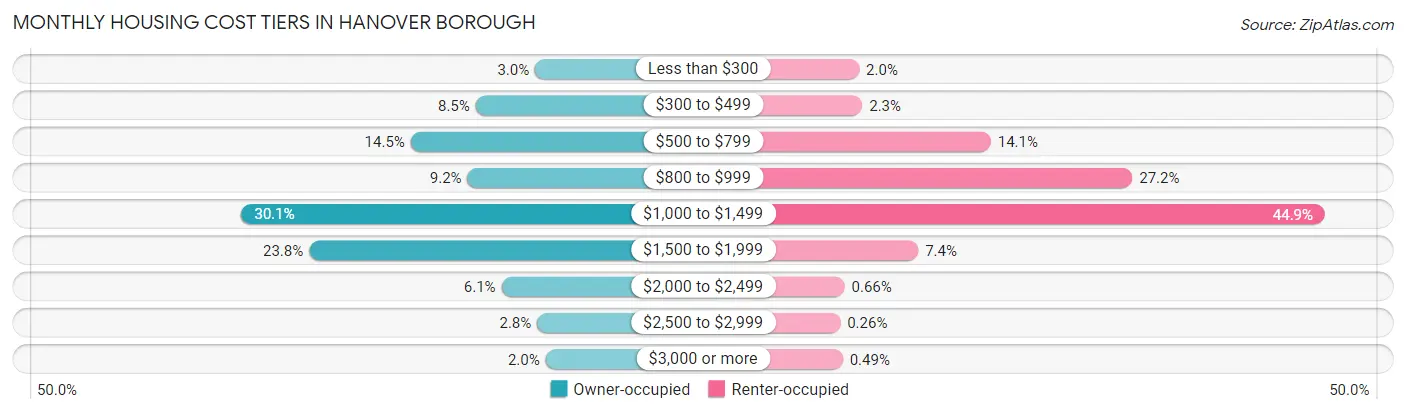
| Monthly Cost | Owner-occupied | Renter-occupied |
| Less than $300 | 124 (3.0%) | 61 (2.0%) |
| $300 to $499 | 349 (8.5%) | 70 (2.3%) |
| $500 to $799 | 595 (14.5%) | 431 (14.1%) |
| $800 to $999 | 380 (9.2%) | 829 (27.2%) |
| $1,000 to $1,499 | 1,237 (30.0%) | 1,370 (44.9%) |
| $1,500 to $1,999 | 980 (23.8%) | 227 (7.4%) |
| $2,000 to $2,499 | 251 (6.1%) | 20 (0.7%) |
| $2,500 to $2,999 | 116 (2.8%) | 8 (0.3%) |
| $3,000 or more | 84 (2.0%) | 15 (0.5%) |
| Total | 4,116 (100.0%) | 3,053 (100.0%) |
Physical Housing Characteristics in Hanover borough
Housing Structures in Hanover borough
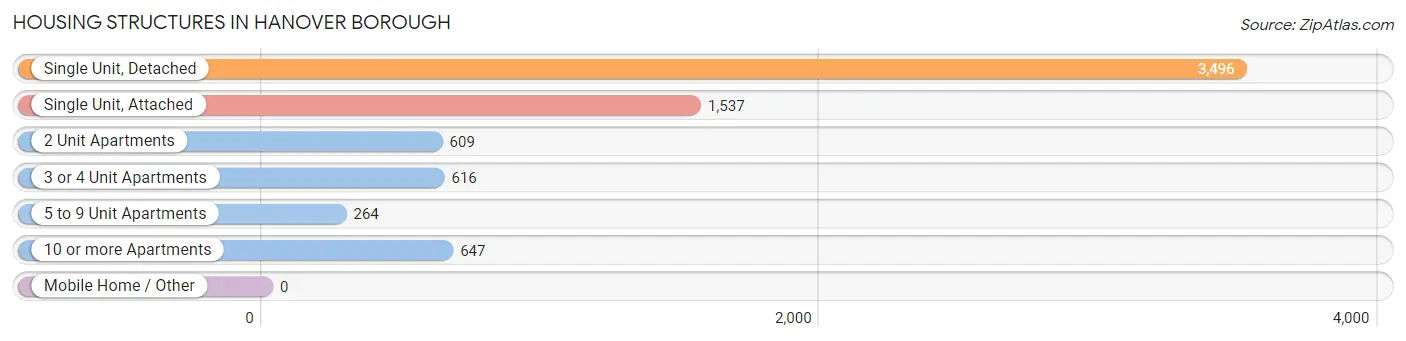
| Structure Type | # Housing Units | % Housing Units |
| Single Unit, Detached | 3,496 | 48.8% |
| Single Unit, Attached | 1,537 | 21.4% |
| 2 Unit Apartments | 609 | 8.5% |
| 3 or 4 Unit Apartments | 616 | 8.6% |
| 5 to 9 Unit Apartments | 264 | 3.7% |
| 10 or more Apartments | 647 | 9.0% |
| Mobile Home / Other | 0 | 0.0% |
| Total | 7,169 | 100.0% |
Housing Structures by Occupancy in Hanover borough
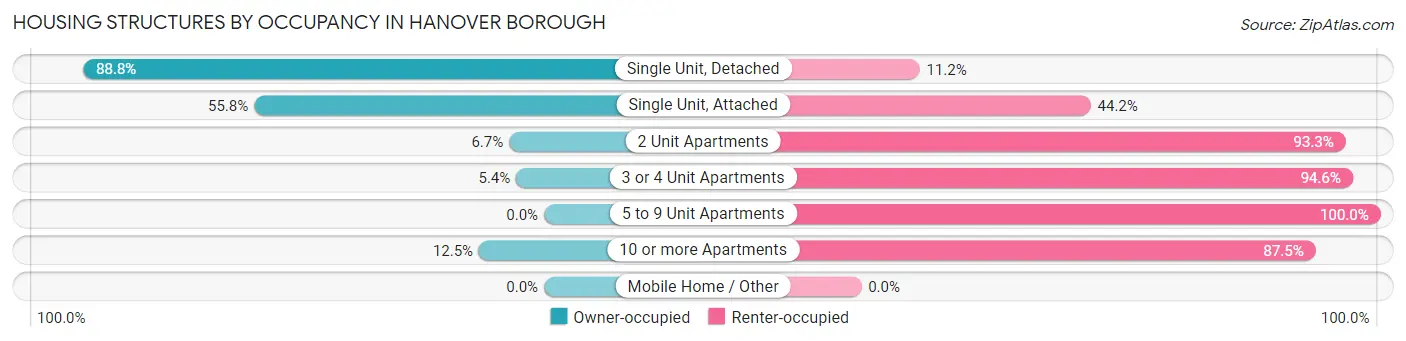
| Structure Type | Owner-occupied | Renter-occupied |
| Single Unit, Detached | 3,103 (88.8%) | 393 (11.2%) |
| Single Unit, Attached | 858 (55.8%) | 679 (44.2%) |
| 2 Unit Apartments | 41 (6.7%) | 568 (93.3%) |
| 3 or 4 Unit Apartments | 33 (5.4%) | 583 (94.6%) |
| 5 to 9 Unit Apartments | 0 (0.0%) | 264 (100.0%) |
| 10 or more Apartments | 81 (12.5%) | 566 (87.5%) |
| Mobile Home / Other | 0 (0.0%) | 0 (0.0%) |
| Total | 4,116 (57.4%) | 3,053 (42.6%) |
Housing Structures by Number of Rooms in Hanover borough
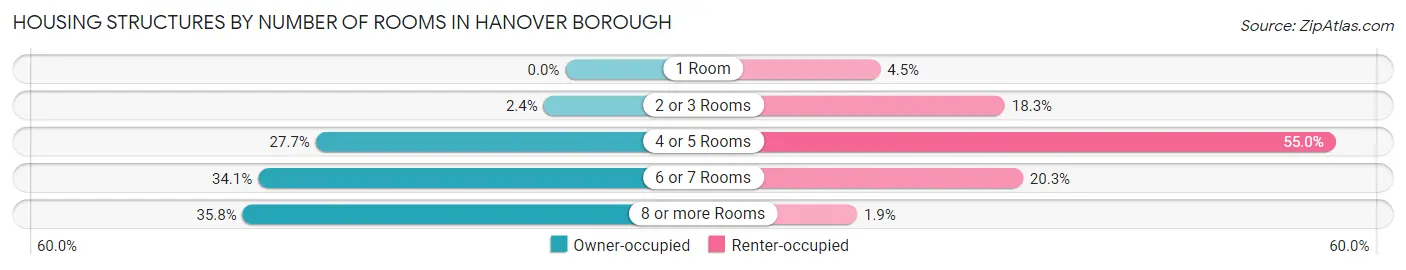
| Number of Rooms | Owner-occupied | Renter-occupied |
| 1 Room | 0 (0.0%) | 137 (4.5%) |
| 2 or 3 Rooms | 99 (2.4%) | 559 (18.3%) |
| 4 or 5 Rooms | 1,140 (27.7%) | 1,679 (55.0%) |
| 6 or 7 Rooms | 1,403 (34.1%) | 620 (20.3%) |
| 8 or more Rooms | 1,474 (35.8%) | 58 (1.9%) |
| Total | 4,116 (100.0%) | 3,053 (100.0%) |
Housing Structure by Heating Type in Hanover borough
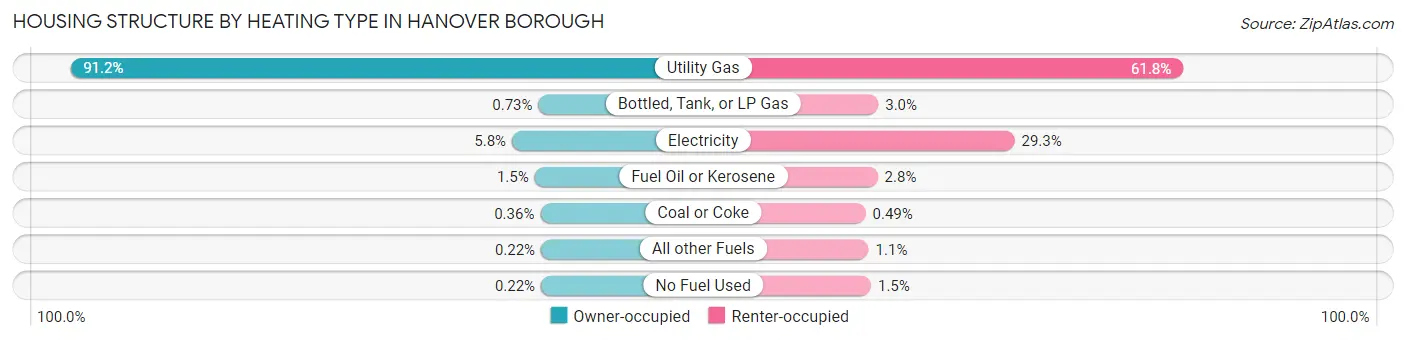
| Heating Type | Owner-occupied | Renter-occupied |
| Utility Gas | 3,753 (91.2%) | 1,888 (61.8%) |
| Bottled, Tank, or LP Gas | 30 (0.7%) | 90 (2.9%) |
| Electricity | 240 (5.8%) | 894 (29.3%) |
| Fuel Oil or Kerosene | 60 (1.5%) | 86 (2.8%) |
| Coal or Coke | 15 (0.4%) | 15 (0.5%) |
| All other Fuels | 9 (0.2%) | 33 (1.1%) |
| No Fuel Used | 9 (0.2%) | 47 (1.5%) |
| Total | 4,116 (100.0%) | 3,053 (100.0%) |
Household Vehicle Usage in Hanover borough
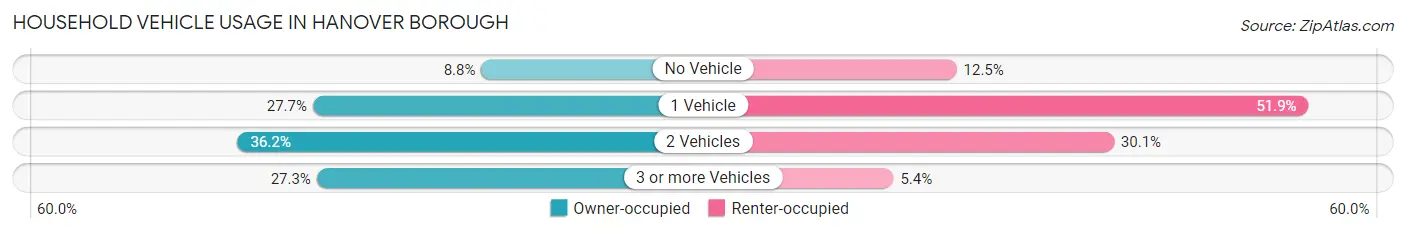
| Vehicles per Household | Owner-occupied | Renter-occupied |
| No Vehicle | 364 (8.8%) | 382 (12.5%) |
| 1 Vehicle | 1,141 (27.7%) | 1,585 (51.9%) |
| 2 Vehicles | 1,488 (36.1%) | 920 (30.1%) |
| 3 or more Vehicles | 1,123 (27.3%) | 166 (5.4%) |
| Total | 4,116 (100.0%) | 3,053 (100.0%) |
Real Estate & Mortgages in Hanover borough
Real Estate and Mortgage Overview in Hanover borough
| Characteristic | Without Mortgage | With Mortgage |
| Housing Units | 1,621 | 2,495 |
| Median Property Value | $169,200 | $183,600 |
| Median Household Income | $60,699 | $331 |
| Monthly Housing Costs | $689 | $84 |
| Real Estate Taxes | $4,304 | $19 |
Property Value by Mortgage Status in Hanover borough
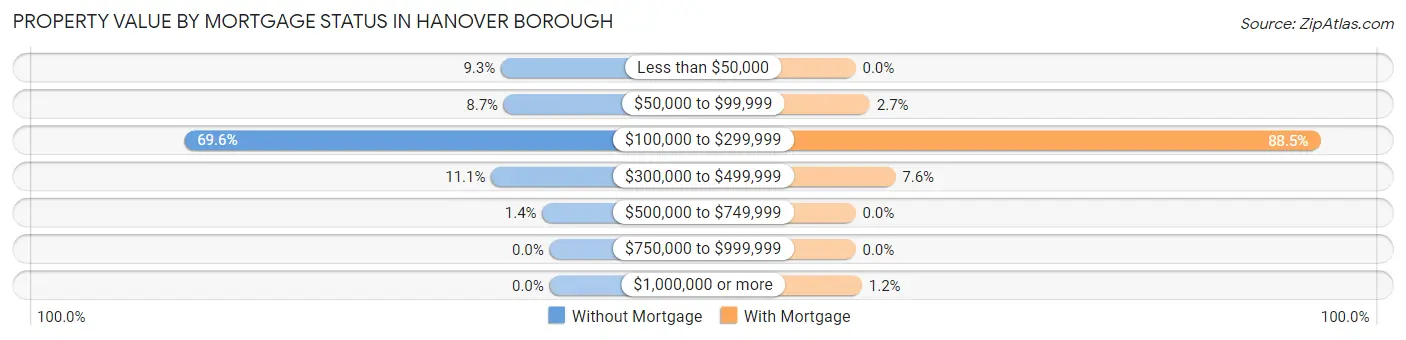
| Property Value | Without Mortgage | With Mortgage |
| Less than $50,000 | 150 (9.2%) | 0 (0.0%) |
| $50,000 to $99,999 | 141 (8.7%) | 68 (2.7%) |
| $100,000 to $299,999 | 1,128 (69.6%) | 2,208 (88.5%) |
| $300,000 to $499,999 | 180 (11.1%) | 189 (7.6%) |
| $500,000 to $749,999 | 22 (1.4%) | 0 (0.0%) |
| $750,000 to $999,999 | 0 (0.0%) | 0 (0.0%) |
| $1,000,000 or more | 0 (0.0%) | 30 (1.2%) |
| Total | 1,621 (100.0%) | 2,495 (100.0%) |
Household Income by Mortgage Status in Hanover borough
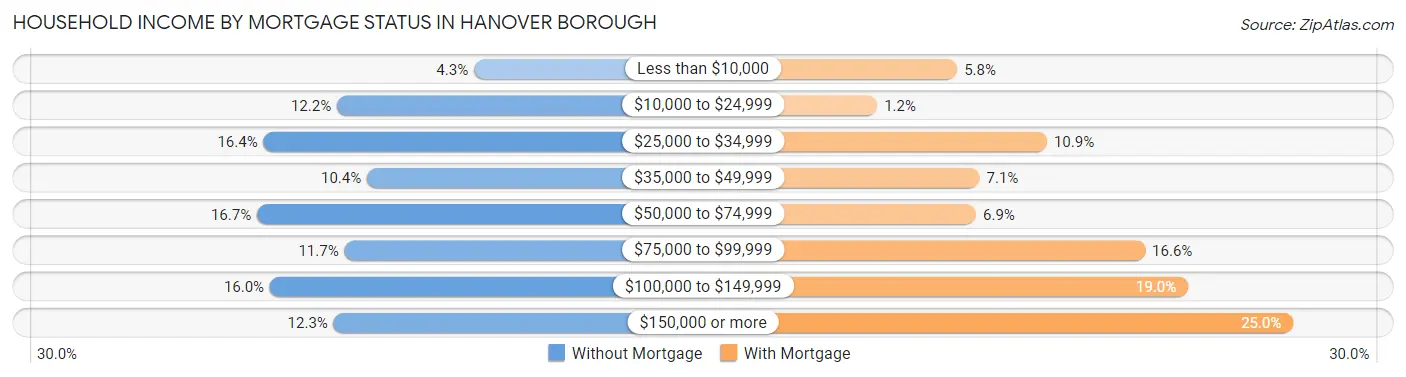
| Household Income | Without Mortgage | With Mortgage |
| Less than $10,000 | 70 (4.3%) | 145 (5.8%) |
| $10,000 to $24,999 | 197 (12.1%) | 31 (1.2%) |
| $25,000 to $34,999 | 265 (16.4%) | 273 (10.9%) |
| $35,000 to $49,999 | 169 (10.4%) | 177 (7.1%) |
| $50,000 to $74,999 | 271 (16.7%) | 172 (6.9%) |
| $75,000 to $99,999 | 190 (11.7%) | 413 (16.6%) |
| $100,000 to $149,999 | 259 (16.0%) | 474 (19.0%) |
| $150,000 or more | 200 (12.3%) | 624 (25.0%) |
| Total | 1,621 (100.0%) | 2,495 (100.0%) |
Property Value to Household Income Ratio in Hanover borough
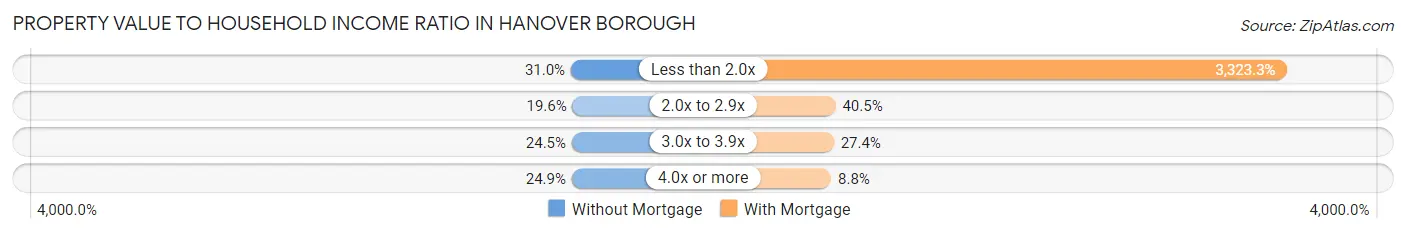
| Value-to-Income Ratio | Without Mortgage | With Mortgage |
| Less than 2.0x | 502 (31.0%) | 82,917 (3,323.3%) |
| 2.0x to 2.9x | 318 (19.6%) | 1,010 (40.5%) |
| 3.0x to 3.9x | 397 (24.5%) | 683 (27.4%) |
| 4.0x or more | 404 (24.9%) | 219 (8.8%) |
| Total | 1,621 (100.0%) | 2,495 (100.0%) |
Real Estate Taxes by Mortgage Status in Hanover borough
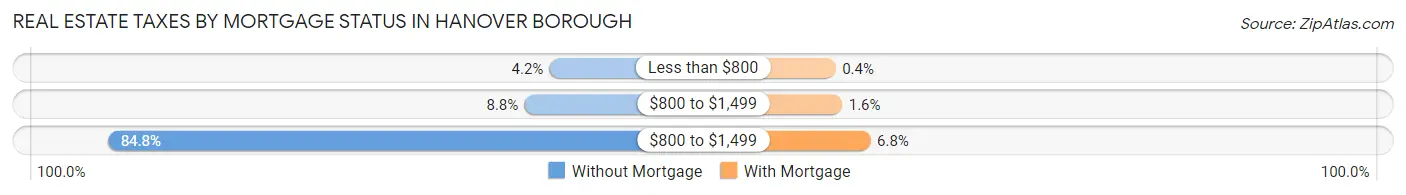
| Property Taxes | Without Mortgage | With Mortgage |
| Less than $800 | 68 (4.2%) | 10 (0.4%) |
| $800 to $1,499 | 142 (8.8%) | 40 (1.6%) |
| $800 to $1,499 | 1,375 (84.8%) | 169 (6.8%) |
| Total | 1,621 (100.0%) | 2,495 (100.0%) |
Health & Disability in Hanover borough
Health Insurance Coverage by Age in Hanover borough
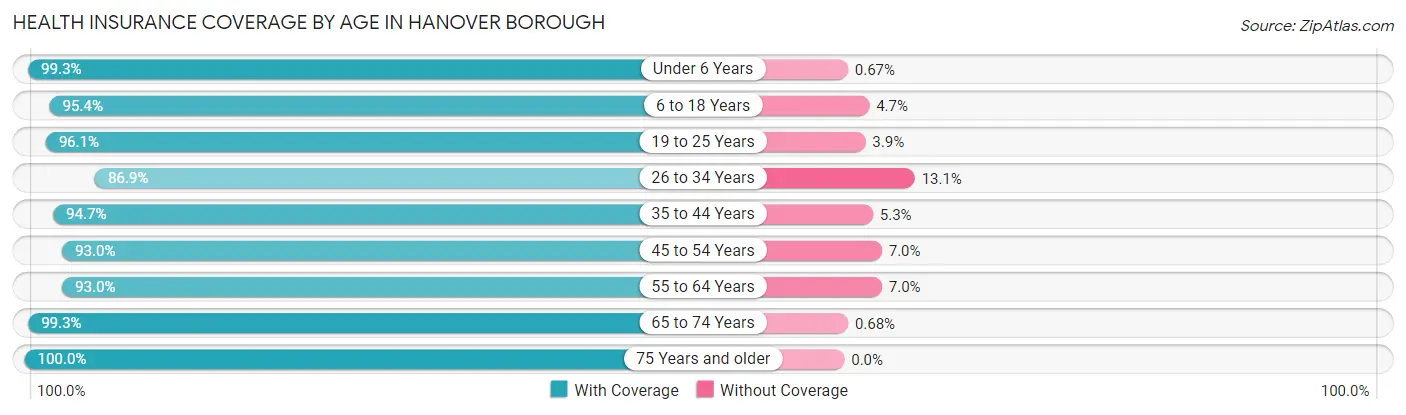
| Age Bracket | With Coverage | Without Coverage |
| Under 6 Years | 1,034 (99.3%) | 7 (0.7%) |
| 6 to 18 Years | 2,707 (95.4%) | 132 (4.6%) |
| 19 to 25 Years | 1,291 (96.1%) | 53 (3.9%) |
| 26 to 34 Years | 1,926 (86.9%) | 291 (13.1%) |
| 35 to 44 Years | 1,581 (94.7%) | 89 (5.3%) |
| 45 to 54 Years | 1,996 (93.0%) | 150 (7.0%) |
| 55 to 64 Years | 1,817 (93.0%) | 137 (7.0%) |
| 65 to 74 Years | 1,317 (99.3%) | 9 (0.7%) |
| 75 Years and older | 1,716 (100.0%) | 0 (0.0%) |
| Total | 15,385 (94.7%) | 868 (5.3%) |
Health Insurance Coverage by Citizenship Status in Hanover borough
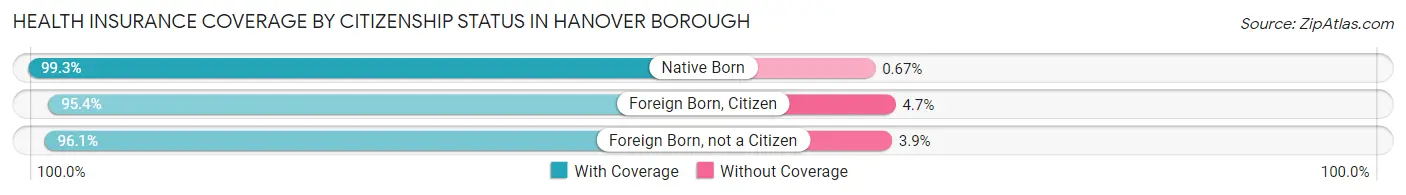
| Citizenship Status | With Coverage | Without Coverage |
| Native Born | 1,034 (99.3%) | 7 (0.7%) |
| Foreign Born, Citizen | 2,707 (95.4%) | 132 (4.6%) |
| Foreign Born, not a Citizen | 1,291 (96.1%) | 53 (3.9%) |
Health Insurance Coverage by Household Income in Hanover borough
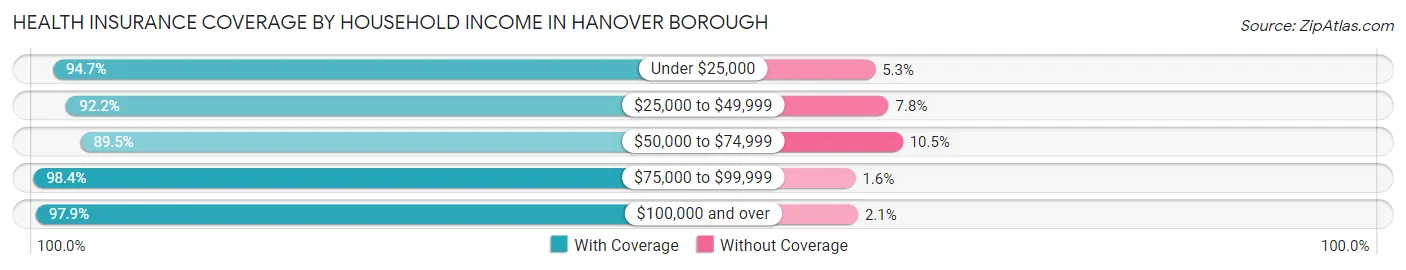
| Household Income | With Coverage | Without Coverage |
| Under $25,000 | 1,848 (94.7%) | 104 (5.3%) |
| $25,000 to $49,999 | 3,044 (92.2%) | 259 (7.8%) |
| $50,000 to $74,999 | 3,062 (89.5%) | 358 (10.5%) |
| $75,000 to $99,999 | 2,431 (98.4%) | 40 (1.6%) |
| $100,000 and over | 4,984 (97.9%) | 107 (2.1%) |
Public vs Private Health Insurance Coverage by Age in Hanover borough
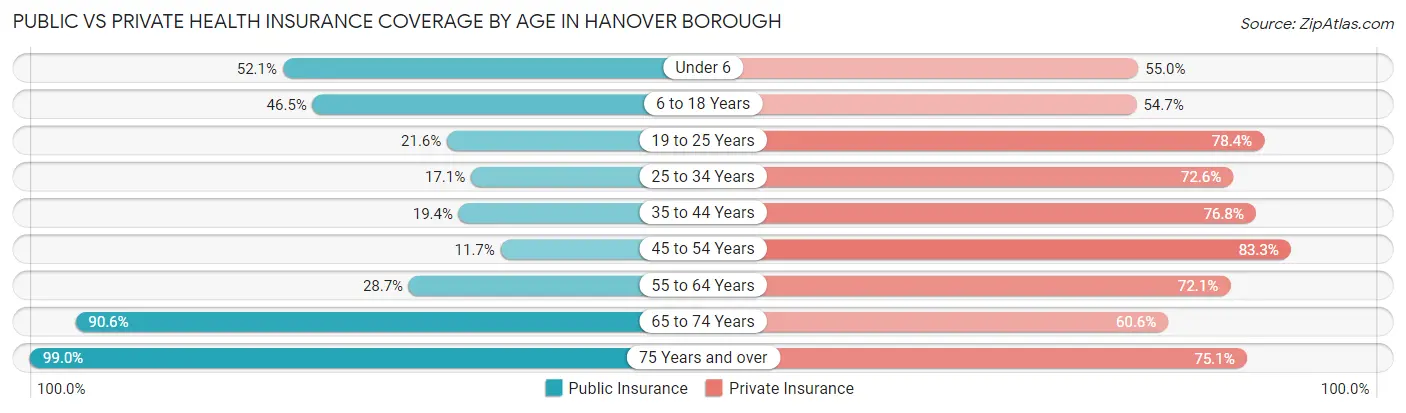
| Age Bracket | Public Insurance | Private Insurance |
| Under 6 | 542 (52.1%) | 573 (55.0%) |
| 6 to 18 Years | 1,321 (46.5%) | 1,553 (54.7%) |
| 19 to 25 Years | 290 (21.6%) | 1,053 (78.3%) |
| 25 to 34 Years | 380 (17.1%) | 1,610 (72.6%) |
| 35 to 44 Years | 324 (19.4%) | 1,283 (76.8%) |
| 45 to 54 Years | 250 (11.7%) | 1,788 (83.3%) |
| 55 to 64 Years | 560 (28.7%) | 1,408 (72.1%) |
| 65 to 74 Years | 1,201 (90.6%) | 803 (60.6%) |
| 75 Years and over | 1,699 (99.0%) | 1,289 (75.1%) |
| Total | 6,567 (40.4%) | 11,360 (69.9%) |
Disability Status by Sex by Age in Hanover borough
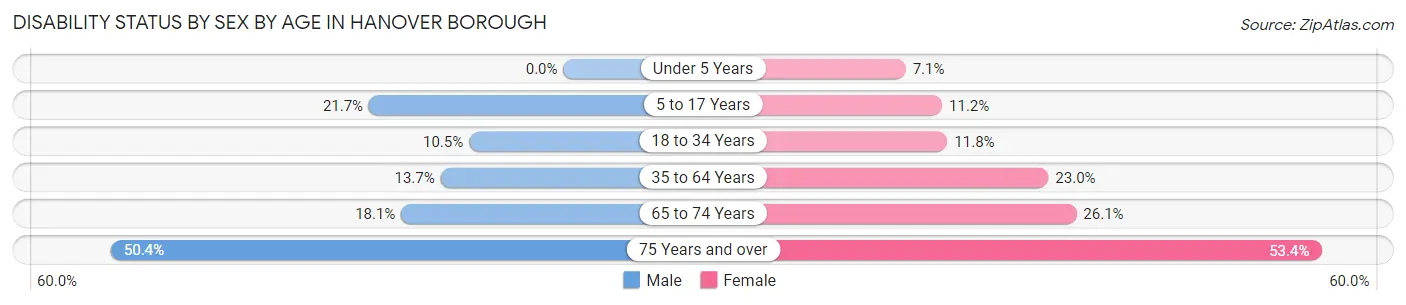
| Age Bracket | Male | Female |
| Under 5 Years | 0 (0.0%) | 28 (7.1%) |
| 5 to 17 Years | 359 (21.6%) | 127 (11.2%) |
| 18 to 34 Years | 199 (10.5%) | 223 (11.8%) |
| 35 to 64 Years | 397 (13.7%) | 660 (23.0%) |
| 65 to 74 Years | 104 (18.1%) | 196 (26.1%) |
| 75 Years and over | 256 (50.4%) | 645 (53.4%) |
Disability Class by Sex by Age in Hanover borough
Disability Class: Hearing Difficulty
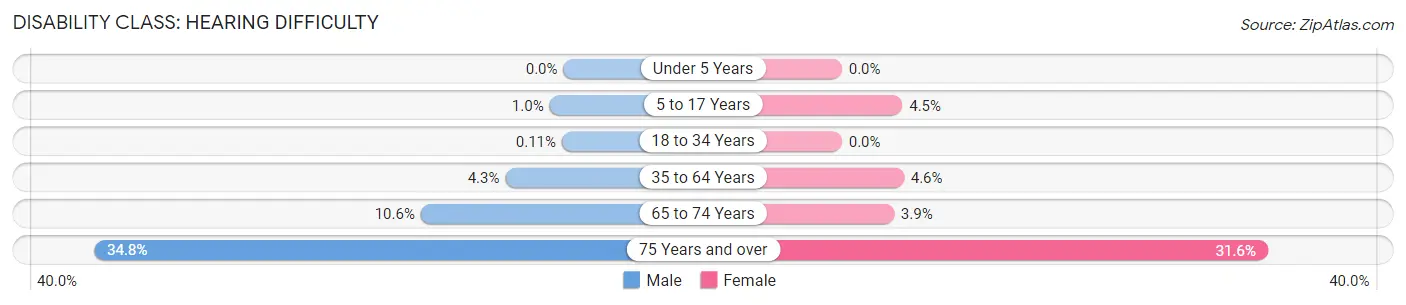
| Age Bracket | Male | Female |
| Under 5 Years | 0 (0.0%) | 0 (0.0%) |
| 5 to 17 Years | 17 (1.0%) | 51 (4.5%) |
| 18 to 34 Years | 2 (0.1%) | 0 (0.0%) |
| 35 to 64 Years | 125 (4.3%) | 132 (4.6%) |
| 65 to 74 Years | 61 (10.6%) | 29 (3.9%) |
| 75 Years and over | 177 (34.8%) | 382 (31.6%) |
Disability Class: Vision Difficulty
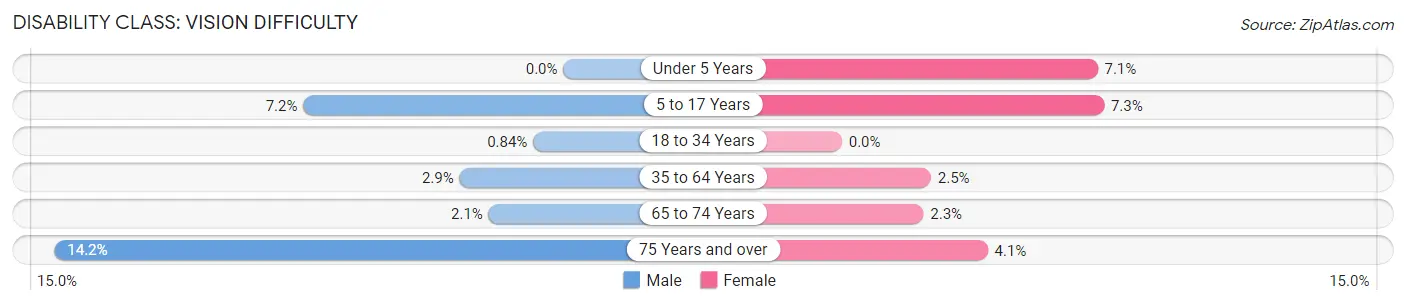
| Age Bracket | Male | Female |
| Under 5 Years | 0 (0.0%) | 28 (7.1%) |
| 5 to 17 Years | 120 (7.2%) | 83 (7.3%) |
| 18 to 34 Years | 16 (0.8%) | 0 (0.0%) |
| 35 to 64 Years | 84 (2.9%) | 71 (2.5%) |
| 65 to 74 Years | 12 (2.1%) | 17 (2.3%) |
| 75 Years and over | 72 (14.2%) | 49 (4.1%) |
Disability Class: Cognitive Difficulty
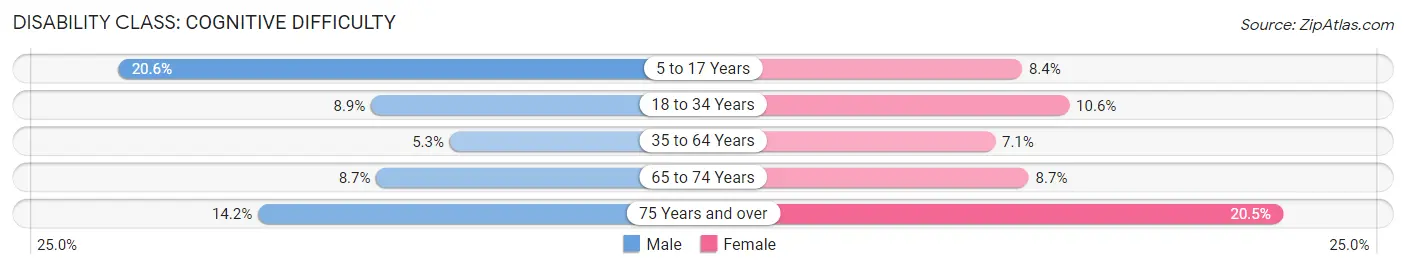
| Age Bracket | Male | Female |
| 5 to 17 Years | 342 (20.6%) | 95 (8.4%) |
| 18 to 34 Years | 169 (8.9%) | 200 (10.5%) |
| 35 to 64 Years | 153 (5.3%) | 204 (7.1%) |
| 65 to 74 Years | 50 (8.7%) | 65 (8.7%) |
| 75 Years and over | 72 (14.2%) | 247 (20.4%) |
Disability Class: Ambulatory Difficulty
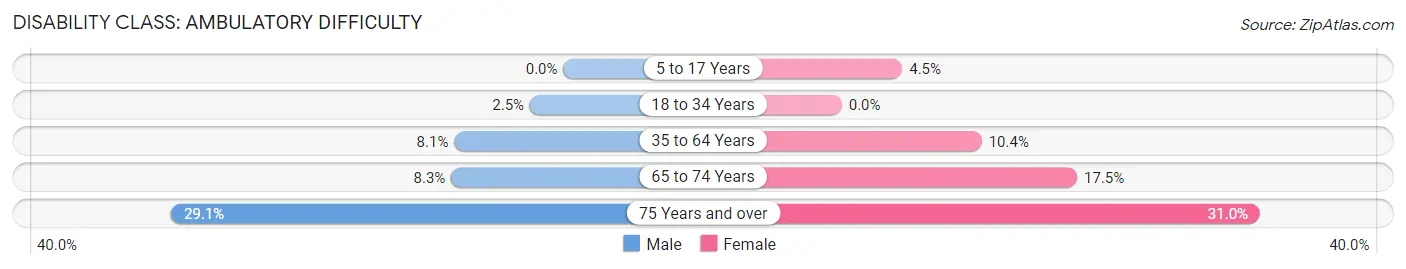
| Age Bracket | Male | Female |
| 5 to 17 Years | 0 (0.0%) | 51 (4.5%) |
| 18 to 34 Years | 47 (2.5%) | 0 (0.0%) |
| 35 to 64 Years | 235 (8.1%) | 298 (10.4%) |
| 65 to 74 Years | 48 (8.3%) | 131 (17.5%) |
| 75 Years and over | 148 (29.1%) | 375 (31.0%) |
Disability Class: Self-Care Difficulty
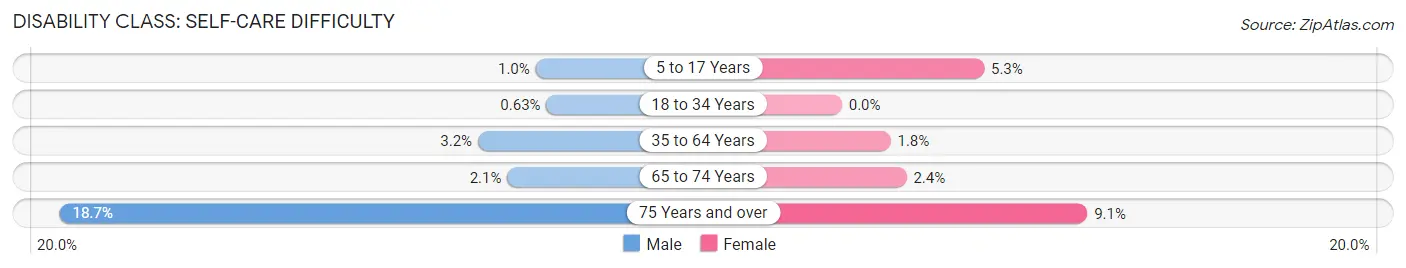
| Age Bracket | Male | Female |
| 5 to 17 Years | 17 (1.0%) | 60 (5.3%) |
| 18 to 34 Years | 12 (0.6%) | 0 (0.0%) |
| 35 to 64 Years | 92 (3.2%) | 52 (1.8%) |
| 65 to 74 Years | 12 (2.1%) | 18 (2.4%) |
| 75 Years and over | 95 (18.7%) | 110 (9.1%) |
Technology Access in Hanover borough
Computing Device Access in Hanover borough
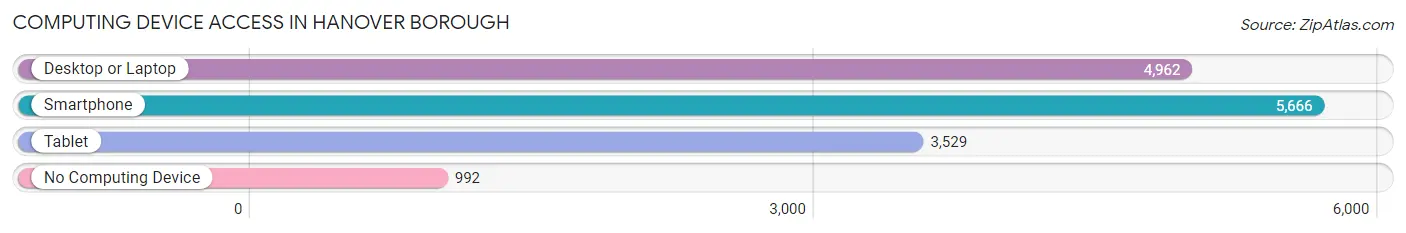
| Device Type | # Households | % Households |
| Desktop or Laptop | 4,962 | 69.2% |
| Smartphone | 5,666 | 79.0% |
| Tablet | 3,529 | 49.2% |
| No Computing Device | 992 | 13.8% |
| Total | 7,169 | 100.0% |
Internet Access in Hanover borough
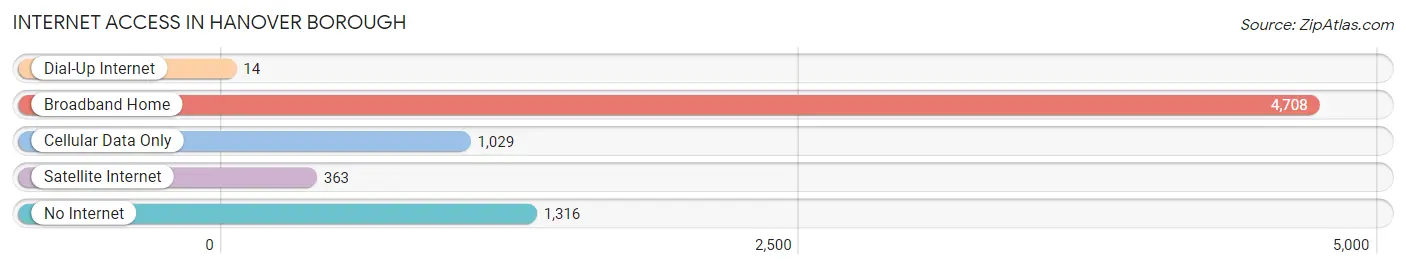
| Internet Type | # Households | % Households |
| Dial-Up Internet | 14 | 0.2% |
| Broadband Home | 4,708 | 65.7% |
| Cellular Data Only | 1,029 | 14.3% |
| Satellite Internet | 363 | 5.1% |
| No Internet | 1,316 | 18.4% |
| Total | 7,169 | 100.0% |
Hanover borough Summary
Hanover Borough is a borough located in York County, Pennsylvania, United States. The population was 15,289 at the 2010 census. The borough is located in the central part of the county and is part of the York-Hanover Metropolitan Statistical Area.
History
Hanover Borough was founded in 1763 by a group of German settlers who had arrived in the area in 1741. The town was named after the German city of Hanover. The settlers were attracted to the area by the fertile soil and the abundance of natural resources. The town quickly grew and by the mid-1800s it was a thriving industrial center. The town was home to several factories, including a paper mill, a tannery, and a foundry.
In the late 1800s, the town began to experience a decline in its industrial base. This was due to the rise of larger cities in the region, such as York and Lancaster, which had better transportation links and more modern factories. By the early 1900s, the town had become a quiet residential community.
Geography
Hanover Borough is located at 39°46'45" North, 76°54'45" West (39.7790, -76.9125). It is situated in the central part of York County, Pennsylvania, and is bordered by the townships of Heidelberg, Penn, and West Manheim. The borough is located approximately 25 miles south of Harrisburg, the state capital, and about 50 miles northwest of Baltimore, Maryland.
The borough has a total area of 2.2 square miles, all of which is land. The borough is located in the Piedmont region of Pennsylvania, which is characterized by rolling hills and valleys. The borough is drained by the Codorus Creek, which flows through the center of town.
Economy
The economy of Hanover Borough is largely based on services and retail. The borough is home to several small businesses, including restaurants, shops, and professional services. The borough also has a number of manufacturing companies, including a paper mill, a tannery, and a foundry.
The borough is also home to several large employers, including Hanover Hospital, which is the largest employer in the borough. Other major employers include Hanover Foods Corporation, a food processing company, and Hanover Shoe Company, a shoe manufacturer.
Demographics
As of the 2010 census, the population of Hanover Borough was 15,289. The racial makeup of the borough was 94.3% White, 1.7% African American, 0.3% Native American, 0.7% Asian, 0.1% Pacific Islander, 1.2% from other races, and 1.9% from two or more races. Hispanic or Latino of any race were 3.3% of the population.
The median household income in the borough was $45,945, and the median family income was $54,945. The per capita income for the borough was $22,845. About 8.3% of families and 10.2% of the population were below the poverty line, including 14.2% of those under age 18 and 6.2% of those age 65 or over.
Common Questions
What is Per Capita Income in Hanover borough?
Per Capita income in Hanover borough is $33,481.
What is the Median Family Income in Hanover borough?
Median Family Income in Hanover borough is $77,077.
What is the Median Household income in Hanover borough?
Median Household Income in Hanover borough is $60,050.
What is Income or Wage Gap in Hanover borough?
Income or Wage Gap in Hanover borough is 32.3%.
Women in Hanover borough earn 67.7 cents for every dollar earned by a man.
What is Family Income Deficit in Hanover borough?
Family Income Deficit in Hanover borough is $8,274.
Families that are below poverty line in Hanover borough earn $8,274 less on average than the poverty threshold level.
What is Inequality or Gini Index in Hanover borough?
Inequality or Gini Index in Hanover borough is 0.43.
What is the Total Population of Hanover borough?
Total Population of Hanover borough is 16,411.
What is the Total Male Population of Hanover borough?
Total Male Population of Hanover borough is 8,055.
What is the Total Female Population of Hanover borough?
Total Female Population of Hanover borough is 8,356.
What is the Ratio of Males per 100 Females in Hanover borough?
There are 96.40 Males per 100 Females in Hanover borough.
What is the Ratio of Females per 100 Males in Hanover borough?
There are 103.74 Females per 100 Males in Hanover borough.
What is the Median Population Age in Hanover borough?
Median Population Age in Hanover borough is 40.4 Years.
What is the Average Family Size in Hanover borough
Average Family Size in Hanover borough is 2.9 People.
What is the Average Household Size in Hanover borough
Average Household Size in Hanover borough is 2.3 People.
How Large is the Labor Force in Hanover borough?
There are 8,609 People in the Labor Forcein in Hanover borough.
What is the Percentage of People in the Labor Force in Hanover borough?
64.8% of People are in the Labor Force in Hanover borough.
What is the Unemployment Rate in Hanover borough?
Unemployment Rate in Hanover borough is 6.9%.