Cities with the Largest Hispanic or Latino Community in Tennessee
RELATED REPORTS & OPTIONS
Hispanic or Latino
Tennessee
Compare Cities
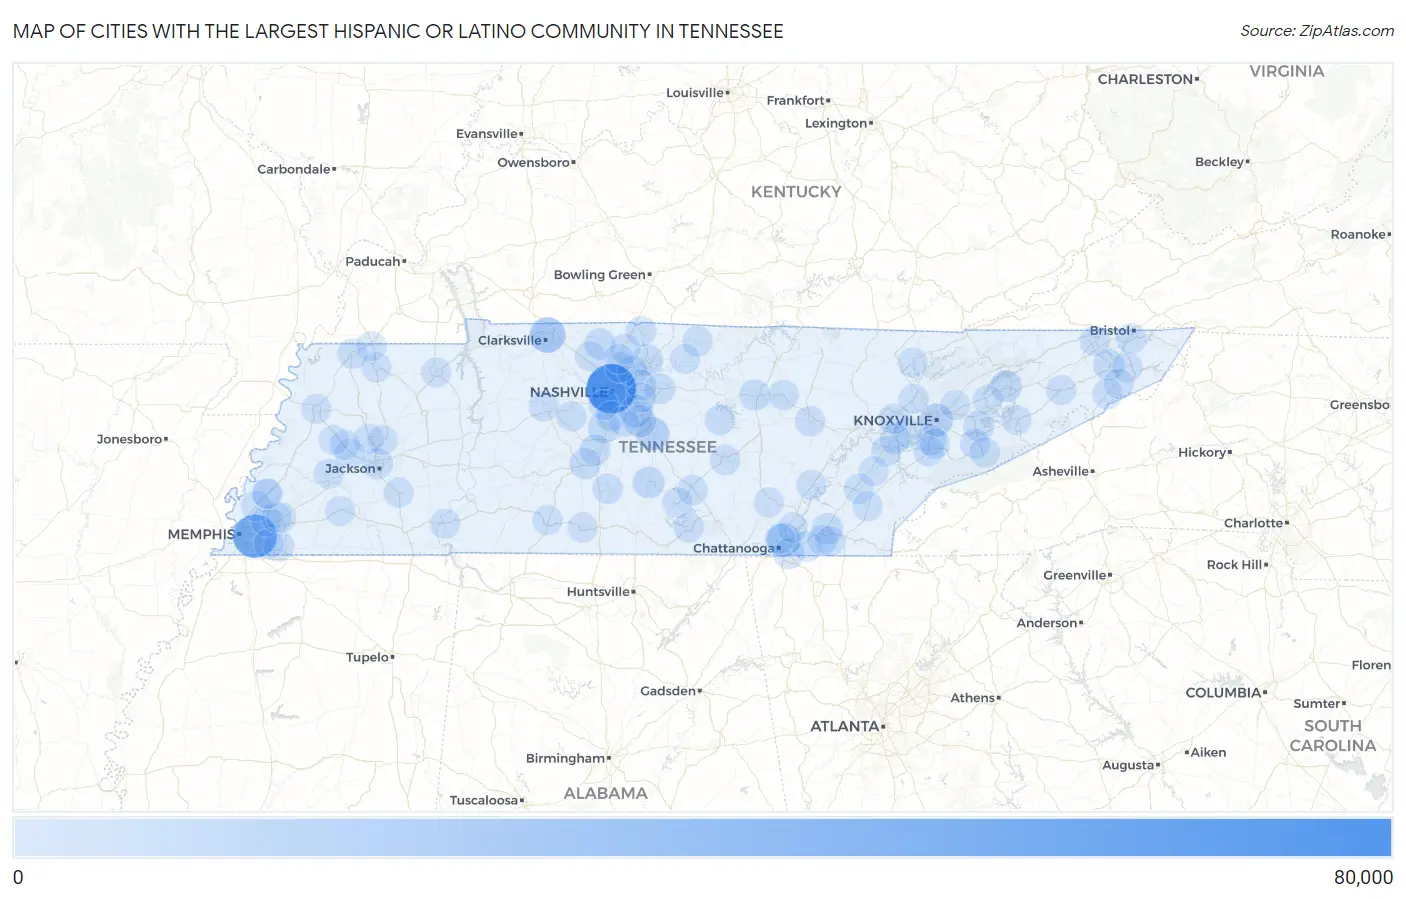
Map of Cities with the Largest Hispanic or Latino Community in Tennessee
0
80,000
Cities with the Largest Hispanic or Latino Community in Tennessee
| City | Hispanic or Latino | vs State | vs National | |
| 1. | Nashville | 73,600 | 412,622(17.84%)#1 | 61,755,866(0.12%)#94 |
| 2. | Memphis | 50,539 | 412,622(12.25%)#2 | 61,755,866(0.08%)#159 |
| 3. | Clarksville | 19,946 | 412,622(4.83%)#3 | 61,755,866(0.03%)#470 |
| 4. | Chattanooga | 13,718 | 412,622(3.32%)#4 | 61,755,866(0.02%)#689 |
| 5. | Murfreesboro | 11,379 | 412,622(2.76%)#5 | 61,755,866(0.02%)#806 |
| 6. | Knoxville | 10,938 | 412,622(2.65%)#6 | 61,755,866(0.02%)#836 |
| 7. | La Vergne | 7,645 | 412,622(1.85%)#7 | 61,755,866(0.01%)#1,152 |
| 8. | Smyrna | 7,284 | 412,622(1.77%)#8 | 61,755,866(0.01%)#1,181 |
| 9. | Morristown | 6,120 | 412,622(1.48%)#9 | 61,755,866(0.01%)#1,345 |
| 10. | Shelbyville | 5,776 | 412,622(1.40%)#10 | 61,755,866(0.01%)#1,413 |
| 11. | Franklin | 4,843 | 412,622(1.17%)#11 | 61,755,866(0.01%)#1,600 |
| 12. | Cleveland | 4,522 | 412,622(1.10%)#12 | 61,755,866(0.01%)#1,687 |
| 13. | Gallatin | 4,211 | 412,622(1.02%)#13 | 61,755,866(0.01%)#1,789 |
| 14. | Columbia | 4,111 | 412,622(1.00%)#14 | 61,755,866(0.01%)#1,828 |
| 15. | Spring Hill | 3,878 | 412,622(0.94%)#15 | 61,755,866(0.01%)#1,915 |
| 16. | Johnson City | 3,769 | 412,622(0.91%)#16 | 61,755,866(0.01%)#1,960 |
| 17. | Springfield | 3,727 | 412,622(0.90%)#17 | 61,755,866(0.01%)#1,970 |
| 18. | Cookeville | 3,529 | 412,622(0.86%)#18 | 61,755,866(0.01%)#2,052 |
| 19. | Sevierville | 3,242 | 412,622(0.79%)#19 | 61,755,866(0.01%)#2,181 |
| 20. | Hendersonville | 3,199 | 412,622(0.78%)#20 | 61,755,866(0.01%)#2,208 |
| 21. | Jackson | 2,973 | 412,622(0.72%)#21 | 61,755,866(0.00%)#2,304 |
| 22. | East Ridge | 2,939 | 412,622(0.71%)#22 | 61,755,866(0.00%)#2,332 |
| 23. | Lebanon | 2,786 | 412,622(0.68%)#23 | 61,755,866(0.00%)#2,420 |
| 24. | Mount Juliet | 2,667 | 412,622(0.65%)#24 | 61,755,866(0.00%)#2,500 |
| 25. | Lenoir City | 2,086 | 412,622(0.51%)#25 | 61,755,866(0.00%)#2,946 |
| 26. | Collierville | 2,050 | 412,622(0.50%)#26 | 61,755,866(0.00%)#2,976 |
| 27. | Bartlett | 1,913 | 412,622(0.46%)#27 | 61,755,866(0.00%)#3,138 |
| 28. | Oak Ridge | 1,762 | 412,622(0.43%)#28 | 61,755,866(0.00%)#3,289 |
| 29. | Mcminnville | 1,743 | 412,622(0.42%)#29 | 61,755,866(0.00%)#3,308 |
| 30. | Brentwood | 1,633 | 412,622(0.40%)#30 | 61,755,866(0.00%)#3,439 |
| 31. | Lewisburg | 1,553 | 412,622(0.38%)#31 | 61,755,866(0.00%)#3,548 |
| 32. | Goodlettsville | 1,466 | 412,622(0.36%)#32 | 61,755,866(0.00%)#3,677 |
| 33. | Kingsport | 1,413 | 412,622(0.34%)#33 | 61,755,866(0.00%)#3,769 |
| 34. | Dickson | 1,256 | 412,622(0.30%)#34 | 61,755,866(0.00%)#4,036 |
| 35. | Collegedale | 1,250 | 412,622(0.30%)#35 | 61,755,866(0.00%)#4,049 |
| 36. | Pigeon Forge | 1,181 | 412,622(0.29%)#36 | 61,755,866(0.00%)#4,197 |
| 37. | Fairview | 1,178 | 412,622(0.29%)#37 | 61,755,866(0.00%)#4,206 |
| 38. | Millington | 1,171 | 412,622(0.28%)#38 | 61,755,866(0.00%)#4,227 |
| 39. | Manchester | 1,116 | 412,622(0.27%)#39 | 61,755,866(0.00%)#4,318 |
| 40. | Crossville | 1,091 | 412,622(0.26%)#40 | 61,755,866(0.00%)#4,381 |
| 41. | Loudon | 1,035 | 412,622(0.25%)#41 | 61,755,866(0.00%)#4,529 |
| 42. | Alcoa | 1,030 | 412,622(0.25%)#42 | 61,755,866(0.00%)#4,538 |
| 43. | Maryville | 1,025 | 412,622(0.25%)#43 | 61,755,866(0.00%)#4,548 |
| 44. | Bristol | 964 | 412,622(0.23%)#44 | 61,755,866(0.00%)#4,725 |
| 45. | Tullahoma | 957 | 412,622(0.23%)#45 | 61,755,866(0.00%)#4,748 |
| 46. | Athens | 946 | 412,622(0.23%)#46 | 61,755,866(0.00%)#4,773 |
| 47. | Winchester | 942 | 412,622(0.23%)#47 | 61,755,866(0.00%)#4,784 |
| 48. | Union City | 927 | 412,622(0.22%)#48 | 61,755,866(0.00%)#4,841 |
| 49. | Smithville | 919 | 412,622(0.22%)#49 | 61,755,866(0.00%)#4,864 |
| 50. | Portland | 916 | 412,622(0.22%)#50 | 61,755,866(0.00%)#4,871 |
| 51. | Lafayette | 877 | 412,622(0.21%)#51 | 61,755,866(0.00%)#4,988 |
| 52. | Germantown | 867 | 412,622(0.21%)#52 | 61,755,866(0.00%)#5,016 |
| 53. | Middle Valley | 848 | 412,622(0.21%)#53 | 61,755,866(0.00%)#5,076 |
| 54. | Humboldt | 823 | 412,622(0.20%)#54 | 61,755,866(0.00%)#5,165 |
| 55. | Nolensville | 813 | 412,622(0.20%)#55 | 61,755,866(0.00%)#5,189 |
| 56. | South Cleveland | 779 | 412,622(0.19%)#56 | 61,755,866(0.00%)#5,305 |
| 57. | Greeneville | 777 | 412,622(0.19%)#57 | 61,755,866(0.00%)#5,316 |
| 58. | Jefferson City | 761 | 412,622(0.18%)#58 | 61,755,866(0.00%)#5,382 |
| 59. | Powell | 721 | 412,622(0.17%)#59 | 61,755,866(0.00%)#5,531 |
| 60. | Lakeland | 717 | 412,622(0.17%)#60 | 61,755,866(0.00%)#5,551 |
| 61. | Bells | 672 | 412,622(0.16%)#61 | 61,755,866(0.00%)#5,748 |
| 62. | White House | 585 | 412,622(0.14%)#62 | 61,755,866(0.00%)#6,153 |
| 63. | Lawrenceburg | 564 | 412,622(0.14%)#63 | 61,755,866(0.00%)#6,265 |
| 64. | Farragut | 553 | 412,622(0.13%)#64 | 61,755,866(0.00%)#6,322 |
| 65. | Savannah | 546 | 412,622(0.13%)#65 | 61,755,866(0.00%)#6,363 |
| 66. | Dunlap | 541 | 412,622(0.13%)#66 | 61,755,866(0.00%)#6,387 |
| 67. | Monterey | 525 | 412,622(0.13%)#67 | 61,755,866(0.00%)#6,483 |
| 68. | Pulaski | 515 | 412,622(0.12%)#68 | 61,755,866(0.00%)#6,547 |
| 69. | Millersville | 500 | 412,622(0.12%)#69 | 61,755,866(0.00%)#6,627 |
| 70. | Red Bank | 498 | 412,622(0.12%)#70 | 61,755,866(0.00%)#6,638 |
| 71. | Elizabethton | 496 | 412,622(0.12%)#71 | 61,755,866(0.00%)#6,649 |
| 72. | Erwin | 480 | 412,622(0.12%)#72 | 61,755,866(0.00%)#6,739 |
| 73. | Gatlinburg | 469 | 412,622(0.11%)#73 | 61,755,866(0.00%)#6,813 |
| 74. | Dayton | 468 | 412,622(0.11%)#74 | 61,755,866(0.00%)#6,822 |
| 75. | Alamo | 432 | 412,622(0.10%)#75 | 61,755,866(0.00%)#7,083 |
| 76. | Brownsville | 427 | 412,622(0.10%)#76 | 61,755,866(0.00%)#7,117 |
| 77. | Arlington | 415 | 412,622(0.10%)#77 | 61,755,866(0.00%)#7,210 |
| 78. | Unicoi | 398 | 412,622(0.10%)#78 | 61,755,866(0.00%)#7,334 |
| 79. | Henderson | 386 | 412,622(0.09%)#79 | 61,755,866(0.00%)#7,426 |
| 80. | Eagleton Village | 378 | 412,622(0.09%)#80 | 61,755,866(0.00%)#7,487 |
| 81. | Martin | 375 | 412,622(0.09%)#81 | 61,755,866(0.00%)#7,516 |
| 82. | Coopertown | 352 | 412,622(0.09%)#82 | 61,755,866(0.00%)#7,717 |
| 83. | Newport | 347 | 412,622(0.08%)#83 | 61,755,866(0.00%)#7,759 |
| 84. | La Follette | 343 | 412,622(0.08%)#84 | 61,755,866(0.00%)#7,805 |
| 85. | Hartsville Trousdale County | 340 | 412,622(0.08%)#85 | 61,755,866(0.00%)#7,840 |
| 86. | Dyersburg | 326 | 412,622(0.08%)#86 | 61,755,866(0.00%)#7,974 |
| 87. | Sweetwater | 314 | 412,622(0.08%)#87 | 61,755,866(0.00%)#8,100 |
| 88. | Forest Hills | 312 | 412,622(0.08%)#88 | 61,755,866(0.00%)#8,126 |
| 89. | Whiteville | 303 | 412,622(0.07%)#89 | 61,755,866(0.00%)#8,222 |
| 90. | Munford | 301 | 412,622(0.07%)#90 | 61,755,866(0.00%)#8,248 |
| 91. | Wildwood Lake | 300 | 412,622(0.07%)#91 | 61,755,866(0.00%)#8,265 |
| 92. | Medina | 288 | 412,622(0.07%)#92 | 61,755,866(0.00%)#8,389 |
| 93. | Paris | 279 | 412,622(0.07%)#93 | 61,755,866(0.00%)#8,513 |
| 94. | Etowah | 279 | 412,622(0.07%)#94 | 61,755,866(0.00%)#8,520 |
| 95. | Maury City | 276 | 412,622(0.07%)#95 | 61,755,866(0.00%)#8,571 |
| 96. | Rural Hill | 263 | 412,622(0.06%)#96 | 61,755,866(0.00%)#8,731 |
| 97. | Atoka | 257 | 412,622(0.06%)#97 | 61,755,866(0.00%)#8,796 |
| 98. | Clinton | 253 | 412,622(0.06%)#98 | 61,755,866(0.00%)#8,866 |
| 99. | Mascot | 253 | 412,622(0.06%)#99 | 61,755,866(0.00%)#8,876 |
| 100. | South Fulton | 251 | 412,622(0.06%)#100 | 61,755,866(0.00%)#8,910 |
Common Questions
What are the Top 10 Cities with the Largest Hispanic or Latino Community in Tennessee?
Top 10 Cities with the Largest Hispanic or Latino Community in Tennessee are:
#1
73,600
#2
50,539
#3
19,946
#4
13,718
#5
11,379
#6
10,938
#7
7,645
#8
7,284
#9
6,120
#10
5,776
What city has the Largest Hispanic or Latino Community in Tennessee?
Nashville has the Largest Hispanic or Latino Community in Tennessee with 73,600.
What is the Total Hispanic or Latino Population in the State of Tennessee?
Total Hispanic or Latino Population in Tennessee is 412,622.
What is the Total Hispanic or Latino Population in the United States?
Total Hispanic or Latino Population in the United States is 61,755,866.