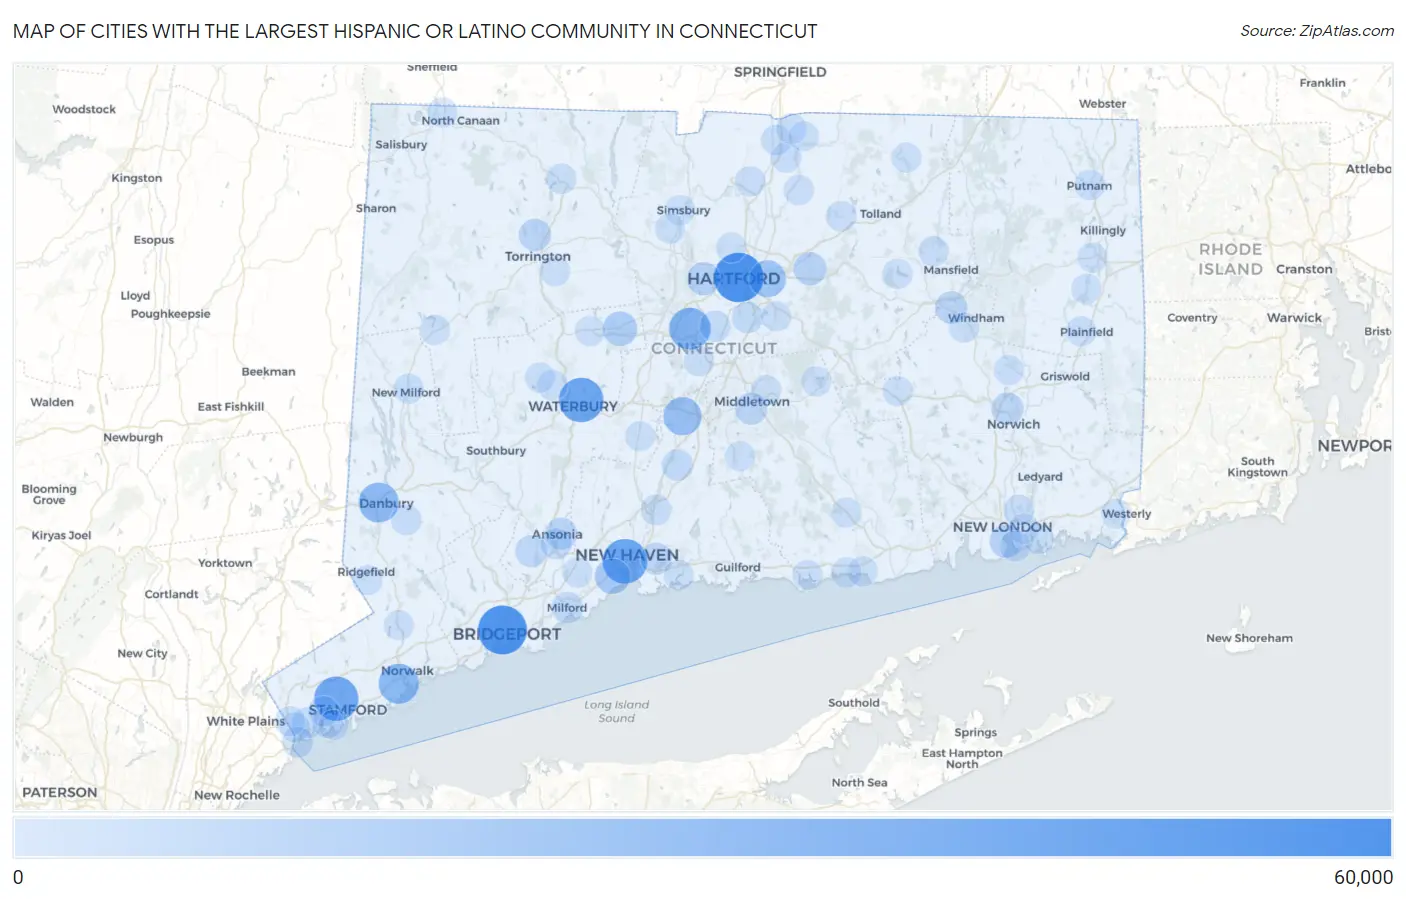
Cities with the Largest Hispanic or Latino Community in Connecticut
RELATED REPORTS & OPTIONS
Hispanic or Latino
Connecticut
Compare Cities
Map of Cities with the Largest Hispanic or Latino Community in Connecticut
0
60,000
Cities with the Largest Hispanic or Latino Community in Connecticut
| City | Hispanic or Latino | vs State | vs National | |
| 1. | Hartford | 55,823 | 627,408(8.90%)#1 | 61,755,866(0.09%)#136 |
| 2. | Bridgeport | 53,790 | 627,408(8.57%)#2 | 61,755,866(0.09%)#147 |
| 3. | New Haven | 41,631 | 627,408(6.64%)#3 | 61,755,866(0.07%)#212 |
| 4. | Waterbury | 41,055 | 627,408(6.54%)#4 | 61,755,866(0.07%)#217 |
| 5. | Stamford | 40,385 | 627,408(6.44%)#5 | 61,755,866(0.07%)#221 |
| 6. | New Britain | 32,910 | 627,408(5.25%)#6 | 61,755,866(0.05%)#286 |
| 7. | Norwalk | 28,000 | 627,408(4.46%)#7 | 61,755,866(0.05%)#329 |
| 8. | Danbury | 27,435 | 627,408(4.37%)#8 | 61,755,866(0.04%)#337 |
| 9. | Meriden | 22,447 | 627,408(3.58%)#9 | 61,755,866(0.04%)#419 |
| 10. | East Hartford | 19,014 | 627,408(3.03%)#10 | 61,755,866(0.03%)#493 |
| 11. | West Haven | 14,801 | 627,408(2.36%)#11 | 61,755,866(0.02%)#625 |
| 12. | Bristol | 12,373 | 627,408(1.97%)#12 | 61,755,866(0.02%)#741 |
| 13. | West Hartford | 8,597 | 627,408(1.37%)#13 | 61,755,866(0.01%)#1,046 |
| 14. | Manchester | 8,345 | 627,408(1.33%)#14 | 61,755,866(0.01%)#1,076 |
| 15. | New London | 8,104 | 627,408(1.29%)#15 | 61,755,866(0.01%)#1,098 |
| 16. | Willimantic | 6,367 | 627,408(1.01%)#16 | 61,755,866(0.01%)#1,310 |
| 17. | Torrington | 6,219 | 627,408(0.99%)#17 | 61,755,866(0.01%)#1,330 |
| 18. | Norwich | 6,021 | 627,408(0.96%)#18 | 61,755,866(0.01%)#1,358 |
| 19. | Ansonia | 5,870 | 627,408(0.94%)#19 | 61,755,866(0.01%)#1,390 |
| 20. | Middletown | 5,289 | 627,408(0.84%)#20 | 61,755,866(0.01%)#1,497 |
| 21. | Naugatuck Borough | 5,050 | 627,408(0.80%)#21 | 61,755,866(0.01%)#1,550 |
| 22. | Shelton | 4,991 | 627,408(0.80%)#22 | 61,755,866(0.01%)#1,566 |
| 23. | East Haven | 4,856 | 627,408(0.77%)#23 | 61,755,866(0.01%)#1,599 |
| 24. | Wallingford Center | 3,997 | 627,408(0.64%)#24 | 61,755,866(0.01%)#1,869 |
| 25. | Milford City Balance | 3,899 | 627,408(0.62%)#25 | 61,755,866(0.01%)#1,909 |
| 26. | Wethersfield | 3,420 | 627,408(0.55%)#26 | 61,755,866(0.01%)#2,096 |
| 27. | Newington | 3,257 | 627,408(0.52%)#27 | 61,755,866(0.01%)#2,174 |
| 28. | Derby | 2,852 | 627,408(0.45%)#28 | 61,755,866(0.00%)#2,377 |
| 29. | Greenwich | 2,660 | 627,408(0.42%)#29 | 61,755,866(0.00%)#2,504 |
| 30. | Byram | 2,139 | 627,408(0.34%)#30 | 61,755,866(0.00%)#2,890 |
| 31. | North Haven | 1,713 | 627,408(0.27%)#31 | 61,755,866(0.00%)#3,353 |
| 32. | Bethel | 1,552 | 627,408(0.25%)#32 | 61,755,866(0.00%)#3,552 |
| 33. | Conning Towers Nautilus Park | 1,477 | 627,408(0.24%)#33 | 61,755,866(0.00%)#3,668 |
| 34. | Putnam | 1,437 | 627,408(0.23%)#34 | 61,755,866(0.00%)#3,725 |
| 35. | Thompsonville | 1,424 | 627,408(0.23%)#35 | 61,755,866(0.00%)#3,748 |
| 36. | Riverside | 1,423 | 627,408(0.23%)#36 | 61,755,866(0.00%)#3,750 |
| 37. | Oakville | 1,380 | 627,408(0.22%)#37 | 61,755,866(0.00%)#3,818 |
| 38. | Rockville | 1,379 | 627,408(0.22%)#38 | 61,755,866(0.00%)#3,822 |
| 39. | Groton | 1,241 | 627,408(0.20%)#39 | 61,755,866(0.00%)#4,070 |
| 40. | Danielson Borough | 1,196 | 627,408(0.19%)#40 | 61,755,866(0.00%)#4,163 |
| 41. | Storrs | 1,100 | 627,408(0.18%)#41 | 61,755,866(0.00%)#4,358 |
| 42. | Cos Cob | 1,038 | 627,408(0.17%)#42 | 61,755,866(0.00%)#4,519 |
| 43. | Southwood Acres | 1,036 | 627,408(0.17%)#43 | 61,755,866(0.00%)#4,528 |
| 44. | Windsor Locks | 862 | 627,408(0.14%)#44 | 61,755,866(0.00%)#5,031 |
| 45. | Sherwood Manor | 841 | 627,408(0.13%)#45 | 61,755,866(0.00%)#5,098 |
| 46. | Winsted | 831 | 627,408(0.13%)#46 | 61,755,866(0.00%)#5,127 |
| 47. | Kensington | 791 | 627,408(0.13%)#47 | 61,755,866(0.00%)#5,264 |
| 48. | Greens Farms | 707 | 627,408(0.11%)#48 | 61,755,866(0.00%)#5,596 |
| 49. | Staples | 703 | 627,408(0.11%)#49 | 61,755,866(0.00%)#5,614 |
| 50. | New Milford | 682 | 627,408(0.11%)#50 | 61,755,866(0.00%)#5,704 |
| 51. | Sandy Hook | 657 | 627,408(0.10%)#51 | 61,755,866(0.00%)#5,811 |
| 52. | Trumbull Center | 585 | 627,408(0.09%)#52 | 61,755,866(0.00%)#6,156 |
| 53. | Plainfield Village | 571 | 627,408(0.09%)#53 | 61,755,866(0.00%)#6,230 |
| 54. | Hazardville | 530 | 627,408(0.08%)#54 | 61,755,866(0.00%)#6,451 |
| 55. | Glastonbury Center | 527 | 627,408(0.08%)#55 | 61,755,866(0.00%)#6,469 |
| 56. | Quinnipiac University | 486 | 627,408(0.08%)#56 | 61,755,866(0.00%)#6,700 |
| 57. | Broad Brook | 483 | 627,408(0.08%)#57 | 61,755,866(0.00%)#6,717 |
| 58. | Terryville | 479 | 627,408(0.08%)#58 | 61,755,866(0.00%)#6,745 |
| 59. | Old Greenwich | 457 | 627,408(0.07%)#59 | 61,755,866(0.00%)#6,907 |
| 60. | Cheshire Village | 452 | 627,408(0.07%)#60 | 61,755,866(0.00%)#6,935 |
| 61. | Noroton | 438 | 627,408(0.07%)#61 | 61,755,866(0.00%)#7,033 |
| 62. | Simsbury Center | 425 | 627,408(0.07%)#62 | 61,755,866(0.00%)#7,133 |
| 63. | Branford Center | 405 | 627,408(0.06%)#63 | 61,755,866(0.00%)#7,290 |
| 64. | Poquonock Bridge | 396 | 627,408(0.06%)#64 | 61,755,866(0.00%)#7,354 |
| 65. | Ridgefield | 394 | 627,408(0.06%)#65 | 61,755,866(0.00%)#7,363 |
| 66. | Portland | 391 | 627,408(0.06%)#66 | 61,755,866(0.00%)#7,384 |
| 67. | Wauregan | 391 | 627,408(0.06%)#67 | 61,755,866(0.00%)#7,391 |
| 68. | Orange | 389 | 627,408(0.06%)#68 | 61,755,866(0.00%)#7,401 |
| 69. | Stafford Springs | 376 | 627,408(0.06%)#69 | 61,755,866(0.00%)#7,510 |
| 70. | Pemberwick | 323 | 627,408(0.05%)#70 | 61,755,866(0.00%)#8,013 |
| 71. | Ball Pond | 321 | 627,408(0.05%)#71 | 61,755,866(0.00%)#8,036 |
| 72. | Long Hill | 313 | 627,408(0.05%)#72 | 61,755,866(0.00%)#8,120 |
| 73. | Westbrook Center | 312 | 627,408(0.05%)#73 | 61,755,866(0.00%)#8,130 |
| 74. | Canaan | 288 | 627,408(0.05%)#74 | 61,755,866(0.00%)#8,394 |
| 75. | Watertown | 285 | 627,408(0.05%)#75 | 61,755,866(0.00%)#8,427 |
| 76. | Saugatuck | 284 | 627,408(0.05%)#76 | 61,755,866(0.00%)#8,442 |
| 77. | Saybrook Manor | 272 | 627,408(0.04%)#77 | 61,755,866(0.00%)#8,619 |
| 78. | Route 7 Gateway | 265 | 627,408(0.04%)#78 | 61,755,866(0.00%)#8,709 |
| 79. | Tokeneke | 252 | 627,408(0.04%)#79 | 61,755,866(0.00%)#8,895 |
| 80. | Wilton Center | 247 | 627,408(0.04%)#80 | 61,755,866(0.00%)#8,974 |
| 81. | Noroton Heights | 244 | 627,408(0.04%)#81 | 61,755,866(0.00%)#9,001 |
| 82. | Clinton | 237 | 627,408(0.04%)#82 | 61,755,866(0.00%)#9,103 |
| 83. | Inglenook | 235 | 627,408(0.04%)#83 | 61,755,866(0.00%)#9,139 |
| 84. | Blue Hills | 228 | 627,408(0.04%)#84 | 61,755,866(0.00%)#9,229 |
| 85. | Pawcatuck | 218 | 627,408(0.03%)#85 | 61,755,866(0.00%)#9,380 |
| 86. | Deep River Center | 215 | 627,408(0.03%)#86 | 61,755,866(0.00%)#9,427 |
| 87. | Northwest Harwinton | 214 | 627,408(0.03%)#87 | 61,755,866(0.00%)#9,443 |
| 88. | Colchester | 213 | 627,408(0.03%)#88 | 61,755,866(0.00%)#9,468 |
| 89. | Durham | 210 | 627,408(0.03%)#89 | 61,755,866(0.00%)#9,526 |
| 90. | Fairfield University | 207 | 627,408(0.03%)#90 | 61,755,866(0.00%)#9,580 |
| 91. | Weatogue | 206 | 627,408(0.03%)#91 | 61,755,866(0.00%)#9,606 |
| 92. | Northford | 200 | 627,408(0.03%)#92 | 61,755,866(0.00%)#9,701 |
| 93. | Coventry Lake | 195 | 627,408(0.03%)#93 | 61,755,866(0.00%)#9,806 |
| 94. | East Brooklyn | 187 | 627,408(0.03%)#94 | 61,755,866(0.00%)#9,959 |
| 95. | South Windham | 185 | 627,408(0.03%)#95 | 61,755,866(0.00%)#10,004 |
| 96. | Glenville | 184 | 627,408(0.03%)#96 | 61,755,866(0.00%)#10,014 |
| 97. | Lake Pocotopaug | 183 | 627,408(0.03%)#97 | 61,755,866(0.00%)#10,036 |
| 98. | Newtown Borough | 181 | 627,408(0.03%)#98 | 61,755,866(0.00%)#10,085 |
| 99. | New Preston | 176 | 627,408(0.03%)#99 | 61,755,866(0.00%)#10,179 |
| 100. | Baltic | 163 | 627,408(0.03%)#100 | 61,755,866(0.00%)#10,446 |
1
2Common Questions
What are the Top 10 Cities with the Largest Hispanic or Latino Community in Connecticut?
Top 10 Cities with the Largest Hispanic or Latino Community in Connecticut are:
#1
55,823
#2
53,790
#3
41,631
#4
41,055
#5
40,385
#6
32,910
#7
28,000
#8
27,435
#9
22,447
#10
19,014
What city has the Largest Hispanic or Latino Community in Connecticut?
Hartford has the Largest Hispanic or Latino Community in Connecticut with 55,823.
What is the Total Hispanic or Latino Population in the State of Connecticut?
Total Hispanic or Latino Population in Connecticut is 627,408.
What is the Total Hispanic or Latino Population in the United States?
Total Hispanic or Latino Population in the United States is 61,755,866.