Cities with the Largest Hispanic or Latino Community in Indiana
RELATED REPORTS & OPTIONS
Hispanic or Latino
Indiana
Compare Cities
Map of Cities with the Largest Hispanic or Latino Community in Indiana
0
100,000
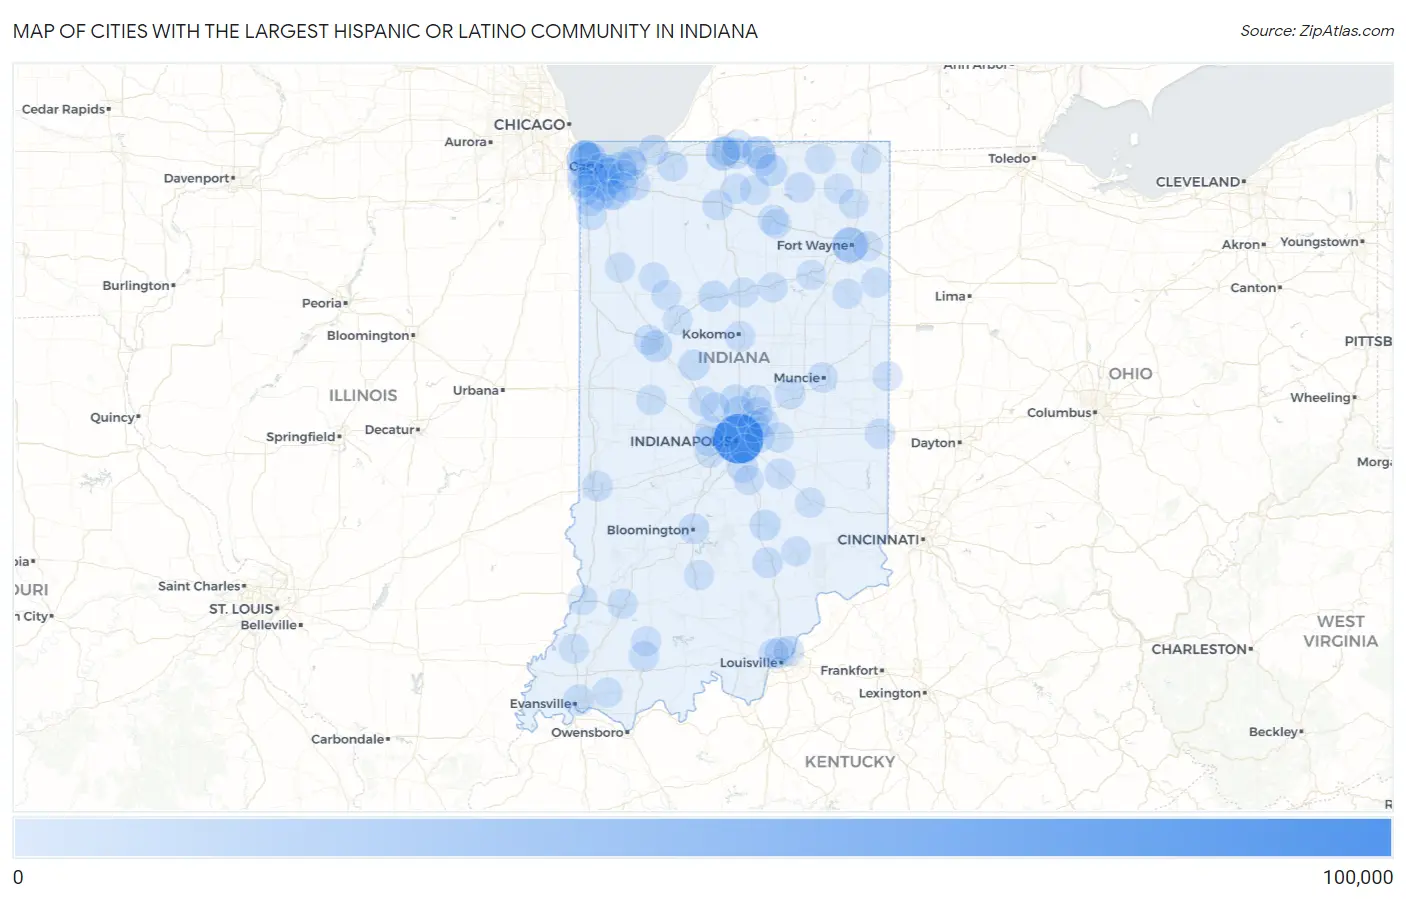
Cities with the Largest Hispanic or Latino Community in Indiana
| City | Hispanic or Latino | vs State | vs National | |
| 1. | Indianapolis | 96,262 | 510,984(18.84%)#1 | 61,755,866(0.16%)#67 |
| 2. | Hammond | 31,255 | 510,984(6.12%)#2 | 61,755,866(0.05%)#300 |
| 3. | Fort Wayne | 25,595 | 510,984(5.01%)#3 | 61,755,866(0.04%)#371 |
| 4. | South Bend | 16,873 | 510,984(3.30%)#4 | 61,755,866(0.03%)#561 |
| 5. | East Chicago | 14,438 | 510,984(2.83%)#5 | 61,755,866(0.02%)#640 |
| 6. | Elkhart | 14,096 | 510,984(2.76%)#6 | 61,755,866(0.02%)#663 |
| 7. | Lawrence | 9,100 | 510,984(1.78%)#7 | 61,755,866(0.01%)#995 |
| 8. | Goshen | 9,037 | 510,984(1.77%)#8 | 61,755,866(0.01%)#1,001 |
| 9. | Lafayette | 8,847 | 510,984(1.73%)#9 | 61,755,866(0.01%)#1,022 |
| 10. | Portage | 7,261 | 510,984(1.42%)#10 | 61,755,866(0.01%)#1,185 |
| 11. | Gary | 6,502 | 510,984(1.27%)#11 | 61,755,866(0.01%)#1,283 |
| 12. | Merrillville | 6,277 | 510,984(1.23%)#12 | 61,755,866(0.01%)#1,325 |
| 13. | Logansport | 5,434 | 510,984(1.06%)#13 | 61,755,866(0.01%)#1,472 |
| 14. | Hobart | 4,944 | 510,984(0.97%)#14 | 61,755,866(0.01%)#1,577 |
| 15. | Frankfort | 4,572 | 510,984(0.89%)#15 | 61,755,866(0.01%)#1,668 |
| 16. | Westfield | 4,564 | 510,984(0.89%)#16 | 61,755,866(0.01%)#1,671 |
| 17. | Columbus | 4,554 | 510,984(0.89%)#17 | 61,755,866(0.01%)#1,676 |
| 18. | Schererville | 4,512 | 510,984(0.88%)#18 | 61,755,866(0.01%)#1,692 |
| 19. | Carmel | 4,371 | 510,984(0.86%)#19 | 61,755,866(0.01%)#1,740 |
| 20. | Greenwood | 4,340 | 510,984(0.85%)#20 | 61,755,866(0.01%)#1,747 |
| 21. | Lake Station | 4,109 | 510,984(0.80%)#21 | 61,755,866(0.01%)#1,831 |
| 22. | Crown Point | 4,078 | 510,984(0.80%)#22 | 61,755,866(0.01%)#1,843 |
| 23. | Evansville | 4,063 | 510,984(0.80%)#23 | 61,755,866(0.01%)#1,846 |
| 24. | Anderson | 3,970 | 510,984(0.78%)#24 | 61,755,866(0.01%)#1,881 |
| 25. | Bloomington | 3,540 | 510,984(0.69%)#25 | 61,755,866(0.01%)#2,047 |
| 26. | Seymour | 3,349 | 510,984(0.66%)#26 | 61,755,866(0.01%)#2,122 |
| 27. | Munster | 3,295 | 510,984(0.64%)#27 | 61,755,866(0.01%)#2,154 |
| 28. | Mishawaka | 3,149 | 510,984(0.62%)#28 | 61,755,866(0.01%)#2,228 |
| 29. | Clarksville | 3,147 | 510,984(0.62%)#29 | 61,755,866(0.01%)#2,229 |
| 30. | Valparaiso | 3,007 | 510,984(0.59%)#30 | 61,755,866(0.00%)#2,284 |
| 31. | La Porte | 2,925 | 510,984(0.57%)#31 | 61,755,866(0.00%)#2,339 |
| 32. | Griffith | 2,873 | 510,984(0.56%)#32 | 61,755,866(0.00%)#2,365 |
| 33. | Plymouth | 2,855 | 510,984(0.56%)#33 | 61,755,866(0.00%)#2,374 |
| 34. | Fishers | 2,815 | 510,984(0.55%)#34 | 61,755,866(0.00%)#2,404 |
| 35. | Michigan City | 2,677 | 510,984(0.52%)#35 | 61,755,866(0.00%)#2,492 |
| 36. | St John | 2,579 | 510,984(0.50%)#36 | 61,755,866(0.00%)#2,551 |
| 37. | Kokomo | 2,543 | 510,984(0.50%)#37 | 61,755,866(0.00%)#2,579 |
| 38. | Ligonier | 2,527 | 510,984(0.49%)#38 | 61,755,866(0.00%)#2,590 |
| 39. | Jeffersonville | 2,516 | 510,984(0.49%)#39 | 61,755,866(0.00%)#2,595 |
| 40. | Noblesville | 2,435 | 510,984(0.48%)#40 | 61,755,866(0.00%)#2,650 |
| 41. | Muncie | 2,344 | 510,984(0.46%)#41 | 61,755,866(0.00%)#2,704 |
| 42. | Plainfield | 2,313 | 510,984(0.45%)#42 | 61,755,866(0.00%)#2,724 |
| 43. | Whiting | 2,310 | 510,984(0.45%)#43 | 61,755,866(0.00%)#2,725 |
| 44. | Terre Haute | 2,255 | 510,984(0.44%)#44 | 61,755,866(0.00%)#2,779 |
| 45. | West Lafayette | 2,179 | 510,984(0.43%)#45 | 61,755,866(0.00%)#2,845 |
| 46. | Huntingburg | 2,074 | 510,984(0.41%)#46 | 61,755,866(0.00%)#2,962 |
| 47. | Warsaw | 1,990 | 510,984(0.39%)#47 | 61,755,866(0.00%)#3,043 |
| 48. | New Albany | 1,889 | 510,984(0.37%)#48 | 61,755,866(0.00%)#3,160 |
| 49. | Dyer | 1,858 | 510,984(0.36%)#49 | 61,755,866(0.00%)#3,195 |
| 50. | Richmond | 1,777 | 510,984(0.35%)#50 | 61,755,866(0.00%)#3,265 |
| 51. | Shelbyville | 1,724 | 510,984(0.34%)#51 | 61,755,866(0.00%)#3,337 |
| 52. | Avon | 1,503 | 510,984(0.29%)#52 | 61,755,866(0.00%)#3,626 |
| 53. | Washington | 1,464 | 510,984(0.29%)#53 | 61,755,866(0.00%)#3,681 |
| 54. | Granger | 1,386 | 510,984(0.27%)#54 | 61,755,866(0.00%)#3,810 |
| 55. | Chesterton | 1,363 | 510,984(0.27%)#55 | 61,755,866(0.00%)#3,855 |
| 56. | Crawfordsville | 1,348 | 510,984(0.26%)#56 | 61,755,866(0.00%)#3,883 |
| 57. | Lowell | 1,227 | 510,984(0.24%)#57 | 61,755,866(0.00%)#4,101 |
| 58. | Lebanon | 1,223 | 510,984(0.24%)#58 | 61,755,866(0.00%)#4,108 |
| 59. | Speedway | 1,185 | 510,984(0.23%)#59 | 61,755,866(0.00%)#4,184 |
| 60. | Nappanee | 1,146 | 510,984(0.22%)#60 | 61,755,866(0.00%)#4,261 |
| 61. | Dunlap | 1,123 | 510,984(0.22%)#61 | 61,755,866(0.00%)#4,308 |
| 62. | Brownsburg | 1,106 | 510,984(0.22%)#62 | 61,755,866(0.00%)#4,346 |
| 63. | Bremen | 982 | 510,984(0.19%)#63 | 61,755,866(0.00%)#4,671 |
| 64. | Monon | 968 | 510,984(0.19%)#64 | 61,755,866(0.00%)#4,716 |
| 65. | Jasper | 911 | 510,984(0.18%)#65 | 61,755,866(0.00%)#4,888 |
| 66. | Zionsville | 858 | 510,984(0.17%)#66 | 61,755,866(0.00%)#5,042 |
| 67. | New Chicago | 817 | 510,984(0.16%)#67 | 61,755,866(0.00%)#5,179 |
| 68. | Decatur | 806 | 510,984(0.16%)#68 | 61,755,866(0.00%)#5,213 |
| 69. | Vincennes | 779 | 510,984(0.15%)#69 | 61,755,866(0.00%)#5,304 |
| 70. | South Haven | 753 | 510,984(0.15%)#70 | 61,755,866(0.00%)#5,403 |
| 71. | Notre Dame | 740 | 510,984(0.14%)#71 | 61,755,866(0.00%)#5,459 |
| 72. | Franklin | 714 | 510,984(0.14%)#72 | 61,755,866(0.00%)#5,566 |
| 73. | New Haven | 707 | 510,984(0.14%)#73 | 61,755,866(0.00%)#5,592 |
| 74. | Winona Lake | 699 | 510,984(0.14%)#74 | 61,755,866(0.00%)#5,631 |
| 75. | Lakes Of The Four Seasons | 666 | 510,984(0.13%)#75 | 61,755,866(0.00%)#5,772 |
| 76. | Union City | 648 | 510,984(0.13%)#76 | 61,755,866(0.00%)#5,862 |
| 77. | Beech Grove | 621 | 510,984(0.12%)#77 | 61,755,866(0.00%)#5,971 |
| 78. | Porter | 619 | 510,984(0.12%)#78 | 61,755,866(0.00%)#5,988 |
| 79. | Kendallville | 593 | 510,984(0.12%)#79 | 61,755,866(0.00%)#6,105 |
| 80. | Winfield | 585 | 510,984(0.11%)#80 | 61,755,866(0.00%)#6,157 |
| 81. | Lagrange | 574 | 510,984(0.11%)#81 | 61,755,866(0.00%)#6,213 |
| 82. | Mccordsville | 553 | 510,984(0.11%)#82 | 61,755,866(0.00%)#6,325 |
| 83. | Huntington | 542 | 510,984(0.11%)#83 | 61,755,866(0.00%)#6,377 |
| 84. | North Vernon | 540 | 510,984(0.11%)#84 | 61,755,866(0.00%)#6,392 |
| 85. | Bluffton | 527 | 510,984(0.10%)#85 | 61,755,866(0.00%)#6,467 |
| 86. | Monticello | 510 | 510,984(0.10%)#86 | 61,755,866(0.00%)#6,574 |
| 87. | Bedford | 487 | 510,984(0.10%)#87 | 61,755,866(0.00%)#6,692 |
| 88. | Cedar Lake | 475 | 510,984(0.09%)#88 | 61,755,866(0.00%)#6,770 |
| 89. | Boonville | 467 | 510,984(0.09%)#89 | 61,755,866(0.00%)#6,833 |
| 90. | Delphi | 465 | 510,984(0.09%)#90 | 61,755,866(0.00%)#6,855 |
| 91. | Shorewood Forest | 460 | 510,984(0.09%)#91 | 61,755,866(0.00%)#6,890 |
| 92. | Greensburg | 436 | 510,984(0.09%)#92 | 61,755,866(0.00%)#7,048 |
| 93. | Princeton | 433 | 510,984(0.08%)#93 | 61,755,866(0.00%)#7,065 |
| 94. | Greenfield | 424 | 510,984(0.08%)#94 | 61,755,866(0.00%)#7,137 |
| 95. | Wabash | 424 | 510,984(0.08%)#95 | 61,755,866(0.00%)#7,141 |
| 96. | Cumberland | 418 | 510,984(0.08%)#96 | 61,755,866(0.00%)#7,186 |
| 97. | Rensselaer | 415 | 510,984(0.08%)#97 | 61,755,866(0.00%)#7,213 |
| 98. | Peru | 413 | 510,984(0.08%)#98 | 61,755,866(0.00%)#7,225 |
| 99. | Angola | 408 | 510,984(0.08%)#99 | 61,755,866(0.00%)#7,265 |
| 100. | Garrett | 400 | 510,984(0.08%)#100 | 61,755,866(0.00%)#7,320 |
Common Questions
What are the Top 10 Cities with the Largest Hispanic or Latino Community in Indiana?
Top 10 Cities with the Largest Hispanic or Latino Community in Indiana are:
#1
96,262
#2
31,255
#3
25,595
#4
16,873
#5
14,438
#6
14,096
#7
9,100
#8
9,037
#9
8,847
#10
7,261
What city has the Largest Hispanic or Latino Community in Indiana?
Indianapolis has the Largest Hispanic or Latino Community in Indiana with 96,262.
What is the Total Hispanic or Latino Population in the State of Indiana?
Total Hispanic or Latino Population in Indiana is 510,984.
What is the Total Hispanic or Latino Population in the United States?
Total Hispanic or Latino Population in the United States is 61,755,866.