Cities with the Largest Hispanic or Latino Community in Virginia
RELATED REPORTS & OPTIONS
Hispanic or Latino
Virginia
Compare Cities
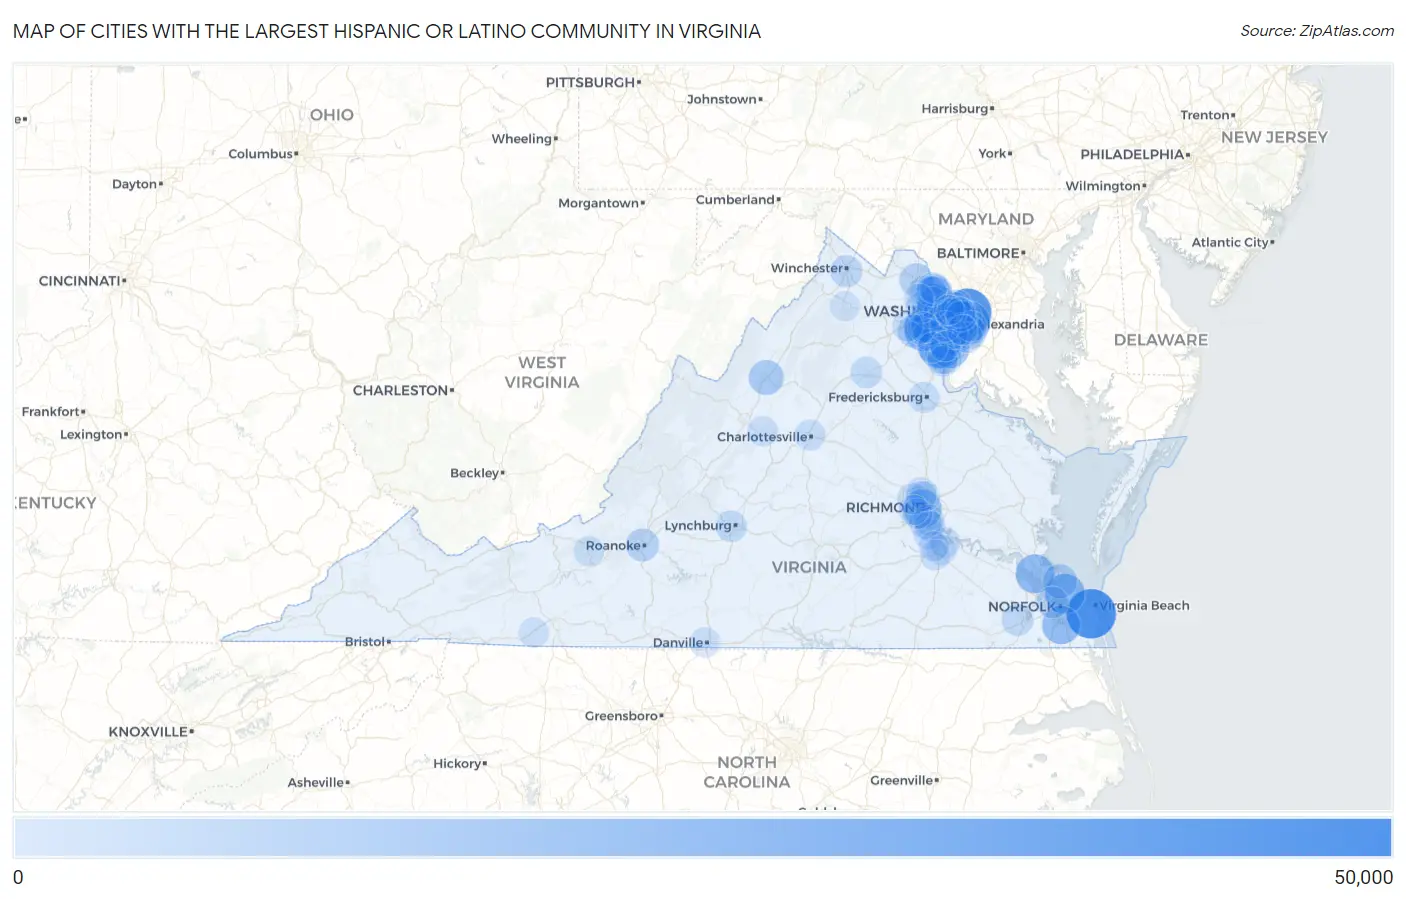
Map of Cities with the Largest Hispanic or Latino Community in Virginia
0
50,000
Cities with the Largest Hispanic or Latino Community in Virginia
| City | Hispanic or Latino | vs State | vs National | |
| 1. | Virginia Beach | 40,139 | 865,015(4.64%)#1 | 61,755,866(0.06%)#225 |
| 2. | Arlington | 36,734 | 865,015(4.25%)#2 | 61,755,866(0.06%)#247 |
| 3. | Alexandria | 26,092 | 865,015(3.02%)#3 | 61,755,866(0.04%)#361 |
| 4. | Dale City | 25,830 | 865,015(2.99%)#4 | 61,755,866(0.04%)#364 |
| 5. | Norfolk | 20,688 | 865,015(2.39%)#5 | 61,755,866(0.03%)#451 |
| 6. | Newport News | 18,290 | 865,015(2.11%)#6 | 61,755,866(0.03%)#516 |
| 7. | Woodbridge | 17,686 | 865,015(2.04%)#7 | 61,755,866(0.03%)#539 |
| 8. | Chesapeake | 17,578 | 865,015(2.03%)#8 | 61,755,866(0.03%)#542 |
| 9. | Richmond | 17,306 | 865,015(2.00%)#9 | 61,755,866(0.03%)#548 |
| 10. | Manassas | 16,527 | 865,015(1.91%)#10 | 61,755,866(0.03%)#571 |
| 11. | Sterling | 14,614 | 865,015(1.69%)#11 | 61,755,866(0.02%)#632 |
| 12. | Annandale | 13,636 | 865,015(1.58%)#12 | 61,755,866(0.02%)#692 |
| 13. | Centreville | 12,009 | 865,015(1.39%)#13 | 61,755,866(0.02%)#765 |
| 14. | West Falls Church | 11,861 | 865,015(1.37%)#14 | 61,755,866(0.02%)#778 |
| 15. | Sudley | 11,256 | 865,015(1.30%)#15 | 61,755,866(0.02%)#814 |
| 16. | Harrisonburg | 10,762 | 865,015(1.24%)#16 | 61,755,866(0.02%)#851 |
| 17. | Woodlawn Cdp Fairfax County | 9,943 | 865,015(1.15%)#17 | 61,755,866(0.02%)#917 |
| 18. | Herndon | 9,143 | 865,015(1.06%)#18 | 61,755,866(0.01%)#990 |
| 19. | Hampton | 9,028 | 865,015(1.04%)#19 | 61,755,866(0.01%)#1,003 |
| 20. | Lake Ridge | 8,982 | 865,015(1.04%)#20 | 61,755,866(0.01%)#1,007 |
| 21. | Reston | 8,815 | 865,015(1.02%)#21 | 61,755,866(0.01%)#1,026 |
| 22. | Bailey S Crossroads | 8,396 | 865,015(0.97%)#22 | 61,755,866(0.01%)#1,072 |
| 23. | Leesburg | 8,103 | 865,015(0.94%)#23 | 61,755,866(0.01%)#1,099 |
| 24. | Manassas Park | 7,175 | 865,015(0.83%)#24 | 61,755,866(0.01%)#1,194 |
| 25. | Burke | 7,079 | 865,015(0.82%)#25 | 61,755,866(0.01%)#1,209 |
| 26. | Bull Run | 6,854 | 865,015(0.79%)#26 | 61,755,866(0.01%)#1,239 |
| 27. | Roanoke | 6,838 | 865,015(0.79%)#27 | 61,755,866(0.01%)#1,243 |
| 28. | Linton Hall | 6,437 | 865,015(0.74%)#28 | 61,755,866(0.01%)#1,294 |
| 29. | Hybla Valley | 6,436 | 865,015(0.74%)#29 | 61,755,866(0.01%)#1,295 |
| 30. | Yorkshire | 5,792 | 865,015(0.67%)#30 | 61,755,866(0.01%)#1,408 |
| 31. | Springfield | 5,714 | 865,015(0.66%)#31 | 61,755,866(0.01%)#1,423 |
| 32. | Meadowbrook | 5,372 | 865,015(0.62%)#32 | 61,755,866(0.01%)#1,484 |
| 33. | Winchester | 5,254 | 865,015(0.61%)#33 | 61,755,866(0.01%)#1,505 |
| 34. | Portsmouth | 4,879 | 865,015(0.56%)#34 | 61,755,866(0.01%)#1,590 |
| 35. | Ashburn | 4,709 | 865,015(0.54%)#35 | 61,755,866(0.01%)#1,634 |
| 36. | Suffolk | 4,573 | 865,015(0.53%)#36 | 61,755,866(0.01%)#1,667 |
| 37. | Chantilly | 4,480 | 865,015(0.52%)#37 | 61,755,866(0.01%)#1,701 |
| 38. | Sugarland Run | 4,402 | 865,015(0.51%)#38 | 61,755,866(0.01%)#1,727 |
| 39. | Fairfax | 4,397 | 865,015(0.51%)#39 | 61,755,866(0.01%)#1,730 |
| 40. | West Springfield | 4,267 | 865,015(0.49%)#40 | 61,755,866(0.01%)#1,769 |
| 41. | Oakton | 4,244 | 865,015(0.49%)#41 | 61,755,866(0.01%)#1,775 |
| 42. | Lincolnia | 4,196 | 865,015(0.49%)#42 | 61,755,866(0.01%)#1,797 |
| 43. | Culpeper | 4,115 | 865,015(0.48%)#43 | 61,755,866(0.01%)#1,826 |
| 44. | Rose Hill Cdp Fairfax County | 4,034 | 865,015(0.47%)#44 | 61,755,866(0.01%)#1,853 |
| 45. | Groveton | 3,935 | 865,015(0.45%)#45 | 61,755,866(0.01%)#1,896 |
| 46. | Hutchison | 3,842 | 865,015(0.44%)#46 | 61,755,866(0.01%)#1,931 |
| 47. | Lorton | 3,791 | 865,015(0.44%)#47 | 61,755,866(0.01%)#1,948 |
| 48. | Fair Oaks | 3,758 | 865,015(0.43%)#48 | 61,755,866(0.01%)#1,963 |
| 49. | Tysons | 3,734 | 865,015(0.43%)#49 | 61,755,866(0.01%)#1,966 |
| 50. | Lynchburg | 3,688 | 865,015(0.43%)#50 | 61,755,866(0.01%)#1,990 |
| 51. | Buckhall | 3,474 | 865,015(0.40%)#51 | 61,755,866(0.01%)#2,075 |
| 52. | Seven Corners | 3,338 | 865,015(0.39%)#52 | 61,755,866(0.01%)#2,132 |
| 53. | Fredericksburg | 3,308 | 865,015(0.38%)#53 | 61,755,866(0.01%)#2,145 |
| 54. | Cherry Hill | 3,308 | 865,015(0.38%)#54 | 61,755,866(0.01%)#2,146 |
| 55. | South Riding | 3,162 | 865,015(0.37%)#55 | 61,755,866(0.01%)#2,222 |
| 56. | Leesylvania | 3,152 | 865,015(0.36%)#56 | 61,755,866(0.01%)#2,226 |
| 57. | Idylwood | 3,121 | 865,015(0.36%)#57 | 61,755,866(0.01%)#2,241 |
| 58. | Mcnair | 3,004 | 865,015(0.35%)#58 | 61,755,866(0.00%)#2,289 |
| 59. | Tuckahoe | 2,815 | 865,015(0.33%)#59 | 61,755,866(0.00%)#2,405 |
| 60. | Charlottesville | 2,705 | 865,015(0.31%)#60 | 61,755,866(0.00%)#2,468 |
| 61. | Montclair | 2,635 | 865,015(0.30%)#61 | 61,755,866(0.00%)#2,513 |
| 62. | Chester | 2,622 | 865,015(0.30%)#62 | 61,755,866(0.00%)#2,522 |
| 63. | Bensley | 2,585 | 865,015(0.30%)#63 | 61,755,866(0.00%)#2,543 |
| 64. | Newington | 2,582 | 865,015(0.30%)#64 | 61,755,866(0.00%)#2,547 |
| 65. | Franconia | 2,418 | 865,015(0.28%)#65 | 61,755,866(0.00%)#2,660 |
| 66. | Mount Vernon | 2,418 | 865,015(0.28%)#66 | 61,755,866(0.00%)#2,661 |
| 67. | Loch Lomond | 2,394 | 865,015(0.28%)#67 | 61,755,866(0.00%)#2,677 |
| 68. | Triangle | 2,390 | 865,015(0.28%)#68 | 61,755,866(0.00%)#2,679 |
| 69. | Mclean | 2,342 | 865,015(0.27%)#69 | 61,755,866(0.00%)#2,707 |
| 70. | Newington Forest | 2,234 | 865,015(0.26%)#70 | 61,755,866(0.00%)#2,798 |
| 71. | Dumfries | 2,230 | 865,015(0.26%)#71 | 61,755,866(0.00%)#2,801 |
| 72. | Gainesville | 2,191 | 865,015(0.25%)#72 | 61,755,866(0.00%)#2,832 |
| 73. | Huntington | 2,165 | 865,015(0.25%)#73 | 61,755,866(0.00%)#2,859 |
| 74. | Burke Centre | 2,141 | 865,015(0.25%)#74 | 61,755,866(0.00%)#2,888 |
| 75. | Laurel | 2,126 | 865,015(0.25%)#75 | 61,755,866(0.00%)#2,908 |
| 76. | Dumbarton | 2,122 | 865,015(0.25%)#76 | 61,755,866(0.00%)#2,916 |
| 77. | Danville | 2,089 | 865,015(0.24%)#77 | 61,755,866(0.00%)#2,938 |
| 78. | Waynesboro | 2,075 | 865,015(0.24%)#78 | 61,755,866(0.00%)#2,959 |
| 79. | Hopewell | 2,043 | 865,015(0.24%)#79 | 61,755,866(0.00%)#2,981 |
| 80. | Merrifield | 2,031 | 865,015(0.23%)#80 | 61,755,866(0.00%)#2,997 |
| 81. | Bellwood | 1,806 | 865,015(0.21%)#81 | 61,755,866(0.00%)#3,237 |
| 82. | Fort Lee | 1,796 | 865,015(0.21%)#82 | 61,755,866(0.00%)#3,247 |
| 83. | Petersburg | 1,765 | 865,015(0.20%)#83 | 61,755,866(0.00%)#3,286 |
| 84. | Lake Barcroft | 1,765 | 865,015(0.20%)#84 | 61,755,866(0.00%)#3,287 |
| 85. | Countryside | 1,733 | 865,015(0.20%)#85 | 61,755,866(0.00%)#3,326 |
| 86. | Blacksburg | 1,703 | 865,015(0.20%)#86 | 61,755,866(0.00%)#3,362 |
| 87. | Manchester | 1,681 | 865,015(0.19%)#87 | 61,755,866(0.00%)#3,386 |
| 88. | Falls Church | 1,640 | 865,015(0.19%)#88 | 61,755,866(0.00%)#3,430 |
| 89. | Independent Hill | 1,597 | 865,015(0.18%)#89 | 61,755,866(0.00%)#3,490 |
| 90. | Kingstowne | 1,584 | 865,015(0.18%)#90 | 61,755,866(0.00%)#3,506 |
| 91. | Potomac Mills | 1,511 | 865,015(0.17%)#91 | 61,755,866(0.00%)#3,614 |
| 92. | Cascades | 1,440 | 865,015(0.17%)#92 | 61,755,866(0.00%)#3,722 |
| 93. | Lakeside | 1,417 | 865,015(0.16%)#93 | 61,755,866(0.00%)#3,757 |
| 94. | Dulles Town Center | 1,414 | 865,015(0.16%)#94 | 61,755,866(0.00%)#3,767 |
| 95. | Front Royal | 1,400 | 865,015(0.16%)#95 | 61,755,866(0.00%)#3,794 |
| 96. | Vienna | 1,379 | 865,015(0.16%)#96 | 61,755,866(0.00%)#3,820 |
| 97. | Galax | 1,379 | 865,015(0.16%)#97 | 61,755,866(0.00%)#3,823 |
| 98. | Bon Air | 1,366 | 865,015(0.16%)#98 | 61,755,866(0.00%)#3,849 |
| 99. | Brambleton | 1,365 | 865,015(0.16%)#99 | 61,755,866(0.00%)#3,851 |
| 100. | Colonial Heights | 1,316 | 865,015(0.15%)#100 | 61,755,866(0.00%)#3,940 |
Common Questions
What are the Top 10 Cities with the Largest Hispanic or Latino Community in Virginia?
Top 10 Cities with the Largest Hispanic or Latino Community in Virginia are:
#1
40,139
#2
36,734
#3
26,092
#4
25,830
#5
20,688
#6
18,290
#7
17,686
#8
17,578
#9
17,306
#10
16,527
What city has the Largest Hispanic or Latino Community in Virginia?
Virginia Beach has the Largest Hispanic or Latino Community in Virginia with 40,139.
What is the Total Hispanic or Latino Population in the State of Virginia?
Total Hispanic or Latino Population in Virginia is 865,015.
What is the Total Hispanic or Latino Population in the United States?
Total Hispanic or Latino Population in the United States is 61,755,866.