Cities with the Largest Hispanic or Latino Community in Mississippi
RELATED REPORTS & OPTIONS
Hispanic or Latino
Mississippi
Compare Cities
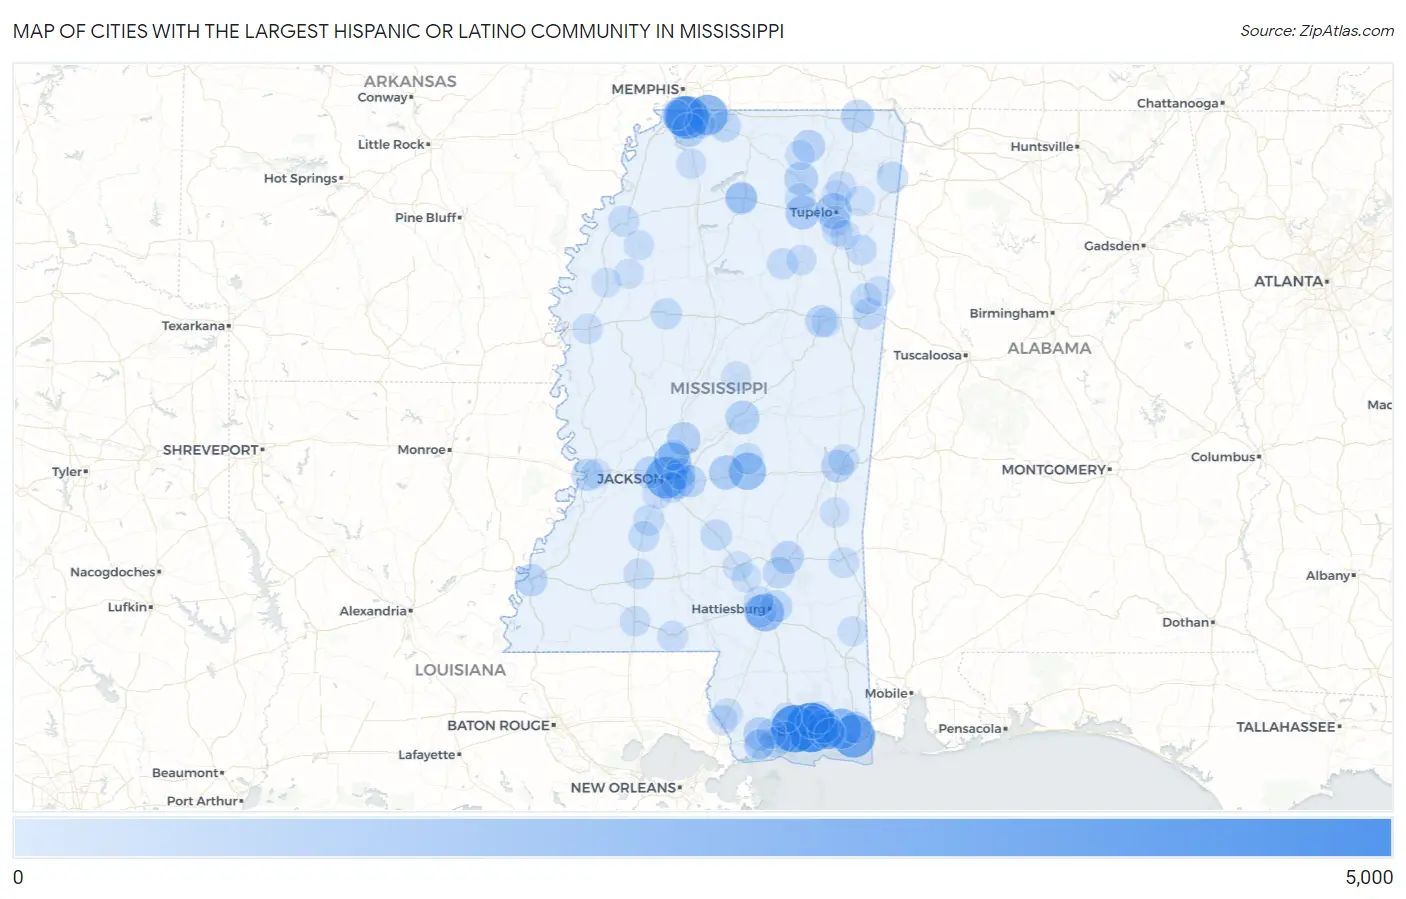
Map of Cities with the Largest Hispanic or Latino Community in Mississippi
0
5,000
Cities with the Largest Hispanic or Latino Community in Mississippi
| City | Hispanic or Latino | vs State | vs National | |
| 1. | Biloxi | 4,405 | 97,123(4.54%)#1 | 61,755,866(0.01%)#1,725 |
| 2. | Gulfport | 3,916 | 97,123(4.03%)#2 | 61,755,866(0.01%)#1,905 |
| 3. | Pascagoula | 2,894 | 97,123(2.98%)#3 | 61,755,866(0.00%)#2,347 |
| 4. | Southaven | 2,871 | 97,123(2.96%)#4 | 61,755,866(0.00%)#2,367 |
| 5. | Jackson | 2,572 | 97,123(2.65%)#5 | 61,755,866(0.00%)#2,556 |
| 6. | Horn Lake | 2,356 | 97,123(2.43%)#6 | 61,755,866(0.00%)#2,698 |
| 7. | Olive Branch | 2,344 | 97,123(2.41%)#7 | 61,755,866(0.00%)#2,705 |
| 8. | Gautier | 2,338 | 97,123(2.41%)#8 | 61,755,866(0.00%)#2,710 |
| 9. | Hattiesburg | 1,798 | 97,123(1.85%)#9 | 61,755,866(0.00%)#3,242 |
| 10. | Ridgeland | 1,666 | 97,123(1.72%)#10 | 61,755,866(0.00%)#3,397 |
| 11. | Forest | 1,623 | 97,123(1.67%)#11 | 61,755,866(0.00%)#3,461 |
| 12. | Ocean Springs | 1,429 | 97,123(1.47%)#12 | 61,755,866(0.00%)#3,738 |
| 13. | Tupelo | 1,270 | 97,123(1.31%)#13 | 61,755,866(0.00%)#4,013 |
| 14. | Pearl | 1,146 | 97,123(1.18%)#14 | 61,755,866(0.00%)#4,260 |
| 15. | Morton | 1,004 | 97,123(1.03%)#15 | 61,755,866(0.00%)#4,608 |
| 16. | Pontotoc | 956 | 97,123(0.98%)#16 | 61,755,866(0.00%)#4,753 |
| 17. | Gulf Hills | 934 | 97,123(0.96%)#17 | 61,755,866(0.00%)#4,819 |
| 18. | Hernando | 894 | 97,123(0.92%)#18 | 61,755,866(0.00%)#4,936 |
| 19. | Carthage | 846 | 97,123(0.87%)#19 | 61,755,866(0.00%)#5,084 |
| 20. | New Albany | 821 | 97,123(0.85%)#20 | 61,755,866(0.00%)#5,169 |
| 21. | Diamondhead | 781 | 97,123(0.80%)#21 | 61,755,866(0.00%)#5,295 |
| 22. | Canton | 777 | 97,123(0.80%)#22 | 61,755,866(0.00%)#5,317 |
| 23. | Corinth | 723 | 97,123(0.74%)#23 | 61,755,866(0.00%)#5,518 |
| 24. | D Iberville | 722 | 97,123(0.74%)#24 | 61,755,866(0.00%)#5,525 |
| 25. | West Hattiesburg | 673 | 97,123(0.69%)#25 | 61,755,866(0.00%)#5,742 |
| 26. | Laurel | 653 | 97,123(0.67%)#26 | 61,755,866(0.00%)#5,828 |
| 27. | Meridian | 648 | 97,123(0.67%)#27 | 61,755,866(0.00%)#5,859 |
| 28. | Ripley | 642 | 97,123(0.66%)#28 | 61,755,866(0.00%)#5,884 |
| 29. | Natchez | 578 | 97,123(0.60%)#29 | 61,755,866(0.00%)#6,192 |
| 30. | Brandon | 543 | 97,123(0.56%)#30 | 61,755,866(0.00%)#6,372 |
| 31. | Latimer | 528 | 97,123(0.54%)#31 | 61,755,866(0.00%)#6,459 |
| 32. | Vicksburg | 527 | 97,123(0.54%)#32 | 61,755,866(0.00%)#6,466 |
| 33. | Starkville | 526 | 97,123(0.54%)#33 | 61,755,866(0.00%)#6,473 |
| 34. | Long Beach | 513 | 97,123(0.53%)#34 | 61,755,866(0.00%)#6,556 |
| 35. | Clinton | 500 | 97,123(0.51%)#35 | 61,755,866(0.00%)#6,623 |
| 36. | Oxford | 498 | 97,123(0.51%)#36 | 61,755,866(0.00%)#6,637 |
| 37. | Moss Point | 493 | 97,123(0.51%)#37 | 61,755,866(0.00%)#6,661 |
| 38. | Petal | 479 | 97,123(0.49%)#38 | 61,755,866(0.00%)#6,743 |
| 39. | Ellisville | 464 | 97,123(0.48%)#39 | 61,755,866(0.00%)#6,861 |
| 40. | Byhalia | 439 | 97,123(0.45%)#40 | 61,755,866(0.00%)#7,031 |
| 41. | Columbus | 432 | 97,123(0.44%)#41 | 61,755,866(0.00%)#7,076 |
| 42. | University | 403 | 97,123(0.41%)#42 | 61,755,866(0.00%)#7,303 |
| 43. | Flowood | 400 | 97,123(0.41%)#43 | 61,755,866(0.00%)#7,319 |
| 44. | Belmont | 393 | 97,123(0.40%)#44 | 61,755,866(0.00%)#7,375 |
| 45. | Hillsboro | 373 | 97,123(0.38%)#45 | 61,755,866(0.00%)#7,545 |
| 46. | Magee | 371 | 97,123(0.38%)#46 | 61,755,866(0.00%)#7,553 |
| 47. | Greenwood | 346 | 97,123(0.36%)#47 | 61,755,866(0.00%)#7,770 |
| 48. | Columbus Afb | 330 | 97,123(0.34%)#48 | 61,755,866(0.00%)#7,943 |
| 49. | Gulf Park Estates | 318 | 97,123(0.33%)#49 | 61,755,866(0.00%)#8,060 |
| 50. | Vardaman | 301 | 97,123(0.31%)#50 | 61,755,866(0.00%)#8,260 |
| 51. | Madison | 297 | 97,123(0.31%)#51 | 61,755,866(0.00%)#8,284 |
| 52. | Clarksdale | 295 | 97,123(0.30%)#52 | 61,755,866(0.00%)#8,308 |
| 53. | Crystal Springs | 286 | 97,123(0.29%)#53 | 61,755,866(0.00%)#8,417 |
| 54. | Marion | 285 | 97,123(0.29%)#54 | 61,755,866(0.00%)#8,432 |
| 55. | Amory | 273 | 97,123(0.28%)#55 | 61,755,866(0.00%)#8,595 |
| 56. | Hazlehurst | 272 | 97,123(0.28%)#56 | 61,755,866(0.00%)#8,612 |
| 57. | Pass Christian | 256 | 97,123(0.26%)#57 | 61,755,866(0.00%)#8,813 |
| 58. | Tylertown | 254 | 97,123(0.26%)#58 | 61,755,866(0.00%)#8,859 |
| 59. | Waynesboro | 247 | 97,123(0.25%)#59 | 61,755,866(0.00%)#8,964 |
| 60. | Brookhaven | 235 | 97,123(0.24%)#60 | 61,755,866(0.00%)#9,127 |
| 61. | Picayune | 233 | 97,123(0.24%)#61 | 61,755,866(0.00%)#9,164 |
| 62. | Richland | 233 | 97,123(0.24%)#62 | 61,755,866(0.00%)#9,167 |
| 63. | Bay St Louis | 225 | 97,123(0.23%)#63 | 61,755,866(0.00%)#9,265 |
| 64. | Ecru | 211 | 97,123(0.22%)#64 | 61,755,866(0.00%)#9,510 |
| 65. | Mccomb | 194 | 97,123(0.20%)#65 | 61,755,866(0.00%)#9,818 |
| 66. | Glen Allan | 187 | 97,123(0.19%)#66 | 61,755,866(0.00%)#9,969 |
| 67. | Waveland | 186 | 97,123(0.19%)#67 | 61,755,866(0.00%)#9,973 |
| 68. | Byram | 185 | 97,123(0.19%)#68 | 61,755,866(0.00%)#9,987 |
| 69. | Tutwiler | 184 | 97,123(0.19%)#69 | 61,755,866(0.00%)#10,016 |
| 70. | Verona | 174 | 97,123(0.18%)#70 | 61,755,866(0.00%)#10,208 |
| 71. | Guntown | 173 | 97,123(0.18%)#71 | 61,755,866(0.00%)#10,227 |
| 72. | Delisle | 173 | 97,123(0.18%)#72 | 61,755,866(0.00%)#10,230 |
| 73. | Oak Grove | 172 | 97,123(0.18%)#73 | 61,755,866(0.00%)#10,262 |
| 74. | Nicholson | 168 | 97,123(0.17%)#74 | 61,755,866(0.00%)#10,334 |
| 75. | Houston | 158 | 97,123(0.16%)#75 | 61,755,866(0.00%)#10,537 |
| 76. | Senatobia | 156 | 97,123(0.16%)#76 | 61,755,866(0.00%)#10,588 |
| 77. | Bethlehem | 156 | 97,123(0.16%)#77 | 61,755,866(0.00%)#10,614 |
| 78. | Rawls Springs | 150 | 97,123(0.15%)#78 | 61,755,866(0.00%)#10,733 |
| 79. | Victoria | 142 | 97,123(0.15%)#79 | 61,755,866(0.00%)#10,931 |
| 80. | Leland | 141 | 97,123(0.15%)#80 | 61,755,866(0.00%)#10,948 |
| 81. | Shannon | 123 | 97,123(0.13%)#81 | 61,755,866(0.00%)#11,489 |
| 82. | Saltillo | 118 | 97,123(0.12%)#82 | 61,755,866(0.00%)#11,625 |
| 83. | Lyman | 118 | 97,123(0.12%)#83 | 61,755,866(0.00%)#11,637 |
| 84. | Quitman | 117 | 97,123(0.12%)#84 | 61,755,866(0.00%)#11,679 |
| 85. | Lakeview | 117 | 97,123(0.12%)#85 | 61,755,866(0.00%)#11,690 |
| 86. | Caledonia | 114 | 97,123(0.12%)#86 | 61,755,866(0.00%)#11,772 |
| 87. | Kosciusko | 112 | 97,123(0.12%)#87 | 61,755,866(0.00%)#11,815 |
| 88. | Beechwood | 109 | 97,123(0.11%)#88 | 61,755,866(0.00%)#11,931 |
| 89. | Bridgetown | 105 | 97,123(0.11%)#89 | 61,755,866(0.00%)#12,084 |
| 90. | Collins | 103 | 97,123(0.11%)#90 | 61,755,866(0.00%)#12,169 |
| 91. | Mantachie | 101 | 97,123(0.10%)#91 | 61,755,866(0.00%)#12,243 |
| 92. | Blue Mountain | 101 | 97,123(0.10%)#92 | 61,755,866(0.00%)#12,249 |
| 93. | Leakesville | 94 | 97,123(0.10%)#93 | 61,755,866(0.00%)#12,526 |
| 94. | Lynchburg | 90 | 97,123(0.09%)#94 | 61,755,866(0.00%)#12,677 |
| 95. | Nettleton | 90 | 97,123(0.09%)#95 | 61,755,866(0.00%)#12,680 |
| 96. | Drew | 89 | 97,123(0.09%)#96 | 61,755,866(0.00%)#12,717 |
| 97. | Cleveland | 86 | 97,123(0.09%)#97 | 61,755,866(0.00%)#12,851 |
| 98. | Mississippi State | 84 | 97,123(0.09%)#98 | 61,755,866(0.00%)#12,948 |
| 99. | Gluckstadt | 84 | 97,123(0.09%)#99 | 61,755,866(0.00%)#12,951 |
| 100. | Seminary | 83 | 97,123(0.09%)#100 | 61,755,866(0.00%)#13,030 |
Common Questions
What are the Top 10 Cities with the Largest Hispanic or Latino Community in Mississippi?
Top 10 Cities with the Largest Hispanic or Latino Community in Mississippi are:
#1
4,405
#2
3,916
#3
2,894
#4
2,871
#5
2,572
#6
2,356
#7
2,344
#8
2,338
#9
1,798
#10
1,666
What city has the Largest Hispanic or Latino Community in Mississippi?
Biloxi has the Largest Hispanic or Latino Community in Mississippi with 4,405.
What is the Total Hispanic or Latino Population in the State of Mississippi?
Total Hispanic or Latino Population in Mississippi is 97,123.
What is the Total Hispanic or Latino Population in the United States?
Total Hispanic or Latino Population in the United States is 61,755,866.