Telford borough, PA Map & Demographics
Telford borough Overview
$41,175
PER CAPITA INCOME
$107,045
AVG FAMILY INCOME
$77,092
AVG HOUSEHOLD INCOME
52.1%
WAGE / INCOME GAP [ % ]
47.9¢/ $1
WAGE / INCOME GAP [ $ ]
$14,479
FAMILY INCOME DEFICIT
0.39
INEQUALITY / GINI INDEX
4,807
TOTAL POPULATION
2,311
MALE POPULATION
2,496
FEMALE POPULATION
92.59
MALES / 100 FEMALES
108.01
FEMALES / 100 MALES
39.4
MEDIAN AGE
3.4
AVG FAMILY SIZE
2.5
AVG HOUSEHOLD SIZE
2,541
LABOR FORCE [ PEOPLE ]
65.7%
PERCENT IN LABOR FORCE
5.2%
UNEMPLOYMENT RATE
Income in Telford borough
Income Overview in Telford borough
Per Capita Income in Telford borough is $41,175, while median incomes of families and households are $107,045 and $77,092 respectively.
| Characteristic | Number | Measure |
| Per Capita Income | 4,807 | $41,175 |
| Median Family Income | 1,048 | $107,045 |
| Mean Family Income | 1,048 | $110,834 |
| Median Household Income | 1,882 | $77,092 |
| Mean Household Income | 1,882 | $87,214 |
| Income Deficit | 1,048 | $14,479 |
| Wage / Income Gap (%) | 4,807 | 52.13% |
| Wage / Income Gap ($) | 4,807 | 47.87¢ per $1 |
| Gini / Inequality Index | 4,807 | 0.39 |
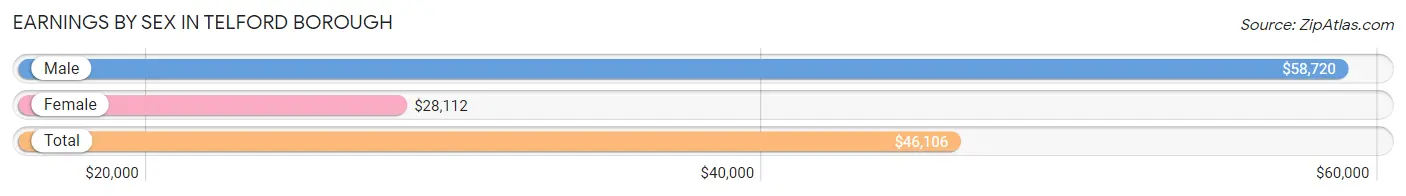
Earnings by Sex in Telford borough
Average Earnings in Telford borough are $46,106, $58,720 for men and $28,112 for women, a difference of 52.1%.
| Sex | Number | Average Earnings |
| Male | 1,349 (52.8%) | $58,720 |
| Female | 1,204 (47.2%) | $28,112 |
| Total | 2,553 (100.0%) | $46,106 |
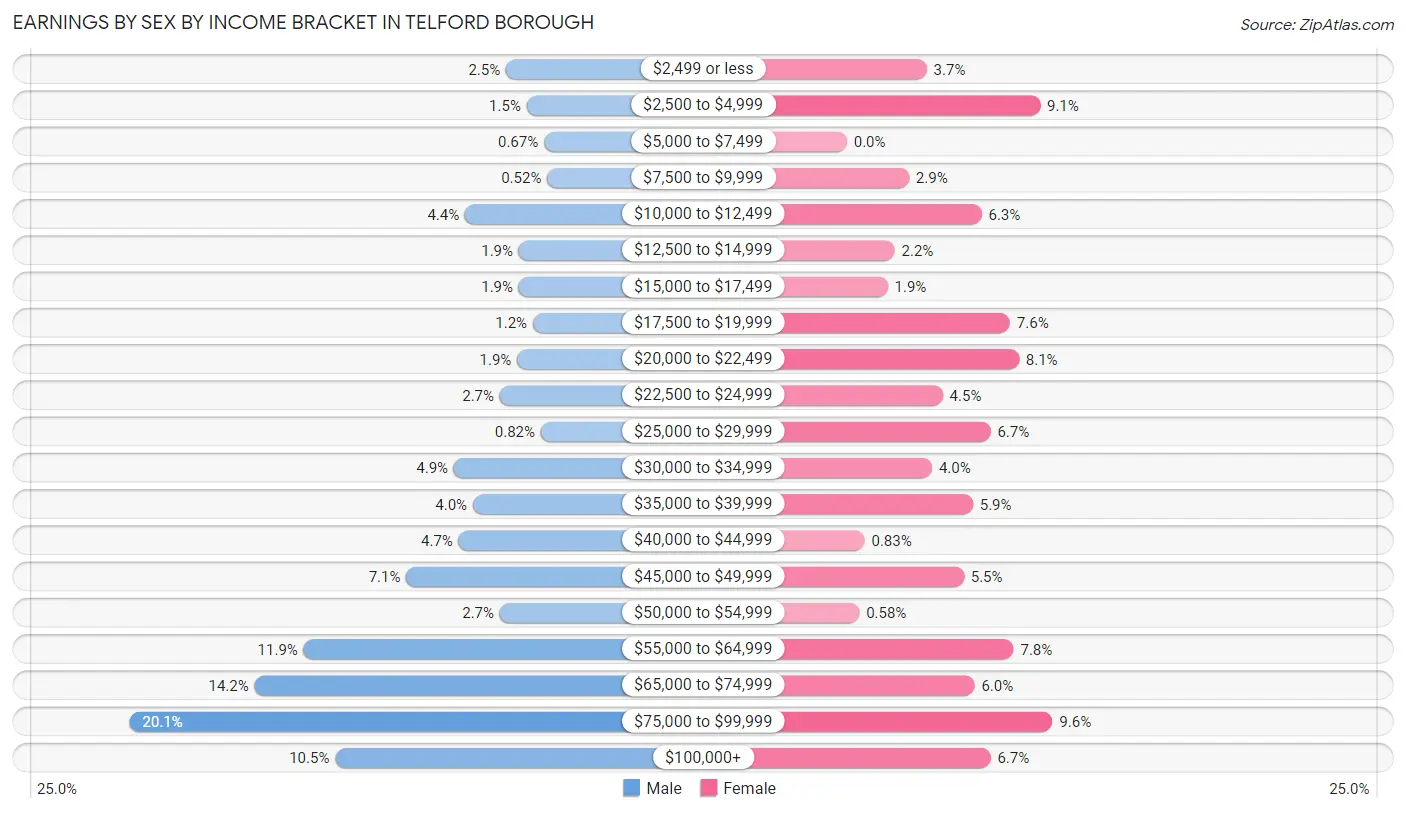
Earnings by Sex by Income Bracket in Telford borough
The most common earnings brackets in Telford borough are $75,000 to $99,999 for men (271 | 20.1%) and $75,000 to $99,999 for women (116 | 9.6%).
| Income | Male | Female |
| $2,499 or less | 33 (2.5%) | 45 (3.7%) |
| $2,500 to $4,999 | 20 (1.5%) | 109 (9.0%) |
| $5,000 to $7,499 | 9 (0.7%) | 0 (0.0%) |
| $7,500 to $9,999 | 7 (0.5%) | 35 (2.9%) |
| $10,000 to $12,499 | 59 (4.4%) | 76 (6.3%) |
| $12,500 to $14,999 | 25 (1.8%) | 27 (2.2%) |
| $15,000 to $17,499 | 25 (1.8%) | 23 (1.9%) |
| $17,500 to $19,999 | 16 (1.2%) | 92 (7.6%) |
| $20,000 to $22,499 | 26 (1.9%) | 97 (8.1%) |
| $22,500 to $24,999 | 37 (2.7%) | 54 (4.5%) |
| $25,000 to $29,999 | 11 (0.8%) | 81 (6.7%) |
| $30,000 to $34,999 | 66 (4.9%) | 48 (4.0%) |
| $35,000 to $39,999 | 54 (4.0%) | 71 (5.9%) |
| $40,000 to $44,999 | 63 (4.7%) | 10 (0.8%) |
| $45,000 to $49,999 | 96 (7.1%) | 66 (5.5%) |
| $50,000 to $54,999 | 37 (2.7%) | 7 (0.6%) |
| $55,000 to $64,999 | 161 (11.9%) | 94 (7.8%) |
| $65,000 to $74,999 | 192 (14.2%) | 72 (6.0%) |
| $75,000 to $99,999 | 271 (20.1%) | 116 (9.6%) |
| $100,000+ | 141 (10.4%) | 81 (6.7%) |
| Total | 1,349 (100.0%) | 1,204 (100.0%) |
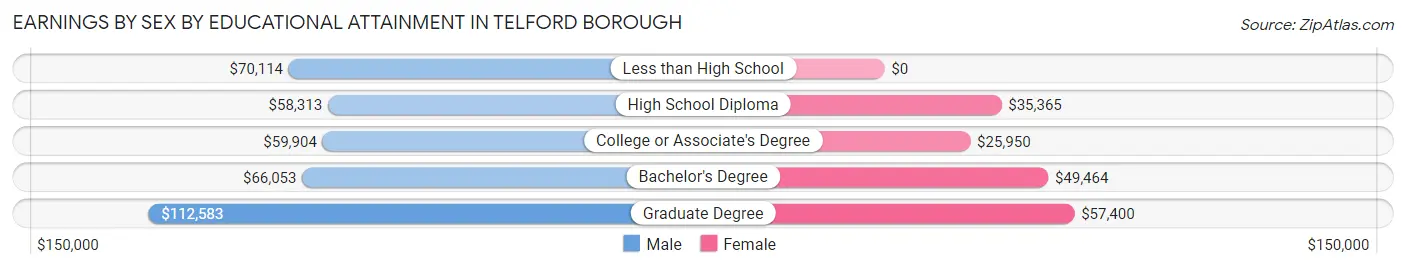
Earnings by Sex by Educational Attainment in Telford borough
Average earnings in Telford borough are $64,219 for men and $35,877 for women, a difference of 44.1%. Men with an educational attainment of graduate degree enjoy the highest average annual earnings of $112,583, while those with high school diploma education earn the least with $58,313. Women with an educational attainment of graduate degree earn the most with the average annual earnings of $57,400, while those with college or associate's degree education have the smallest earnings of $25,950.
| Educational Attainment | Male Income | Female Income |
| Less than High School | $70,114 | $0 |
| High School Diploma | $58,313 | $35,365 |
| College or Associate's Degree | $59,904 | $25,950 |
| Bachelor's Degree | $66,053 | $49,464 |
| Graduate Degree | $112,583 | $57,400 |
| Total | $64,219 | $35,877 |
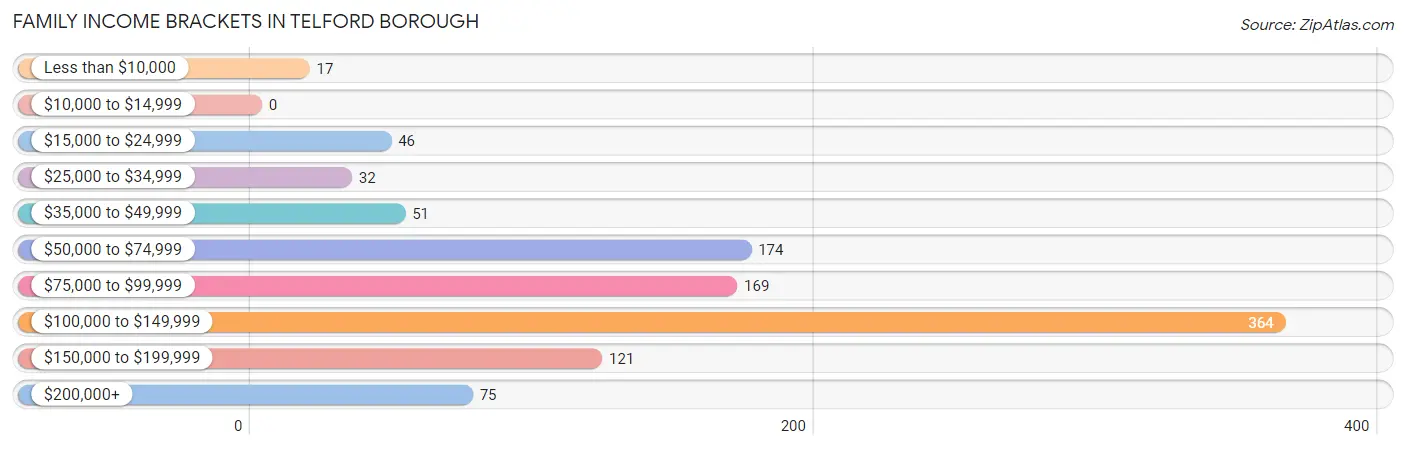
Family Income in Telford borough
Family Income Brackets in Telford borough
According to the Telford borough family income data, there are 364 families falling into the $100,000 to $149,999 income range, which is the most common income bracket and makes up 34.7% of all families.
| Income Bracket | # Families | % Families |
| Less than $10,000 | 17 | 1.6% |
| $10,000 to $14,999 | 0 | 0.0% |
| $15,000 to $24,999 | 46 | 4.4% |
| $25,000 to $34,999 | 32 | 3.1% |
| $35,000 to $49,999 | 51 | 4.9% |
| $50,000 to $74,999 | 174 | 16.6% |
| $75,000 to $99,999 | 169 | 16.1% |
| $100,000 to $149,999 | 364 | 34.7% |
| $150,000 to $199,999 | 121 | 11.5% |
| $200,000+ | 75 | 7.2% |
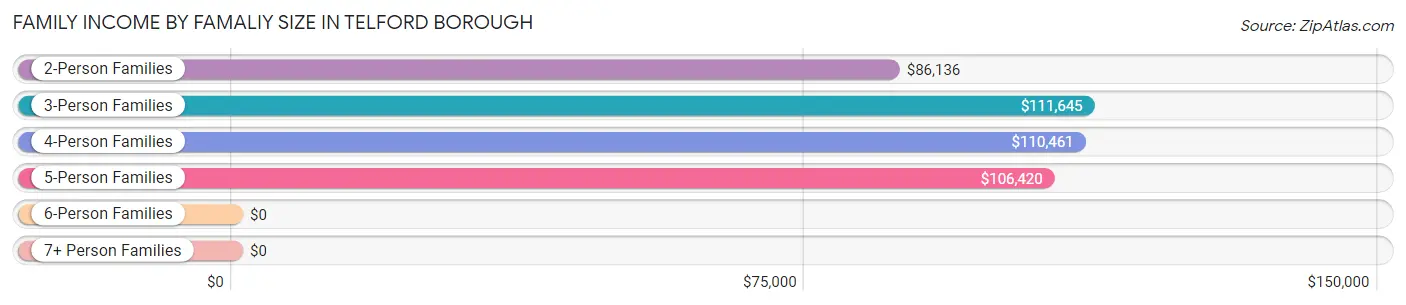
Family Income by Famaliy Size in Telford borough
3-person families (237 | 22.6%) account for the highest median family income in Telford borough with $111,645 per family, while 2-person families (390 | 37.2%) have the highest median income of $43,068 per family member.
| Income Bracket | # Families | Median Income |
| 2-Person Families | 390 (37.2%) | $86,136 |
| 3-Person Families | 237 (22.6%) | $111,645 |
| 4-Person Families | 253 (24.1%) | $110,461 |
| 5-Person Families | 129 (12.3%) | $106,420 |
| 6-Person Families | 17 (1.6%) | $0 |
| 7+ Person Families | 22 (2.1%) | $0 |
| Total | 1,048 (100.0%) | $107,045 |
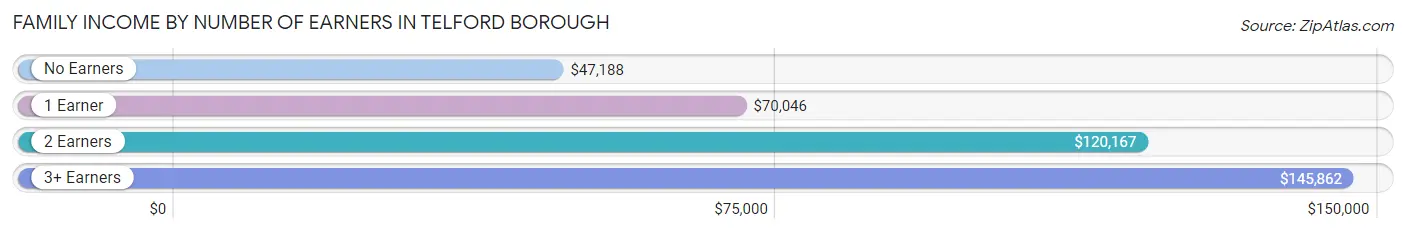
Family Income by Number of Earners in Telford borough
The median family income in Telford borough is $107,045, with families comprising 3+ earners (230) having the highest median family income of $145,862, while families with no earners (173) have the lowest median family income of $47,188, accounting for 22.0% and 16.5% of families, respectively.
| Number of Earners | # Families | Median Income |
| No Earners | 173 (16.5%) | $47,188 |
| 1 Earner | 221 (21.1%) | $70,046 |
| 2 Earners | 424 (40.5%) | $120,167 |
| 3+ Earners | 230 (22.0%) | $145,862 |
| Total | 1,048 (100.0%) | $107,045 |
Household Income in Telford borough
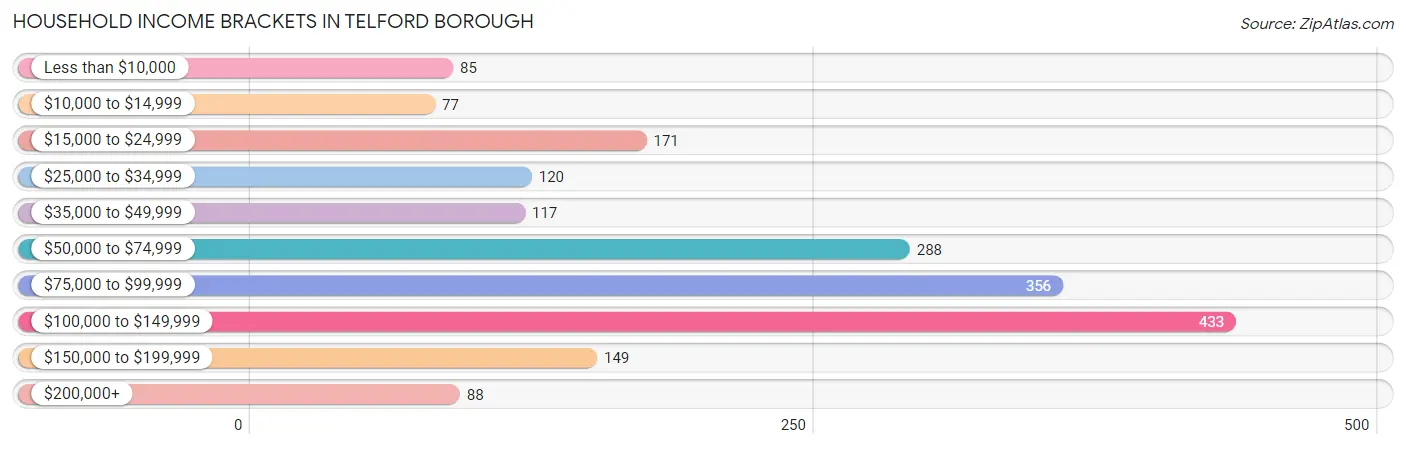
Household Income Brackets in Telford borough
With 433 households falling in the category, the $100,000 to $149,999 income range is the most frequent in Telford borough, accounting for 23.0% of all households. In contrast, only 77 households (4.1%) fall into the $10,000 to $14,999 income bracket, making it the least populous group.
| Income Bracket | # Households | % Households |
| Less than $10,000 | 85 | 4.5% |
| $10,000 to $14,999 | 77 | 4.1% |
| $15,000 to $24,999 | 171 | 9.1% |
| $25,000 to $34,999 | 120 | 6.4% |
| $35,000 to $49,999 | 117 | 6.2% |
| $50,000 to $74,999 | 288 | 15.3% |
| $75,000 to $99,999 | 356 | 18.9% |
| $100,000 to $149,999 | 433 | 23.0% |
| $150,000 to $199,999 | 149 | 7.9% |
| $200,000+ | 88 | 4.7% |
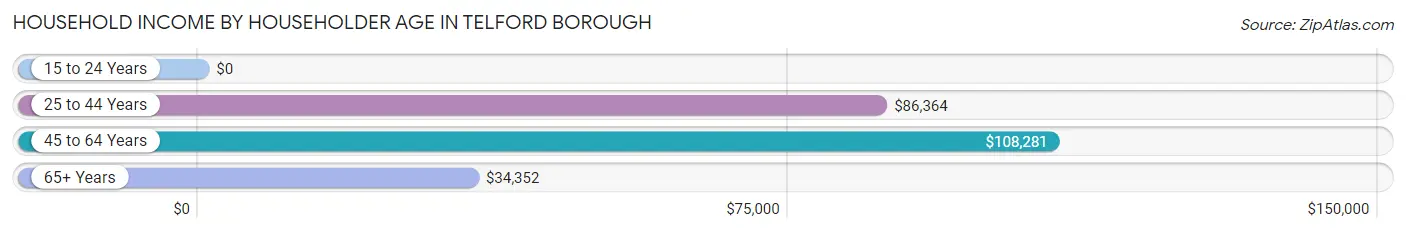
Household Income by Householder Age in Telford borough
The median household income in Telford borough is $77,092, with the highest median household income of $108,281 found in the 45 to 64 years age bracket for the primary householder. A total of 639 households (34.0%) fall into this category. Meanwhile, the 15 to 24 years age bracket for the primary householder has the lowest median household income of $0, with 47 households (2.5%) in this group.
| Income Bracket | # Households | Median Income |
| 15 to 24 Years | 47 (2.5%) | $0 |
| 25 to 44 Years | 566 (30.1%) | $86,364 |
| 45 to 64 Years | 639 (34.0%) | $108,281 |
| 65+ Years | 630 (33.5%) | $34,352 |
| Total | 1,882 (100.0%) | $77,092 |
Poverty in Telford borough
Income Below Poverty by Sex and Age in Telford borough
With 7.8% poverty level for males and 14.7% for females among the residents of Telford borough, 12 to 14 year old males and 18 to 24 year old females are the most vulnerable to poverty, with 25 males (39.7%) and 102 females (40.6%) in their respective age groups living below the poverty level.
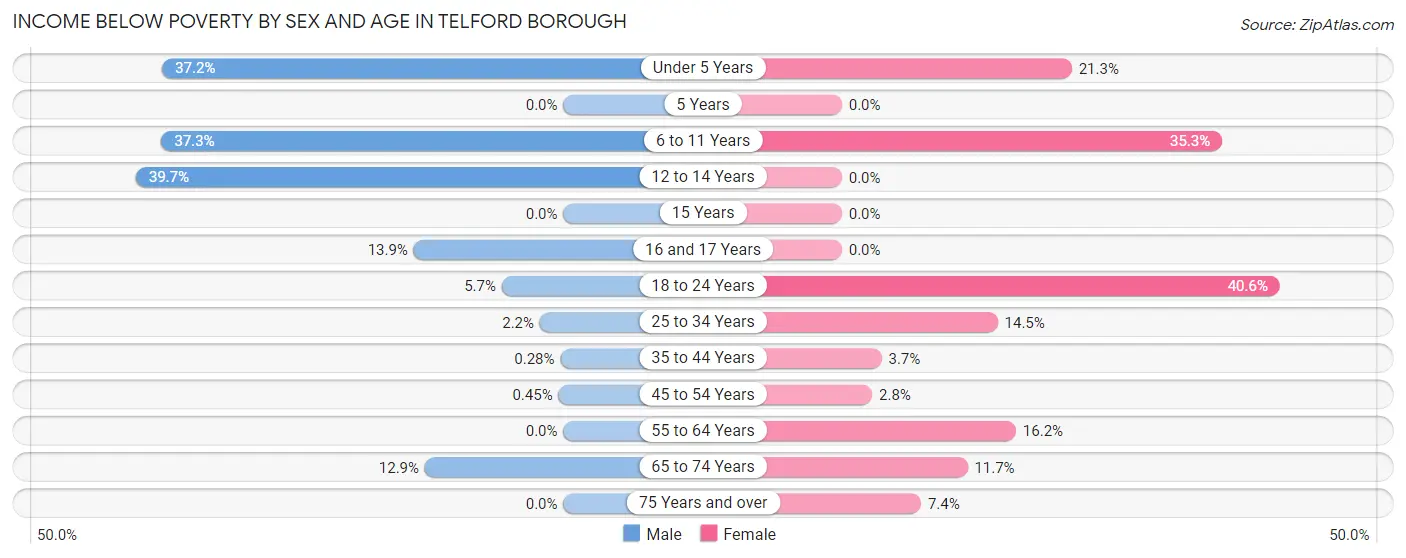
| Age Bracket | Male | Female |
| Under 5 Years | 51 (37.2%) | 35 (21.3%) |
| 5 Years | 0 (0.0%) | 0 (0.0%) |
| 6 to 11 Years | 50 (37.3%) | 66 (35.3%) |
| 12 to 14 Years | 25 (39.7%) | 0 (0.0%) |
| 15 Years | 0 (0.0%) | 0 (0.0%) |
| 16 and 17 Years | 10 (13.9%) | 0 (0.0%) |
| 18 to 24 Years | 8 (5.7%) | 102 (40.6%) |
| 25 to 34 Years | 7 (2.2%) | 48 (14.5%) |
| 35 to 44 Years | 1 (0.3%) | 11 (3.7%) |
| 45 to 54 Years | 1 (0.4%) | 5 (2.8%) |
| 55 to 64 Years | 0 (0.0%) | 53 (16.2%) |
| 65 to 74 Years | 23 (12.9%) | 19 (11.7%) |
| 75 Years and over | 0 (0.0%) | 23 (7.3%) |
| Total | 176 (7.8%) | 362 (14.7%) |
Income Above Poverty by Sex and Age in Telford borough
According to the poverty statistics in Telford borough, males aged 5 years and females aged 5 years are the age groups that are most secure financially, with 100.0% of males and 100.0% of females in these age groups living above the poverty line.
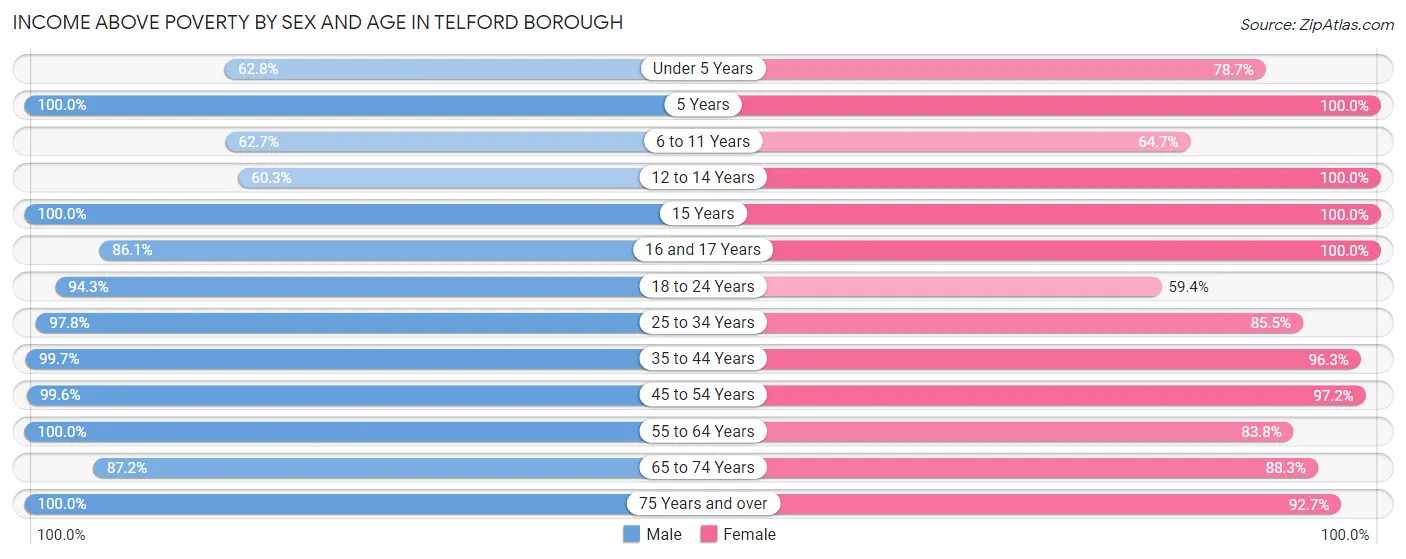
| Age Bracket | Male | Female |
| Under 5 Years | 86 (62.8%) | 129 (78.7%) |
| 5 Years | 30 (100.0%) | 83 (100.0%) |
| 6 to 11 Years | 84 (62.7%) | 121 (64.7%) |
| 12 to 14 Years | 38 (60.3%) | 57 (100.0%) |
| 15 Years | 20 (100.0%) | 53 (100.0%) |
| 16 and 17 Years | 62 (86.1%) | 51 (100.0%) |
| 18 to 24 Years | 132 (94.3%) | 149 (59.4%) |
| 25 to 34 Years | 314 (97.8%) | 284 (85.5%) |
| 35 to 44 Years | 353 (99.7%) | 287 (96.3%) |
| 45 to 54 Years | 222 (99.6%) | 173 (97.2%) |
| 55 to 64 Years | 402 (100.0%) | 275 (83.8%) |
| 65 to 74 Years | 156 (87.2%) | 144 (88.3%) |
| 75 Years and over | 191 (100.0%) | 290 (92.6%) |
| Total | 2,090 (92.2%) | 2,096 (85.3%) |
Income Below Poverty Among Married-Couple Families in Telford borough
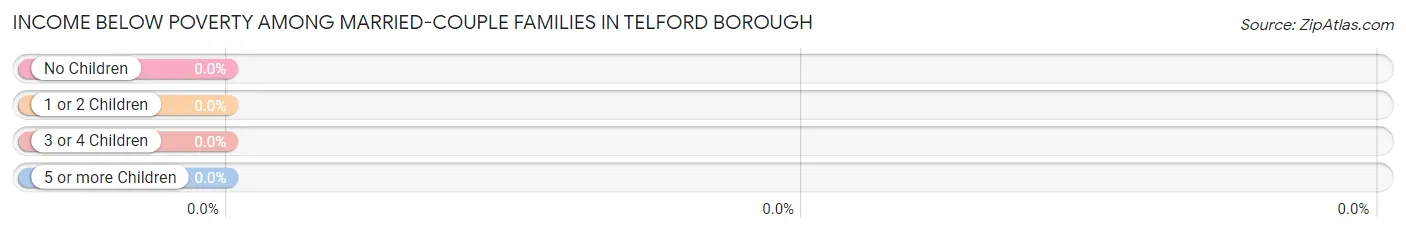
| Children | Above Poverty | Below Poverty |
| No Children | 532 (100.0%) | 0 (0.0%) |
| 1 or 2 Children | 258 (100.0%) | 0 (0.0%) |
| 3 or 4 Children | 102 (100.0%) | 0 (0.0%) |
| 5 or more Children | 0 (0.0%) | 0 (0.0%) |
| Total | 892 (100.0%) | 0 (0.0%) |
Income Below Poverty Among Single-Parent Households in Telford borough
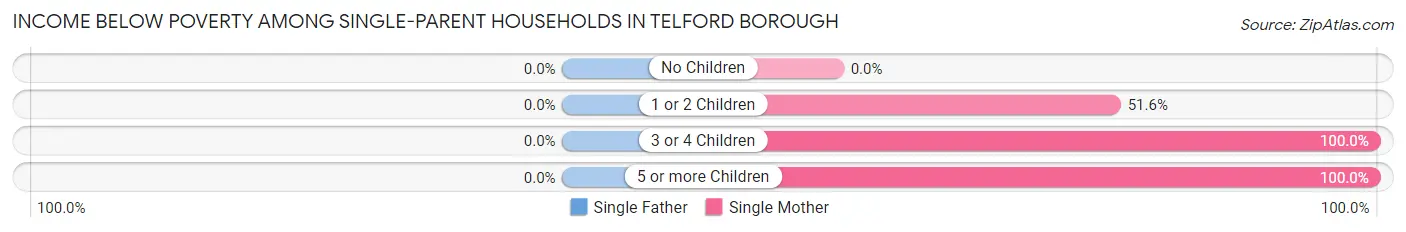
| Children | Single Father | Single Mother |
| No Children | 0 (0.0%) | 0 (0.0%) |
| 1 or 2 Children | 0 (0.0%) | 16 (51.6%) |
| 3 or 4 Children | 0 (0.0%) | 30 (100.0%) |
| 5 or more Children | 0 (0.0%) | 17 (100.0%) |
| Total | 0 (0.0%) | 63 (70.0%) |
Income Below Poverty Among Married-Couple vs Single-Parent Households in Telford borough
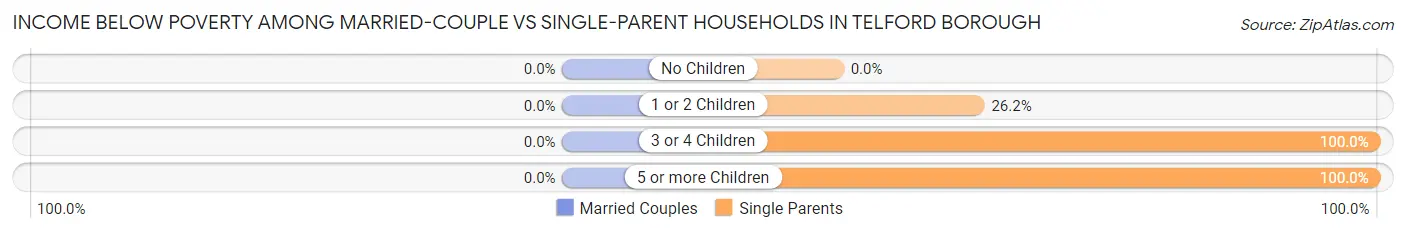
| Children | Married-Couple Families | Single-Parent Households |
| No Children | 0 (0.0%) | 0 (0.0%) |
| 1 or 2 Children | 0 (0.0%) | 16 (26.2%) |
| 3 or 4 Children | 0 (0.0%) | 30 (100.0%) |
| 5 or more Children | 0 (0.0%) | 17 (100.0%) |
| Total | 0 (0.0%) | 63 (40.4%) |
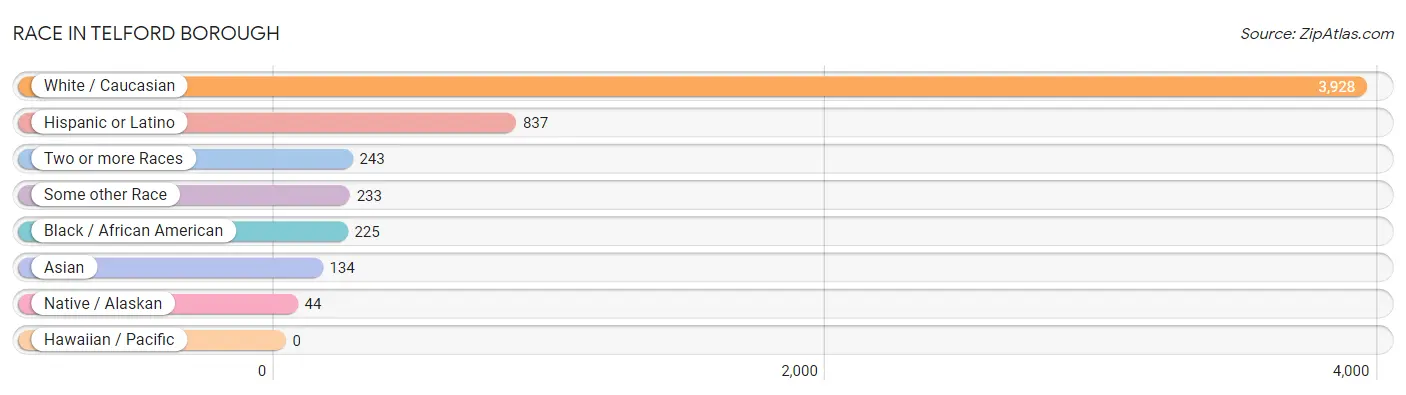
Race in Telford borough
The most populous races in Telford borough are White / Caucasian (3,928 | 81.7%), Hispanic or Latino (837 | 17.4%), and Two or more Races (243 | 5.1%).
| Race | # Population | % Population |
| Asian | 134 | 2.8% |
| Black / African American | 225 | 4.7% |
| Hawaiian / Pacific | 0 | 0.0% |
| Hispanic or Latino | 837 | 17.4% |
| Native / Alaskan | 44 | 0.9% |
| White / Caucasian | 3,928 | 81.7% |
| Two or more Races | 243 | 5.1% |
| Some other Race | 233 | 4.9% |
| Total | 4,807 | 100.0% |
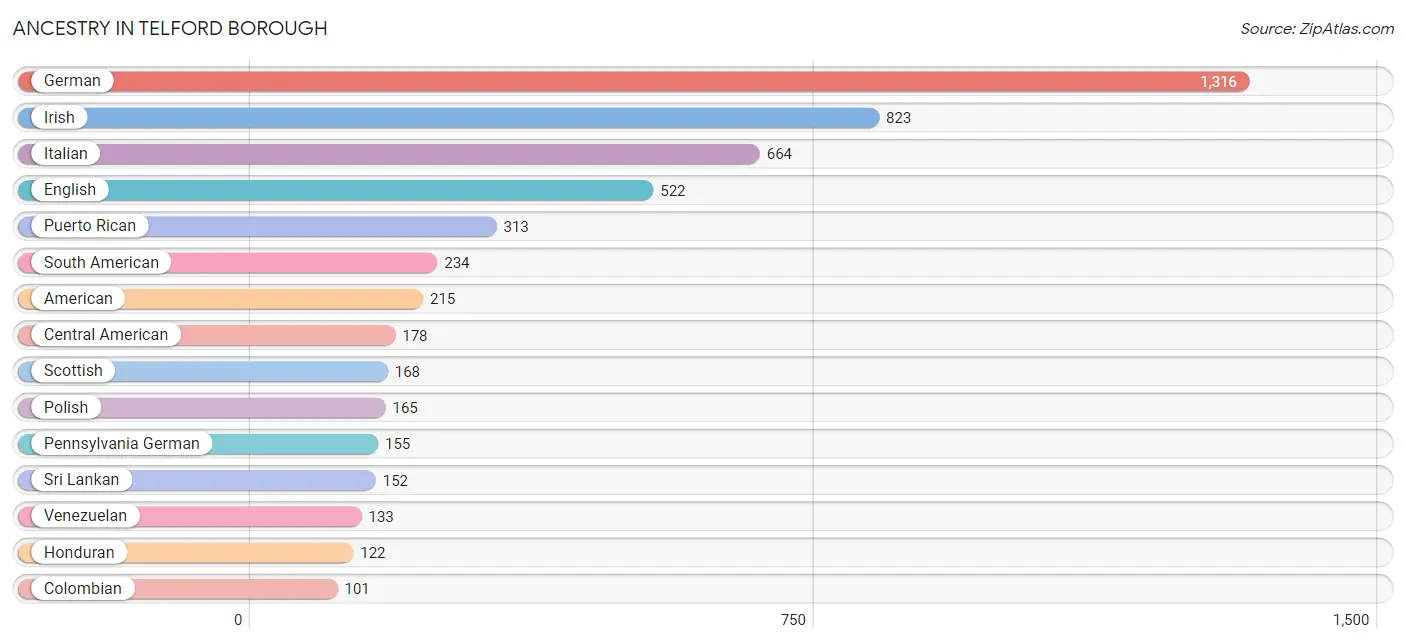
Ancestry in Telford borough
The most populous ancestries reported in Telford borough are German (1,316 | 27.4%), Irish (823 | 17.1%), Italian (664 | 13.8%), English (522 | 10.9%), and Puerto Rican (313 | 6.5%), together accounting for 75.7% of all Telford borough residents.
| Ancestry | # Population | % Population |
| American | 215 | 4.5% |
| Armenian | 40 | 0.8% |
| Austrian | 29 | 0.6% |
| Barbadian | 33 | 0.7% |
| British | 59 | 1.2% |
| Canadian | 47 | 1.0% |
| Central American | 178 | 3.7% |
| Central American Indian | 41 | 0.9% |
| Colombian | 101 | 2.1% |
| Cuban | 34 | 0.7% |
| Delaware | 3 | 0.1% |
| Dominican | 64 | 1.3% |
| Dutch | 73 | 1.5% |
| English | 522 | 10.9% |
| European | 20 | 0.4% |
| French | 93 | 1.9% |
| German | 1,316 | 27.4% |
| Greek | 42 | 0.9% |
| Guatemalan | 56 | 1.2% |
| Honduran | 122 | 2.5% |
| Hungarian | 35 | 0.7% |
| Irish | 823 | 17.1% |
| Italian | 664 | 13.8% |
| Lithuanian | 46 | 1.0% |
| Mexican | 14 | 0.3% |
| Norwegian | 7 | 0.2% |
| Pennsylvania German | 155 | 3.2% |
| Polish | 165 | 3.4% |
| Portuguese | 14 | 0.3% |
| Puerto Rican | 313 | 6.5% |
| Romanian | 77 | 1.6% |
| Russian | 48 | 1.0% |
| Scotch-Irish | 37 | 0.8% |
| Scottish | 168 | 3.5% |
| Slavic | 19 | 0.4% |
| Slovene | 7 | 0.2% |
| South American | 234 | 4.9% |
| Sri Lankan | 152 | 3.2% |
| Swedish | 22 | 0.5% |
| Swiss | 76 | 1.6% |
| Ukrainian | 36 | 0.7% |
| Venezuelan | 133 | 2.8% |
| Welsh | 38 | 0.8% | View All 43 Rows |
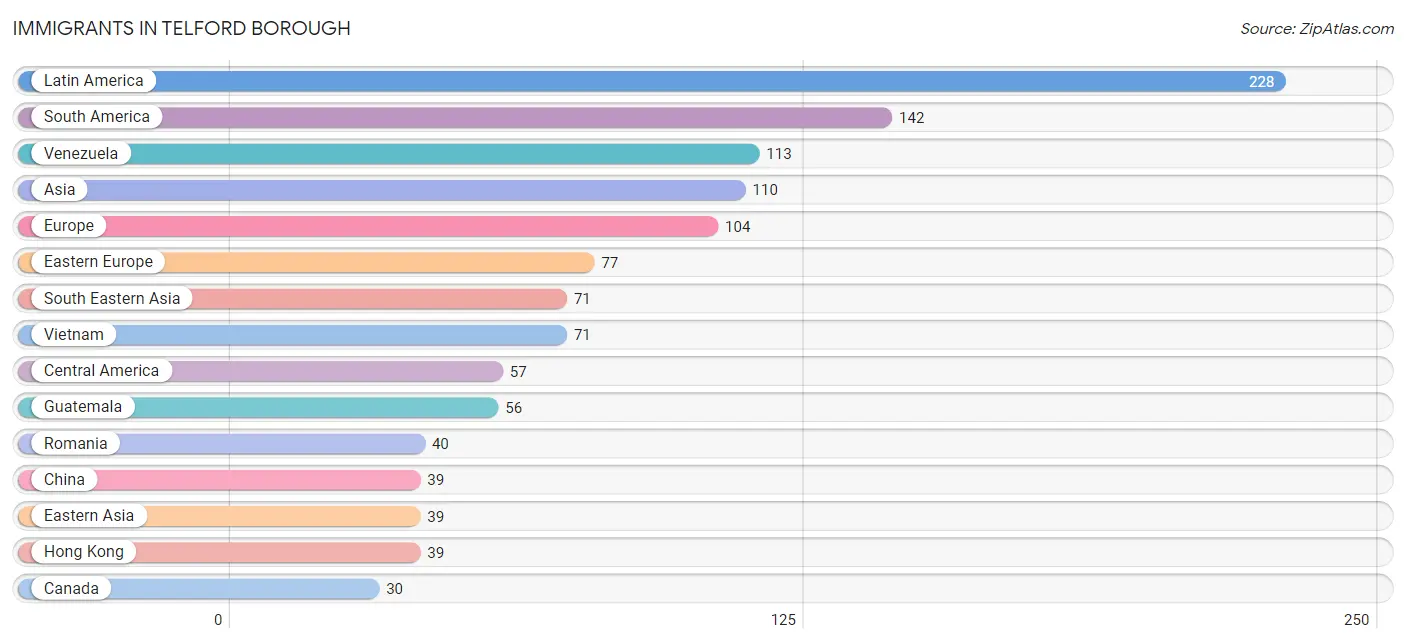
Immigrants in Telford borough
The most numerous immigrant groups reported in Telford borough came from Latin America (228 | 4.7%), South America (142 | 2.9%), Venezuela (113 | 2.4%), Asia (110 | 2.3%), and Europe (104 | 2.2%), together accounting for 14.5% of all Telford borough residents.
| Immigration Origin | # Population | % Population |
| Asia | 110 | 2.3% |
| Barbados | 14 | 0.3% |
| Canada | 30 | 0.6% |
| Caribbean | 29 | 0.6% |
| Central America | 57 | 1.2% |
| China | 39 | 0.8% |
| Colombia | 29 | 0.6% |
| Dominican Republic | 15 | 0.3% |
| Eastern Asia | 39 | 0.8% |
| Eastern Europe | 77 | 1.6% |
| Europe | 104 | 2.2% |
| Germany | 18 | 0.4% |
| Guatemala | 56 | 1.2% |
| Hong Kong | 39 | 0.8% |
| Latin America | 228 | 4.7% |
| Lithuania | 12 | 0.3% |
| Mexico | 1 | 0.0% |
| Northern Europe | 9 | 0.2% |
| Romania | 40 | 0.8% |
| Scotland | 9 | 0.2% |
| South America | 142 | 2.9% |
| South Eastern Asia | 71 | 1.5% |
| Ukraine | 13 | 0.3% |
| Venezuela | 113 | 2.4% |
| Vietnam | 71 | 1.5% |
| Western Europe | 18 | 0.4% | View All 26 Rows |
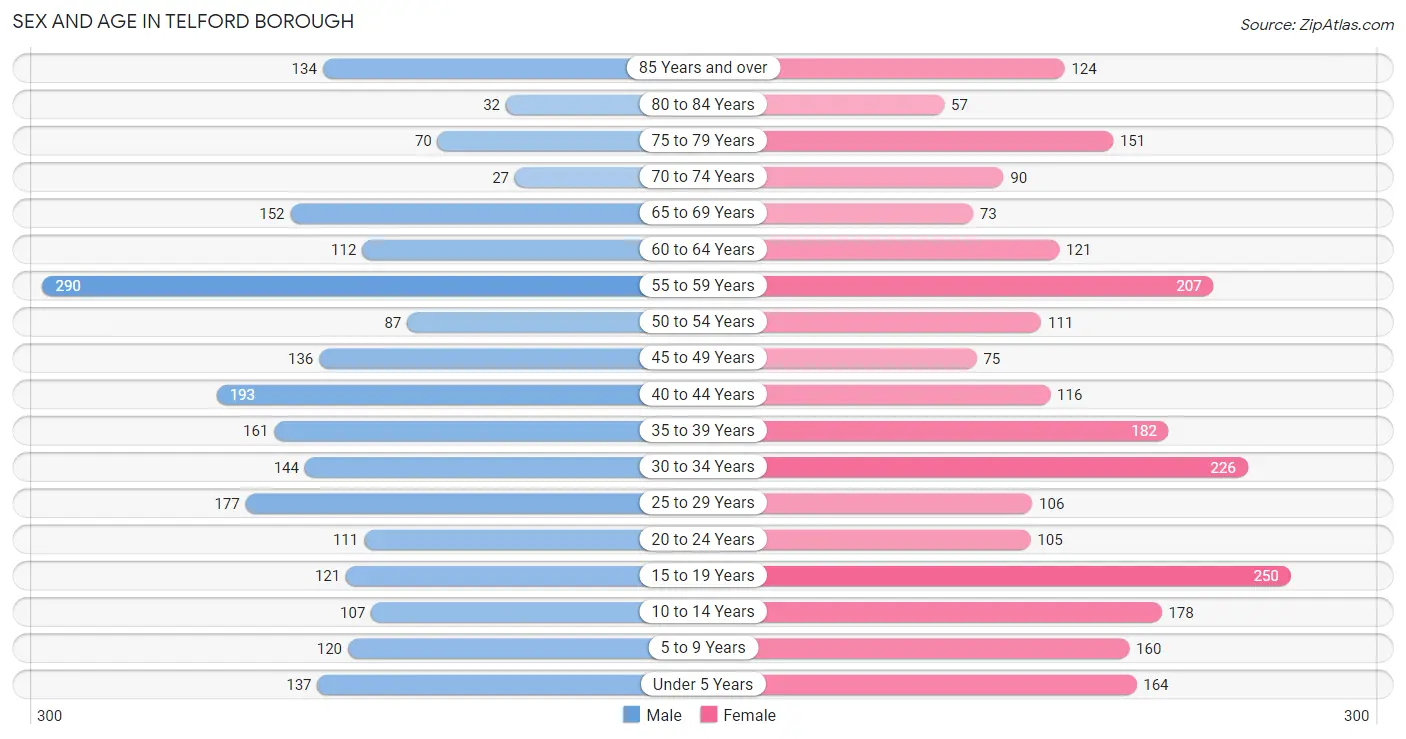
Sex and Age in Telford borough
Sex and Age in Telford borough
The most populous age groups in Telford borough are 55 to 59 Years (290 | 12.6%) for men and 15 to 19 Years (250 | 10.0%) for women.
| Age Bracket | Male | Female |
| Under 5 Years | 137 (5.9%) | 164 (6.6%) |
| 5 to 9 Years | 120 (5.2%) | 160 (6.4%) |
| 10 to 14 Years | 107 (4.6%) | 178 (7.1%) |
| 15 to 19 Years | 121 (5.2%) | 250 (10.0%) |
| 20 to 24 Years | 111 (4.8%) | 105 (4.2%) |
| 25 to 29 Years | 177 (7.7%) | 106 (4.3%) |
| 30 to 34 Years | 144 (6.2%) | 226 (9.0%) |
| 35 to 39 Years | 161 (7.0%) | 182 (7.3%) |
| 40 to 44 Years | 193 (8.4%) | 116 (4.6%) |
| 45 to 49 Years | 136 (5.9%) | 75 (3.0%) |
| 50 to 54 Years | 87 (3.8%) | 111 (4.4%) |
| 55 to 59 Years | 290 (12.6%) | 207 (8.3%) |
| 60 to 64 Years | 112 (4.9%) | 121 (4.9%) |
| 65 to 69 Years | 152 (6.6%) | 73 (2.9%) |
| 70 to 74 Years | 27 (1.2%) | 90 (3.6%) |
| 75 to 79 Years | 70 (3.0%) | 151 (6.0%) |
| 80 to 84 Years | 32 (1.4%) | 57 (2.3%) |
| 85 Years and over | 134 (5.8%) | 124 (5.0%) |
| Total | 2,311 (100.0%) | 2,496 (100.0%) |
Families and Households in Telford borough
Median Family Size in Telford borough
The median family size in Telford borough is 3.38 persons per family, with single female/mother families (90 | 8.6%) accounting for the largest median family size of 3.91 persons per family. On the other hand, single male/father families (66 | 6.3%) represent the smallest median family size with 3.00 persons per family.
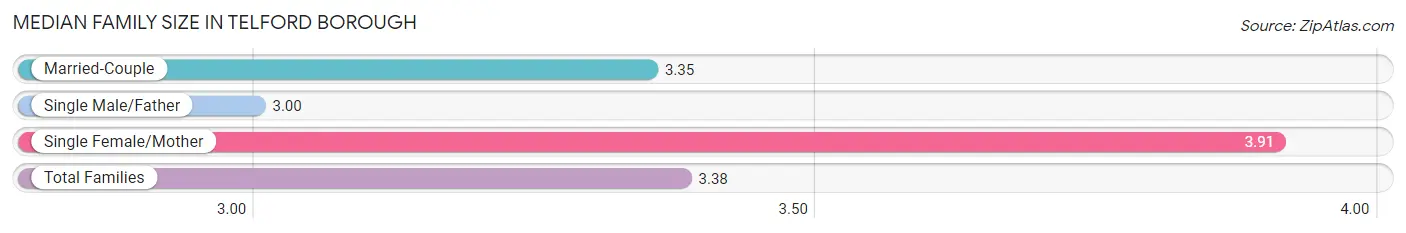
| Family Type | # Families | Family Size |
| Married-Couple | 892 (85.1%) | 3.35 |
| Single Male/Father | 66 (6.3%) | 3.00 |
| Single Female/Mother | 90 (8.6%) | 3.91 |
| Total Families | 1,048 (100.0%) | 3.38 |
Median Household Size in Telford borough
The median household size in Telford borough is 2.51 persons per household, with single female/mother households (90 | 4.8%) accounting for the largest median household size of 4.03 persons per household. non-family households (834 | 44.3%) represent the smallest median household size with 1.30 persons per household.
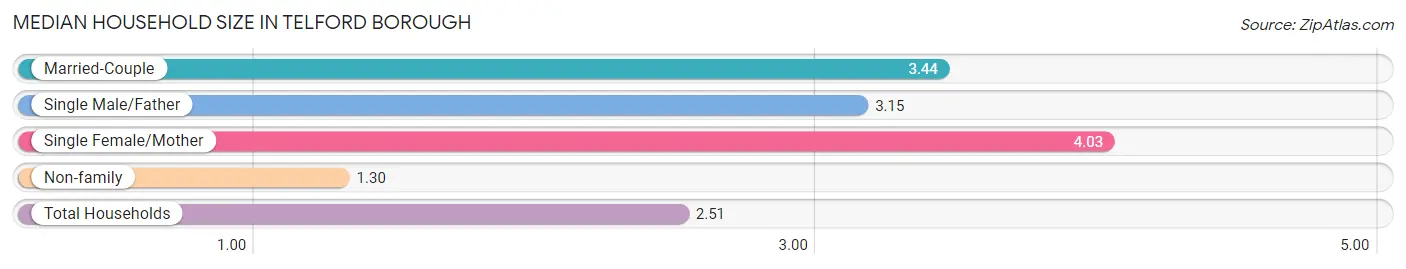
| Household Type | # Households | Household Size |
| Married-Couple | 892 (47.4%) | 3.44 |
| Single Male/Father | 66 (3.5%) | 3.15 |
| Single Female/Mother | 90 (4.8%) | 4.03 |
| Non-family | 834 (44.3%) | 1.30 |
| Total Households | 1,882 (100.0%) | 2.51 |
Household Size by Marriage Status in Telford borough
Out of a total of 1,882 households in Telford borough, 1,048 (55.7%) are family households, while 834 (44.3%) are nonfamily households. The most numerous type of family households are 2-person households, comprising 378, and the most common type of nonfamily households are 1-person households, comprising 630.
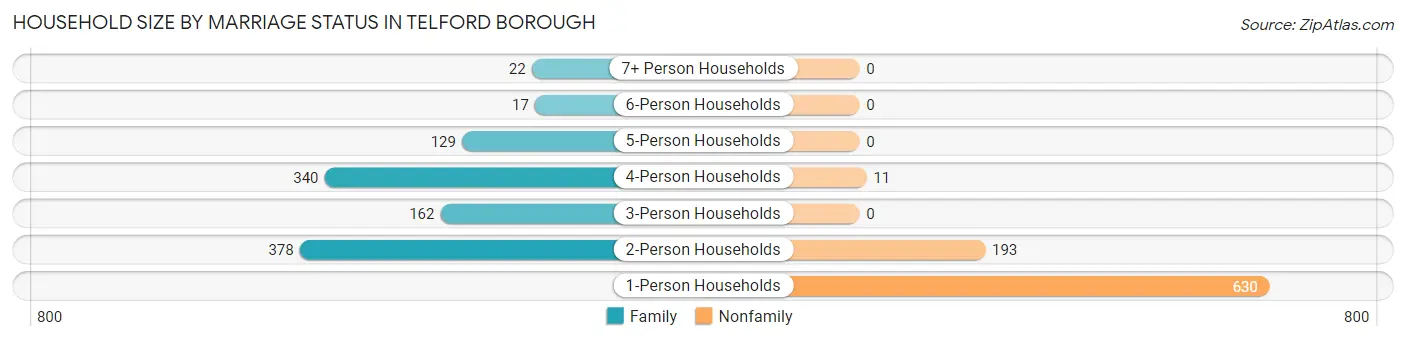
| Household Size | Family Households | Nonfamily Households |
| 1-Person Households | - | 630 (33.5%) |
| 2-Person Households | 378 (20.1%) | 193 (10.3%) |
| 3-Person Households | 162 (8.6%) | 0 (0.0%) |
| 4-Person Households | 340 (18.1%) | 11 (0.6%) |
| 5-Person Households | 129 (6.9%) | 0 (0.0%) |
| 6-Person Households | 17 (0.9%) | 0 (0.0%) |
| 7+ Person Households | 22 (1.2%) | 0 (0.0%) |
| Total | 1,048 (55.7%) | 834 (44.3%) |
Female Fertility in Telford borough
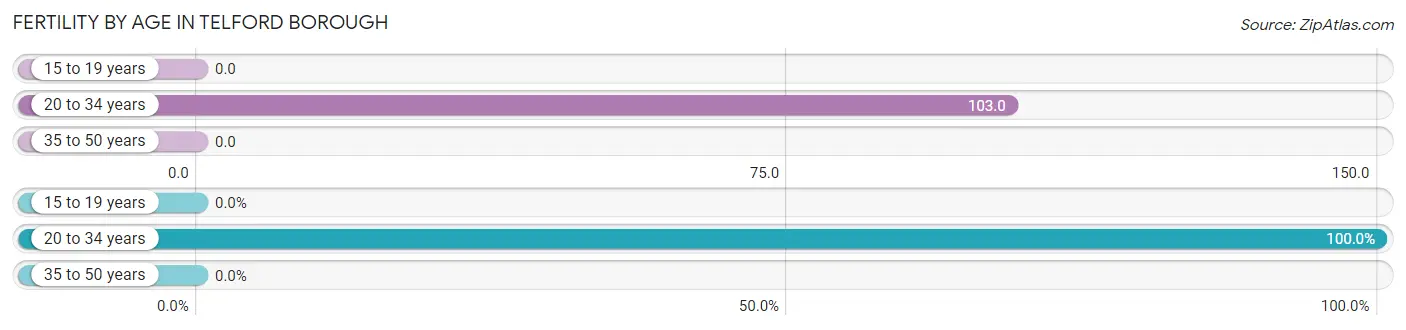
Fertility by Age in Telford borough
Average fertility rate in Telford borough is 42.0 births per 1,000 women. Women in the age bracket of 20 to 34 years have the highest fertility rate with 103.0 births per 1,000 women. Women in the age bracket of 20 to 34 years acount for 100.0% of all women with births.
| Age Bracket | Women with Births | Births / 1,000 Women |
| 15 to 19 years | 0 (0.0%) | 0.0 |
| 20 to 34 years | 45 (100.0%) | 103.0 |
| 35 to 50 years | 0 (0.0%) | 0.0 |
| Total | 45 (100.0%) | 42.0 |
Fertility by Age by Marriage Status in Telford borough
62.2% of women with births (45) in Telford borough are married. The highest percentage of unmarried women with births falls into 20 to 34 years age bracket with 37.8% of them unmarried at the time of birth, while the lowest percentage of unmarried women with births belong to 20 to 34 years age bracket with 37.8% of them unmarried.
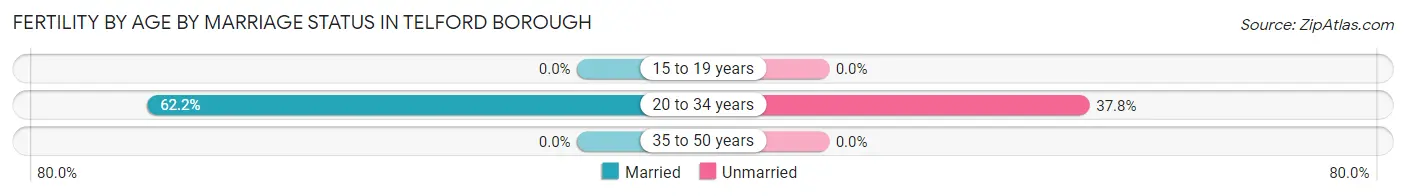
| Age Bracket | Married | Unmarried |
| 15 to 19 years | 0 (0.0%) | 0 (0.0%) |
| 20 to 34 years | 28 (62.2%) | 17 (37.8%) |
| 35 to 50 years | 0 (0.0%) | 0 (0.0%) |
| Total | 28 (62.2%) | 17 (37.8%) |
Fertility by Education in Telford borough
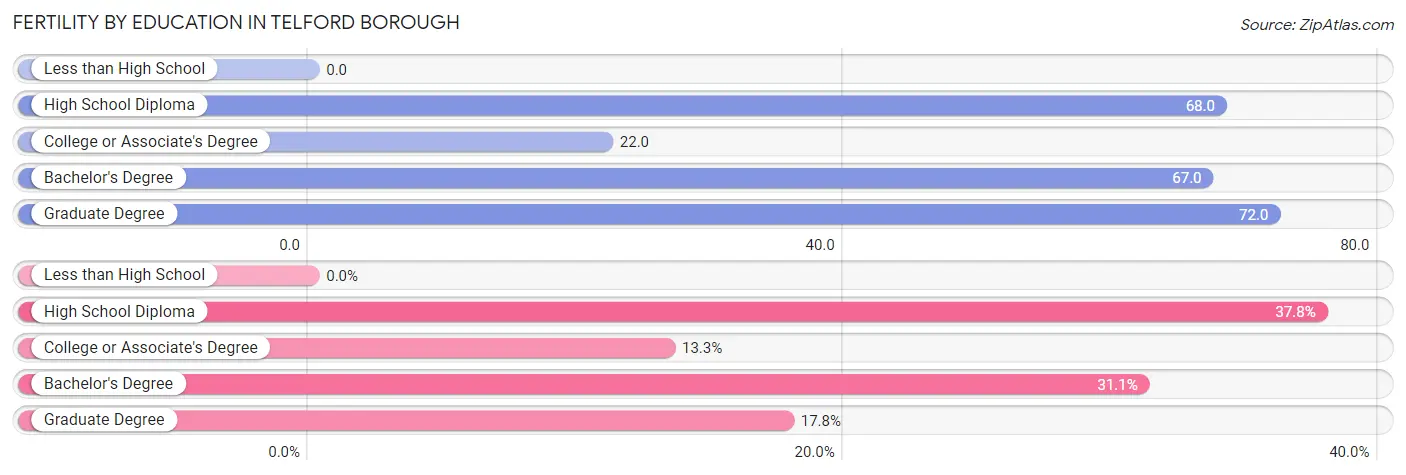
| Educational Attainment | Women with Births | Births / 1,000 Women |
| Less than High School | 0 (0.0%) | 0.0 |
| High School Diploma | 17 (37.8%) | 68.0 |
| College or Associate's Degree | 6 (13.3%) | 22.0 |
| Bachelor's Degree | 14 (31.1%) | 67.0 |
| Graduate Degree | 8 (17.8%) | 72.0 |
| Total | 45 (100.0%) | 42.0 |
Fertility by Education by Marriage Status in Telford borough
37.8% of women with births in Telford borough are unmarried. Women with the educational attainment of college or associate's degree are most likely to be married with 100.0% of them married at childbirth, while women with the educational attainment of high school diploma are least likely to be married with 100.0% of them unmarried at childbirth.
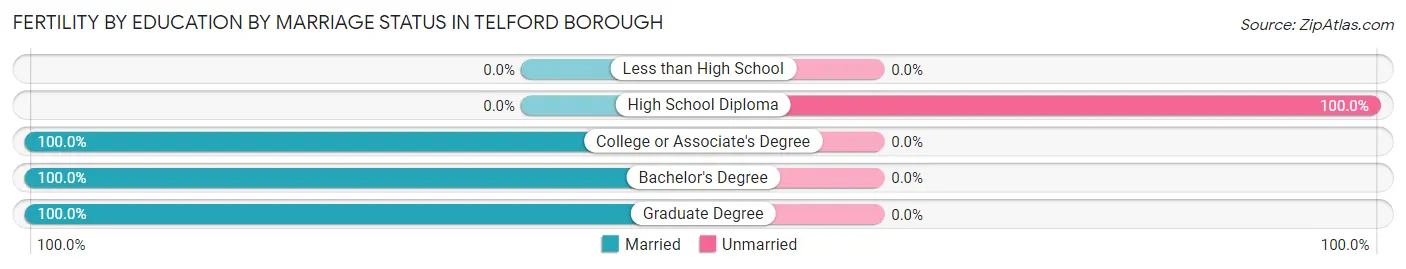
| Educational Attainment | Married | Unmarried |
| Less than High School | 0 (0.0%) | 0 (0.0%) |
| High School Diploma | 0 (0.0%) | 17 (100.0%) |
| College or Associate's Degree | 6 (100.0%) | 0 (0.0%) |
| Bachelor's Degree | 14 (100.0%) | 0 (0.0%) |
| Graduate Degree | 8 (100.0%) | 0 (0.0%) |
| Total | 28 (62.2%) | 17 (37.8%) |
Employment Characteristics in Telford borough
Employment by Class of Employer in Telford borough
Among the 2,343 employed individuals in Telford borough, private company employees (1,763 | 75.2%), not-for-profit organizations (205 | 8.7%), and local government employees (131 | 5.6%) make up the most common classes of employment.
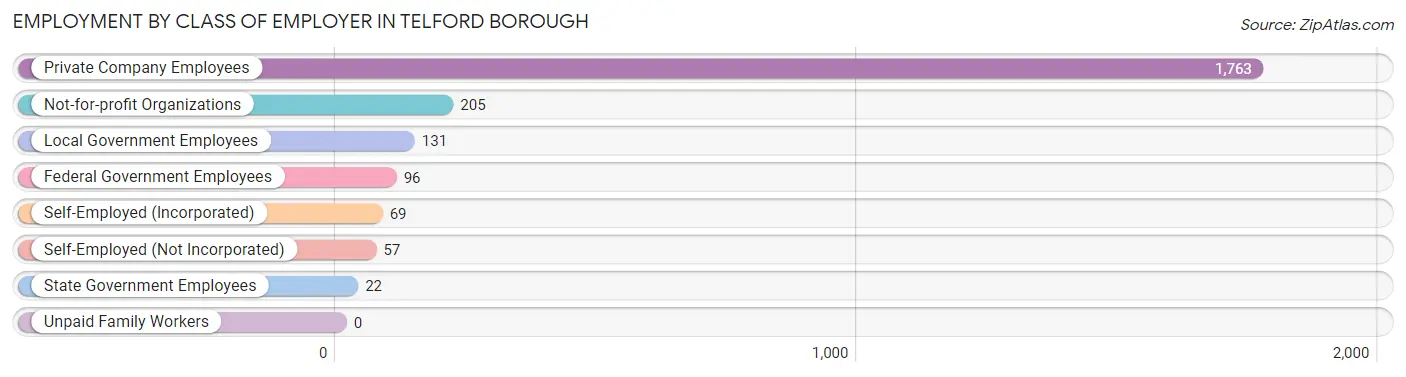
| Employer Class | # Employees | % Employees |
| Private Company Employees | 1,763 | 75.2% |
| Self-Employed (Incorporated) | 69 | 2.9% |
| Self-Employed (Not Incorporated) | 57 | 2.4% |
| Not-for-profit Organizations | 205 | 8.7% |
| Local Government Employees | 131 | 5.6% |
| State Government Employees | 22 | 0.9% |
| Federal Government Employees | 96 | 4.1% |
| Unpaid Family Workers | 0 | 0.0% |
| Total | 2,343 | 100.0% |
Employment Status by Age in Telford borough
According to the labor force statistics for Telford borough, out of the total population over 16 years of age (3,868), 65.7% or 2,541 individuals are in the labor force, with 5.2% or 132 of them unemployed. The age group with the highest labor force participation rate is 20 to 24 years, with 98.6% or 213 individuals in the labor force. Within the labor force, the 20 to 24 years age range has the highest percentage of unemployed individuals, with 34.7% or 74 of them being unemployed.
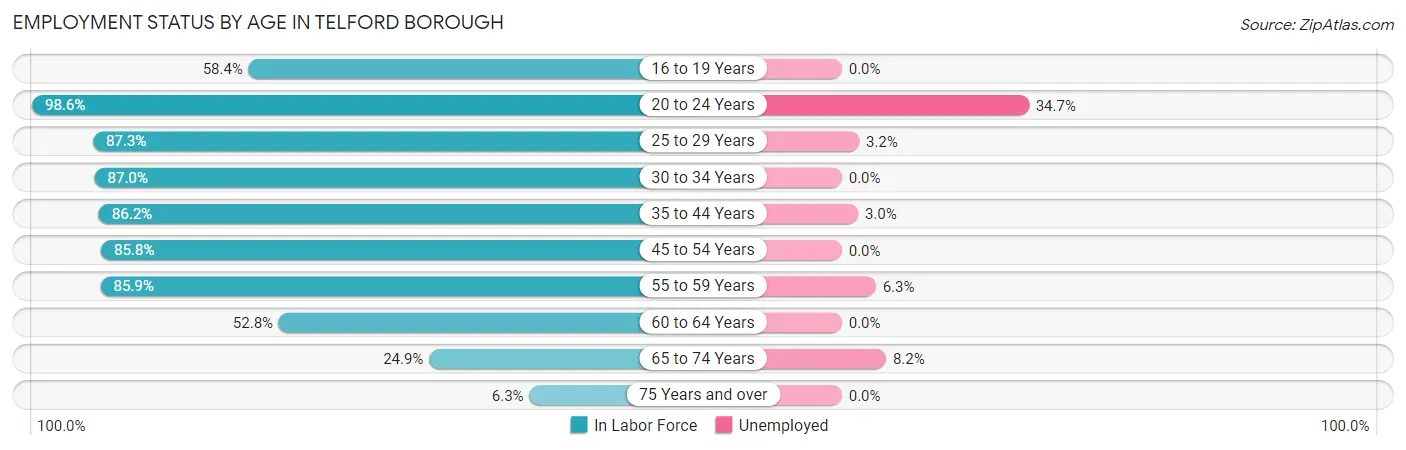
| Age Bracket | In Labor Force | Unemployed |
| 16 to 19 Years | 174 (58.4%) | 0 (0.0%) |
| 20 to 24 Years | 213 (98.6%) | 74 (34.7%) |
| 25 to 29 Years | 247 (87.3%) | 8 (3.2%) |
| 30 to 34 Years | 322 (87.0%) | 0 (0.0%) |
| 35 to 44 Years | 562 (86.2%) | 17 (3.0%) |
| 45 to 54 Years | 351 (85.8%) | 0 (0.0%) |
| 55 to 59 Years | 427 (85.9%) | 27 (6.3%) |
| 60 to 64 Years | 123 (52.8%) | 0 (0.0%) |
| 65 to 74 Years | 85 (24.9%) | 7 (8.2%) |
| 75 Years and over | 36 (6.3%) | 0 (0.0%) |
| Total | 2,541 (65.7%) | 132 (5.2%) |
Employment Status by Educational Attainment in Telford borough
According to labor force statistics for Telford borough, 83.1% of individuals (2,031) out of the total population between 25 and 64 years of age (2,444) are in the labor force, with 2.6% or 53 of them being unemployed. The group with the highest labor force participation rate are those with the educational attainment of bachelor's degree or higher, with 94.0% or 612 individuals in the labor force. Within the labor force, individuals with bachelor's degree or higher education have the highest percentage of unemployment, with 4.4% or 27 of them being unemployed.
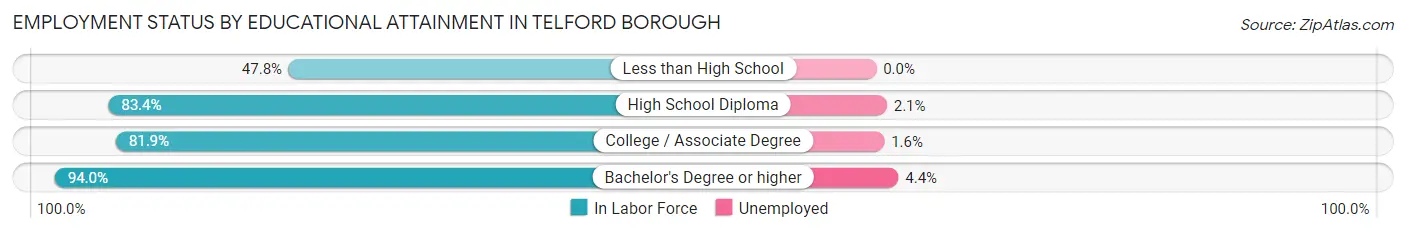
| Educational Attainment | In Labor Force | Unemployed |
| Less than High School | 85 (47.8%) | 0 (0.0%) |
| High School Diploma | 721 (83.4%) | 18 (2.1%) |
| College / Associate Degree | 614 (81.9%) | 12 (1.6%) |
| Bachelor's Degree or higher | 612 (94.0%) | 29 (4.4%) |
| Total | 2,031 (83.1%) | 64 (2.6%) |
Employment Occupations by Sex in Telford borough
Management, Business, Science and Arts Occupations
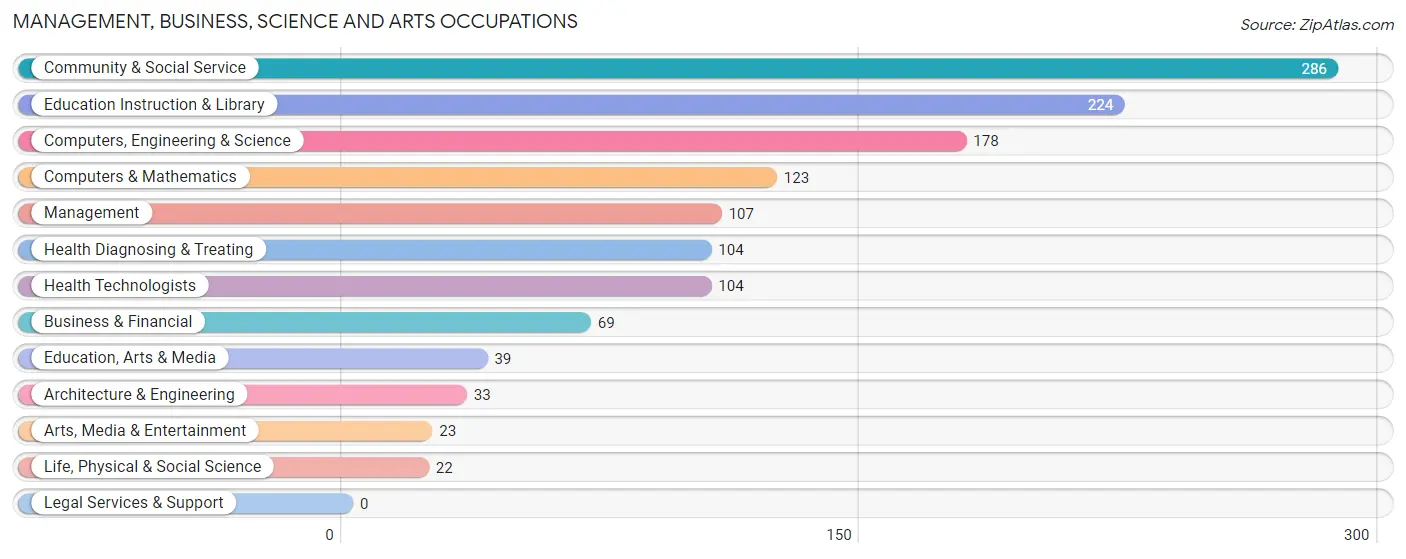
The most common Management, Business, Science and Arts occupations in Telford borough are Community & Social Service (286 | 11.9%), Education Instruction & Library (224 | 9.3%), Computers, Engineering & Science (178 | 7.4%), Computers & Mathematics (123 | 5.1%), and Management (107 | 4.4%).
Management, Business, Science and Arts Occupations by Sex
Within the Management, Business, Science and Arts occupations in Telford borough, the most male-oriented occupations are Architecture & Engineering (100.0%), Life, Physical & Social Science (100.0%), and Computers, Engineering & Science (92.1%), while the most female-oriented occupations are Arts, Media & Entertainment (100.0%), Community & Social Service (85.0%), and Education Instruction & Library (83.9%).
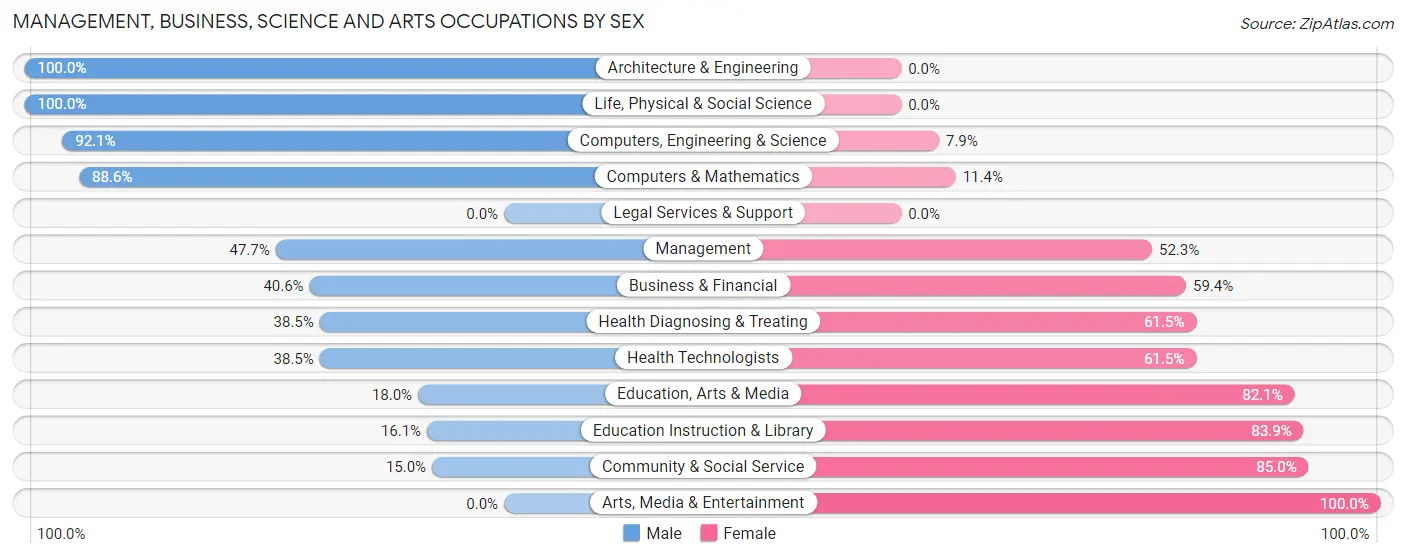
| Occupation | Male | Female |
| Management | 51 (47.7%) | 56 (52.3%) |
| Business & Financial | 28 (40.6%) | 41 (59.4%) |
| Computers, Engineering & Science | 164 (92.1%) | 14 (7.9%) |
| Computers & Mathematics | 109 (88.6%) | 14 (11.4%) |
| Architecture & Engineering | 33 (100.0%) | 0 (0.0%) |
| Life, Physical & Social Science | 22 (100.0%) | 0 (0.0%) |
| Community & Social Service | 43 (15.0%) | 243 (85.0%) |
| Education, Arts & Media | 7 (17.9%) | 32 (82.1%) |
| Legal Services & Support | 0 (0.0%) | 0 (0.0%) |
| Education Instruction & Library | 36 (16.1%) | 188 (83.9%) |
| Arts, Media & Entertainment | 0 (0.0%) | 23 (100.0%) |
| Health Diagnosing & Treating | 40 (38.5%) | 64 (61.5%) |
| Health Technologists | 40 (38.5%) | 64 (61.5%) |
| Total (Category) | 326 (43.8%) | 418 (56.2%) |
| Total (Overall) | 1,292 (53.7%) | 1,115 (46.3%) |
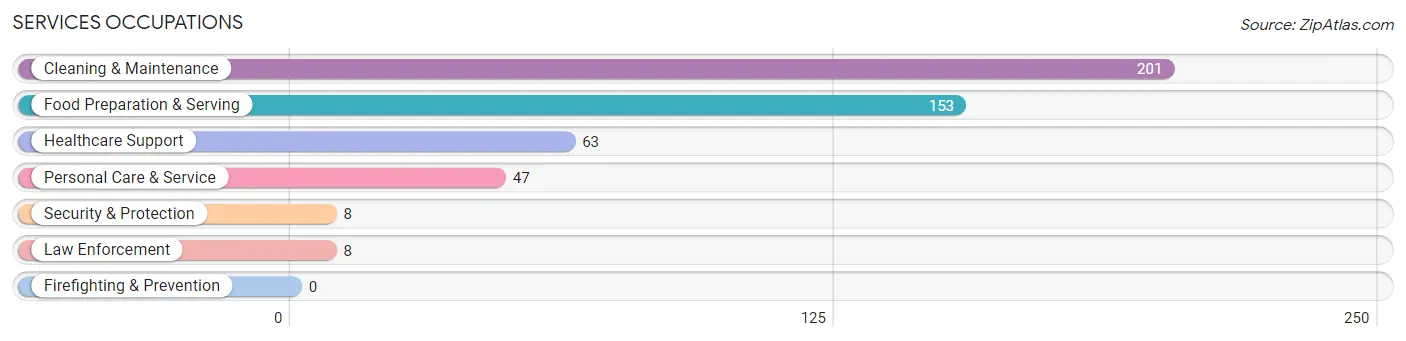
Services Occupations
The most common Services occupations in Telford borough are Cleaning & Maintenance (201 | 8.4%), Food Preparation & Serving (153 | 6.4%), Healthcare Support (63 | 2.6%), Personal Care & Service (47 | 1.9%), and Security & Protection (8 | 0.3%).
Services Occupations by Sex
Within the Services occupations in Telford borough, the most male-oriented occupations are Security & Protection (100.0%), Law Enforcement (100.0%), and Cleaning & Maintenance (88.6%), while the most female-oriented occupations are Healthcare Support (100.0%), Personal Care & Service (97.9%), and Food Preparation & Serving (37.2%).
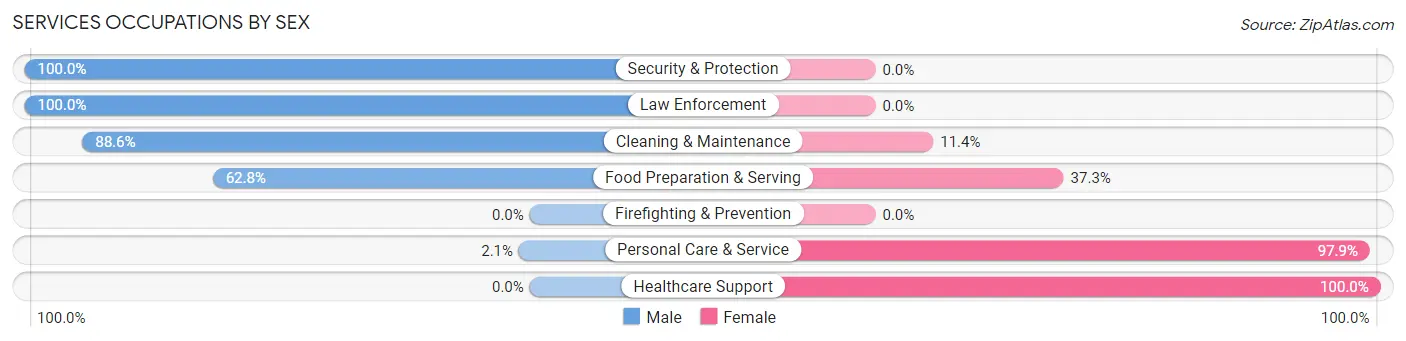
| Occupation | Male | Female |
| Healthcare Support | 0 (0.0%) | 63 (100.0%) |
| Security & Protection | 8 (100.0%) | 0 (0.0%) |
| Firefighting & Prevention | 0 (0.0%) | 0 (0.0%) |
| Law Enforcement | 8 (100.0%) | 0 (0.0%) |
| Food Preparation & Serving | 96 (62.7%) | 57 (37.2%) |
| Cleaning & Maintenance | 178 (88.6%) | 23 (11.4%) |
| Personal Care & Service | 1 (2.1%) | 46 (97.9%) |
| Total (Category) | 283 (60.0%) | 189 (40.0%) |
| Total (Overall) | 1,292 (53.7%) | 1,115 (46.3%) |
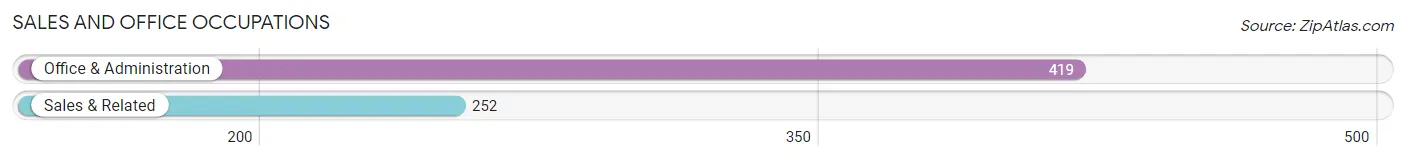
Sales and Office Occupations
The most common Sales and Office occupations in Telford borough are Office & Administration (419 | 17.4%), and Sales & Related (252 | 10.5%).
Sales and Office Occupations by Sex
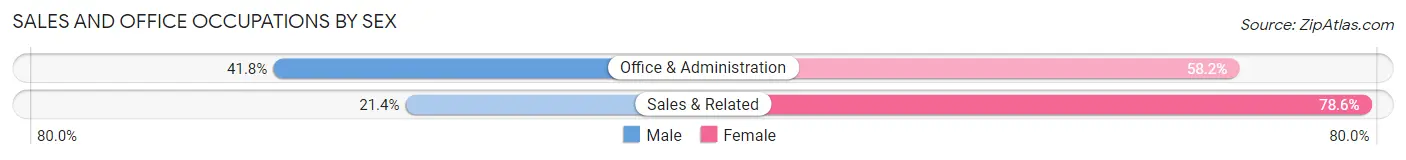
| Occupation | Male | Female |
| Sales & Related | 54 (21.4%) | 198 (78.6%) |
| Office & Administration | 175 (41.8%) | 244 (58.2%) |
| Total (Category) | 229 (34.1%) | 442 (65.9%) |
| Total (Overall) | 1,292 (53.7%) | 1,115 (46.3%) |
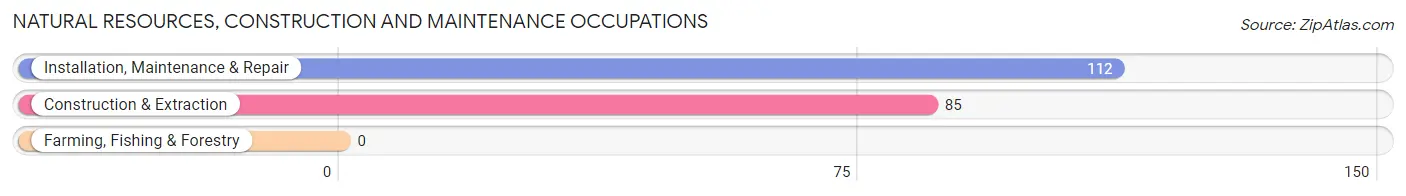
Natural Resources, Construction and Maintenance Occupations
The most common Natural Resources, Construction and Maintenance occupations in Telford borough are Installation, Maintenance & Repair (112 | 4.6%), and Construction & Extraction (85 | 3.5%).
Natural Resources, Construction and Maintenance Occupations by Sex
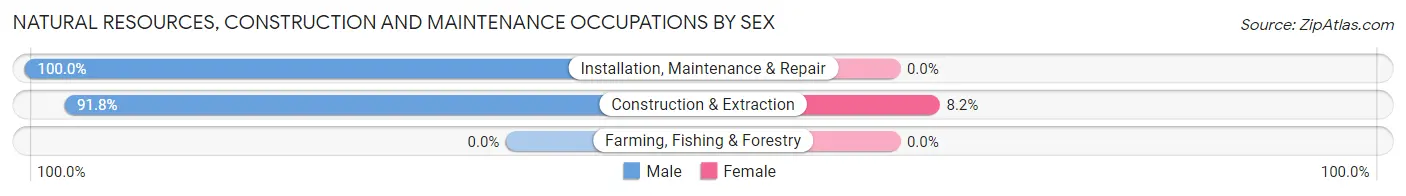
| Occupation | Male | Female |
| Farming, Fishing & Forestry | 0 (0.0%) | 0 (0.0%) |
| Construction & Extraction | 78 (91.8%) | 7 (8.2%) |
| Installation, Maintenance & Repair | 112 (100.0%) | 0 (0.0%) |
| Total (Category) | 190 (96.5%) | 7 (3.5%) |
| Total (Overall) | 1,292 (53.7%) | 1,115 (46.3%) |
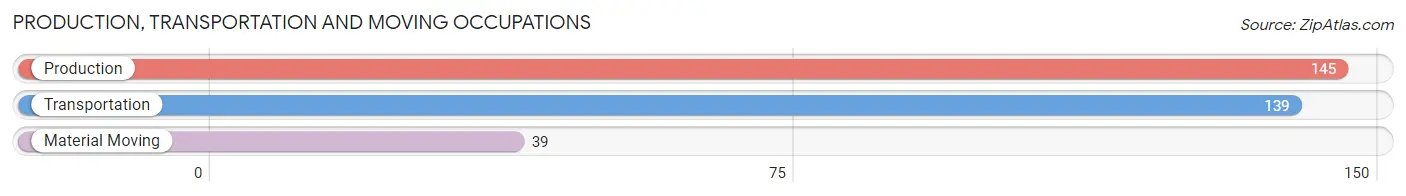
Production, Transportation and Moving Occupations
The most common Production, Transportation and Moving occupations in Telford borough are Production (145 | 6.0%), Transportation (139 | 5.8%), and Material Moving (39 | 1.6%).
Production, Transportation and Moving Occupations by Sex
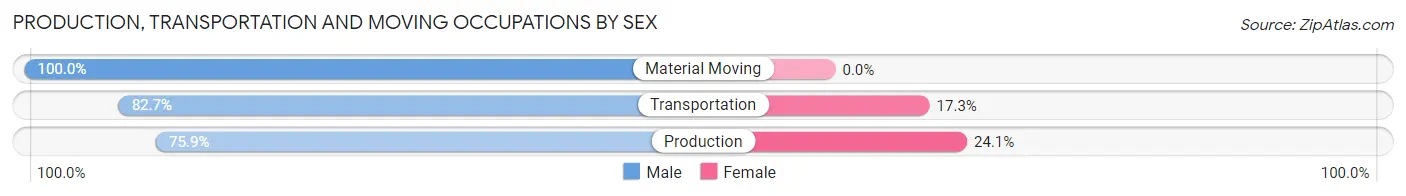
| Occupation | Male | Female |
| Production | 110 (75.9%) | 35 (24.1%) |
| Transportation | 115 (82.7%) | 24 (17.3%) |
| Material Moving | 39 (100.0%) | 0 (0.0%) |
| Total (Category) | 264 (81.7%) | 59 (18.3%) |
| Total (Overall) | 1,292 (53.7%) | 1,115 (46.3%) |
Employment Industries by Sex in Telford borough
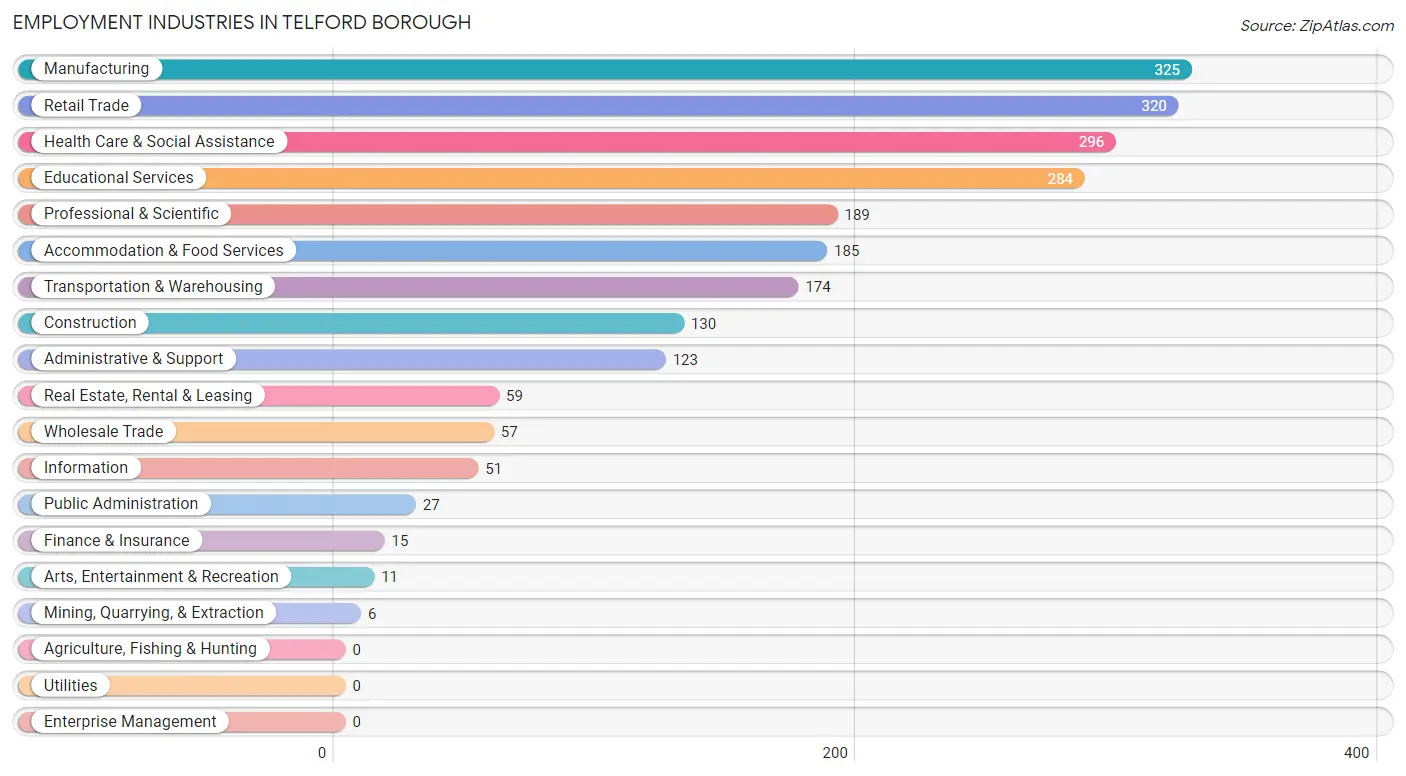
Employment Industries in Telford borough
The major employment industries in Telford borough include Manufacturing (325 | 13.5%), Retail Trade (320 | 13.3%), Health Care & Social Assistance (296 | 12.3%), Educational Services (284 | 11.8%), and Professional & Scientific (189 | 7.9%).
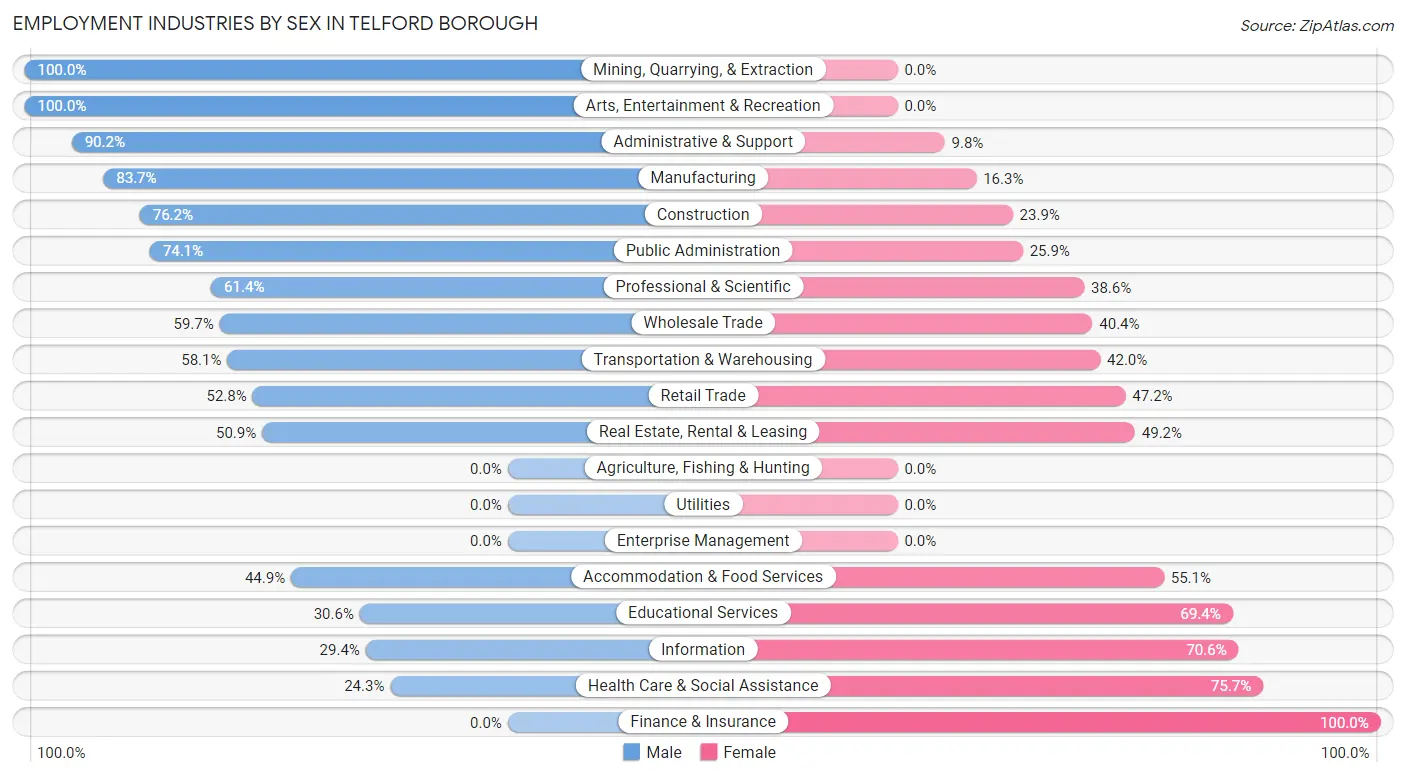
Employment Industries by Sex in Telford borough
The Telford borough industries that see more men than women are Mining, Quarrying, & Extraction (100.0%), Arts, Entertainment & Recreation (100.0%), and Administrative & Support (90.2%), whereas the industries that tend to have a higher number of women are Finance & Insurance (100.0%), Health Care & Social Assistance (75.7%), and Information (70.6%).
| Industry | Male | Female |
| Agriculture, Fishing & Hunting | 0 (0.0%) | 0 (0.0%) |
| Mining, Quarrying, & Extraction | 6 (100.0%) | 0 (0.0%) |
| Construction | 99 (76.1%) | 31 (23.8%) |
| Manufacturing | 272 (83.7%) | 53 (16.3%) |
| Wholesale Trade | 34 (59.7%) | 23 (40.4%) |
| Retail Trade | 169 (52.8%) | 151 (47.2%) |
| Transportation & Warehousing | 101 (58.1%) | 73 (41.9%) |
| Utilities | 0 (0.0%) | 0 (0.0%) |
| Information | 15 (29.4%) | 36 (70.6%) |
| Finance & Insurance | 0 (0.0%) | 15 (100.0%) |
| Real Estate, Rental & Leasing | 30 (50.8%) | 29 (49.1%) |
| Professional & Scientific | 116 (61.4%) | 73 (38.6%) |
| Enterprise Management | 0 (0.0%) | 0 (0.0%) |
| Administrative & Support | 111 (90.2%) | 12 (9.8%) |
| Educational Services | 87 (30.6%) | 197 (69.4%) |
| Health Care & Social Assistance | 72 (24.3%) | 224 (75.7%) |
| Arts, Entertainment & Recreation | 11 (100.0%) | 0 (0.0%) |
| Accommodation & Food Services | 83 (44.9%) | 102 (55.1%) |
| Public Administration | 20 (74.1%) | 7 (25.9%) |
| Total | 1,292 (53.7%) | 1,115 (46.3%) |
Education in Telford borough
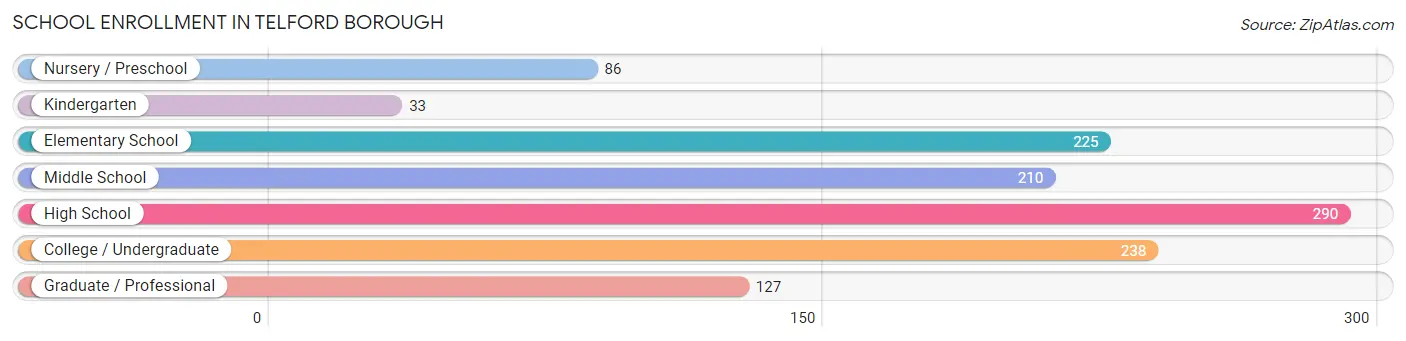
School Enrollment in Telford borough
The most common levels of schooling among the 1,209 students in Telford borough are high school (290 | 24.0%), college / undergraduate (238 | 19.7%), and elementary school (225 | 18.6%).
| School Level | # Students | % Students |
| Nursery / Preschool | 86 | 7.1% |
| Kindergarten | 33 | 2.7% |
| Elementary School | 225 | 18.6% |
| Middle School | 210 | 17.4% |
| High School | 290 | 24.0% |
| College / Undergraduate | 238 | 19.7% |
| Graduate / Professional | 127 | 10.5% |
| Total | 1,209 | 100.0% |
School Enrollment by Age by Funding Source in Telford borough
Out of a total of 1,209 students who are enrolled in schools in Telford borough, 192 (15.9%) attend a private institution, while the remaining 1,017 (84.1%) are enrolled in public schools. The age group of 3 to 4 year olds has the highest likelihood of being enrolled in private schools, with 37 (100.0% in the age bracket) enrolled. Conversely, the age group of 15 to 17 year olds has the lowest likelihood of being enrolled in a private school, with 196 (100.0% in the age bracket) attending a public institution.
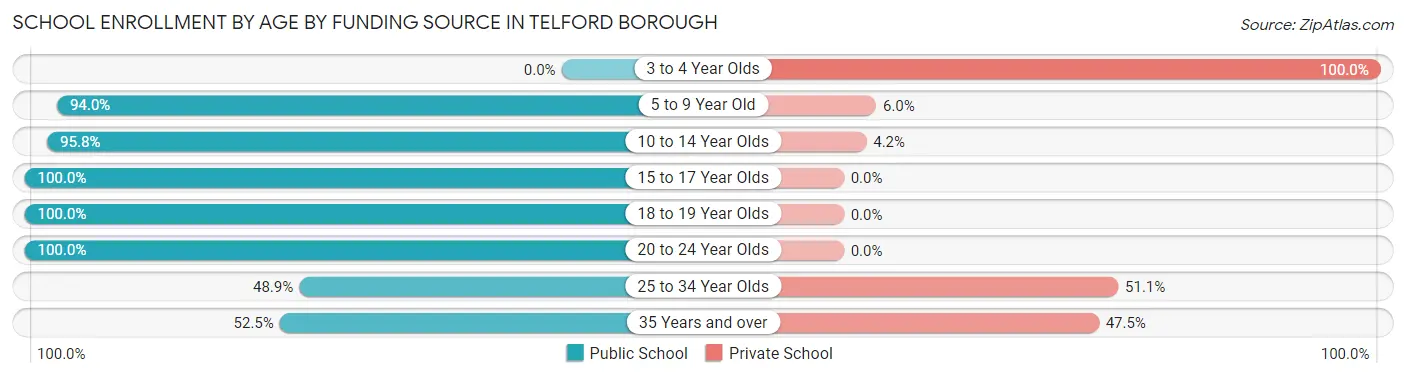
| Age Bracket | Public School | Private School |
| 3 to 4 Year Olds | 0 (0.0%) | 37 (100.0%) |
| 5 to 9 Year Old | 218 (94.0%) | 14 (6.0%) |
| 10 to 14 Year Olds | 273 (95.8%) | 12 (4.2%) |
| 15 to 17 Year Olds | 196 (100.0%) | 0 (0.0%) |
| 18 to 19 Year Olds | 134 (100.0%) | 0 (0.0%) |
| 20 to 24 Year Olds | 67 (100.0%) | 0 (0.0%) |
| 25 to 34 Year Olds | 87 (48.9%) | 91 (51.1%) |
| 35 Years and over | 42 (52.5%) | 38 (47.5%) |
| Total | 1,017 (84.1%) | 192 (15.9%) |
Educational Attainment by Field of Study in Telford borough
Education (203 | 23.7%), business (113 | 13.2%), science & technology (104 | 12.1%), bio, nature & agricultural (83 | 9.7%), and engineering (81 | 9.5%) are the most common fields of study among 857 individuals in Telford borough who have obtained a bachelor's degree or higher.
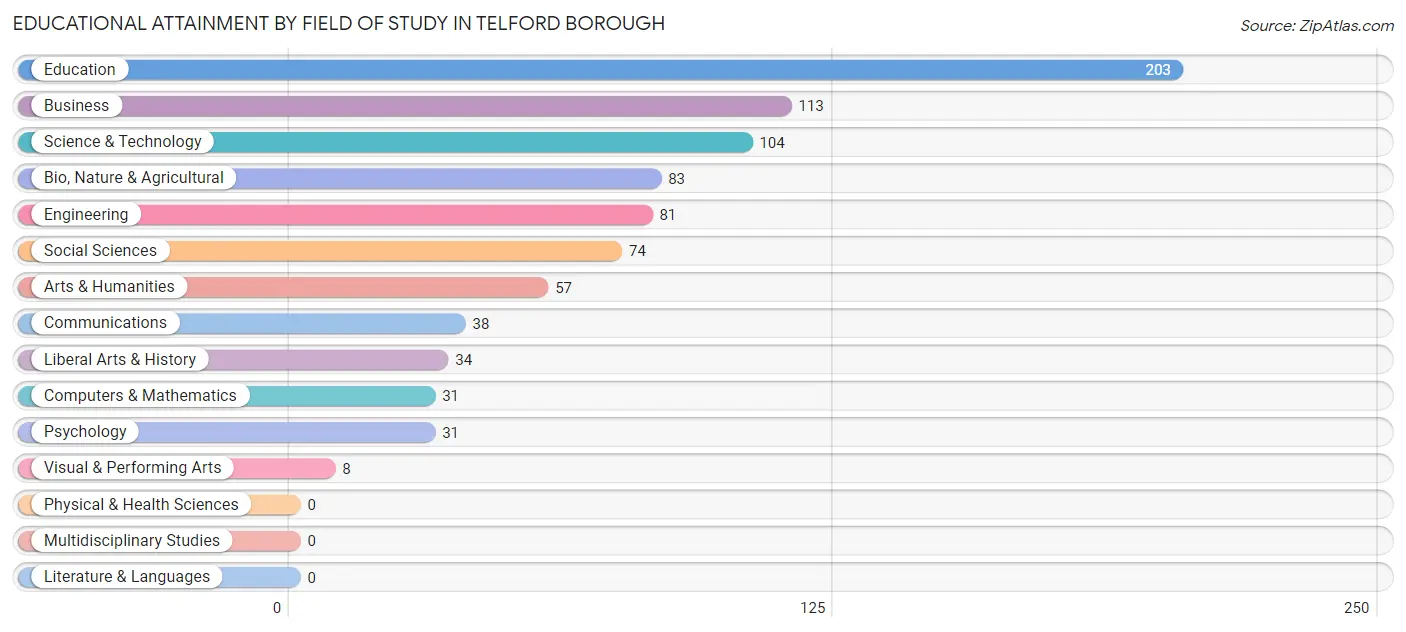
| Field of Study | # Graduates | % Graduates |
| Computers & Mathematics | 31 | 3.6% |
| Bio, Nature & Agricultural | 83 | 9.7% |
| Physical & Health Sciences | 0 | 0.0% |
| Psychology | 31 | 3.6% |
| Social Sciences | 74 | 8.6% |
| Engineering | 81 | 9.5% |
| Multidisciplinary Studies | 0 | 0.0% |
| Science & Technology | 104 | 12.1% |
| Business | 113 | 13.2% |
| Education | 203 | 23.7% |
| Literature & Languages | 0 | 0.0% |
| Liberal Arts & History | 34 | 4.0% |
| Visual & Performing Arts | 8 | 0.9% |
| Communications | 38 | 4.4% |
| Arts & Humanities | 57 | 6.7% |
| Total | 857 | 100.0% |
Transportation & Commute in Telford borough
Vehicle Availability by Sex in Telford borough
The most prevalent vehicle ownership categories in Telford borough are males with 2 vehicles (605, accounting for 47.8%) and females with 2 vehicles (544, making up 56.3%).
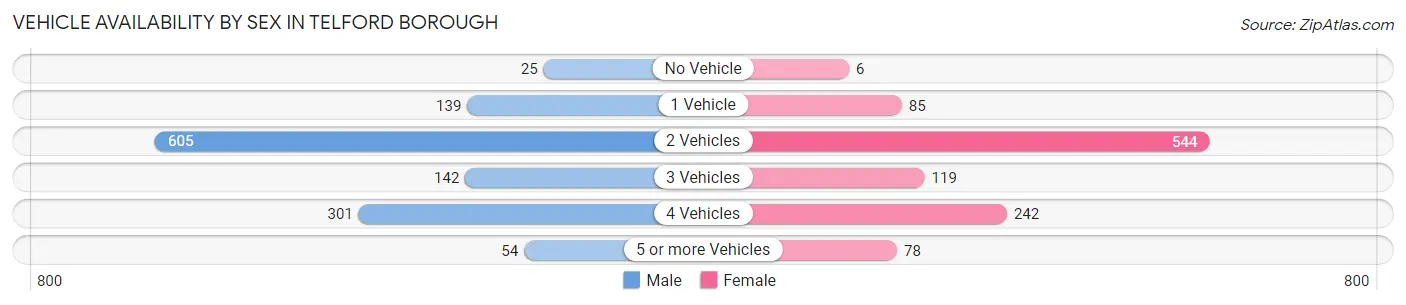
| Vehicles Available | Male | Female |
| No Vehicle | 25 (2.0%) | 6 (0.6%) |
| 1 Vehicle | 139 (11.0%) | 85 (7.9%) |
| 2 Vehicles | 605 (47.8%) | 544 (50.6%) |
| 3 Vehicles | 142 (11.2%) | 119 (11.1%) |
| 4 Vehicles | 301 (23.8%) | 242 (22.5%) |
| 5 or more Vehicles | 54 (4.3%) | 78 (7.3%) |
| Total | 1,266 (100.0%) | 1,074 (100.0%) |
Commute Time in Telford borough
The most frequently occuring commute durations in Telford borough are 30 to 34 minutes (433 commuters, 20.4%), 15 to 19 minutes (404 commuters, 19.1%), and 20 to 24 minutes (324 commuters, 15.3%).
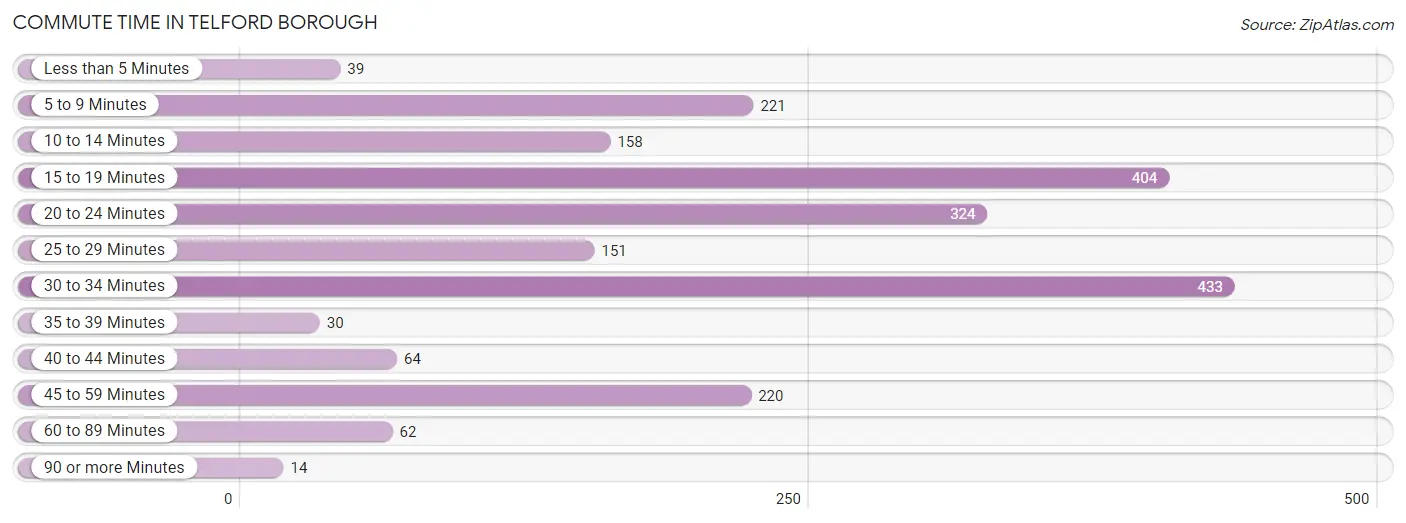
| Commute Time | # Commuters | % Commuters |
| Less than 5 Minutes | 39 | 1.8% |
| 5 to 9 Minutes | 221 | 10.4% |
| 10 to 14 Minutes | 158 | 7.4% |
| 15 to 19 Minutes | 404 | 19.1% |
| 20 to 24 Minutes | 324 | 15.3% |
| 25 to 29 Minutes | 151 | 7.1% |
| 30 to 34 Minutes | 433 | 20.4% |
| 35 to 39 Minutes | 30 | 1.4% |
| 40 to 44 Minutes | 64 | 3.0% |
| 45 to 59 Minutes | 220 | 10.4% |
| 60 to 89 Minutes | 62 | 2.9% |
| 90 or more Minutes | 14 | 0.7% |
Commute Time by Sex in Telford borough
The most common commute times in Telford borough are 30 to 34 minutes (318 commuters, 27.0%) for males and 15 to 19 minutes (212 commuters, 22.5%) for females.
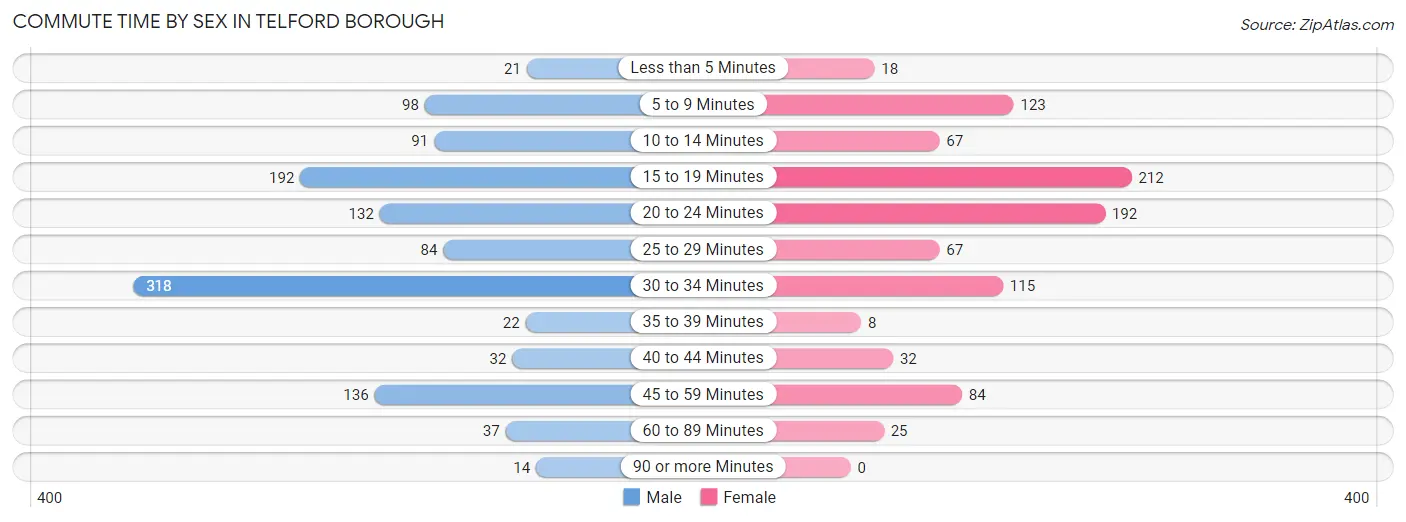
| Commute Time | Male | Female |
| Less than 5 Minutes | 21 (1.8%) | 18 (1.9%) |
| 5 to 9 Minutes | 98 (8.3%) | 123 (13.0%) |
| 10 to 14 Minutes | 91 (7.7%) | 67 (7.1%) |
| 15 to 19 Minutes | 192 (16.3%) | 212 (22.5%) |
| 20 to 24 Minutes | 132 (11.2%) | 192 (20.4%) |
| 25 to 29 Minutes | 84 (7.1%) | 67 (7.1%) |
| 30 to 34 Minutes | 318 (27.0%) | 115 (12.2%) |
| 35 to 39 Minutes | 22 (1.9%) | 8 (0.9%) |
| 40 to 44 Minutes | 32 (2.7%) | 32 (3.4%) |
| 45 to 59 Minutes | 136 (11.6%) | 84 (8.9%) |
| 60 to 89 Minutes | 37 (3.1%) | 25 (2.6%) |
| 90 or more Minutes | 14 (1.2%) | 0 (0.0%) |
Time of Departure to Work by Sex in Telford borough
The most frequent times of departure to work in Telford borough are 6:30 AM to 6:59 AM (211, 17.9%) for males and 7:30 AM to 7:59 AM (253, 26.8%) for females.
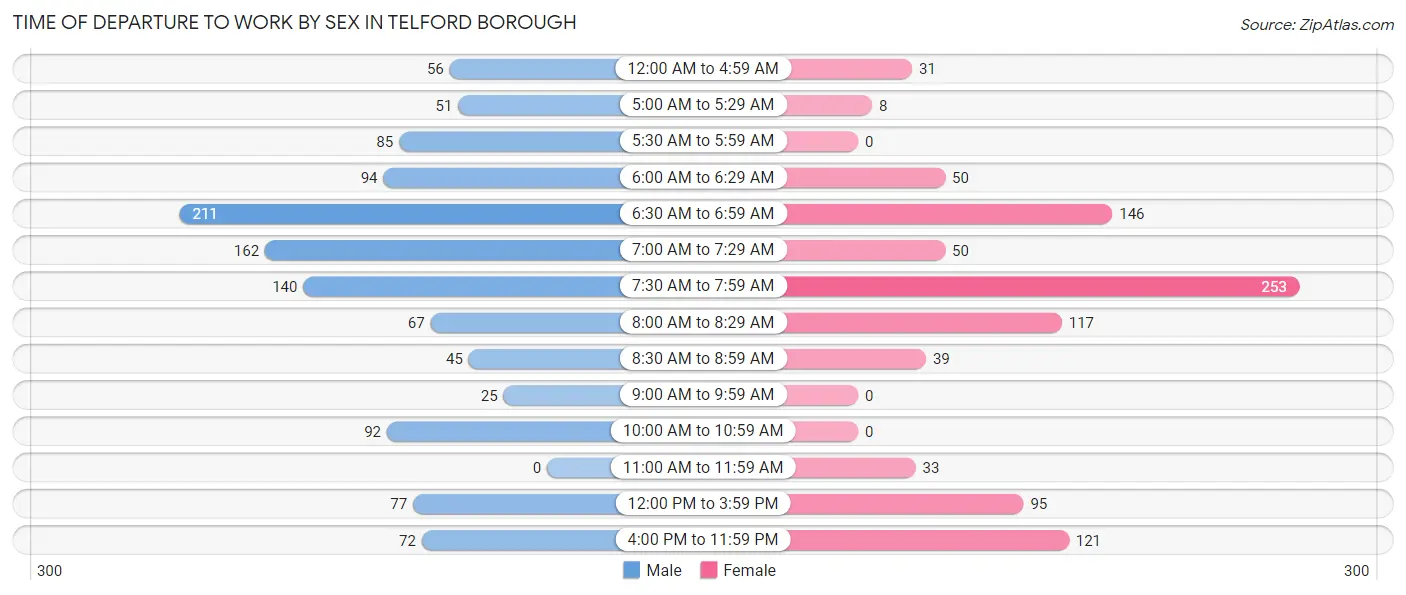
| Time of Departure | Male | Female |
| 12:00 AM to 4:59 AM | 56 (4.8%) | 31 (3.3%) |
| 5:00 AM to 5:29 AM | 51 (4.3%) | 8 (0.9%) |
| 5:30 AM to 5:59 AM | 85 (7.2%) | 0 (0.0%) |
| 6:00 AM to 6:29 AM | 94 (8.0%) | 50 (5.3%) |
| 6:30 AM to 6:59 AM | 211 (17.9%) | 146 (15.5%) |
| 7:00 AM to 7:29 AM | 162 (13.8%) | 50 (5.3%) |
| 7:30 AM to 7:59 AM | 140 (11.9%) | 253 (26.8%) |
| 8:00 AM to 8:29 AM | 67 (5.7%) | 117 (12.4%) |
| 8:30 AM to 8:59 AM | 45 (3.8%) | 39 (4.1%) |
| 9:00 AM to 9:59 AM | 25 (2.1%) | 0 (0.0%) |
| 10:00 AM to 10:59 AM | 92 (7.8%) | 0 (0.0%) |
| 11:00 AM to 11:59 AM | 0 (0.0%) | 33 (3.5%) |
| 12:00 PM to 3:59 PM | 77 (6.5%) | 95 (10.1%) |
| 4:00 PM to 11:59 PM | 72 (6.1%) | 121 (12.8%) |
| Total | 1,177 (100.0%) | 943 (100.0%) |
Housing Occupancy in Telford borough
Occupancy by Ownership in Telford borough
Of the total 1,882 dwellings in Telford borough, owner-occupied units account for 1,155 (61.4%), while renter-occupied units make up 727 (38.6%).
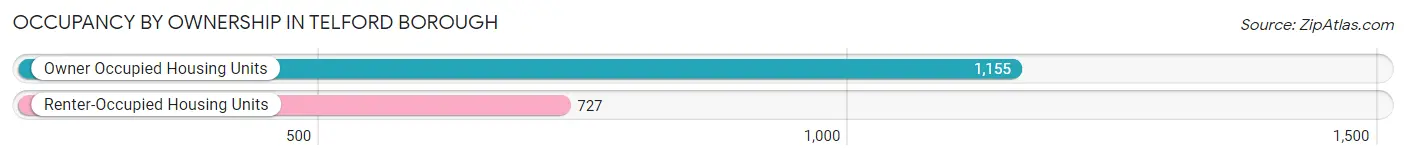
| Occupancy | # Housing Units | % Housing Units |
| Owner Occupied Housing Units | 1,155 | 61.4% |
| Renter-Occupied Housing Units | 727 | 38.6% |
| Total Occupied Housing Units | 1,882 | 100.0% |
Occupancy by Household Size in Telford borough
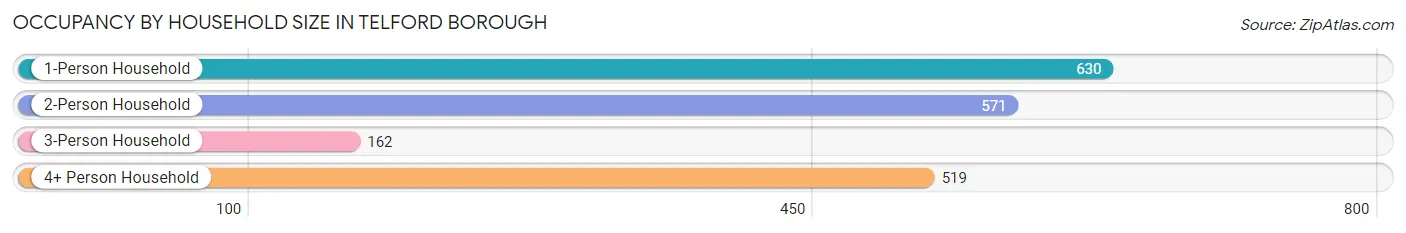
| Household Size | # Housing Units | % Housing Units |
| 1-Person Household | 630 | 33.5% |
| 2-Person Household | 571 | 30.3% |
| 3-Person Household | 162 | 8.6% |
| 4+ Person Household | 519 | 27.6% |
| Total Housing Units | 1,882 | 100.0% |
Occupancy by Ownership by Household Size in Telford borough
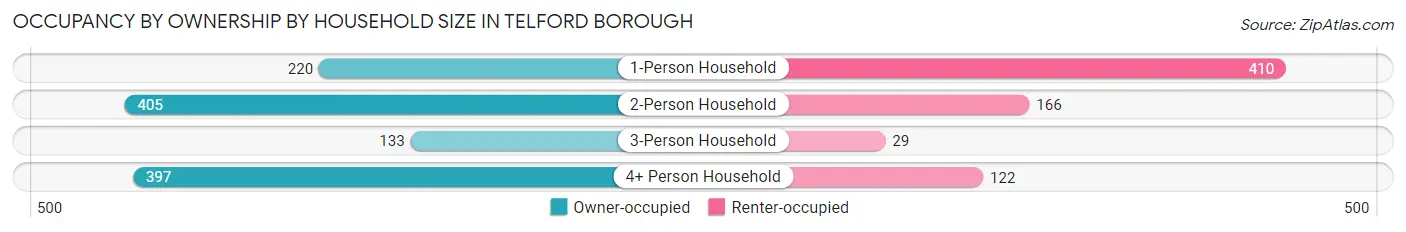
| Household Size | Owner-occupied | Renter-occupied |
| 1-Person Household | 220 (34.9%) | 410 (65.1%) |
| 2-Person Household | 405 (70.9%) | 166 (29.1%) |
| 3-Person Household | 133 (82.1%) | 29 (17.9%) |
| 4+ Person Household | 397 (76.5%) | 122 (23.5%) |
| Total Housing Units | 1,155 (61.4%) | 727 (38.6%) |
Occupancy by Educational Attainment in Telford borough
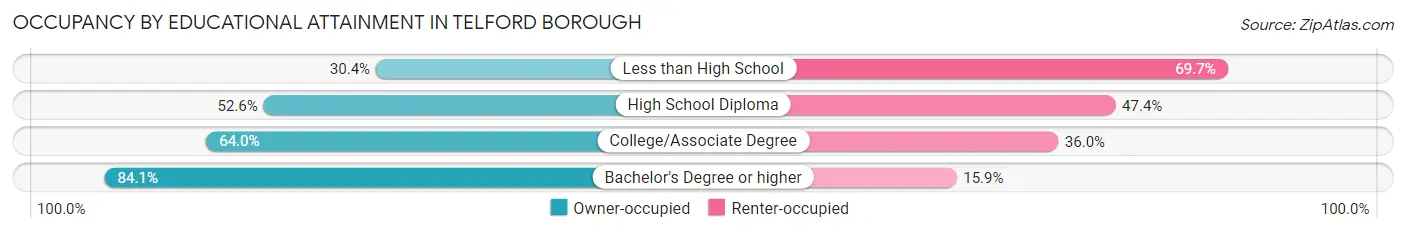
| Household Size | Owner-occupied | Renter-occupied |
| Less than High School | 61 (30.3%) | 140 (69.7%) |
| High School Diploma | 331 (52.6%) | 298 (47.4%) |
| College/Associate Degree | 387 (64.0%) | 218 (36.0%) |
| Bachelor's Degree or higher | 376 (84.1%) | 71 (15.9%) |
Occupancy by Age of Householder in Telford borough
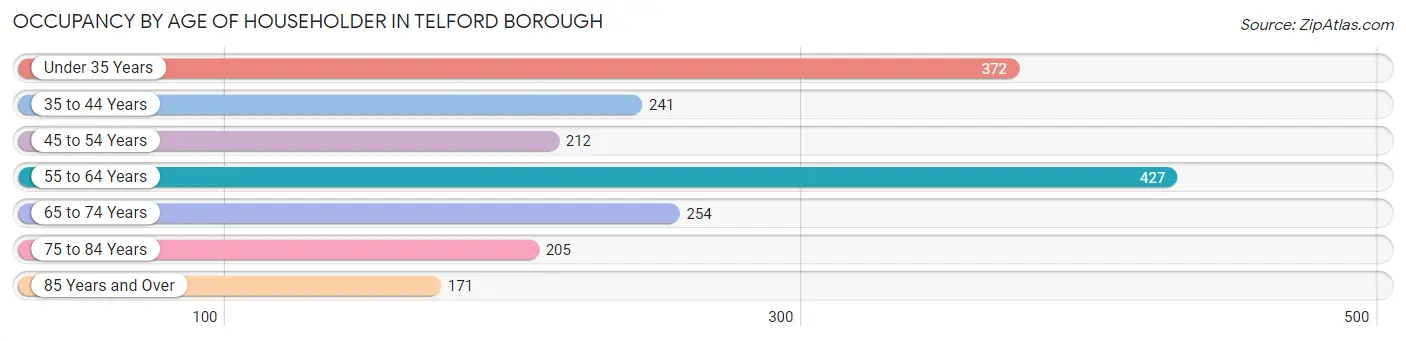
| Age Bracket | # Households | % Households |
| Under 35 Years | 372 | 19.8% |
| 35 to 44 Years | 241 | 12.8% |
| 45 to 54 Years | 212 | 11.3% |
| 55 to 64 Years | 427 | 22.7% |
| 65 to 74 Years | 254 | 13.5% |
| 75 to 84 Years | 205 | 10.9% |
| 85 Years and Over | 171 | 9.1% |
| Total | 1,882 | 100.0% |
Housing Finances in Telford borough
Median Income by Occupancy in Telford borough
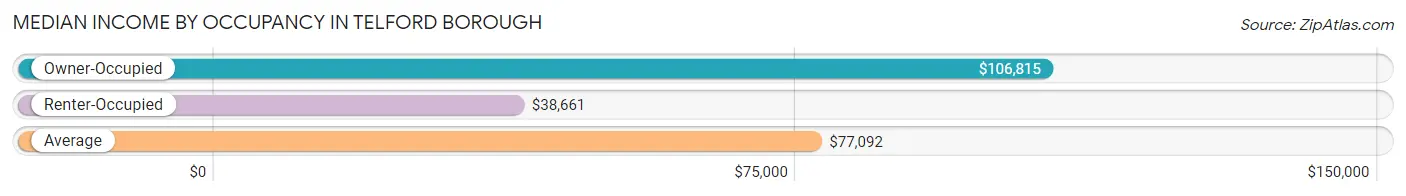
| Occupancy Type | # Households | Median Income |
| Owner-Occupied | 1,155 (61.4%) | $106,815 |
| Renter-Occupied | 727 (38.6%) | $38,661 |
| Average | 1,882 (100.0%) | $77,092 |
Occupancy by Householder Income Bracket in Telford borough
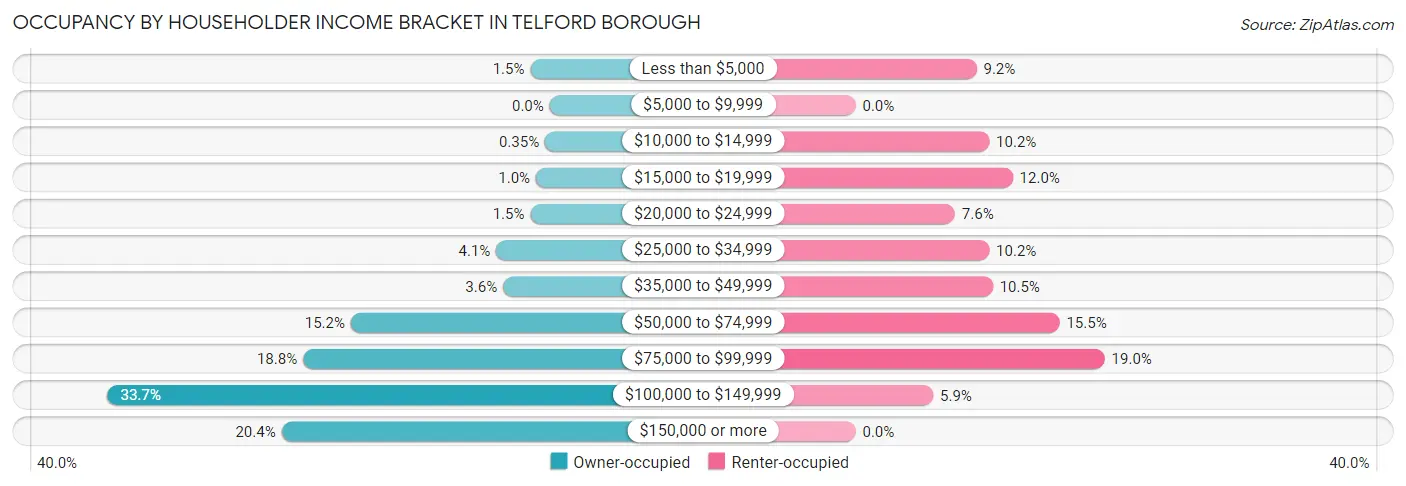
| Income Bracket | Owner-occupied | Renter-occupied |
| Less than $5,000 | 17 (1.5%) | 67 (9.2%) |
| $5,000 to $9,999 | 0 (0.0%) | 0 (0.0%) |
| $10,000 to $14,999 | 4 (0.4%) | 74 (10.2%) |
| $15,000 to $19,999 | 12 (1.0%) | 87 (12.0%) |
| $20,000 to $24,999 | 17 (1.5%) | 55 (7.6%) |
| $25,000 to $34,999 | 47 (4.1%) | 74 (10.2%) |
| $35,000 to $49,999 | 41 (3.5%) | 76 (10.4%) |
| $50,000 to $74,999 | 175 (15.1%) | 113 (15.5%) |
| $75,000 to $99,999 | 217 (18.8%) | 138 (19.0%) |
| $100,000 to $149,999 | 389 (33.7%) | 43 (5.9%) |
| $150,000 or more | 236 (20.4%) | 0 (0.0%) |
| Total | 1,155 (100.0%) | 727 (100.0%) |
Monthly Housing Cost Tiers in Telford borough
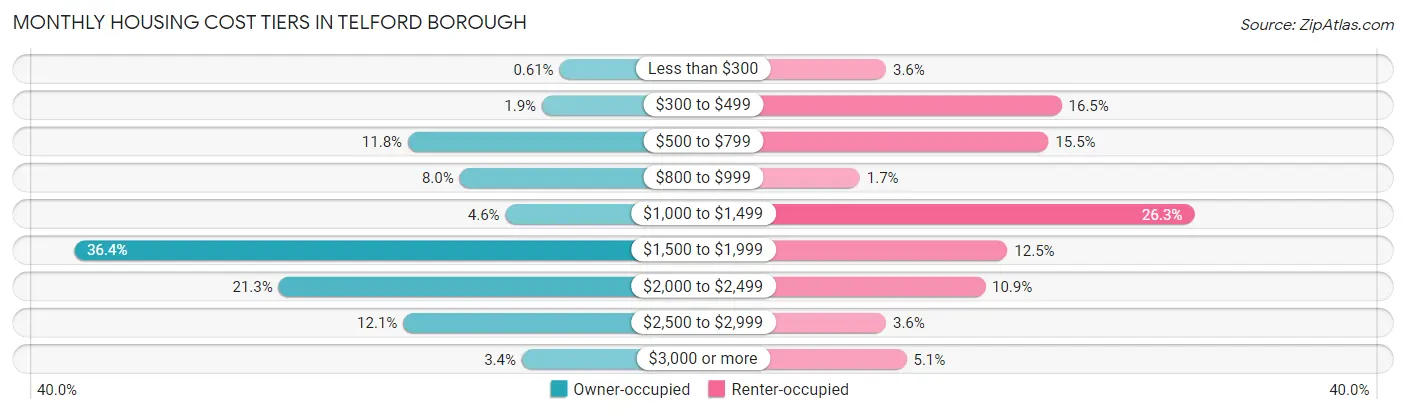
| Monthly Cost | Owner-occupied | Renter-occupied |
| Less than $300 | 7 (0.6%) | 26 (3.6%) |
| $300 to $499 | 22 (1.9%) | 120 (16.5%) |
| $500 to $799 | 136 (11.8%) | 113 (15.5%) |
| $800 to $999 | 92 (8.0%) | 12 (1.7%) |
| $1,000 to $1,499 | 53 (4.6%) | 191 (26.3%) |
| $1,500 to $1,999 | 420 (36.4%) | 91 (12.5%) |
| $2,000 to $2,499 | 246 (21.3%) | 79 (10.9%) |
| $2,500 to $2,999 | 140 (12.1%) | 26 (3.6%) |
| $3,000 or more | 39 (3.4%) | 37 (5.1%) |
| Total | 1,155 (100.0%) | 727 (100.0%) |
Physical Housing Characteristics in Telford borough
Housing Structures in Telford borough
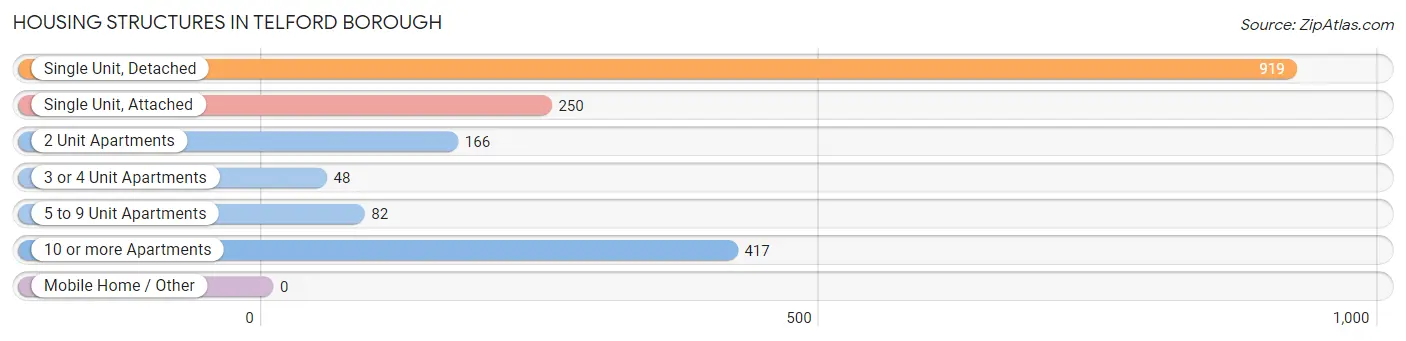
| Structure Type | # Housing Units | % Housing Units |
| Single Unit, Detached | 919 | 48.8% |
| Single Unit, Attached | 250 | 13.3% |
| 2 Unit Apartments | 166 | 8.8% |
| 3 or 4 Unit Apartments | 48 | 2.5% |
| 5 to 9 Unit Apartments | 82 | 4.4% |
| 10 or more Apartments | 417 | 22.2% |
| Mobile Home / Other | 0 | 0.0% |
| Total | 1,882 | 100.0% |
Housing Structures by Occupancy in Telford borough
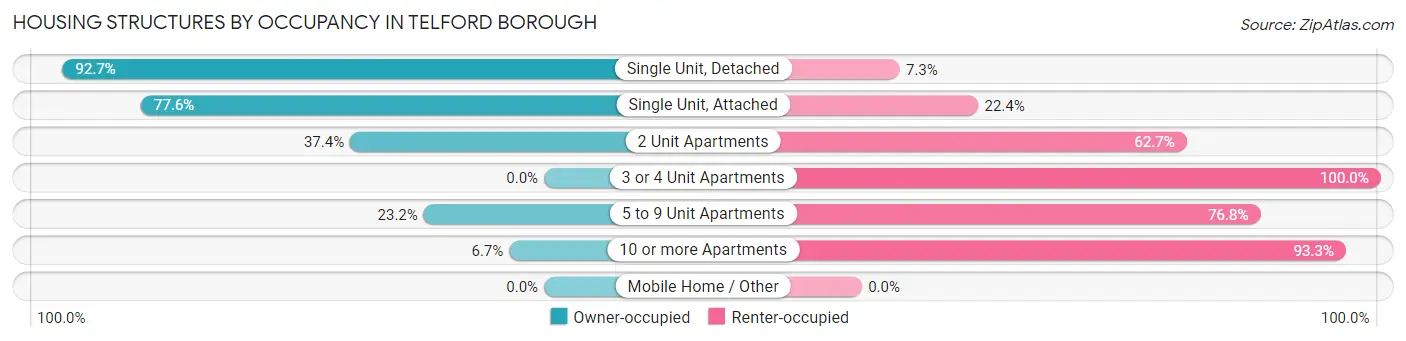
| Structure Type | Owner-occupied | Renter-occupied |
| Single Unit, Detached | 852 (92.7%) | 67 (7.3%) |
| Single Unit, Attached | 194 (77.6%) | 56 (22.4%) |
| 2 Unit Apartments | 62 (37.3%) | 104 (62.6%) |
| 3 or 4 Unit Apartments | 0 (0.0%) | 48 (100.0%) |
| 5 to 9 Unit Apartments | 19 (23.2%) | 63 (76.8%) |
| 10 or more Apartments | 28 (6.7%) | 389 (93.3%) |
| Mobile Home / Other | 0 (0.0%) | 0 (0.0%) |
| Total | 1,155 (61.4%) | 727 (38.6%) |
Housing Structures by Number of Rooms in Telford borough
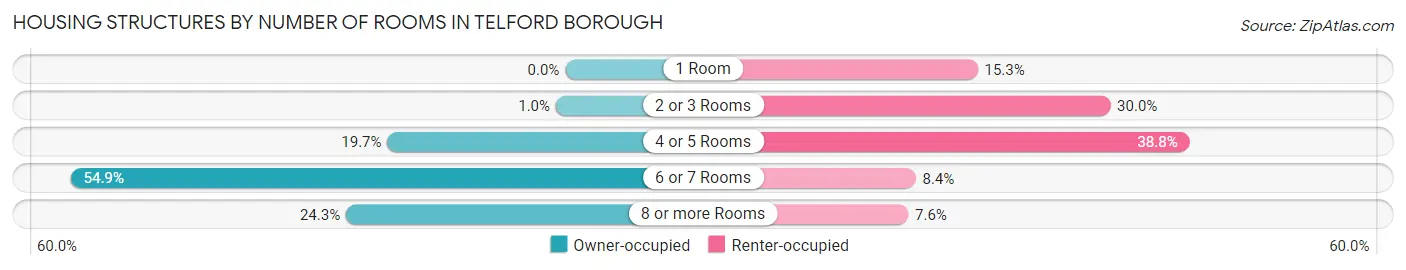
| Number of Rooms | Owner-occupied | Renter-occupied |
| 1 Room | 0 (0.0%) | 111 (15.3%) |
| 2 or 3 Rooms | 12 (1.0%) | 218 (30.0%) |
| 4 or 5 Rooms | 228 (19.7%) | 282 (38.8%) |
| 6 or 7 Rooms | 634 (54.9%) | 61 (8.4%) |
| 8 or more Rooms | 281 (24.3%) | 55 (7.6%) |
| Total | 1,155 (100.0%) | 727 (100.0%) |
Housing Structure by Heating Type in Telford borough
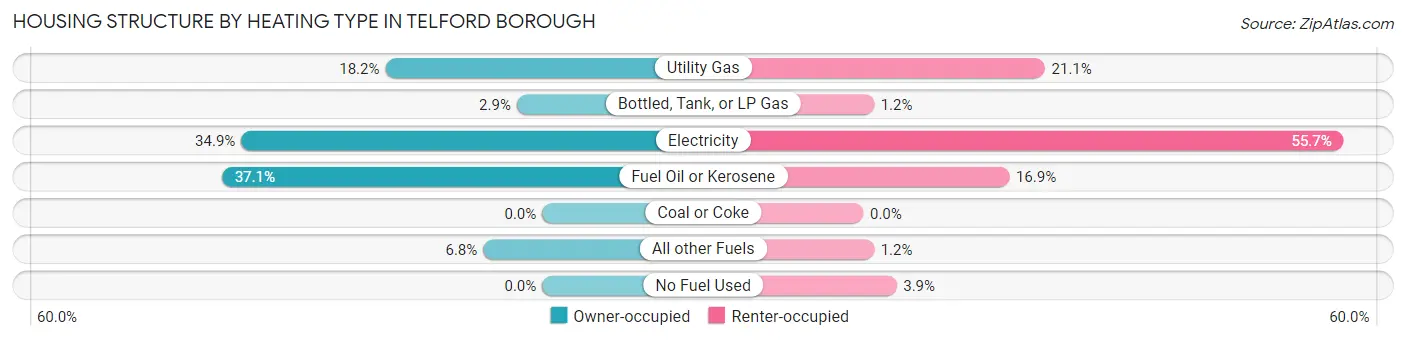
| Heating Type | Owner-occupied | Renter-occupied |
| Utility Gas | 210 (18.2%) | 153 (21.0%) |
| Bottled, Tank, or LP Gas | 34 (2.9%) | 9 (1.2%) |
| Electricity | 403 (34.9%) | 405 (55.7%) |
| Fuel Oil or Kerosene | 429 (37.1%) | 123 (16.9%) |
| Coal or Coke | 0 (0.0%) | 0 (0.0%) |
| All other Fuels | 79 (6.8%) | 9 (1.2%) |
| No Fuel Used | 0 (0.0%) | 28 (3.8%) |
| Total | 1,155 (100.0%) | 727 (100.0%) |
Household Vehicle Usage in Telford borough
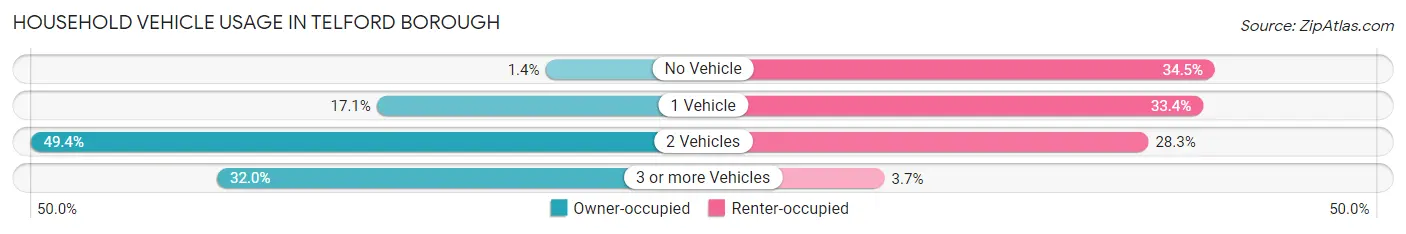
| Vehicles per Household | Owner-occupied | Renter-occupied |
| No Vehicle | 16 (1.4%) | 251 (34.5%) |
| 1 Vehicle | 198 (17.1%) | 243 (33.4%) |
| 2 Vehicles | 571 (49.4%) | 206 (28.3%) |
| 3 or more Vehicles | 370 (32.0%) | 27 (3.7%) |
| Total | 1,155 (100.0%) | 727 (100.0%) |
Real Estate & Mortgages in Telford borough
Real Estate and Mortgage Overview in Telford borough
| Characteristic | Without Mortgage | With Mortgage |
| Housing Units | 268 | 887 |
| Median Property Value | $282,100 | $284,500 |
| Median Household Income | $89,333 | $189 |
| Monthly Housing Costs | $776 | $39 |
| Real Estate Taxes | $4,665 | $7 |
Property Value by Mortgage Status in Telford borough
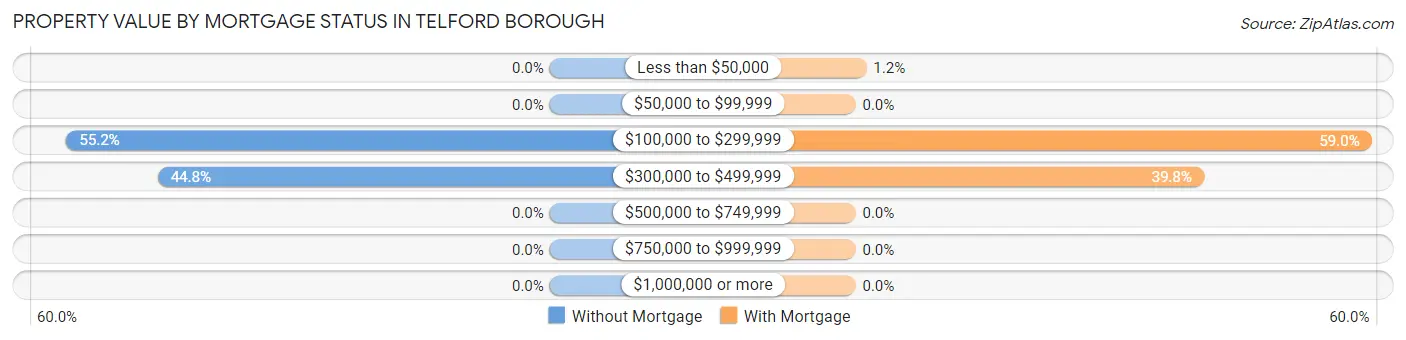
| Property Value | Without Mortgage | With Mortgage |
| Less than $50,000 | 0 (0.0%) | 11 (1.2%) |
| $50,000 to $99,999 | 0 (0.0%) | 0 (0.0%) |
| $100,000 to $299,999 | 148 (55.2%) | 523 (59.0%) |
| $300,000 to $499,999 | 120 (44.8%) | 353 (39.8%) |
| $500,000 to $749,999 | 0 (0.0%) | 0 (0.0%) |
| $750,000 to $999,999 | 0 (0.0%) | 0 (0.0%) |
| $1,000,000 or more | 0 (0.0%) | 0 (0.0%) |
| Total | 268 (100.0%) | 887 (100.0%) |
Household Income by Mortgage Status in Telford borough
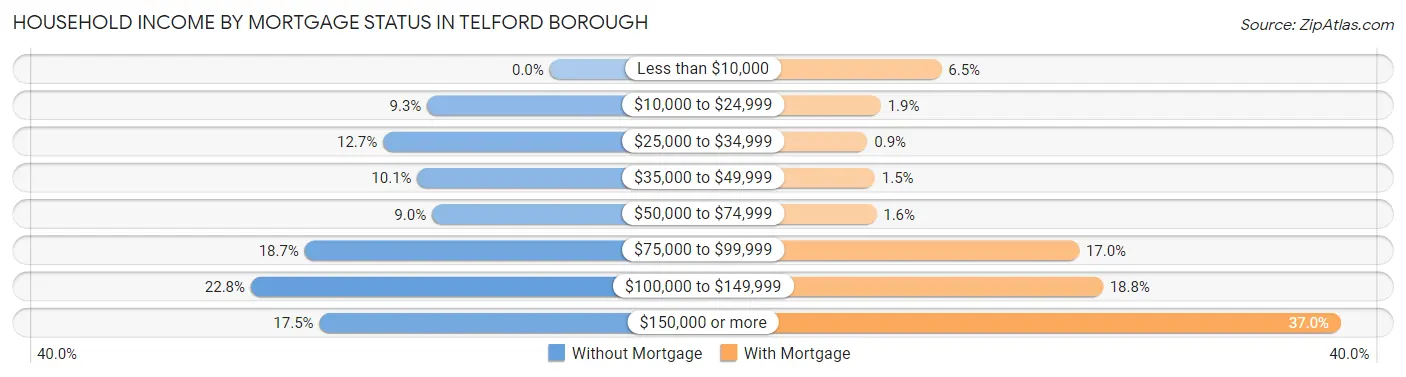
| Household Income | Without Mortgage | With Mortgage |
| Less than $10,000 | 0 (0.0%) | 58 (6.5%) |
| $10,000 to $24,999 | 25 (9.3%) | 17 (1.9%) |
| $25,000 to $34,999 | 34 (12.7%) | 8 (0.9%) |
| $35,000 to $49,999 | 27 (10.1%) | 13 (1.5%) |
| $50,000 to $74,999 | 24 (9.0%) | 14 (1.6%) |
| $75,000 to $99,999 | 50 (18.7%) | 151 (17.0%) |
| $100,000 to $149,999 | 61 (22.8%) | 167 (18.8%) |
| $150,000 or more | 47 (17.5%) | 328 (37.0%) |
| Total | 268 (100.0%) | 887 (100.0%) |
Property Value to Household Income Ratio in Telford borough
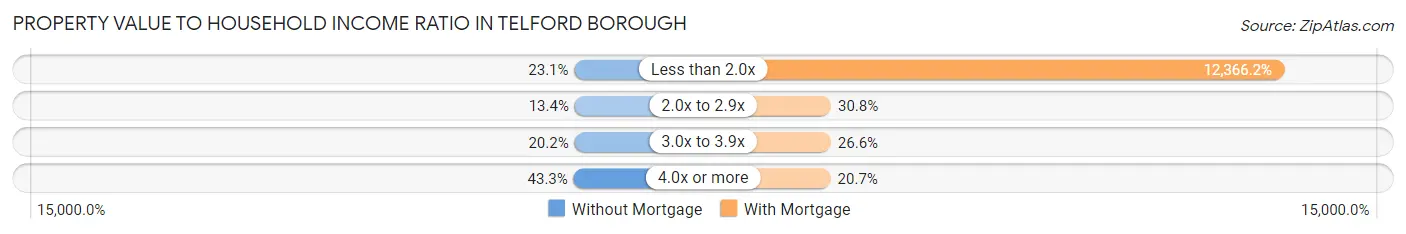
| Value-to-Income Ratio | Without Mortgage | With Mortgage |
| Less than 2.0x | 62 (23.1%) | 109,688 (12,366.2%) |
| 2.0x to 2.9x | 36 (13.4%) | 273 (30.8%) |
| 3.0x to 3.9x | 54 (20.2%) | 236 (26.6%) |
| 4.0x or more | 116 (43.3%) | 184 (20.7%) |
| Total | 268 (100.0%) | 887 (100.0%) |
Real Estate Taxes by Mortgage Status in Telford borough
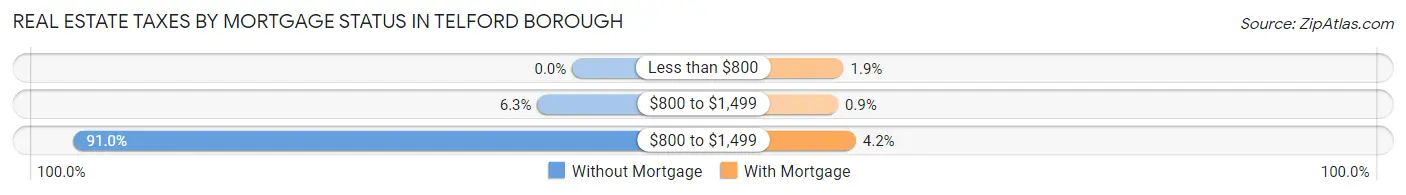
| Property Taxes | Without Mortgage | With Mortgage |
| Less than $800 | 0 (0.0%) | 17 (1.9%) |
| $800 to $1,499 | 17 (6.3%) | 8 (0.9%) |
| $800 to $1,499 | 244 (91.0%) | 37 (4.2%) |
| Total | 268 (100.0%) | 887 (100.0%) |
Health & Disability in Telford borough
Health Insurance Coverage by Age in Telford borough
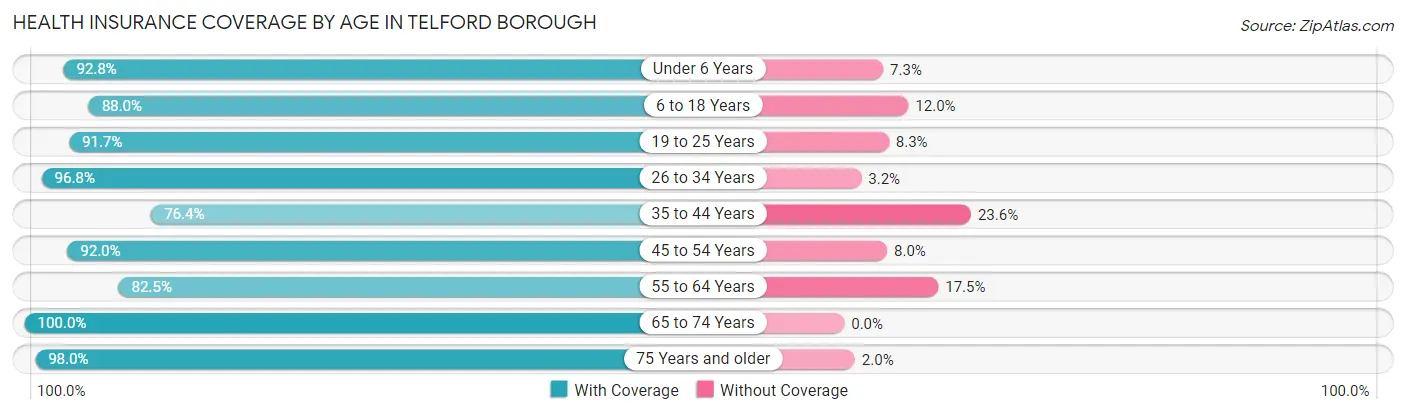
| Age Bracket | With Coverage | Without Coverage |
| Under 6 Years | 384 (92.7%) | 30 (7.2%) |
| 6 to 18 Years | 670 (88.0%) | 91 (12.0%) |
| 19 to 25 Years | 364 (91.7%) | 33 (8.3%) |
| 26 to 34 Years | 517 (96.8%) | 17 (3.2%) |
| 35 to 44 Years | 498 (76.4%) | 154 (23.6%) |
| 45 to 54 Years | 369 (92.0%) | 32 (8.0%) |
| 55 to 64 Years | 602 (82.5%) | 128 (17.5%) |
| 65 to 74 Years | 342 (100.0%) | 0 (0.0%) |
| 75 Years and older | 494 (98.0%) | 10 (2.0%) |
| Total | 4,240 (89.5%) | 495 (10.4%) |
Health Insurance Coverage by Citizenship Status in Telford borough
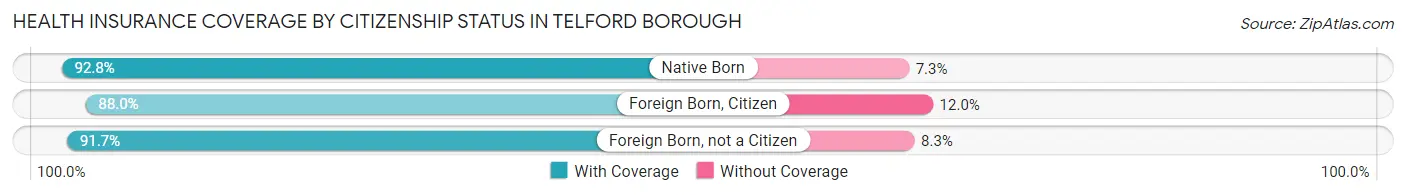
| Citizenship Status | With Coverage | Without Coverage |
| Native Born | 384 (92.7%) | 30 (7.2%) |
| Foreign Born, Citizen | 670 (88.0%) | 91 (12.0%) |
| Foreign Born, not a Citizen | 364 (91.7%) | 33 (8.3%) |
Health Insurance Coverage by Household Income in Telford borough
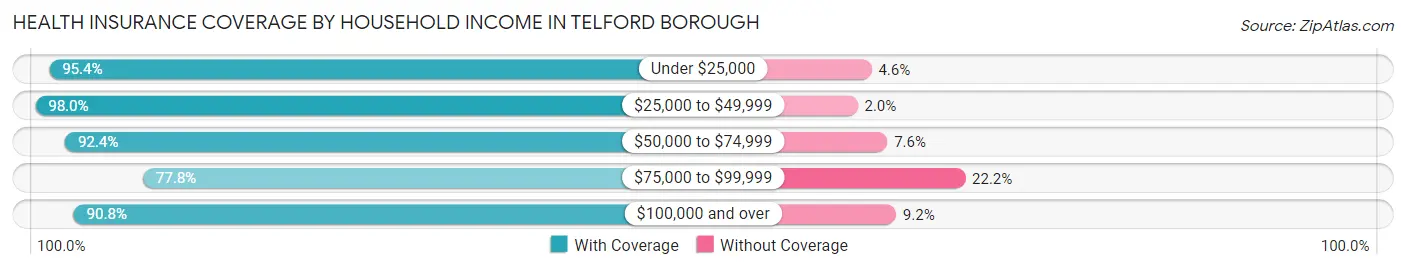
| Household Income | With Coverage | Without Coverage |
| Under $25,000 | 516 (95.4%) | 25 (4.6%) |
| $25,000 to $49,999 | 342 (98.0%) | 7 (2.0%) |
| $50,000 to $74,999 | 635 (92.4%) | 52 (7.6%) |
| $75,000 to $99,999 | 723 (77.8%) | 206 (22.2%) |
| $100,000 and over | 2,014 (90.8%) | 204 (9.2%) |
Public vs Private Health Insurance Coverage by Age in Telford borough
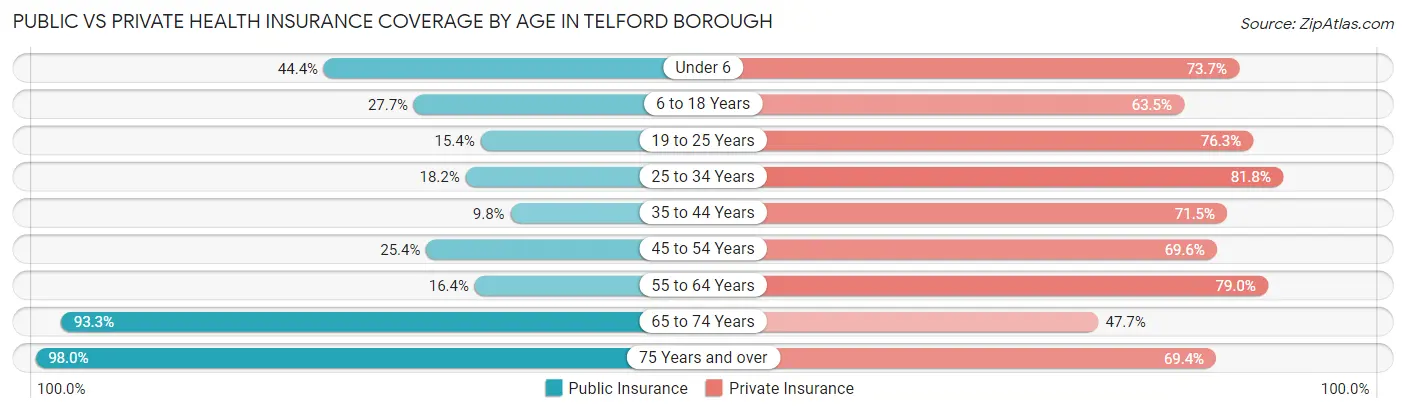
| Age Bracket | Public Insurance | Private Insurance |
| Under 6 | 184 (44.4%) | 305 (73.7%) |
| 6 to 18 Years | 211 (27.7%) | 483 (63.5%) |
| 19 to 25 Years | 61 (15.4%) | 303 (76.3%) |
| 25 to 34 Years | 97 (18.2%) | 437 (81.8%) |
| 35 to 44 Years | 64 (9.8%) | 466 (71.5%) |
| 45 to 54 Years | 102 (25.4%) | 279 (69.6%) |
| 55 to 64 Years | 120 (16.4%) | 577 (79.0%) |
| 65 to 74 Years | 319 (93.3%) | 163 (47.7%) |
| 75 Years and over | 494 (98.0%) | 350 (69.4%) |
| Total | 1,652 (34.9%) | 3,363 (71.0%) |
Disability Status by Sex by Age in Telford borough
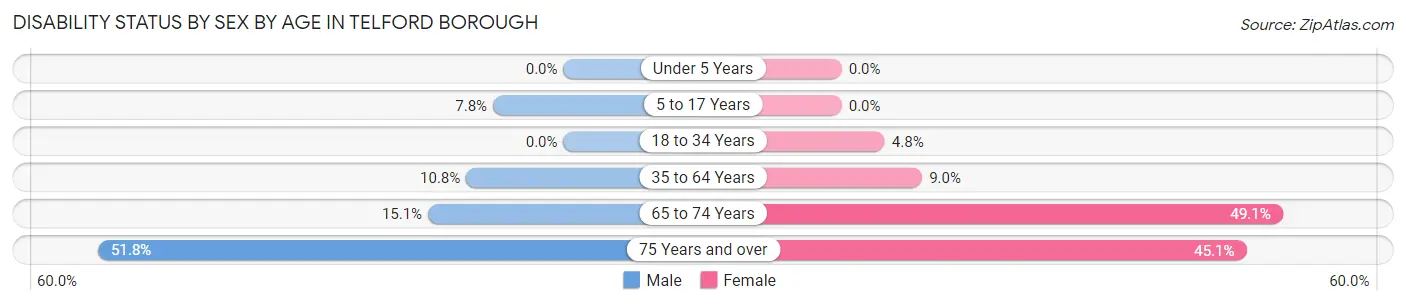
| Age Bracket | Male | Female |
| Under 5 Years | 0 (0.0%) | 0 (0.0%) |
| 5 to 17 Years | 25 (7.8%) | 0 (0.0%) |
| 18 to 34 Years | 0 (0.0%) | 28 (4.8%) |
| 35 to 64 Years | 106 (10.8%) | 72 (9.0%) |
| 65 to 74 Years | 27 (15.1%) | 80 (49.1%) |
| 75 Years and over | 99 (51.8%) | 141 (45.1%) |
Disability Class by Sex by Age in Telford borough
Disability Class: Hearing Difficulty
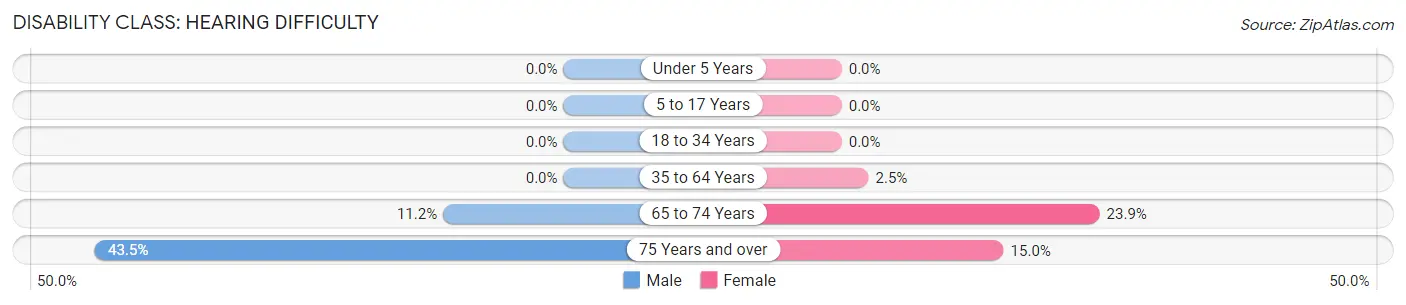
| Age Bracket | Male | Female |
| Under 5 Years | 0 (0.0%) | 0 (0.0%) |
| 5 to 17 Years | 0 (0.0%) | 0 (0.0%) |
| 18 to 34 Years | 0 (0.0%) | 0 (0.0%) |
| 35 to 64 Years | 0 (0.0%) | 20 (2.5%) |
| 65 to 74 Years | 20 (11.2%) | 39 (23.9%) |
| 75 Years and over | 83 (43.5%) | 47 (15.0%) |
Disability Class: Vision Difficulty
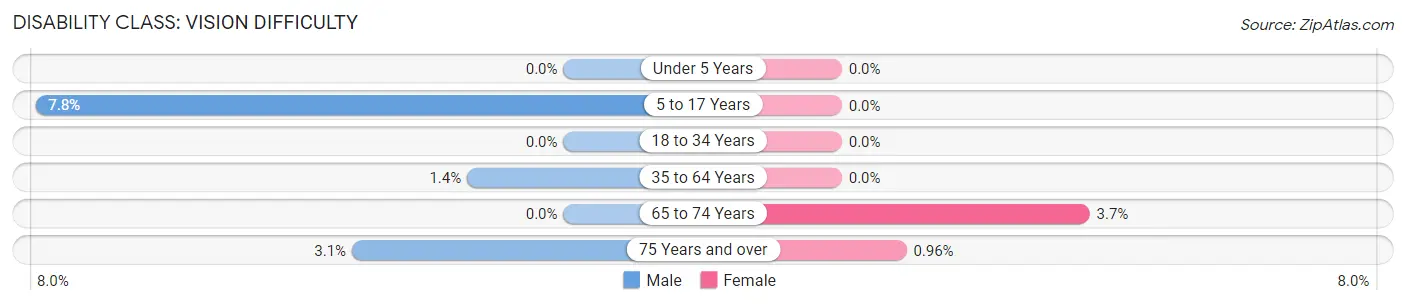
| Age Bracket | Male | Female |
| Under 5 Years | 0 (0.0%) | 0 (0.0%) |
| 5 to 17 Years | 25 (7.8%) | 0 (0.0%) |
| 18 to 34 Years | 0 (0.0%) | 0 (0.0%) |
| 35 to 64 Years | 14 (1.4%) | 0 (0.0%) |
| 65 to 74 Years | 0 (0.0%) | 6 (3.7%) |
| 75 Years and over | 6 (3.1%) | 3 (1.0%) |
Disability Class: Cognitive Difficulty
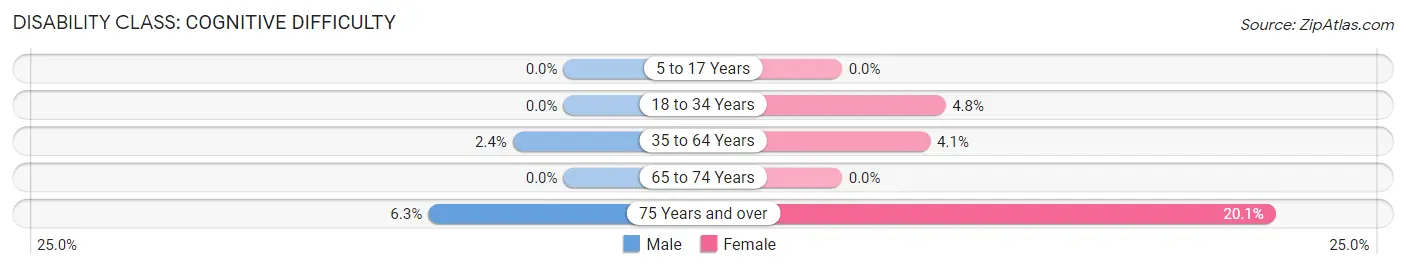
| Age Bracket | Male | Female |
| 5 to 17 Years | 0 (0.0%) | 0 (0.0%) |
| 18 to 34 Years | 0 (0.0%) | 28 (4.8%) |
| 35 to 64 Years | 23 (2.4%) | 33 (4.1%) |
| 65 to 74 Years | 0 (0.0%) | 0 (0.0%) |
| 75 Years and over | 12 (6.3%) | 63 (20.1%) |
Disability Class: Ambulatory Difficulty
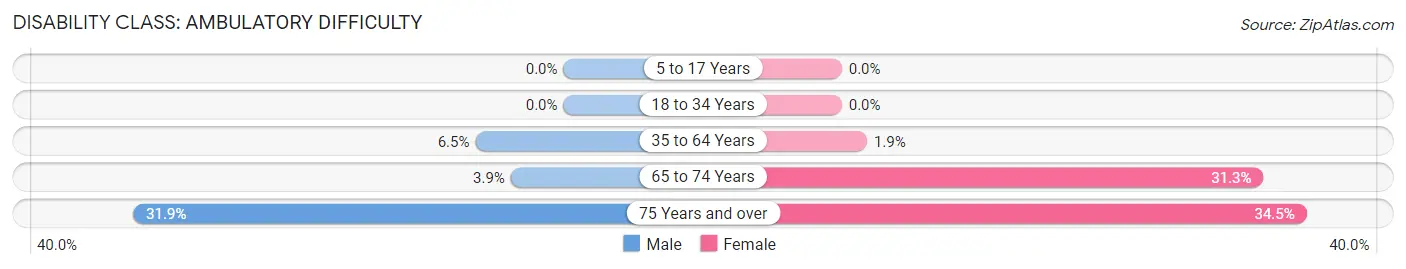
| Age Bracket | Male | Female |
| 5 to 17 Years | 0 (0.0%) | 0 (0.0%) |
| 18 to 34 Years | 0 (0.0%) | 0 (0.0%) |
| 35 to 64 Years | 64 (6.5%) | 15 (1.9%) |
| 65 to 74 Years | 7 (3.9%) | 51 (31.3%) |
| 75 Years and over | 61 (31.9%) | 108 (34.5%) |
Disability Class: Self-Care Difficulty
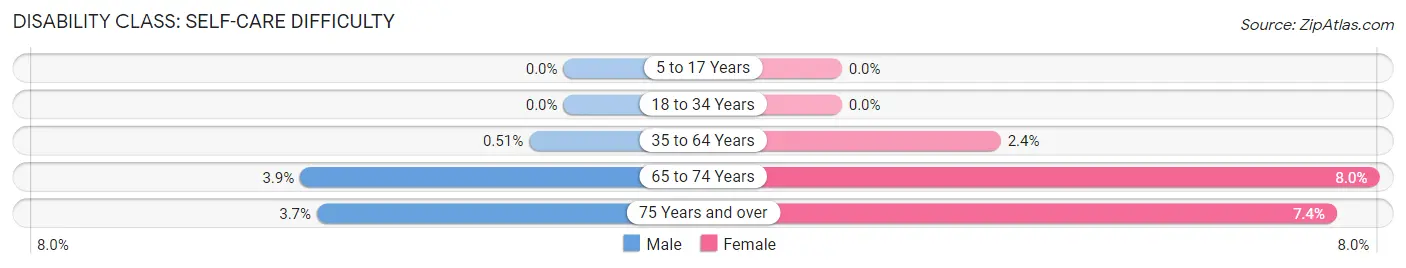
| Age Bracket | Male | Female |
| 5 to 17 Years | 0 (0.0%) | 0 (0.0%) |
| 18 to 34 Years | 0 (0.0%) | 0 (0.0%) |
| 35 to 64 Years | 5 (0.5%) | 19 (2.4%) |
| 65 to 74 Years | 7 (3.9%) | 13 (8.0%) |
| 75 Years and over | 7 (3.7%) | 23 (7.3%) |
Technology Access in Telford borough
Computing Device Access in Telford borough
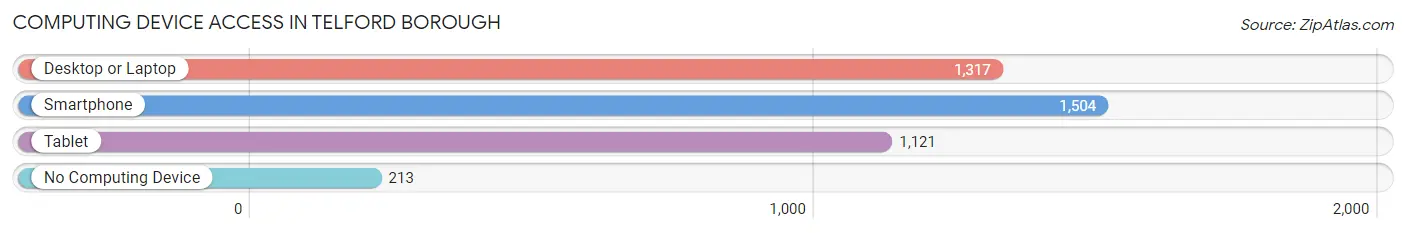
| Device Type | # Households | % Households |
| Desktop or Laptop | 1,317 | 70.0% |
| Smartphone | 1,504 | 79.9% |
| Tablet | 1,121 | 59.6% |
| No Computing Device | 213 | 11.3% |
| Total | 1,882 | 100.0% |
Internet Access in Telford borough
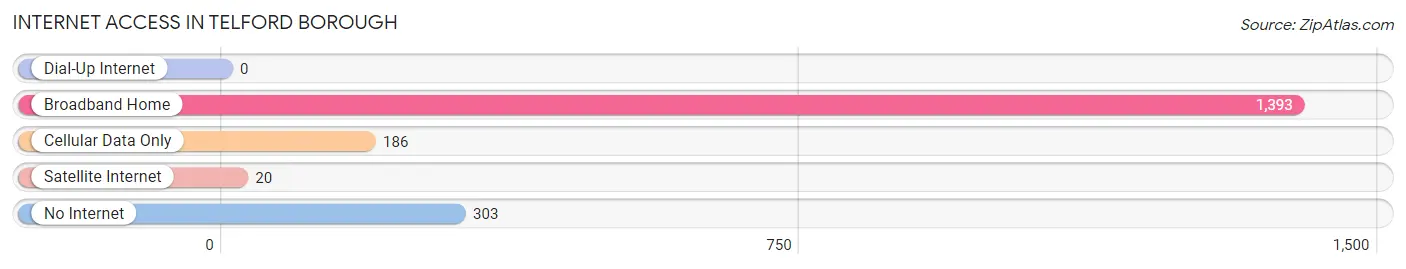
| Internet Type | # Households | % Households |
| Dial-Up Internet | 0 | 0.0% |
| Broadband Home | 1,393 | 74.0% |
| Cellular Data Only | 186 | 9.9% |
| Satellite Internet | 20 | 1.1% |
| No Internet | 303 | 16.1% |
| Total | 1,882 | 100.0% |
Telford borough Summary
Telford Borough is a small borough located in Bucks and Montgomery Counties in Pennsylvania. It is part of the Philadelphia metropolitan area and is located approximately 25 miles north of the city. The borough has a population of approximately 8,000 people and covers an area of 1.3 square miles.
History
Telford Borough was founded in 1851 by a group of Quakers from Philadelphia. The town was named after Thomas Telford, a prominent British engineer and architect. The town was originally a farming community, but it soon developed into a manufacturing center. The first industry in the area was a paper mill, which was established in 1854. Other industries soon followed, including a brickyard, a tannery, and a sawmill.
In the late 19th century, the town began to grow rapidly. The population increased from 1,000 in 1880 to 4,000 in 1900. The town was incorporated as a borough in 1891.
Geography
Telford Borough is located in Bucks and Montgomery Counties in Pennsylvania. It is part of the Philadelphia metropolitan area and is located approximately 25 miles north of the city. The borough has a total area of 1.3 square miles, all of which is land. The borough is bordered by Franconia Township to the north, Souderton Borough to the east, and Hatfield Township to the south and west.
The borough is located in the Delaware Valley, which is a region of low-lying hills and valleys. The terrain is generally flat, with some rolling hills. The borough is located in the Southeastern Pennsylvania Uplands, which is a region of rolling hills and valleys.
Economy
The economy of Telford Borough is largely based on manufacturing and services. The borough is home to several manufacturing companies, including a paper mill, a brickyard, a tannery, and a sawmill. The borough also has a number of retail stores, restaurants, and other businesses.
The borough is also home to several educational institutions, including a community college and a technical school. The borough is also home to a number of churches and other religious organizations.
Demographics
As of the 2010 census, the population of Telford Borough was 8,000. The racial makeup of the borough was 94.3% White, 1.7% African American, 0.3% Native American, 1.2% Asian, 0.1% Pacific Islander, 1.2% from other races, and 1.5% from two or more races. Hispanic or Latino of any race were 3.2% of the population.
The median household income in the borough was $50,000, and the median family income was $60,000. The per capita income in the borough was $25,000. About 8.5% of families and 10.2% of the population were below the poverty line, including 14.2% of those under age 18 and 6.2% of those age 65 or over.
Conclusion
Telford Borough is a small borough located in Bucks and Montgomery Counties in Pennsylvania. It is part of the Philadelphia metropolitan area and is located approximately 25 miles north of the city. The borough has a population of approximately 8,000 people and covers an area of 1.3 square miles. The economy of the borough is largely based on manufacturing and services, and the borough is home to several educational institutions, churches, and other religious organizations. The racial makeup of the borough is predominantly White, with a small percentage of African American, Native American, Asian, and Pacific Islander residents. The median household income in the borough is $50,000, and the median family income is $60,000.
Common Questions
What is Per Capita Income in Telford borough?
Per Capita income in Telford borough is $41,175.
What is the Median Family Income in Telford borough?
Median Family Income in Telford borough is $107,045.
What is the Median Household income in Telford borough?
Median Household Income in Telford borough is $77,092.
What is Income or Wage Gap in Telford borough?
Income or Wage Gap in Telford borough is 52.1%.
Women in Telford borough earn 47.9 cents for every dollar earned by a man.
What is Family Income Deficit in Telford borough?
Family Income Deficit in Telford borough is $14,479.
Families that are below poverty line in Telford borough earn $14,479 less on average than the poverty threshold level.
What is Inequality or Gini Index in Telford borough?
Inequality or Gini Index in Telford borough is 0.39.
What is the Total Population of Telford borough?
Total Population of Telford borough is 4,807.
What is the Total Male Population of Telford borough?
Total Male Population of Telford borough is 2,311.
What is the Total Female Population of Telford borough?
Total Female Population of Telford borough is 2,496.
What is the Ratio of Males per 100 Females in Telford borough?
There are 92.59 Males per 100 Females in Telford borough.
What is the Ratio of Females per 100 Males in Telford borough?
There are 108.01 Females per 100 Males in Telford borough.
What is the Median Population Age in Telford borough?
Median Population Age in Telford borough is 39.4 Years.
What is the Average Family Size in Telford borough
Average Family Size in Telford borough is 3.4 People.
What is the Average Household Size in Telford borough
Average Household Size in Telford borough is 2.5 People.
How Large is the Labor Force in Telford borough?
There are 2,541 People in the Labor Forcein in Telford borough.
What is the Percentage of People in the Labor Force in Telford borough?
65.7% of People are in the Labor Force in Telford borough.
What is the Unemployment Rate in Telford borough?
Unemployment Rate in Telford borough is 5.2%.