Cities with the Largest Hispanic or Latino Community in Utah
RELATED REPORTS & OPTIONS
Hispanic or Latino
Utah
Compare Cities
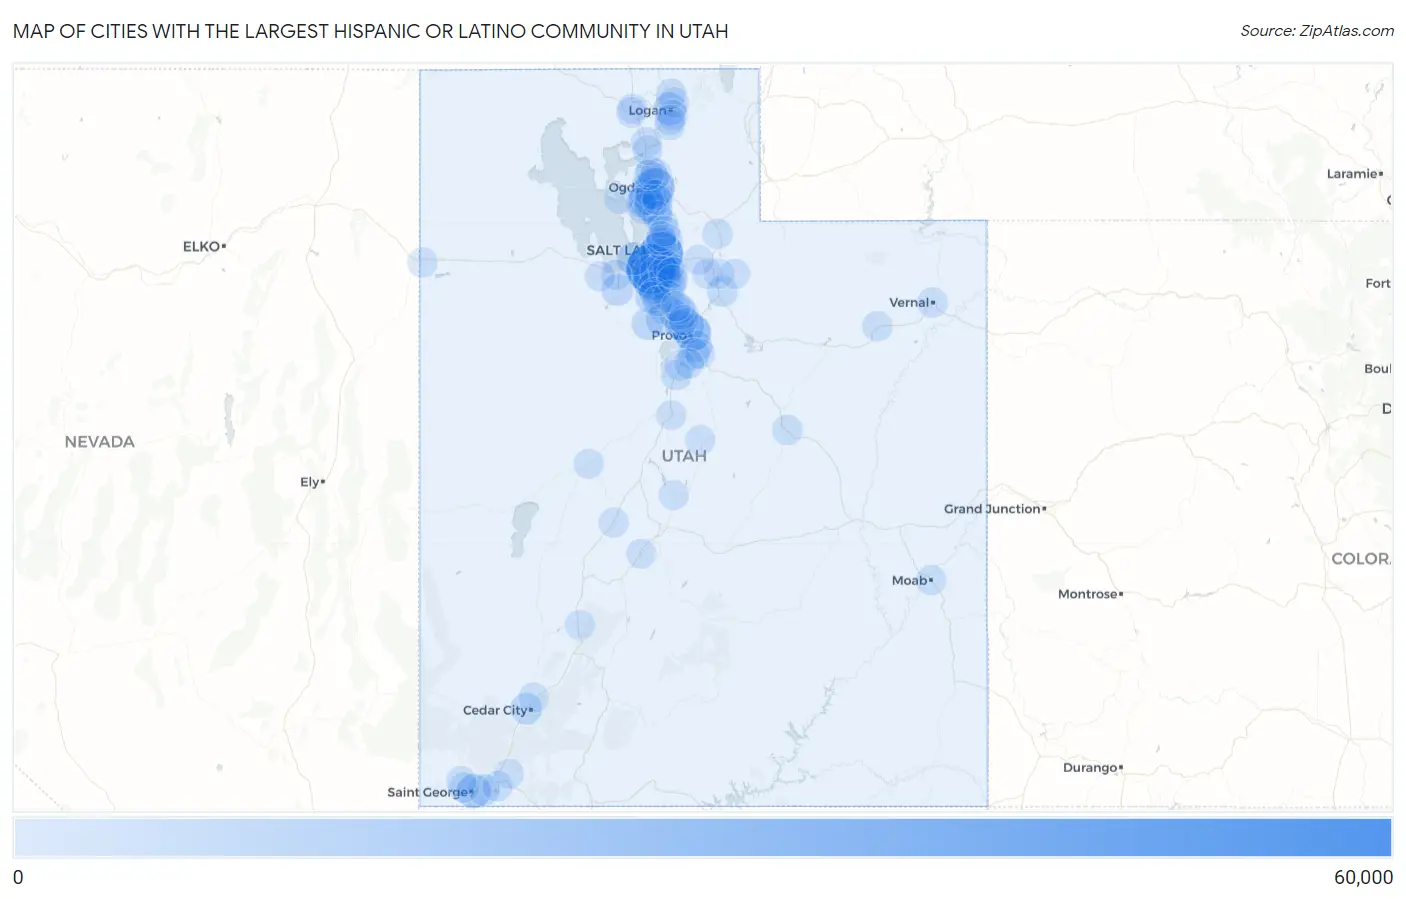
Map of Cities with the Largest Hispanic or Latino Community in Utah
0
60,000
Cities with the Largest Hispanic or Latino Community in Utah
| City | Hispanic or Latino | vs State | vs National | |
| 1. | West Valley City | 57,564 | 480,843(11.97%)#1 | 61,755,866(0.09%)#132 |
| 2. | Salt Lake City | 39,988 | 480,843(8.32%)#2 | 61,755,866(0.06%)#227 |
| 3. | West Jordan | 26,645 | 480,843(5.54%)#3 | 61,755,866(0.04%)#352 |
| 4. | Ogden | 25,711 | 480,843(5.35%)#4 | 61,755,866(0.04%)#368 |
| 5. | Provo | 20,046 | 480,843(4.17%)#5 | 61,755,866(0.03%)#468 |
| 6. | Orem | 17,113 | 480,843(3.56%)#6 | 61,755,866(0.03%)#553 |
| 7. | Kearns | 15,408 | 480,843(3.20%)#7 | 61,755,866(0.02%)#606 |
| 8. | Taylorsville | 14,661 | 480,843(3.05%)#8 | 61,755,866(0.02%)#629 |
| 9. | St George | 11,714 | 480,843(2.44%)#9 | 61,755,866(0.02%)#786 |
| 10. | Layton | 11,478 | 480,843(2.39%)#10 | 61,755,866(0.02%)#800 |
| 11. | Sandy | 9,944 | 480,843(2.07%)#11 | 61,755,866(0.02%)#916 |
| 12. | Magna | 9,698 | 480,843(2.02%)#12 | 61,755,866(0.02%)#943 |
| 13. | Roy | 7,868 | 480,843(1.64%)#13 | 61,755,866(0.01%)#1,127 |
| 14. | South Salt Lake | 7,724 | 480,843(1.61%)#14 | 61,755,866(0.01%)#1,146 |
| 15. | Logan | 7,539 | 480,843(1.57%)#15 | 61,755,866(0.01%)#1,159 |
| 16. | Midvale | 6,215 | 480,843(1.29%)#16 | 61,755,866(0.01%)#1,331 |
| 17. | South Jordan | 6,085 | 480,843(1.27%)#17 | 61,755,866(0.01%)#1,352 |
| 18. | Murray | 6,057 | 480,843(1.26%)#18 | 61,755,866(0.01%)#1,356 |
| 19. | Lehi | 5,925 | 480,843(1.23%)#19 | 61,755,866(0.01%)#1,381 |
| 20. | Clearfield | 5,772 | 480,843(1.20%)#20 | 61,755,866(0.01%)#1,415 |
| 21. | Springville | 5,599 | 480,843(1.16%)#21 | 61,755,866(0.01%)#1,448 |
| 22. | Tooele | 5,475 | 480,843(1.14%)#22 | 61,755,866(0.01%)#1,463 |
| 23. | Millcreek | 5,433 | 480,843(1.13%)#23 | 61,755,866(0.01%)#1,473 |
| 24. | Eagle Mountain | 5,204 | 480,843(1.08%)#24 | 61,755,866(0.01%)#1,518 |
| 25. | Spanish Fork | 5,115 | 480,843(1.06%)#25 | 61,755,866(0.01%)#1,540 |
| 26. | Herriman | 5,090 | 480,843(1.06%)#26 | 61,755,866(0.01%)#1,541 |
| 27. | Cedar City | 4,863 | 480,843(1.01%)#27 | 61,755,866(0.01%)#1,595 |
| 28. | Riverton | 4,714 | 480,843(0.98%)#28 | 61,755,866(0.01%)#1,633 |
| 29. | Washington | 4,191 | 480,843(0.87%)#29 | 61,755,866(0.01%)#1,801 |
| 30. | Saratoga Springs | 4,083 | 480,843(0.85%)#30 | 61,755,866(0.01%)#1,838 |
| 31. | Pleasant Grove | 3,816 | 480,843(0.79%)#31 | 61,755,866(0.01%)#1,936 |
| 32. | Draper | 3,630 | 480,843(0.75%)#32 | 61,755,866(0.01%)#2,011 |
| 33. | West Haven | 3,433 | 480,843(0.71%)#33 | 61,755,866(0.01%)#2,090 |
| 34. | American Fork | 3,365 | 480,843(0.70%)#34 | 61,755,866(0.01%)#2,116 |
| 35. | Bountiful | 3,282 | 480,843(0.68%)#35 | 61,755,866(0.01%)#2,162 |
| 36. | North Salt Lake | 3,280 | 480,843(0.68%)#36 | 61,755,866(0.01%)#2,166 |
| 37. | Clinton | 3,125 | 480,843(0.65%)#37 | 61,755,866(0.01%)#2,239 |
| 38. | Payson | 3,103 | 480,843(0.65%)#38 | 61,755,866(0.01%)#2,249 |
| 39. | Heber | 2,874 | 480,843(0.60%)#39 | 61,755,866(0.00%)#2,364 |
| 40. | South Ogden | 2,461 | 480,843(0.51%)#40 | 61,755,866(0.00%)#2,634 |
| 41. | Syracuse | 2,233 | 480,843(0.46%)#41 | 61,755,866(0.00%)#2,799 |
| 42. | Riverdale | 2,185 | 480,843(0.45%)#42 | 61,755,866(0.00%)#2,839 |
| 43. | Brigham City | 2,061 | 480,843(0.43%)#43 | 61,755,866(0.00%)#2,970 |
| 44. | Holladay | 2,035 | 480,843(0.42%)#44 | 61,755,866(0.00%)#2,992 |
| 45. | Santaquin | 2,018 | 480,843(0.42%)#45 | 61,755,866(0.00%)#3,013 |
| 46. | Pleasant View | 1,822 | 480,843(0.38%)#46 | 61,755,866(0.00%)#3,224 |
| 47. | North Ogden | 1,770 | 480,843(0.37%)#47 | 61,755,866(0.00%)#3,278 |
| 48. | Cottonwood Heights | 1,760 | 480,843(0.37%)#48 | 61,755,866(0.00%)#3,291 |
| 49. | Hurricane | 1,752 | 480,843(0.36%)#49 | 61,755,866(0.00%)#3,295 |
| 50. | Vineyard | 1,740 | 480,843(0.36%)#50 | 61,755,866(0.00%)#3,314 |
| 51. | Price | 1,652 | 480,843(0.34%)#51 | 61,755,866(0.00%)#3,415 |
| 52. | Farmington | 1,562 | 480,843(0.32%)#52 | 61,755,866(0.00%)#3,537 |
| 53. | Kaysville | 1,533 | 480,843(0.32%)#53 | 61,755,866(0.00%)#3,580 |
| 54. | Stansbury Park | 1,491 | 480,843(0.31%)#54 | 61,755,866(0.00%)#3,647 |
| 55. | Tremonton | 1,379 | 480,843(0.29%)#55 | 61,755,866(0.00%)#3,821 |
| 56. | Cedar Hills | 1,338 | 480,843(0.28%)#56 | 61,755,866(0.00%)#3,903 |
| 57. | Hyrum | 1,326 | 480,843(0.28%)#57 | 61,755,866(0.00%)#3,921 |
| 58. | Park City | 1,281 | 480,843(0.27%)#58 | 61,755,866(0.00%)#3,994 |
| 59. | Harrisville | 1,199 | 480,843(0.25%)#59 | 61,755,866(0.00%)#4,157 |
| 60. | North Logan | 1,179 | 480,843(0.25%)#60 | 61,755,866(0.00%)#4,201 |
| 61. | Centerville | 1,168 | 480,843(0.24%)#61 | 61,755,866(0.00%)#4,231 |
| 62. | Smithfield | 1,131 | 480,843(0.24%)#62 | 61,755,866(0.00%)#4,288 |
| 63. | Grantsville | 1,079 | 480,843(0.22%)#63 | 61,755,866(0.00%)#4,416 |
| 64. | Vernal | 1,067 | 480,843(0.22%)#64 | 61,755,866(0.00%)#4,448 |
| 65. | Coalville | 1,052 | 480,843(0.22%)#65 | 61,755,866(0.00%)#4,489 |
| 66. | Providence | 1,034 | 480,843(0.22%)#66 | 61,755,866(0.00%)#4,532 |
| 67. | Washington Terrace | 994 | 480,843(0.21%)#67 | 61,755,866(0.00%)#4,630 |
| 68. | Nibley | 994 | 480,843(0.21%)#68 | 61,755,866(0.00%)#4,631 |
| 69. | Bluffdale | 993 | 480,843(0.21%)#69 | 61,755,866(0.00%)#4,634 |
| 70. | Sunset | 940 | 480,843(0.20%)#70 | 61,755,866(0.00%)#4,790 |
| 71. | Roosevelt | 935 | 480,843(0.19%)#71 | 61,755,866(0.00%)#4,817 |
| 72. | Moab | 910 | 480,843(0.19%)#72 | 61,755,866(0.00%)#4,891 |
| 73. | Santa Clara | 874 | 480,843(0.18%)#73 | 61,755,866(0.00%)#4,997 |
| 74. | Woods Cross | 829 | 480,843(0.17%)#74 | 61,755,866(0.00%)#5,137 |
| 75. | West Point | 826 | 480,843(0.17%)#75 | 61,755,866(0.00%)#5,155 |
| 76. | Hideout | 777 | 480,843(0.16%)#76 | 61,755,866(0.00%)#5,320 |
| 77. | Gunnison | 749 | 480,843(0.16%)#77 | 61,755,866(0.00%)#5,418 |
| 78. | Wendover | 747 | 480,843(0.16%)#78 | 61,755,866(0.00%)#5,428 |
| 79. | South Weber | 726 | 480,843(0.15%)#79 | 61,755,866(0.00%)#5,512 |
| 80. | Lindon | 662 | 480,843(0.14%)#80 | 61,755,866(0.00%)#5,788 |
| 81. | Ivins | 634 | 480,843(0.13%)#81 | 61,755,866(0.00%)#5,921 |
| 82. | Summit Park | 632 | 480,843(0.13%)#82 | 61,755,866(0.00%)#5,928 |
| 83. | White | 627 | 480,843(0.13%)#83 | 61,755,866(0.00%)#5,946 |
| 84. | Delta | 580 | 480,843(0.12%)#84 | 61,755,866(0.00%)#6,185 |
| 85. | Fillmore | 575 | 480,843(0.12%)#85 | 61,755,866(0.00%)#6,207 |
| 86. | Farr West | 563 | 480,843(0.12%)#86 | 61,755,866(0.00%)#6,274 |
| 87. | Highland | 537 | 480,843(0.11%)#87 | 61,755,866(0.00%)#6,407 |
| 88. | Mapleton | 534 | 480,843(0.11%)#88 | 61,755,866(0.00%)#6,429 |
| 89. | West Bountiful | 515 | 480,843(0.11%)#89 | 61,755,866(0.00%)#6,548 |
| 90. | Garland | 514 | 480,843(0.11%)#90 | 61,755,866(0.00%)#6,553 |
| 91. | Hooper | 511 | 480,843(0.11%)#91 | 61,755,866(0.00%)#6,566 |
| 92. | Perry | 475 | 480,843(0.10%)#92 | 61,755,866(0.00%)#6,775 |
| 93. | La Verkin | 461 | 480,843(0.10%)#93 | 61,755,866(0.00%)#6,882 |
| 94. | Kamas | 448 | 480,843(0.09%)#94 | 61,755,866(0.00%)#6,968 |
| 95. | Beaver | 441 | 480,843(0.09%)#95 | 61,755,866(0.00%)#7,013 |
| 96. | Salem | 432 | 480,843(0.09%)#96 | 61,755,866(0.00%)#7,080 |
| 97. | Enoch | 429 | 480,843(0.09%)#97 | 61,755,866(0.00%)#7,097 |
| 98. | Richfield | 403 | 480,843(0.08%)#98 | 61,755,866(0.00%)#7,302 |
| 99. | Moroni | 380 | 480,843(0.08%)#99 | 61,755,866(0.00%)#7,474 |
| 100. | Nephi | 373 | 480,843(0.08%)#100 | 61,755,866(0.00%)#7,538 |
Common Questions
What are the Top 10 Cities with the Largest Hispanic or Latino Community in Utah?
Top 10 Cities with the Largest Hispanic or Latino Community in Utah are:
#1
57,564
#2
39,988
#3
26,645
#4
25,711
#5
20,046
#6
17,113
#7
15,408
#8
14,661
#9
11,714
#10
11,478
What city has the Largest Hispanic or Latino Community in Utah?
West Valley City has the Largest Hispanic or Latino Community in Utah with 57,564.
What is the Total Hispanic or Latino Population in the State of Utah?
Total Hispanic or Latino Population in Utah is 480,843.
What is the Total Hispanic or Latino Population in the United States?
Total Hispanic or Latino Population in the United States is 61,755,866.