Bristol borough, PA Map & Demographics
Bristol borough Overview
$37,766
PER CAPITA INCOME
$86,476
AVG FAMILY INCOME
$67,176
AVG HOUSEHOLD INCOME
29.3%
WAGE / INCOME GAP [ % ]
70.7¢/ $1
WAGE / INCOME GAP [ $ ]
$14,207
FAMILY INCOME DEFICIT
0.45
INEQUALITY / GINI INDEX
9,862
TOTAL POPULATION
4,842
MALE POPULATION
5,020
FEMALE POPULATION
96.45
MALES / 100 FEMALES
103.68
FEMALES / 100 MALES
38.9
MEDIAN AGE
2.9
AVG FAMILY SIZE
2.4
AVG HOUSEHOLD SIZE
5,235
LABOR FORCE [ PEOPLE ]
67.2%
PERCENT IN LABOR FORCE
5.8%
UNEMPLOYMENT RATE
Income in Bristol borough
Income Overview in Bristol borough
Per Capita Income in Bristol borough is $37,766, while median incomes of families and households are $86,476 and $67,176 respectively.
| Characteristic | Number | Measure |
| Per Capita Income | 9,862 | $37,766 |
| Median Family Income | 2,587 | $86,476 |
| Mean Family Income | 2,587 | $102,383 |
| Median Household Income | 4,146 | $67,176 |
| Mean Household Income | 4,146 | $90,528 |
| Income Deficit | 2,587 | $14,207 |
| Wage / Income Gap (%) | 9,862 | 29.31% |
| Wage / Income Gap ($) | 9,862 | 70.69¢ per $1 |
| Gini / Inequality Index | 9,862 | 0.45 |
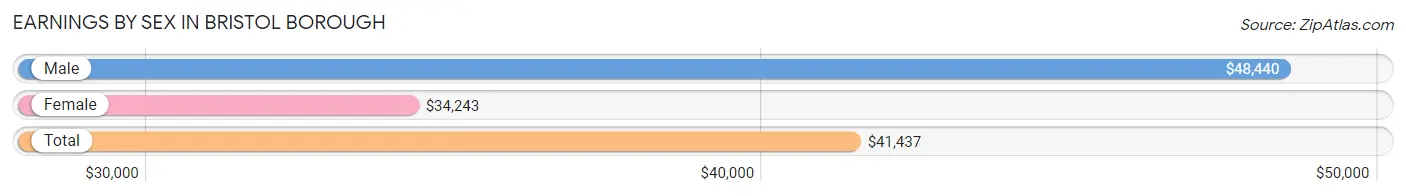
Earnings by Sex in Bristol borough
Average Earnings in Bristol borough are $41,437, $48,440 for men and $34,243 for women, a difference of 29.3%.
| Sex | Number | Average Earnings |
| Male | 2,824 (51.8%) | $48,440 |
| Female | 2,630 (48.2%) | $34,243 |
| Total | 5,454 (100.0%) | $41,437 |
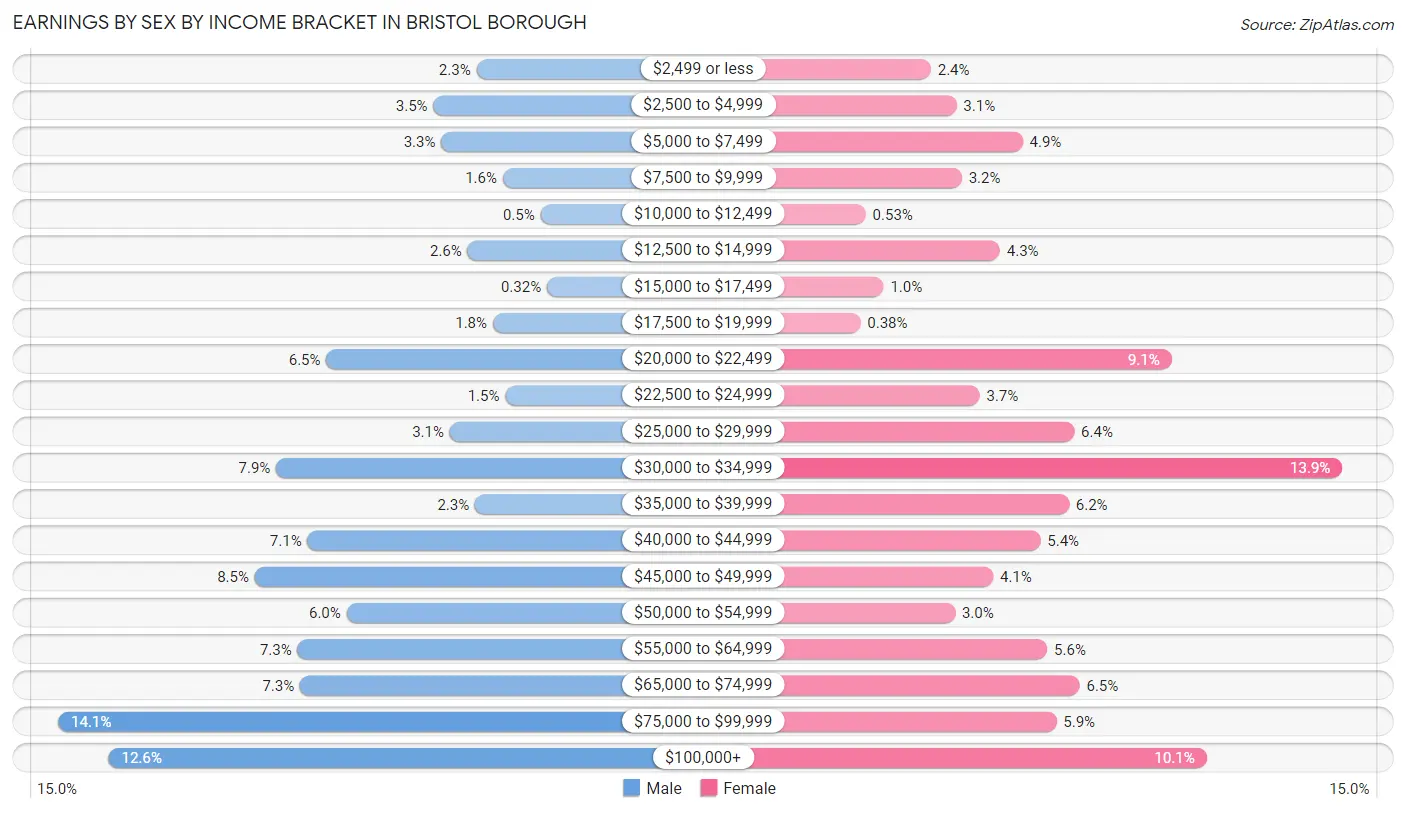
Earnings by Sex by Income Bracket in Bristol borough
The most common earnings brackets in Bristol borough are $75,000 to $99,999 for men (397 | 14.1%) and $30,000 to $34,999 for women (366 | 13.9%).
| Income | Male | Female |
| $2,499 or less | 65 (2.3%) | 62 (2.4%) |
| $2,500 to $4,999 | 99 (3.5%) | 81 (3.1%) |
| $5,000 to $7,499 | 93 (3.3%) | 130 (4.9%) |
| $7,500 to $9,999 | 44 (1.6%) | 85 (3.2%) |
| $10,000 to $12,499 | 14 (0.5%) | 14 (0.5%) |
| $12,500 to $14,999 | 72 (2.5%) | 113 (4.3%) |
| $15,000 to $17,499 | 9 (0.3%) | 27 (1.0%) |
| $17,500 to $19,999 | 52 (1.8%) | 10 (0.4%) |
| $20,000 to $22,499 | 184 (6.5%) | 240 (9.1%) |
| $22,500 to $24,999 | 42 (1.5%) | 98 (3.7%) |
| $25,000 to $29,999 | 86 (3.0%) | 168 (6.4%) |
| $30,000 to $34,999 | 224 (7.9%) | 366 (13.9%) |
| $35,000 to $39,999 | 66 (2.3%) | 164 (6.2%) |
| $40,000 to $44,999 | 199 (7.0%) | 143 (5.4%) |
| $45,000 to $49,999 | 241 (8.5%) | 108 (4.1%) |
| $50,000 to $54,999 | 168 (5.9%) | 80 (3.0%) |
| $55,000 to $64,999 | 207 (7.3%) | 148 (5.6%) |
| $65,000 to $74,999 | 205 (7.3%) | 172 (6.5%) |
| $75,000 to $99,999 | 397 (14.1%) | 155 (5.9%) |
| $100,000+ | 357 (12.6%) | 266 (10.1%) |
| Total | 2,824 (100.0%) | 2,630 (100.0%) |
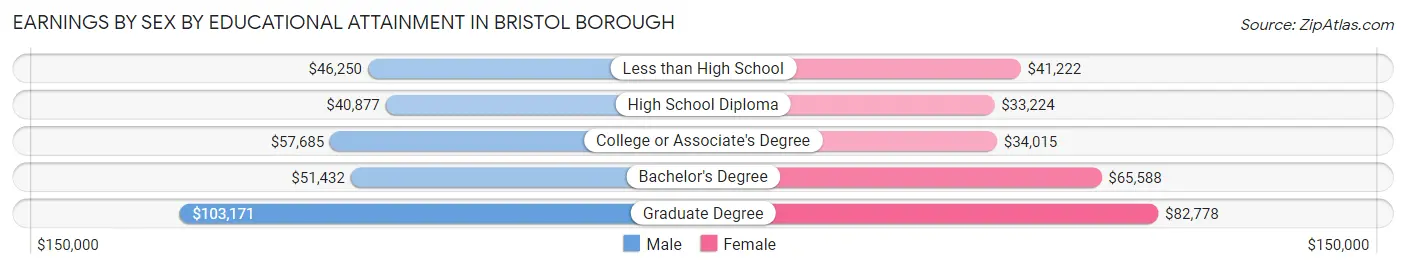
Earnings by Sex by Educational Attainment in Bristol borough
Average earnings in Bristol borough are $50,051 for men and $36,621 for women, a difference of 26.8%. Men with an educational attainment of graduate degree enjoy the highest average annual earnings of $103,171, while those with high school diploma education earn the least with $40,877. Women with an educational attainment of graduate degree earn the most with the average annual earnings of $82,778, while those with high school diploma education have the smallest earnings of $33,224.
| Educational Attainment | Male Income | Female Income |
| Less than High School | $46,250 | $41,222 |
| High School Diploma | $40,877 | $33,224 |
| College or Associate's Degree | $57,685 | $34,015 |
| Bachelor's Degree | $51,432 | $65,588 |
| Graduate Degree | $103,171 | $82,778 |
| Total | $50,051 | $36,621 |
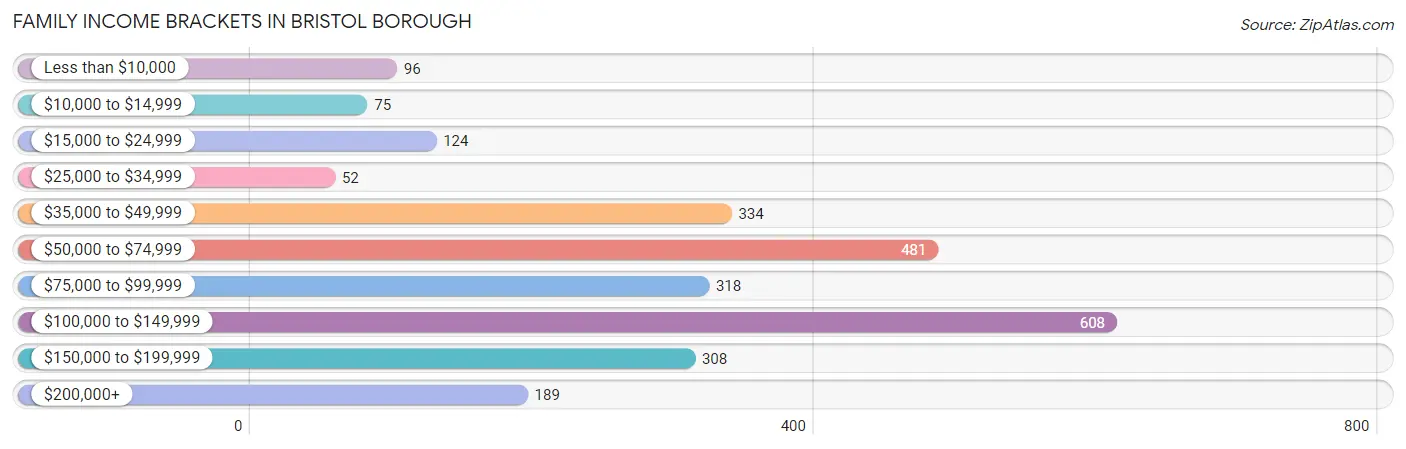
Family Income in Bristol borough
Family Income Brackets in Bristol borough
According to the Bristol borough family income data, there are 608 families falling into the $100,000 to $149,999 income range, which is the most common income bracket and makes up 23.5% of all families. Conversely, the $25,000 to $34,999 income bracket is the least frequent group with only 52 families (2.0%) belonging to this category.
| Income Bracket | # Families | % Families |
| Less than $10,000 | 96 | 3.7% |
| $10,000 to $14,999 | 75 | 2.9% |
| $15,000 to $24,999 | 124 | 4.8% |
| $25,000 to $34,999 | 52 | 2.0% |
| $35,000 to $49,999 | 334 | 12.9% |
| $50,000 to $74,999 | 481 | 18.6% |
| $75,000 to $99,999 | 318 | 12.3% |
| $100,000 to $149,999 | 608 | 23.5% |
| $150,000 to $199,999 | 308 | 11.9% |
| $200,000+ | 189 | 7.3% |
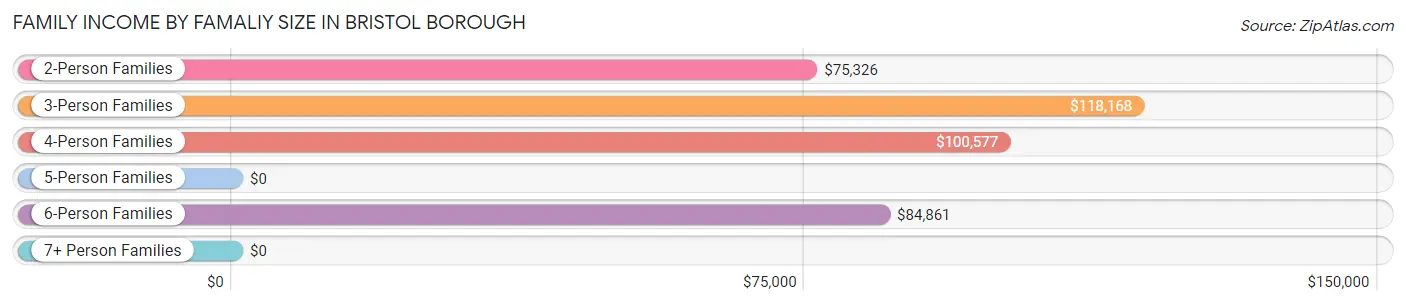
Family Income by Famaliy Size in Bristol borough
3-person families (591 | 22.8%) account for the highest median family income in Bristol borough with $118,168 per family, while 3-person families (591 | 22.8%) have the highest median income of $39,389 per family member.
| Income Bracket | # Families | Median Income |
| 2-Person Families | 1,154 (44.6%) | $75,326 |
| 3-Person Families | 591 (22.8%) | $118,168 |
| 4-Person Families | 430 (16.6%) | $100,577 |
| 5-Person Families | 309 (11.9%) | $0 |
| 6-Person Families | 87 (3.4%) | $84,861 |
| 7+ Person Families | 16 (0.6%) | $0 |
| Total | 2,587 (100.0%) | $86,476 |
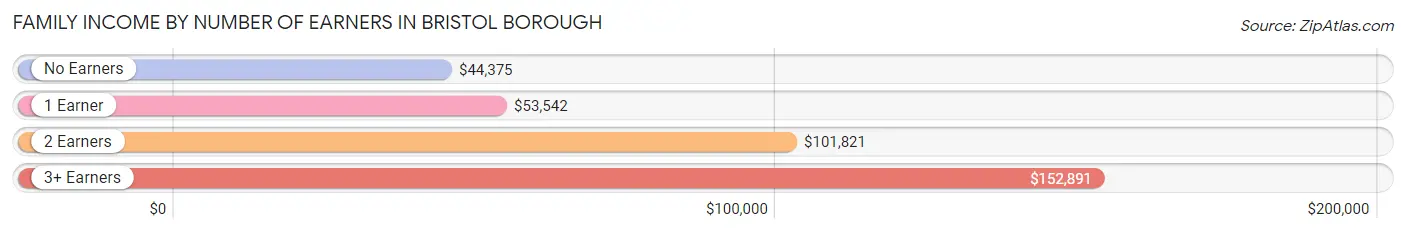
Family Income by Number of Earners in Bristol borough
The median family income in Bristol borough is $86,476, with families comprising 3+ earners (323) having the highest median family income of $152,891, while families with no earners (240) have the lowest median family income of $44,375, accounting for 12.5% and 9.3% of families, respectively.
| Number of Earners | # Families | Median Income |
| No Earners | 240 (9.3%) | $44,375 |
| 1 Earner | 752 (29.1%) | $53,542 |
| 2 Earners | 1,272 (49.2%) | $101,821 |
| 3+ Earners | 323 (12.5%) | $152,891 |
| Total | 2,587 (100.0%) | $86,476 |
Household Income in Bristol borough
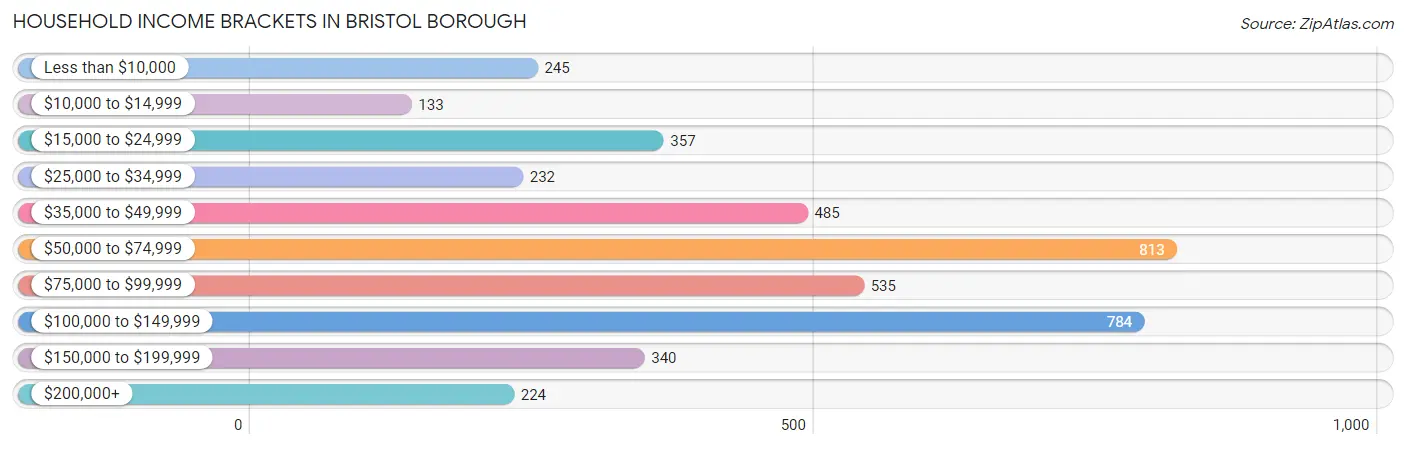
Household Income Brackets in Bristol borough
With 813 households falling in the category, the $50,000 to $74,999 income range is the most frequent in Bristol borough, accounting for 19.6% of all households. In contrast, only 133 households (3.2%) fall into the $10,000 to $14,999 income bracket, making it the least populous group.
| Income Bracket | # Households | % Households |
| Less than $10,000 | 245 | 5.9% |
| $10,000 to $14,999 | 133 | 3.2% |
| $15,000 to $24,999 | 357 | 8.6% |
| $25,000 to $34,999 | 232 | 5.6% |
| $35,000 to $49,999 | 485 | 11.7% |
| $50,000 to $74,999 | 813 | 19.6% |
| $75,000 to $99,999 | 535 | 12.9% |
| $100,000 to $149,999 | 784 | 18.9% |
| $150,000 to $199,999 | 340 | 8.2% |
| $200,000+ | 224 | 5.4% |
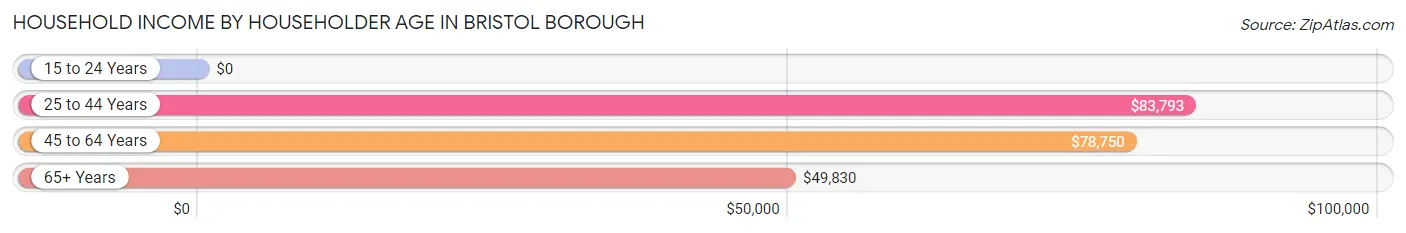
Household Income by Householder Age in Bristol borough
The median household income in Bristol borough is $67,176, with the highest median household income of $83,793 found in the 25 to 44 years age bracket for the primary householder. A total of 1,554 households (37.5%) fall into this category. Meanwhile, the 15 to 24 years age bracket for the primary householder has the lowest median household income of $0, with 79 households (1.9%) in this group.
| Income Bracket | # Households | Median Income |
| 15 to 24 Years | 79 (1.9%) | $0 |
| 25 to 44 Years | 1,554 (37.5%) | $83,793 |
| 45 to 64 Years | 1,204 (29.0%) | $78,750 |
| 65+ Years | 1,309 (31.6%) | $49,830 |
| Total | 4,146 (100.0%) | $67,176 |
Poverty in Bristol borough
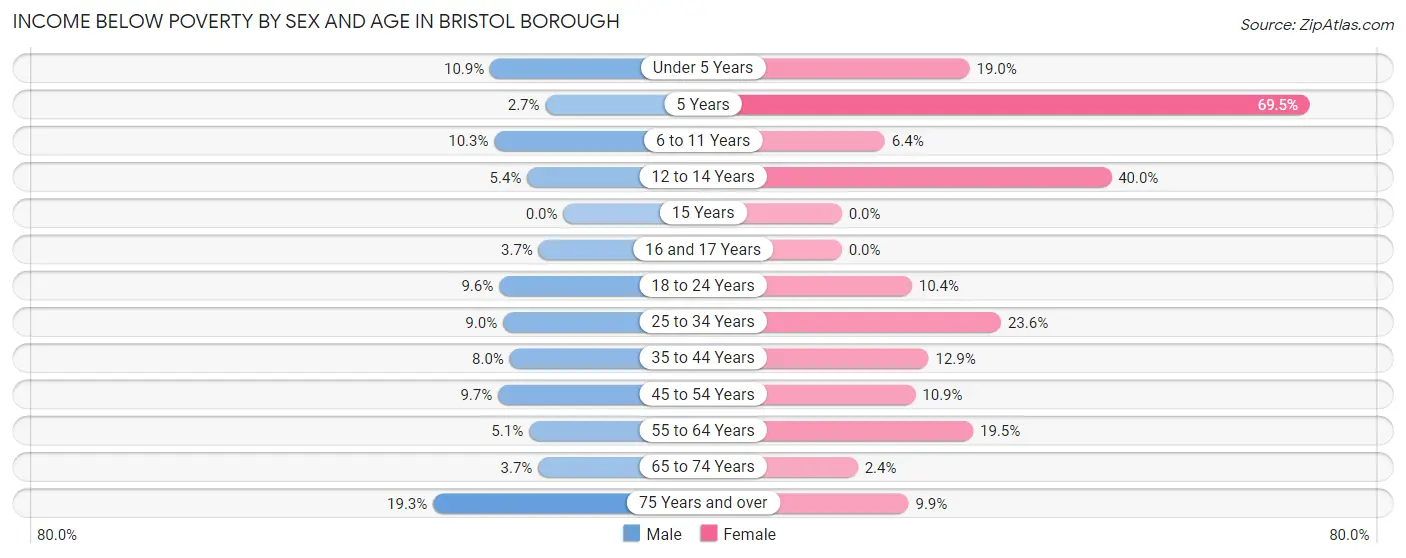
Income Below Poverty by Sex and Age in Bristol borough
With 8.3% poverty level for males and 15.1% for females among the residents of Bristol borough, 75 year old and over males and 5 year old females are the most vulnerable to poverty, with 47 males (19.3%) and 41 females (69.5%) in their respective age groups living below the poverty level.
| Age Bracket | Male | Female |
| Under 5 Years | 39 (10.9%) | 82 (19.0%) |
| 5 Years | 2 (2.7%) | 41 (69.5%) |
| 6 to 11 Years | 47 (10.3%) | 13 (6.4%) |
| 12 to 14 Years | 12 (5.4%) | 92 (40.0%) |
| 15 Years | 0 (0.0%) | 0 (0.0%) |
| 16 and 17 Years | 3 (3.7%) | 0 (0.0%) |
| 18 to 24 Years | 17 (9.6%) | 43 (10.4%) |
| 25 to 34 Years | 77 (9.0%) | 148 (23.6%) |
| 35 to 44 Years | 61 (8.0%) | 109 (12.9%) |
| 45 to 54 Years | 46 (9.7%) | 64 (10.9%) |
| 55 to 64 Years | 29 (5.1%) | 107 (19.5%) |
| 65 to 74 Years | 20 (3.7%) | 13 (2.4%) |
| 75 Years and over | 47 (19.3%) | 45 (9.9%) |
| Total | 400 (8.3%) | 757 (15.1%) |
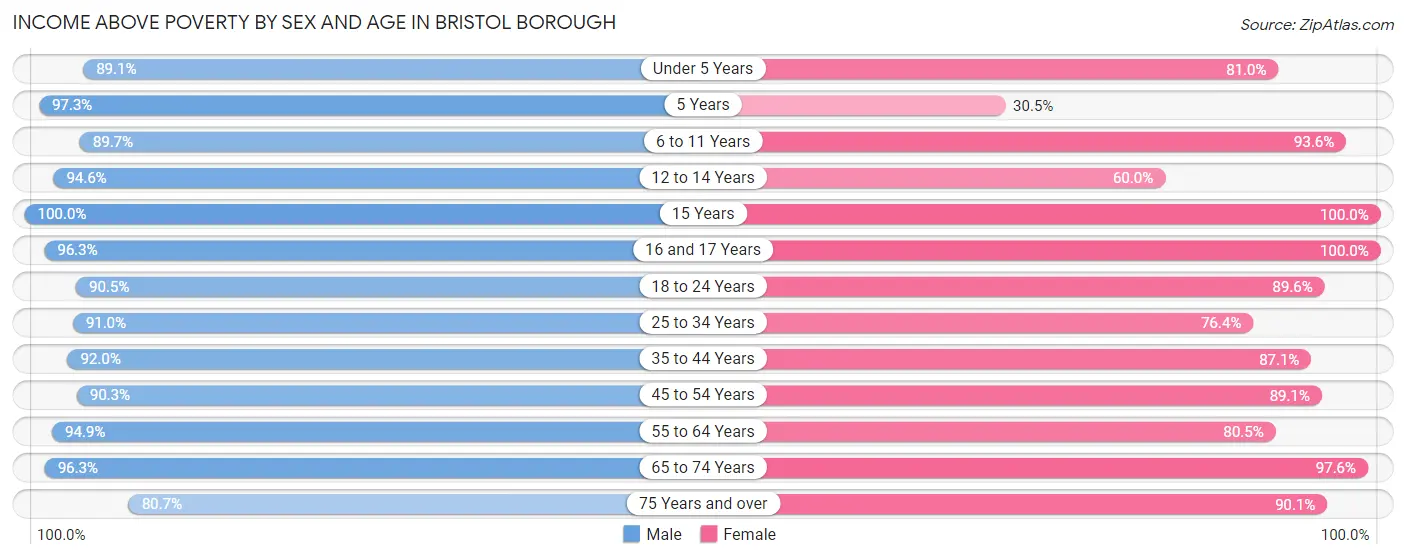
Income Above Poverty by Sex and Age in Bristol borough
According to the poverty statistics in Bristol borough, males aged 15 years and females aged 15 years are the age groups that are most secure financially, with 100.0% of males and 100.0% of females in these age groups living above the poverty line.
| Age Bracket | Male | Female |
| Under 5 Years | 319 (89.1%) | 350 (81.0%) |
| 5 Years | 73 (97.3%) | 18 (30.5%) |
| 6 to 11 Years | 411 (89.7%) | 190 (93.6%) |
| 12 to 14 Years | 212 (94.6%) | 138 (60.0%) |
| 15 Years | 22 (100.0%) | 9 (100.0%) |
| 16 and 17 Years | 79 (96.3%) | 58 (100.0%) |
| 18 to 24 Years | 161 (90.4%) | 371 (89.6%) |
| 25 to 34 Years | 782 (91.0%) | 478 (76.4%) |
| 35 to 44 Years | 704 (92.0%) | 737 (87.1%) |
| 45 to 54 Years | 428 (90.3%) | 522 (89.1%) |
| 55 to 64 Years | 540 (94.9%) | 442 (80.5%) |
| 65 to 74 Years | 515 (96.3%) | 539 (97.6%) |
| 75 Years and over | 196 (80.7%) | 409 (90.1%) |
| Total | 4,442 (91.7%) | 4,261 (84.9%) |
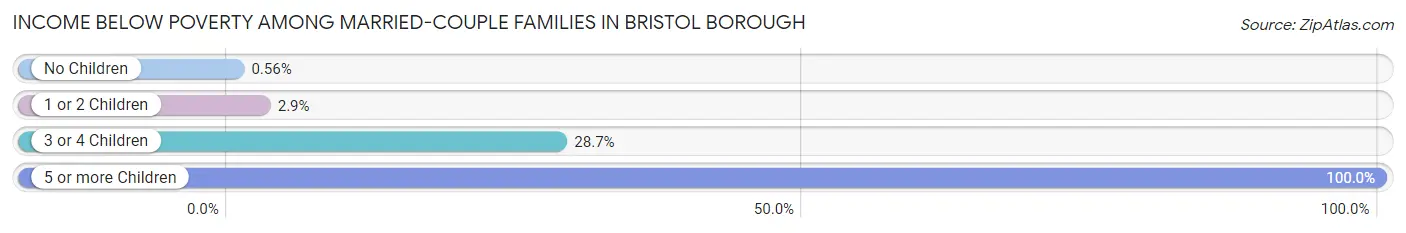
Income Below Poverty Among Married-Couple Families in Bristol borough
The poverty statistics for married-couple families in Bristol borough show that 3.9% or 67 of the total 1,706 families live below the poverty line. Families with 5 or more children have the highest poverty rate of 100.0%, comprising of 2 families. On the other hand, families with no children have the lowest poverty rate of 0.6%, which includes 5 families.
| Children | Above Poverty | Below Poverty |
| No Children | 889 (99.4%) | 5 (0.6%) |
| 1 or 2 Children | 648 (97.2%) | 19 (2.9%) |
| 3 or 4 Children | 102 (71.3%) | 41 (28.7%) |
| 5 or more Children | 0 (0.0%) | 2 (100.0%) |
| Total | 1,639 (96.1%) | 67 (3.9%) |
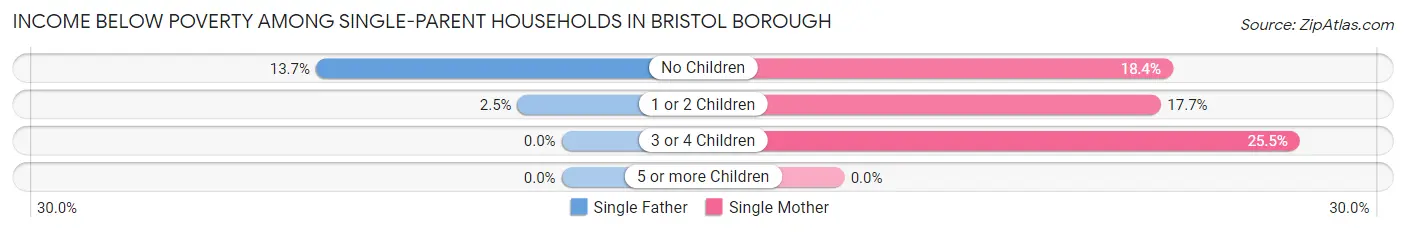
Income Below Poverty Among Single-Parent Households in Bristol borough
According to the poverty data in Bristol borough, 8.2% or 24 single-father households and 20.0% or 118 single-mother households are living below the poverty line. Among single-father households, those with no children have the highest poverty rate, with 21 households (13.7%) experiencing poverty. Likewise, among single-mother households, those with 3 or 4 children have the highest poverty rate, with 40 households (25.5%) falling below the poverty line.
| Children | Single Father | Single Mother |
| No Children | 21 (13.7%) | 41 (18.4%) |
| 1 or 2 Children | 3 (2.5%) | 37 (17.7%) |
| 3 or 4 Children | 0 (0.0%) | 40 (25.5%) |
| 5 or more Children | 0 (0.0%) | 0 (0.0%) |
| Total | 24 (8.2%) | 118 (20.0%) |
Income Below Poverty Among Married-Couple vs Single-Parent Households in Bristol borough
The poverty data for Bristol borough shows that 67 of the married-couple family households (3.9%) and 142 of the single-parent households (16.1%) are living below the poverty level. Within the married-couple family households, those with 5 or more children have the highest poverty rate, with 2 households (100.0%) falling below the poverty line. Among the single-parent households, those with 3 or 4 children have the highest poverty rate, with 40 household (23.0%) living below poverty.
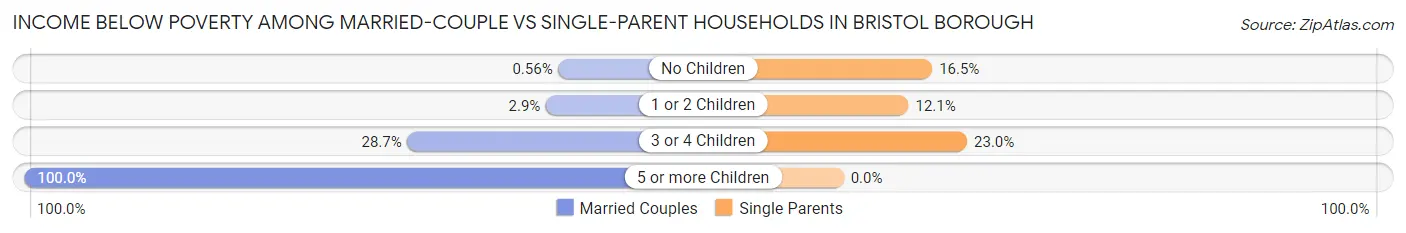
| Children | Married-Couple Families | Single-Parent Households |
| No Children | 5 (0.6%) | 62 (16.5%) |
| 1 or 2 Children | 19 (2.9%) | 40 (12.1%) |
| 3 or 4 Children | 41 (28.7%) | 40 (23.0%) |
| 5 or more Children | 2 (100.0%) | 0 (0.0%) |
| Total | 67 (3.9%) | 142 (16.1%) |
Race in Bristol borough
The most populous races in Bristol borough are White / Caucasian (7,773 | 78.8%), Hispanic or Latino (1,582 | 16.0%), and Two or more Races (751 | 7.6%).
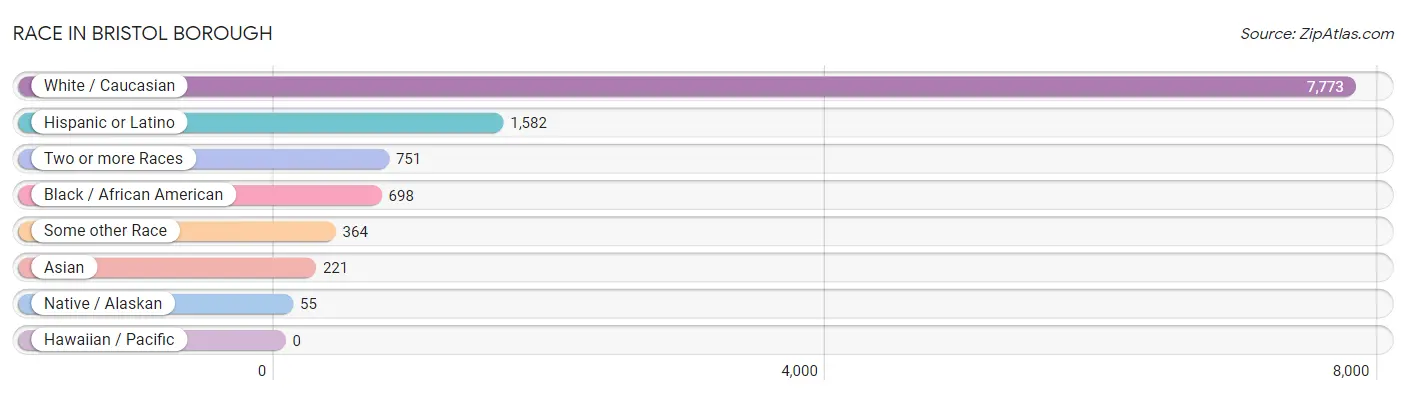
| Race | # Population | % Population |
| Asian | 221 | 2.2% |
| Black / African American | 698 | 7.1% |
| Hawaiian / Pacific | 0 | 0.0% |
| Hispanic or Latino | 1,582 | 16.0% |
| Native / Alaskan | 55 | 0.6% |
| White / Caucasian | 7,773 | 78.8% |
| Two or more Races | 751 | 7.6% |
| Some other Race | 364 | 3.7% |
| Total | 9,862 | 100.0% |
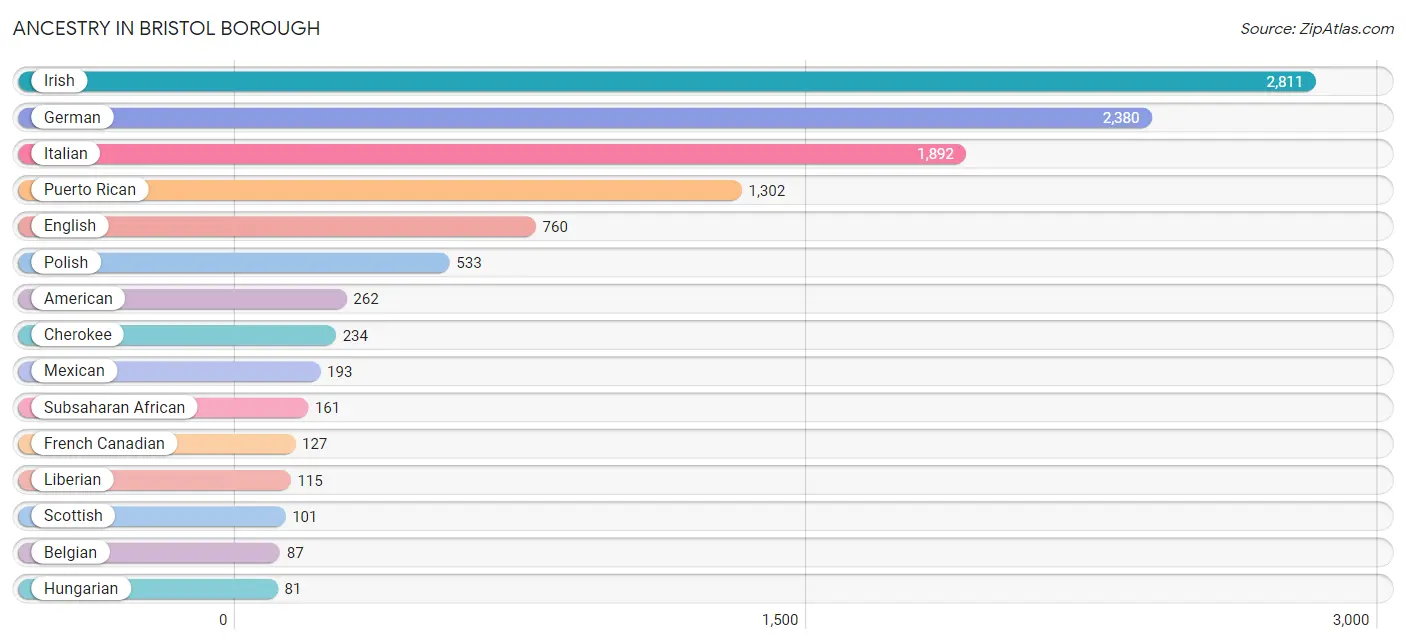
Ancestry in Bristol borough
The most populous ancestries reported in Bristol borough are Irish (2,811 | 28.5%), German (2,380 | 24.1%), Italian (1,892 | 19.2%), Puerto Rican (1,302 | 13.2%), and English (760 | 7.7%), together accounting for 92.7% of all Bristol borough residents.
| Ancestry | # Population | % Population |
| African | 25 | 0.3% |
| American | 262 | 2.7% |
| Austrian | 40 | 0.4% |
| Belgian | 87 | 0.9% |
| Bhutanese | 9 | 0.1% |
| British | 62 | 0.6% |
| Bulgarian | 11 | 0.1% |
| Burmese | 31 | 0.3% |
| Cambodian | 30 | 0.3% |
| Canadian | 12 | 0.1% |
| Central American Indian | 37 | 0.4% |
| Cherokee | 234 | 2.4% |
| Colombian | 46 | 0.5% |
| Czech | 32 | 0.3% |
| Czechoslovakian | 1 | 0.0% |
| Dutch | 71 | 0.7% |
| Eastern European | 17 | 0.2% |
| Ecuadorian | 27 | 0.3% |
| English | 760 | 7.7% |
| European | 7 | 0.1% |
| French | 74 | 0.7% |
| French Canadian | 127 | 1.3% |
| German | 2,380 | 24.1% |
| Hungarian | 81 | 0.8% |
| Irish | 2,811 | 28.5% |
| Iroquois | 3 | 0.0% |
| Italian | 1,892 | 19.2% |
| Korean | 30 | 0.3% |
| Liberian | 115 | 1.2% |
| Lithuanian | 70 | 0.7% |
| Lumbee | 8 | 0.1% |
| Mexican | 193 | 2.0% |
| Mexican American Indian | 10 | 0.1% |
| Norwegian | 63 | 0.6% |
| Pennsylvania German | 13 | 0.1% |
| Polish | 533 | 5.4% |
| Portuguese | 78 | 0.8% |
| Puerto Rican | 1,302 | 13.2% |
| Russian | 41 | 0.4% |
| Scotch-Irish | 61 | 0.6% |
| Scottish | 101 | 1.0% |
| Sierra Leonean | 21 | 0.2% |
| Slovak | 44 | 0.4% |
| South American | 73 | 0.7% |
| Spanish | 14 | 0.1% |
| Sri Lankan | 16 | 0.2% |
| Subsaharan African | 161 | 1.6% |
| Swedish | 41 | 0.4% |
| Thai | 47 | 0.5% |
| Ukrainian | 50 | 0.5% |
| Welsh | 81 | 0.8% | View All 51 Rows |
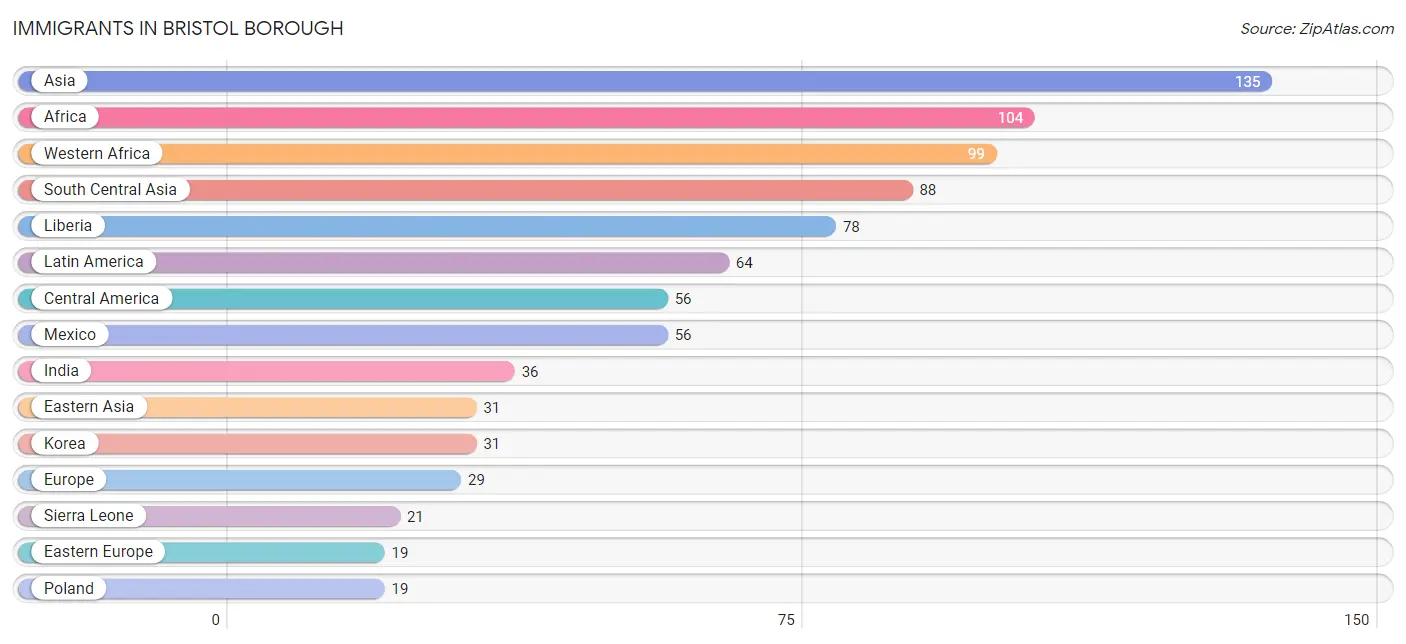
Immigrants in Bristol borough
The most numerous immigrant groups reported in Bristol borough came from Asia (135 | 1.4%), Africa (104 | 1.1%), Western Africa (99 | 1.0%), South Central Asia (88 | 0.9%), and Liberia (78 | 0.8%), together accounting for 5.1% of all Bristol borough residents.
| Immigration Origin | # Population | % Population |
| Africa | 104 | 1.1% |
| Asia | 135 | 1.4% |
| Central America | 56 | 0.6% |
| Eastern Africa | 5 | 0.1% |
| Eastern Asia | 31 | 0.3% |
| Eastern Europe | 19 | 0.2% |
| Ecuador | 8 | 0.1% |
| Europe | 29 | 0.3% |
| India | 36 | 0.4% |
| Italy | 10 | 0.1% |
| Korea | 31 | 0.3% |
| Latin America | 64 | 0.6% |
| Liberia | 78 | 0.8% |
| Mexico | 56 | 0.6% |
| Philippines | 16 | 0.2% |
| Poland | 19 | 0.2% |
| Sierra Leone | 21 | 0.2% |
| South America | 8 | 0.1% |
| South Central Asia | 88 | 0.9% |
| South Eastern Asia | 16 | 0.2% |
| Southern Europe | 10 | 0.1% |
| Western Africa | 99 | 1.0% | View All 22 Rows |
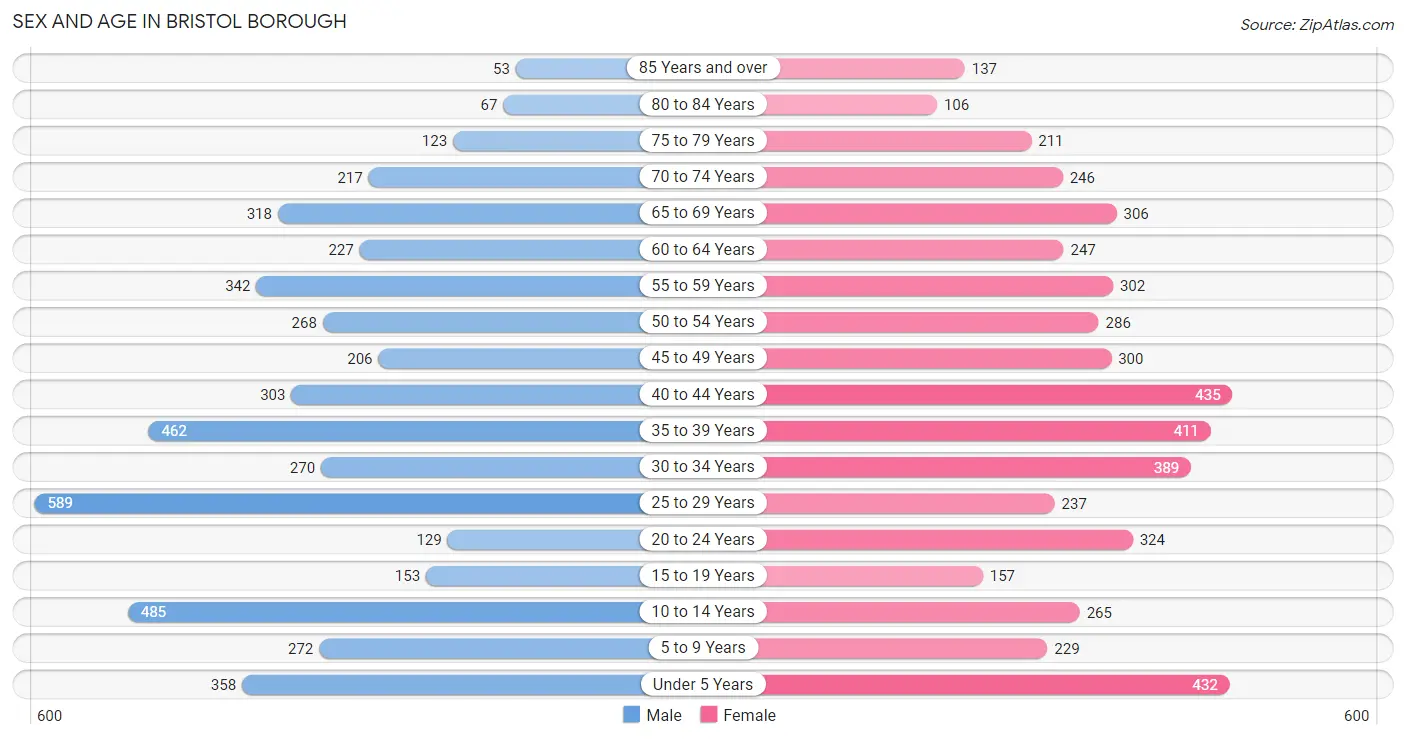
Sex and Age in Bristol borough
Sex and Age in Bristol borough
The most populous age groups in Bristol borough are 25 to 29 Years (589 | 12.2%) for men and 40 to 44 Years (435 | 8.7%) for women.
| Age Bracket | Male | Female |
| Under 5 Years | 358 (7.4%) | 432 (8.6%) |
| 5 to 9 Years | 272 (5.6%) | 229 (4.6%) |
| 10 to 14 Years | 485 (10.0%) | 265 (5.3%) |
| 15 to 19 Years | 153 (3.2%) | 157 (3.1%) |
| 20 to 24 Years | 129 (2.7%) | 324 (6.5%) |
| 25 to 29 Years | 589 (12.2%) | 237 (4.7%) |
| 30 to 34 Years | 270 (5.6%) | 389 (7.7%) |
| 35 to 39 Years | 462 (9.5%) | 411 (8.2%) |
| 40 to 44 Years | 303 (6.3%) | 435 (8.7%) |
| 45 to 49 Years | 206 (4.3%) | 300 (6.0%) |
| 50 to 54 Years | 268 (5.5%) | 286 (5.7%) |
| 55 to 59 Years | 342 (7.1%) | 302 (6.0%) |
| 60 to 64 Years | 227 (4.7%) | 247 (4.9%) |
| 65 to 69 Years | 318 (6.6%) | 306 (6.1%) |
| 70 to 74 Years | 217 (4.5%) | 246 (4.9%) |
| 75 to 79 Years | 123 (2.5%) | 211 (4.2%) |
| 80 to 84 Years | 67 (1.4%) | 106 (2.1%) |
| 85 Years and over | 53 (1.1%) | 137 (2.7%) |
| Total | 4,842 (100.0%) | 5,020 (100.0%) |
Families and Households in Bristol borough
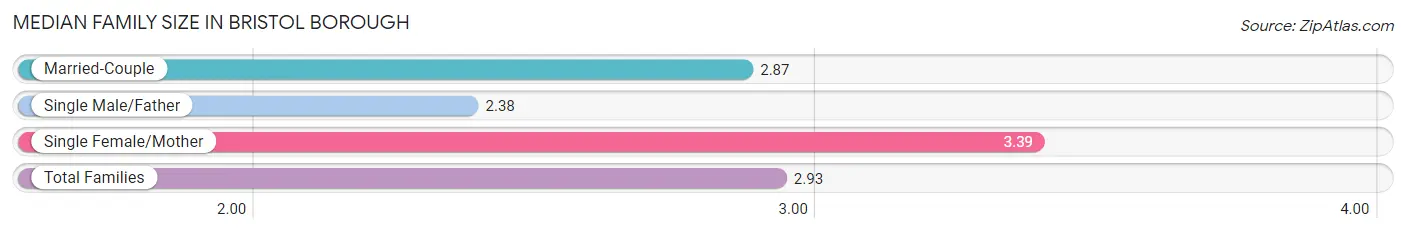
Median Family Size in Bristol borough
The median family size in Bristol borough is 2.93 persons per family, with single female/mother families (589 | 22.8%) accounting for the largest median family size of 3.39 persons per family. On the other hand, single male/father families (292 | 11.3%) represent the smallest median family size with 2.38 persons per family.
| Family Type | # Families | Family Size |
| Married-Couple | 1,706 (65.9%) | 2.87 |
| Single Male/Father | 292 (11.3%) | 2.38 |
| Single Female/Mother | 589 (22.8%) | 3.39 |
| Total Families | 2,587 (100.0%) | 2.93 |
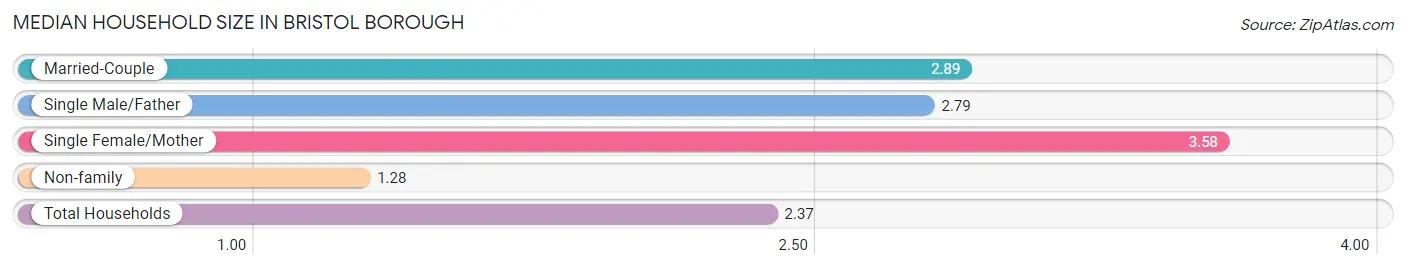
Median Household Size in Bristol borough
The median household size in Bristol borough is 2.37 persons per household, with single female/mother households (589 | 14.2%) accounting for the largest median household size of 3.58 persons per household. non-family households (1,559 | 37.6%) represent the smallest median household size with 1.28 persons per household.
| Household Type | # Households | Household Size |
| Married-Couple | 1,706 (41.1%) | 2.89 |
| Single Male/Father | 292 (7.0%) | 2.79 |
| Single Female/Mother | 589 (14.2%) | 3.58 |
| Non-family | 1,559 (37.6%) | 1.28 |
| Total Households | 4,146 (100.0%) | 2.37 |
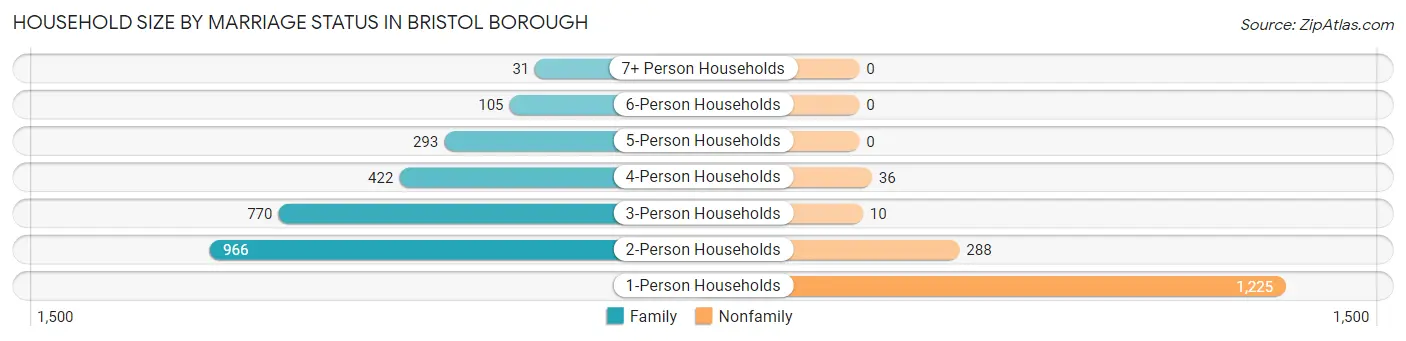
Household Size by Marriage Status in Bristol borough
Out of a total of 4,146 households in Bristol borough, 2,587 (62.4%) are family households, while 1,559 (37.6%) are nonfamily households. The most numerous type of family households are 2-person households, comprising 966, and the most common type of nonfamily households are 1-person households, comprising 1,225.
| Household Size | Family Households | Nonfamily Households |
| 1-Person Households | - | 1,225 (29.5%) |
| 2-Person Households | 966 (23.3%) | 288 (7.0%) |
| 3-Person Households | 770 (18.6%) | 10 (0.2%) |
| 4-Person Households | 422 (10.2%) | 36 (0.9%) |
| 5-Person Households | 293 (7.1%) | 0 (0.0%) |
| 6-Person Households | 105 (2.5%) | 0 (0.0%) |
| 7+ Person Households | 31 (0.7%) | 0 (0.0%) |
| Total | 2,587 (62.4%) | 1,559 (37.6%) |
Female Fertility in Bristol borough
Fertility by Age in Bristol borough
Average fertility rate in Bristol borough is 31.0 births per 1,000 women. Women in the age bracket of 20 to 34 years have the highest fertility rate with 45.0 births per 1,000 women. Women in the age bracket of 20 to 34 years acount for 58.9% of all women with births.
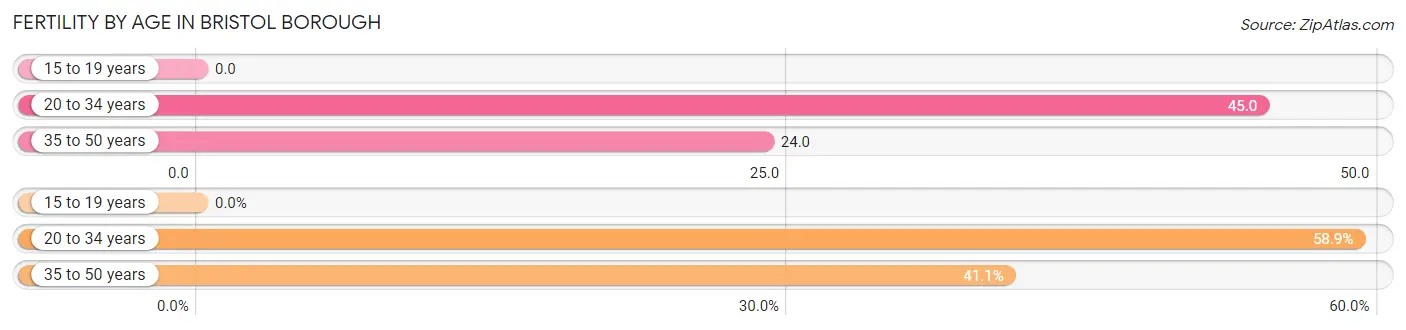
| Age Bracket | Women with Births | Births / 1,000 Women |
| 15 to 19 years | 0 (0.0%) | 0.0 |
| 20 to 34 years | 43 (58.9%) | 45.0 |
| 35 to 50 years | 30 (41.1%) | 24.0 |
| Total | 73 (100.0%) | 31.0 |
Fertility by Age by Marriage Status in Bristol borough
41.1% of women with births (73) in Bristol borough are married. The highest percentage of unmarried women with births falls into 20 to 34 years age bracket with 100.0% of them unmarried at the time of birth, while the lowest percentage of unmarried women with births belong to 35 to 50 years age bracket with 0.0% of them unmarried.
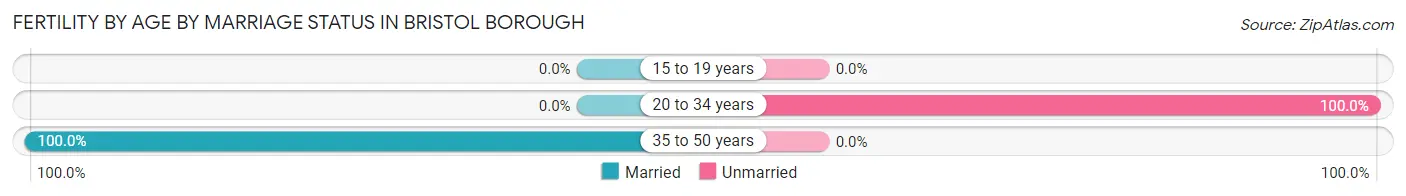
| Age Bracket | Married | Unmarried |
| 15 to 19 years | 0 (0.0%) | 0 (0.0%) |
| 20 to 34 years | 0 (0.0%) | 43 (100.0%) |
| 35 to 50 years | 30 (100.0%) | 0 (0.0%) |
| Total | 30 (41.1%) | 43 (58.9%) |
Fertility by Education in Bristol borough
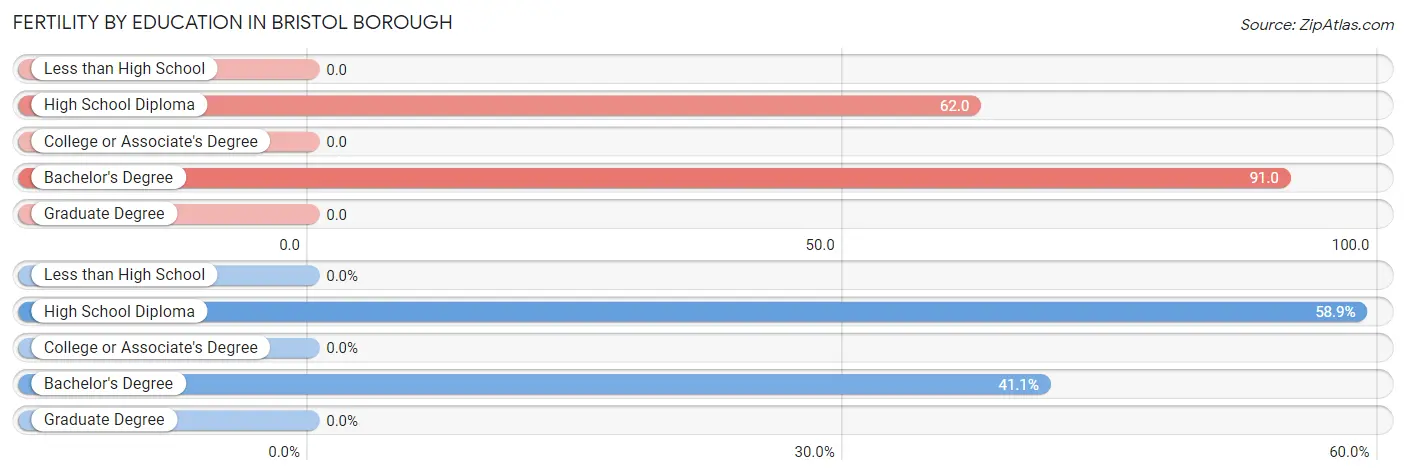
| Educational Attainment | Women with Births | Births / 1,000 Women |
| Less than High School | 0 (0.0%) | 0.0 |
| High School Diploma | 43 (58.9%) | 62.0 |
| College or Associate's Degree | 0 (0.0%) | 0.0 |
| Bachelor's Degree | 30 (41.1%) | 91.0 |
| Graduate Degree | 0 (0.0%) | 0.0 |
| Total | 73 (100.0%) | 31.0 |
Fertility by Education by Marriage Status in Bristol borough
58.9% of women with births in Bristol borough are unmarried. Women with the educational attainment of bachelor's degree are most likely to be married with 100.0% of them married at childbirth, while women with the educational attainment of high school diploma are least likely to be married with 100.0% of them unmarried at childbirth.
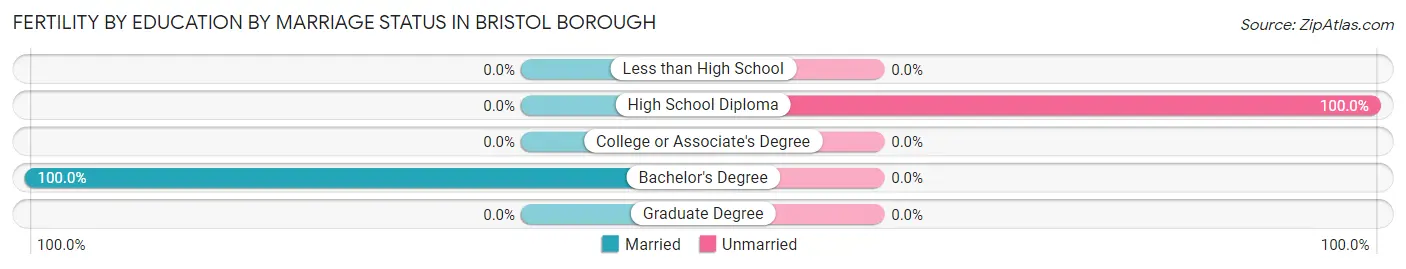
| Educational Attainment | Married | Unmarried |
| Less than High School | 0 (0.0%) | 0 (0.0%) |
| High School Diploma | 0 (0.0%) | 43 (100.0%) |
| College or Associate's Degree | 0 (0.0%) | 0 (0.0%) |
| Bachelor's Degree | 30 (100.0%) | 0 (0.0%) |
| Graduate Degree | 0 (0.0%) | 0 (0.0%) |
| Total | 30 (41.1%) | 43 (58.9%) |
Employment Characteristics in Bristol borough
Employment by Class of Employer in Bristol borough
Among the 4,853 employed individuals in Bristol borough, private company employees (3,712 | 76.5%), not-for-profit organizations (418 | 8.6%), and local government employees (294 | 6.1%) make up the most common classes of employment.
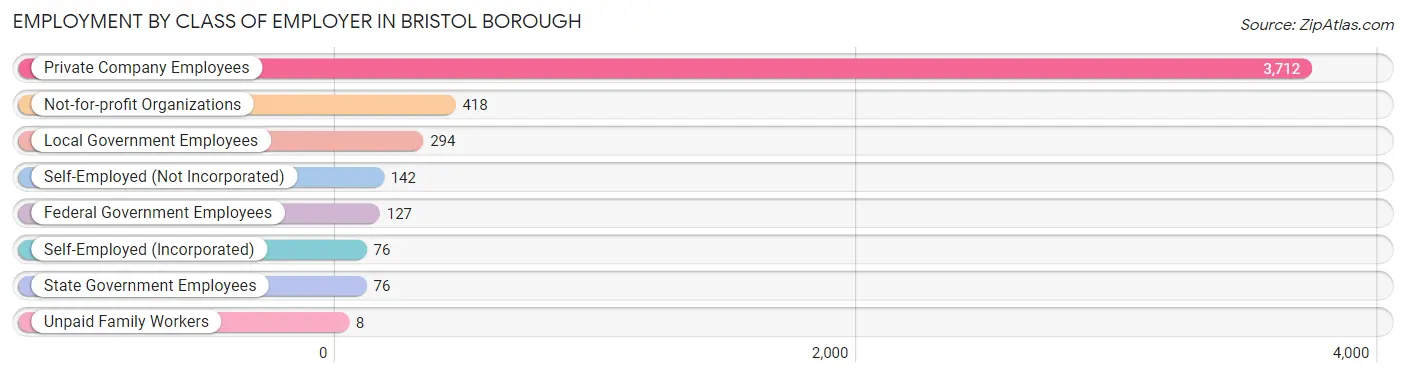
| Employer Class | # Employees | % Employees |
| Private Company Employees | 3,712 | 76.5% |
| Self-Employed (Incorporated) | 76 | 1.6% |
| Self-Employed (Not Incorporated) | 142 | 2.9% |
| Not-for-profit Organizations | 418 | 8.6% |
| Local Government Employees | 294 | 6.1% |
| State Government Employees | 76 | 1.6% |
| Federal Government Employees | 127 | 2.6% |
| Unpaid Family Workers | 8 | 0.2% |
| Total | 4,853 | 100.0% |
Employment Status by Age in Bristol borough
According to the labor force statistics for Bristol borough, out of the total population over 16 years of age (7,790), 67.2% or 5,235 individuals are in the labor force, with 5.8% or 304 of them unemployed. The age group with the highest labor force participation rate is 25 to 29 years, with 97.3% or 804 individuals in the labor force. Within the labor force, the 16 to 19 years age range has the highest percentage of unemployed individuals, with 23.8% or 34 of them being unemployed.
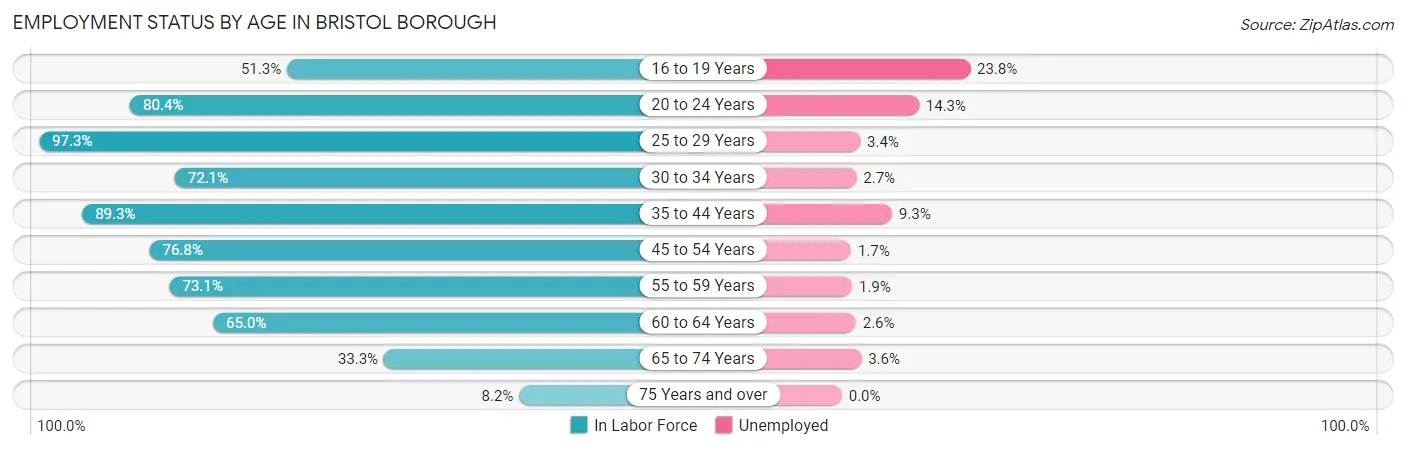
| Age Bracket | In Labor Force | Unemployed |
| 16 to 19 Years | 143 (51.3%) | 34 (23.8%) |
| 20 to 24 Years | 364 (80.4%) | 52 (14.3%) |
| 25 to 29 Years | 804 (97.3%) | 27 (3.4%) |
| 30 to 34 Years | 475 (72.1%) | 13 (2.7%) |
| 35 to 44 Years | 1,439 (89.3%) | 134 (9.3%) |
| 45 to 54 Years | 814 (76.8%) | 14 (1.7%) |
| 55 to 59 Years | 471 (73.1%) | 9 (1.9%) |
| 60 to 64 Years | 308 (65.0%) | 8 (2.6%) |
| 65 to 74 Years | 362 (33.3%) | 13 (3.6%) |
| 75 Years and over | 57 (8.2%) | 0 (0.0%) |
| Total | 5,235 (67.2%) | 304 (5.8%) |
Employment Status by Educational Attainment in Bristol borough
According to labor force statistics for Bristol borough, 81.7% of individuals (4,309) out of the total population between 25 and 64 years of age (5,274) are in the labor force, with 4.8% or 207 of them being unemployed. The group with the highest labor force participation rate are those with the educational attainment of bachelor's degree or higher, with 91.9% or 1,149 individuals in the labor force. Within the labor force, individuals with less than high school education have the highest percentage of unemployment, with 11.5% or 42 of them being unemployed.
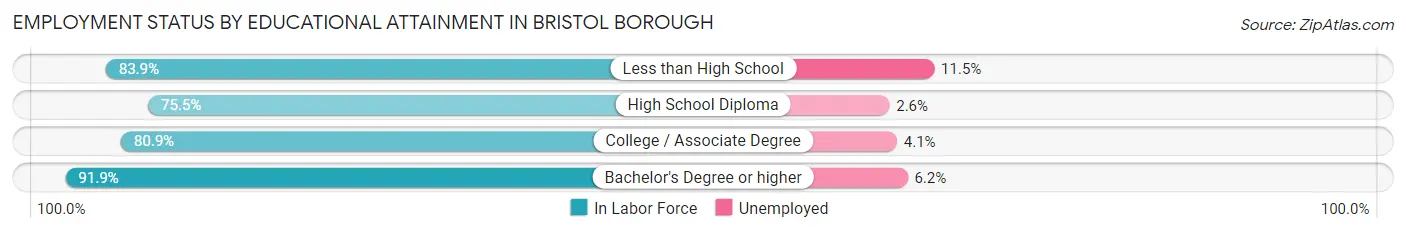
| Educational Attainment | In Labor Force | Unemployed |
| Less than High School | 364 (83.9%) | 50 (11.5%) |
| High School Diploma | 1,493 (75.5%) | 51 (2.6%) |
| College / Associate Degree | 1,304 (80.9%) | 66 (4.1%) |
| Bachelor's Degree or higher | 1,149 (91.9%) | 78 (6.2%) |
| Total | 4,309 (81.7%) | 253 (4.8%) |
Employment Occupations by Sex in Bristol borough
Management, Business, Science and Arts Occupations
The most common Management, Business, Science and Arts occupations in Bristol borough are Community & Social Service (528 | 10.7%), Management (449 | 9.1%), Education Instruction & Library (388 | 7.9%), Business & Financial (293 | 5.9%), and Health Diagnosing & Treating (259 | 5.2%).
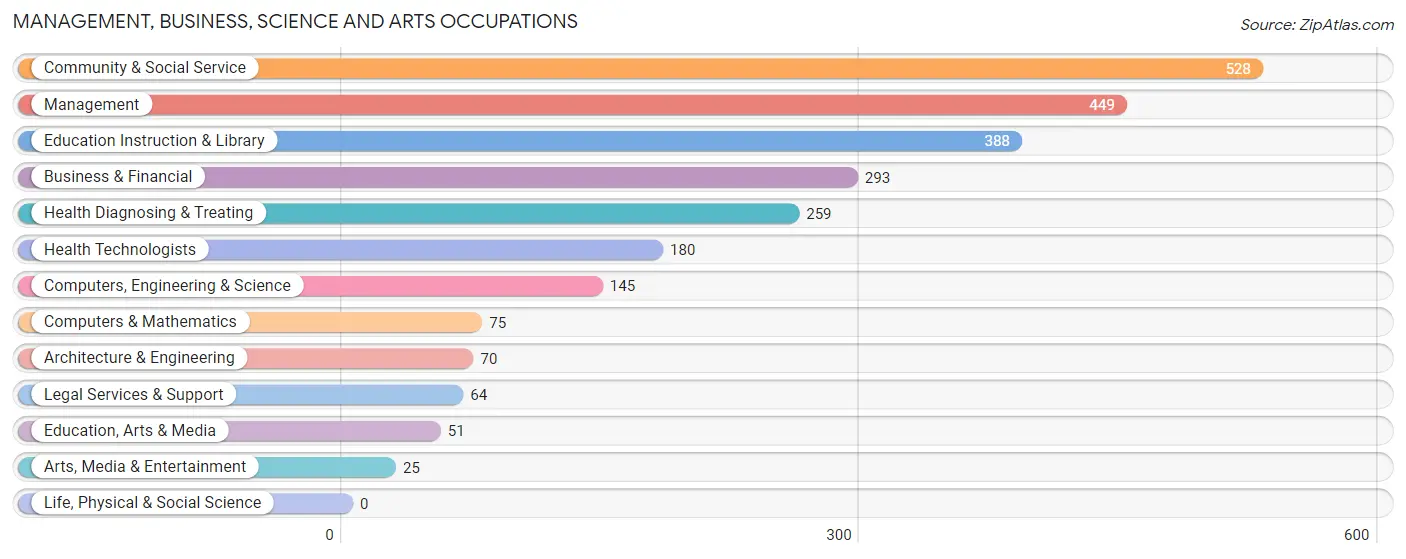
Management, Business, Science and Arts Occupations by Sex
Within the Management, Business, Science and Arts occupations in Bristol borough, the most male-oriented occupations are Architecture & Engineering (100.0%), Arts, Media & Entertainment (100.0%), and Computers, Engineering & Science (93.1%), while the most female-oriented occupations are Health Technologists (83.3%), Legal Services & Support (81.2%), and Education Instruction & Library (67.0%).
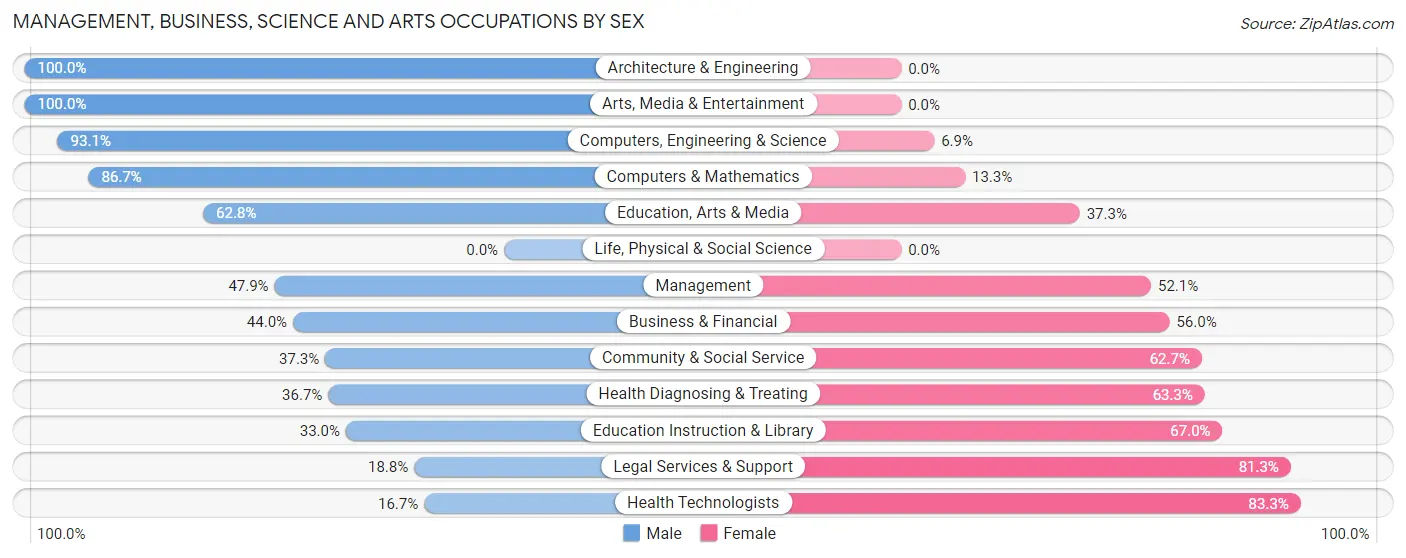
| Occupation | Male | Female |
| Management | 215 (47.9%) | 234 (52.1%) |
| Business & Financial | 129 (44.0%) | 164 (56.0%) |
| Computers, Engineering & Science | 135 (93.1%) | 10 (6.9%) |
| Computers & Mathematics | 65 (86.7%) | 10 (13.3%) |
| Architecture & Engineering | 70 (100.0%) | 0 (0.0%) |
| Life, Physical & Social Science | 0 (0.0%) | 0 (0.0%) |
| Community & Social Service | 197 (37.3%) | 331 (62.7%) |
| Education, Arts & Media | 32 (62.7%) | 19 (37.2%) |
| Legal Services & Support | 12 (18.8%) | 52 (81.2%) |
| Education Instruction & Library | 128 (33.0%) | 260 (67.0%) |
| Arts, Media & Entertainment | 25 (100.0%) | 0 (0.0%) |
| Health Diagnosing & Treating | 95 (36.7%) | 164 (63.3%) |
| Health Technologists | 30 (16.7%) | 150 (83.3%) |
| Total (Category) | 771 (46.1%) | 903 (53.9%) |
| Total (Overall) | 2,552 (51.7%) | 2,381 (48.3%) |
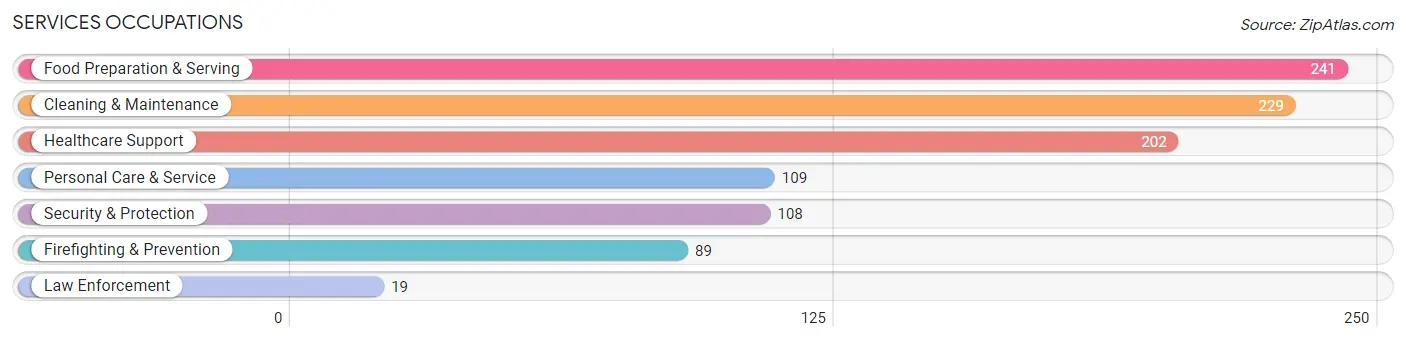
Services Occupations
The most common Services occupations in Bristol borough are Food Preparation & Serving (241 | 4.9%), Cleaning & Maintenance (229 | 4.6%), Healthcare Support (202 | 4.1%), Personal Care & Service (109 | 2.2%), and Security & Protection (108 | 2.2%).
Services Occupations by Sex
Within the Services occupations in Bristol borough, the most male-oriented occupations are Law Enforcement (100.0%), Cleaning & Maintenance (55.9%), and Security & Protection (42.6%), while the most female-oriented occupations are Healthcare Support (100.0%), Personal Care & Service (91.7%), and Firefighting & Prevention (69.7%).
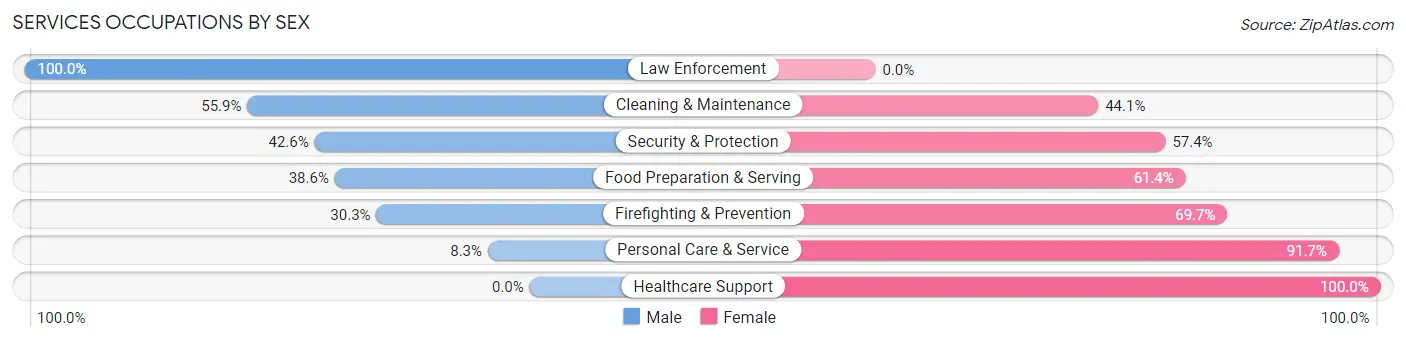
| Occupation | Male | Female |
| Healthcare Support | 0 (0.0%) | 202 (100.0%) |
| Security & Protection | 46 (42.6%) | 62 (57.4%) |
| Firefighting & Prevention | 27 (30.3%) | 62 (69.7%) |
| Law Enforcement | 19 (100.0%) | 0 (0.0%) |
| Food Preparation & Serving | 93 (38.6%) | 148 (61.4%) |
| Cleaning & Maintenance | 128 (55.9%) | 101 (44.1%) |
| Personal Care & Service | 9 (8.3%) | 100 (91.7%) |
| Total (Category) | 276 (31.0%) | 613 (69.0%) |
| Total (Overall) | 2,552 (51.7%) | 2,381 (48.3%) |
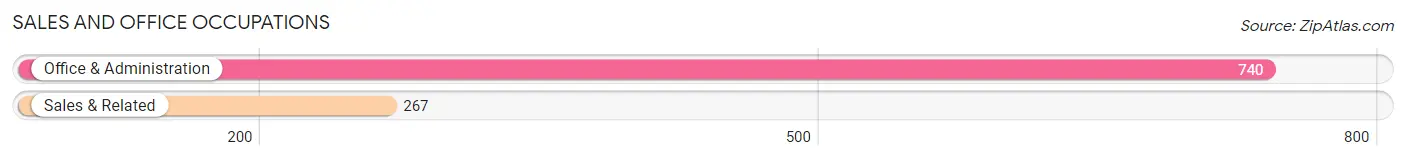
Sales and Office Occupations
The most common Sales and Office occupations in Bristol borough are Office & Administration (740 | 15.0%), and Sales & Related (267 | 5.4%).
Sales and Office Occupations by Sex
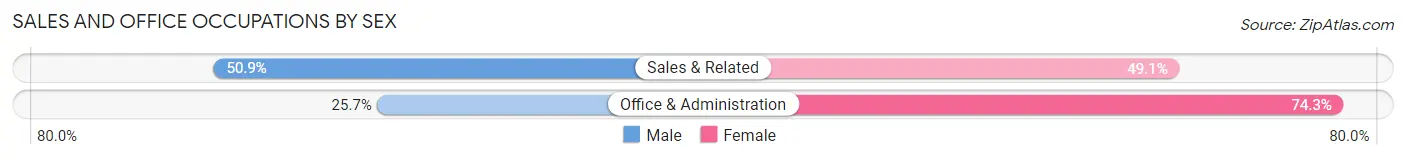
| Occupation | Male | Female |
| Sales & Related | 136 (50.9%) | 131 (49.1%) |
| Office & Administration | 190 (25.7%) | 550 (74.3%) |
| Total (Category) | 326 (32.4%) | 681 (67.6%) |
| Total (Overall) | 2,552 (51.7%) | 2,381 (48.3%) |
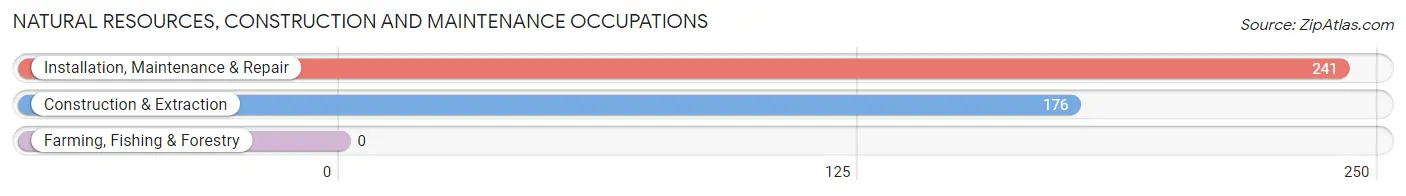
Natural Resources, Construction and Maintenance Occupations
The most common Natural Resources, Construction and Maintenance occupations in Bristol borough are Installation, Maintenance & Repair (241 | 4.9%), and Construction & Extraction (176 | 3.6%).
Natural Resources, Construction and Maintenance Occupations by Sex
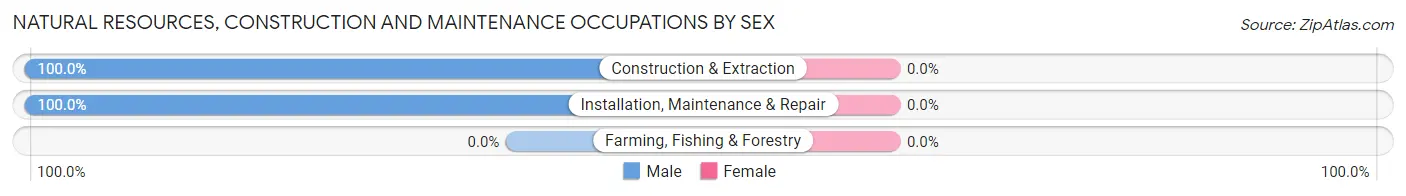
| Occupation | Male | Female |
| Farming, Fishing & Forestry | 0 (0.0%) | 0 (0.0%) |
| Construction & Extraction | 176 (100.0%) | 0 (0.0%) |
| Installation, Maintenance & Repair | 241 (100.0%) | 0 (0.0%) |
| Total (Category) | 417 (100.0%) | 0 (0.0%) |
| Total (Overall) | 2,552 (51.7%) | 2,381 (48.3%) |
Production, Transportation and Moving Occupations
The most common Production, Transportation and Moving occupations in Bristol borough are Transportation (440 | 8.9%), Production (310 | 6.3%), and Material Moving (196 | 4.0%).
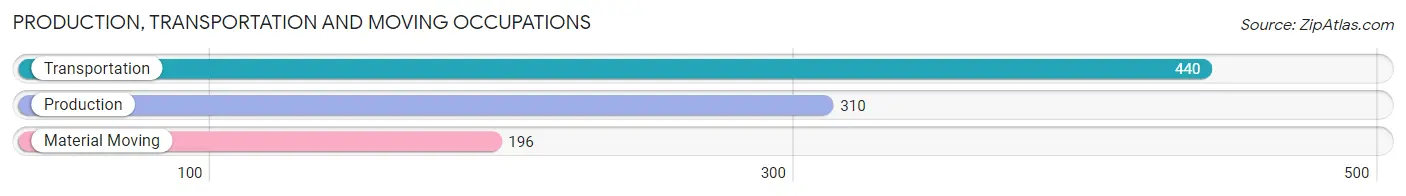
Production, Transportation and Moving Occupations by Sex
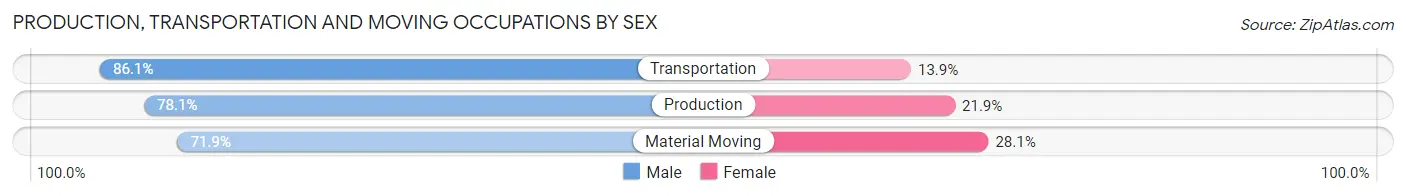
| Occupation | Male | Female |
| Production | 242 (78.1%) | 68 (21.9%) |
| Transportation | 379 (86.1%) | 61 (13.9%) |
| Material Moving | 141 (71.9%) | 55 (28.1%) |
| Total (Category) | 762 (80.5%) | 184 (19.5%) |
| Total (Overall) | 2,552 (51.7%) | 2,381 (48.3%) |
Employment Industries by Sex in Bristol borough
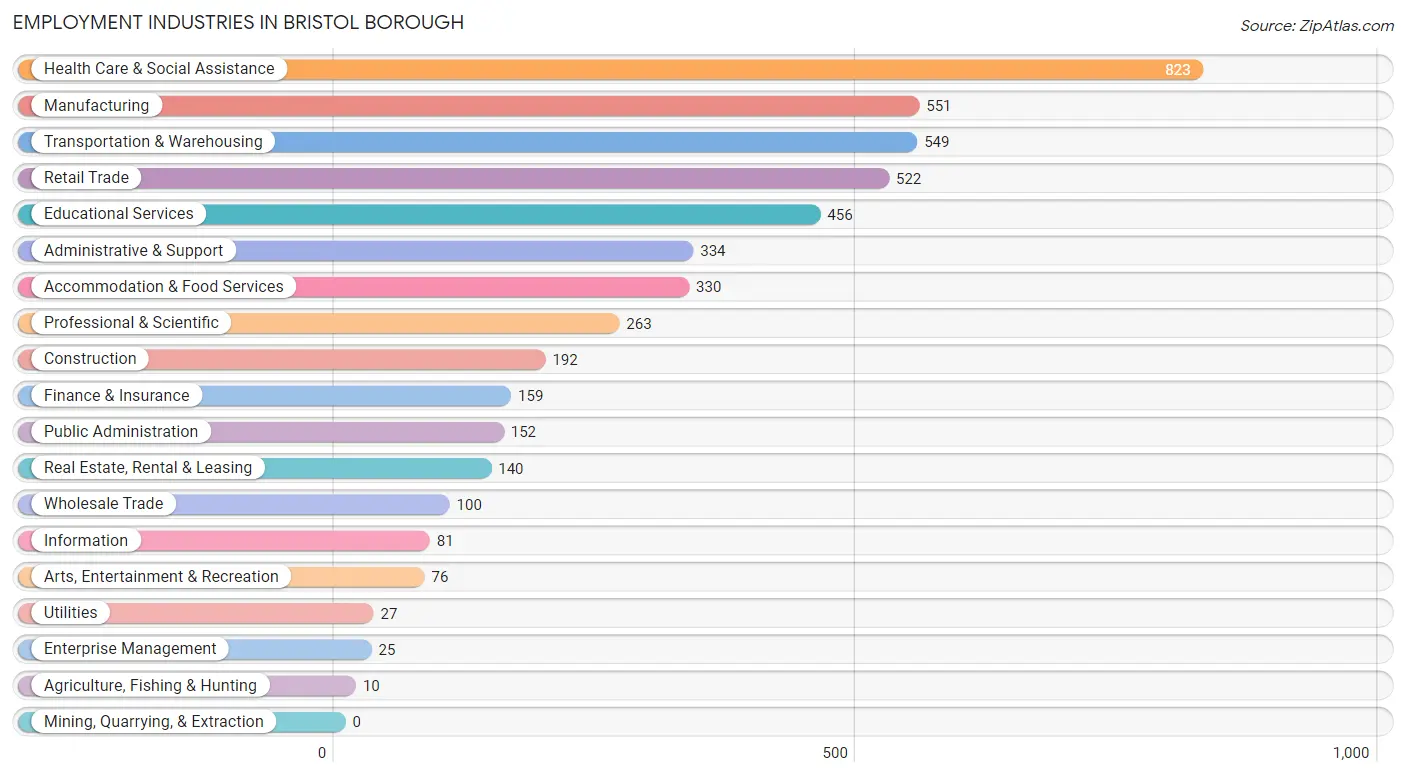
Employment Industries in Bristol borough
The major employment industries in Bristol borough include Health Care & Social Assistance (823 | 16.7%), Manufacturing (551 | 11.2%), Transportation & Warehousing (549 | 11.1%), Retail Trade (522 | 10.6%), and Educational Services (456 | 9.2%).
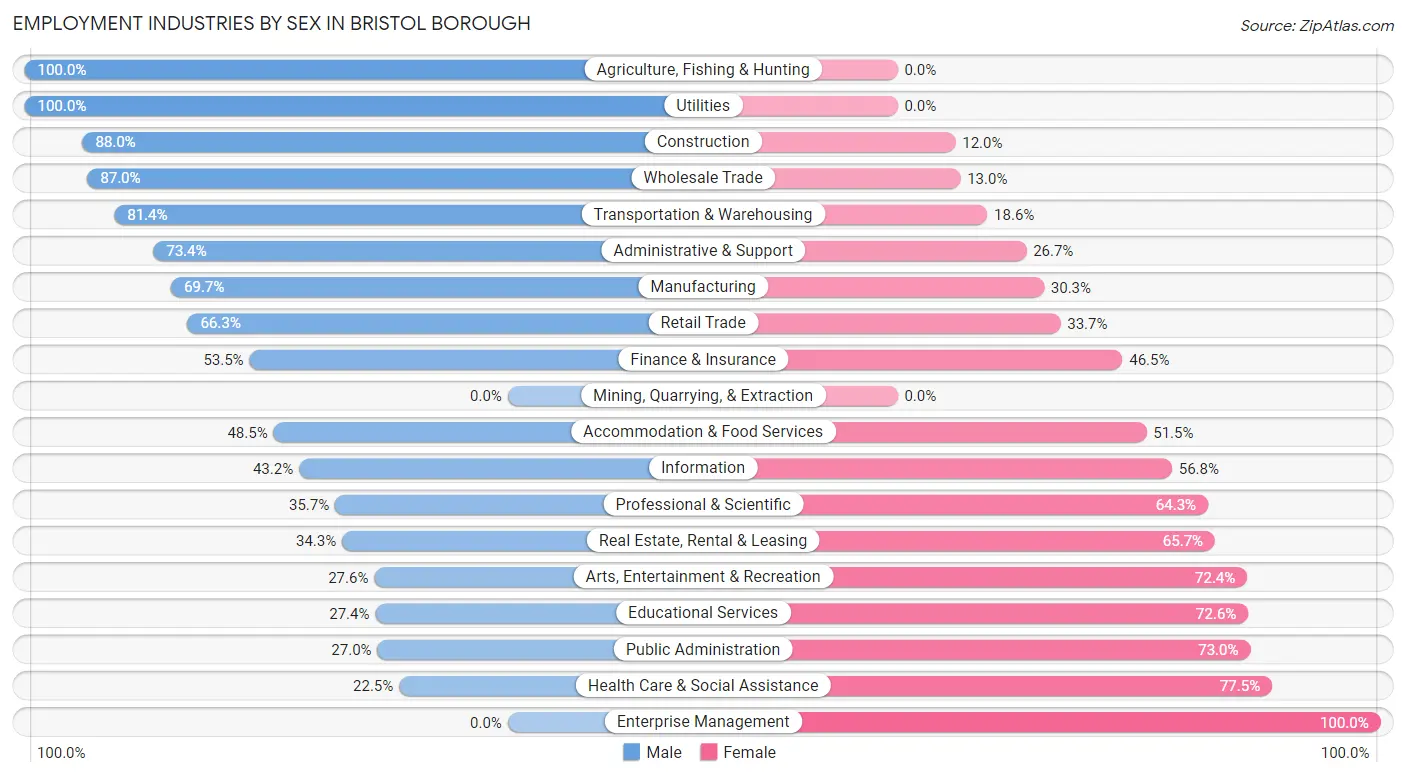
Employment Industries by Sex in Bristol borough
The Bristol borough industries that see more men than women are Agriculture, Fishing & Hunting (100.0%), Utilities (100.0%), and Construction (88.0%), whereas the industries that tend to have a higher number of women are Enterprise Management (100.0%), Health Care & Social Assistance (77.5%), and Public Administration (73.0%).
| Industry | Male | Female |
| Agriculture, Fishing & Hunting | 10 (100.0%) | 0 (0.0%) |
| Mining, Quarrying, & Extraction | 0 (0.0%) | 0 (0.0%) |
| Construction | 169 (88.0%) | 23 (12.0%) |
| Manufacturing | 384 (69.7%) | 167 (30.3%) |
| Wholesale Trade | 87 (87.0%) | 13 (13.0%) |
| Retail Trade | 346 (66.3%) | 176 (33.7%) |
| Transportation & Warehousing | 447 (81.4%) | 102 (18.6%) |
| Utilities | 27 (100.0%) | 0 (0.0%) |
| Information | 35 (43.2%) | 46 (56.8%) |
| Finance & Insurance | 85 (53.5%) | 74 (46.5%) |
| Real Estate, Rental & Leasing | 48 (34.3%) | 92 (65.7%) |
| Professional & Scientific | 94 (35.7%) | 169 (64.3%) |
| Enterprise Management | 0 (0.0%) | 25 (100.0%) |
| Administrative & Support | 245 (73.4%) | 89 (26.7%) |
| Educational Services | 125 (27.4%) | 331 (72.6%) |
| Health Care & Social Assistance | 185 (22.5%) | 638 (77.5%) |
| Arts, Entertainment & Recreation | 21 (27.6%) | 55 (72.4%) |
| Accommodation & Food Services | 160 (48.5%) | 170 (51.5%) |
| Public Administration | 41 (27.0%) | 111 (73.0%) |
| Total | 2,552 (51.7%) | 2,381 (48.3%) |
Education in Bristol borough
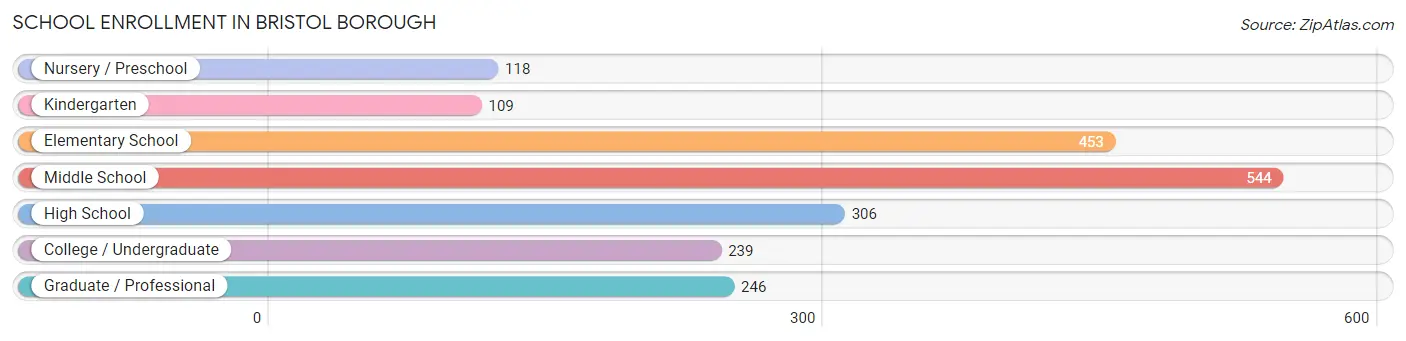
School Enrollment in Bristol borough
The most common levels of schooling among the 2,015 students in Bristol borough are middle school (544 | 27.0%), elementary school (453 | 22.5%), and high school (306 | 15.2%).
| School Level | # Students | % Students |
| Nursery / Preschool | 118 | 5.9% |
| Kindergarten | 109 | 5.4% |
| Elementary School | 453 | 22.5% |
| Middle School | 544 | 27.0% |
| High School | 306 | 15.2% |
| College / Undergraduate | 239 | 11.9% |
| Graduate / Professional | 246 | 12.2% |
| Total | 2,015 | 100.0% |
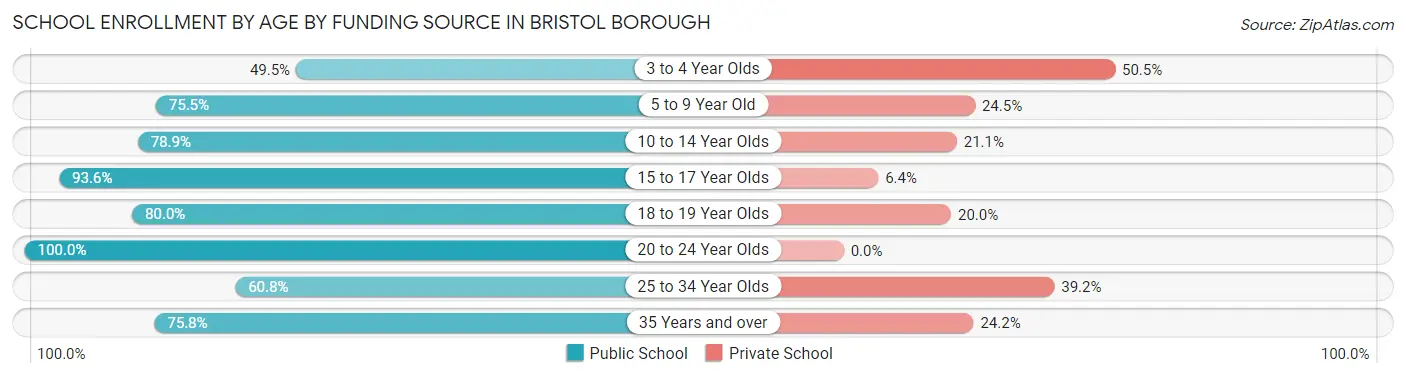
School Enrollment by Age by Funding Source in Bristol borough
Out of a total of 2,015 students who are enrolled in schools in Bristol borough, 472 (23.4%) attend a private institution, while the remaining 1,543 (76.6%) are enrolled in public schools. The age group of 3 to 4 year olds has the highest likelihood of being enrolled in private schools, with 47 (50.5% in the age bracket) enrolled. Conversely, the age group of 20 to 24 year olds has the lowest likelihood of being enrolled in a private school, with 64 (100.0% in the age bracket) attending a public institution.
| Age Bracket | Public School | Private School |
| 3 to 4 Year Olds | 46 (49.5%) | 47 (50.5%) |
| 5 to 9 Year Old | 352 (75.5%) | 114 (24.5%) |
| 10 to 14 Year Olds | 592 (78.9%) | 158 (21.1%) |
| 15 to 17 Year Olds | 160 (93.6%) | 11 (6.4%) |
| 18 to 19 Year Olds | 64 (80.0%) | 16 (20.0%) |
| 20 to 24 Year Olds | 64 (100.0%) | 0 (0.0%) |
| 25 to 34 Year Olds | 127 (60.8%) | 82 (39.2%) |
| 35 Years and over | 138 (75.8%) | 44 (24.2%) |
| Total | 1,543 (76.6%) | 472 (23.4%) |
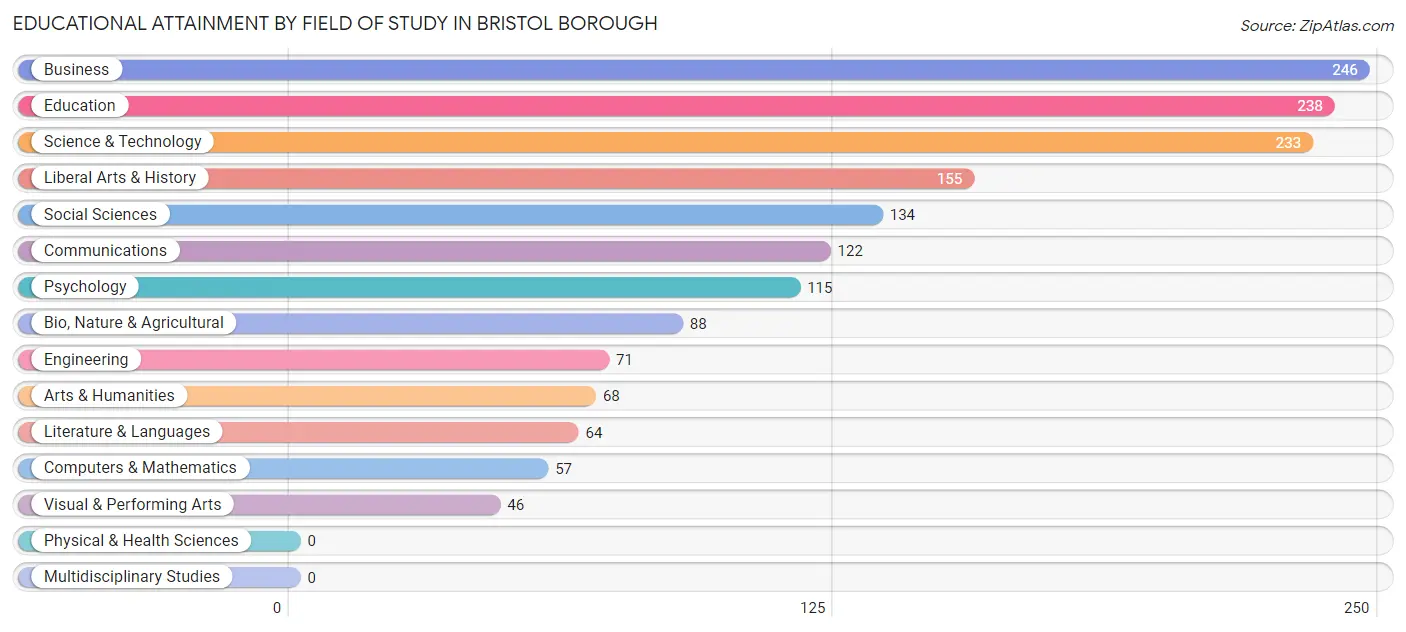
Educational Attainment by Field of Study in Bristol borough
Business (246 | 15.0%), education (238 | 14.5%), science & technology (233 | 14.2%), liberal arts & history (155 | 9.5%), and social sciences (134 | 8.2%) are the most common fields of study among 1,637 individuals in Bristol borough who have obtained a bachelor's degree or higher.
| Field of Study | # Graduates | % Graduates |
| Computers & Mathematics | 57 | 3.5% |
| Bio, Nature & Agricultural | 88 | 5.4% |
| Physical & Health Sciences | 0 | 0.0% |
| Psychology | 115 | 7.0% |
| Social Sciences | 134 | 8.2% |
| Engineering | 71 | 4.3% |
| Multidisciplinary Studies | 0 | 0.0% |
| Science & Technology | 233 | 14.2% |
| Business | 246 | 15.0% |
| Education | 238 | 14.5% |
| Literature & Languages | 64 | 3.9% |
| Liberal Arts & History | 155 | 9.5% |
| Visual & Performing Arts | 46 | 2.8% |
| Communications | 122 | 7.4% |
| Arts & Humanities | 68 | 4.2% |
| Total | 1,637 | 100.0% |
Transportation & Commute in Bristol borough
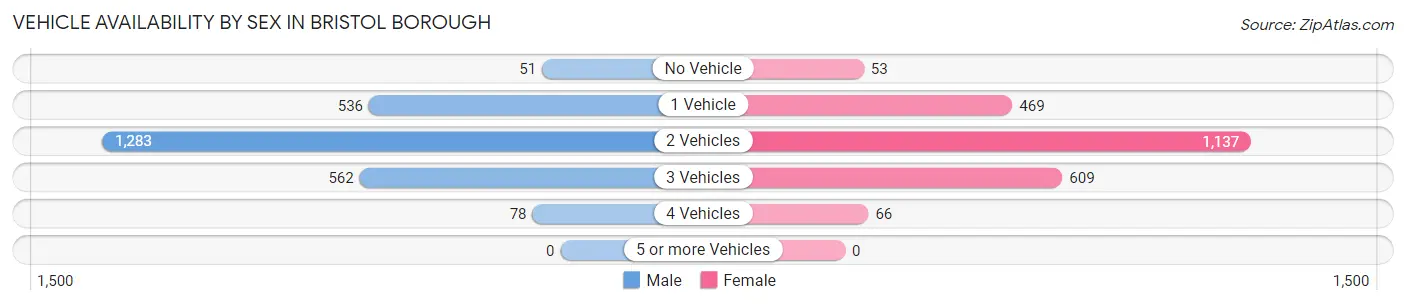
Vehicle Availability by Sex in Bristol borough
The most prevalent vehicle ownership categories in Bristol borough are males with 2 vehicles (1,283, accounting for 51.1%) and females with 2 vehicles (1,137, making up 55.0%).
| Vehicles Available | Male | Female |
| No Vehicle | 51 (2.0%) | 53 (2.3%) |
| 1 Vehicle | 536 (21.3%) | 469 (20.1%) |
| 2 Vehicles | 1,283 (51.1%) | 1,137 (48.7%) |
| 3 Vehicles | 562 (22.4%) | 609 (26.1%) |
| 4 Vehicles | 78 (3.1%) | 66 (2.8%) |
| 5 or more Vehicles | 0 (0.0%) | 0 (0.0%) |
| Total | 2,510 (100.0%) | 2,334 (100.0%) |
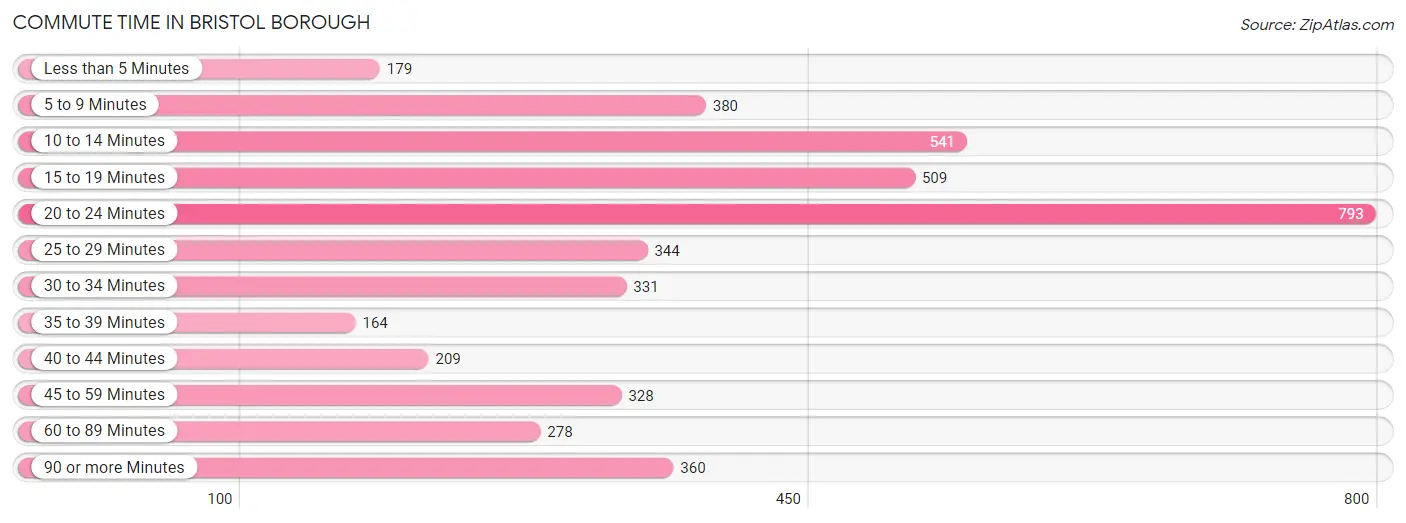
Commute Time in Bristol borough
The most frequently occuring commute durations in Bristol borough are 20 to 24 minutes (793 commuters, 18.0%), 10 to 14 minutes (541 commuters, 12.2%), and 15 to 19 minutes (509 commuters, 11.5%).
| Commute Time | # Commuters | % Commuters |
| Less than 5 Minutes | 179 | 4.1% |
| 5 to 9 Minutes | 380 | 8.6% |
| 10 to 14 Minutes | 541 | 12.2% |
| 15 to 19 Minutes | 509 | 11.5% |
| 20 to 24 Minutes | 793 | 18.0% |
| 25 to 29 Minutes | 344 | 7.8% |
| 30 to 34 Minutes | 331 | 7.5% |
| 35 to 39 Minutes | 164 | 3.7% |
| 40 to 44 Minutes | 209 | 4.7% |
| 45 to 59 Minutes | 328 | 7.4% |
| 60 to 89 Minutes | 278 | 6.3% |
| 90 or more Minutes | 360 | 8.2% |
Commute Time by Sex in Bristol borough
The most common commute times in Bristol borough are 20 to 24 minutes (395 commuters, 16.7%) for males and 20 to 24 minutes (398 commuters, 19.4%) for females.
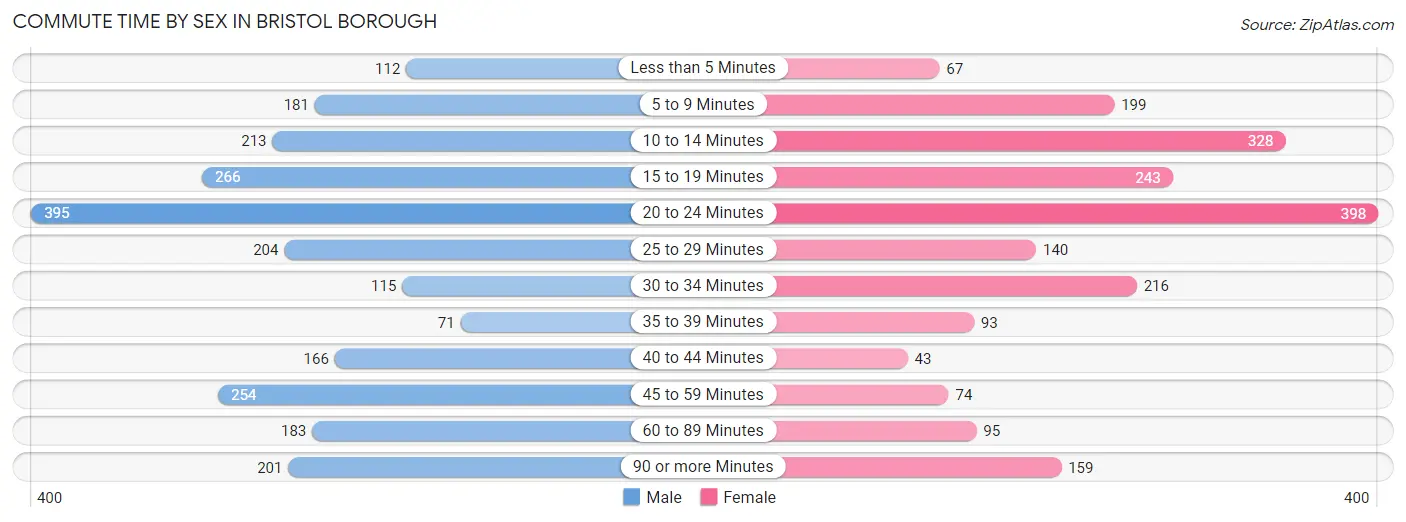
| Commute Time | Male | Female |
| Less than 5 Minutes | 112 (4.7%) | 67 (3.3%) |
| 5 to 9 Minutes | 181 (7.7%) | 199 (9.7%) |
| 10 to 14 Minutes | 213 (9.0%) | 328 (16.0%) |
| 15 to 19 Minutes | 266 (11.3%) | 243 (11.8%) |
| 20 to 24 Minutes | 395 (16.7%) | 398 (19.4%) |
| 25 to 29 Minutes | 204 (8.6%) | 140 (6.8%) |
| 30 to 34 Minutes | 115 (4.9%) | 216 (10.5%) |
| 35 to 39 Minutes | 71 (3.0%) | 93 (4.5%) |
| 40 to 44 Minutes | 166 (7.0%) | 43 (2.1%) |
| 45 to 59 Minutes | 254 (10.8%) | 74 (3.6%) |
| 60 to 89 Minutes | 183 (7.7%) | 95 (4.6%) |
| 90 or more Minutes | 201 (8.5%) | 159 (7.7%) |
Time of Departure to Work by Sex in Bristol borough
The most frequent times of departure to work in Bristol borough are 7:00 AM to 7:29 AM (582, 24.6%) for males and 7:30 AM to 7:59 AM (400, 19.5%) for females.
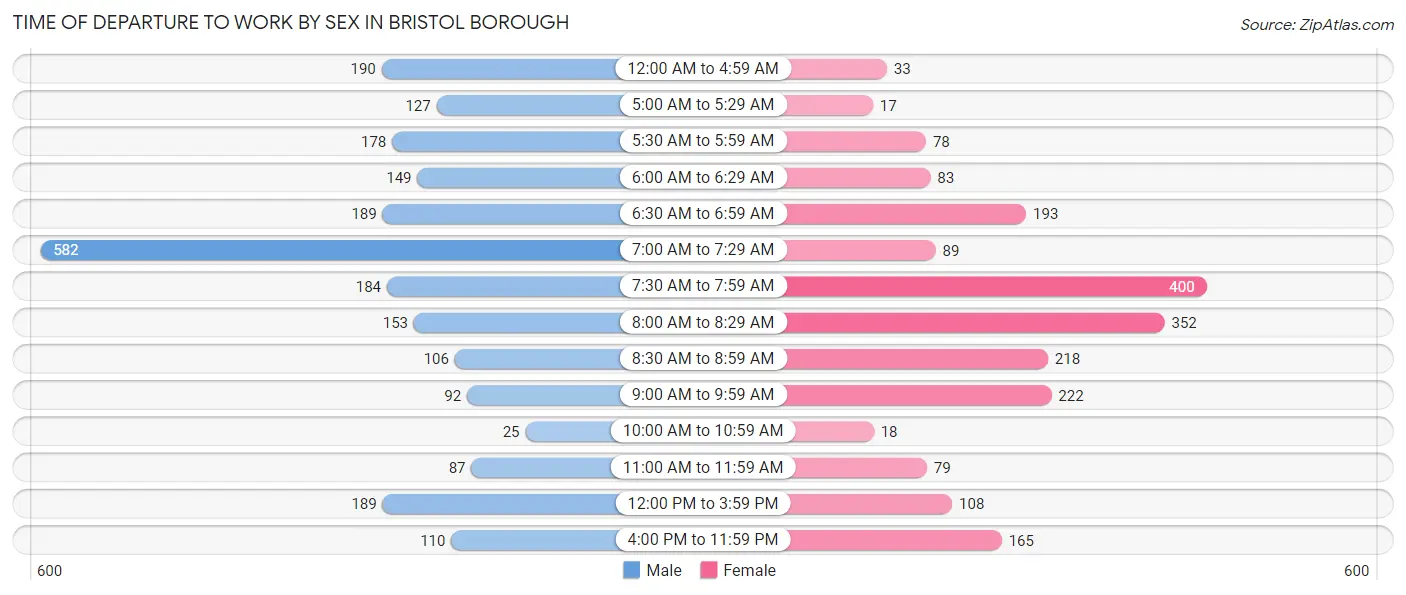
| Time of Departure | Male | Female |
| 12:00 AM to 4:59 AM | 190 (8.1%) | 33 (1.6%) |
| 5:00 AM to 5:29 AM | 127 (5.4%) | 17 (0.8%) |
| 5:30 AM to 5:59 AM | 178 (7.5%) | 78 (3.8%) |
| 6:00 AM to 6:29 AM | 149 (6.3%) | 83 (4.0%) |
| 6:30 AM to 6:59 AM | 189 (8.0%) | 193 (9.4%) |
| 7:00 AM to 7:29 AM | 582 (24.6%) | 89 (4.3%) |
| 7:30 AM to 7:59 AM | 184 (7.8%) | 400 (19.5%) |
| 8:00 AM to 8:29 AM | 153 (6.5%) | 352 (17.1%) |
| 8:30 AM to 8:59 AM | 106 (4.5%) | 218 (10.6%) |
| 9:00 AM to 9:59 AM | 92 (3.9%) | 222 (10.8%) |
| 10:00 AM to 10:59 AM | 25 (1.1%) | 18 (0.9%) |
| 11:00 AM to 11:59 AM | 87 (3.7%) | 79 (3.8%) |
| 12:00 PM to 3:59 PM | 189 (8.0%) | 108 (5.3%) |
| 4:00 PM to 11:59 PM | 110 (4.7%) | 165 (8.0%) |
| Total | 2,361 (100.0%) | 2,055 (100.0%) |
Housing Occupancy in Bristol borough
Occupancy by Ownership in Bristol borough
Of the total 4,146 dwellings in Bristol borough, owner-occupied units account for 2,571 (62.0%), while renter-occupied units make up 1,575 (38.0%).
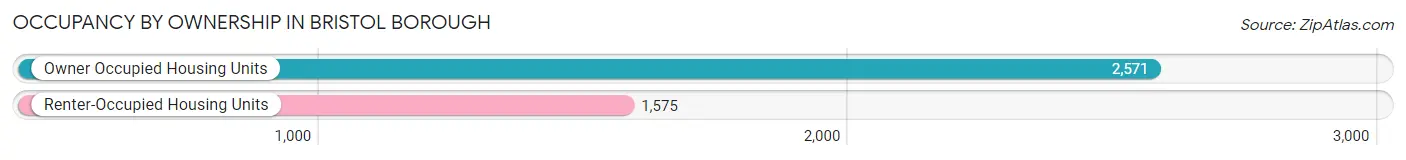
| Occupancy | # Housing Units | % Housing Units |
| Owner Occupied Housing Units | 2,571 | 62.0% |
| Renter-Occupied Housing Units | 1,575 | 38.0% |
| Total Occupied Housing Units | 4,146 | 100.0% |
Occupancy by Household Size in Bristol borough
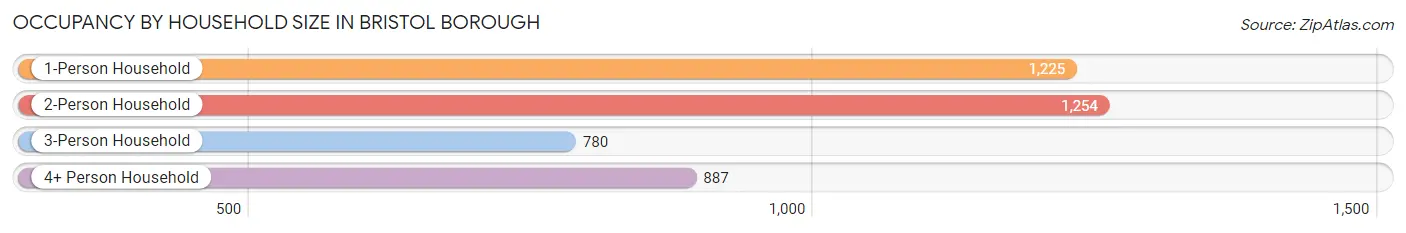
| Household Size | # Housing Units | % Housing Units |
| 1-Person Household | 1,225 | 29.5% |
| 2-Person Household | 1,254 | 30.2% |
| 3-Person Household | 780 | 18.8% |
| 4+ Person Household | 887 | 21.4% |
| Total Housing Units | 4,146 | 100.0% |
Occupancy by Ownership by Household Size in Bristol borough
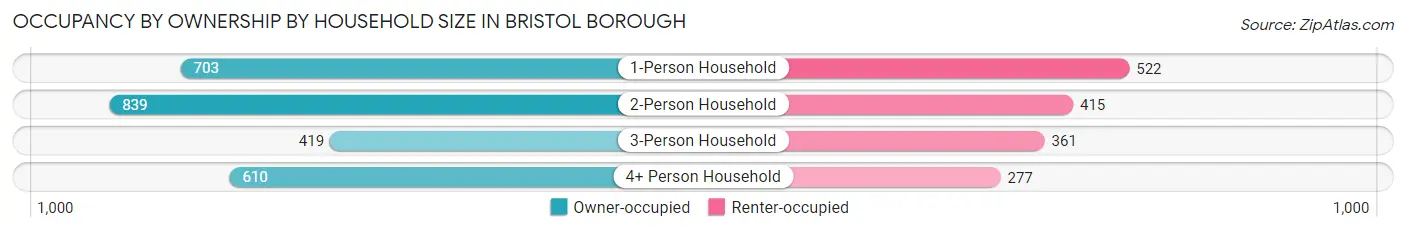
| Household Size | Owner-occupied | Renter-occupied |
| 1-Person Household | 703 (57.4%) | 522 (42.6%) |
| 2-Person Household | 839 (66.9%) | 415 (33.1%) |
| 3-Person Household | 419 (53.7%) | 361 (46.3%) |
| 4+ Person Household | 610 (68.8%) | 277 (31.2%) |
| Total Housing Units | 2,571 (62.0%) | 1,575 (38.0%) |
Occupancy by Educational Attainment in Bristol borough
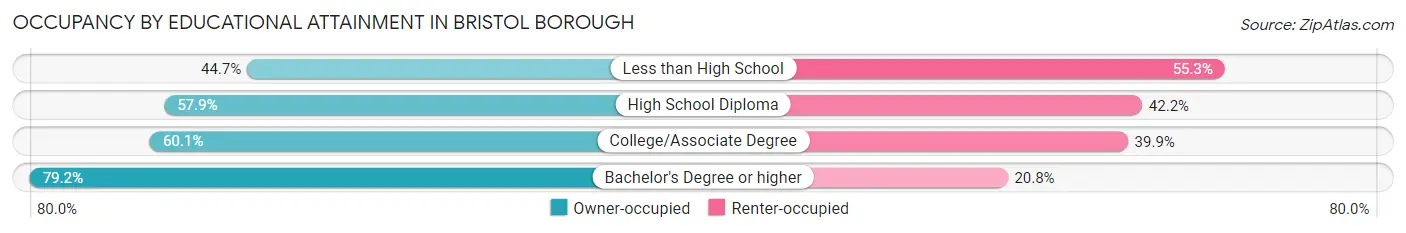
| Household Size | Owner-occupied | Renter-occupied |
| Less than High School | 195 (44.7%) | 241 (55.3%) |
| High School Diploma | 884 (57.9%) | 644 (42.1%) |
| College/Associate Degree | 743 (60.1%) | 493 (39.9%) |
| Bachelor's Degree or higher | 749 (79.2%) | 197 (20.8%) |
Occupancy by Age of Householder in Bristol borough
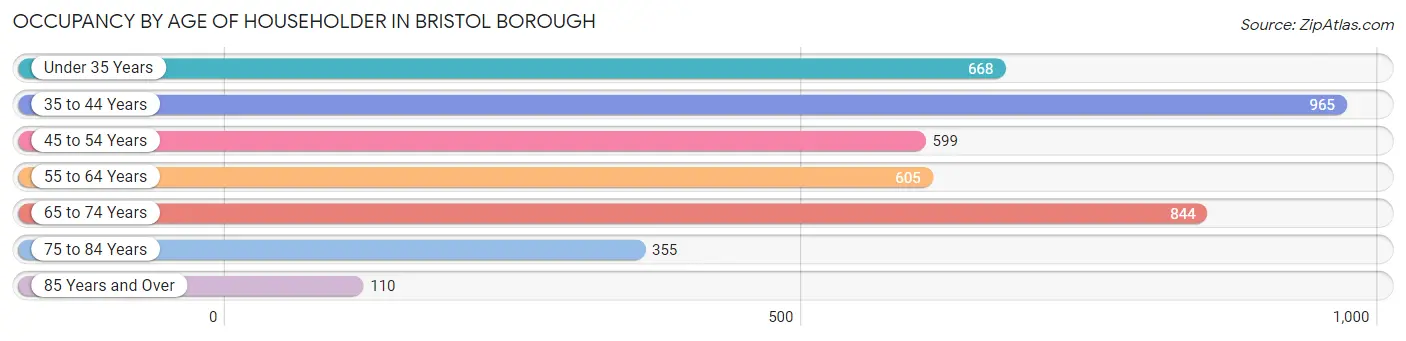
| Age Bracket | # Households | % Households |
| Under 35 Years | 668 | 16.1% |
| 35 to 44 Years | 965 | 23.3% |
| 45 to 54 Years | 599 | 14.4% |
| 55 to 64 Years | 605 | 14.6% |
| 65 to 74 Years | 844 | 20.4% |
| 75 to 84 Years | 355 | 8.6% |
| 85 Years and Over | 110 | 2.6% |
| Total | 4,146 | 100.0% |
Housing Finances in Bristol borough
Median Income by Occupancy in Bristol borough
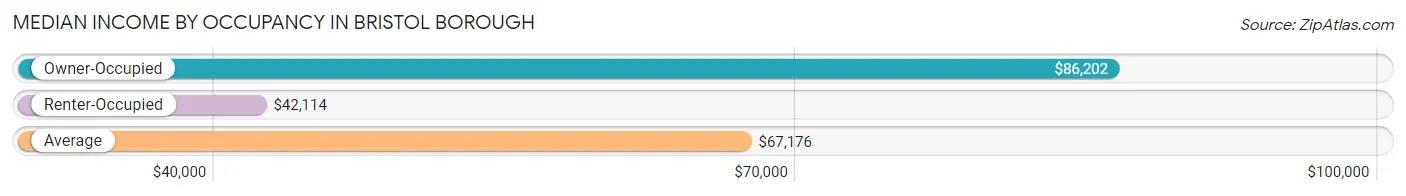
| Occupancy Type | # Households | Median Income |
| Owner-Occupied | 2,571 (62.0%) | $86,202 |
| Renter-Occupied | 1,575 (38.0%) | $42,114 |
| Average | 4,146 (100.0%) | $67,176 |
Occupancy by Householder Income Bracket in Bristol borough
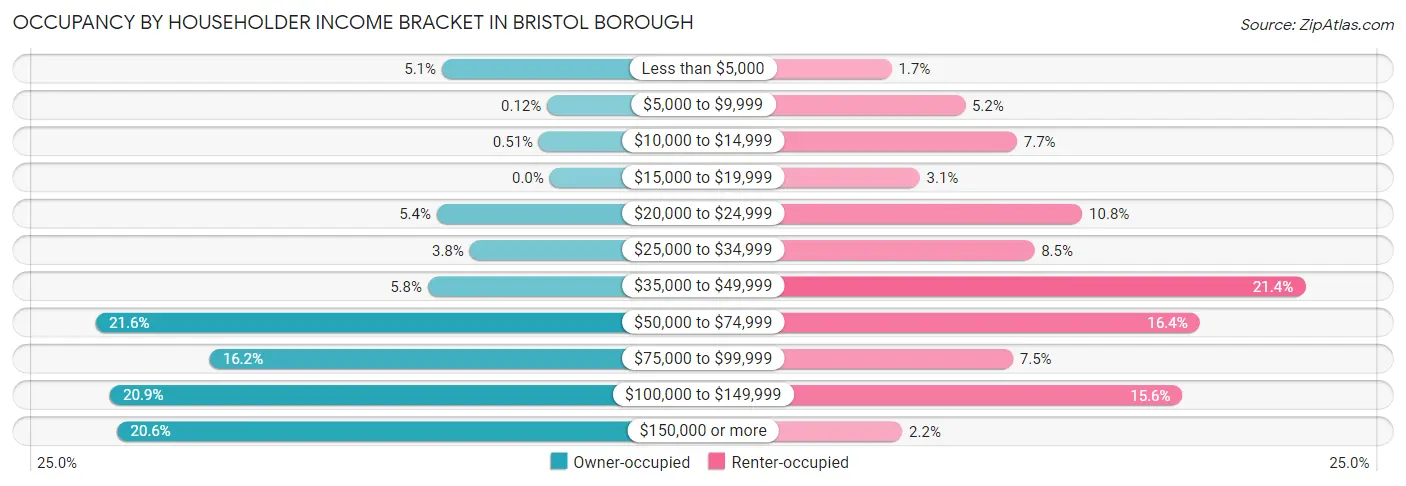
| Income Bracket | Owner-occupied | Renter-occupied |
| Less than $5,000 | 132 (5.1%) | 27 (1.7%) |
| $5,000 to $9,999 | 3 (0.1%) | 82 (5.2%) |
| $10,000 to $14,999 | 13 (0.5%) | 121 (7.7%) |
| $15,000 to $19,999 | 0 (0.0%) | 48 (3.0%) |
| $20,000 to $24,999 | 138 (5.4%) | 170 (10.8%) |
| $25,000 to $34,999 | 98 (3.8%) | 134 (8.5%) |
| $35,000 to $49,999 | 149 (5.8%) | 337 (21.4%) |
| $50,000 to $74,999 | 555 (21.6%) | 258 (16.4%) |
| $75,000 to $99,999 | 416 (16.2%) | 118 (7.5%) |
| $100,000 to $149,999 | 538 (20.9%) | 245 (15.6%) |
| $150,000 or more | 529 (20.6%) | 35 (2.2%) |
| Total | 2,571 (100.0%) | 1,575 (100.0%) |
Monthly Housing Cost Tiers in Bristol borough
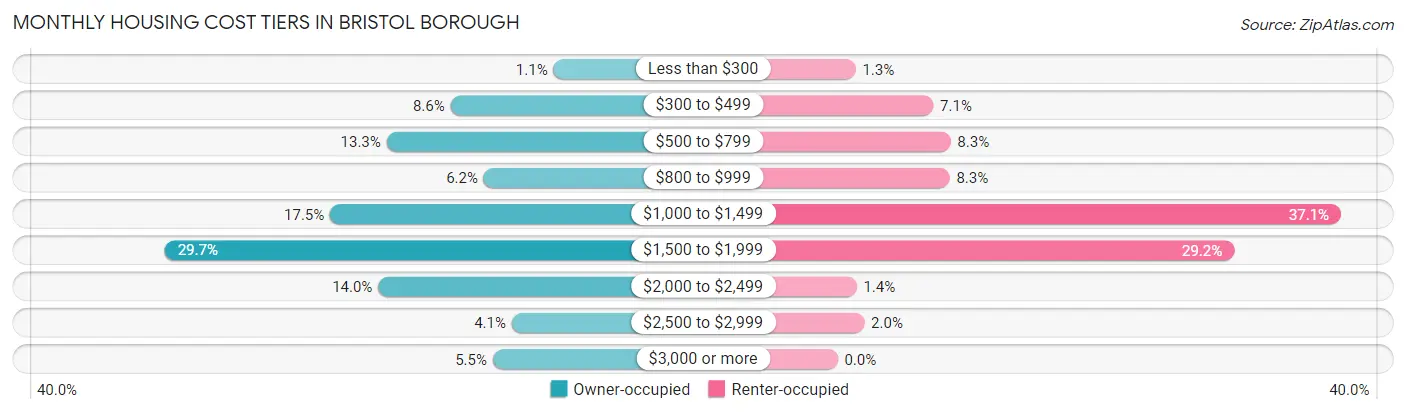
| Monthly Cost | Owner-occupied | Renter-occupied |
| Less than $300 | 27 (1.1%) | 21 (1.3%) |
| $300 to $499 | 222 (8.6%) | 111 (7.0%) |
| $500 to $799 | 343 (13.3%) | 131 (8.3%) |
| $800 to $999 | 159 (6.2%) | 130 (8.3%) |
| $1,000 to $1,499 | 450 (17.5%) | 584 (37.1%) |
| $1,500 to $1,999 | 763 (29.7%) | 460 (29.2%) |
| $2,000 to $2,499 | 359 (14.0%) | 22 (1.4%) |
| $2,500 to $2,999 | 106 (4.1%) | 31 (2.0%) |
| $3,000 or more | 142 (5.5%) | 0 (0.0%) |
| Total | 2,571 (100.0%) | 1,575 (100.0%) |
Physical Housing Characteristics in Bristol borough
Housing Structures in Bristol borough
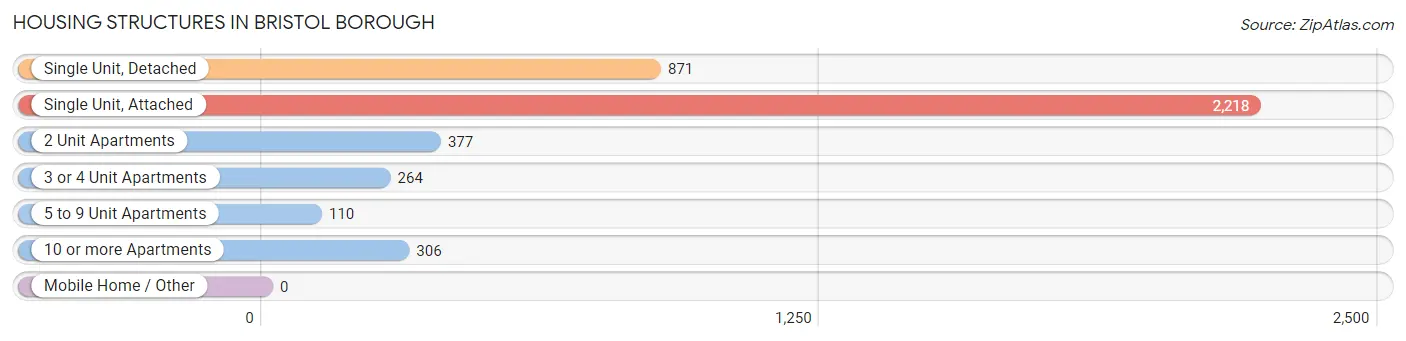
| Structure Type | # Housing Units | % Housing Units |
| Single Unit, Detached | 871 | 21.0% |
| Single Unit, Attached | 2,218 | 53.5% |
| 2 Unit Apartments | 377 | 9.1% |
| 3 or 4 Unit Apartments | 264 | 6.4% |
| 5 to 9 Unit Apartments | 110 | 2.6% |
| 10 or more Apartments | 306 | 7.4% |
| Mobile Home / Other | 0 | 0.0% |
| Total | 4,146 | 100.0% |
Housing Structures by Occupancy in Bristol borough
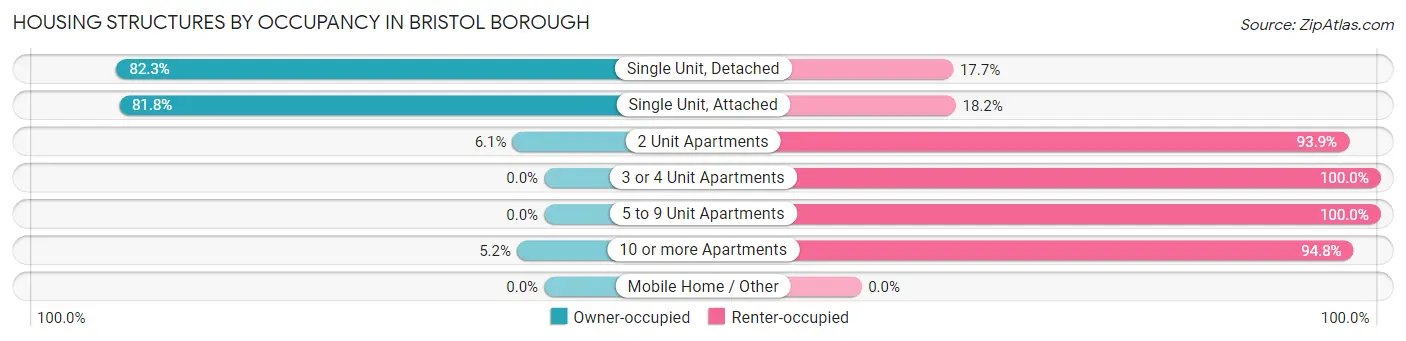
| Structure Type | Owner-occupied | Renter-occupied |
| Single Unit, Detached | 717 (82.3%) | 154 (17.7%) |
| Single Unit, Attached | 1,815 (81.8%) | 403 (18.2%) |
| 2 Unit Apartments | 23 (6.1%) | 354 (93.9%) |
| 3 or 4 Unit Apartments | 0 (0.0%) | 264 (100.0%) |
| 5 to 9 Unit Apartments | 0 (0.0%) | 110 (100.0%) |
| 10 or more Apartments | 16 (5.2%) | 290 (94.8%) |
| Mobile Home / Other | 0 (0.0%) | 0 (0.0%) |
| Total | 2,571 (62.0%) | 1,575 (38.0%) |
Housing Structures by Number of Rooms in Bristol borough
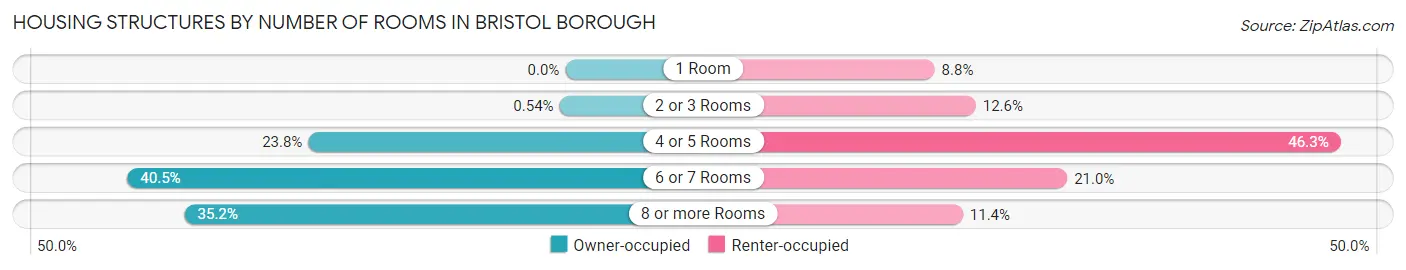
| Number of Rooms | Owner-occupied | Renter-occupied |
| 1 Room | 0 (0.0%) | 138 (8.8%) |
| 2 or 3 Rooms | 14 (0.5%) | 198 (12.6%) |
| 4 or 5 Rooms | 611 (23.8%) | 729 (46.3%) |
| 6 or 7 Rooms | 1,041 (40.5%) | 331 (21.0%) |
| 8 or more Rooms | 905 (35.2%) | 179 (11.4%) |
| Total | 2,571 (100.0%) | 1,575 (100.0%) |
Housing Structure by Heating Type in Bristol borough
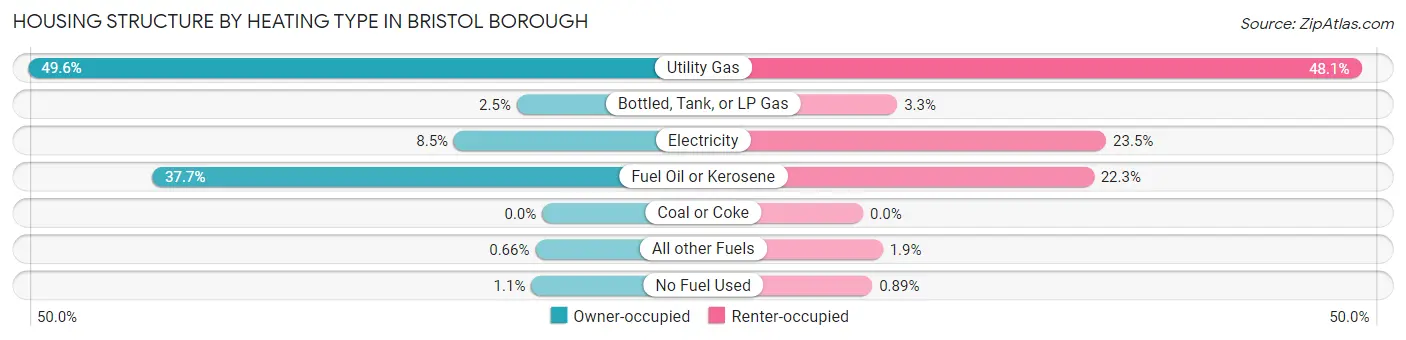
| Heating Type | Owner-occupied | Renter-occupied |
| Utility Gas | 1,276 (49.6%) | 758 (48.1%) |
| Bottled, Tank, or LP Gas | 63 (2.5%) | 52 (3.3%) |
| Electricity | 219 (8.5%) | 370 (23.5%) |
| Fuel Oil or Kerosene | 969 (37.7%) | 351 (22.3%) |
| Coal or Coke | 0 (0.0%) | 0 (0.0%) |
| All other Fuels | 17 (0.7%) | 30 (1.9%) |
| No Fuel Used | 27 (1.1%) | 14 (0.9%) |
| Total | 2,571 (100.0%) | 1,575 (100.0%) |
Household Vehicle Usage in Bristol borough
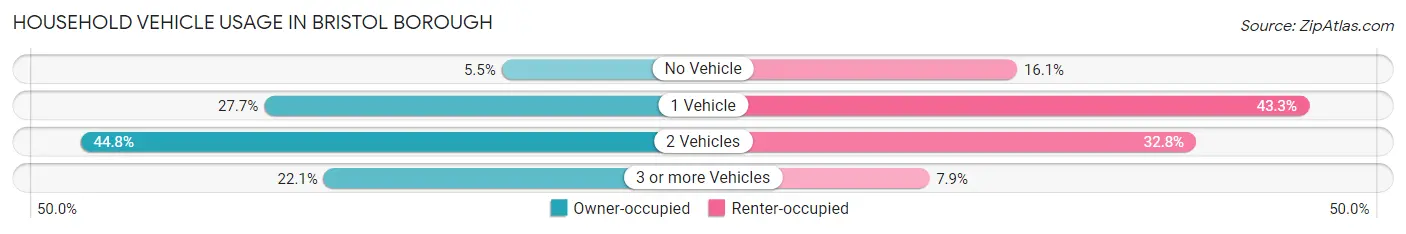
| Vehicles per Household | Owner-occupied | Renter-occupied |
| No Vehicle | 141 (5.5%) | 253 (16.1%) |
| 1 Vehicle | 711 (27.7%) | 682 (43.3%) |
| 2 Vehicles | 1,151 (44.8%) | 516 (32.8%) |
| 3 or more Vehicles | 568 (22.1%) | 124 (7.9%) |
| Total | 2,571 (100.0%) | 1,575 (100.0%) |
Real Estate & Mortgages in Bristol borough
Real Estate and Mortgage Overview in Bristol borough
| Characteristic | Without Mortgage | With Mortgage |
| Housing Units | 789 | 1,782 |
| Median Property Value | $183,900 | $223,200 |
| Median Household Income | $58,219 | $384 |
| Monthly Housing Costs | $642 | $133 |
| Real Estate Taxes | $2,899 | $49 |
Property Value by Mortgage Status in Bristol borough
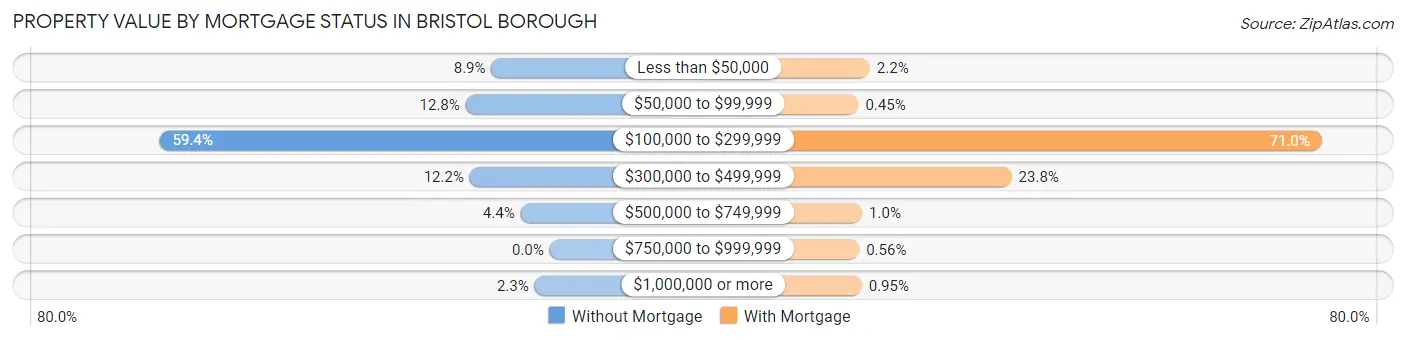
| Property Value | Without Mortgage | With Mortgage |
| Less than $50,000 | 70 (8.9%) | 39 (2.2%) |
| $50,000 to $99,999 | 101 (12.8%) | 8 (0.4%) |
| $100,000 to $299,999 | 469 (59.4%) | 1,266 (71.0%) |
| $300,000 to $499,999 | 96 (12.2%) | 424 (23.8%) |
| $500,000 to $749,999 | 35 (4.4%) | 18 (1.0%) |
| $750,000 to $999,999 | 0 (0.0%) | 10 (0.6%) |
| $1,000,000 or more | 18 (2.3%) | 17 (0.9%) |
| Total | 789 (100.0%) | 1,782 (100.0%) |
Household Income by Mortgage Status in Bristol borough
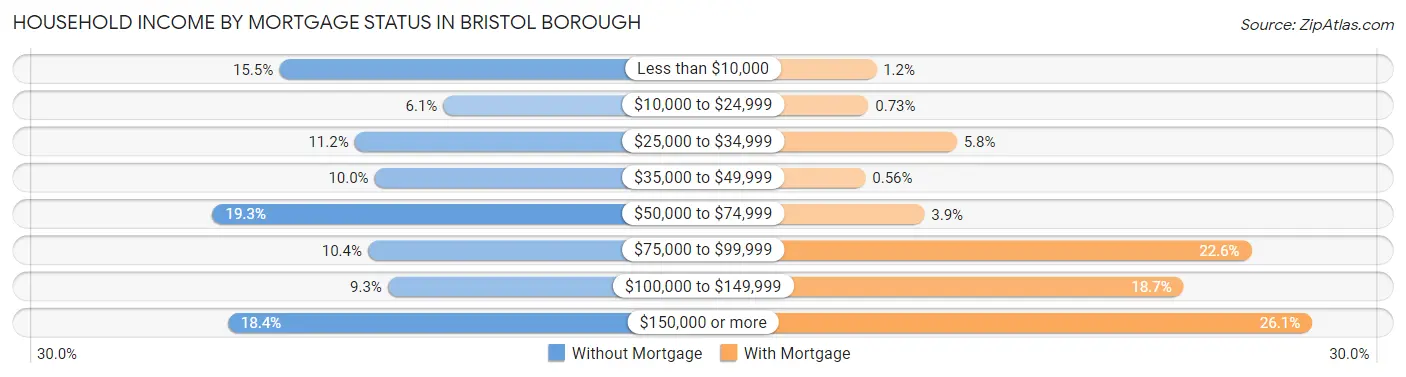
| Household Income | Without Mortgage | With Mortgage |
| Less than $10,000 | 122 (15.5%) | 21 (1.2%) |
| $10,000 to $24,999 | 48 (6.1%) | 13 (0.7%) |
| $25,000 to $34,999 | 88 (11.2%) | 103 (5.8%) |
| $35,000 to $49,999 | 79 (10.0%) | 10 (0.6%) |
| $50,000 to $74,999 | 152 (19.3%) | 70 (3.9%) |
| $75,000 to $99,999 | 82 (10.4%) | 403 (22.6%) |
| $100,000 to $149,999 | 73 (9.2%) | 334 (18.7%) |
| $150,000 or more | 145 (18.4%) | 465 (26.1%) |
| Total | 789 (100.0%) | 1,782 (100.0%) |
Property Value to Household Income Ratio in Bristol borough
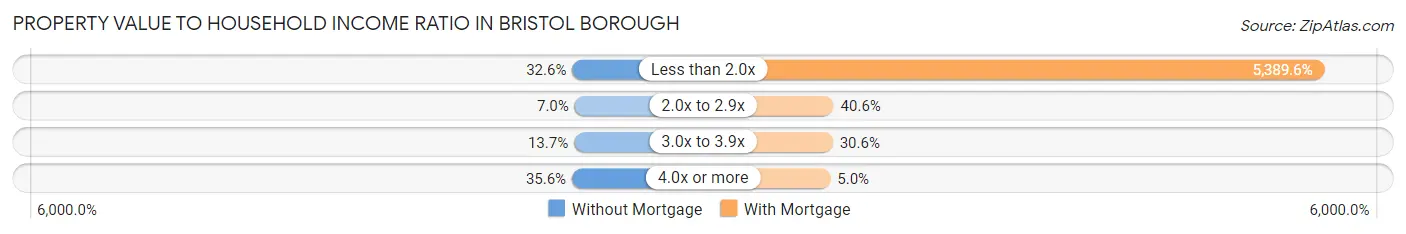
| Value-to-Income Ratio | Without Mortgage | With Mortgage |
| Less than 2.0x | 257 (32.6%) | 96,042 (5,389.6%) |
| 2.0x to 2.9x | 55 (7.0%) | 723 (40.6%) |
| 3.0x to 3.9x | 108 (13.7%) | 545 (30.6%) |
| 4.0x or more | 281 (35.6%) | 89 (5.0%) |
| Total | 789 (100.0%) | 1,782 (100.0%) |
Real Estate Taxes by Mortgage Status in Bristol borough
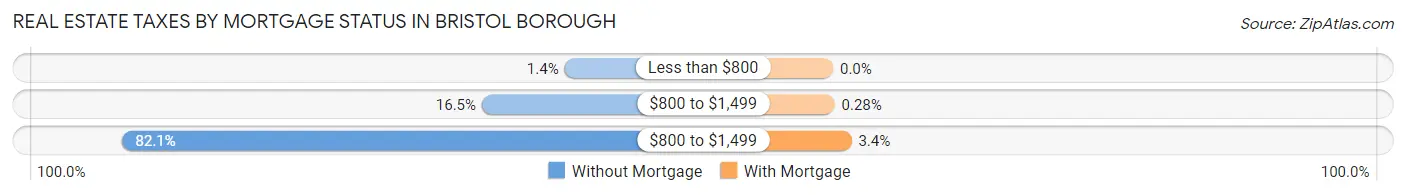
| Property Taxes | Without Mortgage | With Mortgage |
| Less than $800 | 11 (1.4%) | 0 (0.0%) |
| $800 to $1,499 | 130 (16.5%) | 5 (0.3%) |
| $800 to $1,499 | 648 (82.1%) | 60 (3.4%) |
| Total | 789 (100.0%) | 1,782 (100.0%) |
Health & Disability in Bristol borough
Health Insurance Coverage by Age in Bristol borough
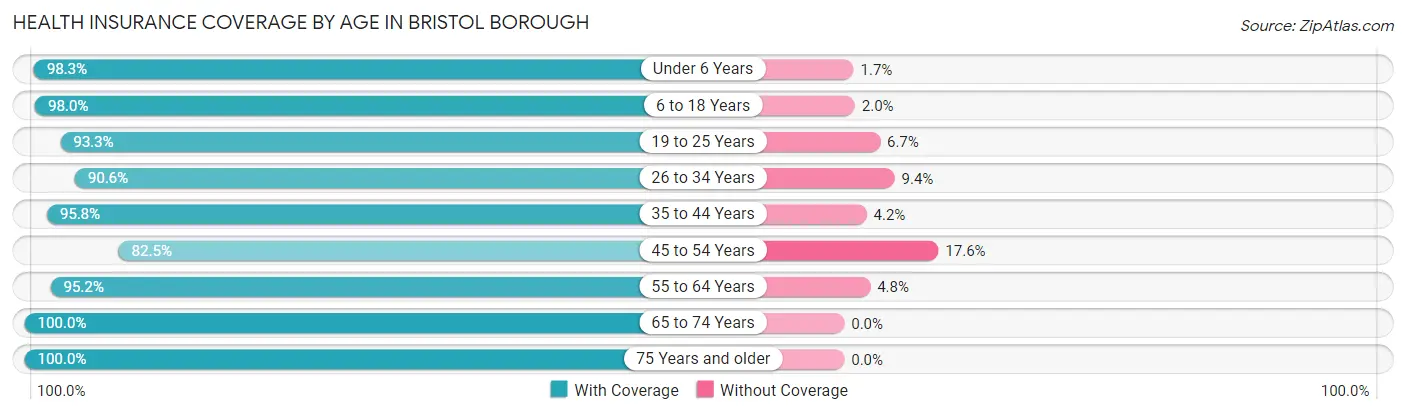
| Age Bracket | With Coverage | Without Coverage |
| Under 6 Years | 908 (98.3%) | 16 (1.7%) |
| 6 to 18 Years | 1,352 (98.0%) | 27 (2.0%) |
| 19 to 25 Years | 729 (93.3%) | 52 (6.7%) |
| 26 to 34 Years | 1,092 (90.6%) | 113 (9.4%) |
| 35 to 44 Years | 1,544 (95.8%) | 67 (4.2%) |
| 45 to 54 Years | 874 (82.5%) | 186 (17.5%) |
| 55 to 64 Years | 1,064 (95.2%) | 54 (4.8%) |
| 65 to 74 Years | 1,087 (100.0%) | 0 (0.0%) |
| 75 Years and older | 697 (100.0%) | 0 (0.0%) |
| Total | 9,347 (94.8%) | 515 (5.2%) |
Health Insurance Coverage by Citizenship Status in Bristol borough
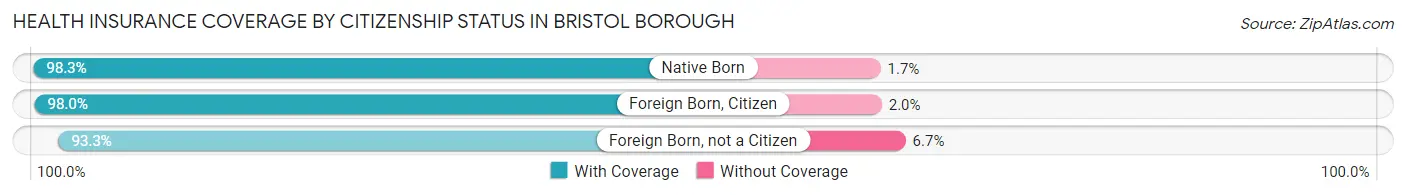
| Citizenship Status | With Coverage | Without Coverage |
| Native Born | 908 (98.3%) | 16 (1.7%) |
| Foreign Born, Citizen | 1,352 (98.0%) | 27 (2.0%) |
| Foreign Born, not a Citizen | 729 (93.3%) | 52 (6.7%) |
Health Insurance Coverage by Household Income in Bristol borough
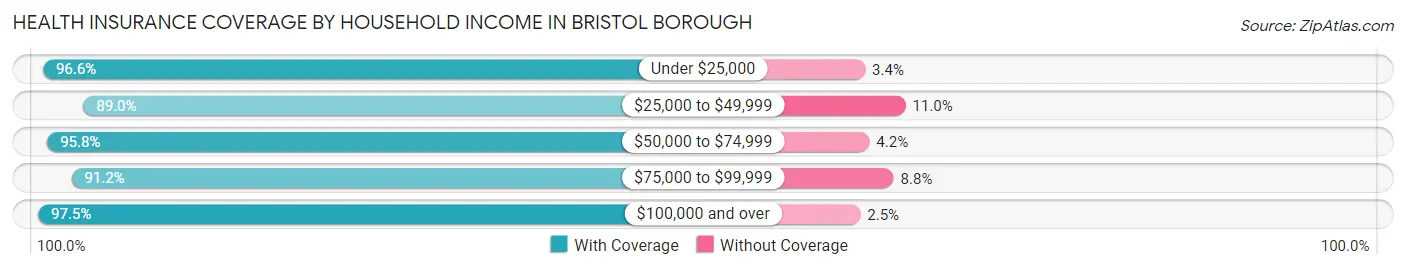
| Household Income | With Coverage | Without Coverage |
| Under $25,000 | 1,235 (96.6%) | 44 (3.4%) |
| $25,000 to $49,999 | 1,551 (89.0%) | 192 (11.0%) |
| $50,000 to $74,999 | 1,761 (95.8%) | 78 (4.2%) |
| $75,000 to $99,999 | 1,070 (91.2%) | 103 (8.8%) |
| $100,000 and over | 3,715 (97.5%) | 97 (2.5%) |
Public vs Private Health Insurance Coverage by Age in Bristol borough
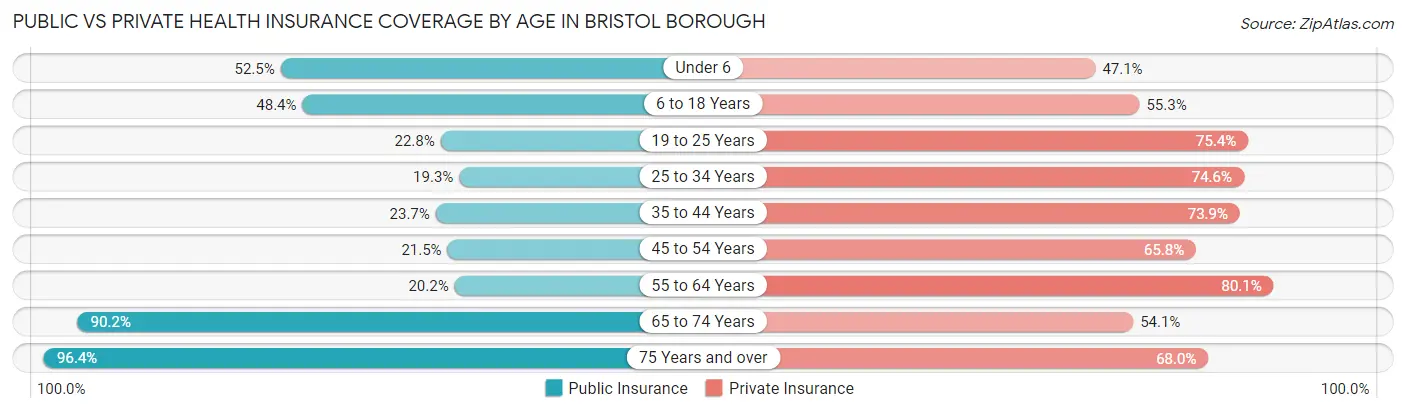
| Age Bracket | Public Insurance | Private Insurance |
| Under 6 | 485 (52.5%) | 435 (47.1%) |
| 6 to 18 Years | 668 (48.4%) | 762 (55.3%) |
| 19 to 25 Years | 178 (22.8%) | 589 (75.4%) |
| 25 to 34 Years | 233 (19.3%) | 899 (74.6%) |
| 35 to 44 Years | 382 (23.7%) | 1,190 (73.9%) |
| 45 to 54 Years | 228 (21.5%) | 697 (65.7%) |
| 55 to 64 Years | 226 (20.2%) | 896 (80.1%) |
| 65 to 74 Years | 980 (90.2%) | 588 (54.1%) |
| 75 Years and over | 672 (96.4%) | 474 (68.0%) |
| Total | 4,052 (41.1%) | 6,530 (66.2%) |
Disability Status by Sex by Age in Bristol borough
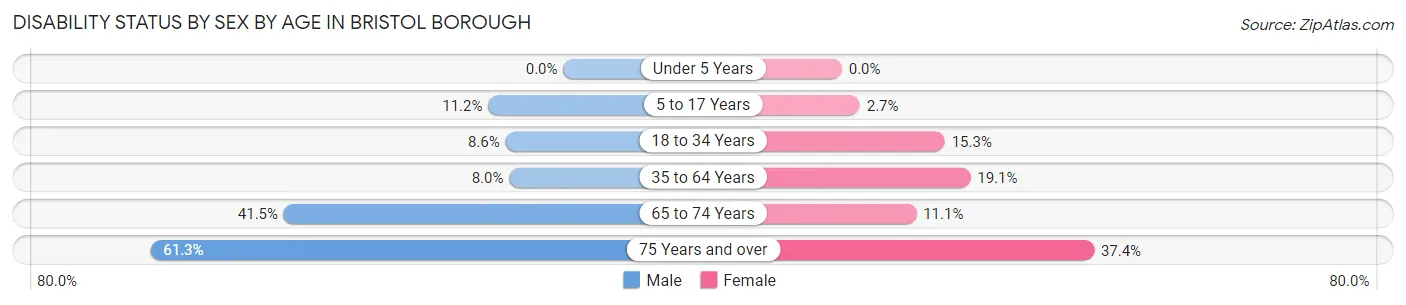
| Age Bracket | Male | Female |
| Under 5 Years | 0 (0.0%) | 0 (0.0%) |
| 5 to 17 Years | 96 (11.2%) | 15 (2.7%) |
| 18 to 34 Years | 89 (8.6%) | 159 (15.3%) |
| 35 to 64 Years | 145 (8.0%) | 378 (19.1%) |
| 65 to 74 Years | 222 (41.5%) | 61 (11.1%) |
| 75 Years and over | 149 (61.3%) | 170 (37.4%) |
Disability Class by Sex by Age in Bristol borough
Disability Class: Hearing Difficulty
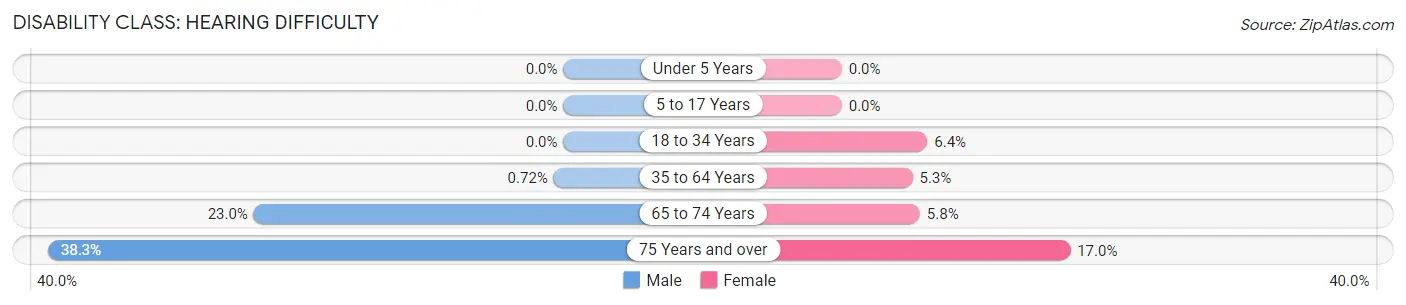
| Age Bracket | Male | Female |
| Under 5 Years | 0 (0.0%) | 0 (0.0%) |
| 5 to 17 Years | 0 (0.0%) | 0 (0.0%) |
| 18 to 34 Years | 0 (0.0%) | 66 (6.4%) |
| 35 to 64 Years | 13 (0.7%) | 104 (5.2%) |
| 65 to 74 Years | 123 (23.0%) | 32 (5.8%) |
| 75 Years and over | 93 (38.3%) | 77 (17.0%) |
Disability Class: Vision Difficulty
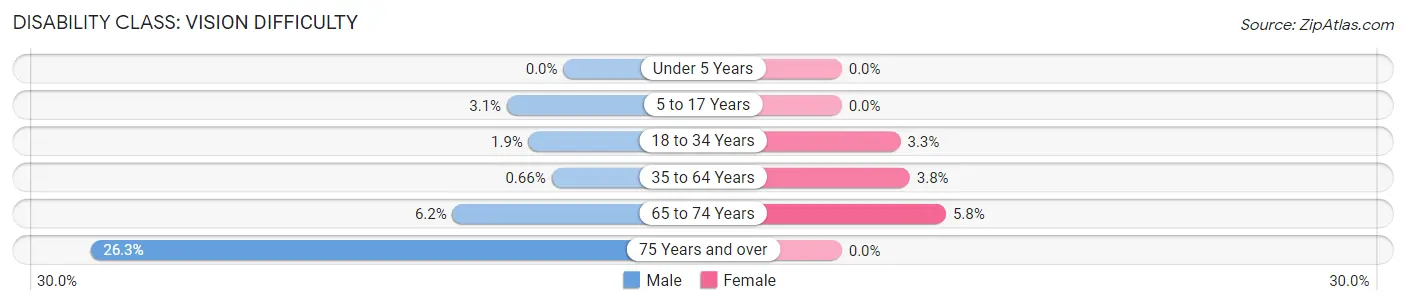
| Age Bracket | Male | Female |
| Under 5 Years | 0 (0.0%) | 0 (0.0%) |
| 5 to 17 Years | 27 (3.1%) | 0 (0.0%) |
| 18 to 34 Years | 20 (1.9%) | 34 (3.3%) |
| 35 to 64 Years | 12 (0.7%) | 75 (3.8%) |
| 65 to 74 Years | 33 (6.2%) | 32 (5.8%) |
| 75 Years and over | 64 (26.3%) | 0 (0.0%) |
Disability Class: Cognitive Difficulty
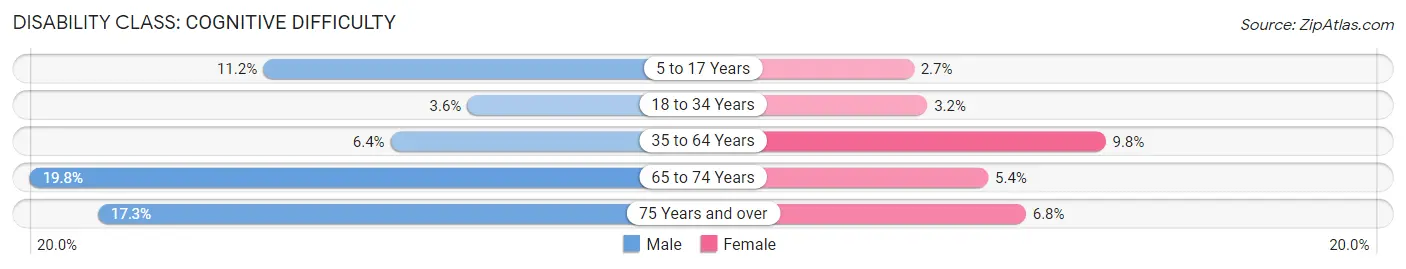
| Age Bracket | Male | Female |
| 5 to 17 Years | 96 (11.2%) | 15 (2.7%) |
| 18 to 34 Years | 37 (3.6%) | 33 (3.2%) |
| 35 to 64 Years | 116 (6.4%) | 194 (9.8%) |
| 65 to 74 Years | 106 (19.8%) | 30 (5.4%) |
| 75 Years and over | 42 (17.3%) | 31 (6.8%) |
Disability Class: Ambulatory Difficulty
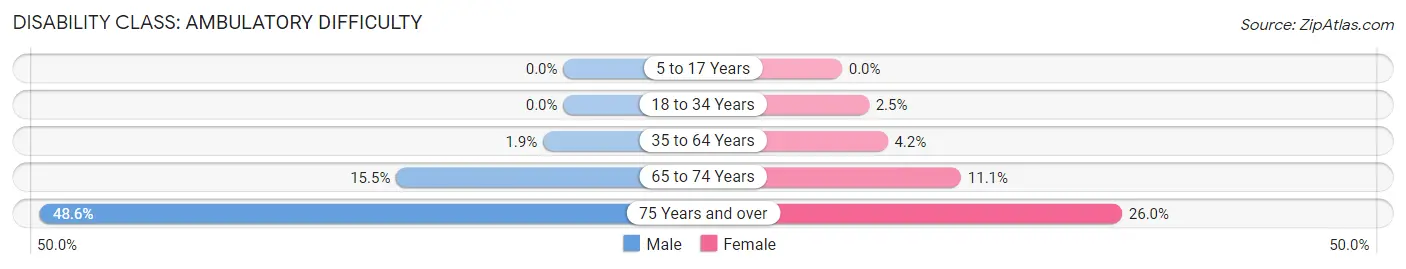
| Age Bracket | Male | Female |
| 5 to 17 Years | 0 (0.0%) | 0 (0.0%) |
| 18 to 34 Years | 0 (0.0%) | 26 (2.5%) |
| 35 to 64 Years | 34 (1.9%) | 84 (4.2%) |
| 65 to 74 Years | 83 (15.5%) | 61 (11.1%) |
| 75 Years and over | 118 (48.6%) | 118 (26.0%) |
Disability Class: Self-Care Difficulty
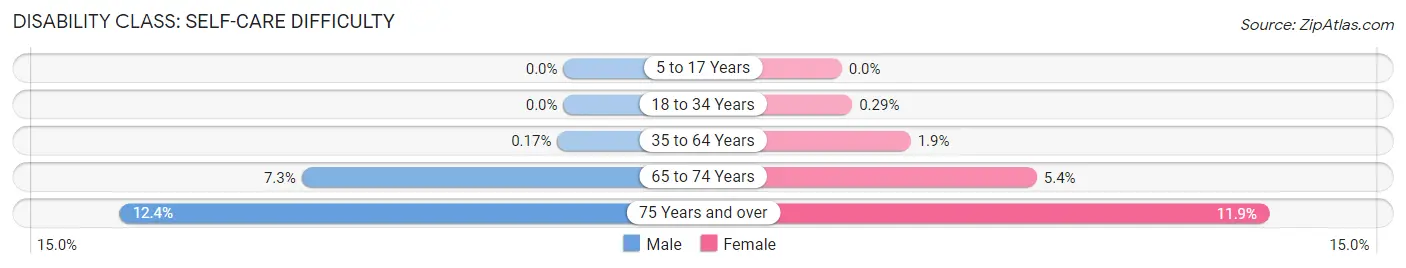
| Age Bracket | Male | Female |
| 5 to 17 Years | 0 (0.0%) | 0 (0.0%) |
| 18 to 34 Years | 0 (0.0%) | 3 (0.3%) |
| 35 to 64 Years | 3 (0.2%) | 38 (1.9%) |
| 65 to 74 Years | 39 (7.3%) | 30 (5.4%) |
| 75 Years and over | 30 (12.3%) | 54 (11.9%) |
Technology Access in Bristol borough
Computing Device Access in Bristol borough
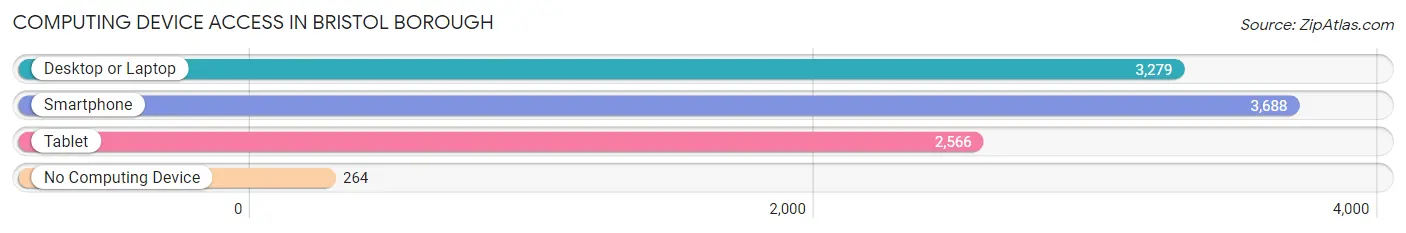
| Device Type | # Households | % Households |
| Desktop or Laptop | 3,279 | 79.1% |
| Smartphone | 3,688 | 88.9% |
| Tablet | 2,566 | 61.9% |
| No Computing Device | 264 | 6.4% |
| Total | 4,146 | 100.0% |
Internet Access in Bristol borough
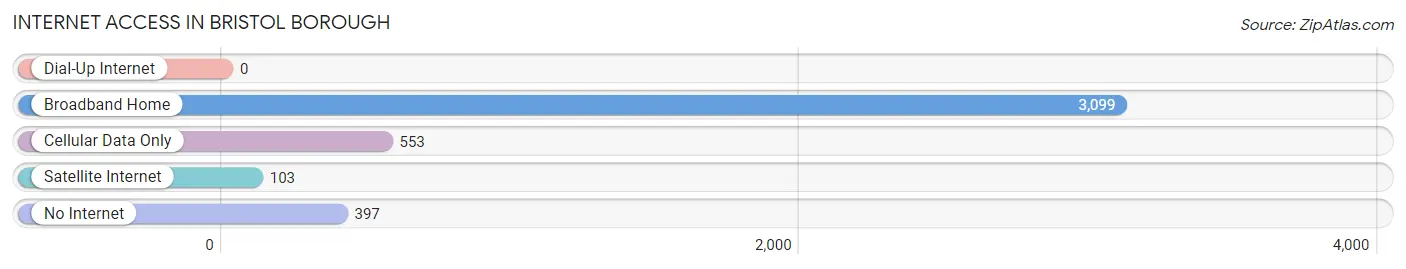
| Internet Type | # Households | % Households |
| Dial-Up Internet | 0 | 0.0% |
| Broadband Home | 3,099 | 74.8% |
| Cellular Data Only | 553 | 13.3% |
| Satellite Internet | 103 | 2.5% |
| No Internet | 397 | 9.6% |
| Total | 4,146 | 100.0% |
Bristol borough Summary
Bristol Borough is a borough in Bucks County, Pennsylvania, located along the Delaware River. It is the oldest borough in the county, having been incorporated in 1720. The borough is home to a population of 9,726 people, according to the 2010 census.
Geography
Bristol Borough is located in southeastern Pennsylvania, in the Delaware Valley region. It is situated along the Delaware River, just north of Philadelphia. The borough is bordered by the boroughs of Morrisville and Fallsington to the north, and by the townships of Bristol and Middletown to the east and south, respectively. The borough covers an area of 1.3 square miles, all of which is land.
Climate
Bristol Borough has a humid subtropical climate, with hot, humid summers and cold, wet winters. The average annual temperature is 57°F, with an average high of 79°F in July and an average low of 35°F in January. The average annual precipitation is 44 inches, with an average of 4 inches of snowfall per year.
Demographics
As of the 2010 census, the population of Bristol Borough was 9,726 people, with a population density of 7,400 people per square mile. The racial makeup of the borough was 79.3% White, 11.3% African American, 0.3% Native American, 1.2% Asian, 0.1% Pacific Islander, 5.2% from other races, and 2.6% from two or more races. Hispanic or Latino of any race were 11.7% of the population.
The median household income in Bristol Borough was $41,945, and the median family income was $50,945. The per capita income was $20,945. About 11.3% of families and 14.2% of the population were below the poverty line, including 19.2% of those under age 18 and 8.2% of those age 65 or over.
Economy
Bristol Borough is home to a variety of businesses, including manufacturing, retail, and service industries. The largest employers in the borough are Bristol Borough School District, Bristol Township School District, and the Bristol Borough Police Department. Other major employers include the Bristol Borough Water Department, the Bristol Borough Fire Department, and the Bristol Borough Public Works Department.
The borough is also home to a number of small businesses, including restaurants, shops, and other services. The borough is also home to a number of historic sites, including the Bristol Wharf, the Bristol Ferry, and the Bristol Historic District.
History
Bristol Borough was founded in 1720 by William Penn, who named it after his hometown of Bristol, England. The borough was originally part of Bucks County, and was incorporated in 1720.
In the 19th century, the borough became a major industrial center, with a number of factories and mills located along the Delaware River. The borough was also home to a number of shipyards, which built ships for the U.S. Navy during the Civil War.
In the 20th century, the borough continued to be an important industrial center, with a number of factories and mills located along the Delaware River. The borough also became a popular tourist destination, with a number of attractions, including the Bristol Ferry, the Bristol Wharf, and the Bristol Historic District.
Today, Bristol Borough is a vibrant community, with a variety of businesses, attractions, and historic sites. The borough is also home to a number of parks and recreational facilities, including the Bristol Borough Park, the Bristol Borough Pool, and the Bristol Borough Library.
Common Questions
What is Per Capita Income in Bristol borough?
Per Capita income in Bristol borough is $37,766.
What is the Median Family Income in Bristol borough?
Median Family Income in Bristol borough is $86,476.
What is the Median Household income in Bristol borough?
Median Household Income in Bristol borough is $67,176.
What is Income or Wage Gap in Bristol borough?
Income or Wage Gap in Bristol borough is 29.3%.
Women in Bristol borough earn 70.7 cents for every dollar earned by a man.
What is Family Income Deficit in Bristol borough?
Family Income Deficit in Bristol borough is $14,207.
Families that are below poverty line in Bristol borough earn $14,207 less on average than the poverty threshold level.
What is Inequality or Gini Index in Bristol borough?
Inequality or Gini Index in Bristol borough is 0.45.
What is the Total Population of Bristol borough?
Total Population of Bristol borough is 9,862.
What is the Total Male Population of Bristol borough?
Total Male Population of Bristol borough is 4,842.
What is the Total Female Population of Bristol borough?
Total Female Population of Bristol borough is 5,020.
What is the Ratio of Males per 100 Females in Bristol borough?
There are 96.45 Males per 100 Females in Bristol borough.
What is the Ratio of Females per 100 Males in Bristol borough?
There are 103.68 Females per 100 Males in Bristol borough.
What is the Median Population Age in Bristol borough?
Median Population Age in Bristol borough is 38.9 Years.
What is the Average Family Size in Bristol borough
Average Family Size in Bristol borough is 2.9 People.
What is the Average Household Size in Bristol borough
Average Household Size in Bristol borough is 2.4 People.
How Large is the Labor Force in Bristol borough?
There are 5,235 People in the Labor Forcein in Bristol borough.
What is the Percentage of People in the Labor Force in Bristol borough?
67.2% of People are in the Labor Force in Bristol borough.
What is the Unemployment Rate in Bristol borough?
Unemployment Rate in Bristol borough is 5.8%.