Cities with the Largest Hispanic or Latino Community in Vermont
RELATED REPORTS & OPTIONS
Hispanic or Latino
Vermont
Compare Cities
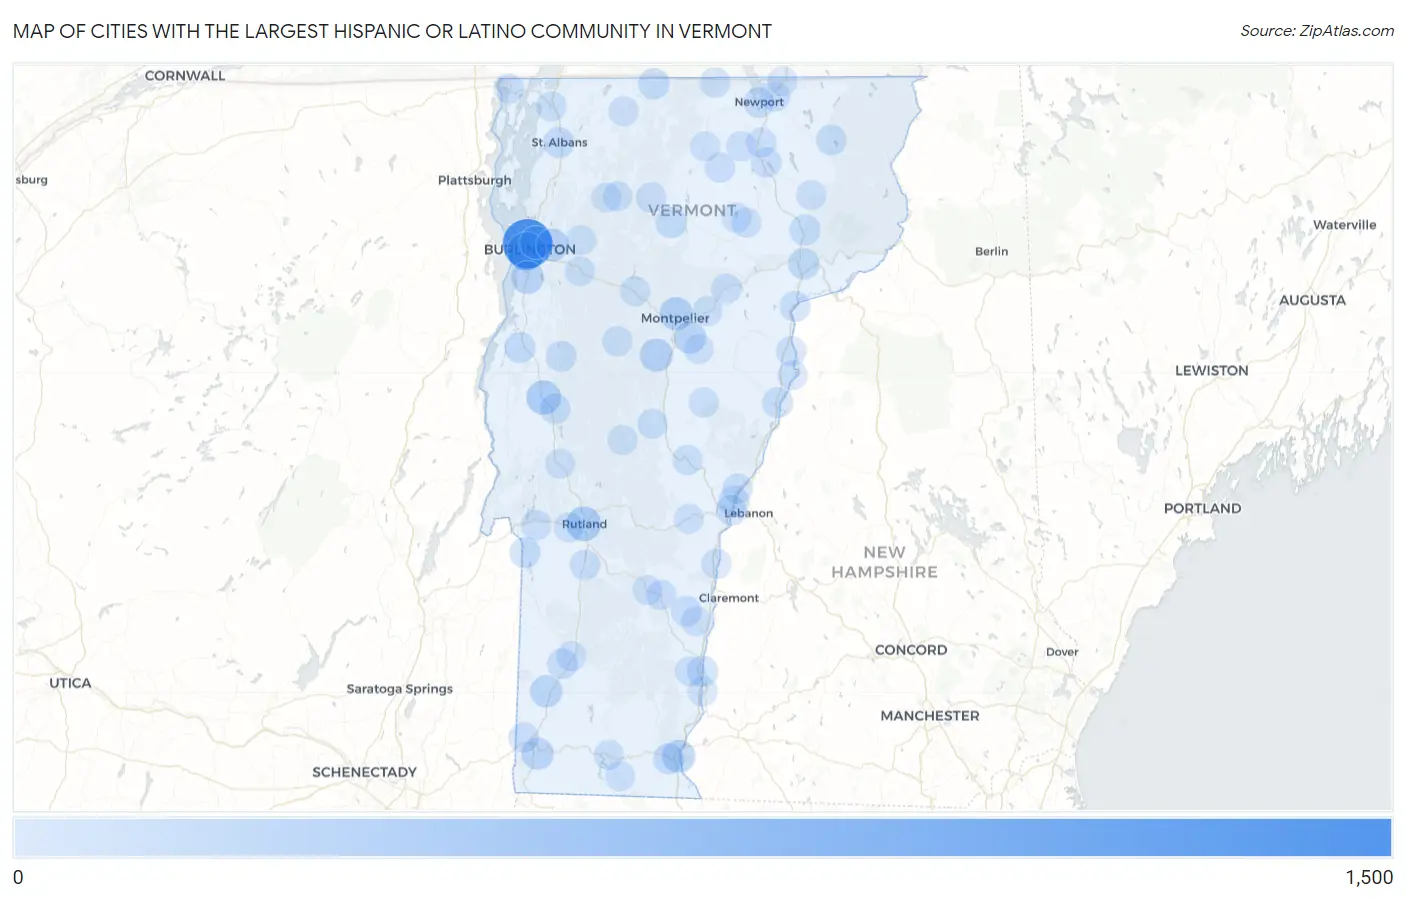
Map of Cities with the Largest Hispanic or Latino Community in Vermont
0
1,500
Cities with the Largest Hispanic or Latino Community in Vermont
| City | Hispanic or Latino | vs State | vs National | |
| 1. | Burlington | 1,457 | 13,793(10.56%)#1 | 61,755,866(0.00%)#3,694 |
| 2. | South Burlington | 615 | 13,793(4.46%)#2 | 61,755,866(0.00%)#6,005 |
| 3. | Rutland | 335 | 13,793(2.43%)#3 | 61,755,866(0.00%)#7,887 |
| 4. | Middlebury | 309 | 13,793(2.24%)#4 | 61,755,866(0.00%)#8,150 |
| 5. | Montpelier | 234 | 13,793(1.70%)#5 | 61,755,866(0.00%)#9,145 |
| 6. | Winooski | 220 | 13,793(1.60%)#6 | 61,755,866(0.00%)#9,341 |
| 7. | Northfield | 214 | 13,793(1.55%)#7 | 61,755,866(0.00%)#9,442 |
| 8. | Brattleboro | 209 | 13,793(1.52%)#8 | 61,755,866(0.00%)#9,538 |
| 9. | Essex Junction | 197 | 13,793(1.43%)#9 | 61,755,866(0.00%)#9,763 |
| 10. | Shelburne | 195 | 13,793(1.41%)#10 | 61,755,866(0.00%)#9,800 |
| 11. | Arlington | 167 | 13,793(1.21%)#11 | 61,755,866(0.00%)#10,362 |
| 12. | Barre | 150 | 13,793(1.09%)#12 | 61,755,866(0.00%)#10,725 |
| 13. | Bennington | 148 | 13,793(1.07%)#13 | 61,755,866(0.00%)#10,770 |
| 14. | St Johnsbury | 95 | 13,793(0.69%)#14 | 61,755,866(0.00%)#12,478 |
| 15. | Richford | 93 | 13,793(0.67%)#15 | 61,755,866(0.00%)#12,567 |
| 16. | Pawlet | 91 | 13,793(0.66%)#16 | 61,755,866(0.00%)#12,650 |
| 17. | Morrisville | 89 | 13,793(0.65%)#17 | 61,755,866(0.00%)#12,714 |
| 18. | West Brattleboro | 80 | 13,793(0.58%)#18 | 61,755,866(0.00%)#13,147 |
| 19. | Lyndonville | 77 | 13,793(0.56%)#19 | 61,755,866(0.00%)#13,309 |
| 20. | Vergennes | 75 | 13,793(0.54%)#20 | 61,755,866(0.00%)#13,401 |
| 21. | Bellows Falls | 64 | 13,793(0.46%)#21 | 61,755,866(0.00%)#14,000 |
| 22. | Poultney | 64 | 13,793(0.46%)#22 | 61,755,866(0.00%)#14,020 |
| 23. | St Albans | 62 | 13,793(0.45%)#23 | 61,755,866(0.00%)#14,111 |
| 24. | Wilder | 61 | 13,793(0.44%)#24 | 61,755,866(0.00%)#14,183 |
| 25. | White River Junction | 59 | 13,793(0.43%)#25 | 61,755,866(0.00%)#14,298 |
| 26. | Bristol | 57 | 13,793(0.41%)#26 | 61,755,866(0.00%)#14,454 |
| 27. | Bradford | 51 | 13,793(0.37%)#27 | 61,755,866(0.00%)#14,869 |
| 28. | Killington | 51 | 13,793(0.37%)#28 | 61,755,866(0.00%)#14,909 |
| 29. | East Middlebury | 49 | 13,793(0.36%)#29 | 61,755,866(0.00%)#15,074 |
| 30. | Barnet | 48 | 13,793(0.35%)#30 | 61,755,866(0.00%)#15,164 |
| 31. | Newport | 47 | 13,793(0.34%)#31 | 61,755,866(0.00%)#15,171 |
| 32. | Bakersfield | 46 | 13,793(0.33%)#32 | 61,755,866(0.00%)#15,330 |
| 33. | Manchester | 43 | 13,793(0.31%)#33 | 61,755,866(0.00%)#15,568 |
| 34. | North Springfield | 42 | 13,793(0.30%)#34 | 61,755,866(0.00%)#15,676 |
| 35. | Island Pond | 40 | 13,793(0.29%)#35 | 61,755,866(0.00%)#15,841 |
| 36. | Johnson | 37 | 13,793(0.27%)#36 | 61,755,866(0.00%)#16,124 |
| 37. | Sheffield | 35 | 13,793(0.25%)#37 | 61,755,866(0.00%)#16,385 |
| 38. | North Bennington | 33 | 13,793(0.24%)#38 | 61,755,866(0.00%)#16,540 |
| 39. | Wallingford | 28 | 13,793(0.20%)#39 | 61,755,866(0.00%)#17,177 |
| 40. | Castleton | 25 | 13,793(0.18%)#40 | 61,755,866(0.00%)#17,565 |
| 41. | Barton | 24 | 13,793(0.17%)#41 | 61,755,866(0.00%)#17,743 |
| 42. | Bolton Valley | 24 | 13,793(0.17%)#42 | 61,755,866(0.00%)#17,819 |
| 43. | Marshfield | 22 | 13,793(0.16%)#43 | 61,755,866(0.00%)#18,086 |
| 44. | Castleton Four Corners | 21 | 13,793(0.15%)#44 | 61,755,866(0.00%)#18,201 |
| 45. | Proctorsville | 21 | 13,793(0.15%)#45 | 61,755,866(0.00%)#18,241 |
| 46. | Swanton | 20 | 13,793(0.15%)#46 | 61,755,866(0.00%)#18,290 |
| 47. | Waitsfield | 20 | 13,793(0.15%)#47 | 61,755,866(0.00%)#18,421 |
| 48. | Albany | 20 | 13,793(0.15%)#48 | 61,755,866(0.00%)#18,425 |
| 49. | South Hero | 20 | 13,793(0.15%)#49 | 61,755,866(0.00%)#18,431 |
| 50. | Lyndon Center | 19 | 13,793(0.14%)#50 | 61,755,866(0.00%)#18,586 |
| 51. | Algiers | 19 | 13,793(0.14%)#51 | 61,755,866(0.00%)#18,595 |
| 52. | Derby Center | 18 | 13,793(0.13%)#52 | 61,755,866(0.00%)#18,696 |
| 53. | South Royalton | 18 | 13,793(0.13%)#53 | 61,755,866(0.00%)#18,735 |
| 54. | Randolph | 17 | 13,793(0.12%)#54 | 61,755,866(0.00%)#18,819 |
| 55. | Norwich | 15 | 13,793(0.11%)#55 | 61,755,866(0.00%)#19,248 |
| 56. | Huntington | 13 | 13,793(0.09%)#56 | 61,755,866(0.00%)#19,707 |
| 57. | North Troy | 13 | 13,793(0.09%)#57 | 61,755,866(0.00%)#19,709 |
| 58. | Websterville | 13 | 13,793(0.09%)#58 | 61,755,866(0.00%)#19,778 |
| 59. | Brandon | 12 | 13,793(0.09%)#59 | 61,755,866(0.00%)#19,847 |
| 60. | Cambridge | 12 | 13,793(0.09%)#60 | 61,755,866(0.00%)#20,039 |
| 61. | Grafton | 12 | 13,793(0.09%)#61 | 61,755,866(0.00%)#20,069 |
| 62. | Windsor | 11 | 13,793(0.08%)#62 | 61,755,866(0.00%)#20,098 |
| 63. | Enosburg Falls | 11 | 13,793(0.08%)#63 | 61,755,866(0.00%)#20,111 |
| 64. | Plainfield | 11 | 13,793(0.08%)#64 | 61,755,866(0.00%)#20,250 |
| 65. | Waterbury | 10 | 13,793(0.07%)#65 | 61,755,866(0.00%)#20,371 |
| 66. | Lowell | 10 | 13,793(0.07%)#66 | 61,755,866(0.00%)#20,546 |
| 67. | West Burke | 10 | 13,793(0.07%)#67 | 61,755,866(0.00%)#20,561 |
| 68. | Springfield | 9 | 13,793(0.07%)#68 | 61,755,866(0.00%)#20,613 |
| 69. | Orleans | 9 | 13,793(0.07%)#69 | 61,755,866(0.00%)#20,669 |
| 70. | Saxtons River | 9 | 13,793(0.07%)#70 | 61,755,866(0.00%)#20,708 |
| 71. | Westminster | 9 | 13,793(0.07%)#71 | 61,755,866(0.00%)#20,716 |
| 72. | Alburgh | 9 | 13,793(0.07%)#72 | 61,755,866(0.00%)#20,742 |
| 73. | Highgate Center | 9 | 13,793(0.07%)#73 | 61,755,866(0.00%)#20,806 |
| 74. | Irasburg | 9 | 13,793(0.07%)#74 | 61,755,866(0.00%)#20,837 |
| 75. | Chelsea | 8 | 13,793(0.06%)#75 | 61,755,866(0.00%)#21,034 |
| 76. | West Rutland | 7 | 13,793(0.05%)#76 | 61,755,866(0.00%)#21,191 |
| 77. | Jericho | 7 | 13,793(0.05%)#77 | 61,755,866(0.00%)#21,224 |
| 78. | Derby Line | 7 | 13,793(0.05%)#78 | 61,755,866(0.00%)#21,265 |
| 79. | Richmond | 7 | 13,793(0.05%)#79 | 61,755,866(0.00%)#21,267 |
| 80. | Wells River | 7 | 13,793(0.05%)#80 | 61,755,866(0.00%)#21,358 |
| 81. | Jacksonville | 7 | 13,793(0.05%)#81 | 61,755,866(0.00%)#21,396 |
| 82. | Stamford | 6 | 13,793(0.04%)#82 | 61,755,866(0.00%)#21,612 |
| 83. | Gilman | 6 | 13,793(0.04%)#83 | 61,755,866(0.00%)#21,713 |
| 84. | Newbury | 5 | 13,793(0.04%)#84 | 61,755,866(0.00%)#21,965 |
| 85. | Lincoln | 5 | 13,793(0.04%)#85 | 61,755,866(0.00%)#22,023 |
| 86. | Wolcott | 5 | 13,793(0.04%)#86 | 61,755,866(0.00%)#22,073 |
| 87. | Greensboro | 5 | 13,793(0.04%)#87 | 61,755,866(0.00%)#22,108 |
| 88. | Manchester Center | 4 | 13,793(0.03%)#88 | 61,755,866(0.00%)#22,155 |
| 89. | Wilmington | 4 | 13,793(0.03%)#89 | 61,755,866(0.00%)#22,298 |
| 90. | Rochester | 4 | 13,793(0.03%)#90 | 61,755,866(0.00%)#22,342 |
| 91. | Jeffersonville | 3 | 13,793(0.02%)#91 | 61,755,866(0.00%)#22,593 |
| 92. | Greensboro Bend | 3 | 13,793(0.02%)#92 | 61,755,866(0.00%)#22,756 |
| 93. | South Lincoln | 3 | 13,793(0.02%)#93 | 61,755,866(0.00%)#22,836 |
| 94. | Highgate Springs | 3 | 13,793(0.02%)#94 | 61,755,866(0.00%)#22,923 |
| 95. | Woodstock | 2 | 13,793(0.01%)#95 | 61,755,866(0.00%)#22,977 |
| 96. | St. George | 2 | 13,793(0.01%)#96 | 61,755,866(0.00%)#23,073 |
| 97. | New Haven | 2 | 13,793(0.01%)#97 | 61,755,866(0.00%)#23,250 |
| 98. | Bolton | 2 | 13,793(0.01%)#98 | 61,755,866(0.00%)#23,366 |
| 99. | Ludlow | 1 | 13,793(0.01%)#99 | 61,755,866(0.00%)#23,427 |
1
Common Questions
What are the Top 10 Cities with the Largest Hispanic or Latino Community in Vermont?
Top 10 Cities with the Largest Hispanic or Latino Community in Vermont are:
#1
1,457
#2
615
#3
335
#4
309
#5
234
#6
220
#7
214
#8
209
#9
197
#10
195
What city has the Largest Hispanic or Latino Community in Vermont?
Burlington has the Largest Hispanic or Latino Community in Vermont with 1,457.
What is the Total Hispanic or Latino Population in the State of Vermont?
Total Hispanic or Latino Population in Vermont is 13,793.
What is the Total Hispanic or Latino Population in the United States?
Total Hispanic or Latino Population in the United States is 61,755,866.