Parkville, PA Map & Demographics
Parkville Map
Parkville Overview
$35,658
PER CAPITA INCOME
$89,955
AVG FAMILY INCOME
$70,497
AVG HOUSEHOLD INCOME
26.7%
WAGE / INCOME GAP [ % ]
73.3¢/ $1
WAGE / INCOME GAP [ $ ]
0.37
INEQUALITY / GINI INDEX
8,226
TOTAL POPULATION
4,375
MALE POPULATION
3,851
FEMALE POPULATION
113.61
MALES / 100 FEMALES
88.02
FEMALES / 100 MALES
36.4
MEDIAN AGE
3.0
AVG FAMILY SIZE
2.5
AVG HOUSEHOLD SIZE
4,495
LABOR FORCE [ PEOPLE ]
67.6%
PERCENT IN LABOR FORCE
3.7%
UNEMPLOYMENT RATE
Income in Parkville
Income Overview in Parkville
Per Capita Income in Parkville is $35,658, while median incomes of families and households are $89,955 and $70,497 respectively.
| Characteristic | Number | Measure |
| Per Capita Income | 8,226 | $35,658 |
| Median Family Income | 2,095 | $89,955 |
| Mean Family Income | 2,095 | $102,442 |
| Median Household Income | 3,253 | $70,497 |
| Mean Household Income | 3,253 | $85,886 |
| Income Deficit | 2,095 | $0 |
| Wage / Income Gap (%) | 8,226 | 26.70% |
| Wage / Income Gap ($) | 8,226 | 73.30¢ per $1 |
| Gini / Inequality Index | 8,226 | 0.37 |
Earnings by Sex in Parkville
Average Earnings in Parkville are $39,329, $47,865 for men and $35,087 for women, a difference of 26.7%.
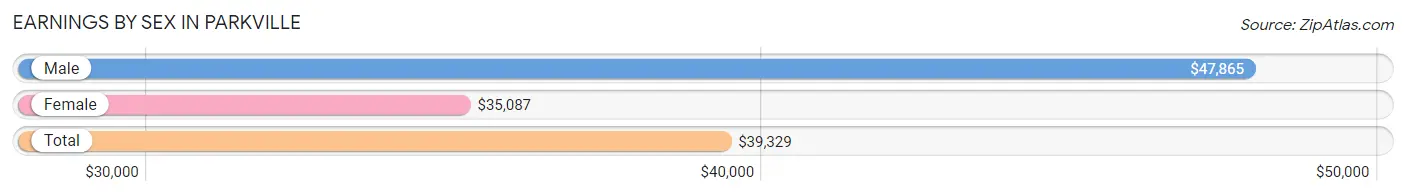
| Sex | Number | Average Earnings |
| Male | 2,625 (55.6%) | $47,865 |
| Female | 2,092 (44.4%) | $35,087 |
| Total | 4,717 (100.0%) | $39,329 |
Earnings by Sex by Income Bracket in Parkville
The most common earnings brackets in Parkville are $100,000+ for men (338 | 12.9%) and $35,000 to $39,999 for women (330 | 15.8%).
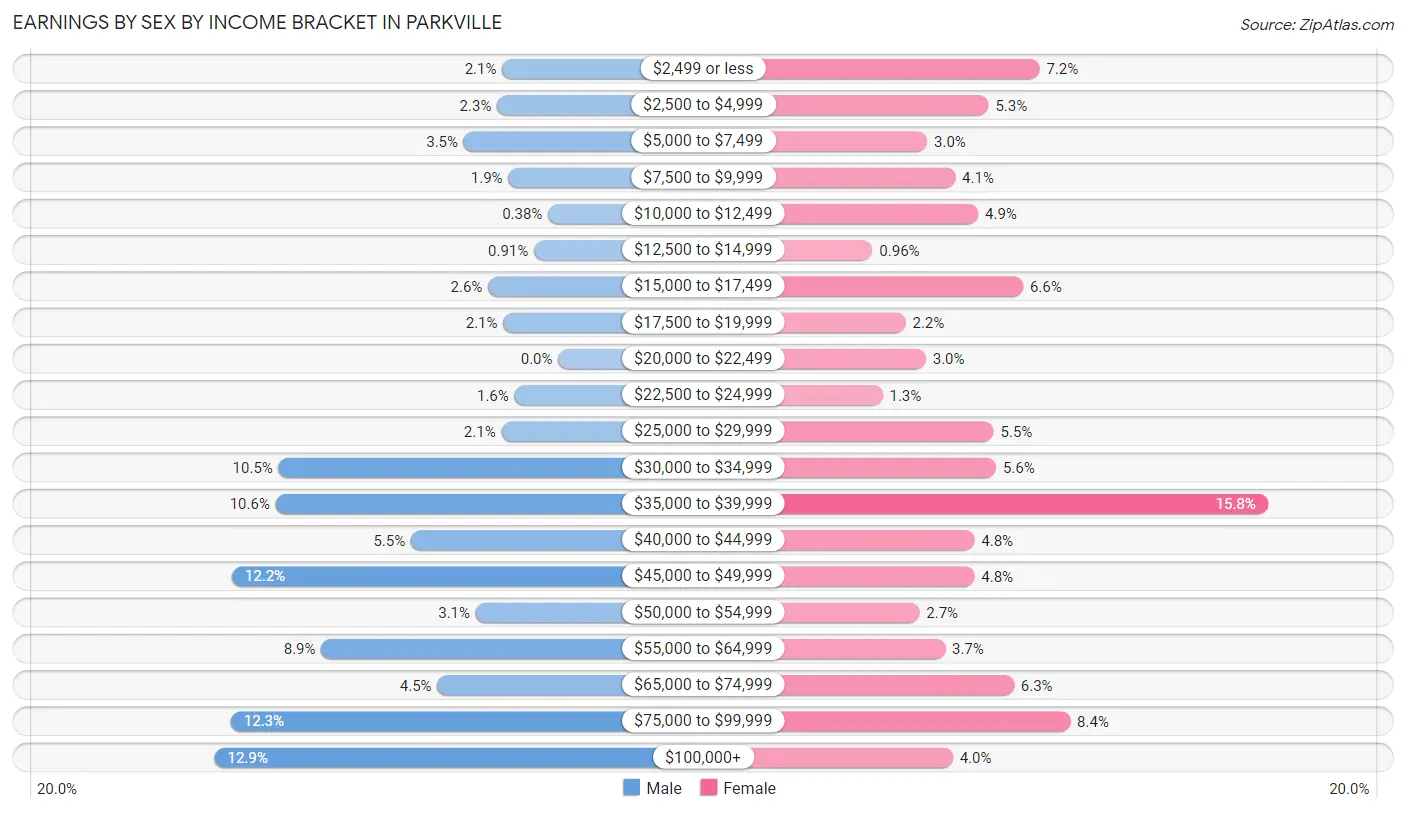
| Income | Male | Female |
| $2,499 or less | 55 (2.1%) | 151 (7.2%) |
| $2,500 to $4,999 | 60 (2.3%) | 111 (5.3%) |
| $5,000 to $7,499 | 93 (3.5%) | 63 (3.0%) |
| $7,500 to $9,999 | 49 (1.9%) | 85 (4.1%) |
| $10,000 to $12,499 | 10 (0.4%) | 103 (4.9%) |
| $12,500 to $14,999 | 24 (0.9%) | 20 (1.0%) |
| $15,000 to $17,499 | 69 (2.6%) | 138 (6.6%) |
| $17,500 to $19,999 | 54 (2.1%) | 46 (2.2%) |
| $20,000 to $22,499 | 0 (0.0%) | 62 (3.0%) |
| $22,500 to $24,999 | 43 (1.6%) | 28 (1.3%) |
| $25,000 to $29,999 | 56 (2.1%) | 115 (5.5%) |
| $30,000 to $34,999 | 275 (10.5%) | 117 (5.6%) |
| $35,000 to $39,999 | 278 (10.6%) | 330 (15.8%) |
| $40,000 to $44,999 | 145 (5.5%) | 100 (4.8%) |
| $45,000 to $49,999 | 321 (12.2%) | 100 (4.8%) |
| $50,000 to $54,999 | 81 (3.1%) | 57 (2.7%) |
| $55,000 to $64,999 | 233 (8.9%) | 77 (3.7%) |
| $65,000 to $74,999 | 119 (4.5%) | 131 (6.3%) |
| $75,000 to $99,999 | 322 (12.3%) | 175 (8.4%) |
| $100,000+ | 338 (12.9%) | 83 (4.0%) |
| Total | 2,625 (100.0%) | 2,092 (100.0%) |
Earnings by Sex by Educational Attainment in Parkville
Average earnings in Parkville are $49,256 for men and $36,863 for women, a difference of 25.2%. Men with an educational attainment of bachelor's degree enjoy the highest average annual earnings of $105,046, while those with high school diploma education earn the least with $45,313. Women with an educational attainment of graduate degree earn the most with the average annual earnings of $48,500, while those with high school diploma education have the smallest earnings of $28,567.
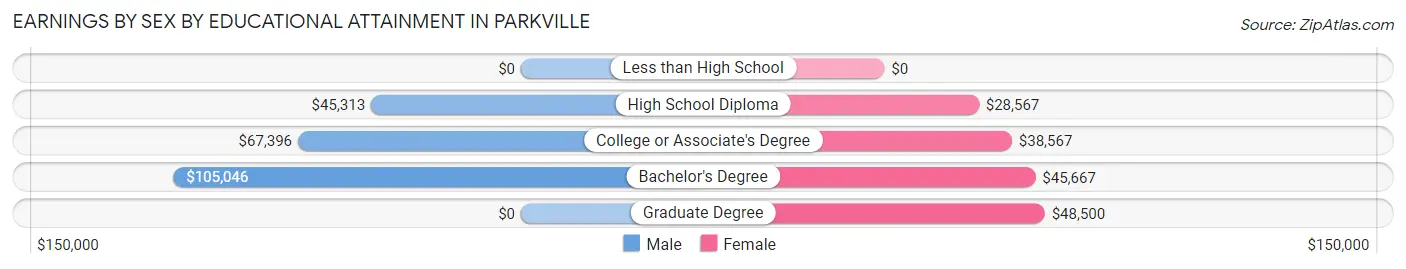
| Educational Attainment | Male Income | Female Income |
| Less than High School | - | - |
| High School Diploma | $45,313 | $28,567 |
| College or Associate's Degree | $67,396 | $38,567 |
| Bachelor's Degree | $105,046 | $45,667 |
| Graduate Degree | - | - |
| Total | $49,256 | $36,863 |
Family Income in Parkville
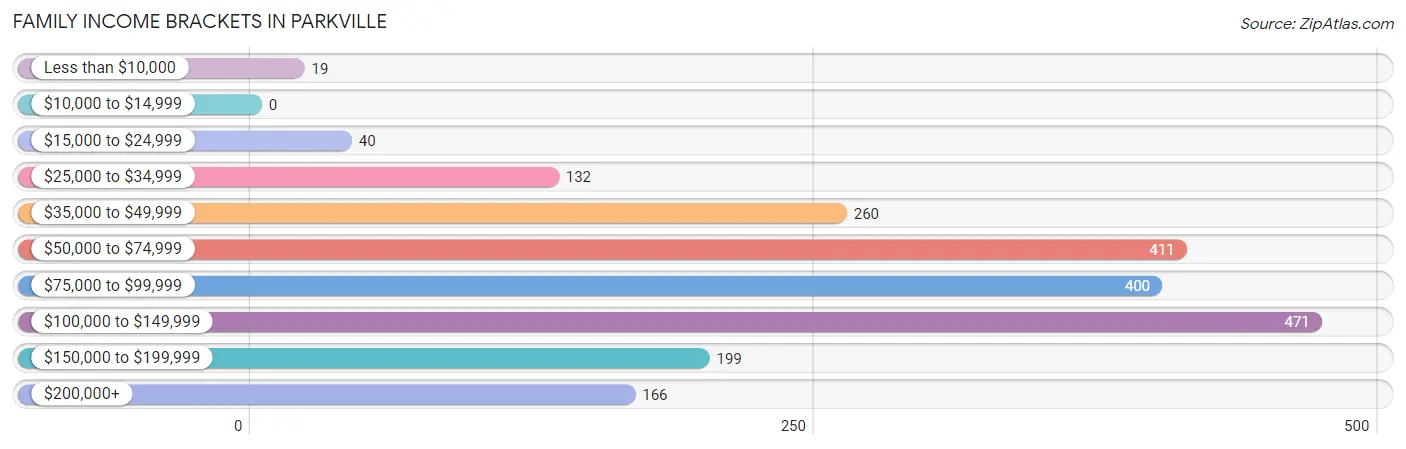
Family Income Brackets in Parkville
According to the Parkville family income data, there are 471 families falling into the $100,000 to $149,999 income range, which is the most common income bracket and makes up 22.5% of all families.
| Income Bracket | # Families | % Families |
| Less than $10,000 | 19 | 0.9% |
| $10,000 to $14,999 | 0 | 0.0% |
| $15,000 to $24,999 | 40 | 1.9% |
| $25,000 to $34,999 | 132 | 6.3% |
| $35,000 to $49,999 | 260 | 12.4% |
| $50,000 to $74,999 | 411 | 19.6% |
| $75,000 to $99,999 | 400 | 19.1% |
| $100,000 to $149,999 | 471 | 22.5% |
| $150,000 to $199,999 | 199 | 9.5% |
| $200,000+ | 166 | 7.9% |
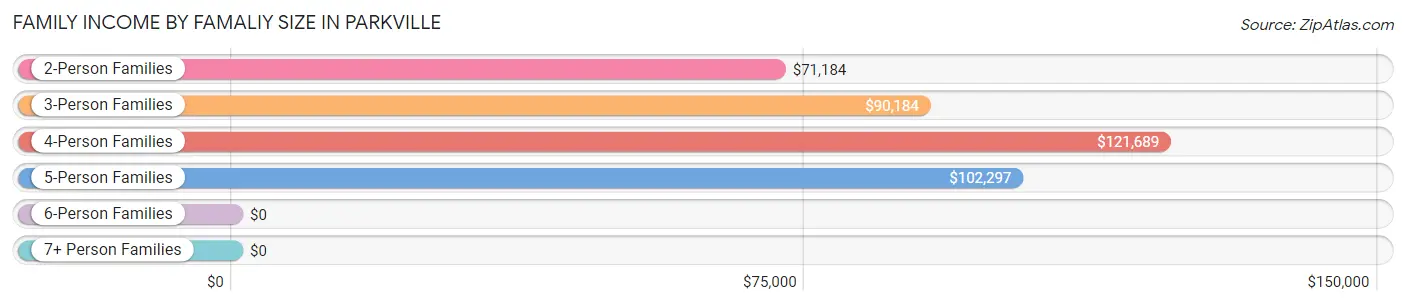
Family Income by Famaliy Size in Parkville
4-person families (372 | 17.8%) account for the highest median family income in Parkville with $121,689 per family, while 2-person families (800 | 38.2%) have the highest median income of $35,592 per family member.
| Income Bracket | # Families | Median Income |
| 2-Person Families | 800 (38.2%) | $71,184 |
| 3-Person Families | 734 (35.0%) | $90,184 |
| 4-Person Families | 372 (17.8%) | $121,689 |
| 5-Person Families | 167 (8.0%) | $102,297 |
| 6-Person Families | 22 (1.1%) | $0 |
| 7+ Person Families | 0 (0.0%) | $0 |
| Total | 2,095 (100.0%) | $89,955 |
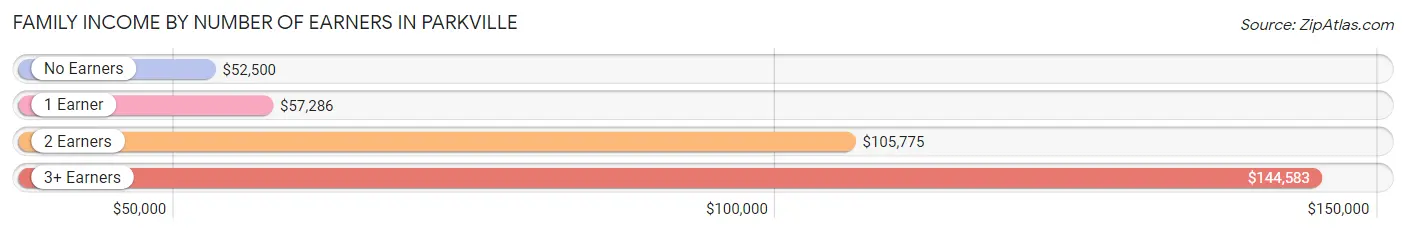
Family Income by Number of Earners in Parkville
The median family income in Parkville is $89,955, with families comprising 3+ earners (290) having the highest median family income of $144,583, while families with no earners (192) have the lowest median family income of $52,500, accounting for 13.8% and 9.2% of families, respectively.
| Number of Earners | # Families | Median Income |
| No Earners | 192 (9.2%) | $52,500 |
| 1 Earner | 848 (40.5%) | $57,286 |
| 2 Earners | 765 (36.5%) | $105,775 |
| 3+ Earners | 290 (13.8%) | $144,583 |
| Total | 2,095 (100.0%) | $89,955 |
Household Income in Parkville
Household Income Brackets in Parkville
With 693 households falling in the category, the $50,000 to $74,999 income range is the most frequent in Parkville, accounting for 21.3% of all households. In contrast, only 13 households (0.4%) fall into the $10,000 to $14,999 income bracket, making it the least populous group.
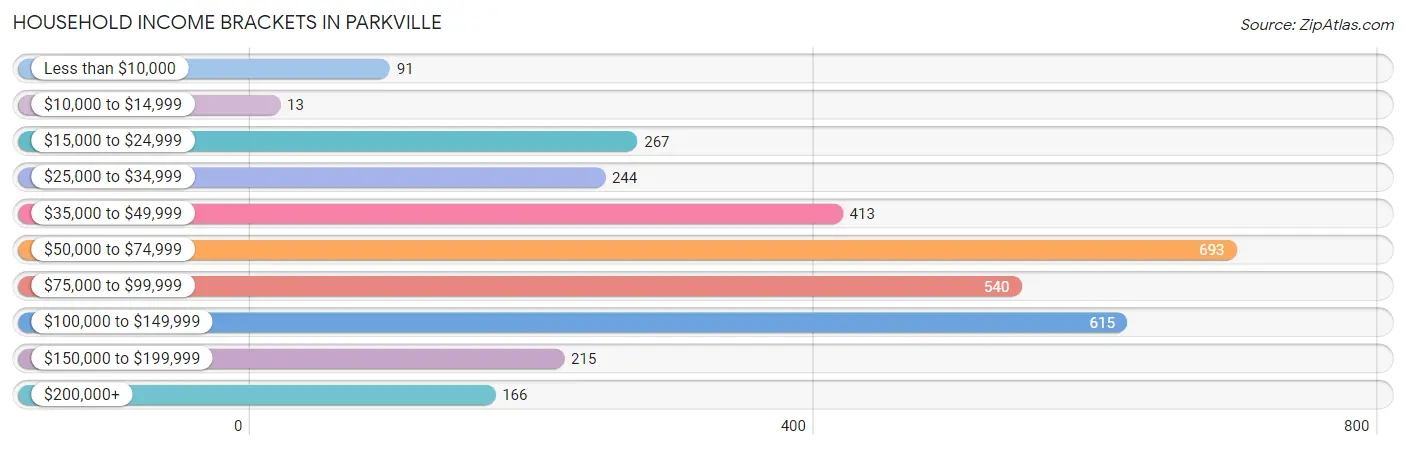
| Income Bracket | # Households | % Households |
| Less than $10,000 | 91 | 2.8% |
| $10,000 to $14,999 | 13 | 0.4% |
| $15,000 to $24,999 | 267 | 8.2% |
| $25,000 to $34,999 | 244 | 7.5% |
| $35,000 to $49,999 | 413 | 12.7% |
| $50,000 to $74,999 | 693 | 21.3% |
| $75,000 to $99,999 | 540 | 16.6% |
| $100,000 to $149,999 | 615 | 18.9% |
| $150,000 to $199,999 | 215 | 6.6% |
| $200,000+ | 166 | 5.1% |
Household Income by Householder Age in Parkville
The median household income in Parkville is $70,497, with the highest median household income of $90,281 found in the 45 to 64 years age bracket for the primary householder. A total of 1,047 households (32.2%) fall into this category. Meanwhile, the 15 to 24 years age bracket for the primary householder has the lowest median household income of $47,425, with 225 households (6.9%) in this group.
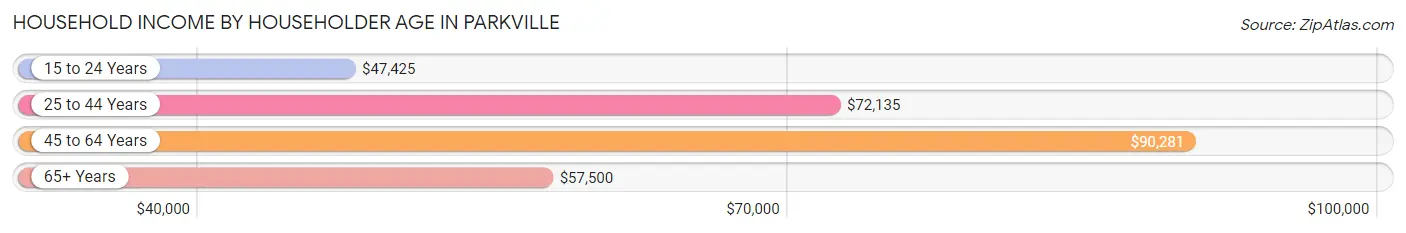
| Income Bracket | # Households | Median Income |
| 15 to 24 Years | 225 (6.9%) | $47,425 |
| 25 to 44 Years | 1,051 (32.3%) | $72,135 |
| 45 to 64 Years | 1,047 (32.2%) | $90,281 |
| 65+ Years | 930 (28.6%) | $57,500 |
| Total | 3,253 (100.0%) | $70,497 |
Poverty in Parkville
Income Below Poverty by Sex and Age in Parkville
With 6.9% poverty level for males and 5.9% for females among the residents of Parkville, 35 to 44 year old males and 55 to 64 year old females are the most vulnerable to poverty, with 82 males (21.1%) and 80 females (21.5%) in their respective age groups living below the poverty level.
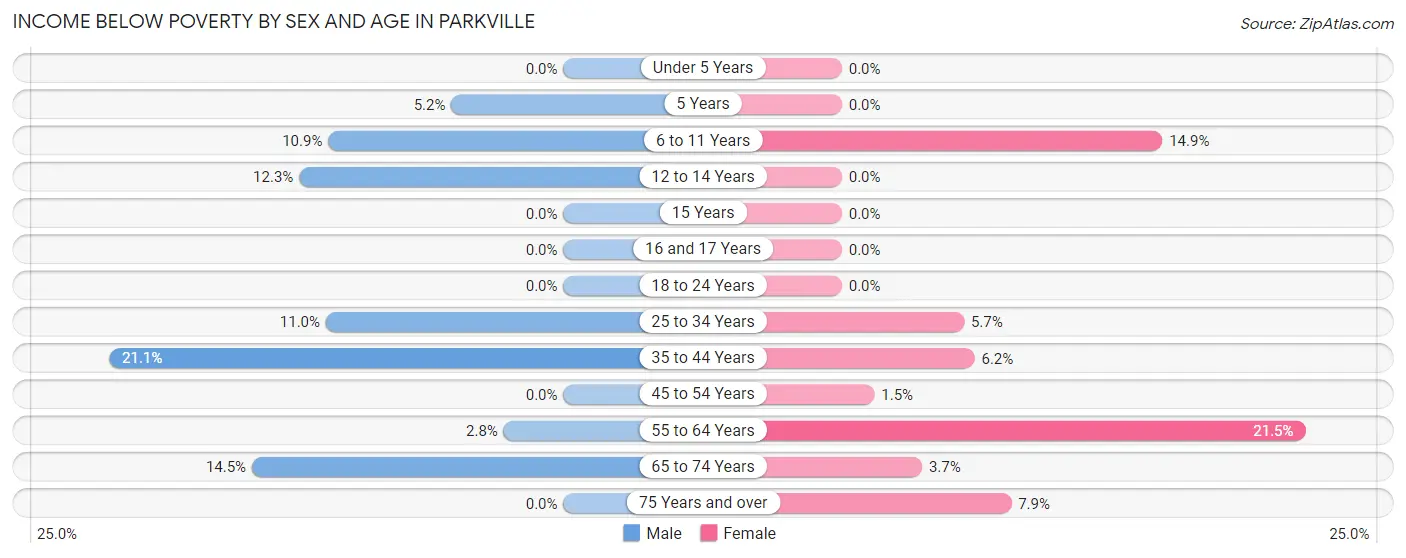
| Age Bracket | Male | Female |
| Under 5 Years | 0 (0.0%) | 0 (0.0%) |
| 5 Years | 13 (5.2%) | 0 (0.0%) |
| 6 to 11 Years | 36 (10.9%) | 40 (14.9%) |
| 12 to 14 Years | 13 (12.3%) | 0 (0.0%) |
| 15 Years | 0 (0.0%) | 0 (0.0%) |
| 16 and 17 Years | 0 (0.0%) | 0 (0.0%) |
| 18 to 24 Years | 0 (0.0%) | 0 (0.0%) |
| 25 to 34 Years | 95 (11.0%) | 27 (5.7%) |
| 35 to 44 Years | 82 (21.1%) | 30 (6.2%) |
| 45 to 54 Years | 0 (0.0%) | 9 (1.5%) |
| 55 to 64 Years | 13 (2.8%) | 80 (21.5%) |
| 65 to 74 Years | 50 (14.4%) | 20 (3.7%) |
| 75 Years and over | 0 (0.0%) | 22 (7.9%) |
| Total | 302 (6.9%) | 228 (5.9%) |
Income Above Poverty by Sex and Age in Parkville
According to the poverty statistics in Parkville, males aged under 5 years and females aged under 5 years are the age groups that are most secure financially, with 100.0% of males and 100.0% of females in these age groups living above the poverty line.
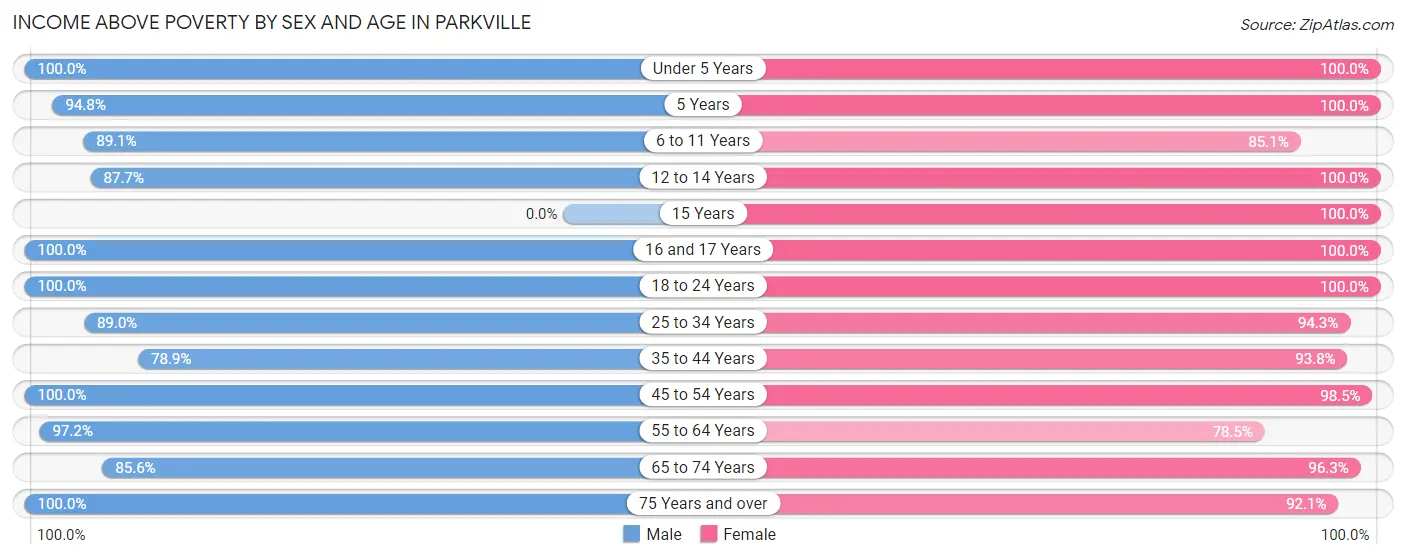
| Age Bracket | Male | Female |
| Under 5 Years | 106 (100.0%) | 316 (100.0%) |
| 5 Years | 237 (94.8%) | 7 (100.0%) |
| 6 to 11 Years | 294 (89.1%) | 229 (85.1%) |
| 12 to 14 Years | 93 (87.7%) | 71 (100.0%) |
| 15 Years | 0 (0.0%) | 121 (100.0%) |
| 16 and 17 Years | 171 (100.0%) | 56 (100.0%) |
| 18 to 24 Years | 544 (100.0%) | 264 (100.0%) |
| 25 to 34 Years | 767 (89.0%) | 449 (94.3%) |
| 35 to 44 Years | 307 (78.9%) | 457 (93.8%) |
| 45 to 54 Years | 517 (100.0%) | 586 (98.5%) |
| 55 to 64 Years | 457 (97.2%) | 292 (78.5%) |
| 65 to 74 Years | 296 (85.6%) | 517 (96.3%) |
| 75 Years and over | 284 (100.0%) | 258 (92.1%) |
| Total | 4,073 (93.1%) | 3,623 (94.1%) |
Income Below Poverty Among Married-Couple Families in Parkville
The poverty statistics for married-couple families in Parkville show that 1.9% or 27 of the total 1,443 families live below the poverty line. Families with 1 or 2 children have the highest poverty rate of 4.4%, comprising of 21 families. On the other hand, families with 3 or 4 children have the lowest poverty rate of 0.0%, which includes 0 families.
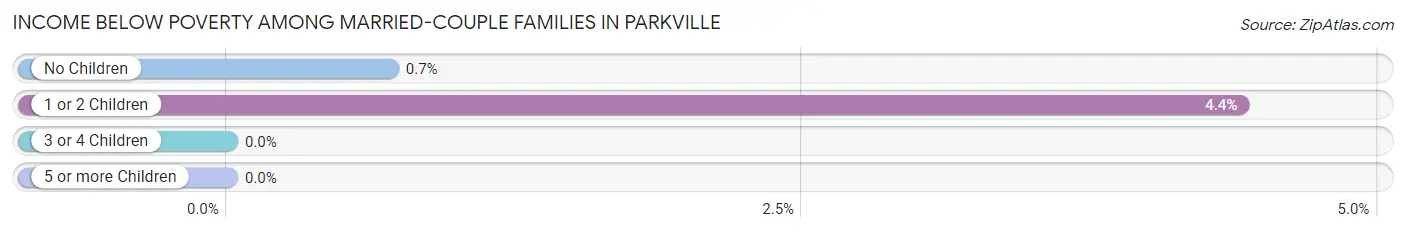
| Children | Above Poverty | Below Poverty |
| No Children | 846 (99.3%) | 6 (0.7%) |
| 1 or 2 Children | 456 (95.6%) | 21 (4.4%) |
| 3 or 4 Children | 114 (100.0%) | 0 (0.0%) |
| 5 or more Children | 0 (0.0%) | 0 (0.0%) |
| Total | 1,416 (98.1%) | 27 (1.9%) |
Income Below Poverty Among Single-Parent Households in Parkville
According to the poverty data in Parkville, 10.8% or 13 single-father households and 3.4% or 18 single-mother households are living below the poverty line. Among single-father households, those with 1 or 2 children have the highest poverty rate, with 13 households (36.1%) experiencing poverty. Likewise, among single-mother households, those with 1 or 2 children have the highest poverty rate, with 18 households (5.0%) falling below the poverty line.
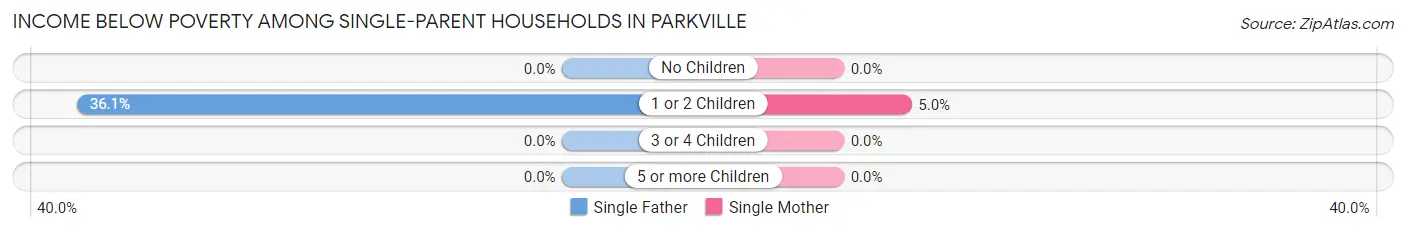
| Children | Single Father | Single Mother |
| No Children | 0 (0.0%) | 0 (0.0%) |
| 1 or 2 Children | 13 (36.1%) | 18 (5.0%) |
| 3 or 4 Children | 0 (0.0%) | 0 (0.0%) |
| 5 or more Children | 0 (0.0%) | 0 (0.0%) |
| Total | 13 (10.8%) | 18 (3.4%) |
Income Below Poverty Among Married-Couple vs Single-Parent Households in Parkville
The poverty data for Parkville shows that 27 of the married-couple family households (1.9%) and 31 of the single-parent households (4.8%) are living below the poverty level. Within the married-couple family households, those with 1 or 2 children have the highest poverty rate, with 21 households (4.4%) falling below the poverty line. Among the single-parent households, those with 1 or 2 children have the highest poverty rate, with 31 household (7.9%) living below poverty.
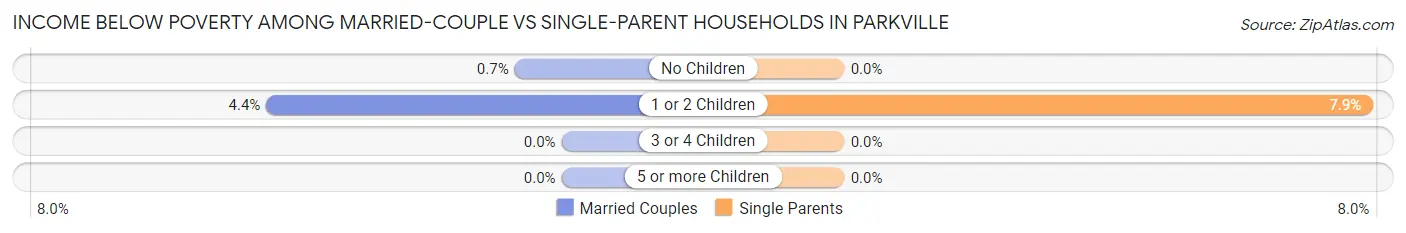
| Children | Married-Couple Families | Single-Parent Households |
| No Children | 6 (0.7%) | 0 (0.0%) |
| 1 or 2 Children | 21 (4.4%) | 31 (7.9%) |
| 3 or 4 Children | 0 (0.0%) | 0 (0.0%) |
| 5 or more Children | 0 (0.0%) | 0 (0.0%) |
| Total | 27 (1.9%) | 31 (4.8%) |
Race in Parkville
The most populous races in Parkville are White / Caucasian (7,205 | 87.6%), Hispanic or Latino (922 | 11.2%), and Two or more Races (837 | 10.2%).
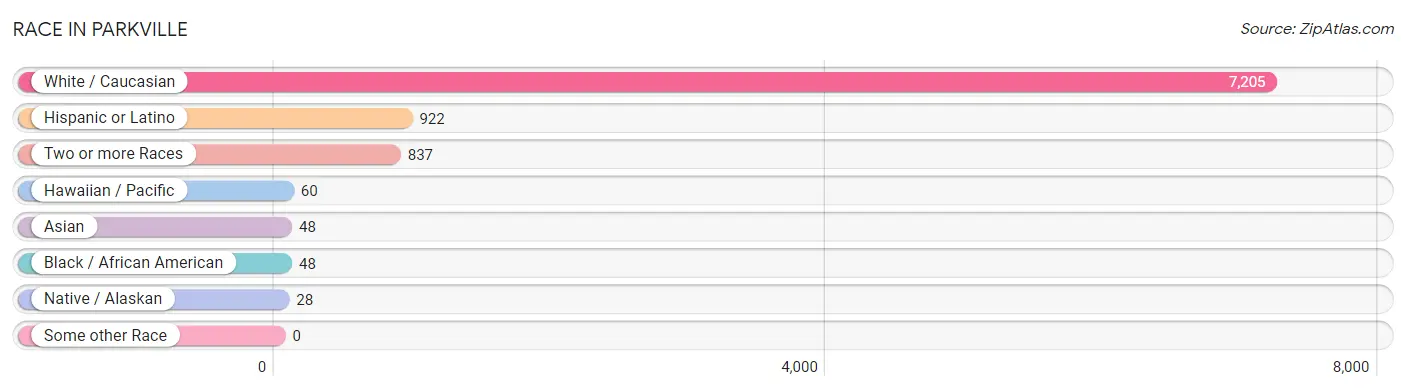
| Race | # Population | % Population |
| Asian | 48 | 0.6% |
| Black / African American | 48 | 0.6% |
| Hawaiian / Pacific | 60 | 0.7% |
| Hispanic or Latino | 922 | 11.2% |
| Native / Alaskan | 28 | 0.3% |
| White / Caucasian | 7,205 | 87.6% |
| Two or more Races | 837 | 10.2% |
| Some other Race | 0 | 0.0% |
| Total | 8,226 | 100.0% |
Ancestry in Parkville
The most populous ancestries reported in Parkville are German (2,659 | 32.3%), Irish (1,075 | 13.1%), English (988 | 12.0%), American (847 | 10.3%), and Italian (471 | 5.7%), together accounting for 73.4% of all Parkville residents.
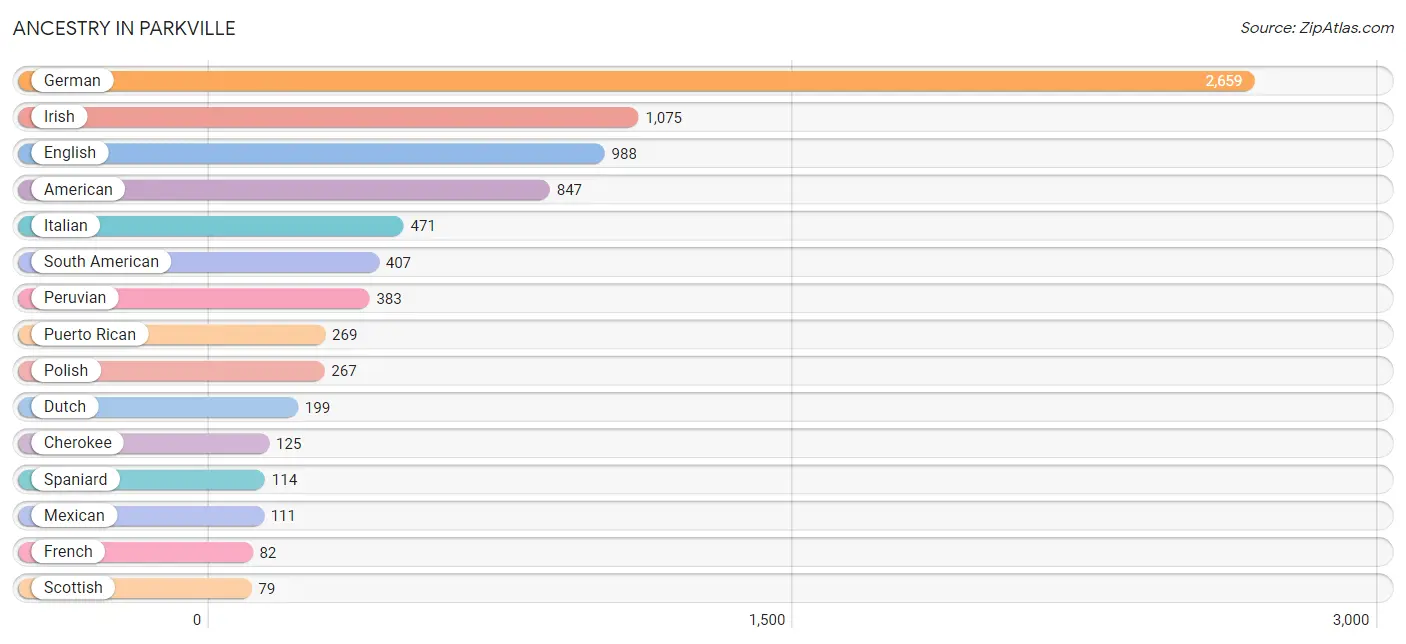
| Ancestry | # Population | % Population |
| American | 847 | 10.3% |
| Arab | 40 | 0.5% |
| British | 16 | 0.2% |
| Burmese | 10 | 0.1% |
| Cherokee | 125 | 1.5% |
| Dominican | 21 | 0.3% |
| Dutch | 199 | 2.4% |
| English | 988 | 12.0% |
| European | 18 | 0.2% |
| Fijian | 60 | 0.7% |
| French | 82 | 1.0% |
| French Canadian | 47 | 0.6% |
| German | 2,659 | 32.3% |
| Greek | 30 | 0.4% |
| Hungarian | 23 | 0.3% |
| Indian (Asian) | 48 | 0.6% |
| Irish | 1,075 | 13.1% |
| Iroquois | 1 | 0.0% |
| Italian | 471 | 5.7% |
| Lebanese | 40 | 0.5% |
| Lithuanian | 46 | 0.6% |
| Mexican | 111 | 1.3% |
| Norwegian | 14 | 0.2% |
| Peruvian | 383 | 4.7% |
| Polish | 267 | 3.3% |
| Portuguese | 34 | 0.4% |
| Puerto Rican | 269 | 3.3% |
| Scandinavian | 19 | 0.2% |
| Scotch-Irish | 69 | 0.8% |
| Scottish | 79 | 1.0% |
| South American | 407 | 5.0% |
| Spaniard | 114 | 1.4% |
| Swedish | 46 | 0.6% |
| Swiss | 47 | 0.6% |
| Thai | 28 | 0.3% |
| Uruguayan | 24 | 0.3% | View All 36 Rows |
Immigrants in Parkville
The most numerous immigrant groups reported in Parkville came from Latin America (234 | 2.8%), Peru (213 | 2.6%), South America (213 | 2.6%), Eastern Europe (56 | 0.7%), and Europe (56 | 0.7%), together accounting for 9.4% of all Parkville residents.
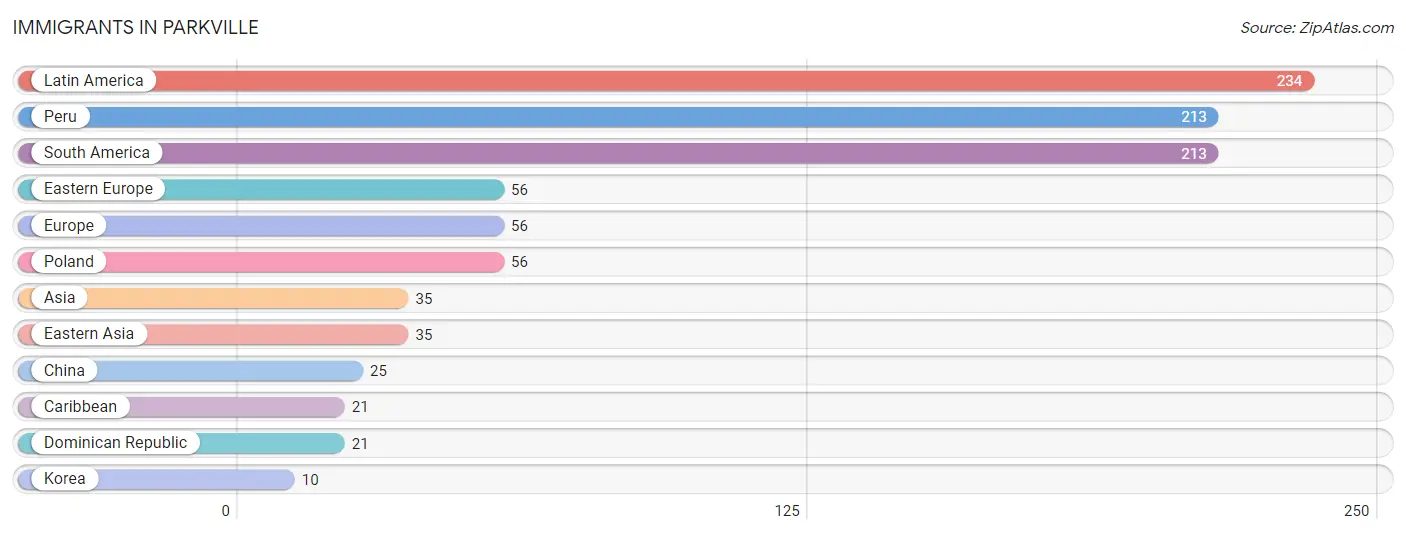
| Immigration Origin | # Population | % Population |
| Asia | 35 | 0.4% |
| Caribbean | 21 | 0.3% |
| China | 25 | 0.3% |
| Dominican Republic | 21 | 0.3% |
| Eastern Asia | 35 | 0.4% |
| Eastern Europe | 56 | 0.7% |
| Europe | 56 | 0.7% |
| Korea | 10 | 0.1% |
| Latin America | 234 | 2.8% |
| Peru | 213 | 2.6% |
| Poland | 56 | 0.7% |
| South America | 213 | 2.6% | View All 12 Rows |
Sex and Age in Parkville
Sex and Age in Parkville
The most populous age groups in Parkville are 25 to 29 Years (532 | 12.2%) for men and 35 to 39 Years (323 | 8.4%) for women.
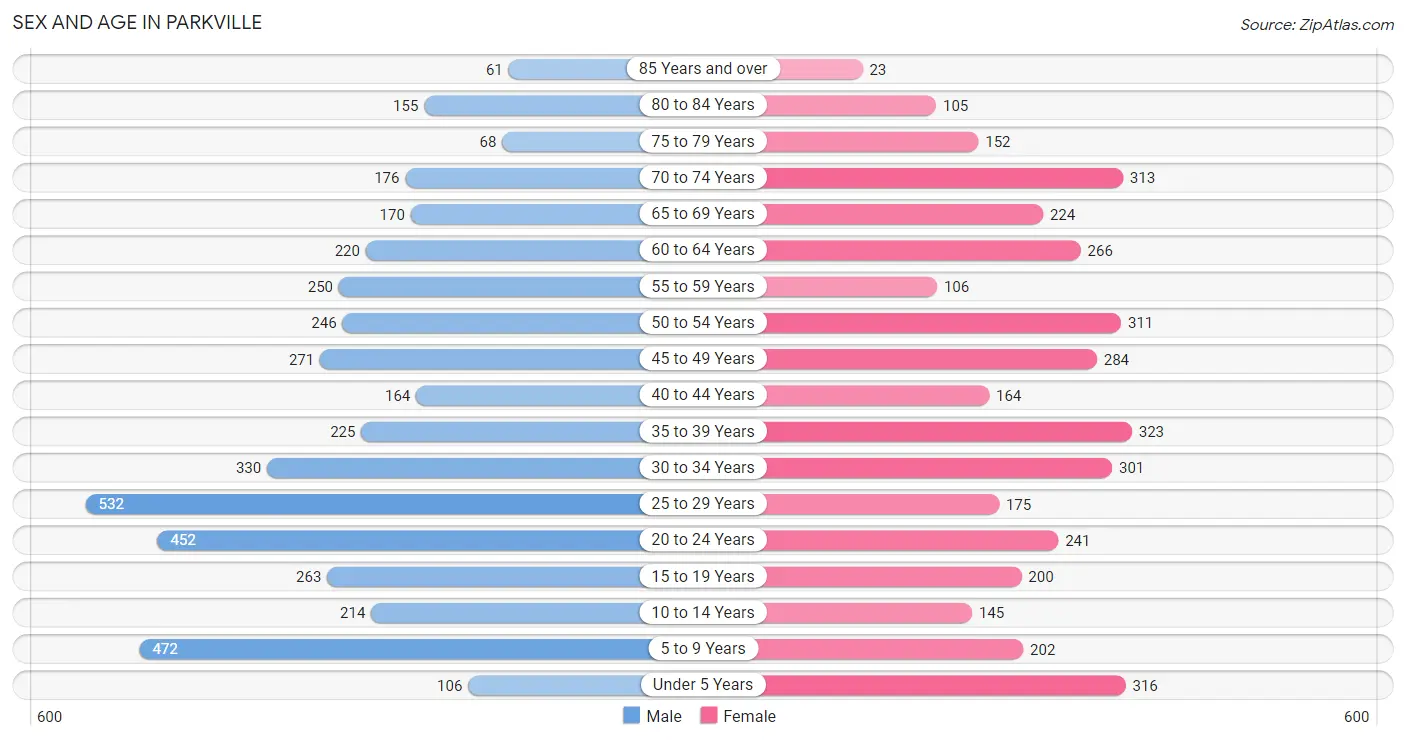
| Age Bracket | Male | Female |
| Under 5 Years | 106 (2.4%) | 316 (8.2%) |
| 5 to 9 Years | 472 (10.8%) | 202 (5.2%) |
| 10 to 14 Years | 214 (4.9%) | 145 (3.8%) |
| 15 to 19 Years | 263 (6.0%) | 200 (5.2%) |
| 20 to 24 Years | 452 (10.3%) | 241 (6.3%) |
| 25 to 29 Years | 532 (12.2%) | 175 (4.5%) |
| 30 to 34 Years | 330 (7.5%) | 301 (7.8%) |
| 35 to 39 Years | 225 (5.1%) | 323 (8.4%) |
| 40 to 44 Years | 164 (3.7%) | 164 (4.3%) |
| 45 to 49 Years | 271 (6.2%) | 284 (7.4%) |
| 50 to 54 Years | 246 (5.6%) | 311 (8.1%) |
| 55 to 59 Years | 250 (5.7%) | 106 (2.8%) |
| 60 to 64 Years | 220 (5.0%) | 266 (6.9%) |
| 65 to 69 Years | 170 (3.9%) | 224 (5.8%) |
| 70 to 74 Years | 176 (4.0%) | 313 (8.1%) |
| 75 to 79 Years | 68 (1.5%) | 152 (4.0%) |
| 80 to 84 Years | 155 (3.5%) | 105 (2.7%) |
| 85 Years and over | 61 (1.4%) | 23 (0.6%) |
| Total | 4,375 (100.0%) | 3,851 (100.0%) |
Families and Households in Parkville
Median Family Size in Parkville
The median family size in Parkville is 3.03 persons per family, with single female/mother families (532 | 25.4%) accounting for the largest median family size of 3.23 persons per family. On the other hand, single male/father families (120 | 5.7%) represent the smallest median family size with 2.36 persons per family.
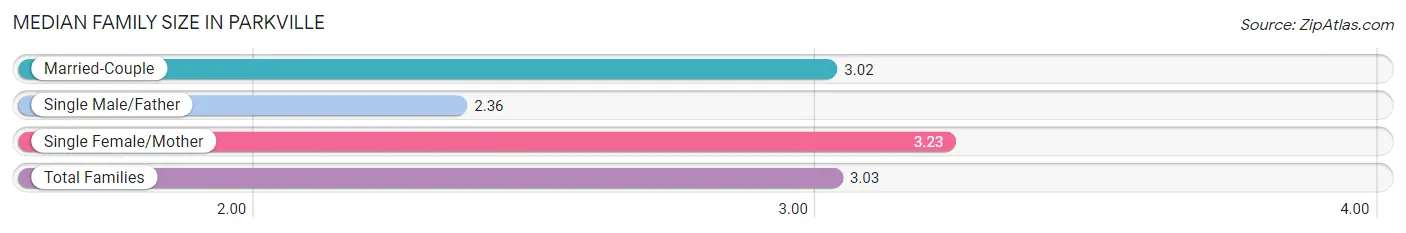
| Family Type | # Families | Family Size |
| Married-Couple | 1,443 (68.9%) | 3.02 |
| Single Male/Father | 120 (5.7%) | 2.36 |
| Single Female/Mother | 532 (25.4%) | 3.23 |
| Total Families | 2,095 (100.0%) | 3.03 |
Median Household Size in Parkville
The median household size in Parkville is 2.52 persons per household, with single female/mother households (532 | 16.4%) accounting for the largest median household size of 3.7 persons per household. non-family households (1,158 | 35.6%) represent the smallest median household size with 1.32 persons per household.
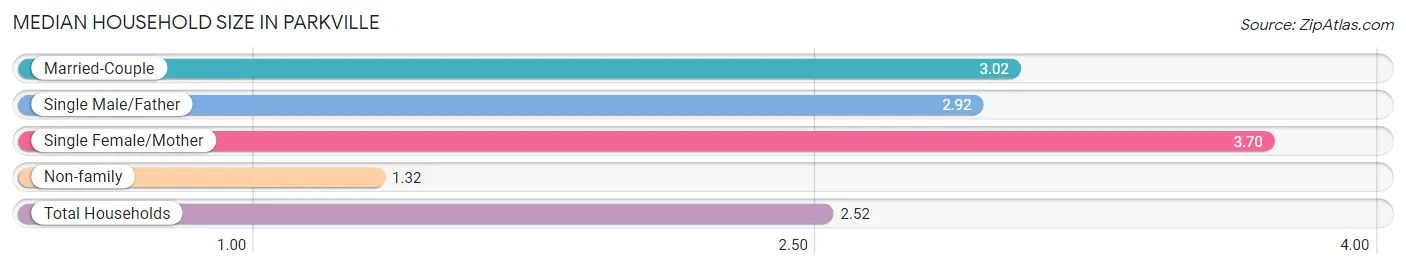
| Household Type | # Households | Household Size |
| Married-Couple | 1,443 (44.4%) | 3.02 |
| Single Male/Father | 120 (3.7%) | 2.92 |
| Single Female/Mother | 532 (16.4%) | 3.70 |
| Non-family | 1,158 (35.6%) | 1.32 |
| Total Households | 3,253 (100.0%) | 2.52 |
Household Size by Marriage Status in Parkville
Out of a total of 3,253 households in Parkville, 2,095 (64.4%) are family households, while 1,158 (35.6%) are nonfamily households. The most numerous type of family households are 2-person households, comprising 722, and the most common type of nonfamily households are 1-person households, comprising 803.
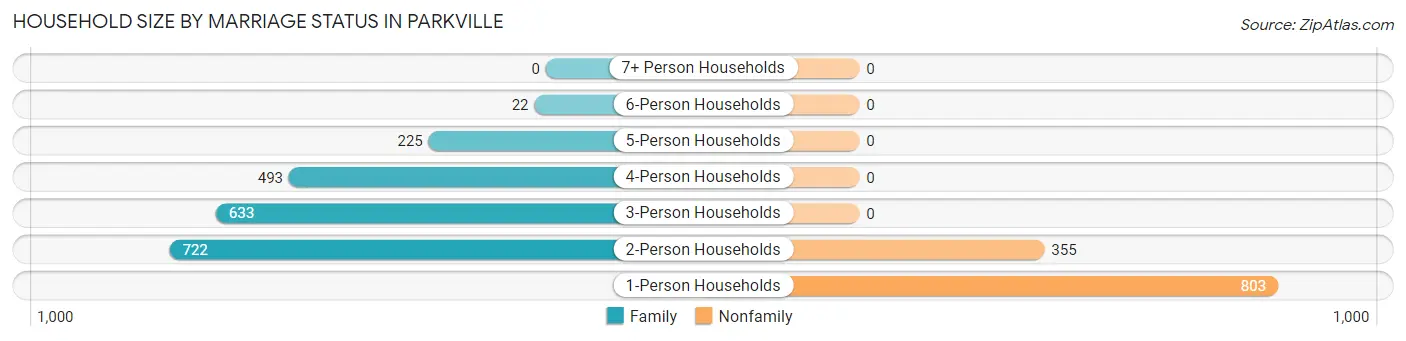
| Household Size | Family Households | Nonfamily Households |
| 1-Person Households | - | 803 (24.7%) |
| 2-Person Households | 722 (22.2%) | 355 (10.9%) |
| 3-Person Households | 633 (19.5%) | 0 (0.0%) |
| 4-Person Households | 493 (15.2%) | 0 (0.0%) |
| 5-Person Households | 225 (6.9%) | 0 (0.0%) |
| 6-Person Households | 22 (0.7%) | 0 (0.0%) |
| 7+ Person Households | 0 (0.0%) | 0 (0.0%) |
| Total | 2,095 (64.4%) | 1,158 (35.6%) |
Female Fertility in Parkville
Fertility by Age in Parkville
Average fertility rate in Parkville is 37.0 births per 1,000 women. Women in the age bracket of 20 to 34 years have the highest fertility rate with 89.0 births per 1,000 women. Women in the age bracket of 20 to 34 years acount for 100.0% of all women with births.
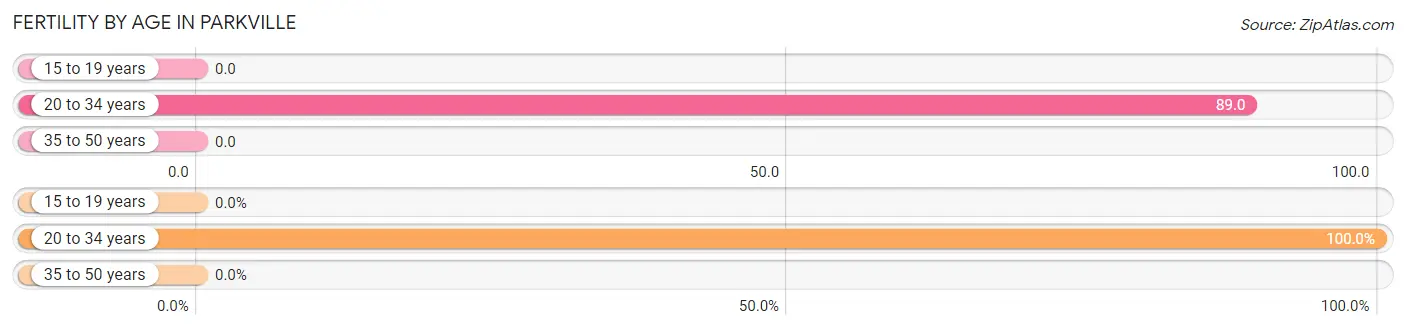
| Age Bracket | Women with Births | Births / 1,000 Women |
| 15 to 19 years | 0 (0.0%) | 0.0 |
| 20 to 34 years | 64 (100.0%) | 89.0 |
| 35 to 50 years | 0 (0.0%) | 0.0 |
| Total | 64 (100.0%) | 37.0 |
Fertility by Age by Marriage Status in Parkville
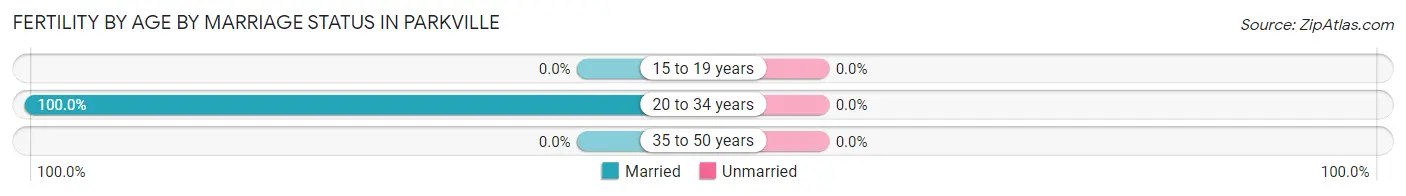
| Age Bracket | Married | Unmarried |
| 15 to 19 years | 0 (0.0%) | 0 (0.0%) |
| 20 to 34 years | 64 (100.0%) | 0 (0.0%) |
| 35 to 50 years | 0 (0.0%) | 0 (0.0%) |
| Total | 64 (100.0%) | 0 (0.0%) |
Fertility by Education in Parkville
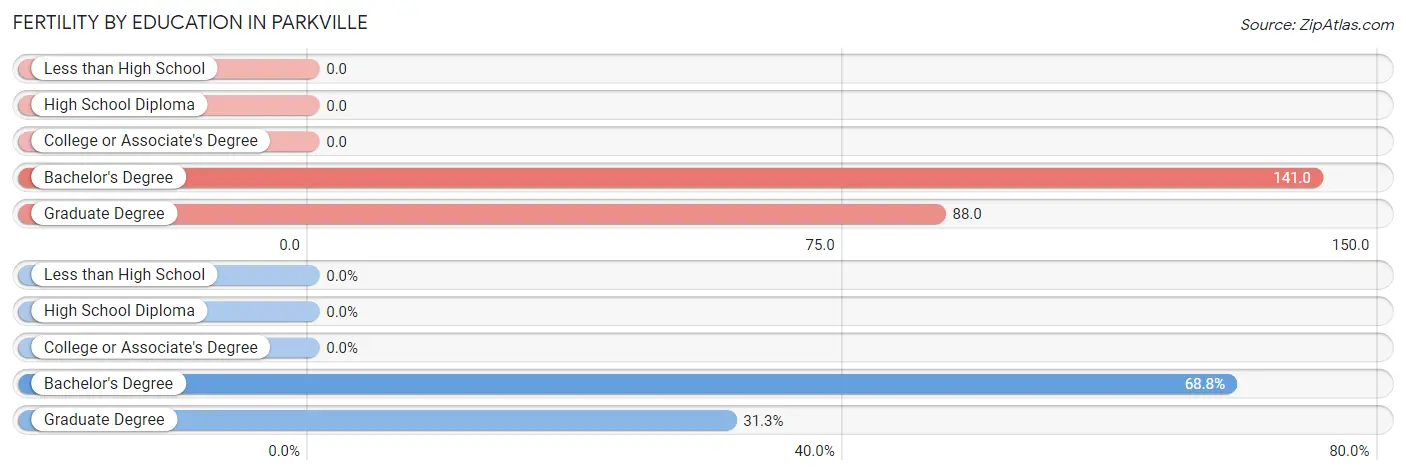
| Educational Attainment | Women with Births | Births / 1,000 Women |
| Less than High School | 0 (0.0%) | 0.0 |
| High School Diploma | 0 (0.0%) | 0.0 |
| College or Associate's Degree | 0 (0.0%) | 0.0 |
| Bachelor's Degree | 44 (68.8%) | 141.0 |
| Graduate Degree | 20 (31.2%) | 88.0 |
| Total | 64 (100.0%) | 37.0 |
Fertility by Education by Marriage Status in Parkville
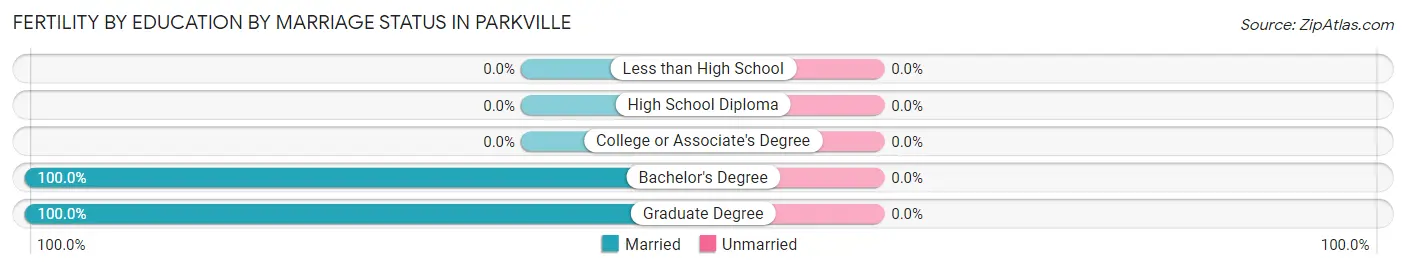
| Educational Attainment | Married | Unmarried |
| Less than High School | 0 (0.0%) | 0 (0.0%) |
| High School Diploma | 0 (0.0%) | 0 (0.0%) |
| College or Associate's Degree | 0 (0.0%) | 0 (0.0%) |
| Bachelor's Degree | 44 (100.0%) | 0 (0.0%) |
| Graduate Degree | 20 (100.0%) | 0 (0.0%) |
| Total | 64 (100.0%) | 0 (0.0%) |
Employment Characteristics in Parkville
Employment by Class of Employer in Parkville
Among the 4,303 employed individuals in Parkville, private company employees (2,957 | 68.7%), not-for-profit organizations (561 | 13.0%), and federal government employees (361 | 8.4%) make up the most common classes of employment.
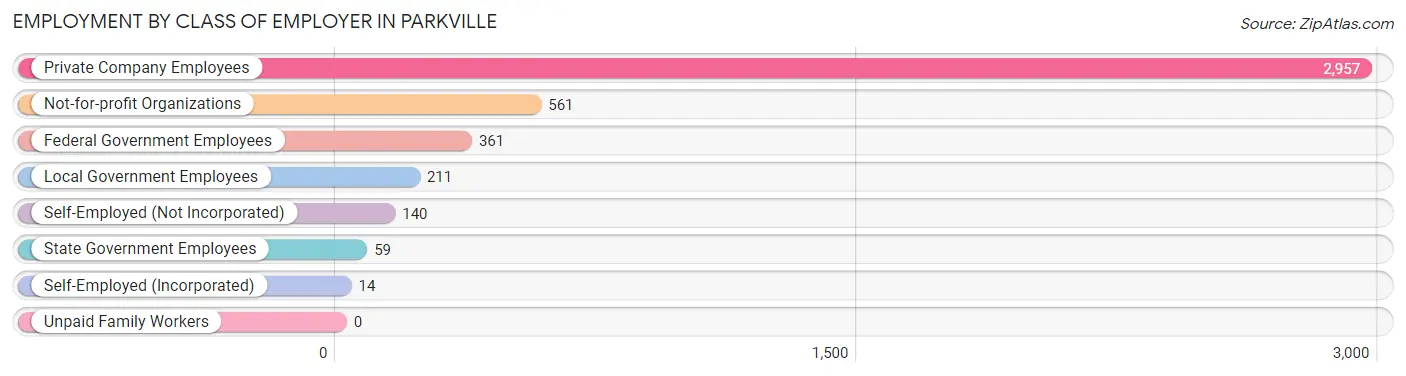
| Employer Class | # Employees | % Employees |
| Private Company Employees | 2,957 | 68.7% |
| Self-Employed (Incorporated) | 14 | 0.3% |
| Self-Employed (Not Incorporated) | 140 | 3.3% |
| Not-for-profit Organizations | 561 | 13.0% |
| Local Government Employees | 211 | 4.9% |
| State Government Employees | 59 | 1.4% |
| Federal Government Employees | 361 | 8.4% |
| Unpaid Family Workers | 0 | 0.0% |
| Total | 4,303 | 100.0% |
Employment Status by Age in Parkville
According to the labor force statistics for Parkville, out of the total population over 16 years of age (6,650), 67.6% or 4,495 individuals are in the labor force, with 3.7% or 166 of them unemployed. The age group with the highest labor force participation rate is 30 to 34 years, with 94.6% or 597 individuals in the labor force. Within the labor force, the 16 to 19 years age range has the highest percentage of unemployed individuals, with 29.7% or 30 of them being unemployed.
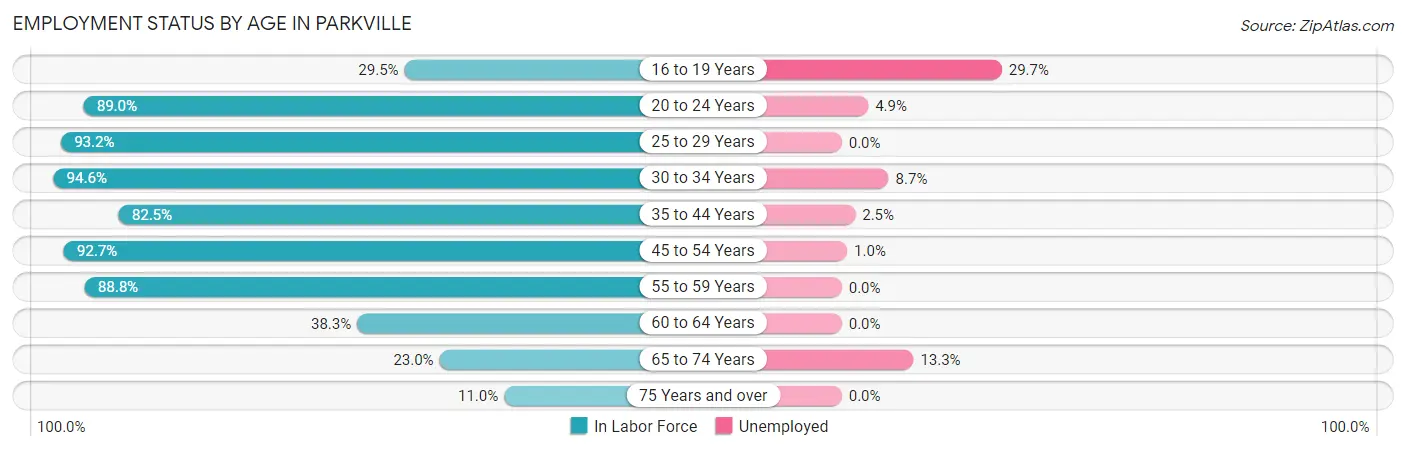
| Age Bracket | In Labor Force | Unemployed |
| 16 to 19 Years | 101 (29.5%) | 30 (29.7%) |
| 20 to 24 Years | 617 (89.0%) | 30 (4.9%) |
| 25 to 29 Years | 659 (93.2%) | 0 (0.0%) |
| 30 to 34 Years | 597 (94.6%) | 52 (8.7%) |
| 35 to 44 Years | 723 (82.5%) | 18 (2.5%) |
| 45 to 54 Years | 1,031 (92.7%) | 10 (1.0%) |
| 55 to 59 Years | 316 (88.8%) | 0 (0.0%) |
| 60 to 64 Years | 186 (38.3%) | 0 (0.0%) |
| 65 to 74 Years | 203 (23.0%) | 27 (13.3%) |
| 75 Years and over | 62 (11.0%) | 0 (0.0%) |
| Total | 4,495 (67.6%) | 166 (3.7%) |
Employment Status by Educational Attainment in Parkville
According to labor force statistics for Parkville, 84.3% of individuals (3,514) out of the total population between 25 and 64 years of age (4,168) are in the labor force, with 2.3% or 81 of them being unemployed. The group with the highest labor force participation rate are those with the educational attainment of high school diploma, with 86.5% or 1,611 individuals in the labor force. Within the labor force, individuals with less than high school education have the highest percentage of unemployment, with 19.9% or 32 of them being unemployed.
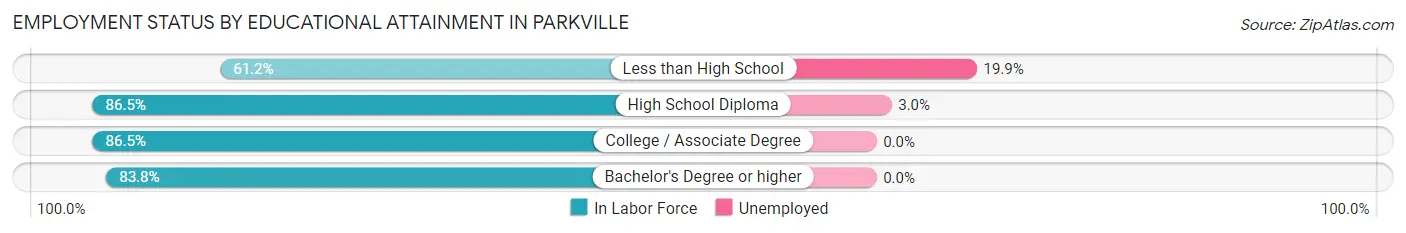
| Educational Attainment | In Labor Force | Unemployed |
| Less than High School | 161 (61.2%) | 52 (19.9%) |
| High School Diploma | 1,611 (86.5%) | 56 (3.0%) |
| College / Associate Degree | 910 (86.5%) | 0 (0.0%) |
| Bachelor's Degree or higher | 830 (83.8%) | 0 (0.0%) |
| Total | 3,514 (84.3%) | 96 (2.3%) |
Employment Occupations by Sex in Parkville
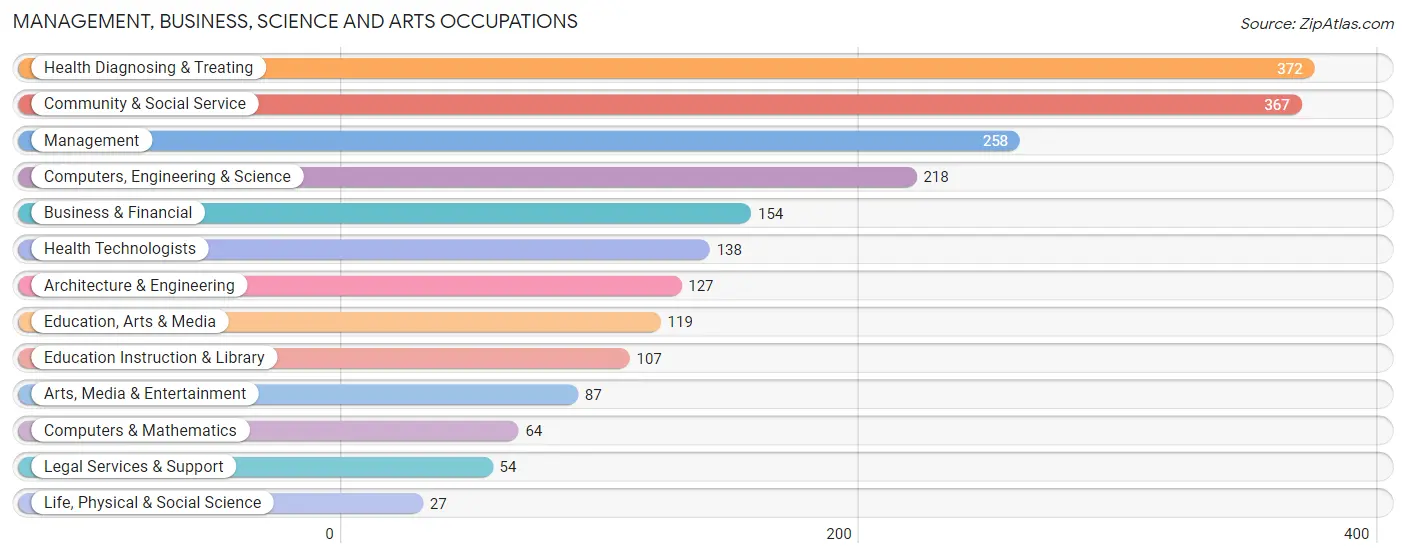
Management, Business, Science and Arts Occupations
The most common Management, Business, Science and Arts occupations in Parkville are Health Diagnosing & Treating (372 | 8.6%), Community & Social Service (367 | 8.5%), Management (258 | 6.0%), Computers, Engineering & Science (218 | 5.0%), and Business & Financial (154 | 3.6%).
Management, Business, Science and Arts Occupations by Sex
Within the Management, Business, Science and Arts occupations in Parkville, the most male-oriented occupations are Computers & Mathematics (100.0%), Life, Physical & Social Science (100.0%), and Management (91.1%), while the most female-oriented occupations are Legal Services & Support (100.0%), Education Instruction & Library (90.6%), and Health Technologists (74.6%).
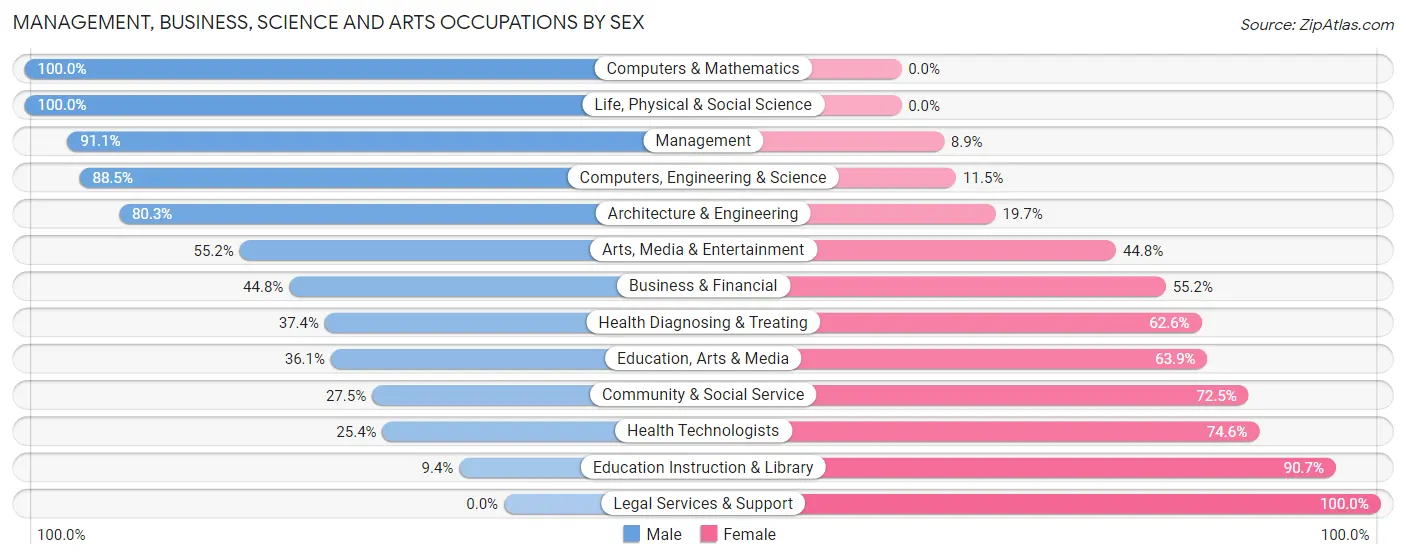
| Occupation | Male | Female |
| Management | 235 (91.1%) | 23 (8.9%) |
| Business & Financial | 69 (44.8%) | 85 (55.2%) |
| Computers, Engineering & Science | 193 (88.5%) | 25 (11.5%) |
| Computers & Mathematics | 64 (100.0%) | 0 (0.0%) |
| Architecture & Engineering | 102 (80.3%) | 25 (19.7%) |
| Life, Physical & Social Science | 27 (100.0%) | 0 (0.0%) |
| Community & Social Service | 101 (27.5%) | 266 (72.5%) |
| Education, Arts & Media | 43 (36.1%) | 76 (63.9%) |
| Legal Services & Support | 0 (0.0%) | 54 (100.0%) |
| Education Instruction & Library | 10 (9.3%) | 97 (90.6%) |
| Arts, Media & Entertainment | 48 (55.2%) | 39 (44.8%) |
| Health Diagnosing & Treating | 139 (37.4%) | 233 (62.6%) |
| Health Technologists | 35 (25.4%) | 103 (74.6%) |
| Total (Category) | 737 (53.8%) | 632 (46.2%) |
| Total (Overall) | 2,472 (57.1%) | 1,856 (42.9%) |
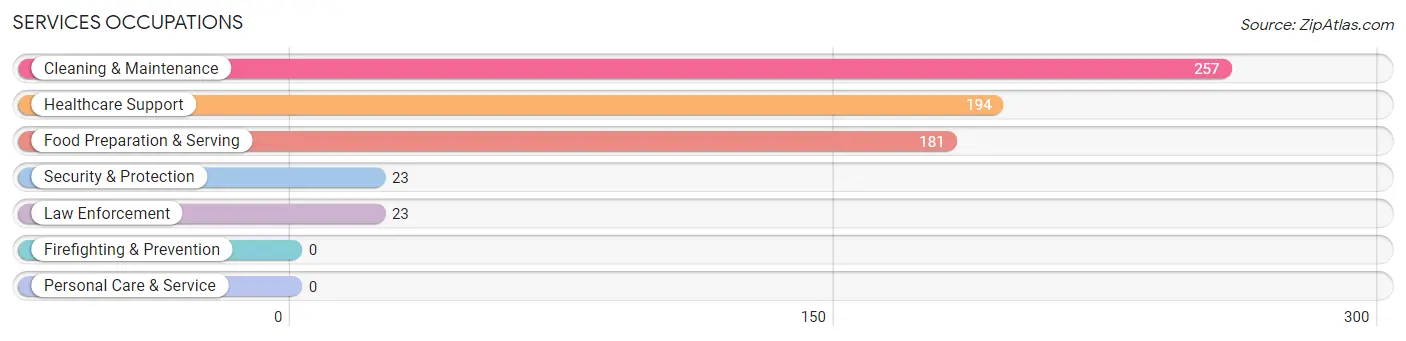
Services Occupations
The most common Services occupations in Parkville are Cleaning & Maintenance (257 | 5.9%), Healthcare Support (194 | 4.5%), Food Preparation & Serving (181 | 4.2%), Security & Protection (23 | 0.5%), and Law Enforcement (23 | 0.5%).
Services Occupations by Sex
Within the Services occupations in Parkville, the most male-oriented occupations are Security & Protection (100.0%), Law Enforcement (100.0%), and Cleaning & Maintenance (82.1%), while the most female-oriented occupations are Healthcare Support (81.4%), Food Preparation & Serving (65.2%), and Cleaning & Maintenance (17.9%).
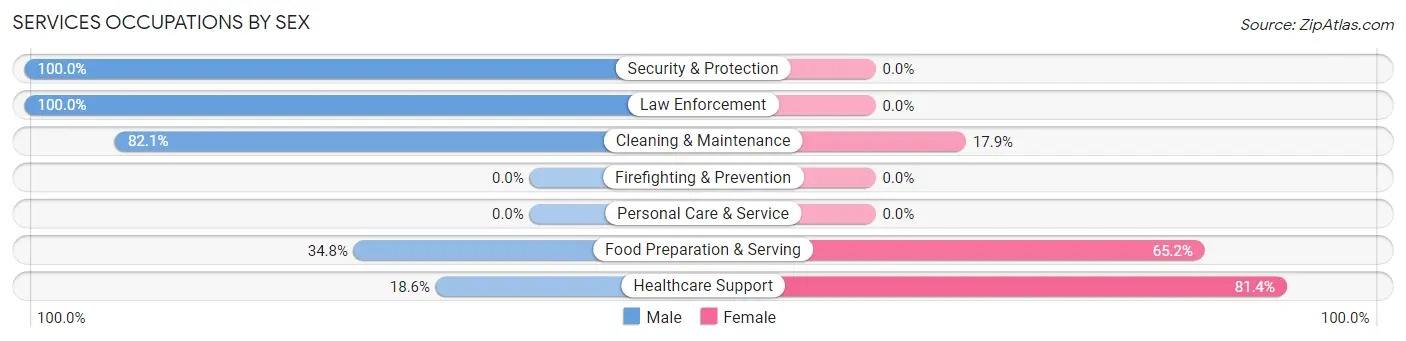
| Occupation | Male | Female |
| Healthcare Support | 36 (18.6%) | 158 (81.4%) |
| Security & Protection | 23 (100.0%) | 0 (0.0%) |
| Firefighting & Prevention | 0 (0.0%) | 0 (0.0%) |
| Law Enforcement | 23 (100.0%) | 0 (0.0%) |
| Food Preparation & Serving | 63 (34.8%) | 118 (65.2%) |
| Cleaning & Maintenance | 211 (82.1%) | 46 (17.9%) |
| Personal Care & Service | 0 (0.0%) | 0 (0.0%) |
| Total (Category) | 333 (50.8%) | 322 (49.2%) |
| Total (Overall) | 2,472 (57.1%) | 1,856 (42.9%) |
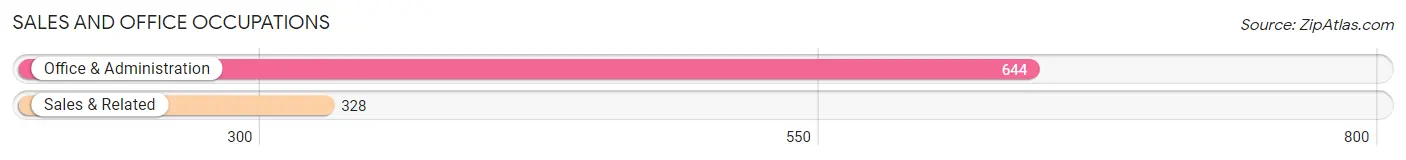
Sales and Office Occupations
The most common Sales and Office occupations in Parkville are Office & Administration (644 | 14.9%), and Sales & Related (328 | 7.6%).
Sales and Office Occupations by Sex
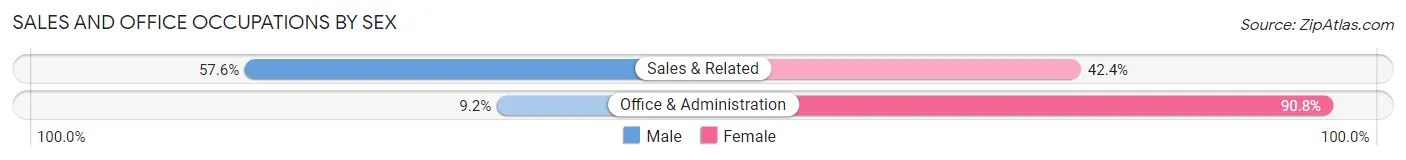
| Occupation | Male | Female |
| Sales & Related | 189 (57.6%) | 139 (42.4%) |
| Office & Administration | 59 (9.2%) | 585 (90.8%) |
| Total (Category) | 248 (25.5%) | 724 (74.5%) |
| Total (Overall) | 2,472 (57.1%) | 1,856 (42.9%) |
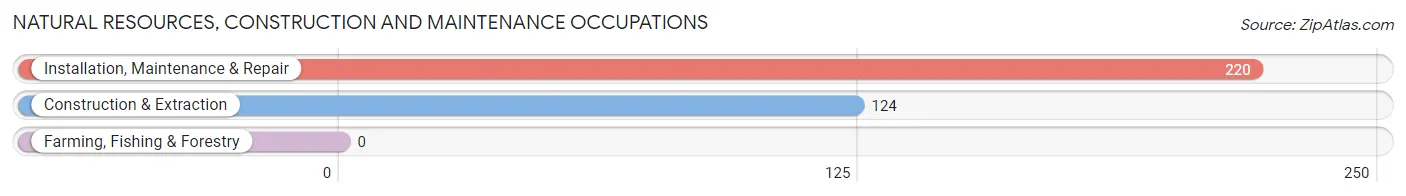
Natural Resources, Construction and Maintenance Occupations
The most common Natural Resources, Construction and Maintenance occupations in Parkville are Installation, Maintenance & Repair (220 | 5.1%), and Construction & Extraction (124 | 2.9%).
Natural Resources, Construction and Maintenance Occupations by Sex
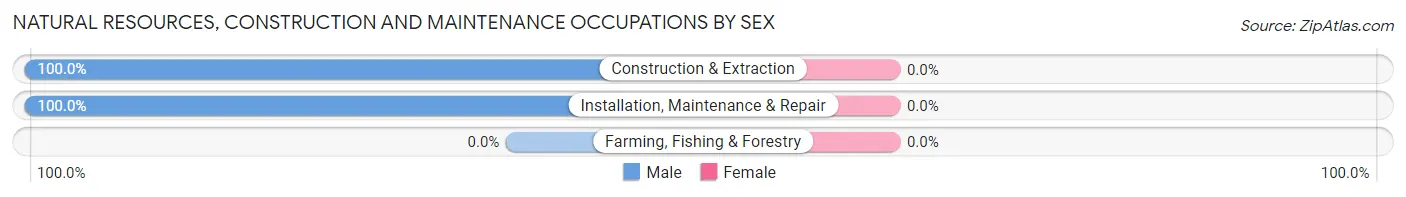
| Occupation | Male | Female |
| Farming, Fishing & Forestry | 0 (0.0%) | 0 (0.0%) |
| Construction & Extraction | 124 (100.0%) | 0 (0.0%) |
| Installation, Maintenance & Repair | 220 (100.0%) | 0 (0.0%) |
| Total (Category) | 344 (100.0%) | 0 (0.0%) |
| Total (Overall) | 2,472 (57.1%) | 1,856 (42.9%) |
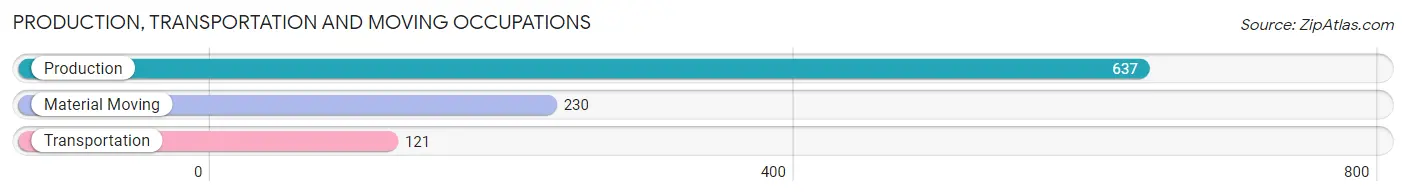
Production, Transportation and Moving Occupations
The most common Production, Transportation and Moving occupations in Parkville are Production (637 | 14.7%), Material Moving (230 | 5.3%), and Transportation (121 | 2.8%).
Production, Transportation and Moving Occupations by Sex
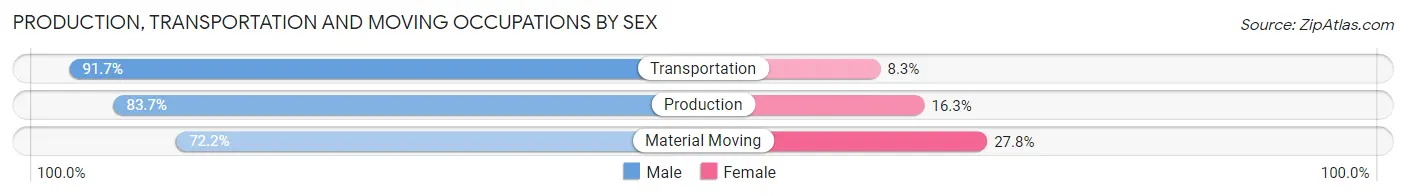
| Occupation | Male | Female |
| Production | 533 (83.7%) | 104 (16.3%) |
| Transportation | 111 (91.7%) | 10 (8.3%) |
| Material Moving | 166 (72.2%) | 64 (27.8%) |
| Total (Category) | 810 (82.0%) | 178 (18.0%) |
| Total (Overall) | 2,472 (57.1%) | 1,856 (42.9%) |
Employment Industries by Sex in Parkville
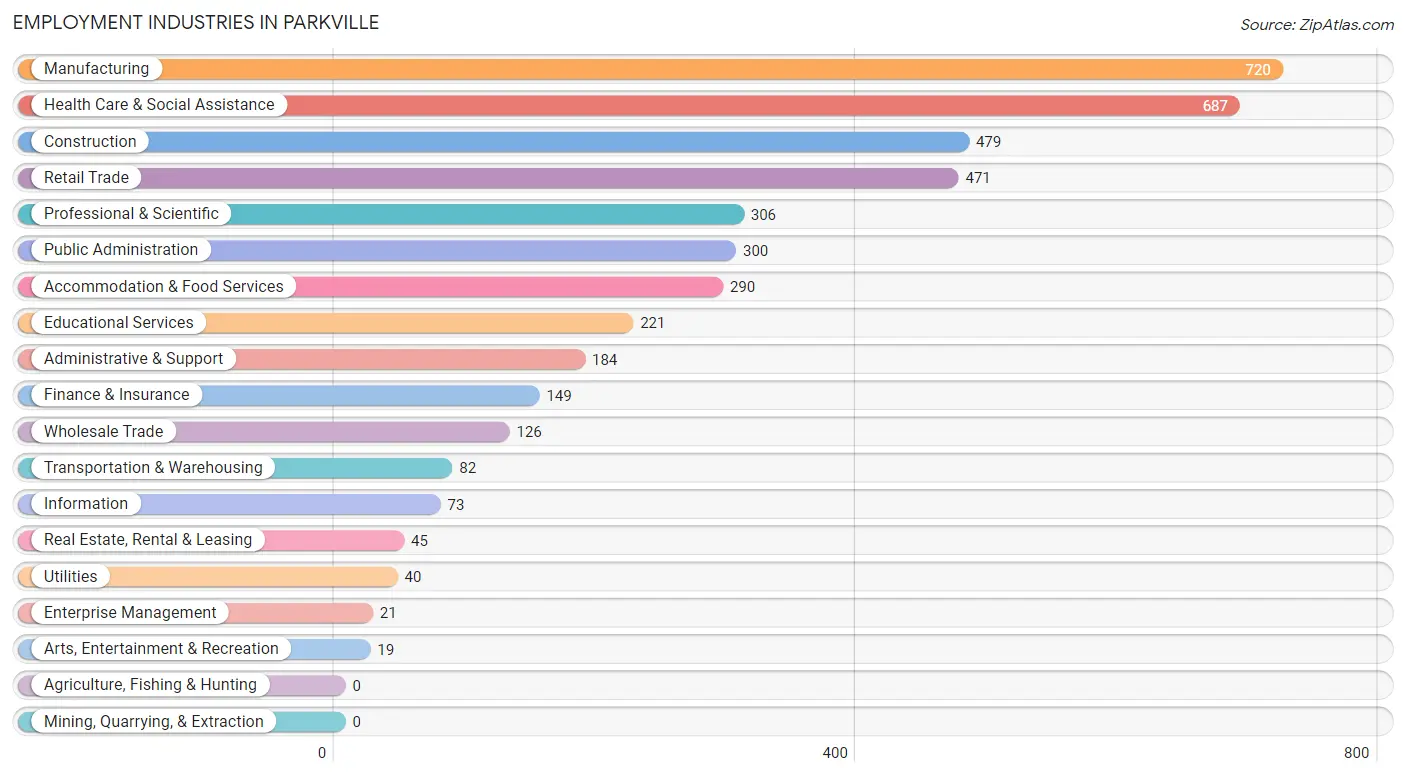
Employment Industries in Parkville
The major employment industries in Parkville include Manufacturing (720 | 16.6%), Health Care & Social Assistance (687 | 15.9%), Construction (479 | 11.1%), Retail Trade (471 | 10.9%), and Professional & Scientific (306 | 7.1%).
Employment Industries by Sex in Parkville
The Parkville industries that see more men than women are Construction (100.0%), Enterprise Management (100.0%), and Arts, Entertainment & Recreation (100.0%), whereas the industries that tend to have a higher number of women are Educational Services (91.4%), Finance & Insurance (85.9%), and Health Care & Social Assistance (71.9%).
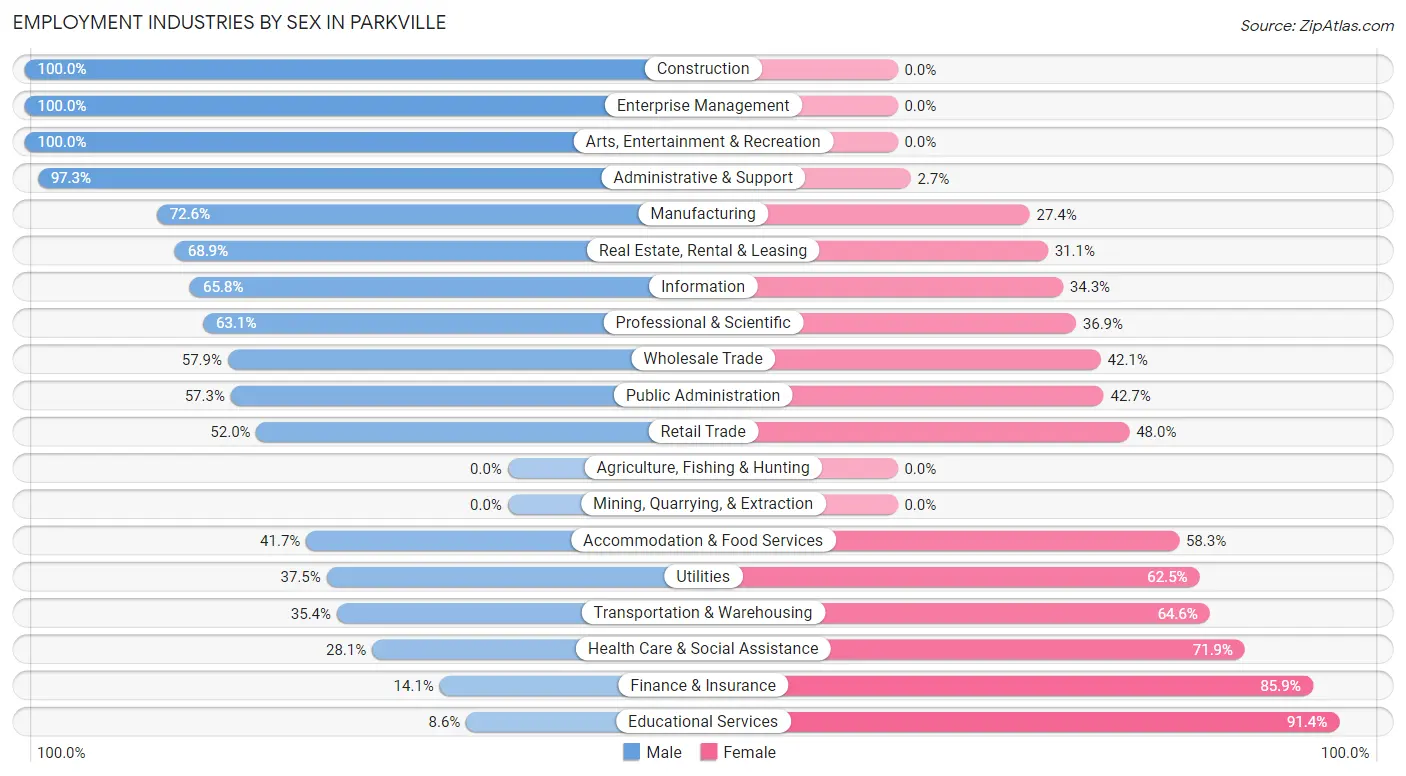
| Industry | Male | Female |
| Agriculture, Fishing & Hunting | 0 (0.0%) | 0 (0.0%) |
| Mining, Quarrying, & Extraction | 0 (0.0%) | 0 (0.0%) |
| Construction | 479 (100.0%) | 0 (0.0%) |
| Manufacturing | 523 (72.6%) | 197 (27.4%) |
| Wholesale Trade | 73 (57.9%) | 53 (42.1%) |
| Retail Trade | 245 (52.0%) | 226 (48.0%) |
| Transportation & Warehousing | 29 (35.4%) | 53 (64.6%) |
| Utilities | 15 (37.5%) | 25 (62.5%) |
| Information | 48 (65.7%) | 25 (34.3%) |
| Finance & Insurance | 21 (14.1%) | 128 (85.9%) |
| Real Estate, Rental & Leasing | 31 (68.9%) | 14 (31.1%) |
| Professional & Scientific | 193 (63.1%) | 113 (36.9%) |
| Enterprise Management | 21 (100.0%) | 0 (0.0%) |
| Administrative & Support | 179 (97.3%) | 5 (2.7%) |
| Educational Services | 19 (8.6%) | 202 (91.4%) |
| Health Care & Social Assistance | 193 (28.1%) | 494 (71.9%) |
| Arts, Entertainment & Recreation | 19 (100.0%) | 0 (0.0%) |
| Accommodation & Food Services | 121 (41.7%) | 169 (58.3%) |
| Public Administration | 172 (57.3%) | 128 (42.7%) |
| Total | 2,472 (57.1%) | 1,856 (42.9%) |
Education in Parkville
School Enrollment in Parkville
The most common levels of schooling among the 1,677 students in Parkville are elementary school (481 | 28.7%), high school (372 | 22.2%), and college / undergraduate (337 | 20.1%).
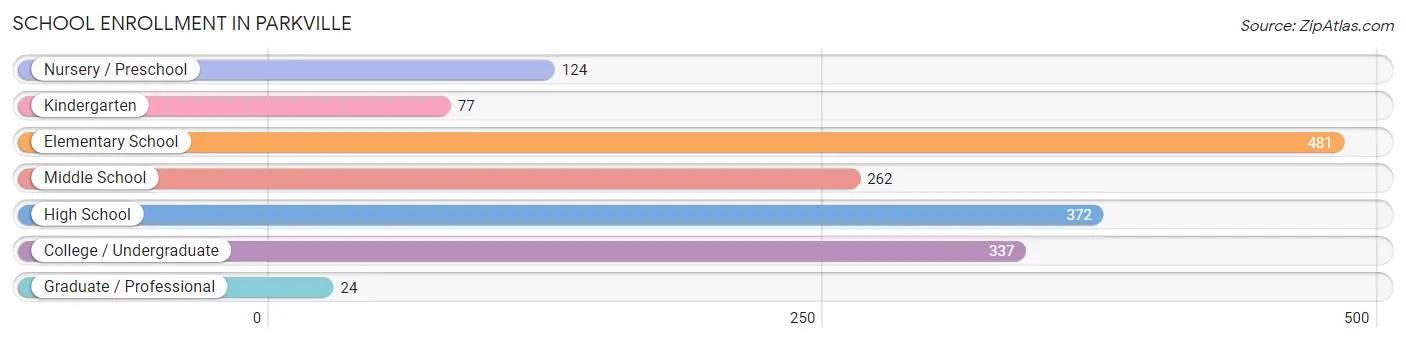
| School Level | # Students | % Students |
| Nursery / Preschool | 124 | 7.4% |
| Kindergarten | 77 | 4.6% |
| Elementary School | 481 | 28.7% |
| Middle School | 262 | 15.6% |
| High School | 372 | 22.2% |
| College / Undergraduate | 337 | 20.1% |
| Graduate / Professional | 24 | 1.4% |
| Total | 1,677 | 100.0% |
School Enrollment by Age by Funding Source in Parkville
Out of a total of 1,677 students who are enrolled in schools in Parkville, 387 (23.1%) attend a private institution, while the remaining 1,290 (76.9%) are enrolled in public schools. The age group of 3 to 4 year olds has the highest likelihood of being enrolled in private schools, with 78 (83.0% in the age bracket) enrolled. Conversely, the age group of 10 to 14 year olds has the lowest likelihood of being enrolled in a private school, with 359 (100.0% in the age bracket) attending a public institution.
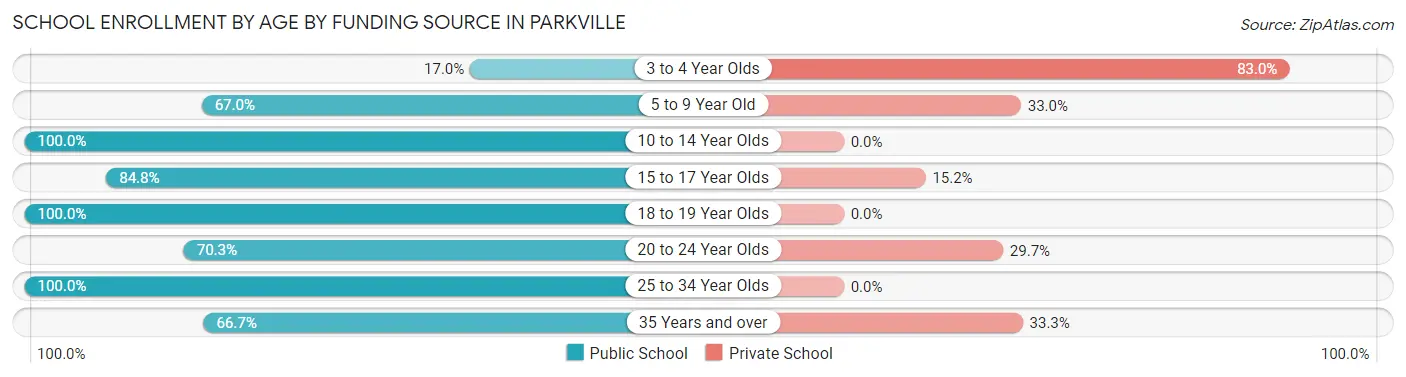
| Age Bracket | Public School | Private School |
| 3 to 4 Year Olds | 16 (17.0%) | 78 (83.0%) |
| 5 to 9 Year Old | 329 (67.0%) | 162 (33.0%) |
| 10 to 14 Year Olds | 359 (100.0%) | 0 (0.0%) |
| 15 to 17 Year Olds | 295 (84.8%) | 53 (15.2%) |
| 18 to 19 Year Olds | 40 (100.0%) | 0 (0.0%) |
| 20 to 24 Year Olds | 166 (70.3%) | 70 (29.7%) |
| 25 to 34 Year Olds | 37 (100.0%) | 0 (0.0%) |
| 35 Years and over | 48 (66.7%) | 24 (33.3%) |
| Total | 1,290 (76.9%) | 387 (23.1%) |
Educational Attainment by Field of Study in Parkville
Arts & humanities (242 | 18.7%), science & technology (218 | 16.9%), computers & mathematics (120 | 9.3%), psychology (119 | 9.2%), and education (119 | 9.2%) are the most common fields of study among 1,294 individuals in Parkville who have obtained a bachelor's degree or higher.
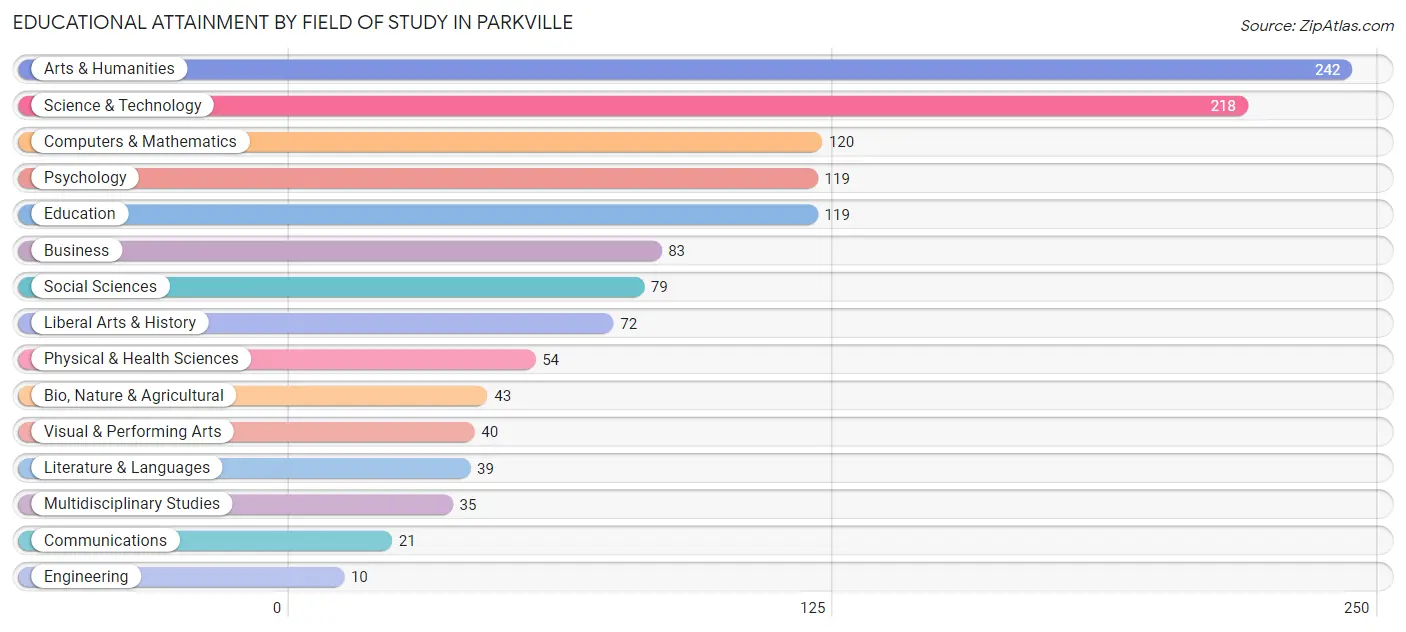
| Field of Study | # Graduates | % Graduates |
| Computers & Mathematics | 120 | 9.3% |
| Bio, Nature & Agricultural | 43 | 3.3% |
| Physical & Health Sciences | 54 | 4.2% |
| Psychology | 119 | 9.2% |
| Social Sciences | 79 | 6.1% |
| Engineering | 10 | 0.8% |
| Multidisciplinary Studies | 35 | 2.7% |
| Science & Technology | 218 | 16.9% |
| Business | 83 | 6.4% |
| Education | 119 | 9.2% |
| Literature & Languages | 39 | 3.0% |
| Liberal Arts & History | 72 | 5.6% |
| Visual & Performing Arts | 40 | 3.1% |
| Communications | 21 | 1.6% |
| Arts & Humanities | 242 | 18.7% |
| Total | 1,294 | 100.0% |
Transportation & Commute in Parkville
Vehicle Availability by Sex in Parkville
The most prevalent vehicle ownership categories in Parkville are males with 2 vehicles (943, accounting for 38.2%) and females with 2 vehicles (628, making up 51.5%).
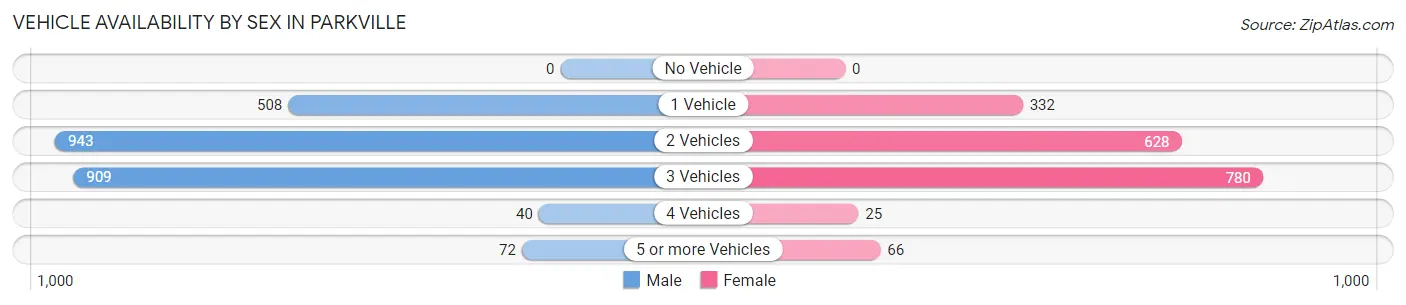
| Vehicles Available | Male | Female |
| No Vehicle | 0 (0.0%) | 0 (0.0%) |
| 1 Vehicle | 508 (20.5%) | 332 (18.1%) |
| 2 Vehicles | 943 (38.2%) | 628 (34.3%) |
| 3 Vehicles | 909 (36.8%) | 780 (42.6%) |
| 4 Vehicles | 40 (1.6%) | 25 (1.4%) |
| 5 or more Vehicles | 72 (2.9%) | 66 (3.6%) |
| Total | 2,472 (100.0%) | 1,831 (100.0%) |
Commute Time in Parkville
The most frequently occuring commute durations in Parkville are 10 to 14 minutes (669 commuters, 16.8%), 15 to 19 minutes (566 commuters, 14.2%), and 20 to 24 minutes (536 commuters, 13.5%).
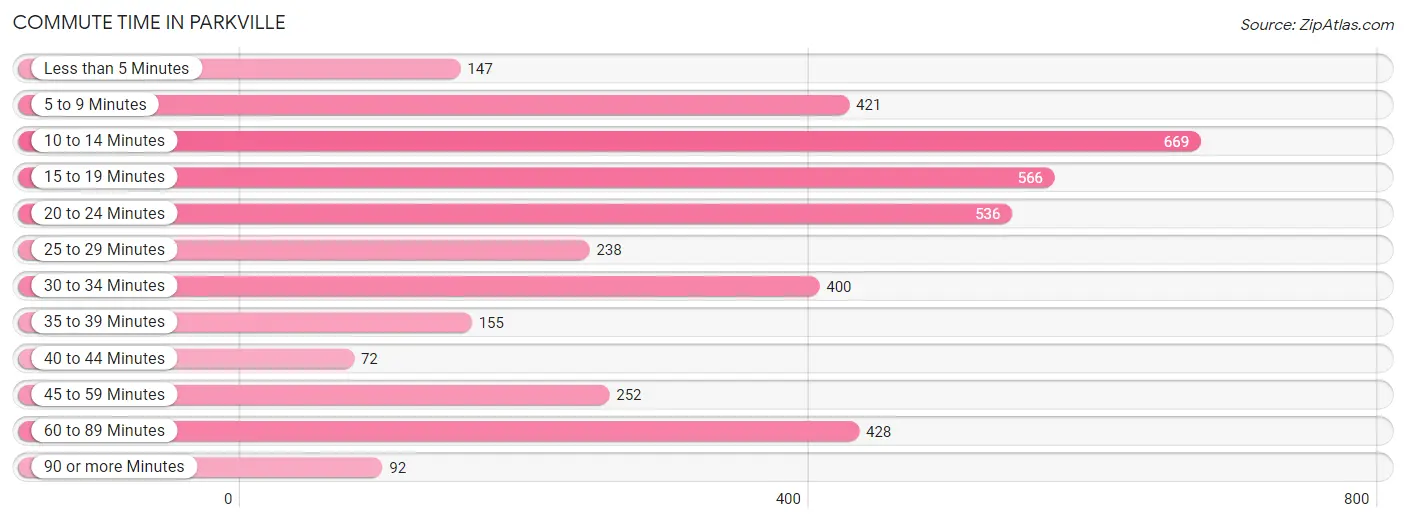
| Commute Time | # Commuters | % Commuters |
| Less than 5 Minutes | 147 | 3.7% |
| 5 to 9 Minutes | 421 | 10.6% |
| 10 to 14 Minutes | 669 | 16.8% |
| 15 to 19 Minutes | 566 | 14.2% |
| 20 to 24 Minutes | 536 | 13.5% |
| 25 to 29 Minutes | 238 | 6.0% |
| 30 to 34 Minutes | 400 | 10.1% |
| 35 to 39 Minutes | 155 | 3.9% |
| 40 to 44 Minutes | 72 | 1.8% |
| 45 to 59 Minutes | 252 | 6.3% |
| 60 to 89 Minutes | 428 | 10.8% |
| 90 or more Minutes | 92 | 2.3% |
Commute Time by Sex in Parkville
The most common commute times in Parkville are 20 to 24 minutes (396 commuters, 17.7%) for males and 10 to 14 minutes (452 commuters, 26.0%) for females.
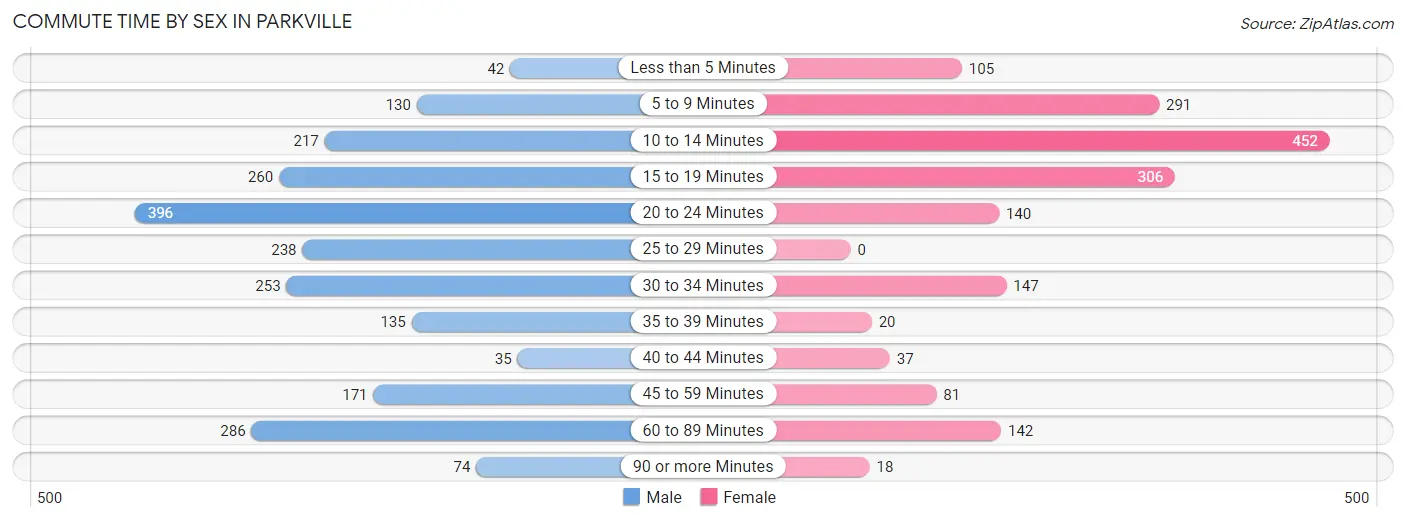
| Commute Time | Male | Female |
| Less than 5 Minutes | 42 (1.9%) | 105 (6.0%) |
| 5 to 9 Minutes | 130 (5.8%) | 291 (16.7%) |
| 10 to 14 Minutes | 217 (9.7%) | 452 (26.0%) |
| 15 to 19 Minutes | 260 (11.6%) | 306 (17.6%) |
| 20 to 24 Minutes | 396 (17.7%) | 140 (8.1%) |
| 25 to 29 Minutes | 238 (10.6%) | 0 (0.0%) |
| 30 to 34 Minutes | 253 (11.3%) | 147 (8.5%) |
| 35 to 39 Minutes | 135 (6.0%) | 20 (1.1%) |
| 40 to 44 Minutes | 35 (1.6%) | 37 (2.1%) |
| 45 to 59 Minutes | 171 (7.6%) | 81 (4.7%) |
| 60 to 89 Minutes | 286 (12.8%) | 142 (8.2%) |
| 90 or more Minutes | 74 (3.3%) | 18 (1.0%) |
Time of Departure to Work by Sex in Parkville
The most frequent times of departure to work in Parkville are 6:00 AM to 6:29 AM (450, 20.1%) for males and 12:00 AM to 4:59 AM (315, 18.1%) for females.
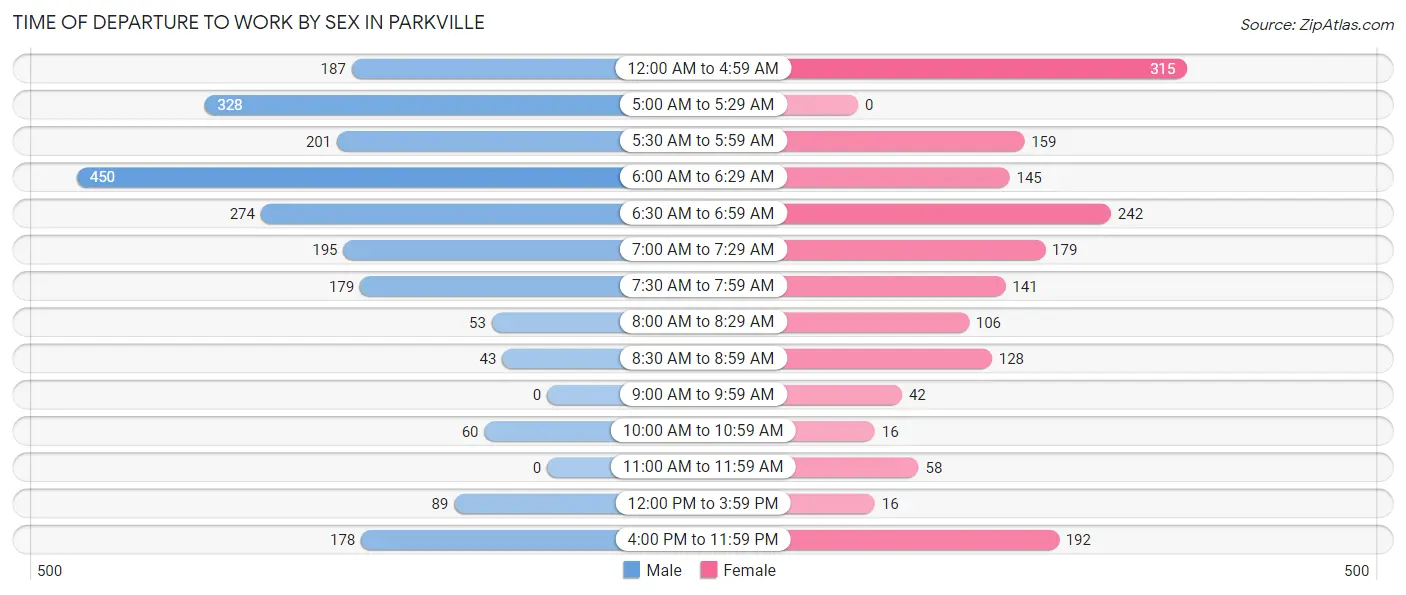
| Time of Departure | Male | Female |
| 12:00 AM to 4:59 AM | 187 (8.4%) | 315 (18.1%) |
| 5:00 AM to 5:29 AM | 328 (14.7%) | 0 (0.0%) |
| 5:30 AM to 5:59 AM | 201 (9.0%) | 159 (9.1%) |
| 6:00 AM to 6:29 AM | 450 (20.1%) | 145 (8.3%) |
| 6:30 AM to 6:59 AM | 274 (12.2%) | 242 (13.9%) |
| 7:00 AM to 7:29 AM | 195 (8.7%) | 179 (10.3%) |
| 7:30 AM to 7:59 AM | 179 (8.0%) | 141 (8.1%) |
| 8:00 AM to 8:29 AM | 53 (2.4%) | 106 (6.1%) |
| 8:30 AM to 8:59 AM | 43 (1.9%) | 128 (7.4%) |
| 9:00 AM to 9:59 AM | 0 (0.0%) | 42 (2.4%) |
| 10:00 AM to 10:59 AM | 60 (2.7%) | 16 (0.9%) |
| 11:00 AM to 11:59 AM | 0 (0.0%) | 58 (3.3%) |
| 12:00 PM to 3:59 PM | 89 (4.0%) | 16 (0.9%) |
| 4:00 PM to 11:59 PM | 178 (8.0%) | 192 (11.0%) |
| Total | 2,237 (100.0%) | 1,739 (100.0%) |
Housing Occupancy in Parkville
Occupancy by Ownership in Parkville
Of the total 3,253 dwellings in Parkville, owner-occupied units account for 2,415 (74.2%), while renter-occupied units make up 838 (25.8%).
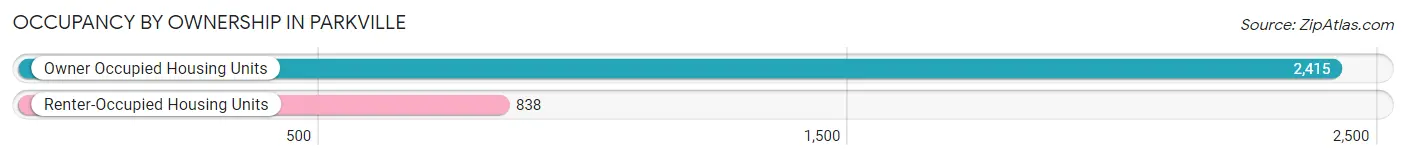
| Occupancy | # Housing Units | % Housing Units |
| Owner Occupied Housing Units | 2,415 | 74.2% |
| Renter-Occupied Housing Units | 838 | 25.8% |
| Total Occupied Housing Units | 3,253 | 100.0% |
Occupancy by Household Size in Parkville
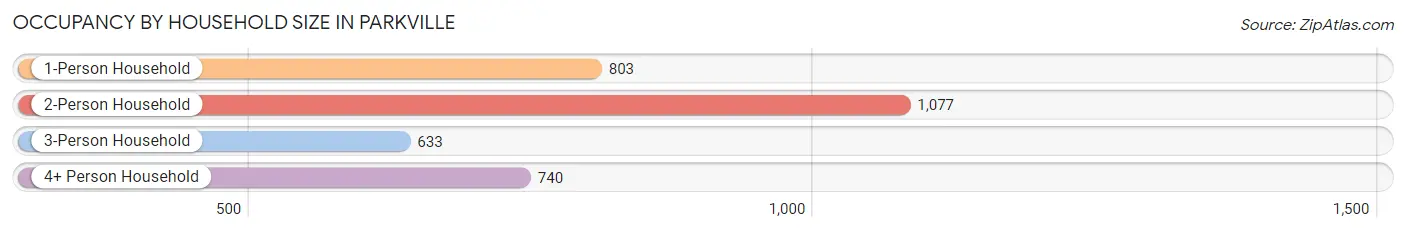
| Household Size | # Housing Units | % Housing Units |
| 1-Person Household | 803 | 24.7% |
| 2-Person Household | 1,077 | 33.1% |
| 3-Person Household | 633 | 19.5% |
| 4+ Person Household | 740 | 22.8% |
| Total Housing Units | 3,253 | 100.0% |
Occupancy by Ownership by Household Size in Parkville
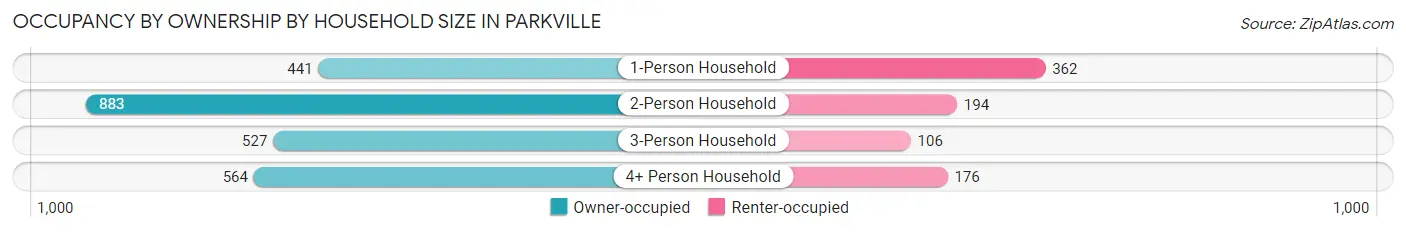
| Household Size | Owner-occupied | Renter-occupied |
| 1-Person Household | 441 (54.9%) | 362 (45.1%) |
| 2-Person Household | 883 (82.0%) | 194 (18.0%) |
| 3-Person Household | 527 (83.3%) | 106 (16.8%) |
| 4+ Person Household | 564 (76.2%) | 176 (23.8%) |
| Total Housing Units | 2,415 (74.2%) | 838 (25.8%) |
Occupancy by Educational Attainment in Parkville
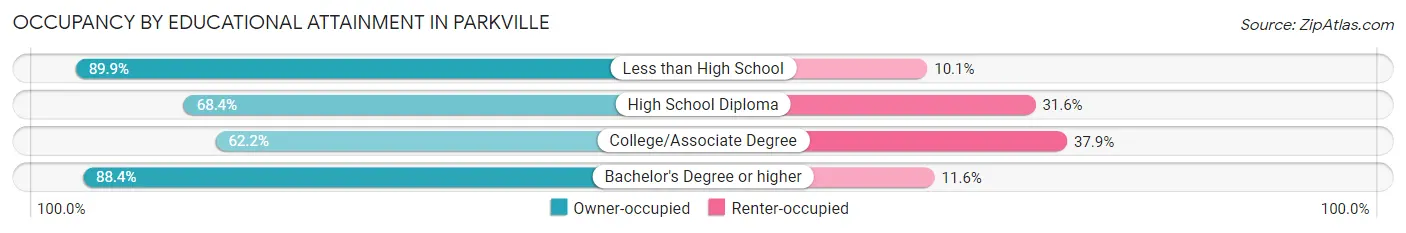
| Household Size | Owner-occupied | Renter-occupied |
| Less than High School | 390 (89.9%) | 44 (10.1%) |
| High School Diploma | 730 (68.4%) | 337 (31.6%) |
| College/Associate Degree | 601 (62.2%) | 366 (37.9%) |
| Bachelor's Degree or higher | 694 (88.4%) | 91 (11.6%) |
Occupancy by Age of Householder in Parkville
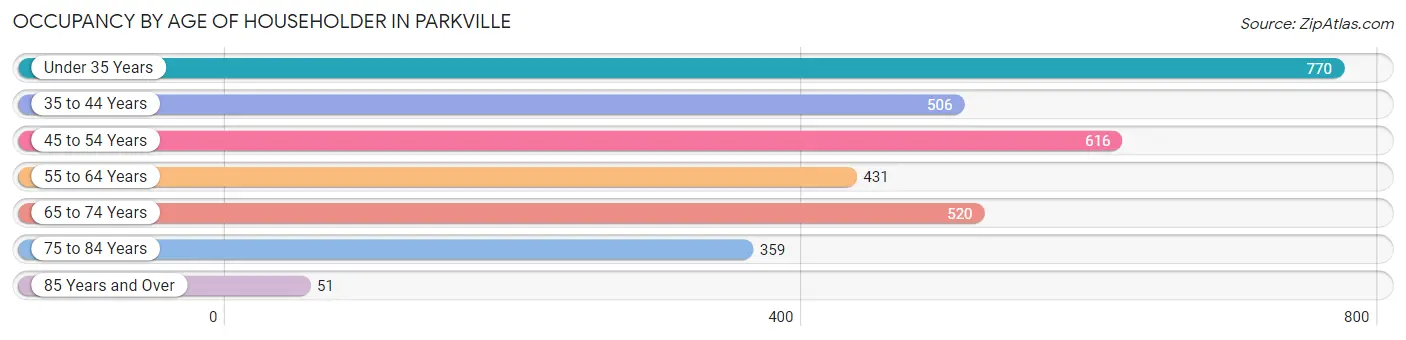
| Age Bracket | # Households | % Households |
| Under 35 Years | 770 | 23.7% |
| 35 to 44 Years | 506 | 15.5% |
| 45 to 54 Years | 616 | 18.9% |
| 55 to 64 Years | 431 | 13.3% |
| 65 to 74 Years | 520 | 16.0% |
| 75 to 84 Years | 359 | 11.0% |
| 85 Years and Over | 51 | 1.6% |
| Total | 3,253 | 100.0% |
Housing Finances in Parkville
Median Income by Occupancy in Parkville
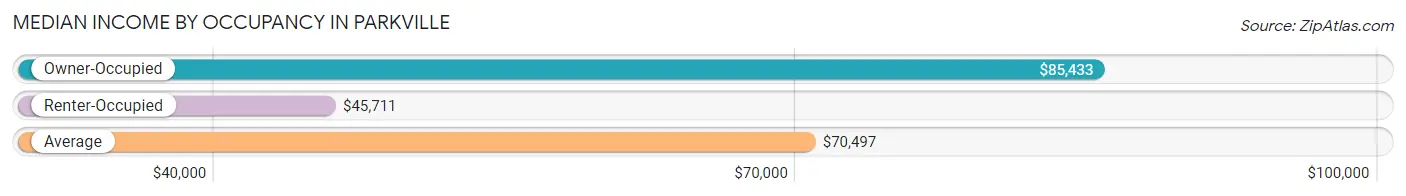
| Occupancy Type | # Households | Median Income |
| Owner-Occupied | 2,415 (74.2%) | $85,433 |
| Renter-Occupied | 838 (25.8%) | $45,711 |
| Average | 3,253 (100.0%) | $70,497 |
Occupancy by Householder Income Bracket in Parkville
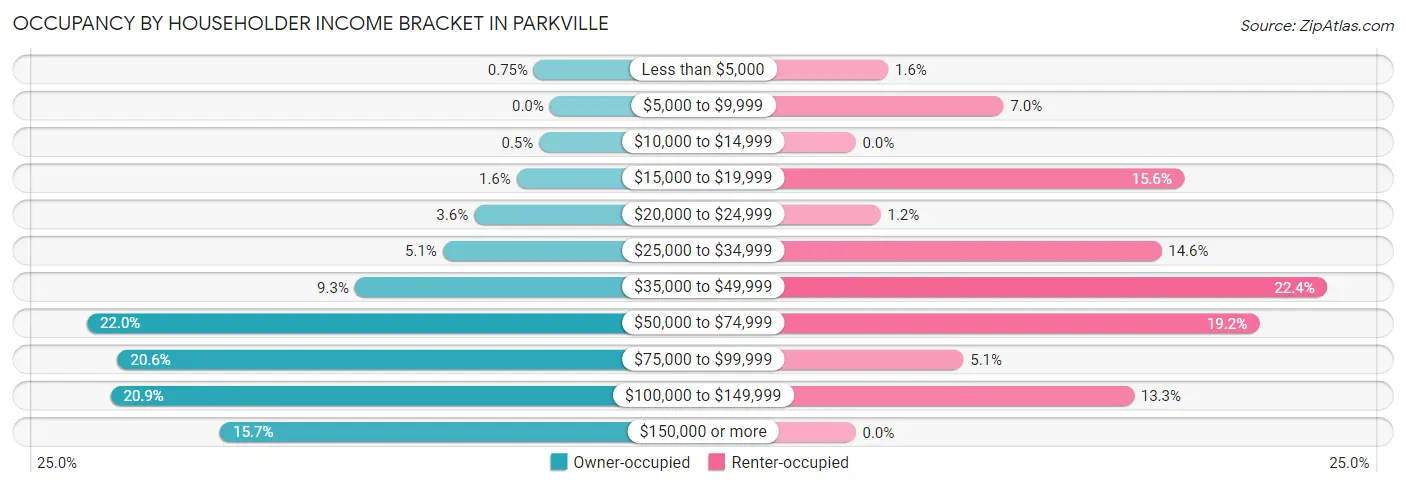
| Income Bracket | Owner-occupied | Renter-occupied |
| Less than $5,000 | 18 (0.7%) | 13 (1.5%) |
| $5,000 to $9,999 | 0 (0.0%) | 59 (7.0%) |
| $10,000 to $14,999 | 12 (0.5%) | 0 (0.0%) |
| $15,000 to $19,999 | 38 (1.6%) | 131 (15.6%) |
| $20,000 to $24,999 | 87 (3.6%) | 10 (1.2%) |
| $25,000 to $34,999 | 123 (5.1%) | 122 (14.6%) |
| $35,000 to $49,999 | 224 (9.3%) | 188 (22.4%) |
| $50,000 to $74,999 | 532 (22.0%) | 161 (19.2%) |
| $75,000 to $99,999 | 497 (20.6%) | 43 (5.1%) |
| $100,000 to $149,999 | 505 (20.9%) | 111 (13.3%) |
| $150,000 or more | 379 (15.7%) | 0 (0.0%) |
| Total | 2,415 (100.0%) | 838 (100.0%) |
Monthly Housing Cost Tiers in Parkville
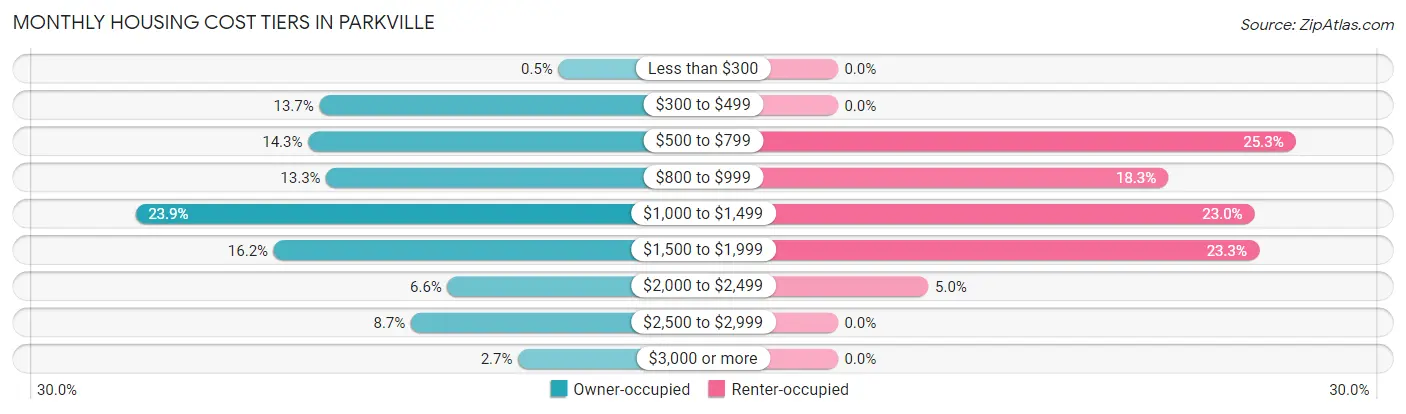
| Monthly Cost | Owner-occupied | Renter-occupied |
| Less than $300 | 12 (0.5%) | 0 (0.0%) |
| $300 to $499 | 331 (13.7%) | 0 (0.0%) |
| $500 to $799 | 346 (14.3%) | 212 (25.3%) |
| $800 to $999 | 322 (13.3%) | 153 (18.3%) |
| $1,000 to $1,499 | 577 (23.9%) | 193 (23.0%) |
| $1,500 to $1,999 | 392 (16.2%) | 195 (23.3%) |
| $2,000 to $2,499 | 160 (6.6%) | 42 (5.0%) |
| $2,500 to $2,999 | 209 (8.6%) | 0 (0.0%) |
| $3,000 or more | 66 (2.7%) | 0 (0.0%) |
| Total | 2,415 (100.0%) | 838 (100.0%) |
Physical Housing Characteristics in Parkville
Housing Structures in Parkville
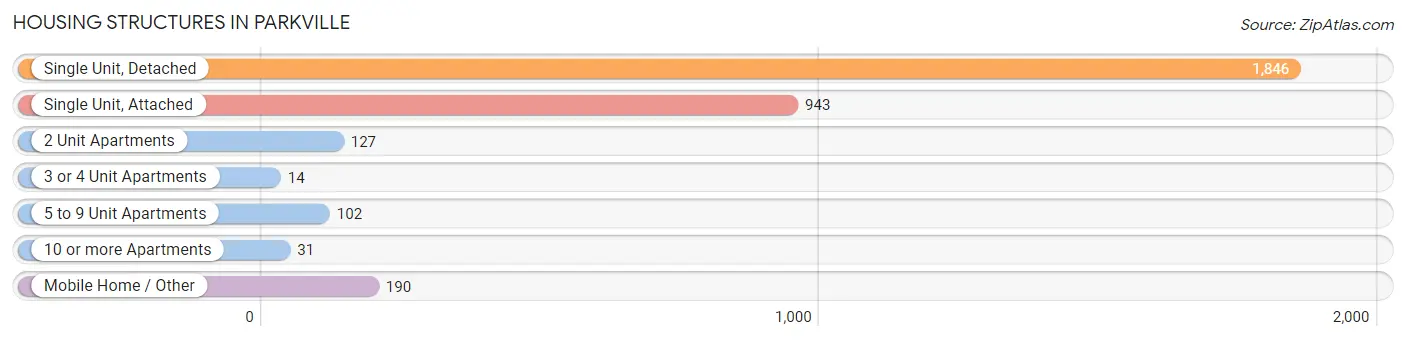
| Structure Type | # Housing Units | % Housing Units |
| Single Unit, Detached | 1,846 | 56.8% |
| Single Unit, Attached | 943 | 29.0% |
| 2 Unit Apartments | 127 | 3.9% |
| 3 or 4 Unit Apartments | 14 | 0.4% |
| 5 to 9 Unit Apartments | 102 | 3.1% |
| 10 or more Apartments | 31 | 0.9% |
| Mobile Home / Other | 190 | 5.8% |
| Total | 3,253 | 100.0% |
Housing Structures by Occupancy in Parkville
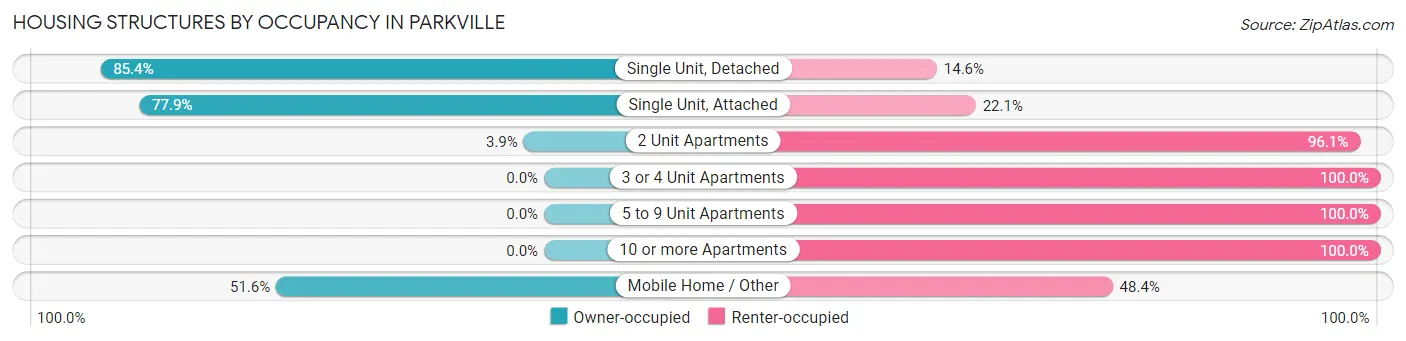
| Structure Type | Owner-occupied | Renter-occupied |
| Single Unit, Detached | 1,577 (85.4%) | 269 (14.6%) |
| Single Unit, Attached | 735 (77.9%) | 208 (22.1%) |
| 2 Unit Apartments | 5 (3.9%) | 122 (96.1%) |
| 3 or 4 Unit Apartments | 0 (0.0%) | 14 (100.0%) |
| 5 to 9 Unit Apartments | 0 (0.0%) | 102 (100.0%) |
| 10 or more Apartments | 0 (0.0%) | 31 (100.0%) |
| Mobile Home / Other | 98 (51.6%) | 92 (48.4%) |
| Total | 2,415 (74.2%) | 838 (25.8%) |
Housing Structures by Number of Rooms in Parkville
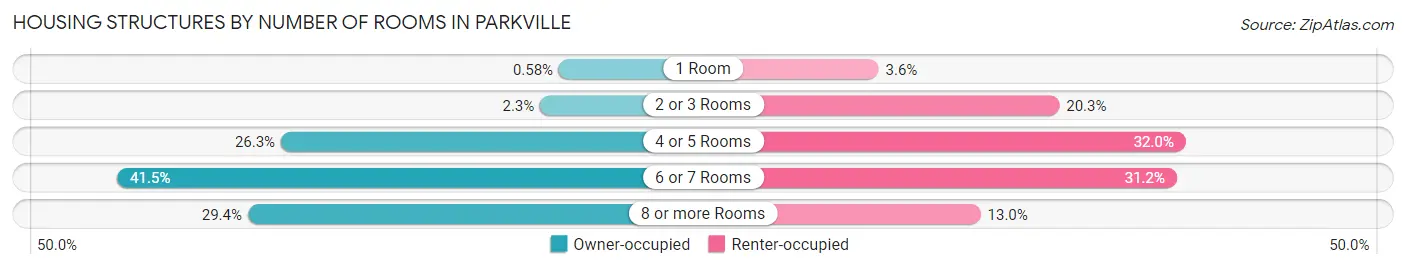
| Number of Rooms | Owner-occupied | Renter-occupied |
| 1 Room | 14 (0.6%) | 30 (3.6%) |
| 2 or 3 Rooms | 56 (2.3%) | 170 (20.3%) |
| 4 or 5 Rooms | 635 (26.3%) | 268 (32.0%) |
| 6 or 7 Rooms | 1,001 (41.4%) | 261 (31.1%) |
| 8 or more Rooms | 709 (29.4%) | 109 (13.0%) |
| Total | 2,415 (100.0%) | 838 (100.0%) |
Housing Structure by Heating Type in Parkville
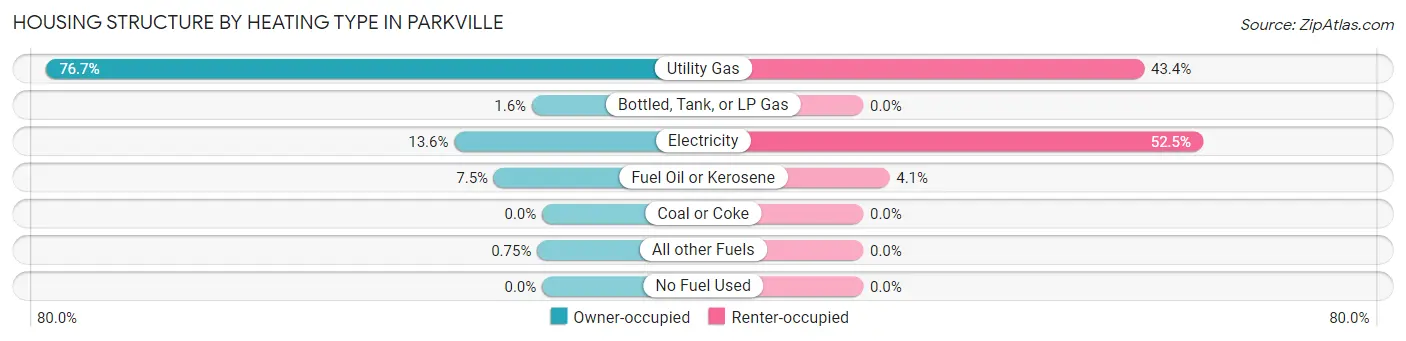
| Heating Type | Owner-occupied | Renter-occupied |
| Utility Gas | 1,851 (76.6%) | 364 (43.4%) |
| Bottled, Tank, or LP Gas | 38 (1.6%) | 0 (0.0%) |
| Electricity | 328 (13.6%) | 440 (52.5%) |
| Fuel Oil or Kerosene | 180 (7.4%) | 34 (4.1%) |
| Coal or Coke | 0 (0.0%) | 0 (0.0%) |
| All other Fuels | 18 (0.7%) | 0 (0.0%) |
| No Fuel Used | 0 (0.0%) | 0 (0.0%) |
| Total | 2,415 (100.0%) | 838 (100.0%) |
Household Vehicle Usage in Parkville
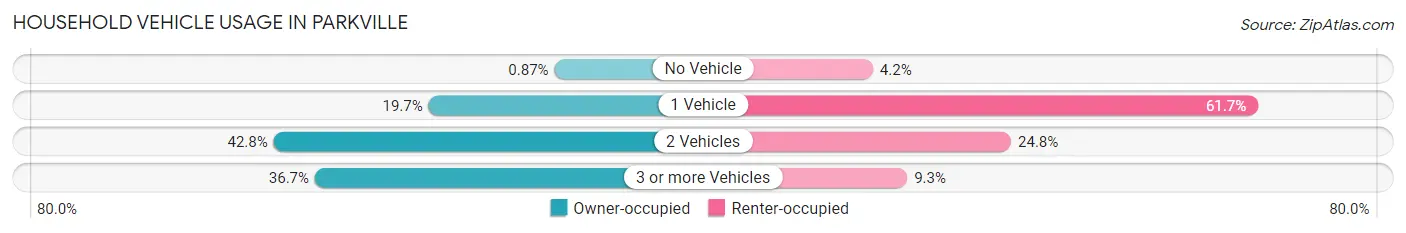
| Vehicles per Household | Owner-occupied | Renter-occupied |
| No Vehicle | 21 (0.9%) | 35 (4.2%) |
| 1 Vehicle | 475 (19.7%) | 517 (61.7%) |
| 2 Vehicles | 1,034 (42.8%) | 208 (24.8%) |
| 3 or more Vehicles | 885 (36.6%) | 78 (9.3%) |
| Total | 2,415 (100.0%) | 838 (100.0%) |
Real Estate & Mortgages in Parkville
Real Estate and Mortgage Overview in Parkville
| Characteristic | Without Mortgage | With Mortgage |
| Housing Units | 727 | 1,688 |
| Median Property Value | $176,200 | $188,000 |
| Median Household Income | $51,658 | $299 |
| Monthly Housing Costs | $564 | $66 |
| Real Estate Taxes | $2,786 | $15 |
Property Value by Mortgage Status in Parkville
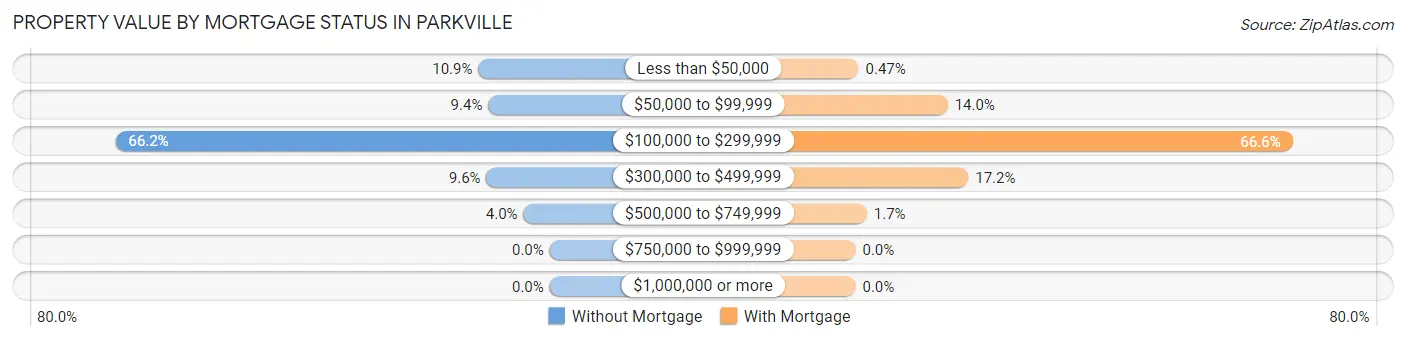
| Property Value | Without Mortgage | With Mortgage |
| Less than $50,000 | 79 (10.9%) | 8 (0.5%) |
| $50,000 to $99,999 | 68 (9.3%) | 237 (14.0%) |
| $100,000 to $299,999 | 481 (66.2%) | 1,124 (66.6%) |
| $300,000 to $499,999 | 70 (9.6%) | 290 (17.2%) |
| $500,000 to $749,999 | 29 (4.0%) | 29 (1.7%) |
| $750,000 to $999,999 | 0 (0.0%) | 0 (0.0%) |
| $1,000,000 or more | 0 (0.0%) | 0 (0.0%) |
| Total | 727 (100.0%) | 1,688 (100.0%) |
Household Income by Mortgage Status in Parkville
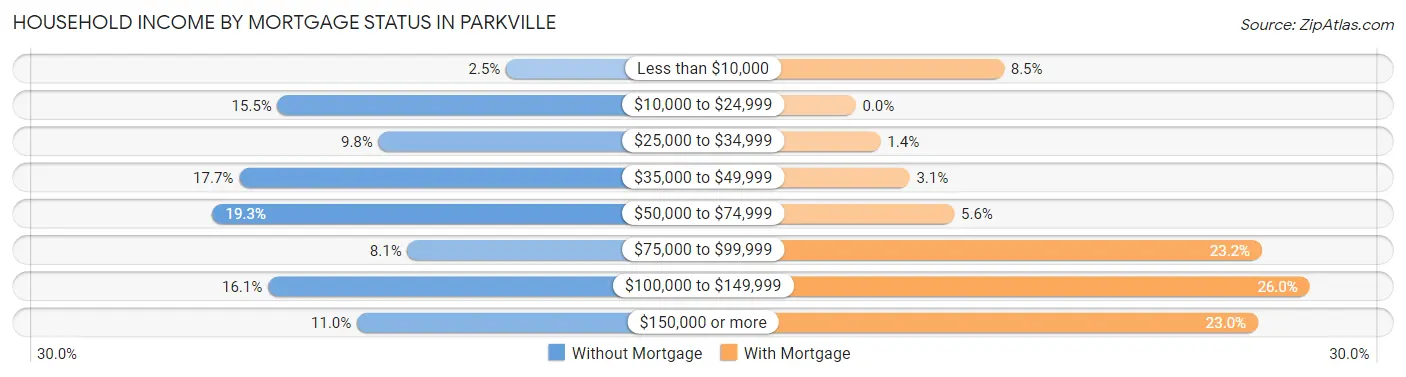
| Household Income | Without Mortgage | With Mortgage |
| Less than $10,000 | 18 (2.5%) | 143 (8.5%) |
| $10,000 to $24,999 | 113 (15.5%) | 0 (0.0%) |
| $25,000 to $34,999 | 71 (9.8%) | 24 (1.4%) |
| $35,000 to $49,999 | 129 (17.7%) | 52 (3.1%) |
| $50,000 to $74,999 | 140 (19.3%) | 95 (5.6%) |
| $75,000 to $99,999 | 59 (8.1%) | 392 (23.2%) |
| $100,000 to $149,999 | 117 (16.1%) | 438 (26.0%) |
| $150,000 or more | 80 (11.0%) | 388 (23.0%) |
| Total | 727 (100.0%) | 1,688 (100.0%) |
Property Value to Household Income Ratio in Parkville
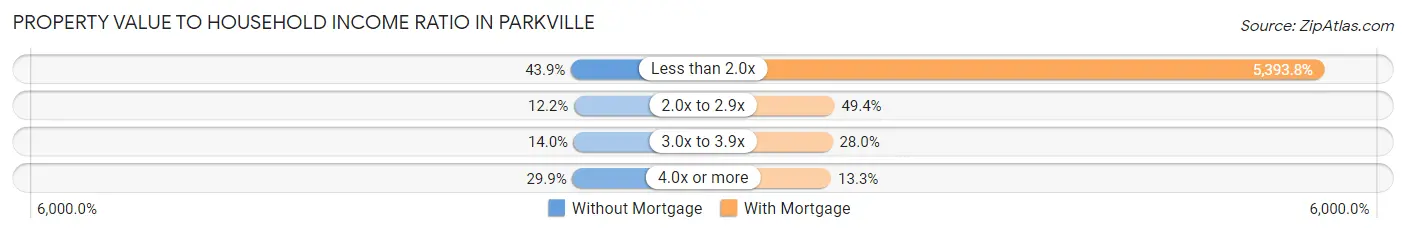
| Value-to-Income Ratio | Without Mortgage | With Mortgage |
| Less than 2.0x | 319 (43.9%) | 91,048 (5,393.8%) |
| 2.0x to 2.9x | 89 (12.2%) | 834 (49.4%) |
| 3.0x to 3.9x | 102 (14.0%) | 472 (28.0%) |
| 4.0x or more | 217 (29.8%) | 224 (13.3%) |
| Total | 727 (100.0%) | 1,688 (100.0%) |
Real Estate Taxes by Mortgage Status in Parkville
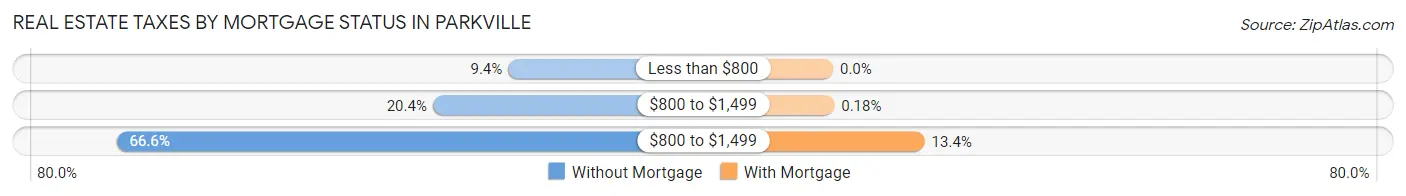
| Property Taxes | Without Mortgage | With Mortgage |
| Less than $800 | 68 (9.3%) | 0 (0.0%) |
| $800 to $1,499 | 148 (20.4%) | 3 (0.2%) |
| $800 to $1,499 | 484 (66.6%) | 226 (13.4%) |
| Total | 727 (100.0%) | 1,688 (100.0%) |
Health & Disability in Parkville
Health Insurance Coverage by Age in Parkville
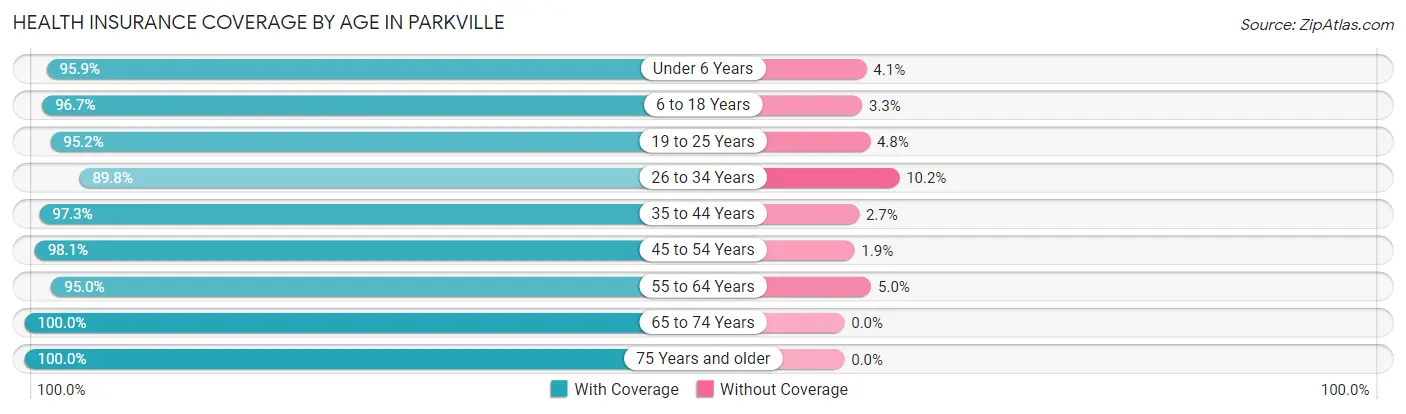
| Age Bracket | With Coverage | Without Coverage |
| Under 6 Years | 651 (95.9%) | 28 (4.1%) |
| 6 to 18 Years | 1,148 (96.7%) | 39 (3.3%) |
| 19 to 25 Years | 775 (95.2%) | 39 (4.8%) |
| 26 to 34 Years | 1,139 (89.8%) | 130 (10.2%) |
| 35 to 44 Years | 852 (97.3%) | 24 (2.7%) |
| 45 to 54 Years | 1,091 (98.1%) | 21 (1.9%) |
| 55 to 64 Years | 800 (95.0%) | 42 (5.0%) |
| 65 to 74 Years | 883 (100.0%) | 0 (0.0%) |
| 75 Years and older | 564 (100.0%) | 0 (0.0%) |
| Total | 7,903 (96.1%) | 323 (3.9%) |
Health Insurance Coverage by Citizenship Status in Parkville
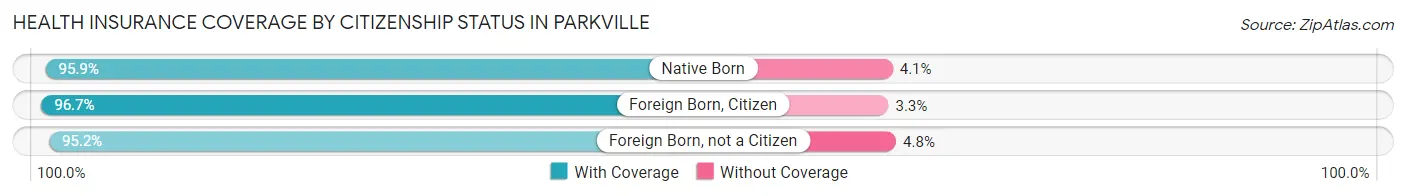
| Citizenship Status | With Coverage | Without Coverage |
| Native Born | 651 (95.9%) | 28 (4.1%) |
| Foreign Born, Citizen | 1,148 (96.7%) | 39 (3.3%) |
| Foreign Born, not a Citizen | 775 (95.2%) | 39 (4.8%) |
Health Insurance Coverage by Household Income in Parkville
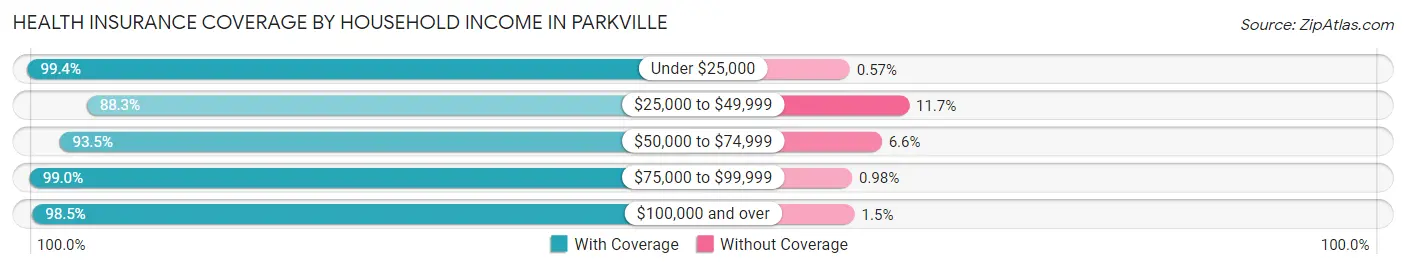
| Household Income | With Coverage | Without Coverage |
| Under $25,000 | 520 (99.4%) | 3 (0.6%) |
| $25,000 to $49,999 | 1,159 (88.3%) | 153 (11.7%) |
| $50,000 to $74,999 | 1,497 (93.4%) | 105 (6.6%) |
| $75,000 to $99,999 | 1,611 (99.0%) | 16 (1.0%) |
| $100,000 and over | 3,093 (98.5%) | 46 (1.5%) |
Public vs Private Health Insurance Coverage by Age in Parkville
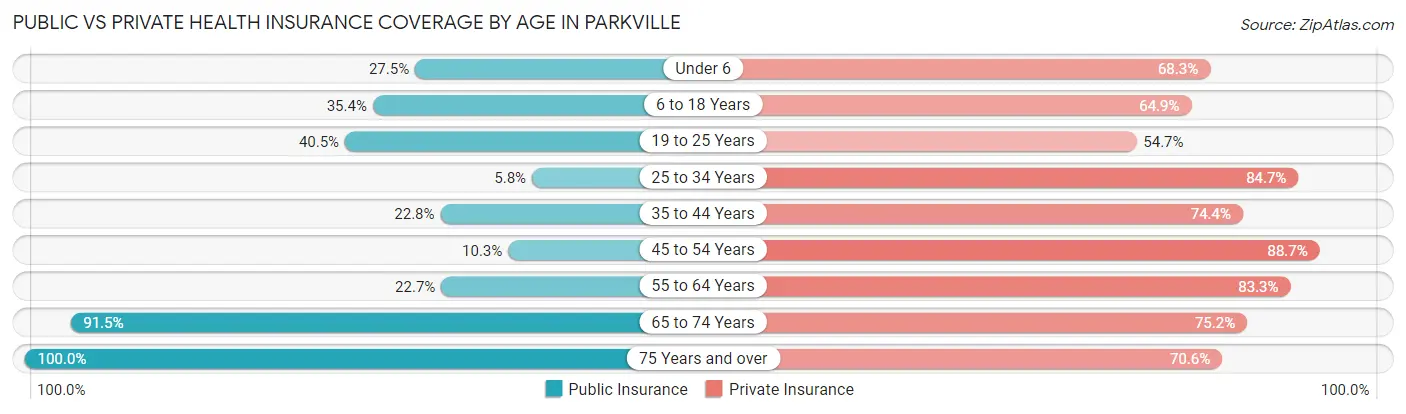
| Age Bracket | Public Insurance | Private Insurance |
| Under 6 | 187 (27.5%) | 464 (68.3%) |
| 6 to 18 Years | 420 (35.4%) | 770 (64.9%) |
| 19 to 25 Years | 330 (40.5%) | 445 (54.7%) |
| 25 to 34 Years | 74 (5.8%) | 1,075 (84.7%) |
| 35 to 44 Years | 200 (22.8%) | 652 (74.4%) |
| 45 to 54 Years | 114 (10.2%) | 986 (88.7%) |
| 55 to 64 Years | 191 (22.7%) | 701 (83.3%) |
| 65 to 74 Years | 808 (91.5%) | 664 (75.2%) |
| 75 Years and over | 564 (100.0%) | 398 (70.6%) |
| Total | 2,888 (35.1%) | 6,155 (74.8%) |
Disability Status by Sex by Age in Parkville
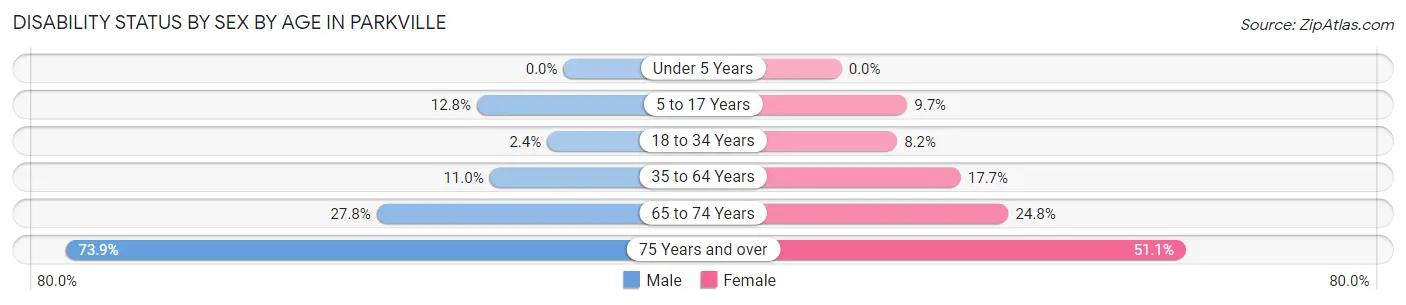
| Age Bracket | Male | Female |
| Under 5 Years | 0 (0.0%) | 0 (0.0%) |
| 5 to 17 Years | 110 (12.8%) | 51 (9.7%) |
| 18 to 34 Years | 34 (2.4%) | 61 (8.2%) |
| 35 to 64 Years | 151 (11.0%) | 257 (17.7%) |
| 65 to 74 Years | 96 (27.8%) | 133 (24.8%) |
| 75 Years and over | 210 (73.9%) | 143 (51.1%) |
Disability Class by Sex by Age in Parkville
Disability Class: Hearing Difficulty
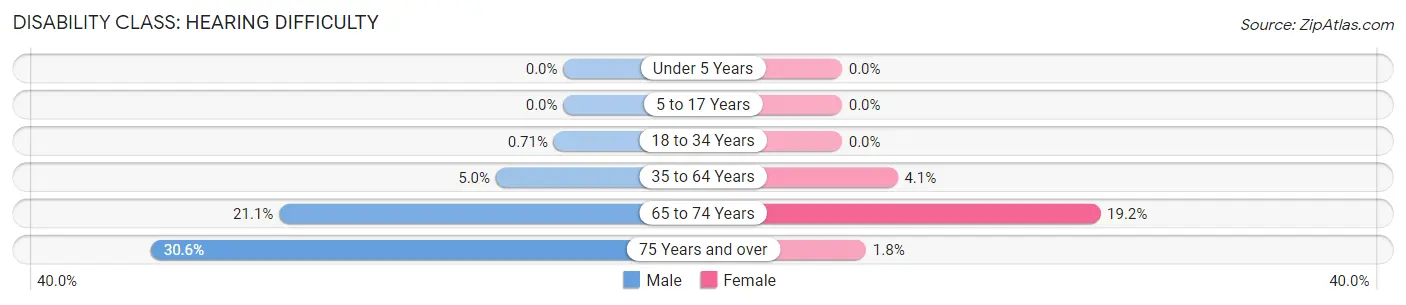
| Age Bracket | Male | Female |
| Under 5 Years | 0 (0.0%) | 0 (0.0%) |
| 5 to 17 Years | 0 (0.0%) | 0 (0.0%) |
| 18 to 34 Years | 10 (0.7%) | 0 (0.0%) |
| 35 to 64 Years | 69 (5.0%) | 60 (4.1%) |
| 65 to 74 Years | 73 (21.1%) | 103 (19.2%) |
| 75 Years and over | 87 (30.6%) | 5 (1.8%) |
Disability Class: Vision Difficulty
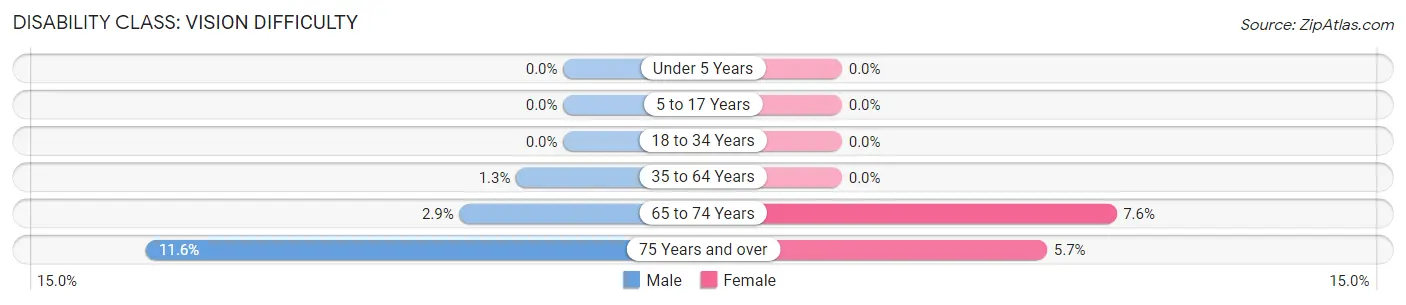
| Age Bracket | Male | Female |
| Under 5 Years | 0 (0.0%) | 0 (0.0%) |
| 5 to 17 Years | 0 (0.0%) | 0 (0.0%) |
| 18 to 34 Years | 0 (0.0%) | 0 (0.0%) |
| 35 to 64 Years | 18 (1.3%) | 0 (0.0%) |
| 65 to 74 Years | 10 (2.9%) | 41 (7.6%) |
| 75 Years and over | 33 (11.6%) | 16 (5.7%) |
Disability Class: Cognitive Difficulty
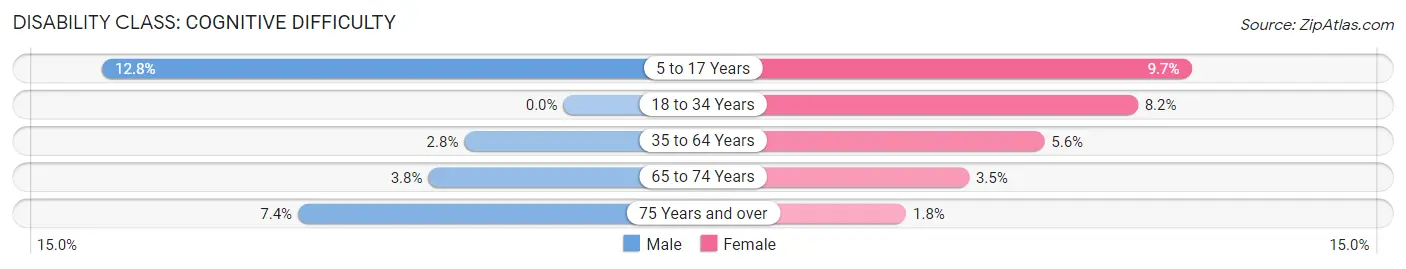
| Age Bracket | Male | Female |
| 5 to 17 Years | 110 (12.8%) | 51 (9.7%) |
| 18 to 34 Years | 0 (0.0%) | 61 (8.2%) |
| 35 to 64 Years | 38 (2.8%) | 82 (5.6%) |
| 65 to 74 Years | 13 (3.8%) | 19 (3.5%) |
| 75 Years and over | 21 (7.4%) | 5 (1.8%) |
Disability Class: Ambulatory Difficulty
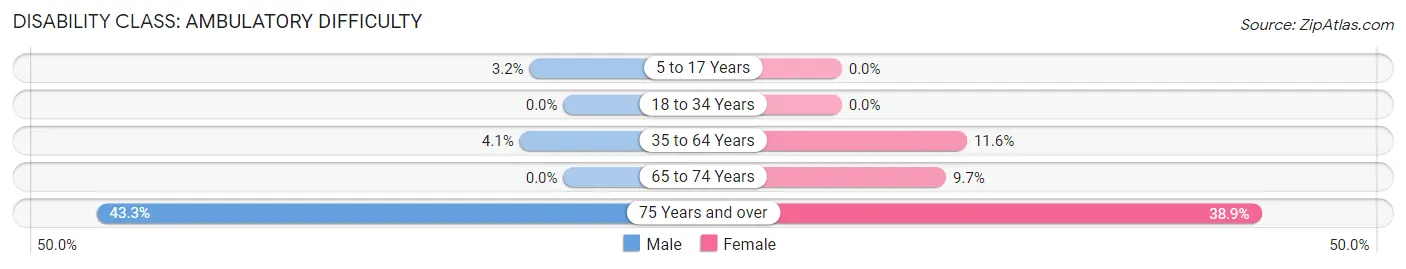
| Age Bracket | Male | Female |
| 5 to 17 Years | 27 (3.2%) | 0 (0.0%) |
| 18 to 34 Years | 0 (0.0%) | 0 (0.0%) |
| 35 to 64 Years | 56 (4.1%) | 169 (11.6%) |
| 65 to 74 Years | 0 (0.0%) | 52 (9.7%) |
| 75 Years and over | 123 (43.3%) | 109 (38.9%) |
Disability Class: Self-Care Difficulty
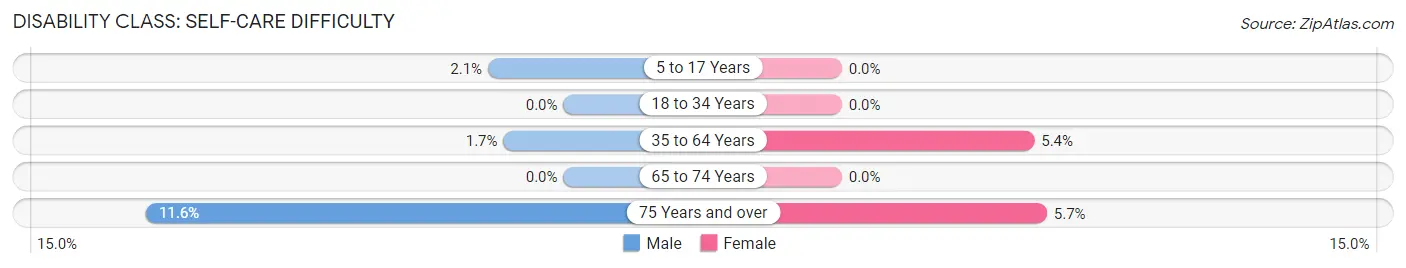
| Age Bracket | Male | Female |
| 5 to 17 Years | 18 (2.1%) | 0 (0.0%) |
| 18 to 34 Years | 0 (0.0%) | 0 (0.0%) |
| 35 to 64 Years | 23 (1.7%) | 78 (5.4%) |
| 65 to 74 Years | 0 (0.0%) | 0 (0.0%) |
| 75 Years and over | 33 (11.6%) | 16 (5.7%) |
Technology Access in Parkville
Computing Device Access in Parkville
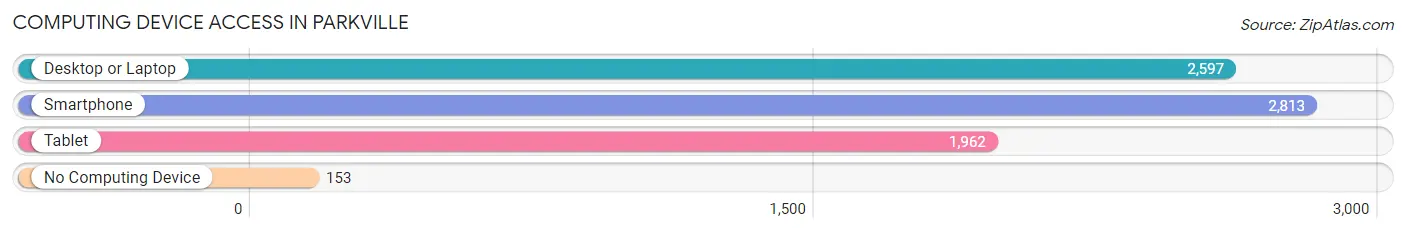
| Device Type | # Households | % Households |
| Desktop or Laptop | 2,597 | 79.8% |
| Smartphone | 2,813 | 86.5% |
| Tablet | 1,962 | 60.3% |
| No Computing Device | 153 | 4.7% |
| Total | 3,253 | 100.0% |
Internet Access in Parkville
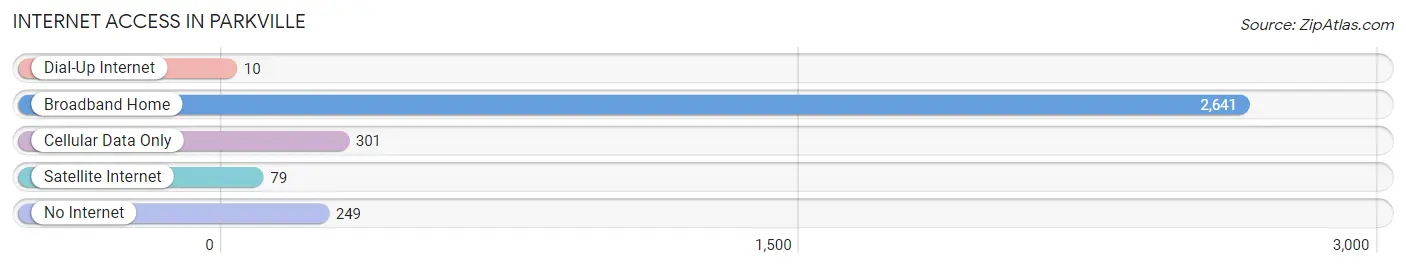
| Internet Type | # Households | % Households |
| Dial-Up Internet | 10 | 0.3% |
| Broadband Home | 2,641 | 81.2% |
| Cellular Data Only | 301 | 9.2% |
| Satellite Internet | 79 | 2.4% |
| No Internet | 249 | 7.6% |
| Total | 3,253 | 100.0% |
Parkville Summary
Parkville is a small borough located in Butler County, Pennsylvania. It is situated in the western part of the state, approximately 30 miles north of Pittsburgh. The borough was founded in 1876 and has a population of approximately 1,000 people.
History
Parkville was founded in 1876 by a group of settlers from the nearby town of Butler. The settlers were looking for a place to build a new community and chose the area that is now Parkville. The town was named after the nearby park, which was owned by the local railroad company. The park was a popular destination for picnics and other outdoor activities.
The town grew quickly and by the early 1900s, it had become a thriving community. The town was home to several businesses, including a general store, a blacksmith shop, a sawmill, and a grist mill. The town also had a post office, a school, and a church.
In the early 1900s, the town was home to a large number of immigrants from Europe. Many of these immigrants were of German and Polish descent. The immigrants brought with them their culture and traditions, which are still evident in the town today.
Geography
Parkville is located in western Pennsylvania, approximately 30 miles north of Pittsburgh. The borough is situated in the foothills of the Allegheny Mountains and is surrounded by rolling hills and forests. The town is located on the banks of the Connoquenessing Creek, which flows through the town and provides a source of recreation for the residents.
The town is located in a temperate climate zone and experiences four distinct seasons. Summers are warm and humid, while winters are cold and snowy. The average annual temperature is around 50 degrees Fahrenheit.
Economy
The economy of Parkville is largely based on agriculture and tourism. The town is home to several farms, which produce a variety of crops, including corn, soybeans, and hay. The town is also home to several wineries, which produce a variety of wines.
Tourism is an important part of the local economy. The town is home to several historic sites, including the Parkville Historic District, which is listed on the National Register of Historic Places. The town also hosts several festivals and events throughout the year, including the Parkville Harvest Festival and the Parkville Music Festival.
Demographics
As of the 2010 census, the population of Parkville was 1,000 people. The racial makeup of the town was 97.2% White, 0.7% African American, 0.3% Native American, 0.3% Asian, and 1.5% from other races. The median household income was $41,250 and the median family income was $50,000.
The town is home to a variety of religious denominations, including Catholic, Lutheran, Methodist, and Presbyterian. The town is also home to a variety of ethnic groups, including German, Polish, and Italian.
Conclusion
Parkville is a small borough located in Butler County, Pennsylvania. It was founded in 1876 and has a population of approximately 1,000 people. The town is situated in the foothills of the Allegheny Mountains and is surrounded by rolling hills and forests. The economy of Parkville is largely based on agriculture and tourism. The town is home to several historic sites and hosts several festivals and events throughout the year. The population of Parkville is 97.2% White, 0.7% African American, 0.3% Native American, 0.3% Asian, and 1.5% from other races. The town is home to a variety of religious denominations and ethnic groups.
Common Questions
What is Per Capita Income in Parkville?
Per Capita income in Parkville is $35,658.
What is the Median Family Income in Parkville?
Median Family Income in Parkville is $89,955.
What is the Median Household income in Parkville?
Median Household Income in Parkville is $70,497.
What is Income or Wage Gap in Parkville?
Income or Wage Gap in Parkville is 26.7%.
Women in Parkville earn 73.3 cents for every dollar earned by a man.
What is Inequality or Gini Index in Parkville?
Inequality or Gini Index in Parkville is 0.37.
What is the Total Population of Parkville?
Total Population of Parkville is 8,226.
What is the Total Male Population of Parkville?
Total Male Population of Parkville is 4,375.
What is the Total Female Population of Parkville?
Total Female Population of Parkville is 3,851.
What is the Ratio of Males per 100 Females in Parkville?
There are 113.61 Males per 100 Females in Parkville.
What is the Ratio of Females per 100 Males in Parkville?
There are 88.02 Females per 100 Males in Parkville.
What is the Median Population Age in Parkville?
Median Population Age in Parkville is 36.4 Years.
What is the Average Family Size in Parkville
Average Family Size in Parkville is 3.0 People.
What is the Average Household Size in Parkville
Average Household Size in Parkville is 2.5 People.
How Large is the Labor Force in Parkville?
There are 4,495 People in the Labor Forcein in Parkville.
What is the Percentage of People in the Labor Force in Parkville?
67.6% of People are in the Labor Force in Parkville.
What is the Unemployment Rate in Parkville?
Unemployment Rate in Parkville is 3.7%.