Cities with the Largest Hispanic or Latino Community in Michigan
RELATED REPORTS & OPTIONS
Hispanic or Latino
Michigan
Compare Cities
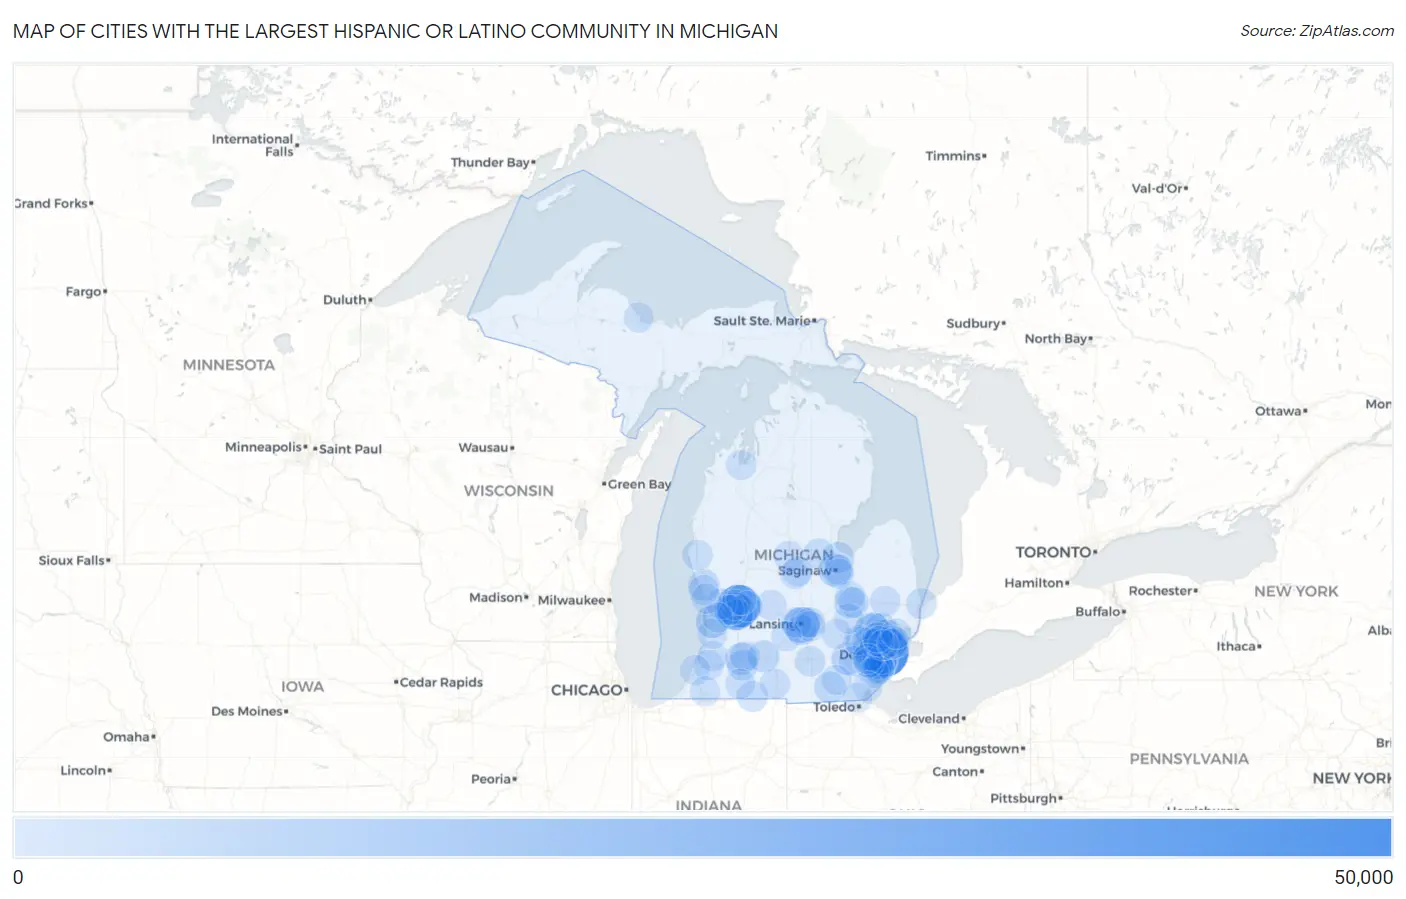
Map of Cities with the Largest Hispanic or Latino Community in Michigan
0
50,000
Cities with the Largest Hispanic or Latino Community in Michigan
| City | Hispanic or Latino | vs State | vs National | |
| 1. | Detroit | 48,054 | 550,427(8.73%)#1 | 61,755,866(0.08%)#172 |
| 2. | Grand Rapids | 31,593 | 550,427(5.74%)#2 | 61,755,866(0.05%)#296 |
| 3. | Wyoming | 18,466 | 550,427(3.35%)#3 | 61,755,866(0.03%)#506 |
| 4. | Lansing | 14,105 | 550,427(2.56%)#4 | 61,755,866(0.02%)#661 |
| 5. | Pontiac | 12,786 | 550,427(2.32%)#5 | 61,755,866(0.02%)#720 |
| 6. | Lincoln Park | 10,625 | 550,427(1.93%)#6 | 61,755,866(0.02%)#860 |
| 7. | Holland | 8,183 | 550,427(1.49%)#7 | 61,755,866(0.01%)#1,087 |
| 8. | Saginaw | 7,273 | 550,427(1.32%)#8 | 61,755,866(0.01%)#1,184 |
| 9. | Ann Arbor | 5,832 | 550,427(1.06%)#9 | 61,755,866(0.01%)#1,402 |
| 10. | Kentwood | 5,599 | 550,427(1.02%)#10 | 61,755,866(0.01%)#1,447 |
| 11. | Kalamazoo | 5,423 | 550,427(0.99%)#11 | 61,755,866(0.01%)#1,475 |
| 12. | Taylor | 4,820 | 550,427(0.88%)#12 | 61,755,866(0.01%)#1,610 |
| 13. | Adrian | 4,464 | 550,427(0.81%)#13 | 61,755,866(0.01%)#1,705 |
| 14. | Westland | 4,257 | 550,427(0.77%)#14 | 61,755,866(0.01%)#1,771 |
| 15. | Battle Creek | 4,235 | 550,427(0.77%)#15 | 61,755,866(0.01%)#1,779 |
| 16. | Livonia | 4,121 | 550,427(0.75%)#16 | 61,755,866(0.01%)#1,822 |
| 17. | Muskegon | 3,712 | 550,427(0.67%)#17 | 61,755,866(0.01%)#1,975 |
| 18. | Flint | 3,481 | 550,427(0.63%)#18 | 61,755,866(0.01%)#2,072 |
| 19. | Bay City | 3,472 | 550,427(0.63%)#19 | 61,755,866(0.01%)#2,076 |
| 20. | Warren | 3,444 | 550,427(0.63%)#20 | 61,755,866(0.01%)#2,083 |
| 21. | Rochester Hills | 3,346 | 550,427(0.61%)#21 | 61,755,866(0.01%)#2,125 |
| 22. | Allen Park | 3,318 | 550,427(0.60%)#22 | 61,755,866(0.01%)#2,142 |
| 23. | Southgate | 3,156 | 550,427(0.57%)#23 | 61,755,866(0.01%)#2,224 |
| 24. | Dearborn Heights | 3,094 | 550,427(0.56%)#24 | 61,755,866(0.01%)#2,252 |
| 25. | Dearborn | 3,041 | 550,427(0.55%)#25 | 61,755,866(0.00%)#2,271 |
| 26. | Melvindale | 2,880 | 550,427(0.52%)#26 | 61,755,866(0.00%)#2,357 |
| 27. | Novi | 2,842 | 550,427(0.52%)#27 | 61,755,866(0.00%)#2,385 |
| 28. | Sterling Heights | 2,699 | 550,427(0.49%)#28 | 61,755,866(0.00%)#2,473 |
| 29. | Sturgis | 2,645 | 550,427(0.48%)#29 | 61,755,866(0.00%)#2,511 |
| 30. | Portage | 2,601 | 550,427(0.47%)#30 | 61,755,866(0.00%)#2,533 |
| 31. | Royal Oak | 2,551 | 550,427(0.46%)#31 | 61,755,866(0.00%)#2,574 |
| 32. | East Lansing | 2,481 | 550,427(0.45%)#32 | 61,755,866(0.00%)#2,621 |
| 33. | Troy | 2,264 | 550,427(0.41%)#33 | 61,755,866(0.00%)#2,772 |
| 34. | Auburn Hills | 2,223 | 550,427(0.40%)#34 | 61,755,866(0.00%)#2,808 |
| 35. | Holt | 2,167 | 550,427(0.39%)#35 | 61,755,866(0.00%)#2,856 |
| 36. | Cutlerville | 2,142 | 550,427(0.39%)#36 | 61,755,866(0.00%)#2,886 |
| 37. | Port Huron | 2,099 | 550,427(0.38%)#37 | 61,755,866(0.00%)#2,930 |
| 38. | Jackson | 1,974 | 550,427(0.36%)#38 | 61,755,866(0.00%)#3,061 |
| 39. | Midland | 1,870 | 550,427(0.34%)#39 | 61,755,866(0.00%)#3,183 |
| 40. | Farmington Hills | 1,865 | 550,427(0.34%)#40 | 61,755,866(0.00%)#3,187 |
| 41. | Roseville | 1,801 | 550,427(0.33%)#41 | 61,755,866(0.00%)#3,240 |
| 42. | Ecorse | 1,773 | 550,427(0.32%)#42 | 61,755,866(0.00%)#3,272 |
| 43. | Wyandotte | 1,631 | 550,427(0.30%)#43 | 61,755,866(0.00%)#3,442 |
| 44. | Imlay City | 1,631 | 550,427(0.30%)#44 | 61,755,866(0.00%)#3,444 |
| 45. | Waverly | 1,591 | 550,427(0.29%)#45 | 61,755,866(0.00%)#3,500 |
| 46. | St Clair Shores | 1,564 | 550,427(0.28%)#46 | 61,755,866(0.00%)#3,530 |
| 47. | Ionia | 1,529 | 550,427(0.28%)#47 | 61,755,866(0.00%)#3,586 |
| 48. | Comstock Park | 1,486 | 550,427(0.27%)#48 | 61,755,866(0.00%)#3,656 |
| 49. | Burton | 1,340 | 550,427(0.24%)#49 | 61,755,866(0.00%)#3,899 |
| 50. | Walker | 1,316 | 550,427(0.24%)#50 | 61,755,866(0.00%)#3,939 |
| 51. | Shelby | 1,301 | 550,427(0.24%)#51 | 61,755,866(0.00%)#3,969 |
| 52. | Garden City | 1,296 | 550,427(0.24%)#52 | 61,755,866(0.00%)#3,975 |
| 53. | Allendale | 1,267 | 550,427(0.23%)#53 | 61,755,866(0.00%)#4,016 |
| 54. | Ypsilanti | 1,265 | 550,427(0.23%)#54 | 61,755,866(0.00%)#4,021 |
| 55. | Mount Pleasant | 1,259 | 550,427(0.23%)#55 | 61,755,866(0.00%)#4,029 |
| 56. | Forest Hills | 1,232 | 550,427(0.22%)#56 | 61,755,866(0.00%)#4,083 |
| 57. | Southfield | 1,165 | 550,427(0.21%)#57 | 61,755,866(0.00%)#4,237 |
| 58. | Coldwater | 1,138 | 550,427(0.21%)#58 | 61,755,866(0.00%)#4,275 |
| 59. | River Rouge | 1,113 | 550,427(0.20%)#59 | 61,755,866(0.00%)#4,331 |
| 60. | Norton Shores | 1,086 | 550,427(0.20%)#60 | 61,755,866(0.00%)#4,392 |
| 61. | Alma | 1,036 | 550,427(0.19%)#61 | 61,755,866(0.00%)#4,527 |
| 62. | Okemos | 1,006 | 550,427(0.18%)#62 | 61,755,866(0.00%)#4,596 |
| 63. | Woodhaven | 956 | 550,427(0.17%)#63 | 61,755,866(0.00%)#4,752 |
| 64. | Bangor | 939 | 550,427(0.17%)#64 | 61,755,866(0.00%)#4,802 |
| 65. | Riverview | 883 | 550,427(0.16%)#65 | 61,755,866(0.00%)#4,966 |
| 66. | Trenton | 879 | 550,427(0.16%)#66 | 61,755,866(0.00%)#4,977 |
| 67. | Hartford | 872 | 550,427(0.16%)#67 | 61,755,866(0.00%)#5,006 |
| 68. | Haslett | 868 | 550,427(0.16%)#68 | 61,755,866(0.00%)#5,012 |
| 69. | Wixom | 847 | 550,427(0.15%)#69 | 61,755,866(0.00%)#5,077 |
| 70. | Ferndale | 836 | 550,427(0.15%)#70 | 61,755,866(0.00%)#5,109 |
| 71. | Hazel Park | 826 | 550,427(0.15%)#71 | 61,755,866(0.00%)#5,154 |
| 72. | Benton Heights | 818 | 550,427(0.15%)#72 | 61,755,866(0.00%)#5,178 |
| 73. | Grandville | 815 | 550,427(0.15%)#73 | 61,755,866(0.00%)#5,185 |
| 74. | Fennville | 791 | 550,427(0.14%)#74 | 61,755,866(0.00%)#5,267 |
| 75. | Flat Rock | 774 | 550,427(0.14%)#75 | 61,755,866(0.00%)#5,333 |
| 76. | Romulus | 769 | 550,427(0.14%)#76 | 61,755,866(0.00%)#5,351 |
| 77. | Howell | 757 | 550,427(0.14%)#77 | 61,755,866(0.00%)#5,393 |
| 78. | Buena Vista | 736 | 550,427(0.13%)#78 | 61,755,866(0.00%)#5,480 |
| 79. | Monroe | 669 | 550,427(0.12%)#79 | 61,755,866(0.00%)#5,763 |
| 80. | Berkley | 668 | 550,427(0.12%)#80 | 61,755,866(0.00%)#5,765 |
| 81. | Wayne | 663 | 550,427(0.12%)#81 | 61,755,866(0.00%)#5,783 |
| 82. | Eastwood | 663 | 550,427(0.12%)#82 | 61,755,866(0.00%)#5,785 |
| 83. | Tecumseh | 658 | 550,427(0.12%)#83 | 61,755,866(0.00%)#5,807 |
| 84. | Jenison | 655 | 550,427(0.12%)#84 | 61,755,866(0.00%)#5,818 |
| 85. | Birmingham | 651 | 550,427(0.12%)#85 | 61,755,866(0.00%)#5,840 |
| 86. | Temperance | 619 | 550,427(0.11%)#86 | 61,755,866(0.00%)#5,986 |
| 87. | Bridgeport | 611 | 550,427(0.11%)#87 | 61,755,866(0.00%)#6,022 |
| 88. | Northview | 606 | 550,427(0.11%)#88 | 61,755,866(0.00%)#6,048 |
| 89. | Three Rivers | 593 | 550,427(0.11%)#89 | 61,755,866(0.00%)#6,106 |
| 90. | Eastpointe | 585 | 550,427(0.11%)#90 | 61,755,866(0.00%)#6,151 |
| 91. | St Louis | 583 | 550,427(0.11%)#91 | 61,755,866(0.00%)#6,166 |
| 92. | Marquette | 578 | 550,427(0.11%)#92 | 61,755,866(0.00%)#6,190 |
| 93. | Fenton | 570 | 550,427(0.10%)#93 | 61,755,866(0.00%)#6,234 |
| 94. | Charlotte | 568 | 550,427(0.10%)#94 | 61,755,866(0.00%)#6,246 |
| 95. | Grand Haven | 560 | 550,427(0.10%)#95 | 61,755,866(0.00%)#6,293 |
| 96. | Beecher | 546 | 550,427(0.10%)#96 | 61,755,866(0.00%)#6,361 |
| 97. | Traverse City | 544 | 550,427(0.10%)#97 | 61,755,866(0.00%)#6,367 |
| 98. | Niles | 539 | 550,427(0.10%)#98 | 61,755,866(0.00%)#6,397 |
| 99. | Zeeland | 536 | 550,427(0.10%)#99 | 61,755,866(0.00%)#6,422 |
| 100. | Mount Clemens | 523 | 550,427(0.10%)#100 | 61,755,866(0.00%)#6,492 |
Common Questions
What are the Top 10 Cities with the Largest Hispanic or Latino Community in Michigan?
Top 10 Cities with the Largest Hispanic or Latino Community in Michigan are:
#1
48,054
#2
31,593
#3
18,466
#4
14,105
#5
12,786
#6
10,625
#7
8,183
#8
7,273
#9
5,832
#10
5,599
What city has the Largest Hispanic or Latino Community in Michigan?
Detroit has the Largest Hispanic or Latino Community in Michigan with 48,054.
What is the Total Hispanic or Latino Population in the State of Michigan?
Total Hispanic or Latino Population in Michigan is 550,427.
What is the Total Hispanic or Latino Population in the United States?
Total Hispanic or Latino Population in the United States is 61,755,866.