Blandon, PA Map & Demographics
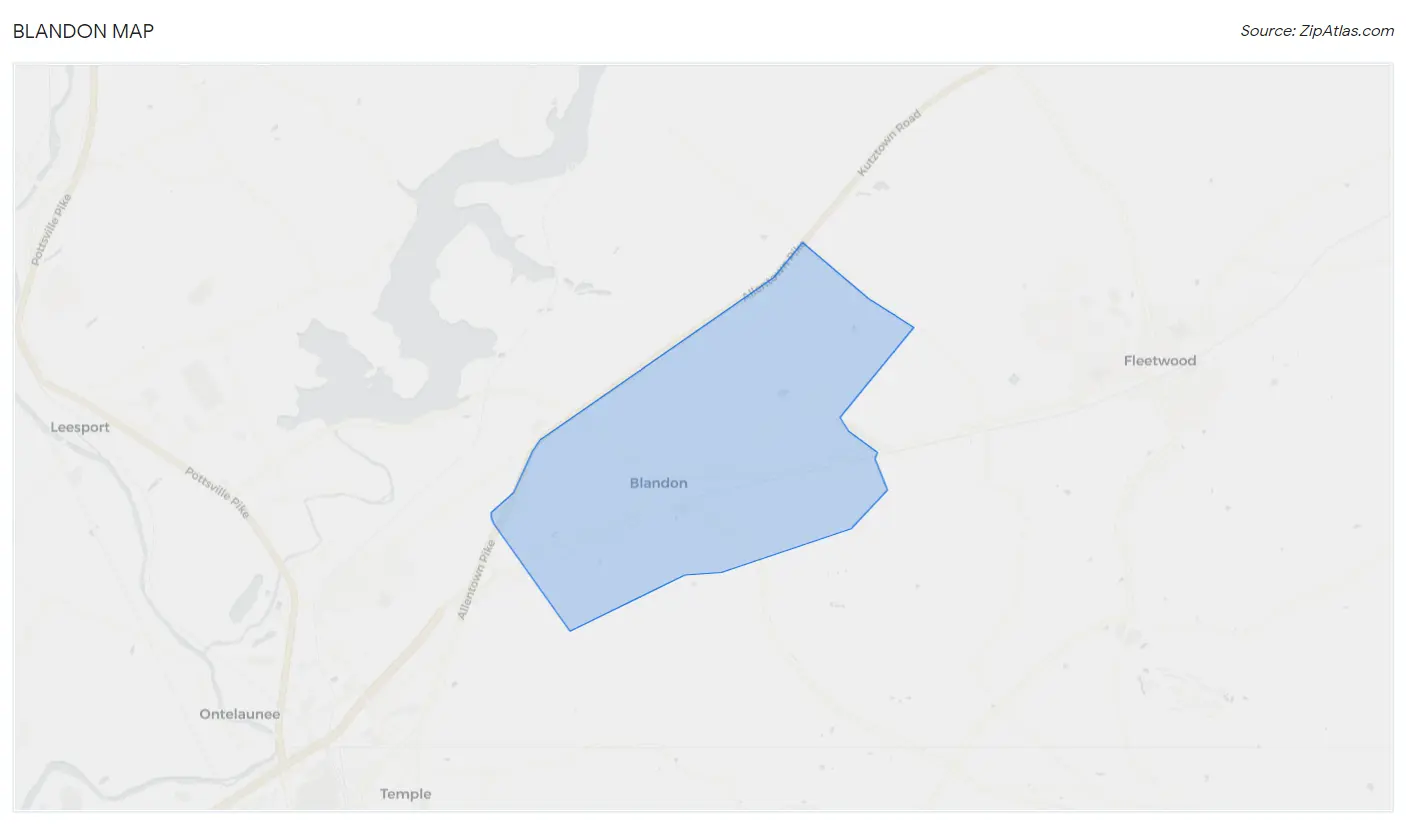
Blandon Map
Blandon Overview
$48,138
PER CAPITA INCOME
$143,125
AVG FAMILY INCOME
$111,292
AVG HOUSEHOLD INCOME
42.3%
WAGE / INCOME GAP [ % ]
57.7¢/ $1
WAGE / INCOME GAP [ $ ]
0.37
INEQUALITY / GINI INDEX
7,484
TOTAL POPULATION
3,878
MALE POPULATION
3,606
FEMALE POPULATION
107.54
MALES / 100 FEMALES
92.99
FEMALES / 100 MALES
45.3
MEDIAN AGE
3.0
AVG FAMILY SIZE
2.6
AVG HOUSEHOLD SIZE
4,427
LABOR FORCE [ PEOPLE ]
72.9%
PERCENT IN LABOR FORCE
1.6%
UNEMPLOYMENT RATE
Blandon Zip Codes
Income in Blandon
Income Overview in Blandon
Per Capita Income in Blandon is $48,138, while median incomes of families and households are $143,125 and $111,292 respectively.
| Characteristic | Number | Measure |
| Per Capita Income | 7,484 | $48,138 |
| Median Family Income | 2,244 | $143,125 |
| Mean Family Income | 2,244 | $142,452 |
| Median Household Income | 2,819 | $111,292 |
| Mean Household Income | 2,819 | $127,844 |
| Income Deficit | 2,244 | $0 |
| Wage / Income Gap (%) | 7,484 | 42.30% |
| Wage / Income Gap ($) | 7,484 | 57.70¢ per $1 |
| Gini / Inequality Index | 7,484 | 0.37 |
Earnings by Sex in Blandon
Average Earnings in Blandon are $50,451, $61,326 for men and $35,388 for women, a difference of 42.3%.
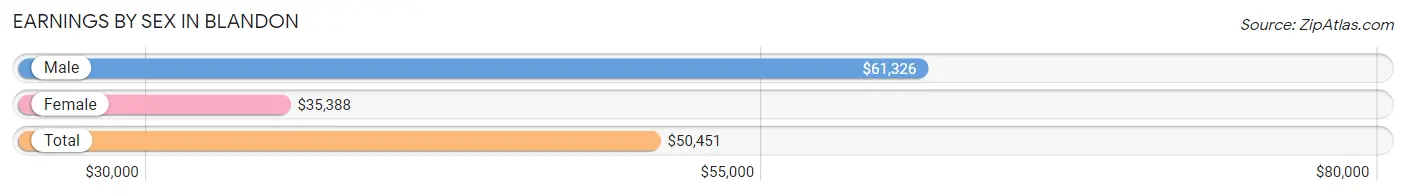
| Sex | Number | Average Earnings |
| Male | 2,573 (54.2%) | $61,326 |
| Female | 2,170 (45.8%) | $35,388 |
| Total | 4,743 (100.0%) | $50,451 |
Earnings by Sex by Income Bracket in Blandon
The most common earnings brackets in Blandon are $100,000+ for men (539 | 20.9%) and $100,000+ for women (272 | 12.5%).
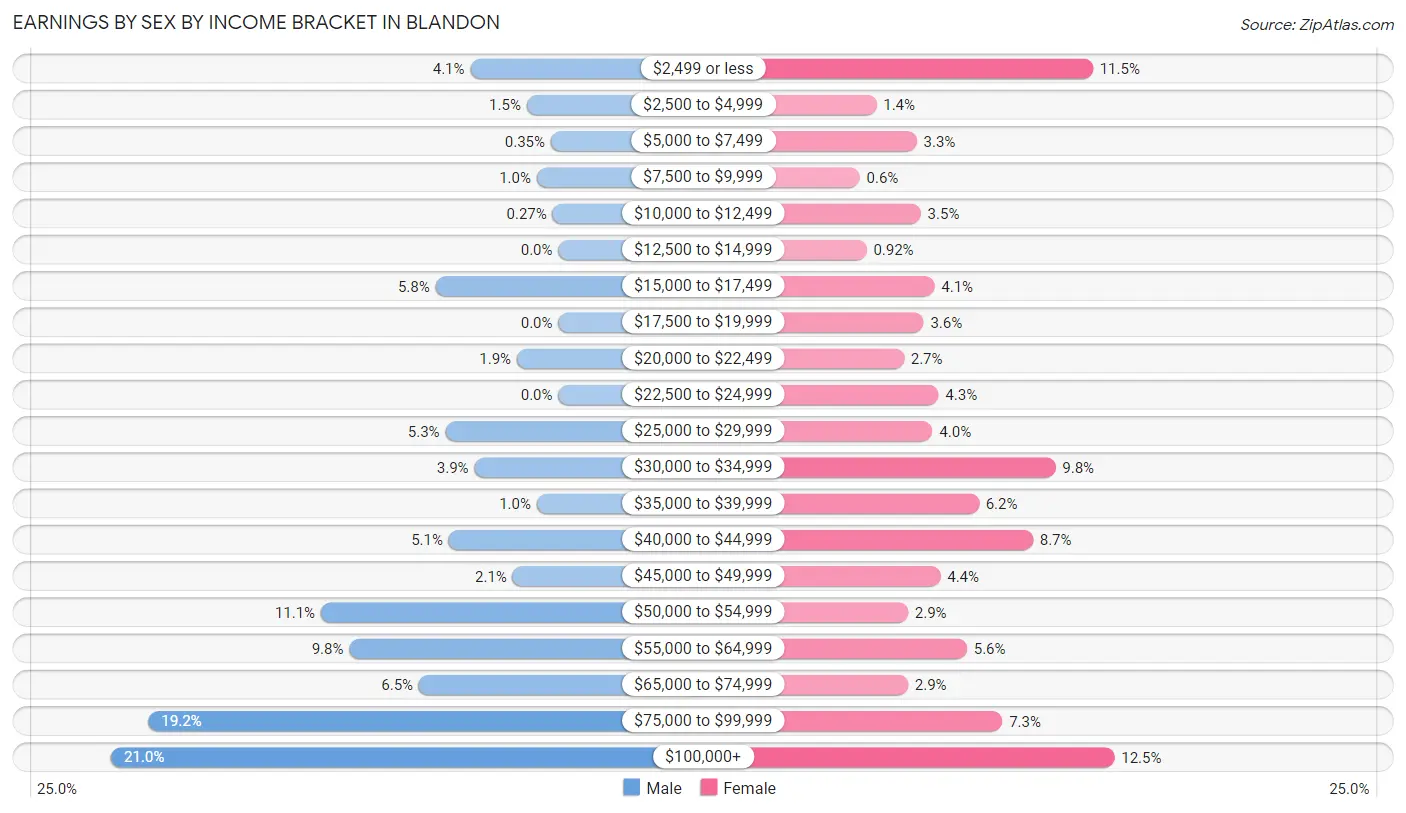
| Income | Male | Female |
| $2,499 or less | 106 (4.1%) | 250 (11.5%) |
| $2,500 to $4,999 | 38 (1.5%) | 30 (1.4%) |
| $5,000 to $7,499 | 9 (0.4%) | 71 (3.3%) |
| $7,500 to $9,999 | 26 (1.0%) | 13 (0.6%) |
| $10,000 to $12,499 | 7 (0.3%) | 75 (3.5%) |
| $12,500 to $14,999 | 0 (0.0%) | 20 (0.9%) |
| $15,000 to $17,499 | 148 (5.8%) | 89 (4.1%) |
| $17,500 to $19,999 | 0 (0.0%) | 78 (3.6%) |
| $20,000 to $22,499 | 50 (1.9%) | 58 (2.7%) |
| $22,500 to $24,999 | 0 (0.0%) | 93 (4.3%) |
| $25,000 to $29,999 | 136 (5.3%) | 87 (4.0%) |
| $30,000 to $34,999 | 101 (3.9%) | 212 (9.8%) |
| $35,000 to $39,999 | 26 (1.0%) | 134 (6.2%) |
| $40,000 to $44,999 | 132 (5.1%) | 189 (8.7%) |
| $45,000 to $49,999 | 55 (2.1%) | 95 (4.4%) |
| $50,000 to $54,999 | 286 (11.1%) | 62 (2.9%) |
| $55,000 to $64,999 | 252 (9.8%) | 122 (5.6%) |
| $65,000 to $74,999 | 168 (6.5%) | 62 (2.9%) |
| $75,000 to $99,999 | 494 (19.2%) | 158 (7.3%) |
| $100,000+ | 539 (20.9%) | 272 (12.5%) |
| Total | 2,573 (100.0%) | 2,170 (100.0%) |
Earnings by Sex by Educational Attainment in Blandon
Average earnings in Blandon are $70,345 for men and $42,780 for women, a difference of 39.2%. Men with an educational attainment of college or associate's degree enjoy the highest average annual earnings of $75,541, while those with bachelor's degree education earn the least with $67,069. Women with an educational attainment of graduate degree earn the most with the average annual earnings of $87,727, while those with less than high school education have the smallest earnings of $23,462.
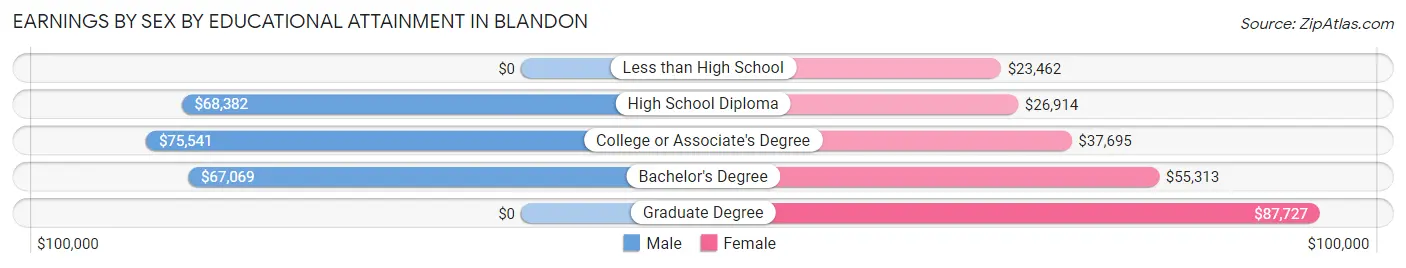
| Educational Attainment | Male Income | Female Income |
| Less than High School | - | - |
| High School Diploma | $68,382 | $26,914 |
| College or Associate's Degree | $75,541 | $37,695 |
| Bachelor's Degree | $67,069 | $55,313 |
| Graduate Degree | - | - |
| Total | $70,345 | $42,780 |
Family Income in Blandon
Family Income Brackets in Blandon
According to the Blandon family income data, there are 552 families falling into the $100,000 to $149,999 income range, which is the most common income bracket and makes up 24.6% of all families.
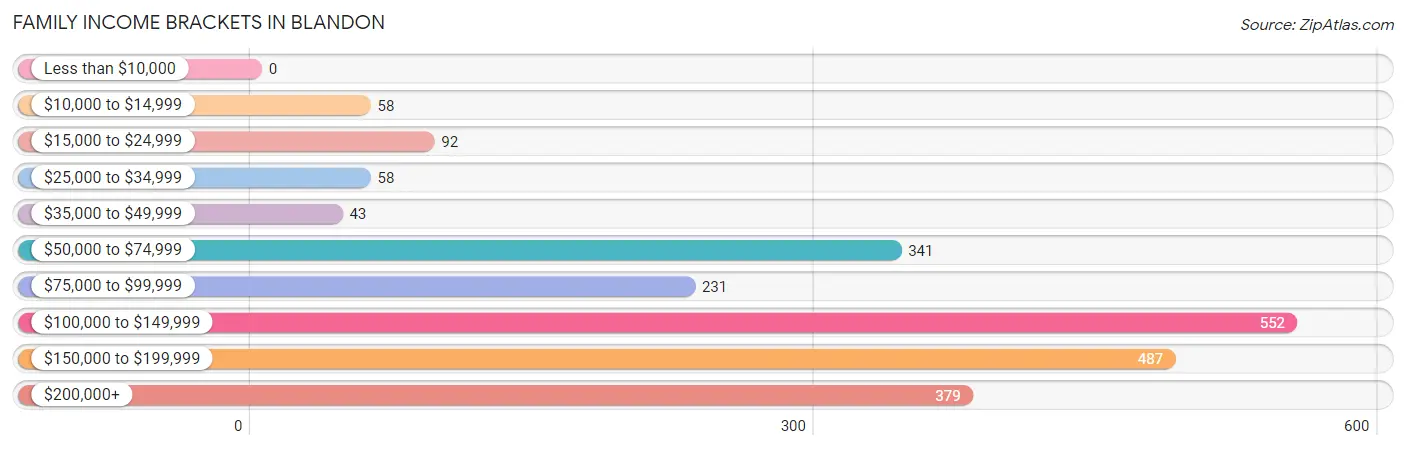
| Income Bracket | # Families | % Families |
| Less than $10,000 | 0 | 0.0% |
| $10,000 to $14,999 | 58 | 2.6% |
| $15,000 to $24,999 | 92 | 4.1% |
| $25,000 to $34,999 | 58 | 2.6% |
| $35,000 to $49,999 | 43 | 1.9% |
| $50,000 to $74,999 | 341 | 15.2% |
| $75,000 to $99,999 | 231 | 10.3% |
| $100,000 to $149,999 | 552 | 24.6% |
| $150,000 to $199,999 | 487 | 21.7% |
| $200,000+ | 379 | 16.9% |
Family Income by Famaliy Size in Blandon
4-person families (502 | 22.4%) account for the highest median family income in Blandon with $160,300 per family, while 2-person families (818 | 36.4%) have the highest median income of $52,621 per family member.
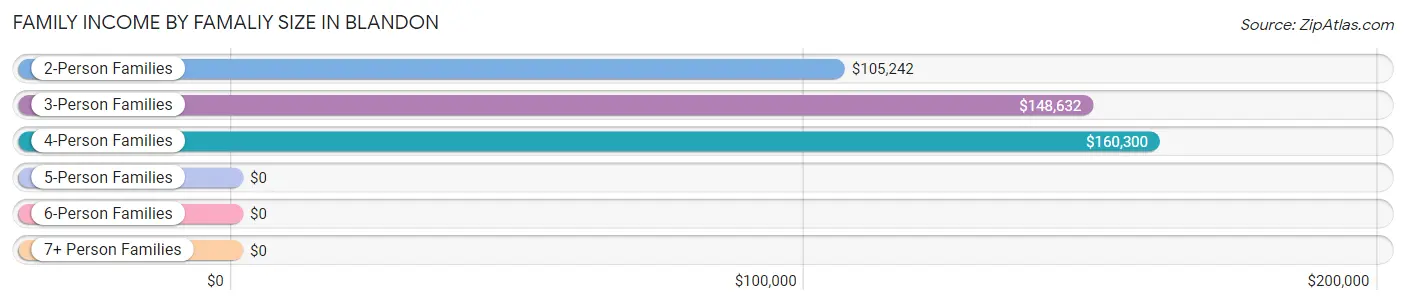
| Income Bracket | # Families | Median Income |
| 2-Person Families | 818 (36.4%) | $105,242 |
| 3-Person Families | 771 (34.4%) | $148,632 |
| 4-Person Families | 502 (22.4%) | $160,300 |
| 5-Person Families | 153 (6.8%) | $0 |
| 6-Person Families | 0 (0.0%) | $0 |
| 7+ Person Families | 0 (0.0%) | $0 |
| Total | 2,244 (100.0%) | $143,125 |
Family Income by Number of Earners in Blandon
The median family income in Blandon is $143,125, with families comprising 2 earners (980) having the highest median family income of $156,128, while families with no earners (224) have the lowest median family income of $51,641, accounting for 43.7% and 10.0% of families, respectively.
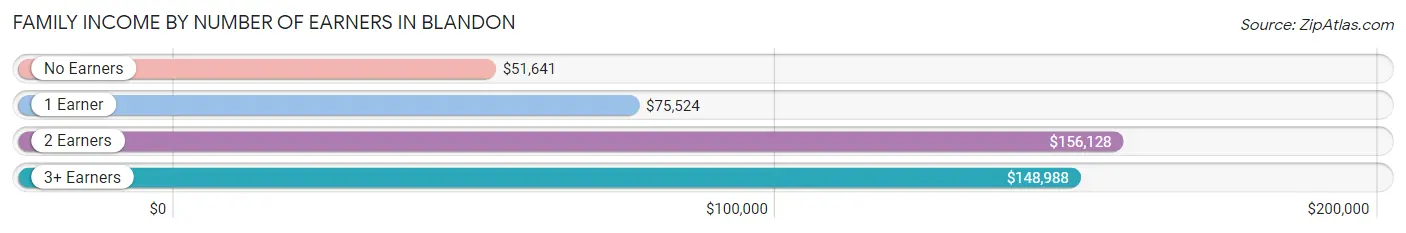
| Number of Earners | # Families | Median Income |
| No Earners | 224 (10.0%) | $51,641 |
| 1 Earner | 413 (18.4%) | $75,524 |
| 2 Earners | 980 (43.7%) | $156,128 |
| 3+ Earners | 627 (27.9%) | $148,988 |
| Total | 2,244 (100.0%) | $143,125 |
Household Income in Blandon
Household Income Brackets in Blandon
With 606 households falling in the category, the $100,000 to $149,999 income range is the most frequent in Blandon, accounting for 21.5% of all households.
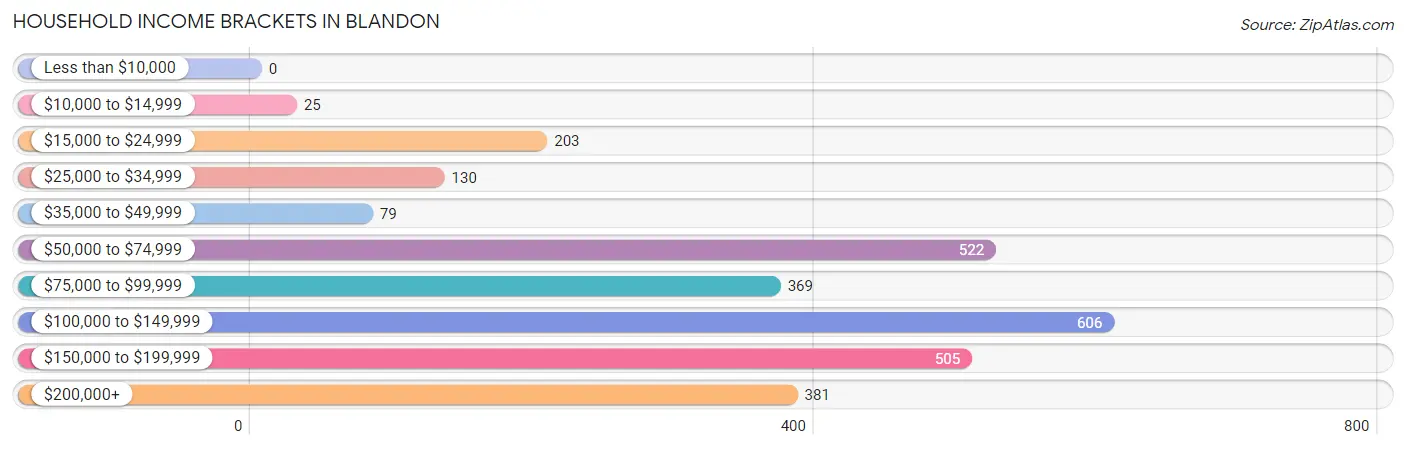
| Income Bracket | # Households | % Households |
| Less than $10,000 | 0 | 0.0% |
| $10,000 to $14,999 | 25 | 0.9% |
| $15,000 to $24,999 | 203 | 7.2% |
| $25,000 to $34,999 | 130 | 4.6% |
| $35,000 to $49,999 | 79 | 2.8% |
| $50,000 to $74,999 | 522 | 18.5% |
| $75,000 to $99,999 | 369 | 13.1% |
| $100,000 to $149,999 | 606 | 21.5% |
| $150,000 to $199,999 | 505 | 17.9% |
| $200,000+ | 381 | 13.5% |
Household Income by Householder Age in Blandon
The median household income in Blandon is $111,292, with the highest median household income of $148,892 found in the 45 to 64 years age bracket for the primary householder. A total of 1,467 households (52.0%) fall into this category.
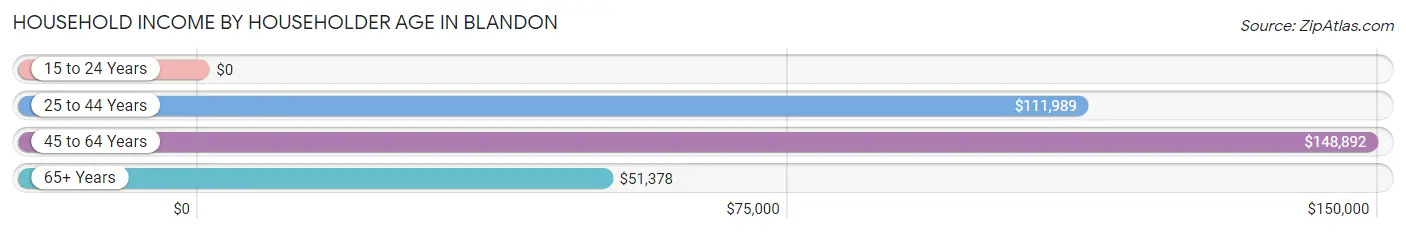
| Income Bracket | # Households | Median Income |
| 15 to 24 Years | 0 (0.0%) | $0 |
| 25 to 44 Years | 631 (22.4%) | $111,989 |
| 45 to 64 Years | 1,467 (52.0%) | $148,892 |
| 65+ Years | 721 (25.6%) | $51,378 |
| Total | 2,819 (100.0%) | $111,292 |
Poverty in Blandon
Income Below Poverty by Sex and Age in Blandon
With 4.4% poverty level for males and 6.6% for females among the residents of Blandon, 75 year old and over males and 5 year old females are the most vulnerable to poverty, with 54 males (24.1%) and 63 females (67.0%) in their respective age groups living below the poverty level.
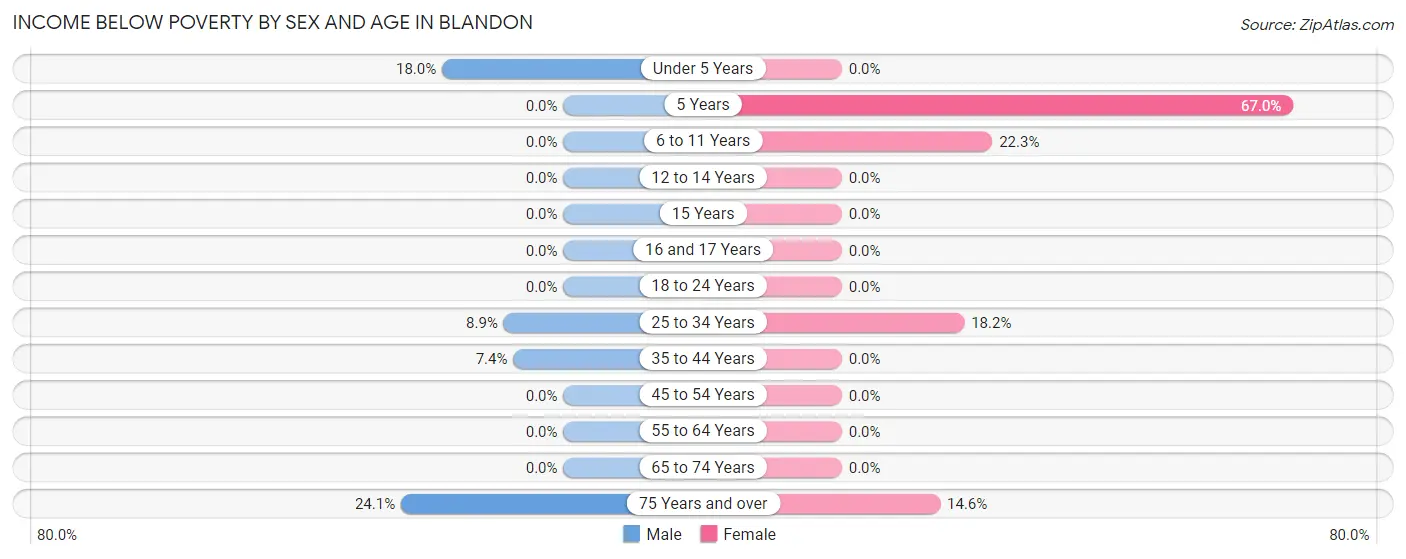
| Age Bracket | Male | Female |
| Under 5 Years | 49 (18.0%) | 0 (0.0%) |
| 5 Years | 0 (0.0%) | 63 (67.0%) |
| 6 to 11 Years | 0 (0.0%) | 61 (22.3%) |
| 12 to 14 Years | 0 (0.0%) | 0 (0.0%) |
| 15 Years | 0 (0.0%) | 0 (0.0%) |
| 16 and 17 Years | 0 (0.0%) | 0 (0.0%) |
| 18 to 24 Years | 0 (0.0%) | 0 (0.0%) |
| 25 to 34 Years | 33 (8.8%) | 80 (18.2%) |
| 35 to 44 Years | 33 (7.4%) | 0 (0.0%) |
| 45 to 54 Years | 0 (0.0%) | 0 (0.0%) |
| 55 to 64 Years | 0 (0.0%) | 0 (0.0%) |
| 65 to 74 Years | 0 (0.0%) | 0 (0.0%) |
| 75 Years and over | 54 (24.1%) | 33 (14.6%) |
| Total | 169 (4.4%) | 237 (6.6%) |
Income Above Poverty by Sex and Age in Blandon
According to the poverty statistics in Blandon, males aged 5 years and females aged under 5 years are the age groups that are most secure financially, with 100.0% of males and 100.0% of females in these age groups living above the poverty line.
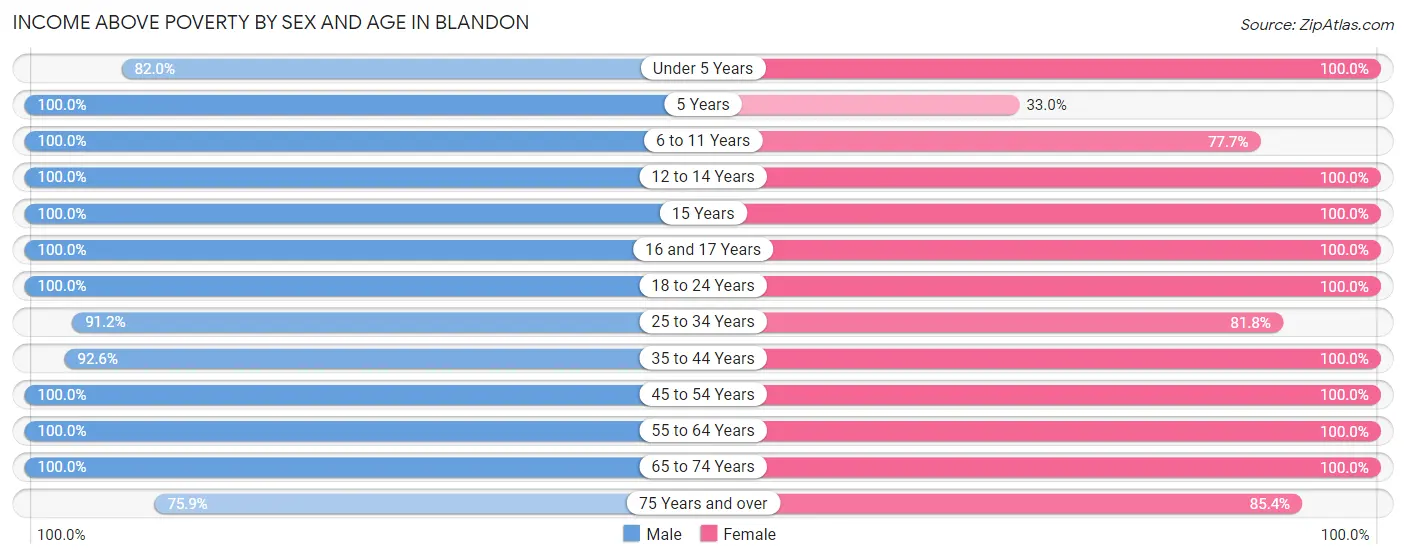
| Age Bracket | Male | Female |
| Under 5 Years | 223 (82.0%) | 59 (100.0%) |
| 5 Years | 13 (100.0%) | 31 (33.0%) |
| 6 to 11 Years | 124 (100.0%) | 212 (77.7%) |
| 12 to 14 Years | 107 (100.0%) | 251 (100.0%) |
| 15 Years | 141 (100.0%) | 45 (100.0%) |
| 16 and 17 Years | 88 (100.0%) | 70 (100.0%) |
| 18 to 24 Years | 224 (100.0%) | 303 (100.0%) |
| 25 to 34 Years | 340 (91.1%) | 360 (81.8%) |
| 35 to 44 Years | 411 (92.6%) | 353 (100.0%) |
| 45 to 54 Years | 824 (100.0%) | 654 (100.0%) |
| 55 to 64 Years | 675 (100.0%) | 526 (100.0%) |
| 65 to 74 Years | 369 (100.0%) | 280 (100.0%) |
| 75 Years and over | 170 (75.9%) | 193 (85.4%) |
| Total | 3,709 (95.6%) | 3,337 (93.4%) |
Income Below Poverty Among Married-Couple Families in Blandon
The poverty statistics for married-couple families in Blandon show that 3.4% or 61 of the total 1,820 families live below the poverty line. Families with 3 or 4 children have the highest poverty rate of 37.5%, comprising of 33 families. On the other hand, families with 1 or 2 children have the lowest poverty rate of 0.0%, which includes 0 families.
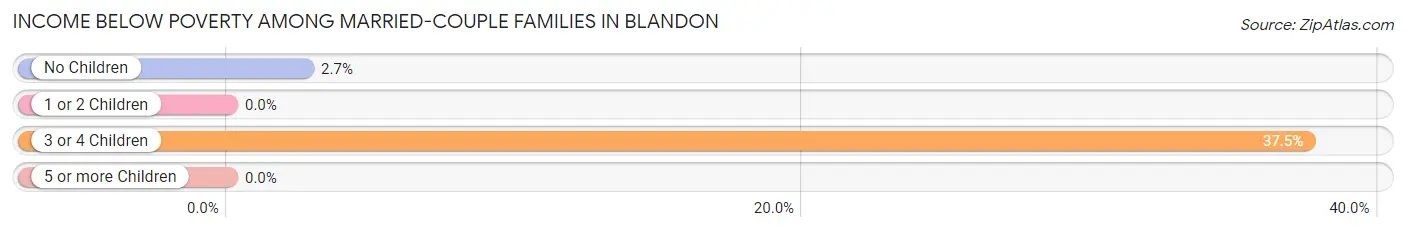
| Children | Above Poverty | Below Poverty |
| No Children | 1,028 (97.4%) | 28 (2.6%) |
| 1 or 2 Children | 676 (100.0%) | 0 (0.0%) |
| 3 or 4 Children | 55 (62.5%) | 33 (37.5%) |
| 5 or more Children | 0 (0.0%) | 0 (0.0%) |
| Total | 1,759 (96.7%) | 61 (3.4%) |
Income Below Poverty Among Single-Parent Households in Blandon
According to the poverty data in Blandon, 9.2% or 26 single-father households and 33.3% or 47 single-mother households are living below the poverty line. Among single-father households, those with no children have the highest poverty rate, with 26 households (9.8%) experiencing poverty. Likewise, among single-mother households, those with 1 or 2 children have the highest poverty rate, with 47 households (42.7%) falling below the poverty line.
| Children | Single Father | Single Mother |
| No Children | 26 (9.8%) | 0 (0.0%) |
| 1 or 2 Children | 0 (0.0%) | 47 (42.7%) |
| 3 or 4 Children | 0 (0.0%) | 0 (0.0%) |
| 5 or more Children | 0 (0.0%) | 0 (0.0%) |
| Total | 26 (9.2%) | 47 (33.3%) |
Income Below Poverty Among Married-Couple vs Single-Parent Households in Blandon
The poverty data for Blandon shows that 61 of the married-couple family households (3.4%) and 73 of the single-parent households (17.2%) are living below the poverty level. Within the married-couple family households, those with 3 or 4 children have the highest poverty rate, with 33 households (37.5%) falling below the poverty line. Among the single-parent households, those with 1 or 2 children have the highest poverty rate, with 47 household (42.7%) living below poverty.
| Children | Married-Couple Families | Single-Parent Households |
| No Children | 28 (2.6%) | 26 (8.8%) |
| 1 or 2 Children | 0 (0.0%) | 47 (42.7%) |
| 3 or 4 Children | 33 (37.5%) | 0 (0.0%) |
| 5 or more Children | 0 (0.0%) | 0 (0.0%) |
| Total | 61 (3.4%) | 73 (17.2%) |
Race in Blandon
The most populous races in Blandon are White / Caucasian (6,519 | 87.1%), Hispanic or Latino (762 | 10.2%), and Some other Race (376 | 5.0%).
| Race | # Population | % Population |
| Asian | 237 | 3.2% |
| Black / African American | 105 | 1.4% |
| Hawaiian / Pacific | 0 | 0.0% |
| Hispanic or Latino | 762 | 10.2% |
| Native / Alaskan | 0 | 0.0% |
| White / Caucasian | 6,519 | 87.1% |
| Two or more Races | 247 | 3.3% |
| Some other Race | 376 | 5.0% |
| Total | 7,484 | 100.0% |
Ancestry in Blandon
The most populous ancestries reported in Blandon are German (2,333 | 31.2%), Italian (1,401 | 18.7%), Polish (1,034 | 13.8%), English (648 | 8.7%), and Irish (608 | 8.1%), together accounting for 80.5% of all Blandon residents.
| Ancestry | # Population | % Population |
| American | 303 | 4.1% |
| British | 101 | 1.3% |
| Central American | 214 | 2.9% |
| Czech | 11 | 0.2% |
| Czechoslovakian | 20 | 0.3% |
| Dominican | 157 | 2.1% |
| Dutch | 76 | 1.0% |
| Eastern European | 74 | 1.0% |
| English | 648 | 8.7% |
| European | 161 | 2.1% |
| Finnish | 18 | 0.2% |
| French | 21 | 0.3% |
| French Canadian | 76 | 1.0% |
| German | 2,333 | 31.2% |
| Hungarian | 340 | 4.5% |
| Irish | 608 | 8.1% |
| Italian | 1,401 | 18.7% |
| Jamaican | 27 | 0.4% |
| Korean | 107 | 1.4% |
| Liberian | 17 | 0.2% |
| Lithuanian | 7 | 0.1% |
| Mexican | 99 | 1.3% |
| Norwegian | 32 | 0.4% |
| Panamanian | 46 | 0.6% |
| Pennsylvania German | 288 | 3.8% |
| Polish | 1,034 | 13.8% |
| Portuguese | 22 | 0.3% |
| Puerto Rican | 286 | 3.8% |
| Russian | 52 | 0.7% |
| Salvadoran | 168 | 2.2% |
| Scottish | 169 | 2.3% |
| Slavic | 22 | 0.3% |
| Slovak | 6 | 0.1% |
| Spanish | 6 | 0.1% |
| Subsaharan African | 26 | 0.4% |
| Thai | 148 | 2.0% |
| Ukrainian | 67 | 0.9% |
| Welsh | 14 | 0.2% | View All 38 Rows |
Immigrants in Blandon
The most numerous immigrant groups reported in Blandon came from Latin America (219 | 2.9%), Central America (138 | 1.8%), Asia (118 | 1.6%), South Eastern Asia (118 | 1.6%), and El Salvador (96 | 1.3%), together accounting for 9.2% of all Blandon residents.
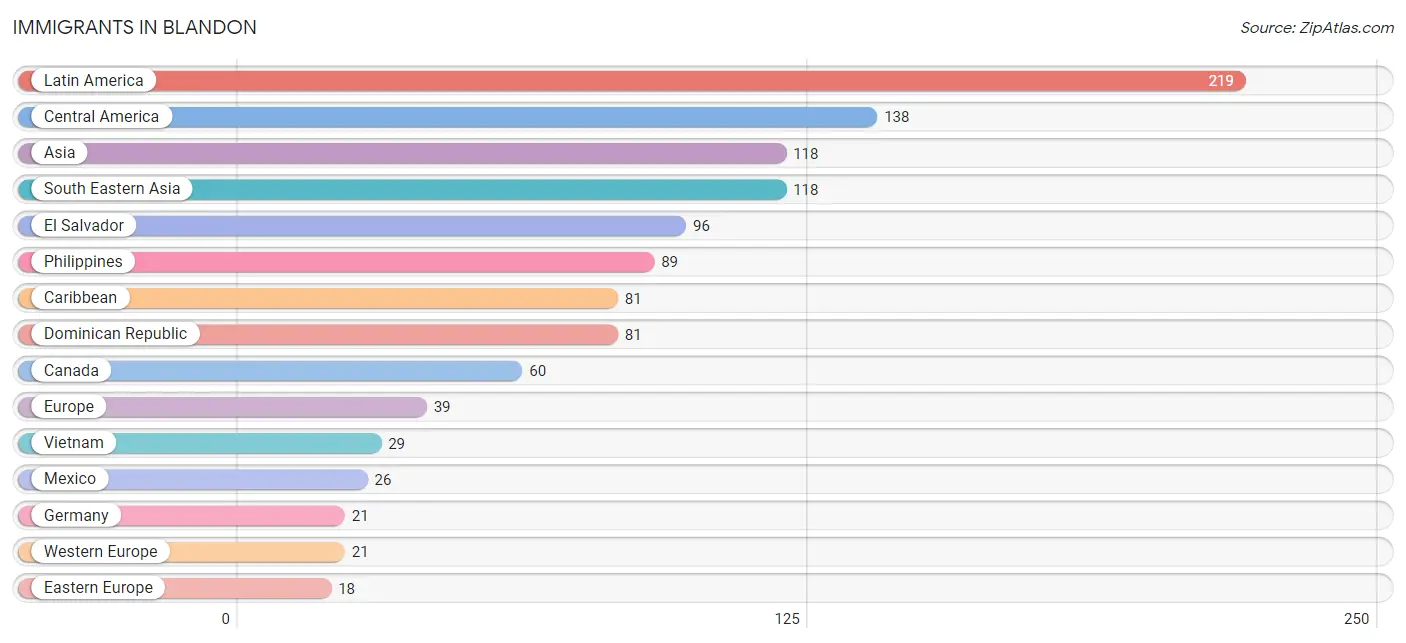
| Immigration Origin | # Population | % Population |
| Africa | 9 | 0.1% |
| Asia | 118 | 1.6% |
| Canada | 60 | 0.8% |
| Caribbean | 81 | 1.1% |
| Central America | 138 | 1.8% |
| Dominican Republic | 81 | 1.1% |
| Eastern Europe | 18 | 0.2% |
| El Salvador | 96 | 1.3% |
| Europe | 39 | 0.5% |
| Germany | 21 | 0.3% |
| Latin America | 219 | 2.9% |
| Mexico | 26 | 0.4% |
| Panama | 16 | 0.2% |
| Philippines | 89 | 1.2% |
| Russia | 18 | 0.2% |
| South Eastern Asia | 118 | 1.6% |
| Vietnam | 29 | 0.4% |
| Western Africa | 9 | 0.1% |
| Western Europe | 21 | 0.3% | View All 19 Rows |
Sex and Age in Blandon
Sex and Age in Blandon
The most populous age groups in Blandon are 45 to 49 Years (522 | 13.5%) for men and 45 to 49 Years (389 | 10.8%) for women.
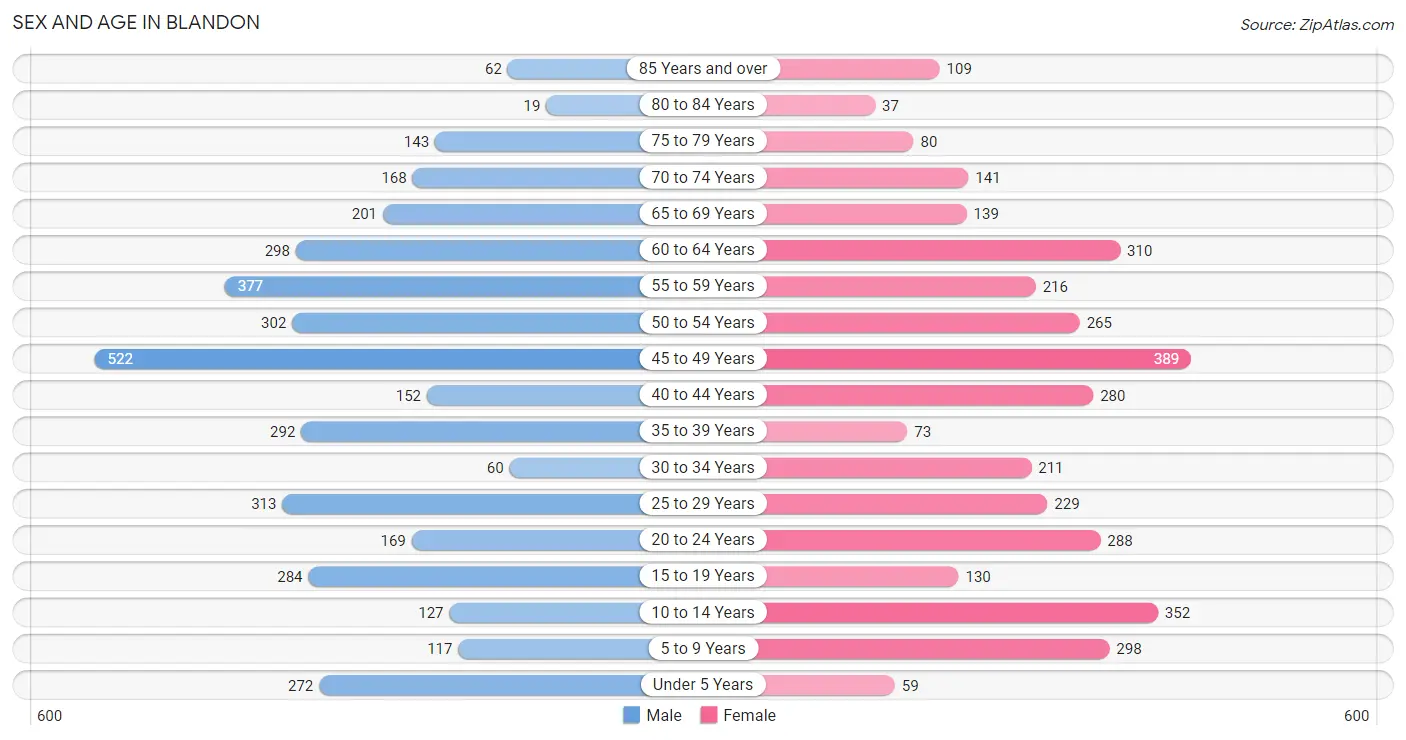
| Age Bracket | Male | Female |
| Under 5 Years | 272 (7.0%) | 59 (1.6%) |
| 5 to 9 Years | 117 (3.0%) | 298 (8.3%) |
| 10 to 14 Years | 127 (3.3%) | 352 (9.8%) |
| 15 to 19 Years | 284 (7.3%) | 130 (3.6%) |
| 20 to 24 Years | 169 (4.4%) | 288 (8.0%) |
| 25 to 29 Years | 313 (8.1%) | 229 (6.4%) |
| 30 to 34 Years | 60 (1.5%) | 211 (5.9%) |
| 35 to 39 Years | 292 (7.5%) | 73 (2.0%) |
| 40 to 44 Years | 152 (3.9%) | 280 (7.8%) |
| 45 to 49 Years | 522 (13.5%) | 389 (10.8%) |
| 50 to 54 Years | 302 (7.8%) | 265 (7.3%) |
| 55 to 59 Years | 377 (9.7%) | 216 (6.0%) |
| 60 to 64 Years | 298 (7.7%) | 310 (8.6%) |
| 65 to 69 Years | 201 (5.2%) | 139 (3.8%) |
| 70 to 74 Years | 168 (4.3%) | 141 (3.9%) |
| 75 to 79 Years | 143 (3.7%) | 80 (2.2%) |
| 80 to 84 Years | 19 (0.5%) | 37 (1.0%) |
| 85 Years and over | 62 (1.6%) | 109 (3.0%) |
| Total | 3,878 (100.0%) | 3,606 (100.0%) |
Families and Households in Blandon
Median Family Size in Blandon
The median family size in Blandon is 3.00 persons per family, with married-couple families (1,820 | 81.1%) accounting for the largest median family size of 3.06 persons per family. On the other hand, single male/father families (283 | 12.6%) represent the smallest median family size with 2.67 persons per family.
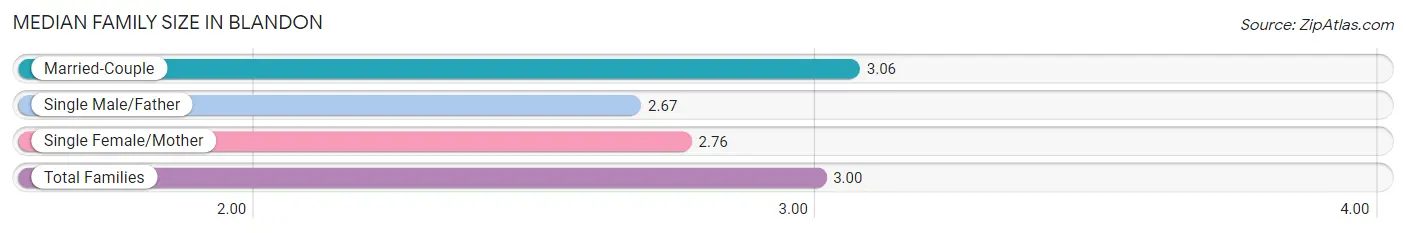
| Family Type | # Families | Family Size |
| Married-Couple | 1,820 (81.1%) | 3.06 |
| Single Male/Father | 283 (12.6%) | 2.67 |
| Single Female/Mother | 141 (6.3%) | 2.76 |
| Total Families | 2,244 (100.0%) | 3.00 |
Median Household Size in Blandon
The median household size in Blandon is 2.65 persons per household, with single female/mother households (141 | 5.0%) accounting for the largest median household size of 3.45 persons per household. non-family households (575 | 20.4%) represent the smallest median household size with 1.15 persons per household.
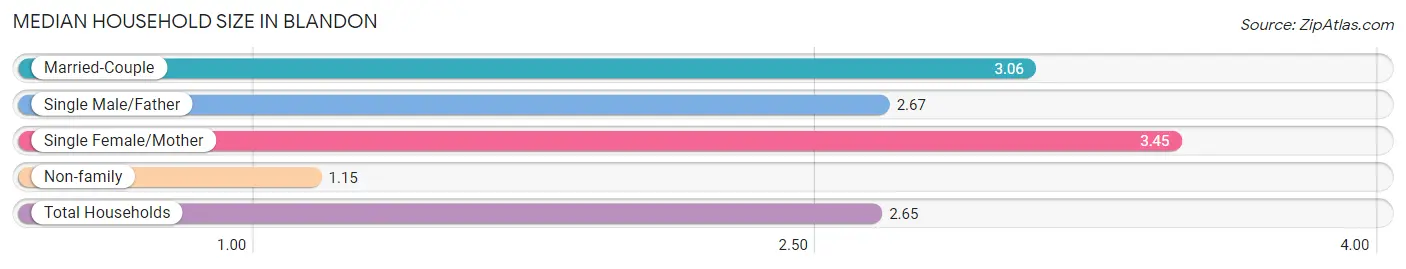
| Household Type | # Households | Household Size |
| Married-Couple | 1,820 (64.6%) | 3.06 |
| Single Male/Father | 283 (10.0%) | 2.67 |
| Single Female/Mother | 141 (5.0%) | 3.45 |
| Non-family | 575 (20.4%) | 1.15 |
| Total Households | 2,819 (100.0%) | 2.65 |
Household Size by Marriage Status in Blandon
Out of a total of 2,819 households in Blandon, 2,244 (79.6%) are family households, while 575 (20.4%) are nonfamily households. The most numerous type of family households are 2-person households, comprising 818, and the most common type of nonfamily households are 1-person households, comprising 516.
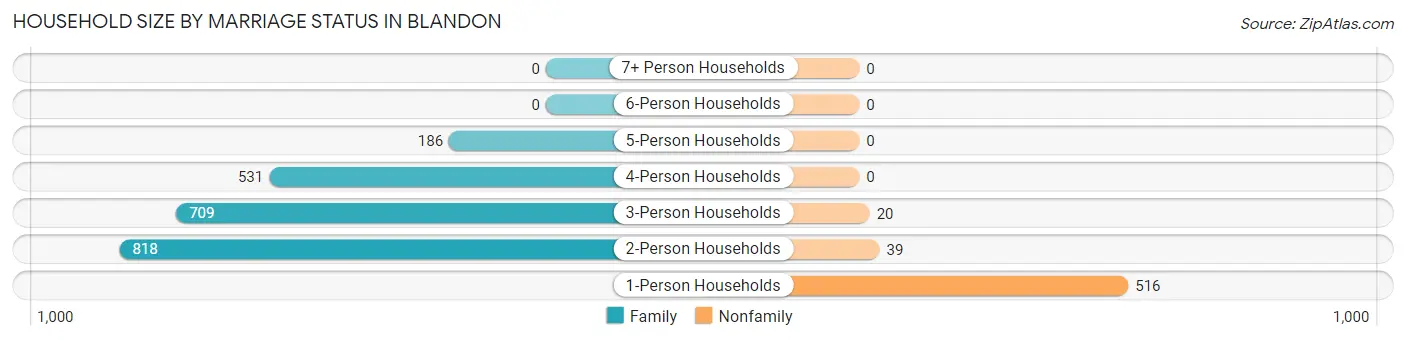
| Household Size | Family Households | Nonfamily Households |
| 1-Person Households | - | 516 (18.3%) |
| 2-Person Households | 818 (29.0%) | 39 (1.4%) |
| 3-Person Households | 709 (25.2%) | 20 (0.7%) |
| 4-Person Households | 531 (18.8%) | 0 (0.0%) |
| 5-Person Households | 186 (6.6%) | 0 (0.0%) |
| 6-Person Households | 0 (0.0%) | 0 (0.0%) |
| 7+ Person Households | 0 (0.0%) | 0 (0.0%) |
| Total | 2,244 (79.6%) | 575 (20.4%) |
Female Fertility in Blandon
Fertility by Age in Blandon
Average fertility rate in Blandon is 38.0 births per 1,000 women. Women in the age bracket of 20 to 34 years have the highest fertility rate with 88.0 births per 1,000 women. Women in the age bracket of 20 to 34 years acount for 100.0% of all women with births.
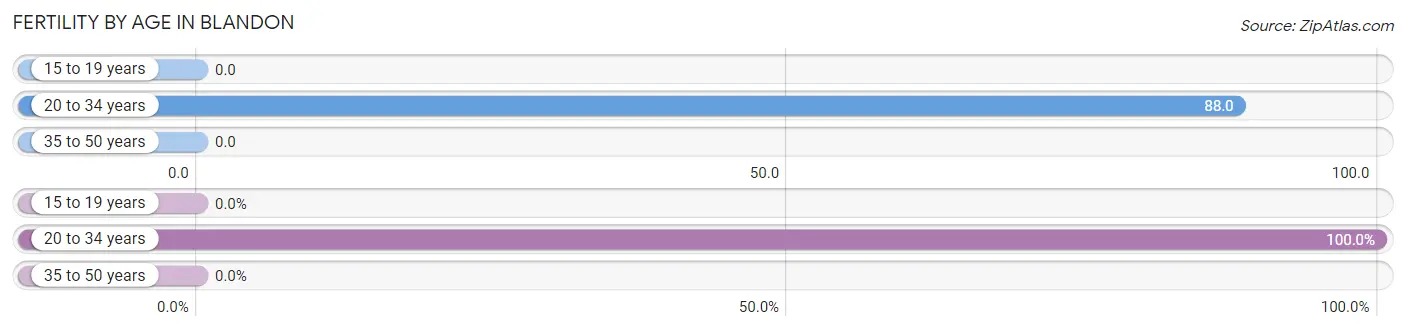
| Age Bracket | Women with Births | Births / 1,000 Women |
| 15 to 19 years | 0 (0.0%) | 0.0 |
| 20 to 34 years | 64 (100.0%) | 88.0 |
| 35 to 50 years | 0 (0.0%) | 0.0 |
| Total | 64 (100.0%) | 38.0 |
Fertility by Age by Marriage Status in Blandon
48.4% of women with births (64) in Blandon are married. The highest percentage of unmarried women with births falls into 20 to 34 years age bracket with 51.6% of them unmarried at the time of birth, while the lowest percentage of unmarried women with births belong to 20 to 34 years age bracket with 51.6% of them unmarried.
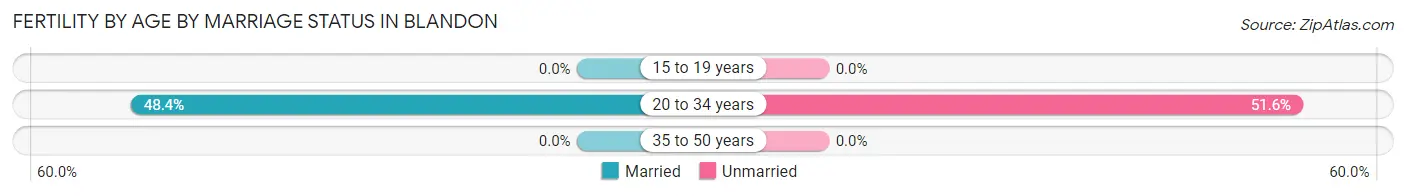
| Age Bracket | Married | Unmarried |
| 15 to 19 years | 0 (0.0%) | 0 (0.0%) |
| 20 to 34 years | 31 (48.4%) | 33 (51.6%) |
| 35 to 50 years | 0 (0.0%) | 0 (0.0%) |
| Total | 31 (48.4%) | 33 (51.6%) |
Fertility by Education in Blandon
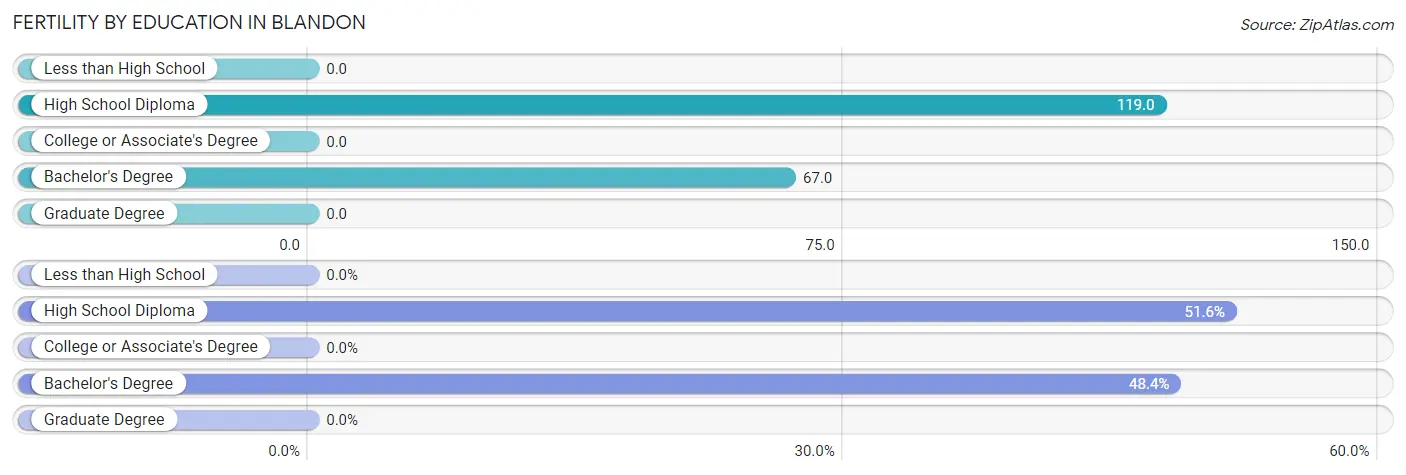
| Educational Attainment | Women with Births | Births / 1,000 Women |
| Less than High School | 0 (0.0%) | 0.0 |
| High School Diploma | 33 (51.6%) | 119.0 |
| College or Associate's Degree | 0 (0.0%) | 0.0 |
| Bachelor's Degree | 31 (48.4%) | 67.0 |
| Graduate Degree | 0 (0.0%) | 0.0 |
| Total | 64 (100.0%) | 38.0 |
Fertility by Education by Marriage Status in Blandon
51.6% of women with births in Blandon are unmarried. Women with the educational attainment of bachelor's degree are most likely to be married with 100.0% of them married at childbirth, while women with the educational attainment of high school diploma are least likely to be married with 100.0% of them unmarried at childbirth.
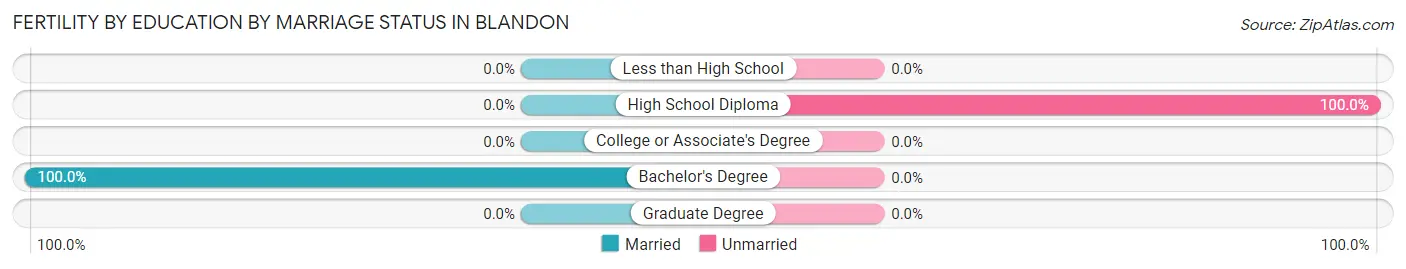
| Educational Attainment | Married | Unmarried |
| Less than High School | 0 (0.0%) | 0 (0.0%) |
| High School Diploma | 0 (0.0%) | 33 (100.0%) |
| College or Associate's Degree | 0 (0.0%) | 0 (0.0%) |
| Bachelor's Degree | 31 (100.0%) | 0 (0.0%) |
| Graduate Degree | 0 (0.0%) | 0 (0.0%) |
| Total | 31 (48.4%) | 33 (51.6%) |
Employment Characteristics in Blandon
Employment by Class of Employer in Blandon
Among the 4,304 employed individuals in Blandon, private company employees (3,076 | 71.5%), not-for-profit organizations (481 | 11.2%), and self-employed (not incorporated) (245 | 5.7%) make up the most common classes of employment.
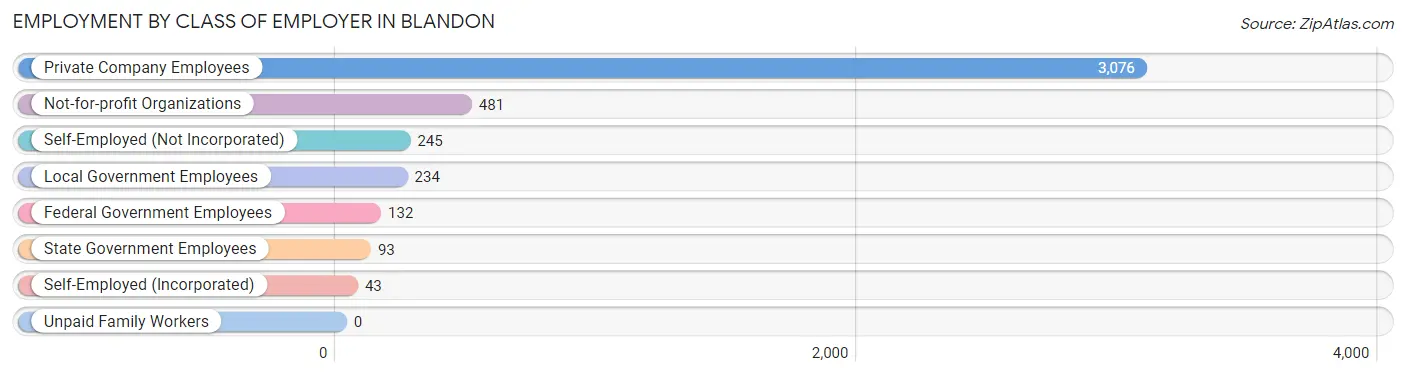
| Employer Class | # Employees | % Employees |
| Private Company Employees | 3,076 | 71.5% |
| Self-Employed (Incorporated) | 43 | 1.0% |
| Self-Employed (Not Incorporated) | 245 | 5.7% |
| Not-for-profit Organizations | 481 | 11.2% |
| Local Government Employees | 234 | 5.4% |
| State Government Employees | 93 | 2.2% |
| Federal Government Employees | 132 | 3.1% |
| Unpaid Family Workers | 0 | 0.0% |
| Total | 4,304 | 100.0% |
Employment Status by Age in Blandon
According to the labor force statistics for Blandon, out of the total population over 16 years of age (6,073), 72.9% or 4,427 individuals are in the labor force, with 1.6% or 71 of them unemployed. The age group with the highest labor force participation rate is 45 to 54 years, with 94.7% or 1,400 individuals in the labor force. Within the labor force, the 25 to 29 years age range has the highest percentage of unemployed individuals, with 4.9% or 22 of them being unemployed.
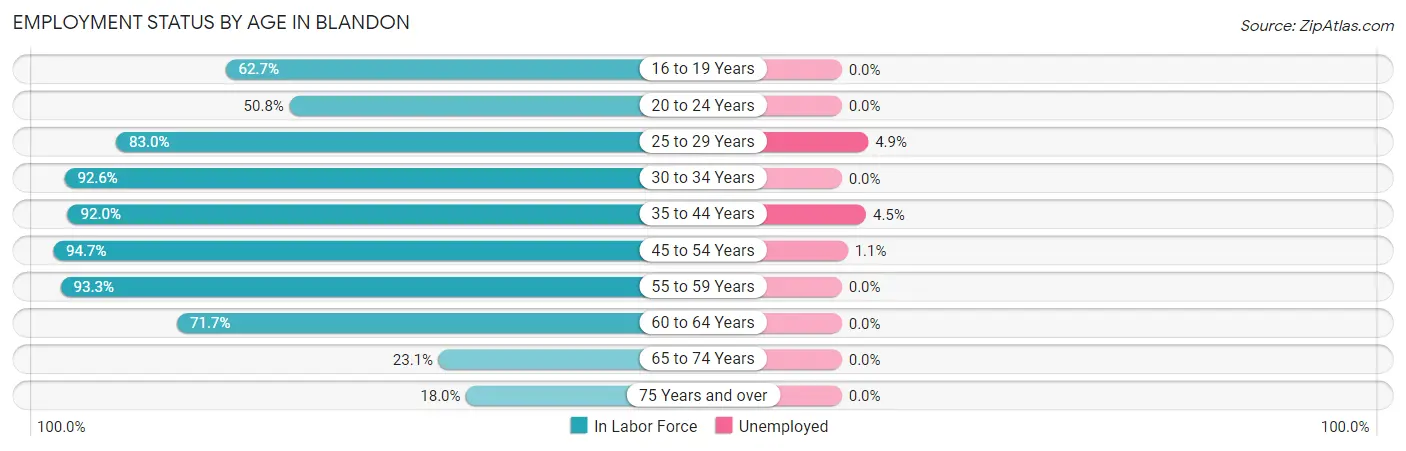
| Age Bracket | In Labor Force | Unemployed |
| 16 to 19 Years | 143 (62.7%) | 0 (0.0%) |
| 20 to 24 Years | 232 (50.8%) | 0 (0.0%) |
| 25 to 29 Years | 450 (83.0%) | 22 (4.9%) |
| 30 to 34 Years | 251 (92.6%) | 0 (0.0%) |
| 35 to 44 Years | 733 (92.0%) | 33 (4.5%) |
| 45 to 54 Years | 1,400 (94.7%) | 15 (1.1%) |
| 55 to 59 Years | 553 (93.3%) | 0 (0.0%) |
| 60 to 64 Years | 436 (71.7%) | 0 (0.0%) |
| 65 to 74 Years | 150 (23.1%) | 0 (0.0%) |
| 75 Years and over | 81 (18.0%) | 0 (0.0%) |
| Total | 4,427 (72.9%) | 71 (1.6%) |
Employment Status by Educational Attainment in Blandon
According to labor force statistics for Blandon, 89.1% of individuals (3,821) out of the total population between 25 and 64 years of age (4,289) are in the labor force, with 1.8% or 69 of them being unemployed. The group with the highest labor force participation rate are those with the educational attainment of college / associate degree, with 94.5% or 1,169 individuals in the labor force. Within the labor force, individuals with high school diploma education have the highest percentage of unemployment, with 2.8% or 33 of them being unemployed.
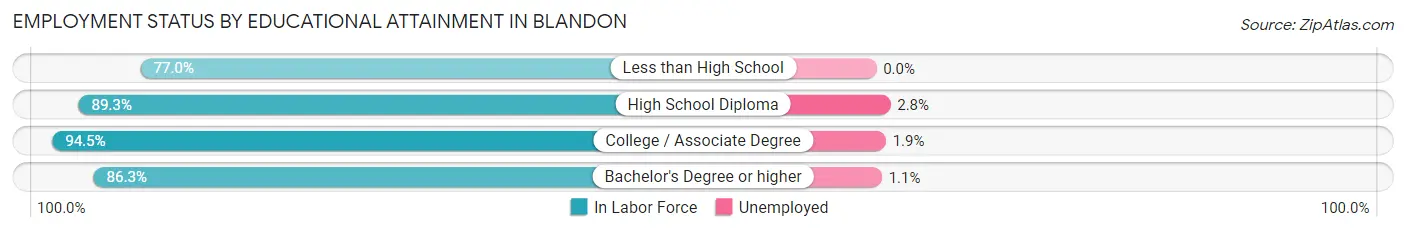
| Educational Attainment | In Labor Force | Unemployed |
| Less than High School | 171 (77.0%) | 0 (0.0%) |
| High School Diploma | 1,173 (89.3%) | 37 (2.8%) |
| College / Associate Degree | 1,169 (94.5%) | 24 (1.9%) |
| Bachelor's Degree or higher | 1,308 (86.3%) | 17 (1.1%) |
| Total | 3,821 (89.1%) | 77 (1.8%) |
Employment Occupations by Sex in Blandon
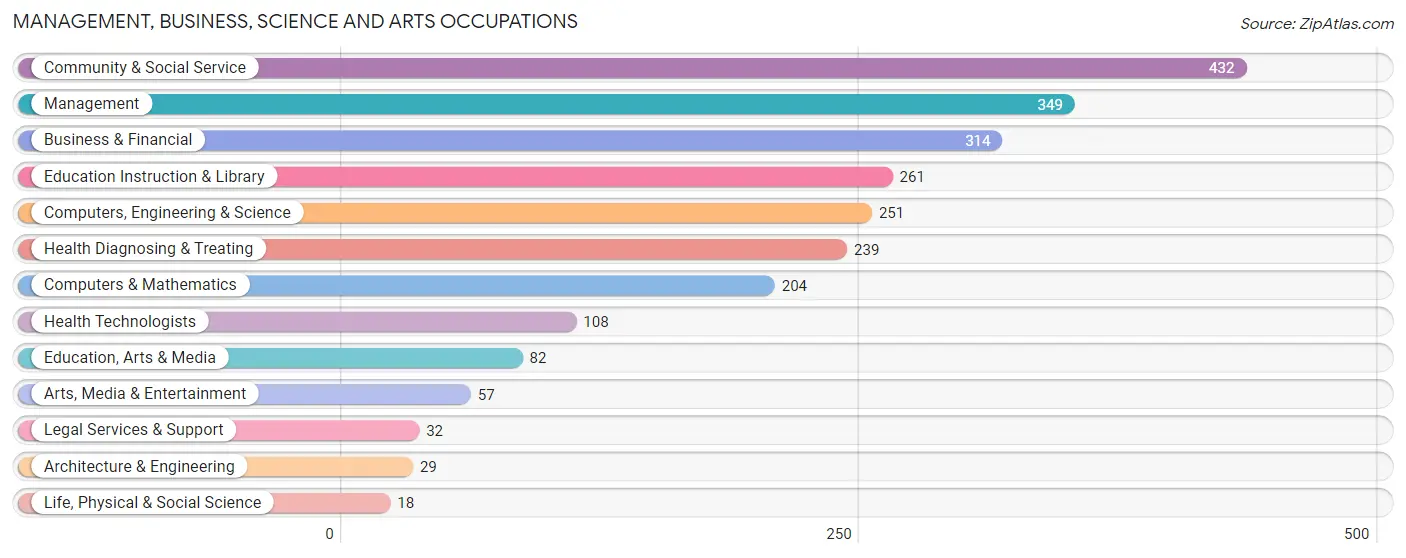
Management, Business, Science and Arts Occupations
The most common Management, Business, Science and Arts occupations in Blandon are Community & Social Service (432 | 9.9%), Management (349 | 8.0%), Business & Financial (314 | 7.2%), Education Instruction & Library (261 | 6.0%), and Computers, Engineering & Science (251 | 5.8%).
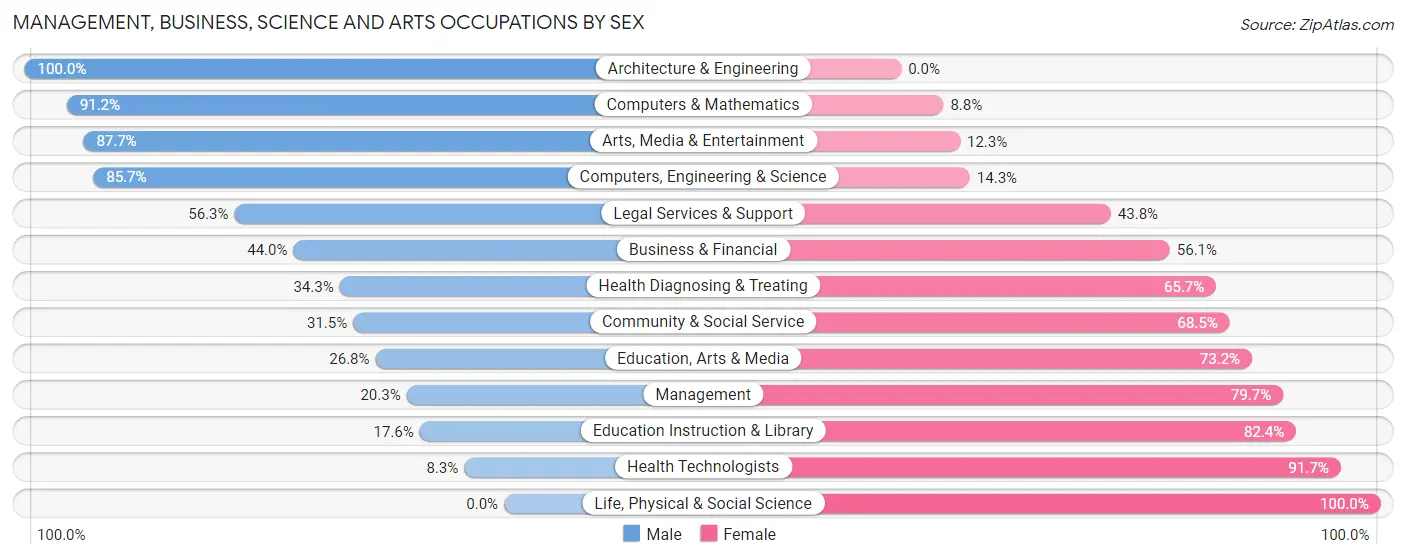
Management, Business, Science and Arts Occupations by Sex
Within the Management, Business, Science and Arts occupations in Blandon, the most male-oriented occupations are Architecture & Engineering (100.0%), Computers & Mathematics (91.2%), and Arts, Media & Entertainment (87.7%), while the most female-oriented occupations are Life, Physical & Social Science (100.0%), Health Technologists (91.7%), and Education Instruction & Library (82.4%).
| Occupation | Male | Female |
| Management | 71 (20.3%) | 278 (79.7%) |
| Business & Financial | 138 (44.0%) | 176 (56.0%) |
| Computers, Engineering & Science | 215 (85.7%) | 36 (14.3%) |
| Computers & Mathematics | 186 (91.2%) | 18 (8.8%) |
| Architecture & Engineering | 29 (100.0%) | 0 (0.0%) |
| Life, Physical & Social Science | 0 (0.0%) | 18 (100.0%) |
| Community & Social Service | 136 (31.5%) | 296 (68.5%) |
| Education, Arts & Media | 22 (26.8%) | 60 (73.2%) |
| Legal Services & Support | 18 (56.2%) | 14 (43.8%) |
| Education Instruction & Library | 46 (17.6%) | 215 (82.4%) |
| Arts, Media & Entertainment | 50 (87.7%) | 7 (12.3%) |
| Health Diagnosing & Treating | 82 (34.3%) | 157 (65.7%) |
| Health Technologists | 9 (8.3%) | 99 (91.7%) |
| Total (Category) | 642 (40.5%) | 943 (59.5%) |
| Total (Overall) | 2,464 (56.5%) | 1,894 (43.5%) |
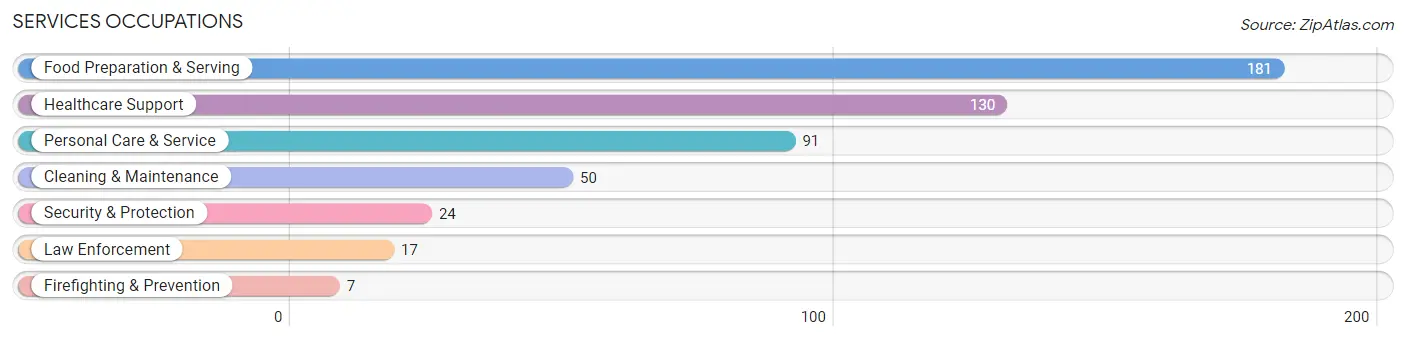
Services Occupations
The most common Services occupations in Blandon are Food Preparation & Serving (181 | 4.2%), Healthcare Support (130 | 3.0%), Personal Care & Service (91 | 2.1%), Cleaning & Maintenance (50 | 1.1%), and Security & Protection (24 | 0.5%).
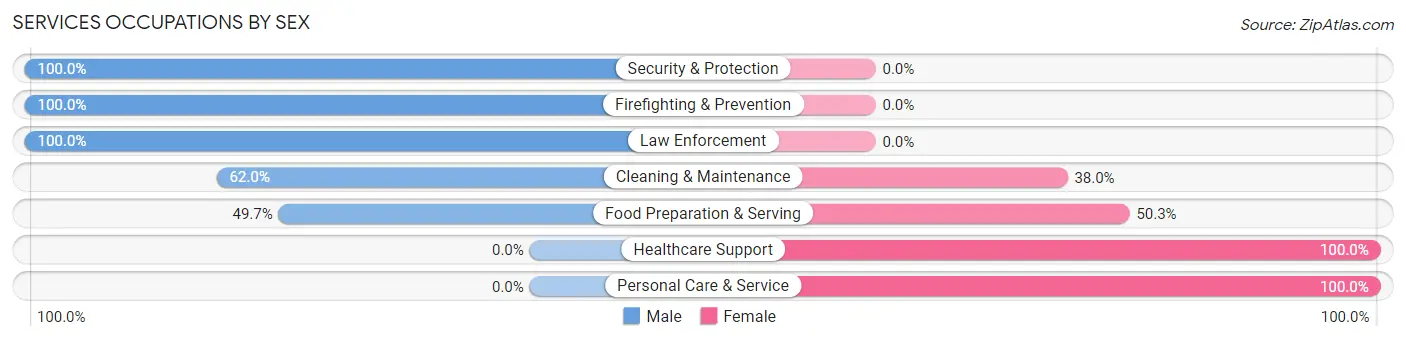
Services Occupations by Sex
Within the Services occupations in Blandon, the most male-oriented occupations are Security & Protection (100.0%), Firefighting & Prevention (100.0%), and Law Enforcement (100.0%), while the most female-oriented occupations are Healthcare Support (100.0%), Personal Care & Service (100.0%), and Food Preparation & Serving (50.3%).
| Occupation | Male | Female |
| Healthcare Support | 0 (0.0%) | 130 (100.0%) |
| Security & Protection | 24 (100.0%) | 0 (0.0%) |
| Firefighting & Prevention | 7 (100.0%) | 0 (0.0%) |
| Law Enforcement | 17 (100.0%) | 0 (0.0%) |
| Food Preparation & Serving | 90 (49.7%) | 91 (50.3%) |
| Cleaning & Maintenance | 31 (62.0%) | 19 (38.0%) |
| Personal Care & Service | 0 (0.0%) | 91 (100.0%) |
| Total (Category) | 145 (30.5%) | 331 (69.5%) |
| Total (Overall) | 2,464 (56.5%) | 1,894 (43.5%) |
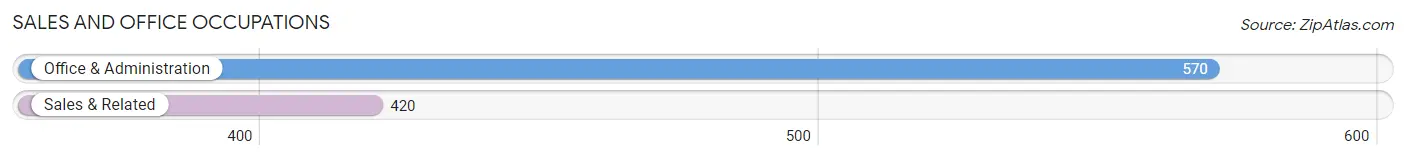
Sales and Office Occupations
The most common Sales and Office occupations in Blandon are Office & Administration (570 | 13.1%), and Sales & Related (420 | 9.6%).
Sales and Office Occupations by Sex
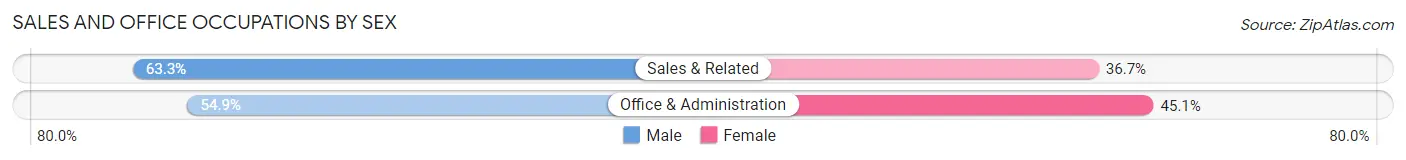
| Occupation | Male | Female |
| Sales & Related | 266 (63.3%) | 154 (36.7%) |
| Office & Administration | 313 (54.9%) | 257 (45.1%) |
| Total (Category) | 579 (58.5%) | 411 (41.5%) |
| Total (Overall) | 2,464 (56.5%) | 1,894 (43.5%) |
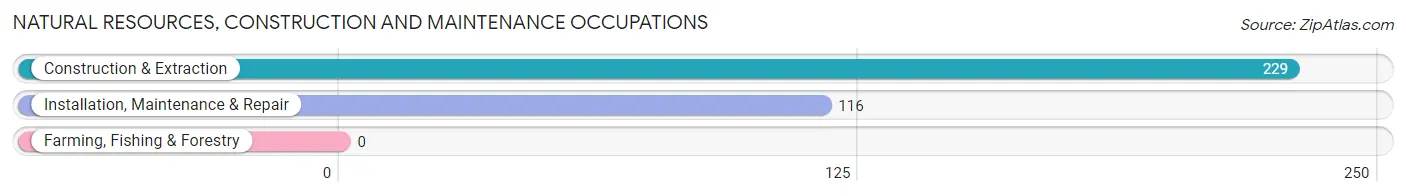
Natural Resources, Construction and Maintenance Occupations
The most common Natural Resources, Construction and Maintenance occupations in Blandon are Construction & Extraction (229 | 5.2%), and Installation, Maintenance & Repair (116 | 2.7%).
Natural Resources, Construction and Maintenance Occupations by Sex
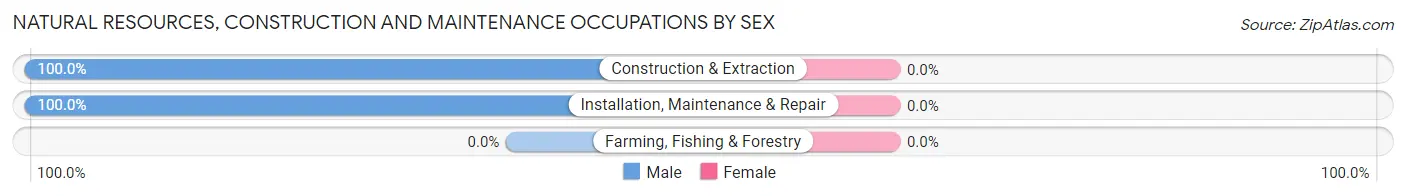
| Occupation | Male | Female |
| Farming, Fishing & Forestry | 0 (0.0%) | 0 (0.0%) |
| Construction & Extraction | 229 (100.0%) | 0 (0.0%) |
| Installation, Maintenance & Repair | 116 (100.0%) | 0 (0.0%) |
| Total (Category) | 345 (100.0%) | 0 (0.0%) |
| Total (Overall) | 2,464 (56.5%) | 1,894 (43.5%) |
Production, Transportation and Moving Occupations
The most common Production, Transportation and Moving occupations in Blandon are Material Moving (558 | 12.8%), Production (216 | 5.0%), and Transportation (188 | 4.3%).
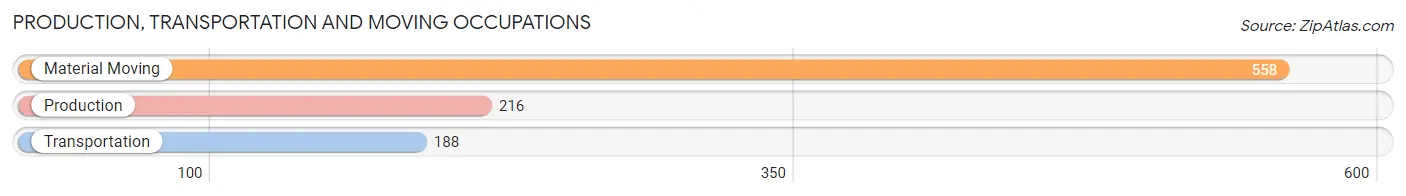
Production, Transportation and Moving Occupations by Sex
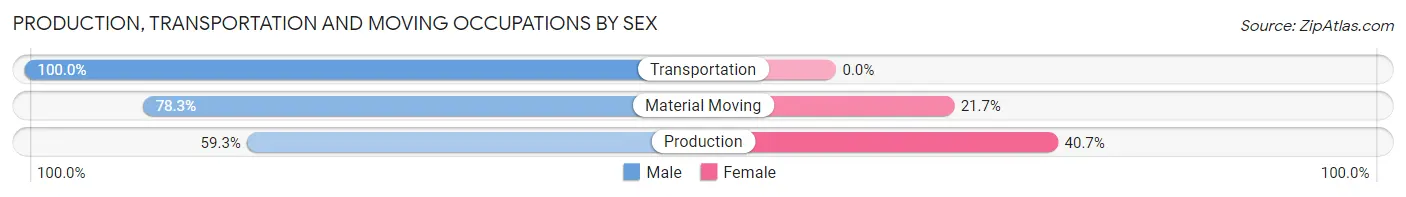
| Occupation | Male | Female |
| Production | 128 (59.3%) | 88 (40.7%) |
| Transportation | 188 (100.0%) | 0 (0.0%) |
| Material Moving | 437 (78.3%) | 121 (21.7%) |
| Total (Category) | 753 (78.3%) | 209 (21.7%) |
| Total (Overall) | 2,464 (56.5%) | 1,894 (43.5%) |
Employment Industries by Sex in Blandon
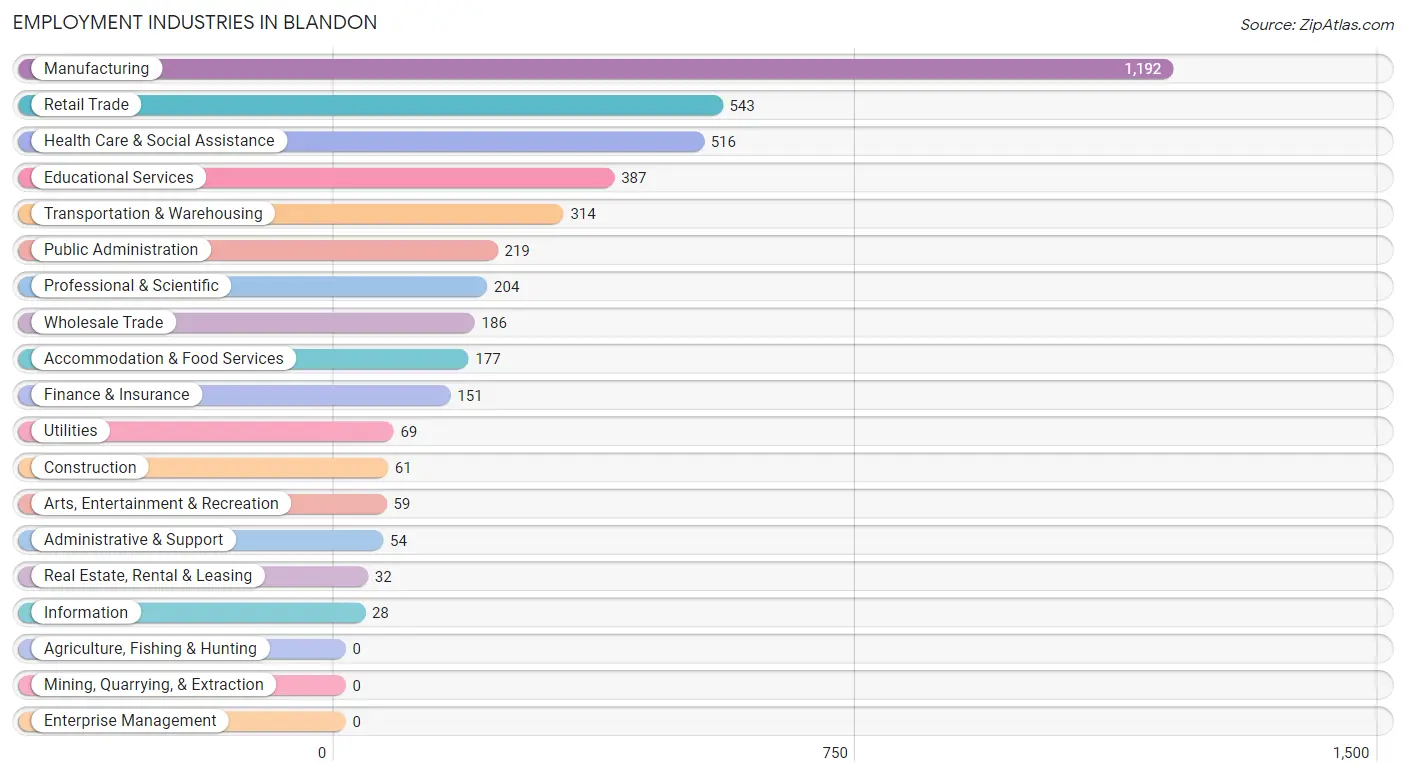
Employment Industries in Blandon
The major employment industries in Blandon include Manufacturing (1,192 | 27.4%), Retail Trade (543 | 12.5%), Health Care & Social Assistance (516 | 11.8%), Educational Services (387 | 8.9%), and Transportation & Warehousing (314 | 7.2%).
Employment Industries by Sex in Blandon
The Blandon industries that see more men than women are Construction (100.0%), Wholesale Trade (100.0%), and Utilities (100.0%), whereas the industries that tend to have a higher number of women are Information (100.0%), Finance & Insurance (88.7%), and Health Care & Social Assistance (81.6%).
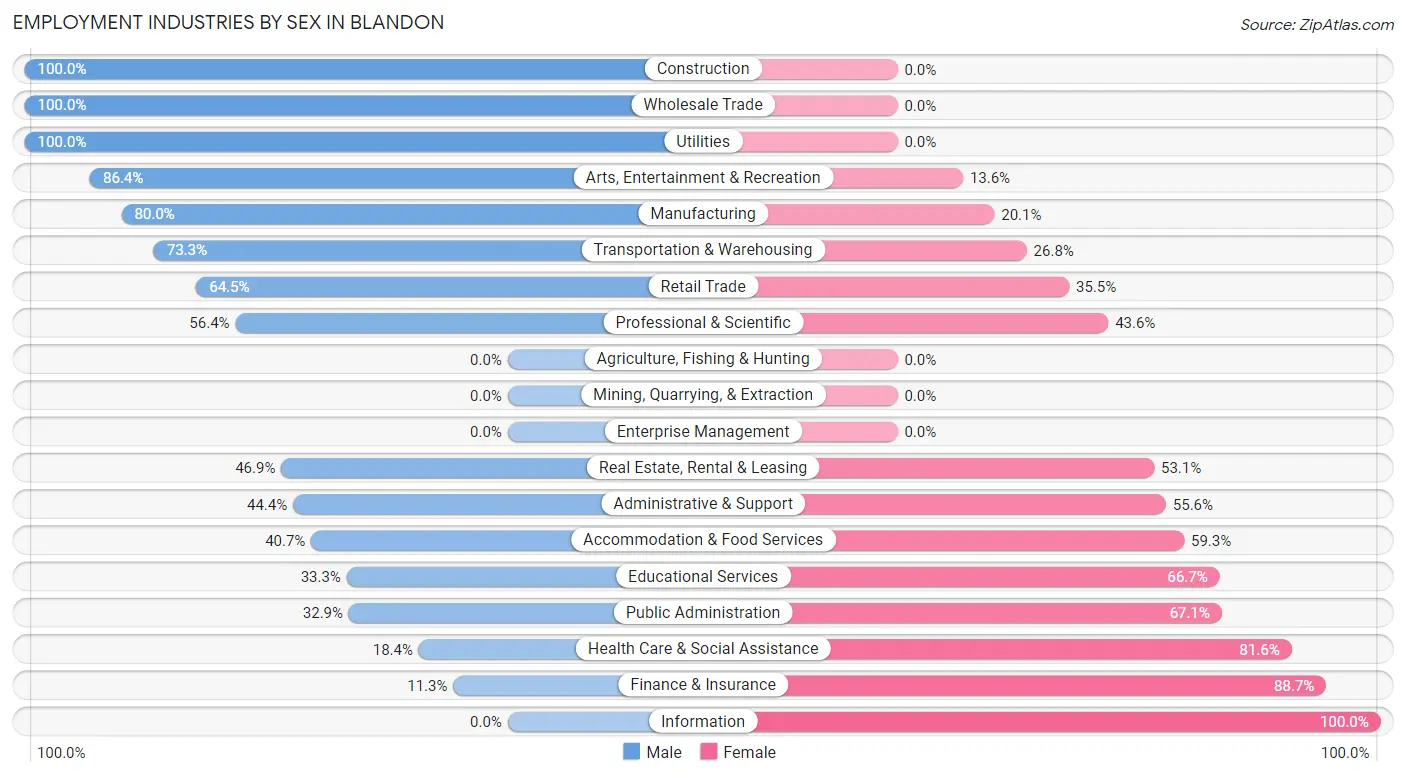
| Industry | Male | Female |
| Agriculture, Fishing & Hunting | 0 (0.0%) | 0 (0.0%) |
| Mining, Quarrying, & Extraction | 0 (0.0%) | 0 (0.0%) |
| Construction | 61 (100.0%) | 0 (0.0%) |
| Manufacturing | 953 (79.9%) | 239 (20.1%) |
| Wholesale Trade | 186 (100.0%) | 0 (0.0%) |
| Retail Trade | 350 (64.5%) | 193 (35.5%) |
| Transportation & Warehousing | 230 (73.3%) | 84 (26.8%) |
| Utilities | 69 (100.0%) | 0 (0.0%) |
| Information | 0 (0.0%) | 28 (100.0%) |
| Finance & Insurance | 17 (11.3%) | 134 (88.7%) |
| Real Estate, Rental & Leasing | 15 (46.9%) | 17 (53.1%) |
| Professional & Scientific | 115 (56.4%) | 89 (43.6%) |
| Enterprise Management | 0 (0.0%) | 0 (0.0%) |
| Administrative & Support | 24 (44.4%) | 30 (55.6%) |
| Educational Services | 129 (33.3%) | 258 (66.7%) |
| Health Care & Social Assistance | 95 (18.4%) | 421 (81.6%) |
| Arts, Entertainment & Recreation | 51 (86.4%) | 8 (13.6%) |
| Accommodation & Food Services | 72 (40.7%) | 105 (59.3%) |
| Public Administration | 72 (32.9%) | 147 (67.1%) |
| Total | 2,464 (56.5%) | 1,894 (43.5%) |
Education in Blandon
School Enrollment in Blandon
The most common levels of schooling among the 1,973 students in Blandon are college / undergraduate (515 | 26.1%), middle school (410 | 20.8%), and high school (384 | 19.5%).
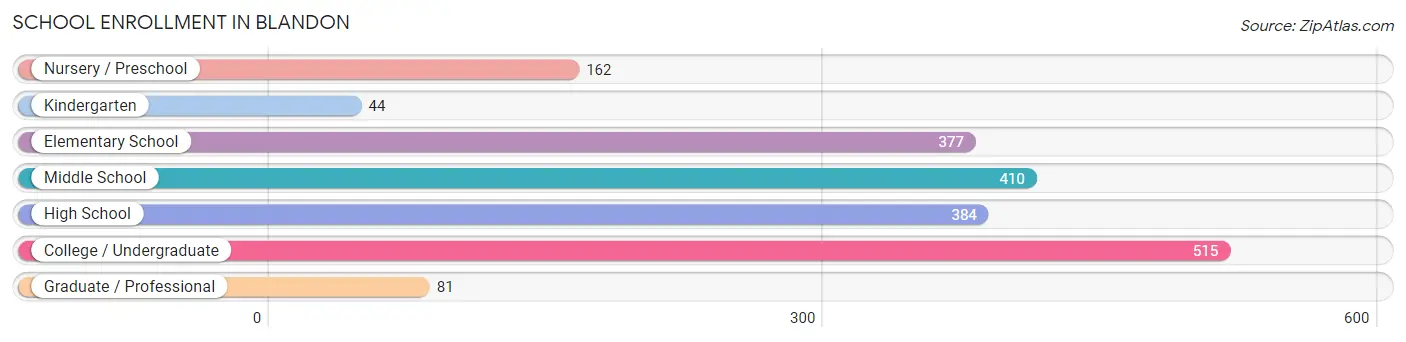
| School Level | # Students | % Students |
| Nursery / Preschool | 162 | 8.2% |
| Kindergarten | 44 | 2.2% |
| Elementary School | 377 | 19.1% |
| Middle School | 410 | 20.8% |
| High School | 384 | 19.5% |
| College / Undergraduate | 515 | 26.1% |
| Graduate / Professional | 81 | 4.1% |
| Total | 1,973 | 100.0% |
School Enrollment by Age by Funding Source in Blandon
Out of a total of 1,973 students who are enrolled in schools in Blandon, 314 (15.9%) attend a private institution, while the remaining 1,659 (84.1%) are enrolled in public schools. The age group of 3 to 4 year olds has the highest likelihood of being enrolled in private schools, with 130 (100.0% in the age bracket) enrolled. Conversely, the age group of 18 to 19 year olds has the lowest likelihood of being enrolled in a private school, with 62 (100.0% in the age bracket) attending a public institution.
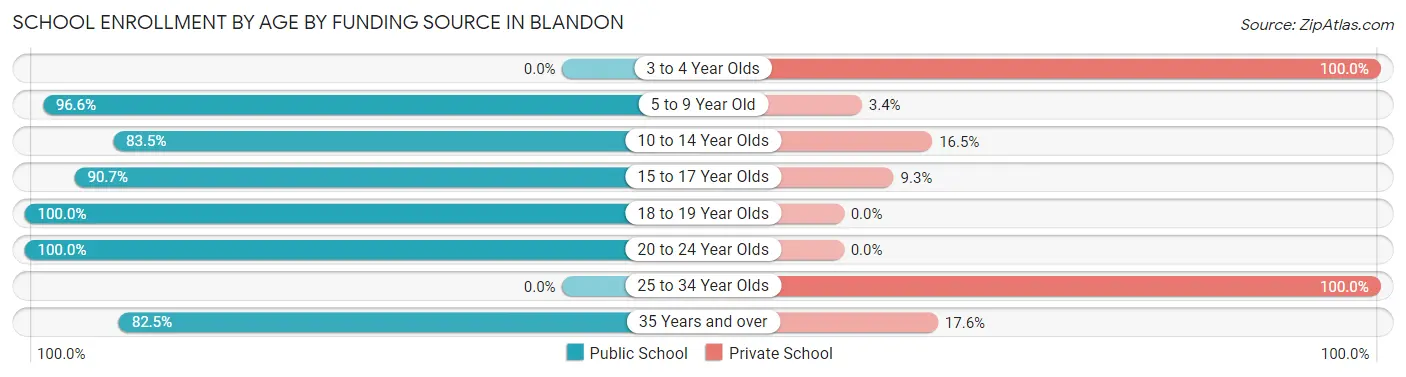
| Age Bracket | Public School | Private School |
| 3 to 4 Year Olds | 0 (0.0%) | 130 (100.0%) |
| 5 to 9 Year Old | 371 (96.6%) | 13 (3.4%) |
| 10 to 14 Year Olds | 400 (83.5%) | 79 (16.5%) |
| 15 to 17 Year Olds | 312 (90.7%) | 32 (9.3%) |
| 18 to 19 Year Olds | 62 (100.0%) | 0 (0.0%) |
| 20 to 24 Year Olds | 360 (100.0%) | 0 (0.0%) |
| 25 to 34 Year Olds | 0 (0.0%) | 26 (100.0%) |
| 35 Years and over | 155 (82.5%) | 33 (17.5%) |
| Total | 1,659 (84.1%) | 314 (15.9%) |
Educational Attainment by Field of Study in Blandon
Business (408 | 21.8%), education (308 | 16.5%), engineering (230 | 12.3%), arts & humanities (214 | 11.4%), and science & technology (141 | 7.5%) are the most common fields of study among 1,870 individuals in Blandon who have obtained a bachelor's degree or higher.
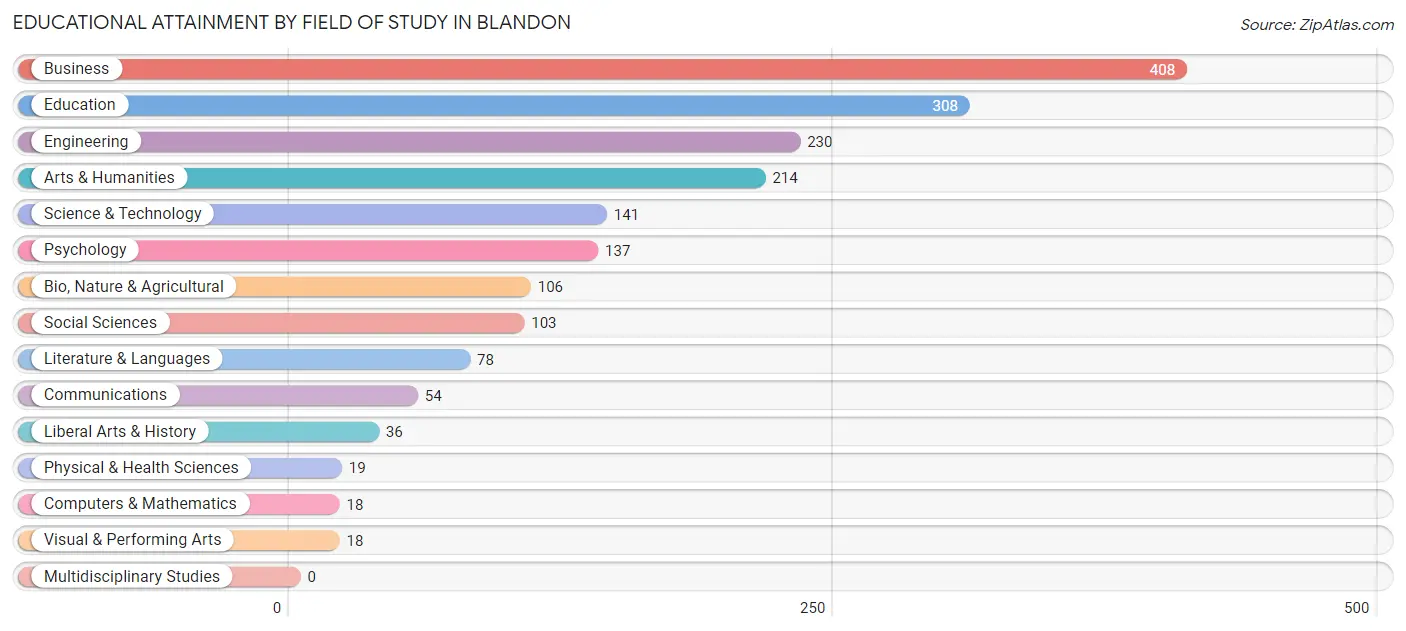
| Field of Study | # Graduates | % Graduates |
| Computers & Mathematics | 18 | 1.0% |
| Bio, Nature & Agricultural | 106 | 5.7% |
| Physical & Health Sciences | 19 | 1.0% |
| Psychology | 137 | 7.3% |
| Social Sciences | 103 | 5.5% |
| Engineering | 230 | 12.3% |
| Multidisciplinary Studies | 0 | 0.0% |
| Science & Technology | 141 | 7.5% |
| Business | 408 | 21.8% |
| Education | 308 | 16.5% |
| Literature & Languages | 78 | 4.2% |
| Liberal Arts & History | 36 | 1.9% |
| Visual & Performing Arts | 18 | 1.0% |
| Communications | 54 | 2.9% |
| Arts & Humanities | 214 | 11.4% |
| Total | 1,870 | 100.0% |
Transportation & Commute in Blandon
Vehicle Availability by Sex in Blandon
The most prevalent vehicle ownership categories in Blandon are males with 2 vehicles (952, accounting for 38.6%) and females with 2 vehicles (861, making up 51.7%).
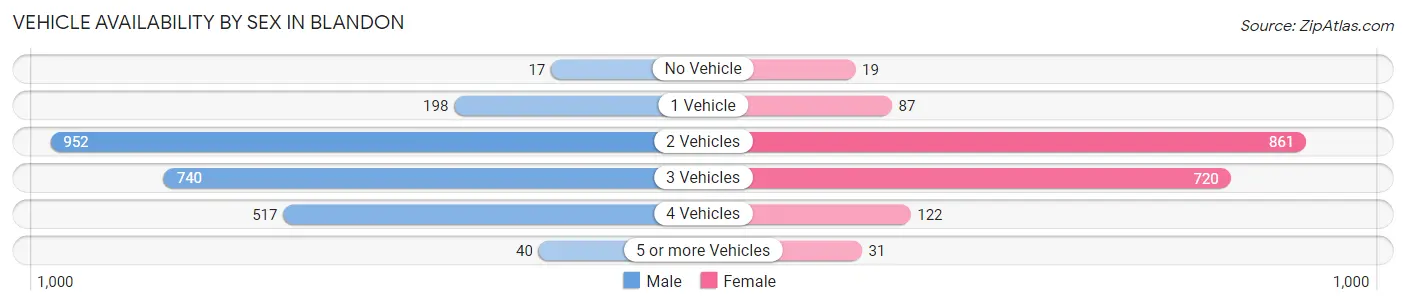
| Vehicles Available | Male | Female |
| No Vehicle | 17 (0.7%) | 19 (1.0%) |
| 1 Vehicle | 198 (8.0%) | 87 (4.7%) |
| 2 Vehicles | 952 (38.6%) | 861 (46.8%) |
| 3 Vehicles | 740 (30.0%) | 720 (39.1%) |
| 4 Vehicles | 517 (21.0%) | 122 (6.6%) |
| 5 or more Vehicles | 40 (1.6%) | 31 (1.7%) |
| Total | 2,464 (100.0%) | 1,840 (100.0%) |
Commute Time in Blandon
The most frequently occuring commute durations in Blandon are 15 to 19 minutes (721 commuters, 19.2%), 30 to 34 minutes (643 commuters, 17.1%), and 20 to 24 minutes (574 commuters, 15.3%).
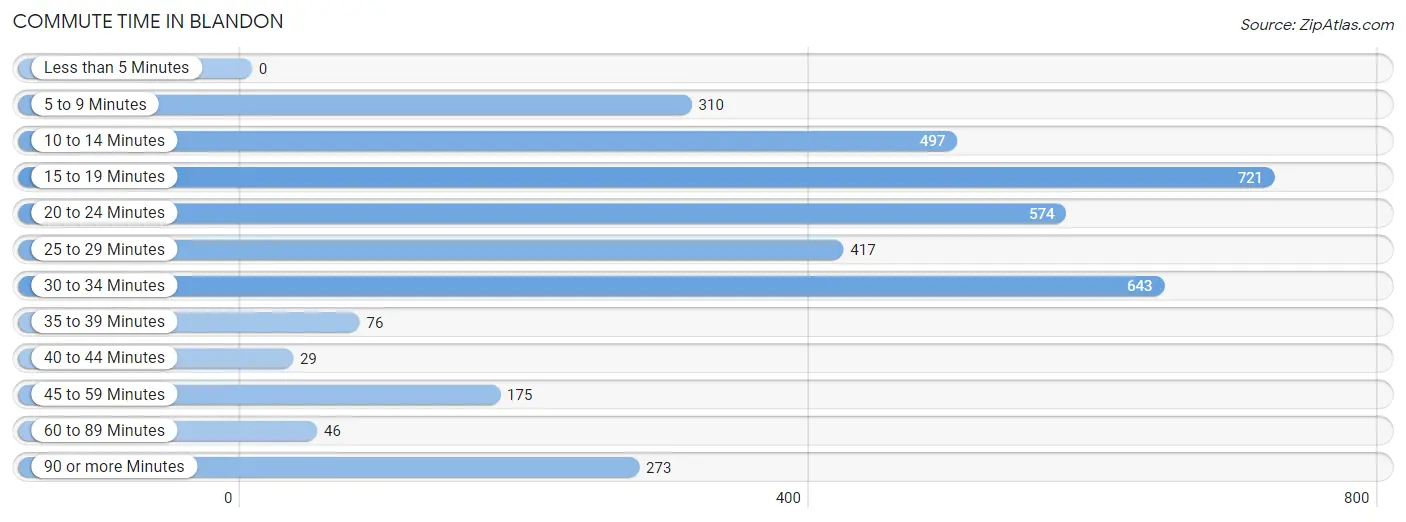
| Commute Time | # Commuters | % Commuters |
| Less than 5 Minutes | 0 | 0.0% |
| 5 to 9 Minutes | 310 | 8.2% |
| 10 to 14 Minutes | 497 | 13.2% |
| 15 to 19 Minutes | 721 | 19.2% |
| 20 to 24 Minutes | 574 | 15.3% |
| 25 to 29 Minutes | 417 | 11.1% |
| 30 to 34 Minutes | 643 | 17.1% |
| 35 to 39 Minutes | 76 | 2.0% |
| 40 to 44 Minutes | 29 | 0.8% |
| 45 to 59 Minutes | 175 | 4.6% |
| 60 to 89 Minutes | 46 | 1.2% |
| 90 or more Minutes | 273 | 7.3% |
Commute Time by Sex in Blandon
The most common commute times in Blandon are 15 to 19 minutes (427 commuters, 18.9%) for males and 20 to 24 minutes (317 commuters, 21.2%) for females.
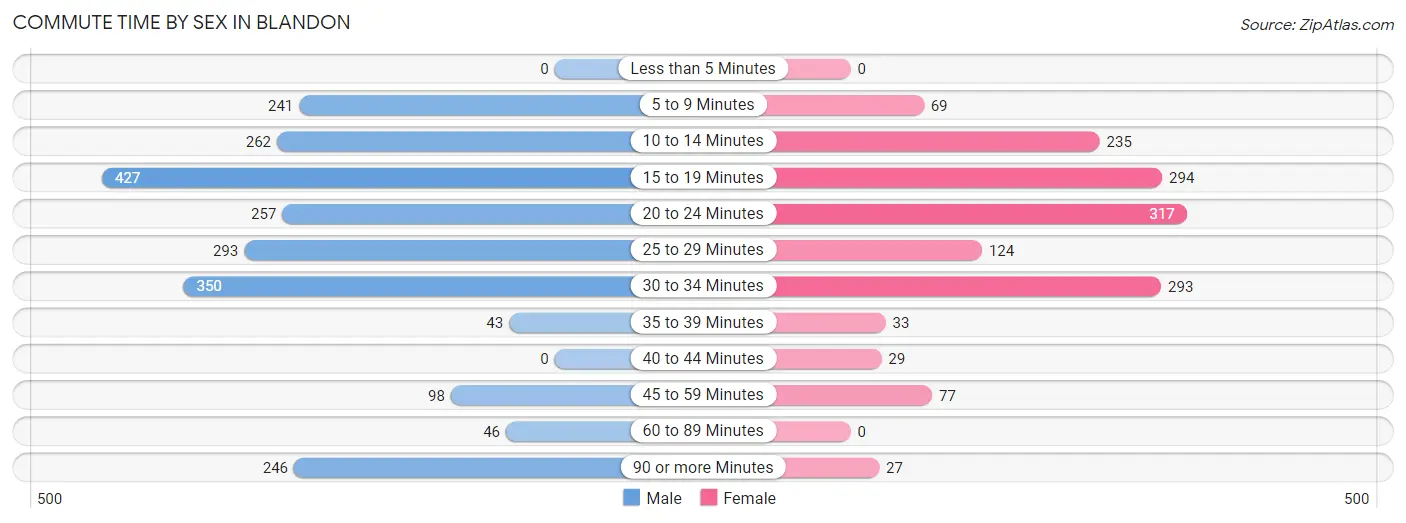
| Commute Time | Male | Female |
| Less than 5 Minutes | 0 (0.0%) | 0 (0.0%) |
| 5 to 9 Minutes | 241 (10.6%) | 69 (4.6%) |
| 10 to 14 Minutes | 262 (11.6%) | 235 (15.7%) |
| 15 to 19 Minutes | 427 (18.9%) | 294 (19.6%) |
| 20 to 24 Minutes | 257 (11.4%) | 317 (21.2%) |
| 25 to 29 Minutes | 293 (13.0%) | 124 (8.3%) |
| 30 to 34 Minutes | 350 (15.5%) | 293 (19.6%) |
| 35 to 39 Minutes | 43 (1.9%) | 33 (2.2%) |
| 40 to 44 Minutes | 0 (0.0%) | 29 (1.9%) |
| 45 to 59 Minutes | 98 (4.3%) | 77 (5.1%) |
| 60 to 89 Minutes | 46 (2.0%) | 0 (0.0%) |
| 90 or more Minutes | 246 (10.9%) | 27 (1.8%) |
Time of Departure to Work by Sex in Blandon
The most frequent times of departure to work in Blandon are 4:00 PM to 11:59 PM (384, 17.0%) for males and 7:30 AM to 7:59 AM (256, 17.1%) for females.
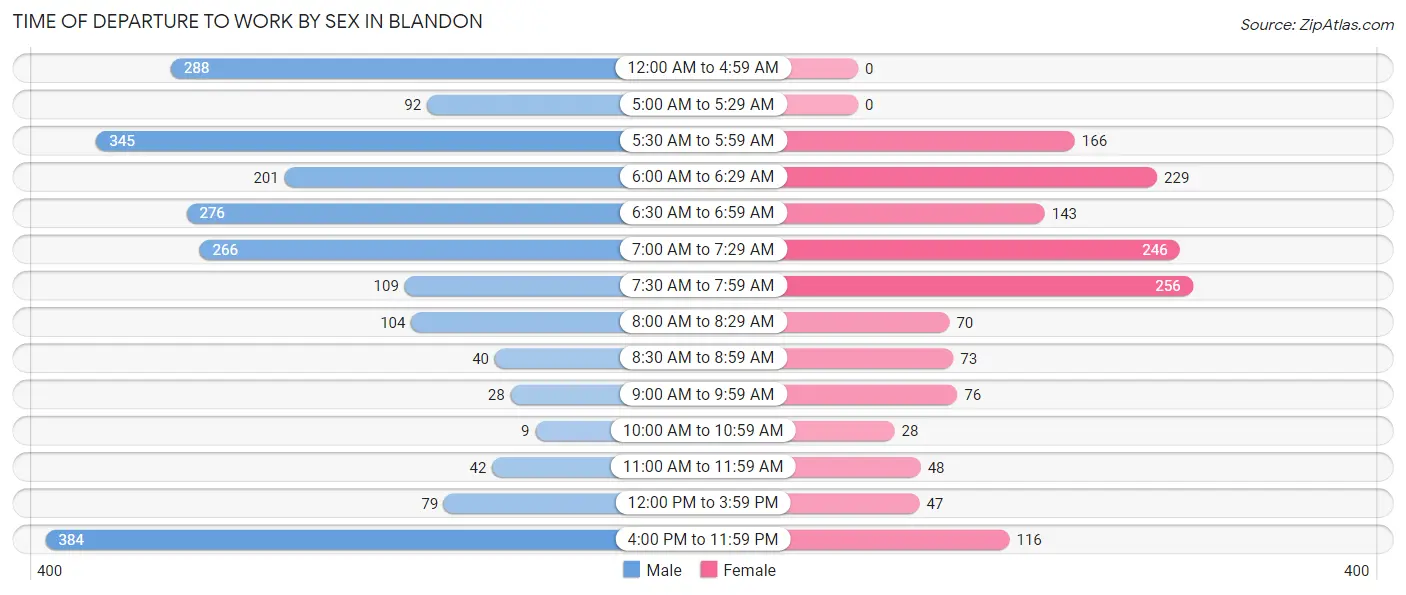
| Time of Departure | Male | Female |
| 12:00 AM to 4:59 AM | 288 (12.7%) | 0 (0.0%) |
| 5:00 AM to 5:29 AM | 92 (4.1%) | 0 (0.0%) |
| 5:30 AM to 5:59 AM | 345 (15.2%) | 166 (11.1%) |
| 6:00 AM to 6:29 AM | 201 (8.9%) | 229 (15.3%) |
| 6:30 AM to 6:59 AM | 276 (12.2%) | 143 (9.6%) |
| 7:00 AM to 7:29 AM | 266 (11.7%) | 246 (16.4%) |
| 7:30 AM to 7:59 AM | 109 (4.8%) | 256 (17.1%) |
| 8:00 AM to 8:29 AM | 104 (4.6%) | 70 (4.7%) |
| 8:30 AM to 8:59 AM | 40 (1.8%) | 73 (4.9%) |
| 9:00 AM to 9:59 AM | 28 (1.2%) | 76 (5.1%) |
| 10:00 AM to 10:59 AM | 9 (0.4%) | 28 (1.9%) |
| 11:00 AM to 11:59 AM | 42 (1.9%) | 48 (3.2%) |
| 12:00 PM to 3:59 PM | 79 (3.5%) | 47 (3.1%) |
| 4:00 PM to 11:59 PM | 384 (17.0%) | 116 (7.7%) |
| Total | 2,263 (100.0%) | 1,498 (100.0%) |
Housing Occupancy in Blandon
Occupancy by Ownership in Blandon
Of the total 2,819 dwellings in Blandon, owner-occupied units account for 2,470 (87.6%), while renter-occupied units make up 349 (12.4%).
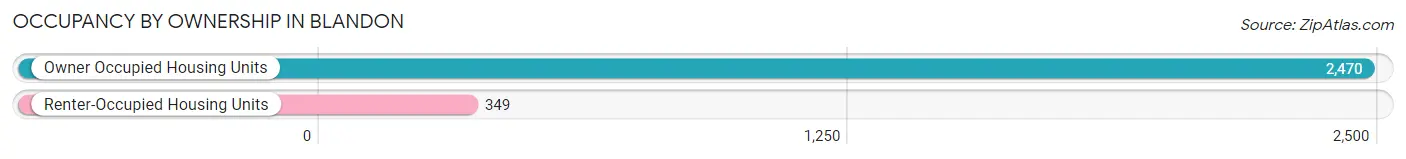
| Occupancy | # Housing Units | % Housing Units |
| Owner Occupied Housing Units | 2,470 | 87.6% |
| Renter-Occupied Housing Units | 349 | 12.4% |
| Total Occupied Housing Units | 2,819 | 100.0% |
Occupancy by Household Size in Blandon
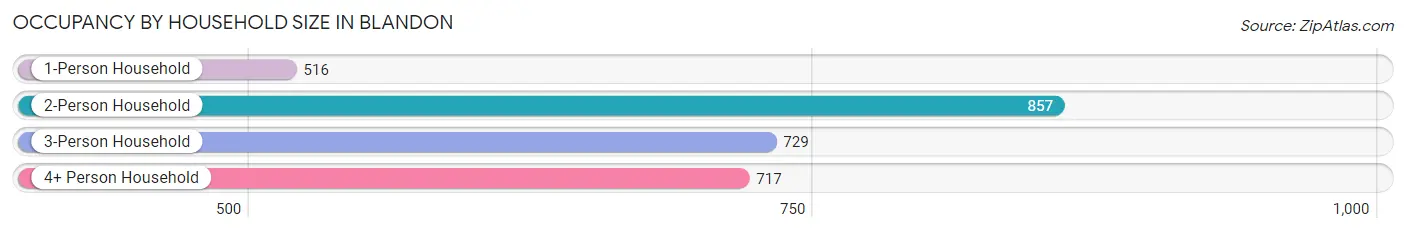
| Household Size | # Housing Units | % Housing Units |
| 1-Person Household | 516 | 18.3% |
| 2-Person Household | 857 | 30.4% |
| 3-Person Household | 729 | 25.9% |
| 4+ Person Household | 717 | 25.4% |
| Total Housing Units | 2,819 | 100.0% |
Occupancy by Ownership by Household Size in Blandon
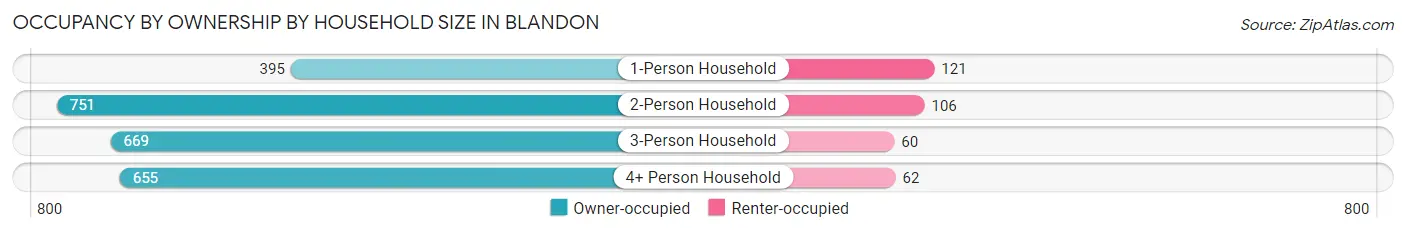
| Household Size | Owner-occupied | Renter-occupied |
| 1-Person Household | 395 (76.5%) | 121 (23.4%) |
| 2-Person Household | 751 (87.6%) | 106 (12.4%) |
| 3-Person Household | 669 (91.8%) | 60 (8.2%) |
| 4+ Person Household | 655 (91.3%) | 62 (8.6%) |
| Total Housing Units | 2,470 (87.6%) | 349 (12.4%) |
Occupancy by Educational Attainment in Blandon
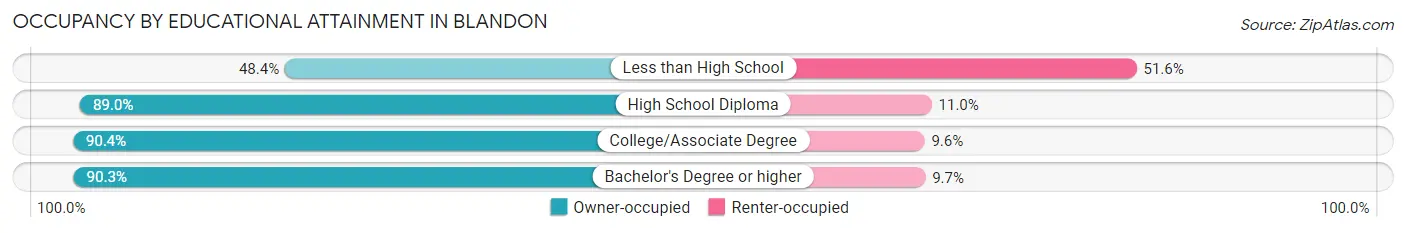
| Household Size | Owner-occupied | Renter-occupied |
| Less than High School | 74 (48.4%) | 79 (51.6%) |
| High School Diploma | 826 (89.0%) | 102 (11.0%) |
| College/Associate Degree | 633 (90.4%) | 67 (9.6%) |
| Bachelor's Degree or higher | 937 (90.3%) | 101 (9.7%) |
Occupancy by Age of Householder in Blandon
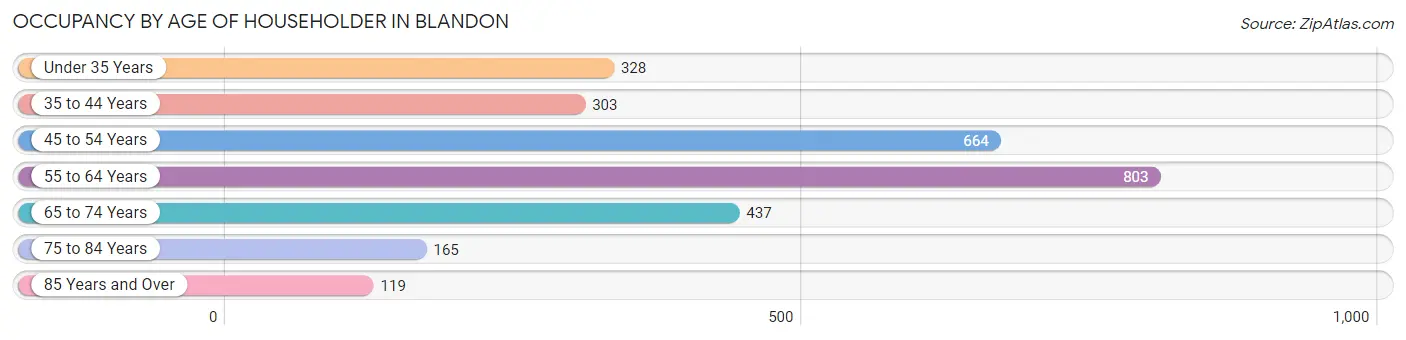
| Age Bracket | # Households | % Households |
| Under 35 Years | 328 | 11.6% |
| 35 to 44 Years | 303 | 10.7% |
| 45 to 54 Years | 664 | 23.5% |
| 55 to 64 Years | 803 | 28.5% |
| 65 to 74 Years | 437 | 15.5% |
| 75 to 84 Years | 165 | 5.9% |
| 85 Years and Over | 119 | 4.2% |
| Total | 2,819 | 100.0% |
Housing Finances in Blandon
Median Income by Occupancy in Blandon
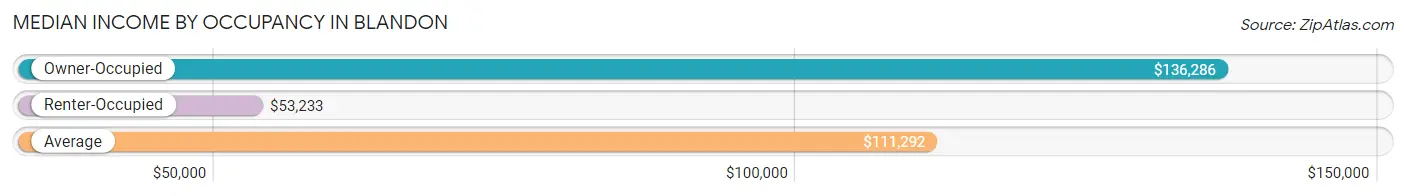
| Occupancy Type | # Households | Median Income |
| Owner-Occupied | 2,470 (87.6%) | $136,286 |
| Renter-Occupied | 349 (12.4%) | $53,233 |
| Average | 2,819 (100.0%) | $111,292 |
Occupancy by Householder Income Bracket in Blandon
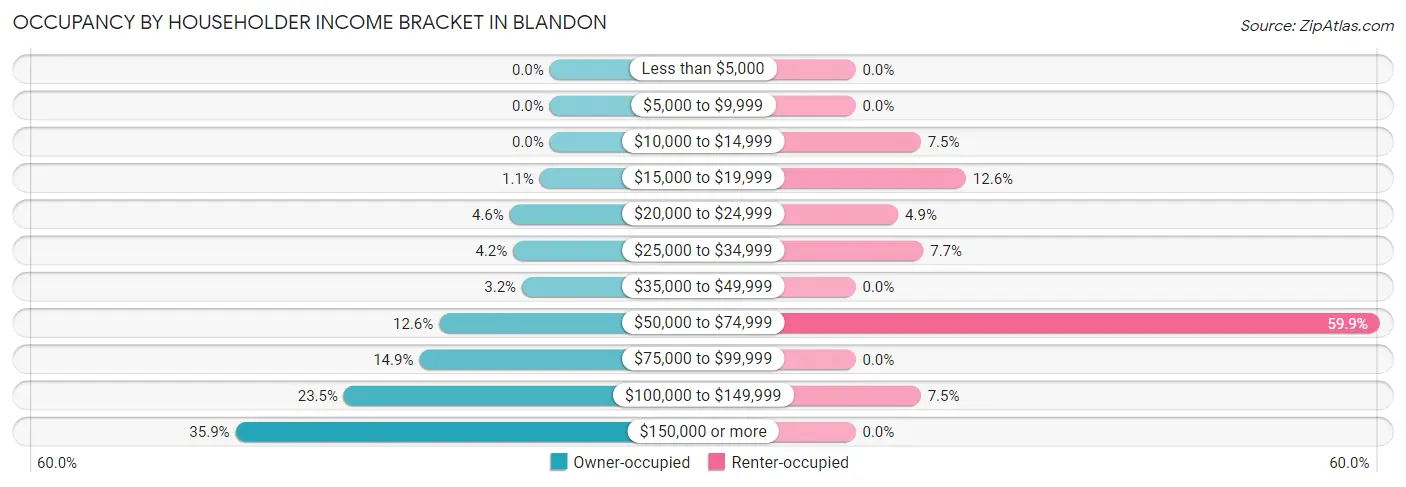
| Income Bracket | Owner-occupied | Renter-occupied |
| Less than $5,000 | 0 (0.0%) | 0 (0.0%) |
| $5,000 to $9,999 | 0 (0.0%) | 0 (0.0%) |
| $10,000 to $14,999 | 0 (0.0%) | 26 (7.4%) |
| $15,000 to $19,999 | 28 (1.1%) | 44 (12.6%) |
| $20,000 to $24,999 | 113 (4.6%) | 17 (4.9%) |
| $25,000 to $34,999 | 103 (4.2%) | 27 (7.7%) |
| $35,000 to $49,999 | 78 (3.2%) | 0 (0.0%) |
| $50,000 to $74,999 | 312 (12.6%) | 209 (59.9%) |
| $75,000 to $99,999 | 368 (14.9%) | 0 (0.0%) |
| $100,000 to $149,999 | 581 (23.5%) | 26 (7.4%) |
| $150,000 or more | 887 (35.9%) | 0 (0.0%) |
| Total | 2,470 (100.0%) | 349 (100.0%) |
Monthly Housing Cost Tiers in Blandon
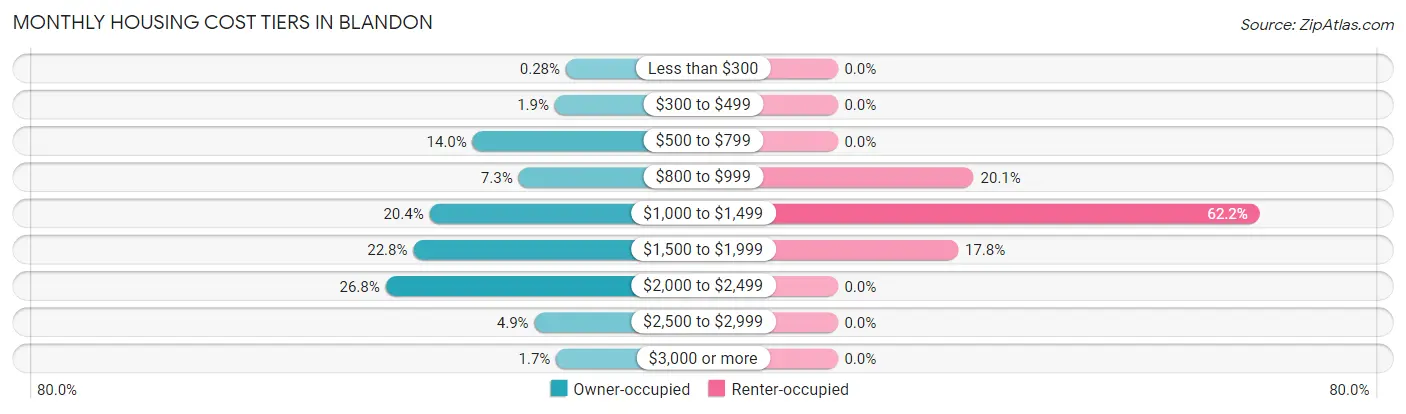
| Monthly Cost | Owner-occupied | Renter-occupied |
| Less than $300 | 7 (0.3%) | 0 (0.0%) |
| $300 to $499 | 47 (1.9%) | 0 (0.0%) |
| $500 to $799 | 346 (14.0%) | 0 (0.0%) |
| $800 to $999 | 179 (7.2%) | 70 (20.1%) |
| $1,000 to $1,499 | 503 (20.4%) | 217 (62.2%) |
| $1,500 to $1,999 | 562 (22.8%) | 62 (17.8%) |
| $2,000 to $2,499 | 663 (26.8%) | 0 (0.0%) |
| $2,500 to $2,999 | 121 (4.9%) | 0 (0.0%) |
| $3,000 or more | 42 (1.7%) | 0 (0.0%) |
| Total | 2,470 (100.0%) | 349 (100.0%) |
Physical Housing Characteristics in Blandon
Housing Structures in Blandon
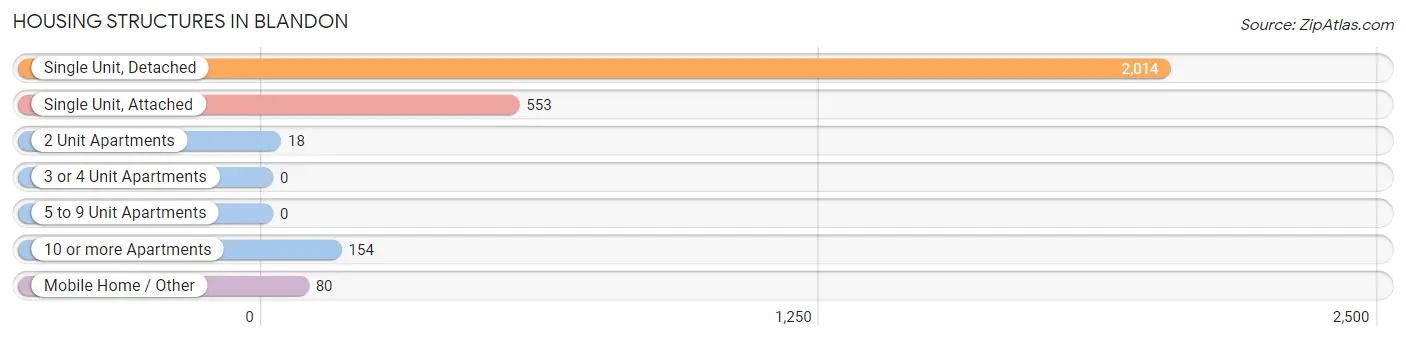
| Structure Type | # Housing Units | % Housing Units |
| Single Unit, Detached | 2,014 | 71.4% |
| Single Unit, Attached | 553 | 19.6% |
| 2 Unit Apartments | 18 | 0.6% |
| 3 or 4 Unit Apartments | 0 | 0.0% |
| 5 to 9 Unit Apartments | 0 | 0.0% |
| 10 or more Apartments | 154 | 5.5% |
| Mobile Home / Other | 80 | 2.8% |
| Total | 2,819 | 100.0% |
Housing Structures by Occupancy in Blandon
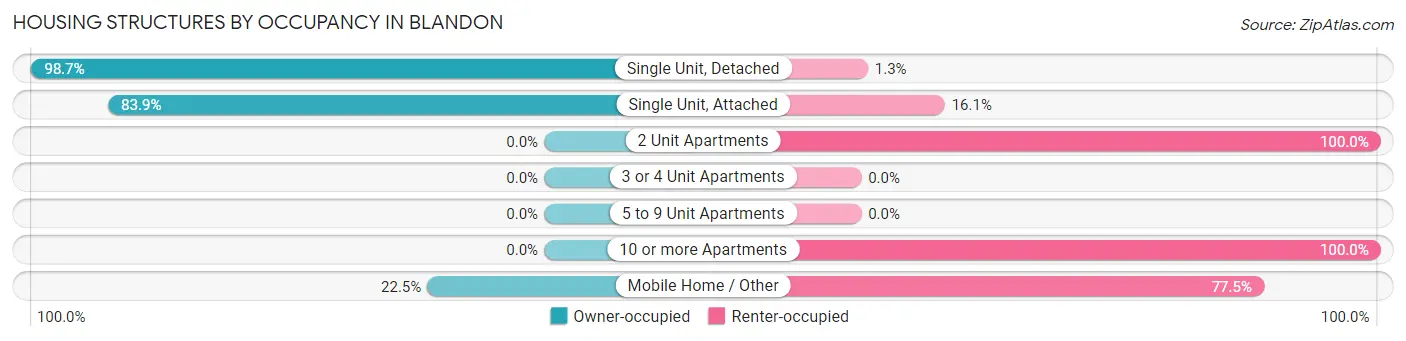
| Structure Type | Owner-occupied | Renter-occupied |
| Single Unit, Detached | 1,988 (98.7%) | 26 (1.3%) |
| Single Unit, Attached | 464 (83.9%) | 89 (16.1%) |
| 2 Unit Apartments | 0 (0.0%) | 18 (100.0%) |
| 3 or 4 Unit Apartments | 0 (0.0%) | 0 (0.0%) |
| 5 to 9 Unit Apartments | 0 (0.0%) | 0 (0.0%) |
| 10 or more Apartments | 0 (0.0%) | 154 (100.0%) |
| Mobile Home / Other | 18 (22.5%) | 62 (77.5%) |
| Total | 2,470 (87.6%) | 349 (12.4%) |
Housing Structures by Number of Rooms in Blandon
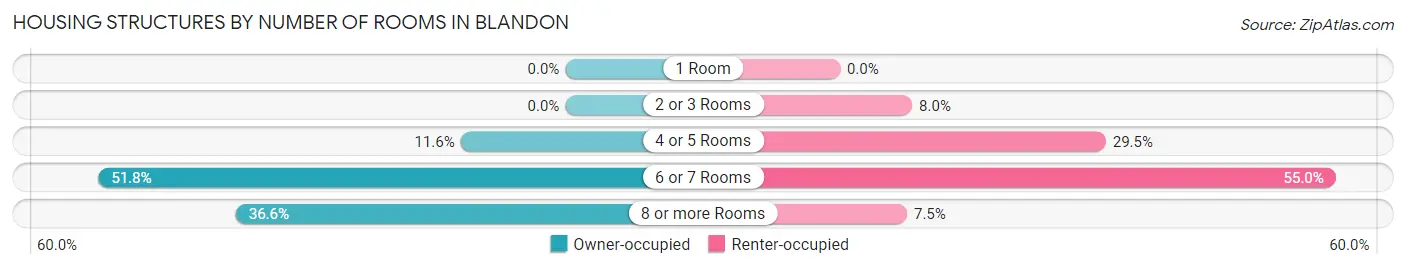
| Number of Rooms | Owner-occupied | Renter-occupied |
| 1 Room | 0 (0.0%) | 0 (0.0%) |
| 2 or 3 Rooms | 0 (0.0%) | 28 (8.0%) |
| 4 or 5 Rooms | 287 (11.6%) | 103 (29.5%) |
| 6 or 7 Rooms | 1,280 (51.8%) | 192 (55.0%) |
| 8 or more Rooms | 903 (36.6%) | 26 (7.4%) |
| Total | 2,470 (100.0%) | 349 (100.0%) |
Housing Structure by Heating Type in Blandon
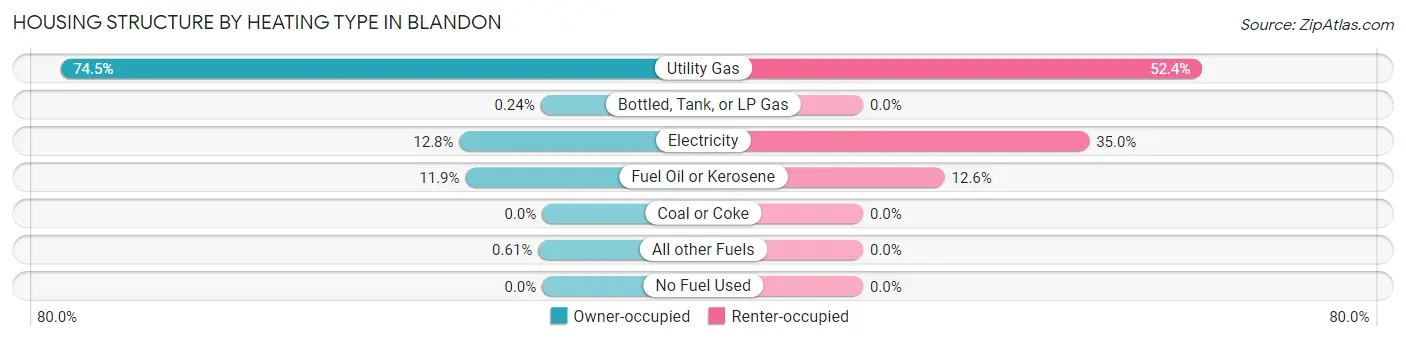
| Heating Type | Owner-occupied | Renter-occupied |
| Utility Gas | 1,840 (74.5%) | 183 (52.4%) |
| Bottled, Tank, or LP Gas | 6 (0.2%) | 0 (0.0%) |
| Electricity | 316 (12.8%) | 122 (35.0%) |
| Fuel Oil or Kerosene | 293 (11.9%) | 44 (12.6%) |
| Coal or Coke | 0 (0.0%) | 0 (0.0%) |
| All other Fuels | 15 (0.6%) | 0 (0.0%) |
| No Fuel Used | 0 (0.0%) | 0 (0.0%) |
| Total | 2,470 (100.0%) | 349 (100.0%) |
Household Vehicle Usage in Blandon
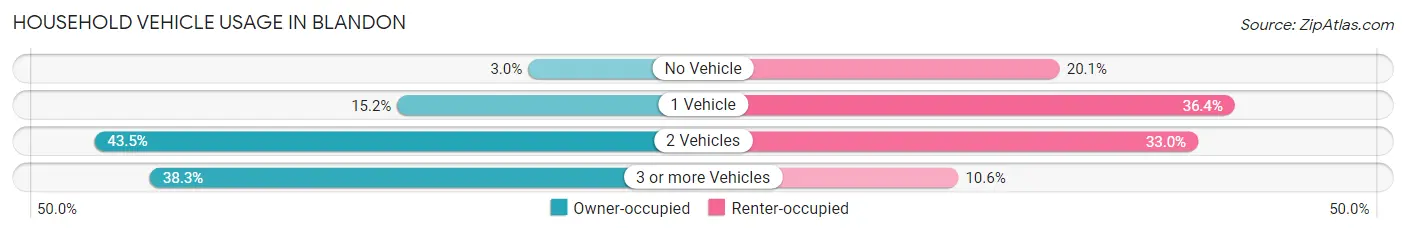
| Vehicles per Household | Owner-occupied | Renter-occupied |
| No Vehicle | 74 (3.0%) | 70 (20.1%) |
| 1 Vehicle | 376 (15.2%) | 127 (36.4%) |
| 2 Vehicles | 1,074 (43.5%) | 115 (33.0%) |
| 3 or more Vehicles | 946 (38.3%) | 37 (10.6%) |
| Total | 2,470 (100.0%) | 349 (100.0%) |
Real Estate & Mortgages in Blandon
Real Estate and Mortgage Overview in Blandon
| Characteristic | Without Mortgage | With Mortgage |
| Housing Units | 723 | 1,747 |
| Median Property Value | $232,100 | $262,900 |
| Median Household Income | $85,324 | $786 |
| Monthly Housing Costs | $784 | $42 |
| Real Estate Taxes | $5,246 | $26 |
Property Value by Mortgage Status in Blandon
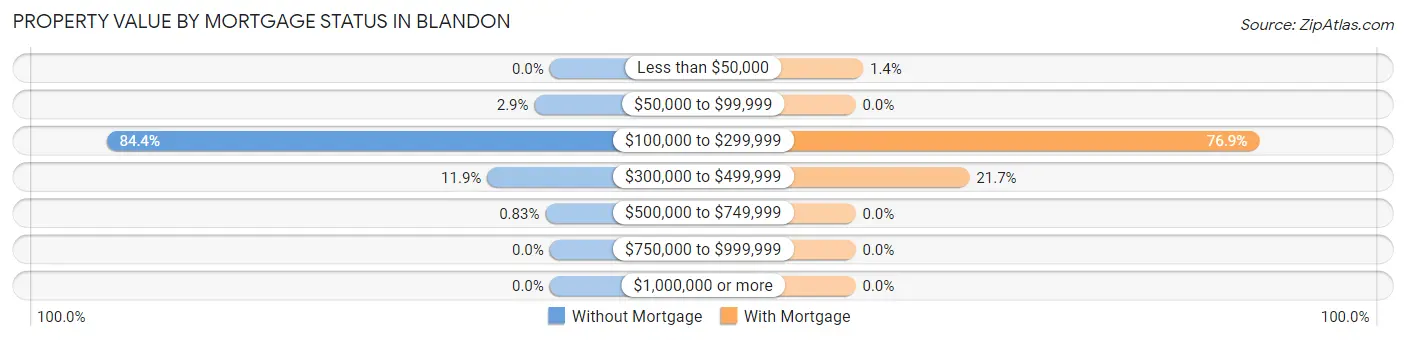
| Property Value | Without Mortgage | With Mortgage |
| Less than $50,000 | 0 (0.0%) | 25 (1.4%) |
| $50,000 to $99,999 | 21 (2.9%) | 0 (0.0%) |
| $100,000 to $299,999 | 610 (84.4%) | 1,343 (76.9%) |
| $300,000 to $499,999 | 86 (11.9%) | 379 (21.7%) |
| $500,000 to $749,999 | 6 (0.8%) | 0 (0.0%) |
| $750,000 to $999,999 | 0 (0.0%) | 0 (0.0%) |
| $1,000,000 or more | 0 (0.0%) | 0 (0.0%) |
| Total | 723 (100.0%) | 1,747 (100.0%) |
Household Income by Mortgage Status in Blandon
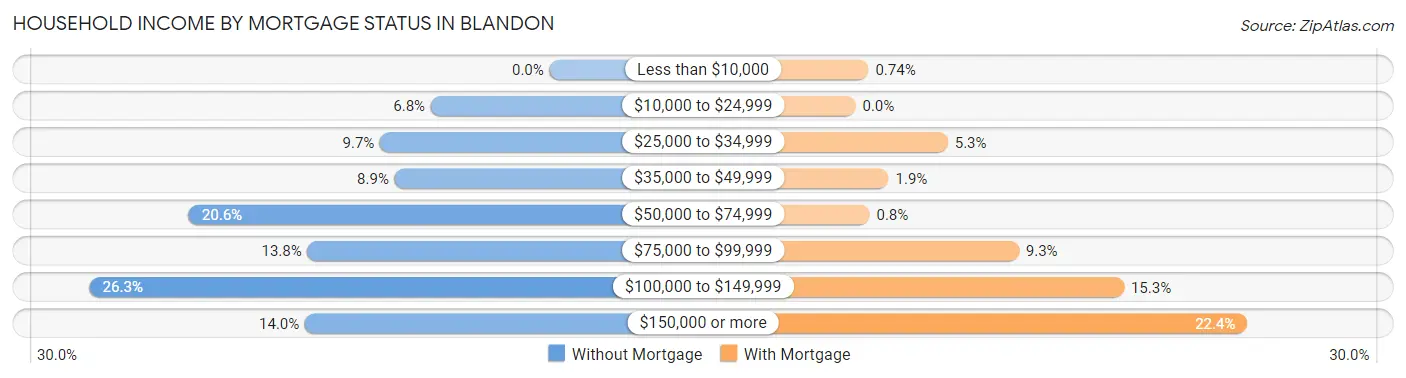
| Household Income | Without Mortgage | With Mortgage |
| Less than $10,000 | 0 (0.0%) | 13 (0.7%) |
| $10,000 to $24,999 | 49 (6.8%) | 0 (0.0%) |
| $25,000 to $34,999 | 70 (9.7%) | 92 (5.3%) |
| $35,000 to $49,999 | 64 (8.8%) | 33 (1.9%) |
| $50,000 to $74,999 | 149 (20.6%) | 14 (0.8%) |
| $75,000 to $99,999 | 100 (13.8%) | 163 (9.3%) |
| $100,000 to $149,999 | 190 (26.3%) | 268 (15.3%) |
| $150,000 or more | 101 (14.0%) | 391 (22.4%) |
| Total | 723 (100.0%) | 1,747 (100.0%) |
Property Value to Household Income Ratio in Blandon
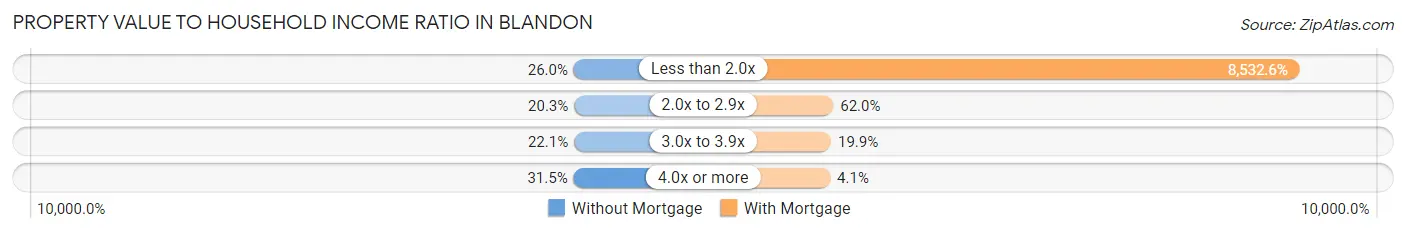
| Value-to-Income Ratio | Without Mortgage | With Mortgage |
| Less than 2.0x | 188 (26.0%) | 149,065 (8,532.6%) |
| 2.0x to 2.9x | 147 (20.3%) | 1,083 (62.0%) |
| 3.0x to 3.9x | 160 (22.1%) | 348 (19.9%) |
| 4.0x or more | 228 (31.5%) | 72 (4.1%) |
| Total | 723 (100.0%) | 1,747 (100.0%) |
Real Estate Taxes by Mortgage Status in Blandon
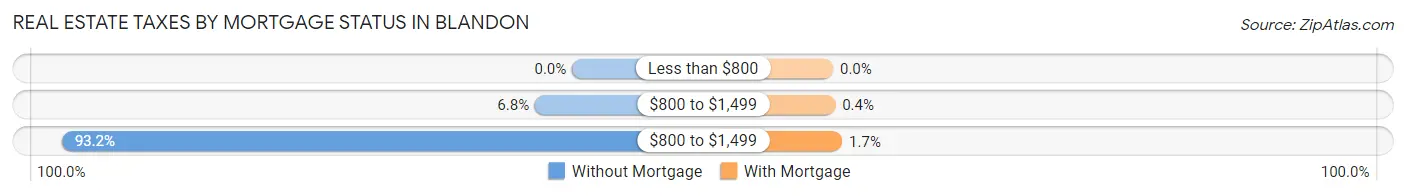
| Property Taxes | Without Mortgage | With Mortgage |
| Less than $800 | 0 (0.0%) | 0 (0.0%) |
| $800 to $1,499 | 49 (6.8%) | 7 (0.4%) |
| $800 to $1,499 | 674 (93.2%) | 29 (1.7%) |
| Total | 723 (100.0%) | 1,747 (100.0%) |
Health & Disability in Blandon
Health Insurance Coverage by Age in Blandon
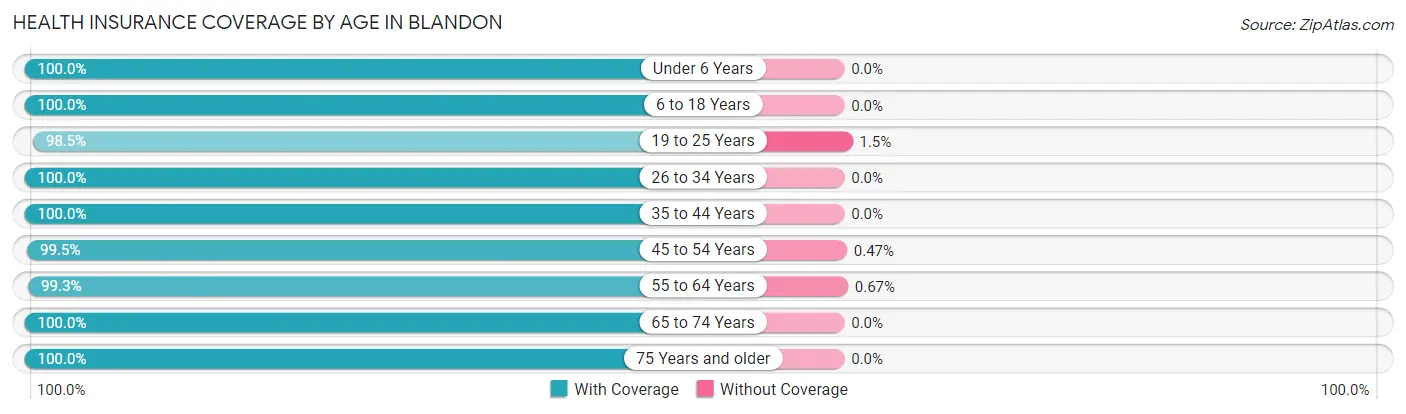
| Age Bracket | With Coverage | Without Coverage |
| Under 6 Years | 438 (100.0%) | 0 (0.0%) |
| 6 to 18 Years | 1,186 (100.0%) | 0 (0.0%) |
| 19 to 25 Years | 578 (98.5%) | 9 (1.5%) |
| 26 to 34 Years | 698 (100.0%) | 0 (0.0%) |
| 35 to 44 Years | 797 (100.0%) | 0 (0.0%) |
| 45 to 54 Years | 1,471 (99.5%) | 7 (0.5%) |
| 55 to 64 Years | 1,193 (99.3%) | 8 (0.7%) |
| 65 to 74 Years | 649 (100.0%) | 0 (0.0%) |
| 75 Years and older | 450 (100.0%) | 0 (0.0%) |
| Total | 7,460 (99.7%) | 24 (0.3%) |
Health Insurance Coverage by Citizenship Status in Blandon
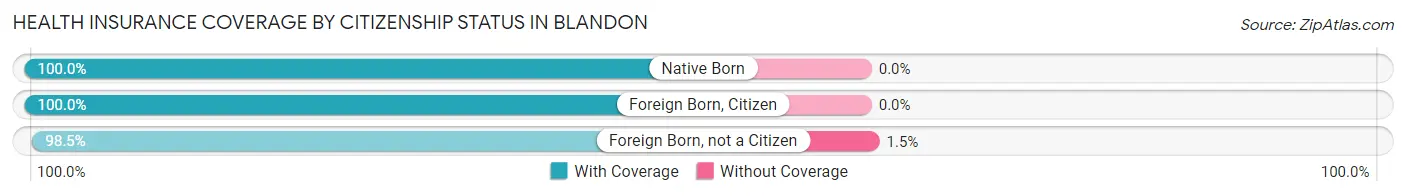
| Citizenship Status | With Coverage | Without Coverage |
| Native Born | 438 (100.0%) | 0 (0.0%) |
| Foreign Born, Citizen | 1,186 (100.0%) | 0 (0.0%) |
| Foreign Born, not a Citizen | 578 (98.5%) | 9 (1.5%) |
Health Insurance Coverage by Household Income in Blandon
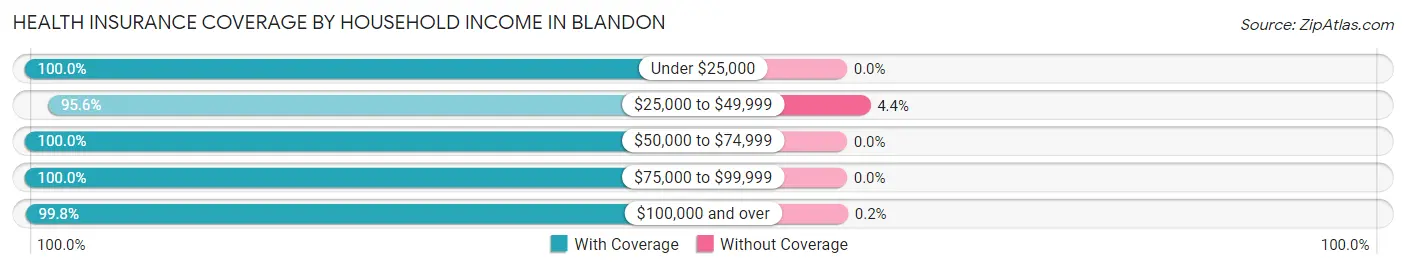
| Household Income | With Coverage | Without Coverage |
| Under $25,000 | 438 (100.0%) | 0 (0.0%) |
| $25,000 to $49,999 | 327 (95.6%) | 15 (4.4%) |
| $50,000 to $74,999 | 1,337 (100.0%) | 0 (0.0%) |
| $75,000 to $99,999 | 970 (100.0%) | 0 (0.0%) |
| $100,000 and over | 4,388 (99.8%) | 9 (0.2%) |
Public vs Private Health Insurance Coverage by Age in Blandon
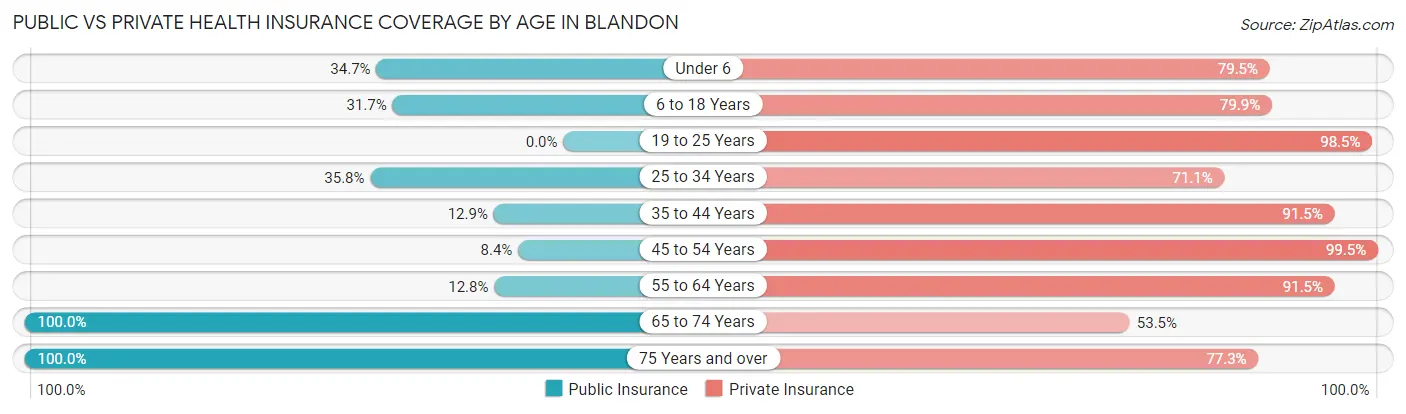
| Age Bracket | Public Insurance | Private Insurance |
| Under 6 | 152 (34.7%) | 348 (79.4%) |
| 6 to 18 Years | 376 (31.7%) | 947 (79.8%) |
| 19 to 25 Years | 0 (0.0%) | 578 (98.5%) |
| 25 to 34 Years | 250 (35.8%) | 496 (71.1%) |
| 35 to 44 Years | 103 (12.9%) | 729 (91.5%) |
| 45 to 54 Years | 124 (8.4%) | 1,471 (99.5%) |
| 55 to 64 Years | 154 (12.8%) | 1,099 (91.5%) |
| 65 to 74 Years | 649 (100.0%) | 347 (53.5%) |
| 75 Years and over | 450 (100.0%) | 348 (77.3%) |
| Total | 2,258 (30.2%) | 6,363 (85.0%) |
Disability Status by Sex by Age in Blandon
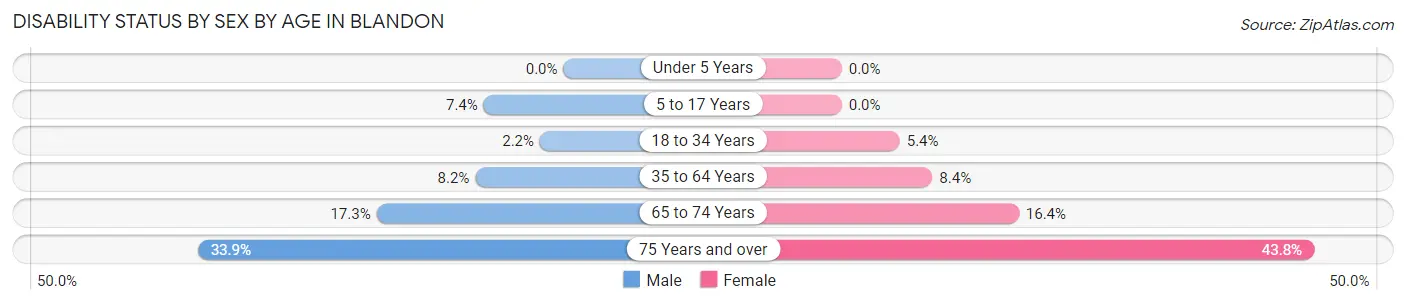
| Age Bracket | Male | Female |
| Under 5 Years | 0 (0.0%) | 0 (0.0%) |
| 5 to 17 Years | 35 (7.4%) | 0 (0.0%) |
| 18 to 34 Years | 13 (2.2%) | 40 (5.4%) |
| 35 to 64 Years | 159 (8.2%) | 129 (8.4%) |
| 65 to 74 Years | 64 (17.3%) | 46 (16.4%) |
| 75 Years and over | 76 (33.9%) | 99 (43.8%) |
Disability Class by Sex by Age in Blandon
Disability Class: Hearing Difficulty
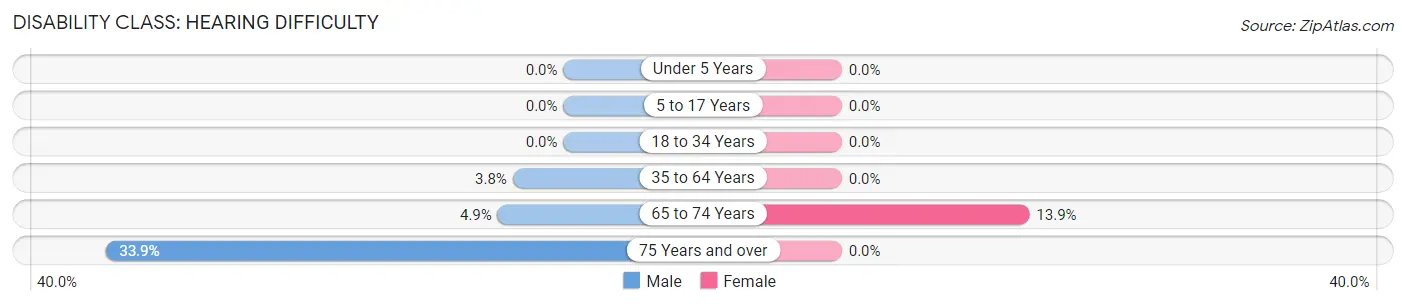
| Age Bracket | Male | Female |
| Under 5 Years | 0 (0.0%) | 0 (0.0%) |
| 5 to 17 Years | 0 (0.0%) | 0 (0.0%) |
| 18 to 34 Years | 0 (0.0%) | 0 (0.0%) |
| 35 to 64 Years | 73 (3.8%) | 0 (0.0%) |
| 65 to 74 Years | 18 (4.9%) | 39 (13.9%) |
| 75 Years and over | 76 (33.9%) | 0 (0.0%) |
Disability Class: Vision Difficulty
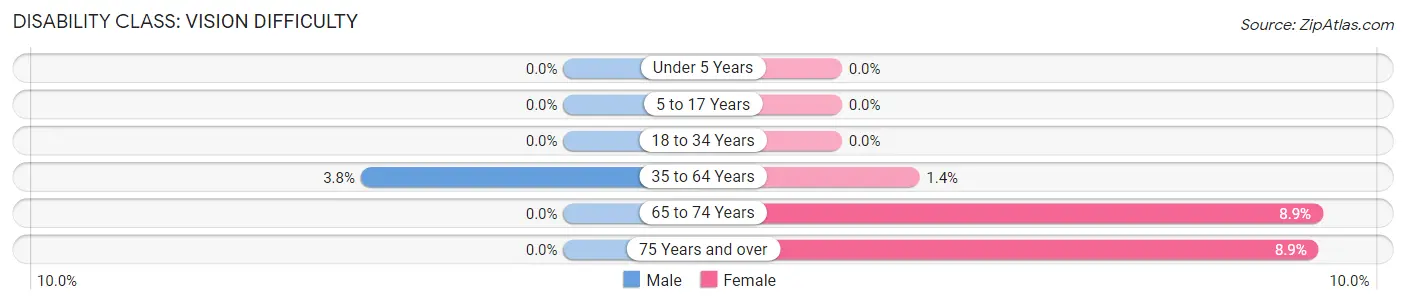
| Age Bracket | Male | Female |
| Under 5 Years | 0 (0.0%) | 0 (0.0%) |
| 5 to 17 Years | 0 (0.0%) | 0 (0.0%) |
| 18 to 34 Years | 0 (0.0%) | 0 (0.0%) |
| 35 to 64 Years | 73 (3.8%) | 22 (1.4%) |
| 65 to 74 Years | 0 (0.0%) | 25 (8.9%) |
| 75 Years and over | 0 (0.0%) | 20 (8.8%) |
Disability Class: Cognitive Difficulty
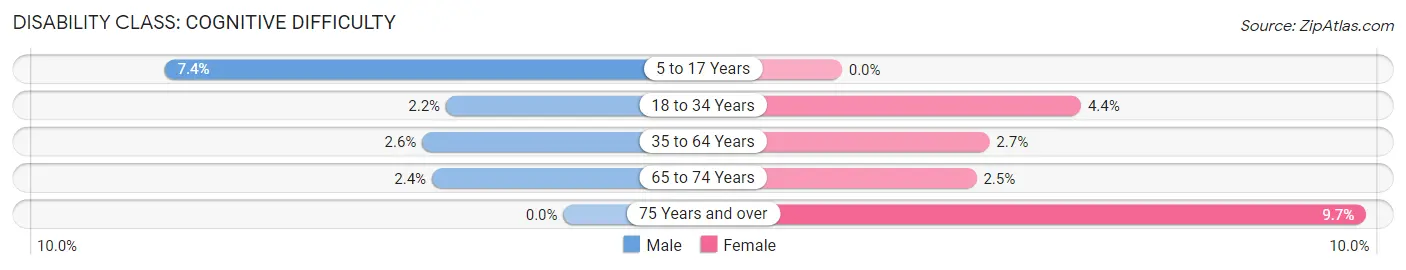
| Age Bracket | Male | Female |
| 5 to 17 Years | 35 (7.4%) | 0 (0.0%) |
| 18 to 34 Years | 13 (2.2%) | 33 (4.4%) |
| 35 to 64 Years | 51 (2.6%) | 42 (2.7%) |
| 65 to 74 Years | 9 (2.4%) | 7 (2.5%) |
| 75 Years and over | 0 (0.0%) | 22 (9.7%) |
Disability Class: Ambulatory Difficulty
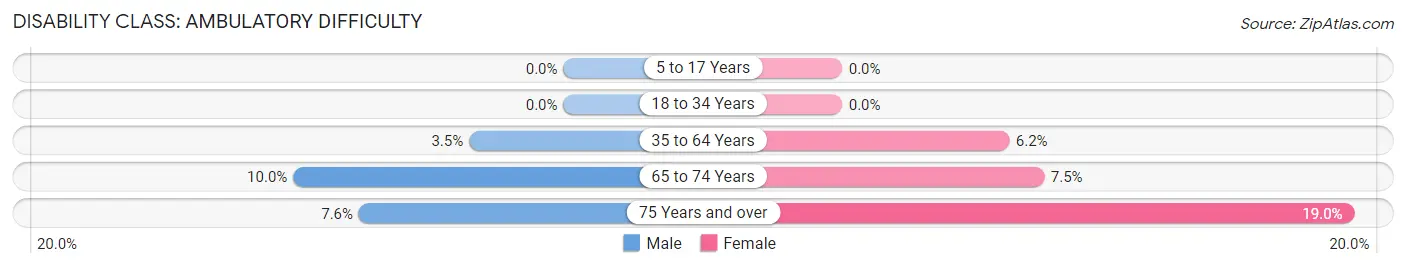
| Age Bracket | Male | Female |
| 5 to 17 Years | 0 (0.0%) | 0 (0.0%) |
| 18 to 34 Years | 0 (0.0%) | 0 (0.0%) |
| 35 to 64 Years | 68 (3.5%) | 95 (6.2%) |
| 65 to 74 Years | 37 (10.0%) | 21 (7.5%) |
| 75 Years and over | 17 (7.6%) | 43 (19.0%) |
Disability Class: Self-Care Difficulty
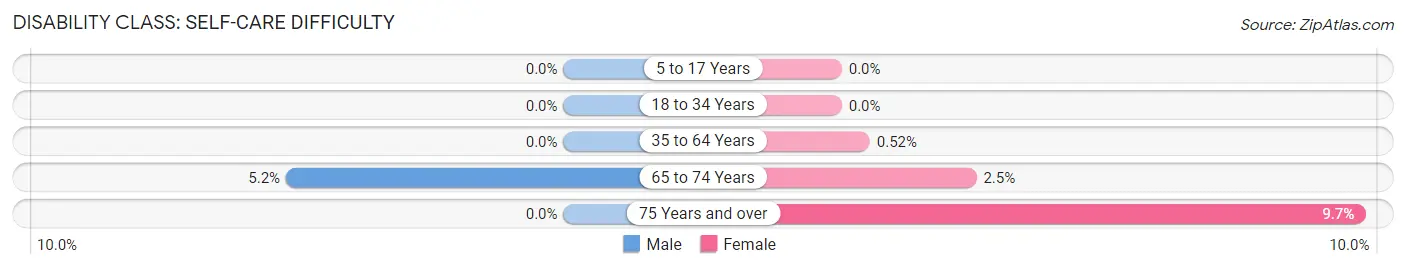
| Age Bracket | Male | Female |
| 5 to 17 Years | 0 (0.0%) | 0 (0.0%) |
| 18 to 34 Years | 0 (0.0%) | 0 (0.0%) |
| 35 to 64 Years | 0 (0.0%) | 8 (0.5%) |
| 65 to 74 Years | 19 (5.1%) | 7 (2.5%) |
| 75 Years and over | 0 (0.0%) | 22 (9.7%) |
Technology Access in Blandon
Computing Device Access in Blandon
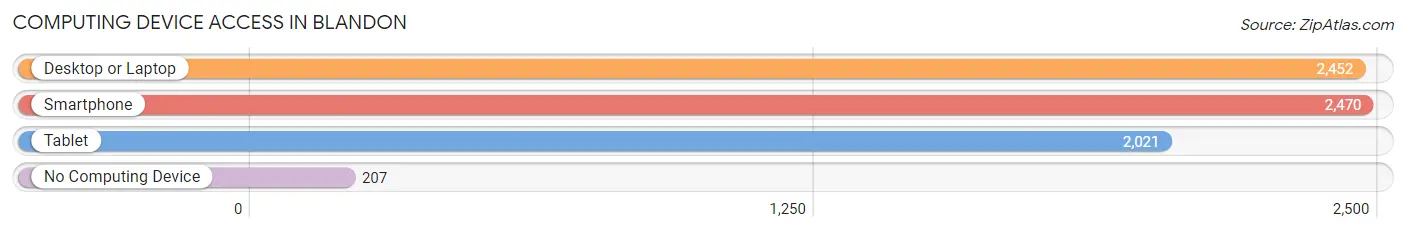
| Device Type | # Households | % Households |
| Desktop or Laptop | 2,452 | 87.0% |
| Smartphone | 2,470 | 87.6% |
| Tablet | 2,021 | 71.7% |
| No Computing Device | 207 | 7.3% |
| Total | 2,819 | 100.0% |
Internet Access in Blandon
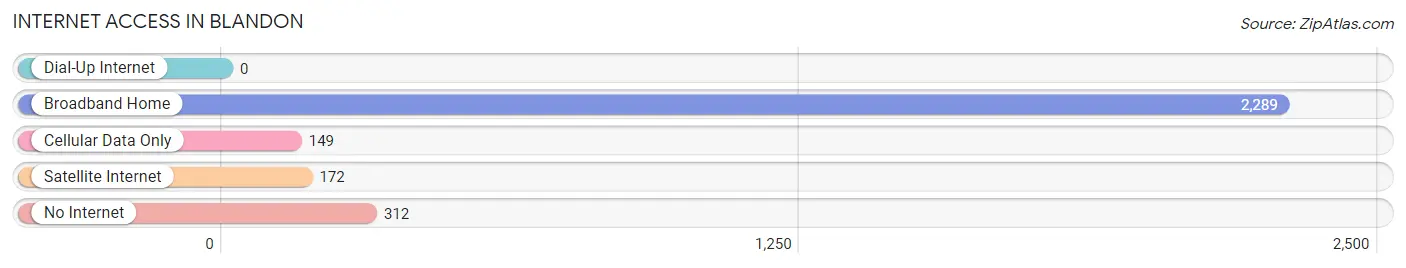
| Internet Type | # Households | % Households |
| Dial-Up Internet | 0 | 0.0% |
| Broadband Home | 2,289 | 81.2% |
| Cellular Data Only | 149 | 5.3% |
| Satellite Internet | 172 | 6.1% |
| No Internet | 312 | 11.1% |
| Total | 2,819 | 100.0% |
Blandon Summary
Blandon, Pennsylvania is a small borough located in Berks County, Pennsylvania. It is situated in the southeastern corner of the county, approximately 10 miles northeast of Reading. The population of Blandon was 2,845 at the 2010 census.
History
Blandon was first settled in 1737 by a group of German immigrants led by Johann Peter Blankenbuehler. The settlement was originally known as Blankenbuehler's Settlement, but was later changed to Blandon in 1845. The name Blandon is derived from the German word "Blankenbuehler," which means "white beech tree."
The first post office in Blandon was established in 1845. The first school was built in 1848, and the first church was built in 1851. The first railroad line was built in 1871, connecting Blandon to Reading.
Geography
Blandon is located at 40°22'45" North, 75°55'45" West (40.379167, -75.929167). It is situated in the southeastern corner of Berks County, approximately 10 miles northeast of Reading. The borough is bordered by Maidencreek Township to the north, Richmond Township to the east, and Ontelaunee Township to the south and west.
The borough has a total area of 0.9 square miles, all of which is land. Blandon is located in the Schuylkill River watershed. The borough is served by Pennsylvania Route 73 and U.S. Route 222.
Economy
Blandon's economy is largely based on agriculture and light manufacturing. The borough is home to several small businesses, including a feed mill, a lumber yard, and a machine shop. The borough is also home to several farms, including a dairy farm, a poultry farm, and a vegetable farm.
Demographics
As of the 2010 census, there were 2,845 people, 1,093 households, and 790 families residing in the borough. The population density was 3,097.2 people per square mile. There were 1,164 housing units at an average density of 1,272.2 per square mile. The racial makeup of the borough was 97.2% White, 0.7% African American, 0.2% Native American, 0.4% Asian, 0.2% from other races, and 1.3% from two or more races. Hispanic or Latino of any race were 1.3% of the population.
There were 1,093 households, out of which 33.2% had children under the age of 18 living with them, 56.2% were married couples living together, 10.2% had a female householder with no husband present, and 28.7% were non-families. 24.2% of all households were made up of individuals, and 10.2% had someone living alone who was 65 years of age or older. The average household size was 2.60 and the average family size was 3.09.
In the borough, the population was spread out, with 25.2% under the age of 18, 7.2% from 18 to 24, 30.2% from 25 to 44, 22.3% from 45 to 64, and 15.1% who were 65 years of age or older. The median age was 38 years. For every 100 females, there were 95.2 males. For every 100 females age 18 and over, there were 92.2 males.
The median income for a household in the borough was $50,938, and the median income for a family was $58,906. Males had a median income of $41,964 versus $30,938 for females. The per capita income for the borough was $22,845. About 4.2% of families and 5.7% of the population were below the poverty line, including 7.2% of those under age 18 and 4.2% of those age 65 or over.
Common Questions
What is Per Capita Income in Blandon?
Per Capita income in Blandon is $48,138.
What is the Median Family Income in Blandon?
Median Family Income in Blandon is $143,125.
What is the Median Household income in Blandon?
Median Household Income in Blandon is $111,292.
What is Income or Wage Gap in Blandon?
Income or Wage Gap in Blandon is 42.3%.
Women in Blandon earn 57.7 cents for every dollar earned by a man.
What is Inequality or Gini Index in Blandon?
Inequality or Gini Index in Blandon is 0.37.
What is the Total Population of Blandon?
Total Population of Blandon is 7,484.
What is the Total Male Population of Blandon?
Total Male Population of Blandon is 3,878.
What is the Total Female Population of Blandon?
Total Female Population of Blandon is 3,606.
What is the Ratio of Males per 100 Females in Blandon?
There are 107.54 Males per 100 Females in Blandon.
What is the Ratio of Females per 100 Males in Blandon?
There are 92.99 Females per 100 Males in Blandon.
What is the Median Population Age in Blandon?
Median Population Age in Blandon is 45.3 Years.
What is the Average Family Size in Blandon
Average Family Size in Blandon is 3.0 People.
What is the Average Household Size in Blandon
Average Household Size in Blandon is 2.6 People.
How Large is the Labor Force in Blandon?
There are 4,427 People in the Labor Forcein in Blandon.
What is the Percentage of People in the Labor Force in Blandon?
72.9% of People are in the Labor Force in Blandon.
What is the Unemployment Rate in Blandon?
Unemployment Rate in Blandon is 1.6%.