Cities with the Largest Hispanic or Latino Community in New Mexico
RELATED REPORTS & OPTIONS
Hispanic or Latino
New Mexico
Compare Cities
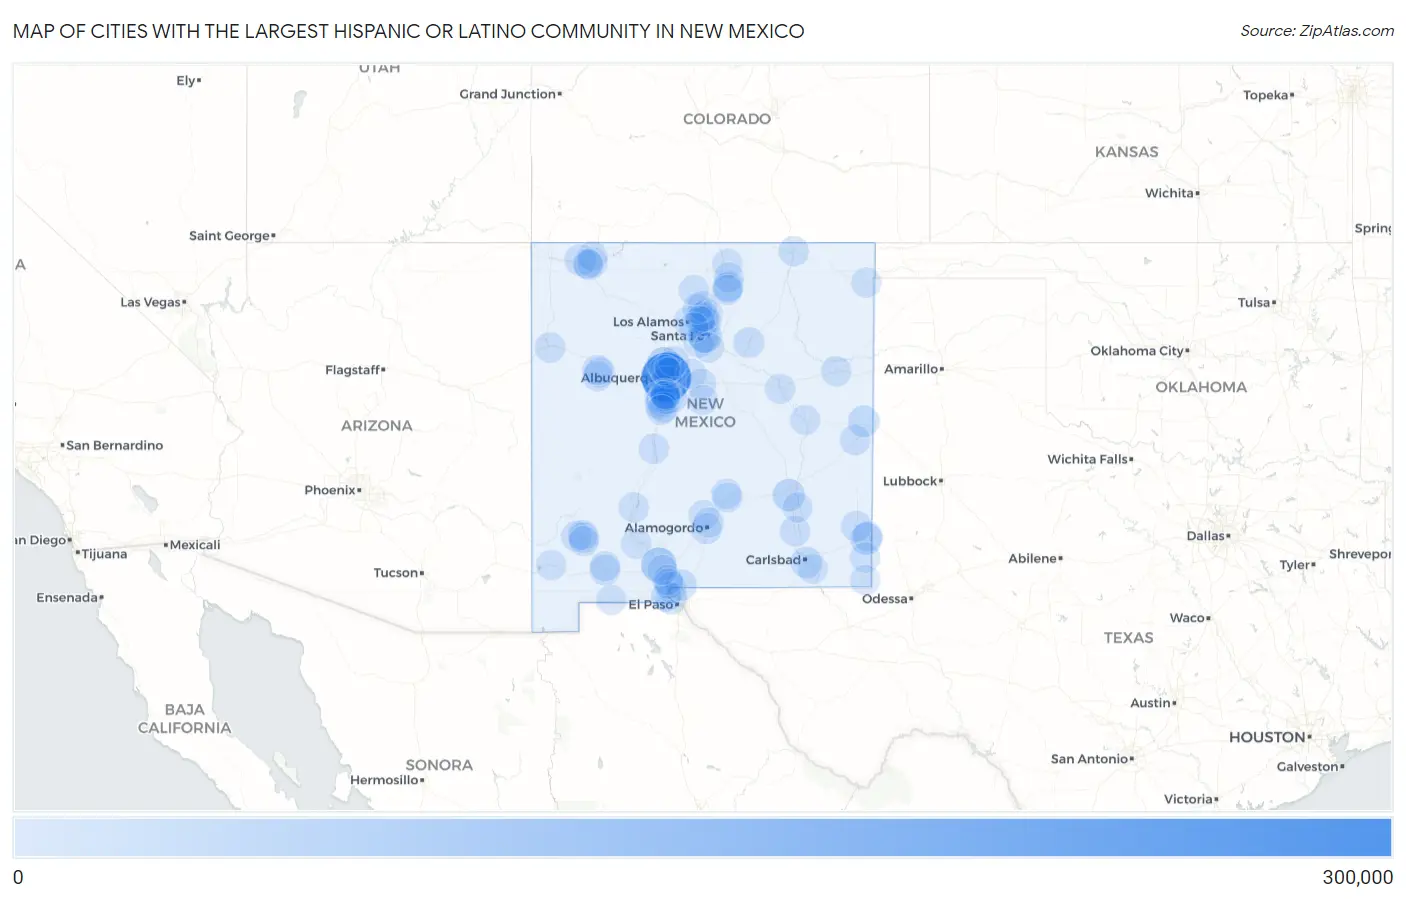
Map of Cities with the Largest Hispanic or Latino Community in New Mexico
0
300,000
Cities with the Largest Hispanic or Latino Community in New Mexico
| City | Hispanic or Latino | vs State | vs National | |
| 1. | Albuquerque | 279,981 | 1,051,626(26.62%)#1 | 61,755,866(0.45%)#15 |
| 2. | Las Cruces | 68,686 | 1,051,626(6.53%)#2 | 61,755,866(0.11%)#105 |
| 3. | Santa Fe | 46,481 | 1,051,626(4.42%)#3 | 61,755,866(0.08%)#181 |
| 4. | Rio Rancho | 45,330 | 1,051,626(4.31%)#4 | 61,755,866(0.07%)#185 |
| 5. | South Valley | 30,779 | 1,051,626(2.93%)#5 | 61,755,866(0.05%)#301 |
| 6. | Roswell | 29,383 | 1,051,626(2.79%)#6 | 61,755,866(0.05%)#315 |
| 7. | Hobbs | 24,983 | 1,051,626(2.38%)#7 | 61,755,866(0.04%)#381 |
| 8. | Clovis | 18,636 | 1,051,626(1.77%)#8 | 61,755,866(0.03%)#501 |
| 9. | Carlsbad | 18,073 | 1,051,626(1.72%)#9 | 61,755,866(0.03%)#526 |
| 10. | Sunland Park | 15,821 | 1,051,626(1.50%)#10 | 61,755,866(0.03%)#591 |
| 11. | Chaparral | 13,721 | 1,051,626(1.30%)#11 | 61,755,866(0.02%)#688 |
| 12. | Farmington | 11,993 | 1,051,626(1.14%)#12 | 61,755,866(0.02%)#767 |
| 13. | Deming | 11,067 | 1,051,626(1.05%)#13 | 61,755,866(0.02%)#827 |
| 14. | Los Lunas | 10,536 | 1,051,626(1.00%)#14 | 61,755,866(0.02%)#867 |
| 15. | Las Vegas | 10,340 | 1,051,626(0.98%)#15 | 61,755,866(0.02%)#881 |
| 16. | Alamogordo | 10,014 | 1,051,626(0.95%)#16 | 61,755,866(0.02%)#908 |
| 17. | Espanola | 8,882 | 1,051,626(0.84%)#17 | 61,755,866(0.01%)#1,016 |
| 18. | Anthony | 8,690 | 1,051,626(0.83%)#18 | 61,755,866(0.01%)#1,039 |
| 19. | Lovington | 7,937 | 1,051,626(0.75%)#19 | 61,755,866(0.01%)#1,115 |
| 20. | Gallup | 6,808 | 1,051,626(0.65%)#20 | 61,755,866(0.01%)#1,245 |
| 21. | Artesia | 6,759 | 1,051,626(0.64%)#21 | 61,755,866(0.01%)#1,252 |
| 22. | North Valley | 6,403 | 1,051,626(0.61%)#22 | 61,755,866(0.01%)#1,304 |
| 23. | Bernalillo | 6,257 | 1,051,626(0.59%)#23 | 61,755,866(0.01%)#1,329 |
| 24. | Portales | 5,356 | 1,051,626(0.51%)#24 | 61,755,866(0.01%)#1,485 |
| 25. | Grants | 5,286 | 1,051,626(0.50%)#25 | 61,755,866(0.01%)#1,500 |
| 26. | Santa Teresa | 5,171 | 1,051,626(0.49%)#26 | 61,755,866(0.01%)#1,527 |
| 27. | Belen | 5,139 | 1,051,626(0.49%)#27 | 61,755,866(0.01%)#1,531 |
| 28. | Silver City | 4,940 | 1,051,626(0.47%)#28 | 61,755,866(0.01%)#1,578 |
| 29. | El Cerro Mission | 4,114 | 1,051,626(0.39%)#29 | 61,755,866(0.01%)#1,827 |
| 30. | Socorro | 4,052 | 1,051,626(0.39%)#30 | 61,755,866(0.01%)#1,849 |
| 31. | Meadow Lake | 3,585 | 1,051,626(0.34%)#31 | 61,755,866(0.01%)#2,028 |
| 32. | Tucumcari | 3,370 | 1,051,626(0.32%)#32 | 61,755,866(0.01%)#2,113 |
| 33. | Raton | 3,361 | 1,051,626(0.32%)#33 | 61,755,866(0.01%)#2,118 |
| 34. | Vado | 3,219 | 1,051,626(0.31%)#34 | 61,755,866(0.01%)#2,195 |
| 35. | La Cienega | 3,113 | 1,051,626(0.30%)#35 | 61,755,866(0.01%)#2,244 |
| 36. | Taos | 3,108 | 1,051,626(0.30%)#36 | 61,755,866(0.01%)#2,247 |
| 37. | North Hobbs | 2,985 | 1,051,626(0.28%)#37 | 61,755,866(0.00%)#2,297 |
| 38. | Los Chaves | 2,721 | 1,051,626(0.26%)#38 | 61,755,866(0.00%)#2,456 |
| 39. | Los Ranchos De Albuquerque | 2,685 | 1,051,626(0.26%)#39 | 61,755,866(0.00%)#2,481 |
| 40. | Chimayo | 2,567 | 1,051,626(0.24%)#40 | 61,755,866(0.00%)#2,559 |
| 41. | El Cerro | 2,518 | 1,051,626(0.24%)#41 | 61,755,866(0.00%)#2,594 |
| 42. | Ruidoso | 2,386 | 1,051,626(0.23%)#42 | 61,755,866(0.00%)#2,683 |
| 43. | Los Alamos | 2,371 | 1,051,626(0.23%)#43 | 61,755,866(0.00%)#2,691 |
| 44. | Rio Communities | 2,305 | 1,051,626(0.22%)#44 | 61,755,866(0.00%)#2,730 |
| 45. | Bloomfield | 2,265 | 1,051,626(0.22%)#45 | 61,755,866(0.00%)#2,771 |
| 46. | Edgewood | 2,225 | 1,051,626(0.21%)#46 | 61,755,866(0.00%)#2,805 |
| 47. | Truth Or Consequences | 2,221 | 1,051,626(0.21%)#47 | 61,755,866(0.00%)#2,809 |
| 48. | Corrales | 2,178 | 1,051,626(0.21%)#48 | 61,755,866(0.00%)#2,847 |
| 49. | Paradise Hills | 2,105 | 1,051,626(0.20%)#49 | 61,755,866(0.00%)#2,927 |
| 50. | Santa Rosa | 2,047 | 1,051,626(0.19%)#50 | 61,755,866(0.00%)#2,978 |
| 51. | Peralta | 2,027 | 1,051,626(0.19%)#51 | 61,755,866(0.00%)#3,003 |
| 52. | Crouch Mesa | 2,002 | 1,051,626(0.19%)#52 | 61,755,866(0.00%)#3,035 |
| 53. | Questa | 1,977 | 1,051,626(0.19%)#53 | 61,755,866(0.00%)#3,059 |
| 54. | Agua Fria | 1,867 | 1,051,626(0.18%)#54 | 61,755,866(0.00%)#3,186 |
| 55. | San Rafael | 1,861 | 1,051,626(0.18%)#55 | 61,755,866(0.00%)#3,191 |
| 56. | Ranchos De Taos | 1,768 | 1,051,626(0.17%)#56 | 61,755,866(0.00%)#3,283 |
| 57. | Bayard | 1,743 | 1,051,626(0.17%)#57 | 61,755,866(0.00%)#3,310 |
| 58. | La Mesilla | 1,731 | 1,051,626(0.16%)#58 | 61,755,866(0.00%)#3,331 |
| 59. | Bosque Farms | 1,725 | 1,051,626(0.16%)#59 | 61,755,866(0.00%)#3,335 |
| 60. | Tularosa | 1,661 | 1,051,626(0.16%)#60 | 61,755,866(0.00%)#3,403 |
| 61. | Eunice | 1,618 | 1,051,626(0.15%)#61 | 61,755,866(0.00%)#3,467 |
| 62. | Lordsburg | 1,558 | 1,051,626(0.15%)#62 | 61,755,866(0.00%)#3,545 |
| 63. | Pojoaque | 1,540 | 1,051,626(0.15%)#63 | 61,755,866(0.00%)#3,571 |
| 64. | Aztec | 1,533 | 1,051,626(0.15%)#64 | 61,755,866(0.00%)#3,581 |
| 65. | Clayton | 1,489 | 1,051,626(0.14%)#65 | 61,755,866(0.00%)#3,649 |
| 66. | Milan | 1,443 | 1,051,626(0.14%)#66 | 61,755,866(0.00%)#3,719 |
| 67. | Arroyo Seco | 1,418 | 1,051,626(0.13%)#67 | 61,755,866(0.00%)#3,755 |
| 68. | Hatch | 1,412 | 1,051,626(0.13%)#68 | 61,755,866(0.00%)#3,771 |
| 69. | Nambe | 1,395 | 1,051,626(0.13%)#69 | 61,755,866(0.00%)#3,800 |
| 70. | La Villita | 1,392 | 1,051,626(0.13%)#70 | 61,755,866(0.00%)#3,805 |
| 71. | Santa Clara | 1,369 | 1,051,626(0.13%)#71 | 61,755,866(0.00%)#3,844 |
| 72. | El Valle De Arroyo Seco | 1,354 | 1,051,626(0.13%)#72 | 61,755,866(0.00%)#3,871 |
| 73. | Ruidoso Downs | 1,315 | 1,051,626(0.13%)#73 | 61,755,866(0.00%)#3,944 |
| 74. | Valencia | 1,305 | 1,051,626(0.12%)#74 | 61,755,866(0.00%)#3,963 |
| 75. | Moriarty | 1,295 | 1,051,626(0.12%)#75 | 61,755,866(0.00%)#3,978 |
| 76. | Dona Ana | 1,287 | 1,051,626(0.12%)#76 | 61,755,866(0.00%)#3,987 |
| 77. | Jal | 1,270 | 1,051,626(0.12%)#77 | 61,755,866(0.00%)#4,014 |
| 78. | Angustura | 1,262 | 1,051,626(0.12%)#78 | 61,755,866(0.00%)#4,026 |
| 79. | Berino | 1,250 | 1,051,626(0.12%)#79 | 61,755,866(0.00%)#4,052 |
| 80. | University Park | 1,243 | 1,051,626(0.12%)#80 | 61,755,866(0.00%)#4,064 |
| 81. | Loving | 1,182 | 1,051,626(0.11%)#81 | 61,755,866(0.00%)#4,196 |
| 82. | Hurley | 1,176 | 1,051,626(0.11%)#82 | 61,755,866(0.00%)#4,212 |
| 83. | Jarales | 1,175 | 1,051,626(0.11%)#83 | 61,755,866(0.00%)#4,216 |
| 84. | Columbus | 1,157 | 1,051,626(0.11%)#84 | 61,755,866(0.00%)#4,248 |
| 85. | El Rancho | 1,144 | 1,051,626(0.11%)#85 | 61,755,866(0.00%)#4,270 |
| 86. | Kirtland Afb | 1,142 | 1,051,626(0.11%)#86 | 61,755,866(0.00%)#4,273 |
| 87. | Estancia | 1,116 | 1,051,626(0.11%)#87 | 61,755,866(0.00%)#4,321 |
| 88. | El Duende | 1,109 | 1,051,626(0.11%)#88 | 61,755,866(0.00%)#4,342 |
| 89. | White Rock | 1,091 | 1,051,626(0.10%)#89 | 61,755,866(0.00%)#4,383 |
| 90. | West Hammond | 1,051 | 1,051,626(0.10%)#90 | 61,755,866(0.00%)#4,492 |
| 91. | La Luz | 1,008 | 1,051,626(0.10%)#91 | 61,755,866(0.00%)#4,591 |
| 92. | Rio Rancho Estates | 1,003 | 1,051,626(0.10%)#92 | 61,755,866(0.00%)#4,609 |
| 93. | Lee Acres | 991 | 1,051,626(0.09%)#93 | 61,755,866(0.00%)#4,639 |
| 94. | Keeler Farm | 989 | 1,051,626(0.09%)#94 | 61,755,866(0.00%)#4,646 |
| 95. | Gamerco | 974 | 1,051,626(0.09%)#95 | 61,755,866(0.00%)#4,700 |
| 96. | El Rito | 973 | 1,051,626(0.09%)#96 | 61,755,866(0.00%)#4,704 |
| 97. | Dexter | 910 | 1,051,626(0.09%)#97 | 61,755,866(0.00%)#4,893 |
| 98. | Talpa | 900 | 1,051,626(0.09%)#98 | 61,755,866(0.00%)#4,921 |
| 99. | Eldorado At Santa Fe | 897 | 1,051,626(0.09%)#99 | 61,755,866(0.00%)#4,930 |
| 100. | Fort Sumner | 896 | 1,051,626(0.09%)#100 | 61,755,866(0.00%)#4,934 |
Common Questions
What are the Top 10 Cities with the Largest Hispanic or Latino Community in New Mexico?
Top 10 Cities with the Largest Hispanic or Latino Community in New Mexico are:
#1
279,981
#2
68,686
#3
46,481
#4
45,330
#5
30,779
#6
29,383
#7
24,983
#8
18,636
#9
18,073
#10
15,821
What city has the Largest Hispanic or Latino Community in New Mexico?
Albuquerque has the Largest Hispanic or Latino Community in New Mexico with 279,981.
What is the Total Hispanic or Latino Population in the State of New Mexico?
Total Hispanic or Latino Population in New Mexico is 1,051,626.
What is the Total Hispanic or Latino Population in the United States?
Total Hispanic or Latino Population in the United States is 61,755,866.