Cities with the Largest Hispanic or Latino Community in Puerto Rico
RELATED REPORTS & OPTIONS
Hispanic or Latino
Puerto Rico
Compare Cities
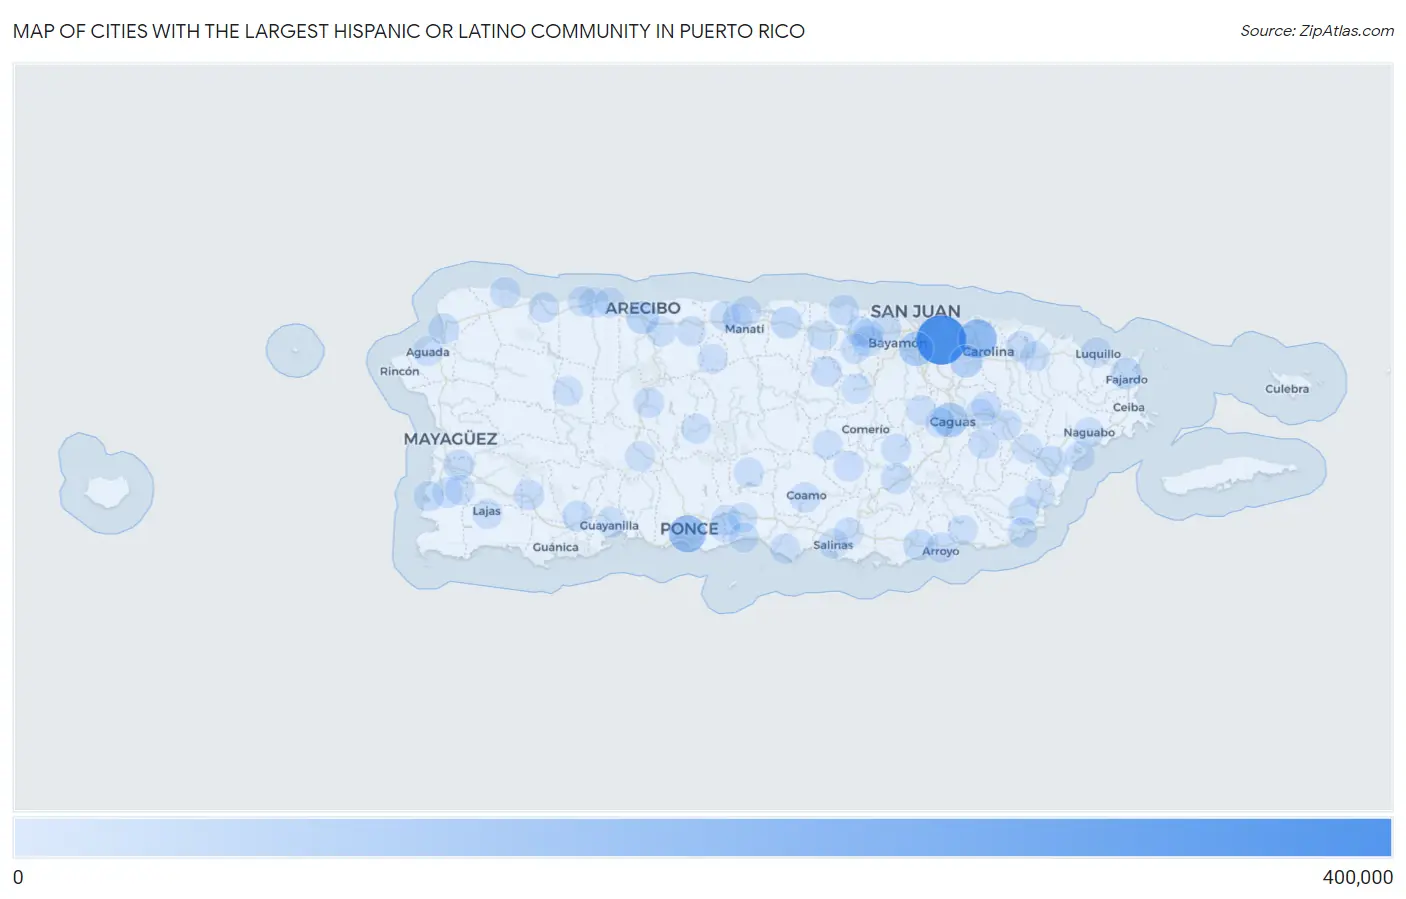
Map of Cities with the Largest Hispanic or Latino Community in Puerto Rico
0
400,000
Cities with the Largest Hispanic or Latino Community in Puerto Rico
| City | Hispanic or Latino | vs State | vs National | |
| 1. | San Juan | 315,789 | 3,231,327(9.77%)#1 | 61,755,866(0.51%)#12 |
| 2. | Bayamón | 166,711 | 3,231,327(5.16%)#2 | 61,755,866(0.27%)#30 |
| 3. | Carolina | 137,398 | 3,231,327(4.25%)#3 | 61,755,866(0.22%)#38 |
| 4. | Ponce | 110,019 | 3,231,327(3.40%)#4 | 61,755,866(0.18%)#55 |
| 5. | Caguas | 72,206 | 3,231,327(2.23%)#5 | 61,755,866(0.12%)#95 |
| 6. | Guaynabo | 68,876 | 3,231,327(2.13%)#6 | 61,755,866(0.11%)#104 |
| 7. | Mayaguez | 59,511 | 3,231,327(1.84%)#7 | 61,755,866(0.10%)#126 |
| 8. | Trujillo Alto | 42,896 | 3,231,327(1.33%)#8 | 61,755,866(0.07%)#203 |
| 9. | Arecibo | 40,243 | 3,231,327(1.25%)#9 | 61,755,866(0.07%)#223 |
| 10. | Mansión Del Mar | 26,979 | 3,231,327(0.83%)#10 | 61,755,866(0.04%)#341 |
| 11. | Fajardo | 25,518 | 3,231,327(0.79%)#11 | 61,755,866(0.04%)#374 |
| 12. | Vega Baja | 22,961 | 3,231,327(0.71%)#12 | 61,755,866(0.04%)#407 |
| 13. | Catano | 22,781 | 3,231,327(0.71%)#13 | 61,755,866(0.04%)#414 |
| 14. | Guayama | 18,001 | 3,231,327(0.56%)#14 | 61,755,866(0.03%)#530 |
| 15. | Humacao | 16,632 | 3,231,327(0.51%)#15 | 61,755,866(0.03%)#568 |
| 16. | Yauco | 15,084 | 3,231,327(0.47%)#16 | 61,755,866(0.02%)#615 |
| 17. | Cayey | 14,413 | 3,231,327(0.45%)#17 | 61,755,866(0.02%)#643 |
| 18. | Candelaria | 13,978 | 3,231,327(0.43%)#18 | 61,755,866(0.02%)#670 |
| 19. | Dorado | 12,602 | 3,231,327(0.39%)#19 | 61,755,866(0.02%)#726 |
| 20. | Canovanas | 12,439 | 3,231,327(0.38%)#20 | 61,755,866(0.02%)#738 |
| 21. | Rio Grande | 12,254 | 3,231,327(0.38%)#21 | 61,755,866(0.02%)#750 |
| 22. | Caño Martin Peña | 11,876 | 3,231,327(0.37%)#22 | 61,755,866(0.02%)#775 |
| 23. | Aguadilla | 11,231 | 3,231,327(0.35%)#23 | 61,755,866(0.02%)#816 |
| 24. | Hormigueros | 11,097 | 3,231,327(0.34%)#24 | 61,755,866(0.02%)#824 |
| 25. | Manati | 10,972 | 3,231,327(0.34%)#25 | 61,755,866(0.02%)#833 |
| 26. | Sabana Grande | 10,269 | 3,231,327(0.32%)#26 | 61,755,866(0.02%)#887 |
| 27. | San German | 10,213 | 3,231,327(0.32%)#27 | 61,755,866(0.02%)#894 |
| 28. | Cabo Rojo | 10,098 | 3,231,327(0.31%)#28 | 61,755,866(0.02%)#904 |
| 29. | Pajaros | 9,986 | 3,231,327(0.31%)#29 | 61,755,866(0.02%)#914 |
| 30. | Corozal | 9,964 | 3,231,327(0.31%)#30 | 61,755,866(0.02%)#915 |
| 31. | Isabela | 9,819 | 3,231,327(0.30%)#31 | 61,755,866(0.02%)#931 |
| 32. | Coamo | 9,762 | 3,231,327(0.30%)#32 | 61,755,866(0.02%)#938 |
| 33. | Vega Alta | 9,081 | 3,231,327(0.28%)#33 | 61,755,866(0.01%)#997 |
| 34. | Juncos | 8,886 | 3,231,327(0.27%)#34 | 61,755,866(0.01%)#1,014 |
| 35. | San Sebastian | 8,758 | 3,231,327(0.27%)#35 | 61,755,866(0.01%)#1,033 |
| 36. | Aibonito | 8,590 | 3,231,327(0.27%)#36 | 61,755,866(0.01%)#1,048 |
| 37. | San Lorenzo | 8,563 | 3,231,327(0.26%)#37 | 61,755,866(0.01%)#1,050 |
| 38. | Juana Diaz | 8,140 | 3,231,327(0.25%)#38 | 61,755,866(0.01%)#1,093 |
| 39. | Luquillo | 7,859 | 3,231,327(0.24%)#39 | 61,755,866(0.01%)#1,129 |
| 40. | Sabana Seca | 7,768 | 3,231,327(0.24%)#40 | 61,755,866(0.01%)#1,138 |
| 41. | Arroyo | 7,746 | 3,231,327(0.24%)#41 | 61,755,866(0.01%)#1,141 |
| 42. | Utuado | 7,428 | 3,231,327(0.23%)#42 | 61,755,866(0.01%)#1,170 |
| 43. | San Antonio Comunidad Dorado Municipio | 7,338 | 3,231,327(0.23%)#43 | 61,755,866(0.01%)#1,178 |
| 44. | San Isidro | 7,285 | 3,231,327(0.23%)#44 | 61,755,866(0.01%)#1,180 |
| 45. | Gurabo | 6,773 | 3,231,327(0.21%)#45 | 61,755,866(0.01%)#1,249 |
| 46. | Puerto Real | 6,325 | 3,231,327(0.20%)#46 | 61,755,866(0.01%)#1,319 |
| 47. | Yabucoa | 6,072 | 3,231,327(0.19%)#47 | 61,755,866(0.01%)#1,353 |
| 48. | Cidra | 6,020 | 3,231,327(0.19%)#48 | 61,755,866(0.01%)#1,359 |
| 49. | Quebradillas | 6,015 | 3,231,327(0.19%)#49 | 61,755,866(0.01%)#1,360 |
| 50. | Guanica | 5,449 | 3,231,327(0.17%)#50 | 61,755,866(0.01%)#1,468 |
| 51. | Penuelas | 5,238 | 3,231,327(0.16%)#51 | 61,755,866(0.01%)#1,510 |
| 52. | Santa Isabel | 5,133 | 3,231,327(0.16%)#52 | 61,755,866(0.01%)#1,533 |
| 53. | Coco | 5,006 | 3,231,327(0.15%)#53 | 61,755,866(0.01%)#1,561 |
| 54. | Naguabo | 5,001 | 3,231,327(0.15%)#54 | 61,755,866(0.01%)#1,563 |
| 55. | Las Piedras | 4,984 | 3,231,327(0.15%)#55 | 61,755,866(0.01%)#1,569 |
| 56. | Lares | 4,819 | 3,231,327(0.15%)#56 | 61,755,866(0.01%)#1,611 |
| 57. | Adjuntas | 4,706 | 3,231,327(0.15%)#57 | 61,755,866(0.01%)#1,635 |
| 58. | Lajas | 4,510 | 3,231,327(0.14%)#58 | 61,755,866(0.01%)#1,694 |
| 59. | Santa Barbara | 4,368 | 3,231,327(0.14%)#59 | 61,755,866(0.01%)#1,742 |
| 60. | Salinas | 4,338 | 3,231,327(0.13%)#60 | 61,755,866(0.01%)#1,749 |
| 61. | Anasco | 4,215 | 3,231,327(0.13%)#61 | 61,755,866(0.01%)#1,788 |
| 62. | Candelaria Arenas | 4,199 | 3,231,327(0.13%)#62 | 61,755,866(0.01%)#1,793 |
| 63. | Aguilita | 4,197 | 3,231,327(0.13%)#63 | 61,755,866(0.01%)#1,796 |
| 64. | Florida | 4,175 | 3,231,327(0.13%)#64 | 61,755,866(0.01%)#1,807 |
| 65. | Imbery | 4,174 | 3,231,327(0.13%)#65 | 61,755,866(0.01%)#1,808 |
| 66. | Hatillo | 4,019 | 3,231,327(0.12%)#66 | 61,755,866(0.01%)#1,857 |
| 67. | Campanilla | 3,988 | 3,231,327(0.12%)#67 | 61,755,866(0.01%)#1,874 |
| 68. | Comerio | 3,656 | 3,231,327(0.11%)#68 | 61,755,866(0.01%)#2,001 |
| 69. | Punta Santiago | 3,609 | 3,231,327(0.11%)#69 | 61,755,866(0.01%)#2,021 |
| 70. | Camuy | 3,585 | 3,231,327(0.11%)#70 | 61,755,866(0.01%)#2,030 |
| 71. | Brenas | 3,557 | 3,231,327(0.11%)#71 | 61,755,866(0.01%)#2,041 |
| 72. | Bajadero | 3,539 | 3,231,327(0.11%)#72 | 61,755,866(0.01%)#2,049 |
| 73. | Barceloneta | 3,485 | 3,231,327(0.11%)#73 | 61,755,866(0.01%)#2,069 |
| 74. | Naranjito | 3,441 | 3,231,327(0.11%)#74 | 61,755,866(0.01%)#2,084 |
| 75. | Hacienda San Jose | 3,384 | 3,231,327(0.10%)#75 | 61,755,866(0.01%)#2,110 |
| 76. | Caban | 3,310 | 3,231,327(0.10%)#76 | 61,755,866(0.01%)#2,144 |
| 77. | Guayanilla | 3,288 | 3,231,327(0.10%)#77 | 61,755,866(0.01%)#2,161 |
| 78. | Aguas Buenas | 3,242 | 3,231,327(0.10%)#78 | 61,755,866(0.01%)#2,182 |
| 79. | Celada | 3,232 | 3,231,327(0.10%)#79 | 61,755,866(0.01%)#2,191 |
| 80. | Toa Alta | 3,230 | 3,231,327(0.10%)#80 | 61,755,866(0.01%)#2,192 |
| 81. | Sabana Hoyos | 3,154 | 3,231,327(0.10%)#81 | 61,755,866(0.01%)#2,225 |
| 82. | Tierras Nuevas Poniente | 3,115 | 3,231,327(0.10%)#82 | 61,755,866(0.01%)#2,243 |
| 83. | Los Prados | 3,003 | 3,231,327(0.09%)#83 | 61,755,866(0.00%)#2,290 |
| 84. | Comunas | 2,983 | 3,231,327(0.09%)#84 | 61,755,866(0.00%)#2,300 |
| 85. | Patillas | 2,955 | 3,231,327(0.09%)#85 | 61,755,866(0.00%)#2,316 |
| 86. | La Luisa | 2,937 | 3,231,327(0.09%)#86 | 61,755,866(0.00%)#2,334 |
| 87. | Coqui | 2,914 | 3,231,327(0.09%)#87 | 61,755,866(0.00%)#2,341 |
| 88. | Carrizales | 2,889 | 3,231,327(0.09%)#88 | 61,755,866(0.00%)#2,351 |
| 89. | Emajagua | 2,887 | 3,231,327(0.09%)#89 | 61,755,866(0.00%)#2,353 |
| 90. | Monte Grande | 2,885 | 3,231,327(0.09%)#90 | 61,755,866(0.00%)#2,354 |
| 91. | Aguada | 2,877 | 3,231,327(0.09%)#91 | 61,755,866(0.00%)#2,362 |
| 92. | Jayuya | 2,841 | 3,231,327(0.09%)#92 | 61,755,866(0.00%)#2,386 |
| 93. | Barranquitas | 2,812 | 3,231,327(0.09%)#93 | 61,755,866(0.00%)#2,410 |
| 94. | La Dolores | 2,808 | 3,231,327(0.09%)#94 | 61,755,866(0.00%)#2,411 |
| 95. | Capitanejo | 2,751 | 3,231,327(0.09%)#95 | 61,755,866(0.00%)#2,437 |
| 96. | Villalba | 2,728 | 3,231,327(0.08%)#96 | 61,755,866(0.00%)#2,449 |
| 97. | Loiza | 2,714 | 3,231,327(0.08%)#97 | 61,755,866(0.00%)#2,461 |
| 98. | Piedra Aguza | 2,706 | 3,231,327(0.08%)#98 | 61,755,866(0.00%)#2,467 |
| 99. | Potala Pastillo | 2,679 | 3,231,327(0.08%)#99 | 61,755,866(0.00%)#2,491 |
| 100. | Brisas Del Campanero | 2,668 | 3,231,327(0.08%)#100 | 61,755,866(0.00%)#2,499 |
Common Questions
What are the Top 10 Cities with the Largest Hispanic or Latino Community in Puerto Rico?
Top 10 Cities with the Largest Hispanic or Latino Community in Puerto Rico are:
What city has the Largest Hispanic or Latino Community in Puerto Rico?
San Juan has the Largest Hispanic or Latino Community in Puerto Rico with 315,789.
What is the Total Hispanic or Latino Population in the State of Puerto Rico?
Total Hispanic or Latino Population in Puerto Rico is 3,231,327.
What is the Total Hispanic or Latino Population in the United States?
Total Hispanic or Latino Population in the United States is 61,755,866.