Fayette, OH Map & Demographics
Fayette Map
Fayette Overview
$22,472
PER CAPITA INCOME
$57,500
AVG FAMILY INCOME
$41,016
AVG HOUSEHOLD INCOME
$7,684
FAMILY INCOME DEFICIT
0.44
INEQUALITY / GINI INDEX
1,177
TOTAL POPULATION
552
MALE POPULATION
625
FEMALE POPULATION
88.32
MALES / 100 FEMALES
113.22
FEMALES / 100 MALES
44.9
MEDIAN AGE
2.7
AVG FAMILY SIZE
2.1
AVG HOUSEHOLD SIZE
609
LABOR FORCE [ PEOPLE ]
58.3%
PERCENT IN LABOR FORCE
5.3%
UNEMPLOYMENT RATE
Fayette Zip Codes
Income in Fayette
Income Overview in Fayette
Per Capita Income in Fayette is $22,472, while median incomes of families and households are $57,500 and $41,016 respectively.
| Characteristic | Number | Measure |
| Per Capita Income | 1,177 | $22,472 |
| Median Family Income | 330 | $57,500 |
| Mean Family Income | 330 | $56,974 |
| Median Household Income | 553 | $41,016 |
| Mean Household Income | 553 | $47,405 |
| Income Deficit | 330 | $7,684 |
| Wage / Income Gap (%) | 1,177 | 0.00% |
| Wage / Income Gap ($) | 1,177 | 100.00¢ per $1 |
| Gini / Inequality Index | 1,177 | 0.44 |
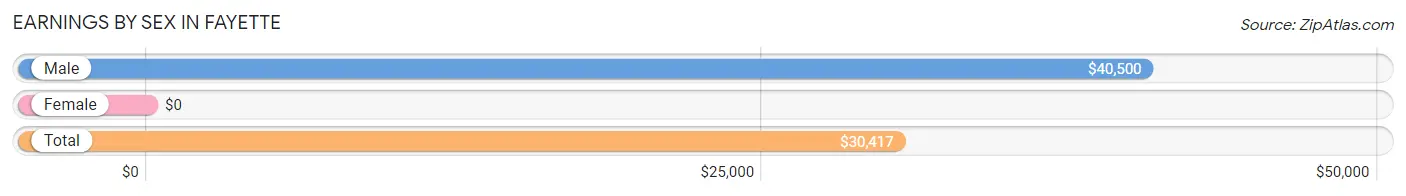
Earnings by Sex in Fayette
| Sex | Number | Average Earnings |
| Male | 268 (43.8%) | $40,500 |
| Female | 344 (56.2%) | $0 |
| Total | 612 (100.0%) | $30,417 |
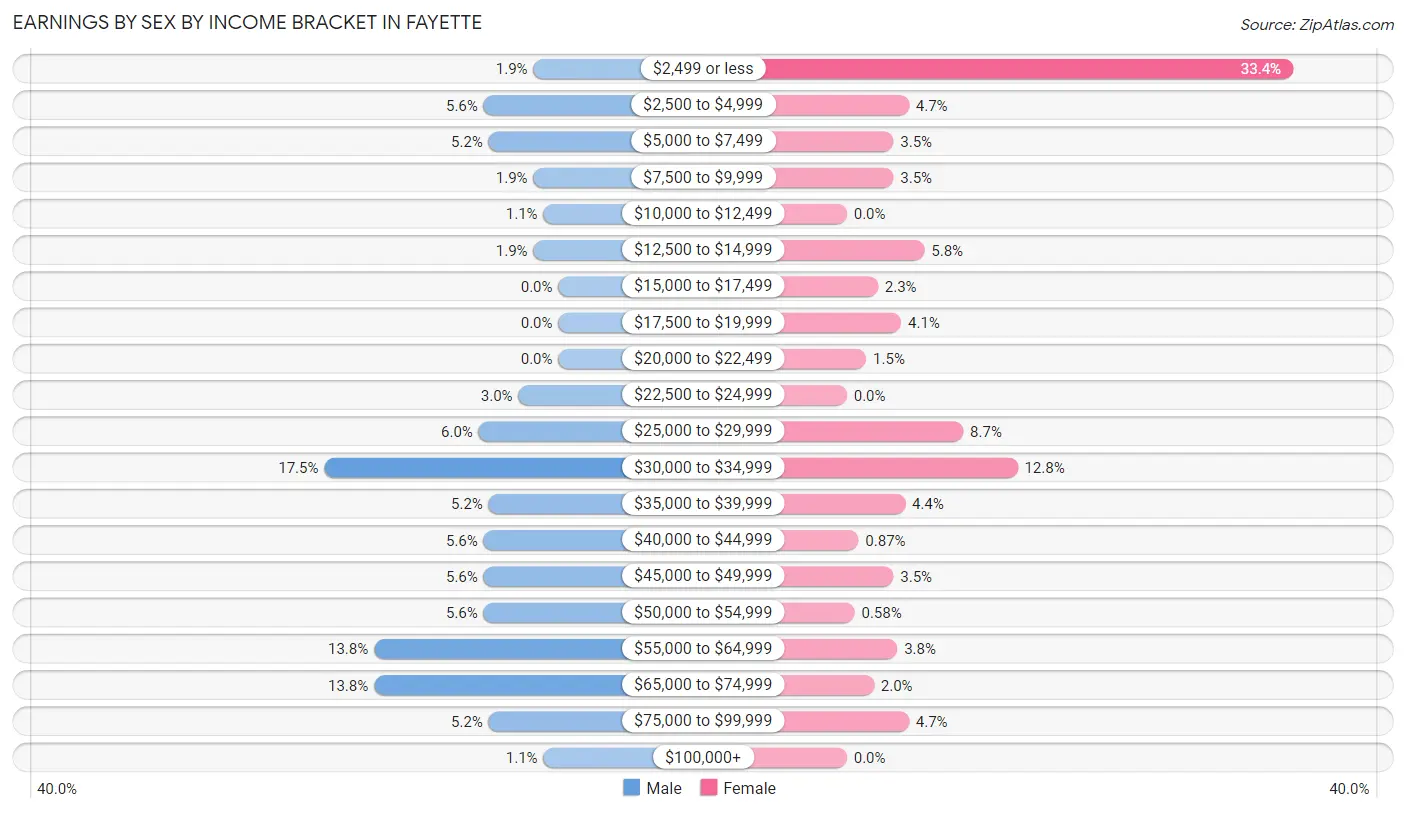
Earnings by Sex by Income Bracket in Fayette
The most common earnings brackets in Fayette are $30,000 to $34,999 for men (47 | 17.5%) and $2,499 or less for women (115 | 33.4%).
| Income | Male | Female |
| $2,499 or less | 5 (1.9%) | 115 (33.4%) |
| $2,500 to $4,999 | 15 (5.6%) | 16 (4.6%) |
| $5,000 to $7,499 | 14 (5.2%) | 12 (3.5%) |
| $7,500 to $9,999 | 5 (1.9%) | 12 (3.5%) |
| $10,000 to $12,499 | 3 (1.1%) | 0 (0.0%) |
| $12,500 to $14,999 | 5 (1.9%) | 20 (5.8%) |
| $15,000 to $17,499 | 0 (0.0%) | 8 (2.3%) |
| $17,500 to $19,999 | 0 (0.0%) | 14 (4.1%) |
| $20,000 to $22,499 | 0 (0.0%) | 5 (1.5%) |
| $22,500 to $24,999 | 8 (3.0%) | 0 (0.0%) |
| $25,000 to $29,999 | 16 (6.0%) | 30 (8.7%) |
| $30,000 to $34,999 | 47 (17.5%) | 44 (12.8%) |
| $35,000 to $39,999 | 14 (5.2%) | 15 (4.4%) |
| $40,000 to $44,999 | 15 (5.6%) | 3 (0.9%) |
| $45,000 to $49,999 | 15 (5.6%) | 12 (3.5%) |
| $50,000 to $54,999 | 15 (5.6%) | 2 (0.6%) |
| $55,000 to $64,999 | 37 (13.8%) | 13 (3.8%) |
| $65,000 to $74,999 | 37 (13.8%) | 7 (2.0%) |
| $75,000 to $99,999 | 14 (5.2%) | 16 (4.6%) |
| $100,000+ | 3 (1.1%) | 0 (0.0%) |
| Total | 268 (100.0%) | 344 (100.0%) |
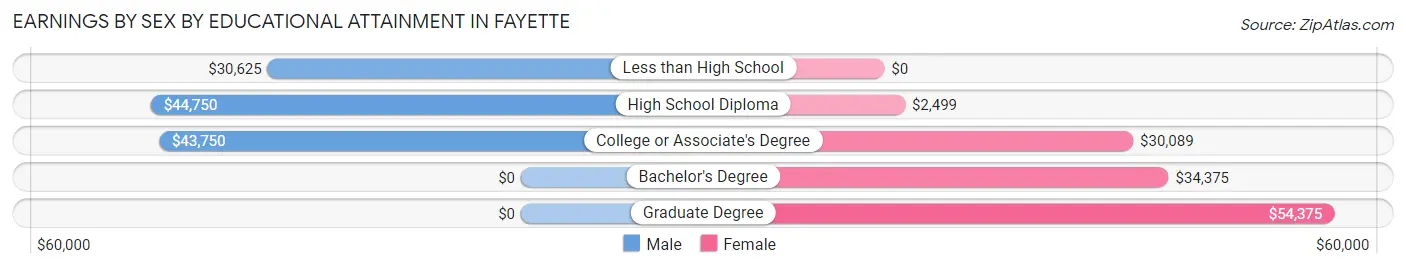
Earnings by Sex by Educational Attainment in Fayette
| Educational Attainment | Male Income | Female Income |
| Less than High School | $30,625 | $0 |
| High School Diploma | $44,750 | $2,499 |
| College or Associate's Degree | $43,750 | $30,089 |
| Bachelor's Degree | - | - |
| Graduate Degree | - | - |
| Total | $41,875 | $0 |
Family Income in Fayette
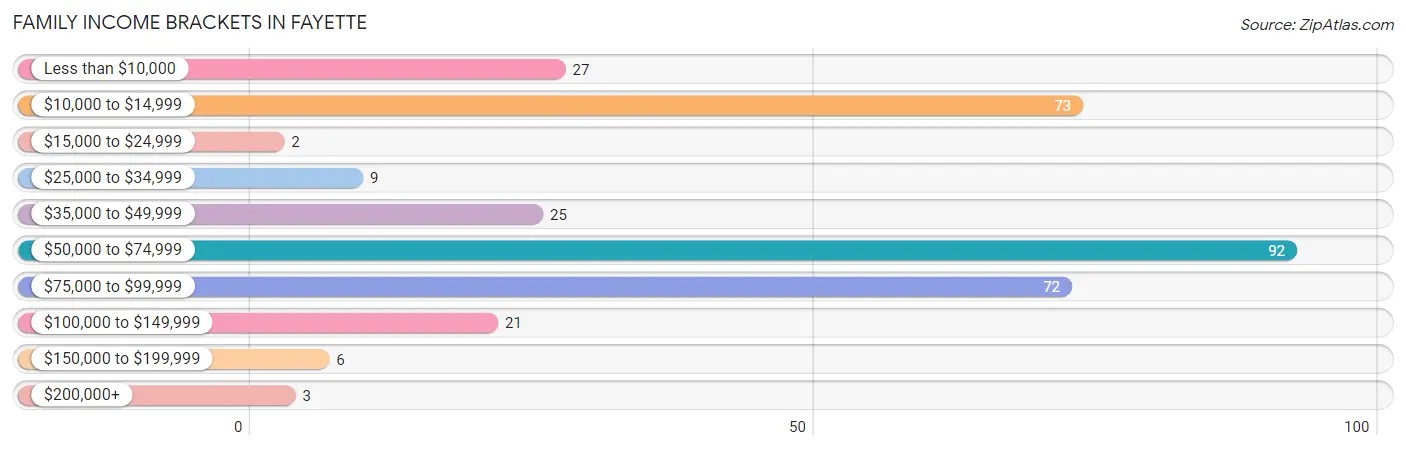
Family Income Brackets in Fayette
According to the Fayette family income data, there are 92 families falling into the $50,000 to $74,999 income range, which is the most common income bracket and makes up 27.9% of all families. Conversely, the $15,000 to $24,999 income bracket is the least frequent group with only 2 families (0.6%) belonging to this category.
| Income Bracket | # Families | % Families |
| Less than $10,000 | 27 | 8.2% |
| $10,000 to $14,999 | 73 | 22.1% |
| $15,000 to $24,999 | 2 | 0.6% |
| $25,000 to $34,999 | 9 | 2.7% |
| $35,000 to $49,999 | 25 | 7.6% |
| $50,000 to $74,999 | 92 | 27.9% |
| $75,000 to $99,999 | 72 | 21.8% |
| $100,000 to $149,999 | 21 | 6.4% |
| $150,000 to $199,999 | 6 | 1.8% |
| $200,000+ | 3 | 0.9% |
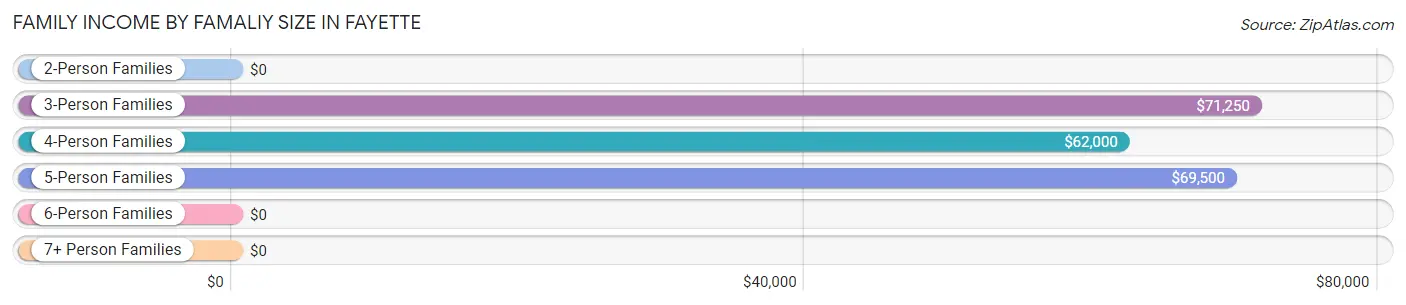
Family Income by Famaliy Size in Fayette
3-person families (106 | 32.1%) account for the highest median family income in Fayette with $71,250 per family, while 3-person families (106 | 32.1%) have the highest median income of $23,750 per family member.
| Income Bracket | # Families | Median Income |
| 2-Person Families | 186 (56.4%) | $0 |
| 3-Person Families | 106 (32.1%) | $71,250 |
| 4-Person Families | 16 (4.9%) | $62,000 |
| 5-Person Families | 20 (6.1%) | $69,500 |
| 6-Person Families | 2 (0.6%) | $0 |
| 7+ Person Families | 0 (0.0%) | $0 |
| Total | 330 (100.0%) | $57,500 |
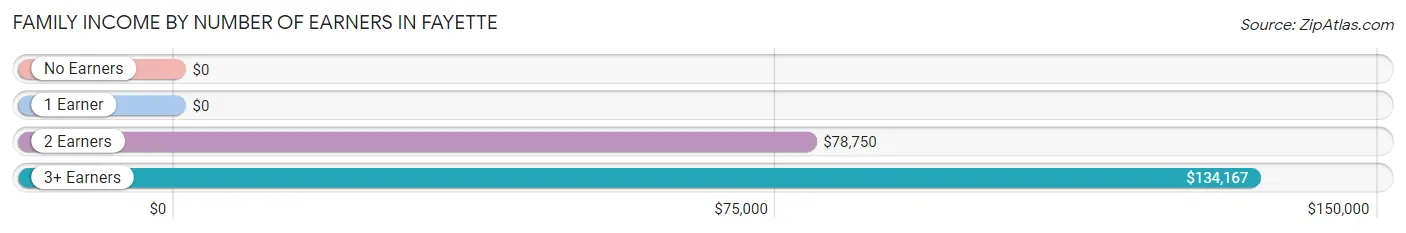
Family Income by Number of Earners in Fayette
| Number of Earners | # Families | Median Income |
| No Earners | 42 (12.7%) | $0 |
| 1 Earner | 170 (51.5%) | $0 |
| 2 Earners | 98 (29.7%) | $78,750 |
| 3+ Earners | 20 (6.1%) | $134,167 |
| Total | 330 (100.0%) | $57,500 |
Household Income in Fayette
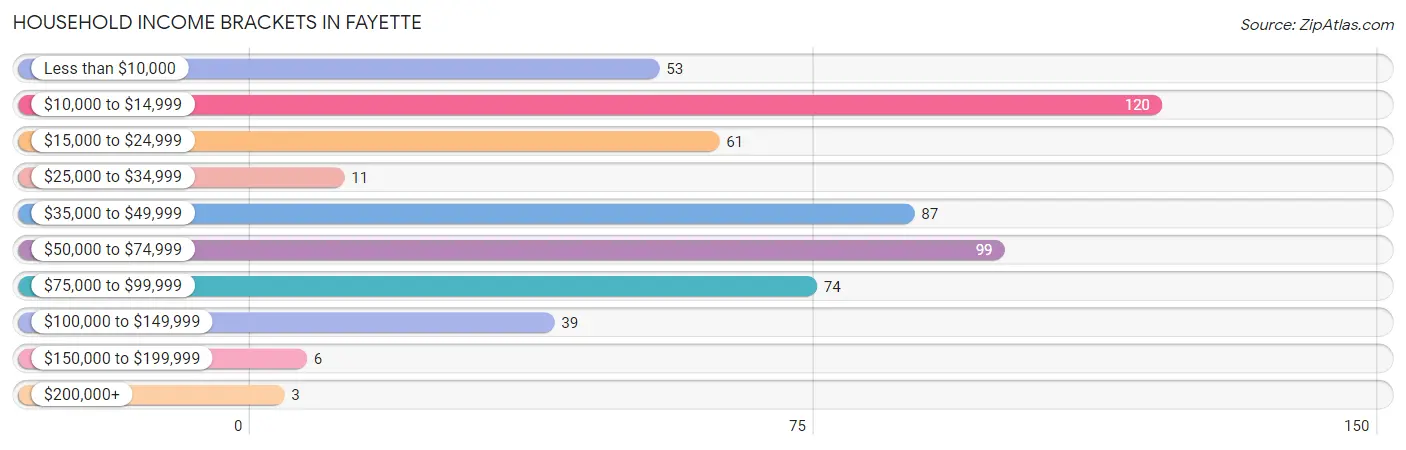
Household Income Brackets in Fayette
With 120 households falling in the category, the $10,000 to $14,999 income range is the most frequent in Fayette, accounting for 21.7% of all households. In contrast, only 3 households (0.5%) fall into the $200,000+ income bracket, making it the least populous group.
| Income Bracket | # Households | % Households |
| Less than $10,000 | 53 | 9.6% |
| $10,000 to $14,999 | 120 | 21.7% |
| $15,000 to $24,999 | 61 | 11.0% |
| $25,000 to $34,999 | 11 | 2.0% |
| $35,000 to $49,999 | 87 | 15.7% |
| $50,000 to $74,999 | 99 | 17.9% |
| $75,000 to $99,999 | 74 | 13.4% |
| $100,000 to $149,999 | 39 | 7.1% |
| $150,000 to $199,999 | 6 | 1.1% |
| $200,000+ | 3 | 0.5% |
Household Income by Householder Age in Fayette
The median household income in Fayette is $41,016, with the highest median household income of $53,438 found in the 45 to 64 years age bracket for the primary householder. A total of 204 households (36.9%) fall into this category. Meanwhile, the 15 to 24 years age bracket for the primary householder has the lowest median household income of $0, with 19 households (3.4%) in this group.
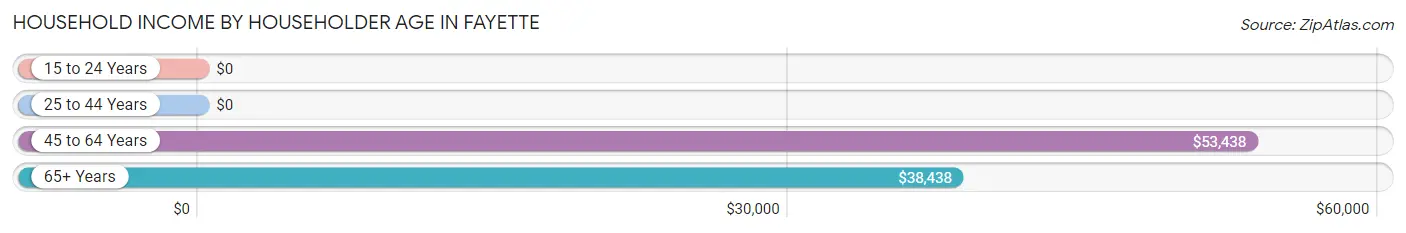
| Income Bracket | # Households | Median Income |
| 15 to 24 Years | 19 (3.4%) | $0 |
| 25 to 44 Years | 177 (32.0%) | $0 |
| 45 to 64 Years | 204 (36.9%) | $53,438 |
| 65+ Years | 153 (27.7%) | $38,438 |
| Total | 553 (100.0%) | $41,016 |
Poverty in Fayette
Income Below Poverty by Sex and Age in Fayette
With 24.2% poverty level for males and 28.8% for females among the residents of Fayette, 35 to 44 year old males and 5 year old females are the most vulnerable to poverty, with 55 males (55.0%) and 9 females (100.0%) in their respective age groups living below the poverty level.
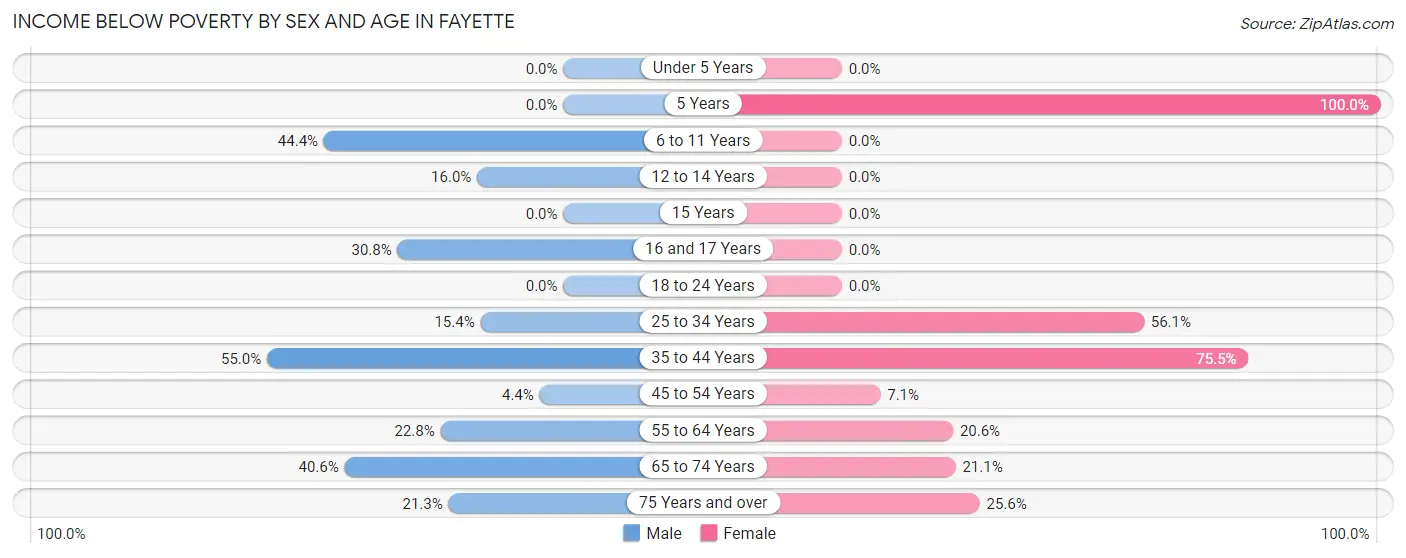
| Age Bracket | Male | Female |
| Under 5 Years | 0 (0.0%) | 0 (0.0%) |
| 5 Years | 0 (0.0%) | 9 (100.0%) |
| 6 to 11 Years | 4 (44.4%) | 0 (0.0%) |
| 12 to 14 Years | 4 (16.0%) | 0 (0.0%) |
| 15 Years | 0 (0.0%) | 0 (0.0%) |
| 16 and 17 Years | 4 (30.8%) | 0 (0.0%) |
| 18 to 24 Years | 0 (0.0%) | 0 (0.0%) |
| 25 to 34 Years | 10 (15.4%) | 37 (56.1%) |
| 35 to 44 Years | 55 (55.0%) | 80 (75.5%) |
| 45 to 54 Years | 3 (4.4%) | 7 (7.1%) |
| 55 to 64 Years | 26 (22.8%) | 13 (20.6%) |
| 65 to 74 Years | 13 (40.6%) | 23 (21.1%) |
| 75 Years and over | 13 (21.3%) | 11 (25.6%) |
| Total | 132 (24.2%) | 180 (28.8%) |
Income Above Poverty by Sex and Age in Fayette
According to the poverty statistics in Fayette, males aged under 5 years and females aged under 5 years are the age groups that are most secure financially, with 100.0% of males and 100.0% of females in these age groups living above the poverty line.
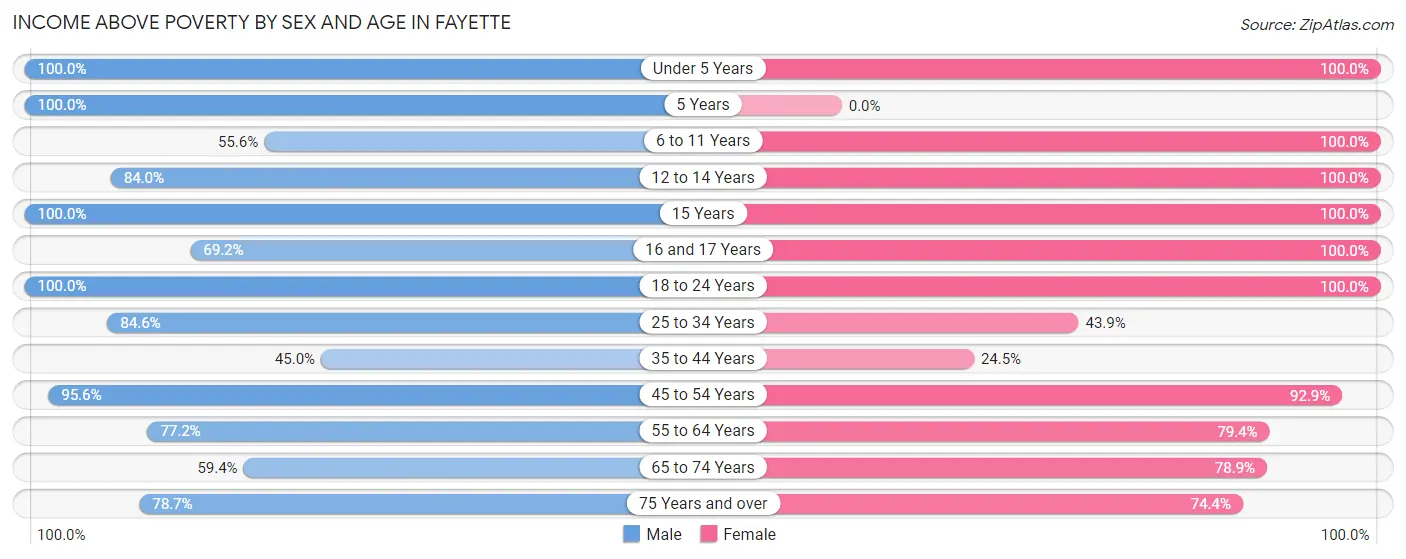
| Age Bracket | Male | Female |
| Under 5 Years | 13 (100.0%) | 25 (100.0%) |
| 5 Years | 8 (100.0%) | 0 (0.0%) |
| 6 to 11 Years | 5 (55.6%) | 6 (100.0%) |
| 12 to 14 Years | 21 (84.0%) | 8 (100.0%) |
| 15 Years | 6 (100.0%) | 17 (100.0%) |
| 16 and 17 Years | 9 (69.2%) | 14 (100.0%) |
| 18 to 24 Years | 31 (100.0%) | 61 (100.0%) |
| 25 to 34 Years | 55 (84.6%) | 29 (43.9%) |
| 35 to 44 Years | 45 (45.0%) | 26 (24.5%) |
| 45 to 54 Years | 65 (95.6%) | 91 (92.9%) |
| 55 to 64 Years | 88 (77.2%) | 50 (79.4%) |
| 65 to 74 Years | 19 (59.4%) | 86 (78.9%) |
| 75 Years and over | 48 (78.7%) | 32 (74.4%) |
| Total | 413 (75.8%) | 445 (71.2%) |
Income Below Poverty Among Married-Couple Families in Fayette
The poverty statistics for married-couple families in Fayette show that 32.7% or 82 of the total 251 families live below the poverty line. Families with no children have the highest poverty rate of 41.8%, comprising of 82 families. On the other hand, families with 1 or 2 children have the lowest poverty rate of 0.0%, which includes 0 families.
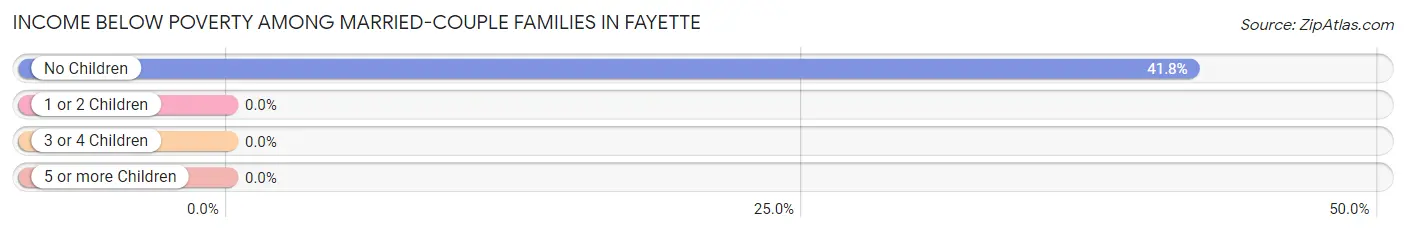
| Children | Above Poverty | Below Poverty |
| No Children | 114 (58.2%) | 82 (41.8%) |
| 1 or 2 Children | 43 (100.0%) | 0 (0.0%) |
| 3 or 4 Children | 12 (100.0%) | 0 (0.0%) |
| 5 or more Children | 0 (0.0%) | 0 (0.0%) |
| Total | 169 (67.3%) | 82 (32.7%) |
Income Below Poverty Among Single-Parent Households in Fayette
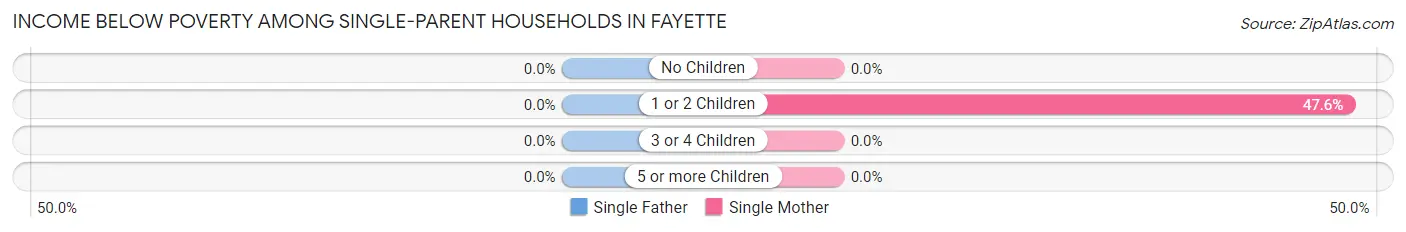
| Children | Single Father | Single Mother |
| No Children | 0 (0.0%) | 0 (0.0%) |
| 1 or 2 Children | 0 (0.0%) | 20 (47.6%) |
| 3 or 4 Children | 0 (0.0%) | 0 (0.0%) |
| 5 or more Children | 0 (0.0%) | 0 (0.0%) |
| Total | 0 (0.0%) | 20 (31.2%) |
Income Below Poverty Among Married-Couple vs Single-Parent Households in Fayette
The poverty data for Fayette shows that 82 of the married-couple family households (32.7%) and 20 of the single-parent households (25.3%) are living below the poverty level. Within the married-couple family households, those with no children have the highest poverty rate, with 82 households (41.8%) falling below the poverty line. Among the single-parent households, those with 1 or 2 children have the highest poverty rate, with 20 household (43.5%) living below poverty.
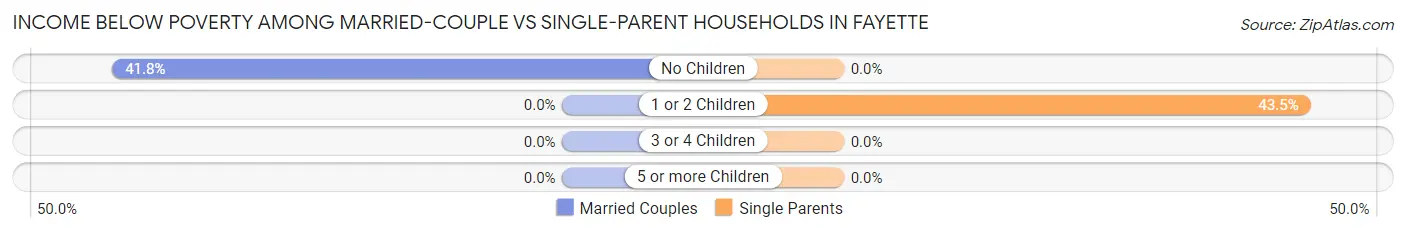
| Children | Married-Couple Families | Single-Parent Households |
| No Children | 82 (41.8%) | 0 (0.0%) |
| 1 or 2 Children | 0 (0.0%) | 20 (43.5%) |
| 3 or 4 Children | 0 (0.0%) | 0 (0.0%) |
| 5 or more Children | 0 (0.0%) | 0 (0.0%) |
| Total | 82 (32.7%) | 20 (25.3%) |
Race in Fayette
The most populous races in Fayette are White / Caucasian (1,093 | 92.9%), Hispanic or Latino (78 | 6.6%), and Two or more Races (38 | 3.2%).
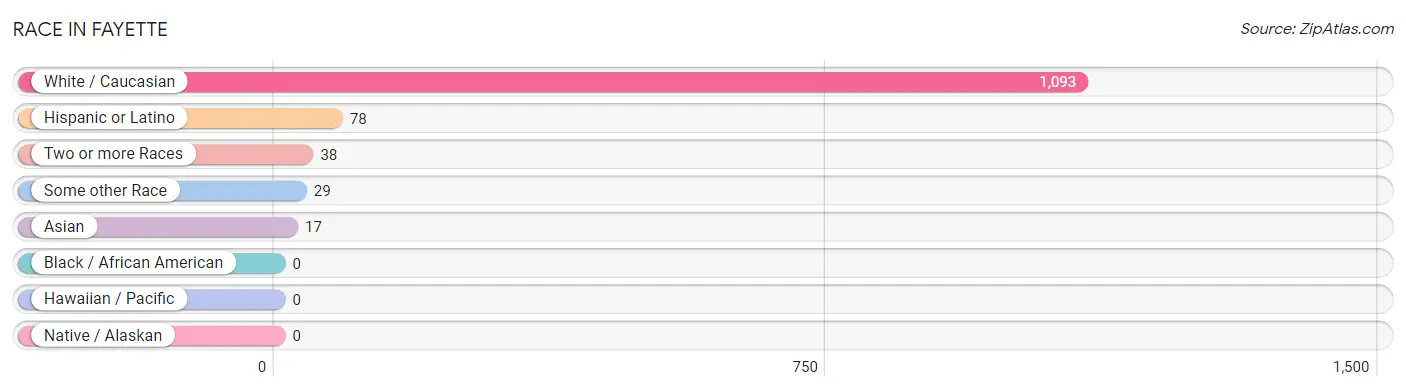
| Race | # Population | % Population |
| Asian | 17 | 1.4% |
| Black / African American | 0 | 0.0% |
| Hawaiian / Pacific | 0 | 0.0% |
| Hispanic or Latino | 78 | 6.6% |
| Native / Alaskan | 0 | 0.0% |
| White / Caucasian | 1,093 | 92.9% |
| Two or more Races | 38 | 3.2% |
| Some other Race | 29 | 2.5% |
| Total | 1,177 | 100.0% |
Ancestry in Fayette
The most populous ancestries reported in Fayette are German (393 | 33.4%), Irish (148 | 12.6%), American (141 | 12.0%), English (92 | 7.8%), and Mexican (78 | 6.6%), together accounting for 72.4% of all Fayette residents.
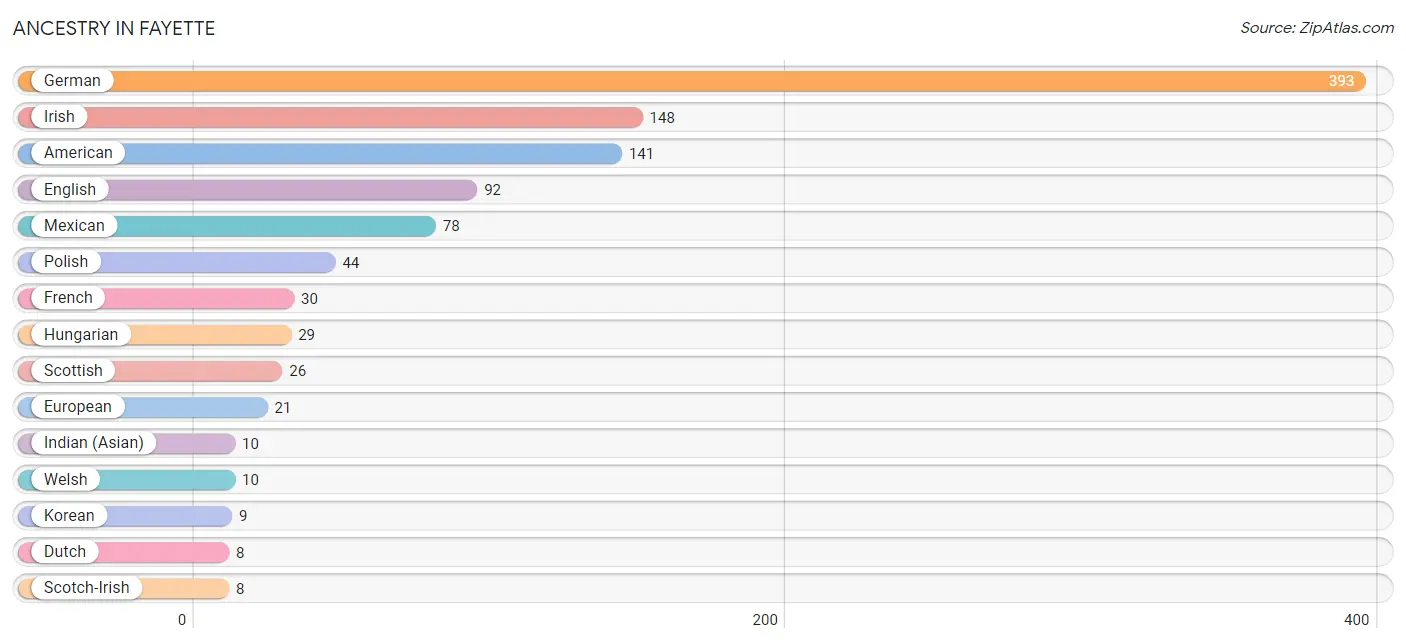
| Ancestry | # Population | % Population |
| American | 141 | 12.0% |
| Bangladeshi | 5 | 0.4% |
| Blackfeet | 2 | 0.2% |
| Danish | 2 | 0.2% |
| Dutch | 8 | 0.7% |
| English | 92 | 7.8% |
| European | 21 | 1.8% |
| French | 30 | 2.5% |
| French Canadian | 5 | 0.4% |
| German | 393 | 33.4% |
| Hungarian | 29 | 2.5% |
| Indian (Asian) | 10 | 0.9% |
| Irish | 148 | 12.6% |
| Italian | 6 | 0.5% |
| Korean | 9 | 0.8% |
| Mexican | 78 | 6.6% |
| Polish | 44 | 3.7% |
| Scotch-Irish | 8 | 0.7% |
| Scottish | 26 | 2.2% |
| Swiss | 8 | 0.7% |
| Welsh | 10 | 0.9% | View All 21 Rows |
Immigrants in Fayette
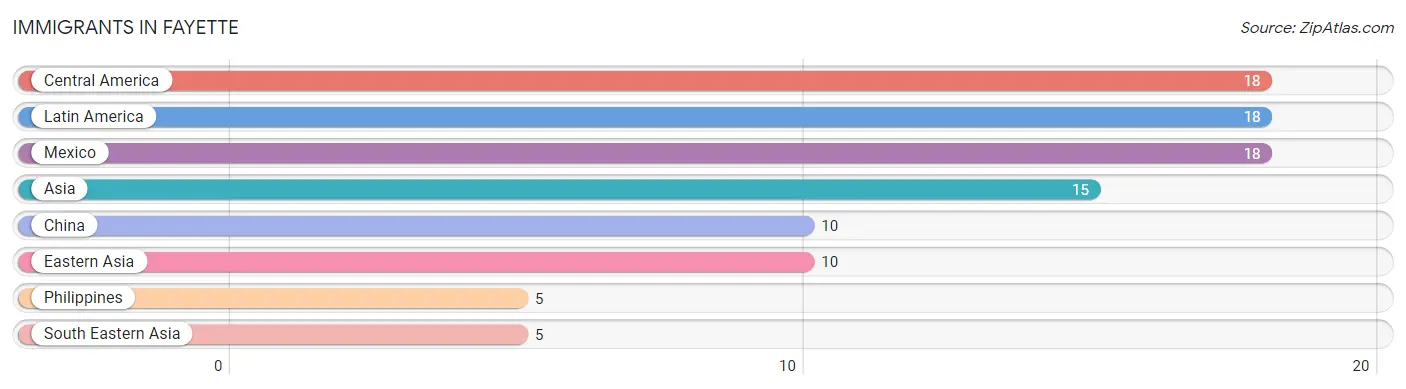
The most numerous immigrant groups reported in Fayette came from Central America (18 | 1.5%), Latin America (18 | 1.5%), Mexico (18 | 1.5%), Asia (15 | 1.3%), and China (10 | 0.9%), together accounting for 6.7% of all Fayette residents.
| Immigration Origin | # Population | % Population |
| Asia | 15 | 1.3% |
| Central America | 18 | 1.5% |
| China | 10 | 0.9% |
| Eastern Asia | 10 | 0.9% |
| Latin America | 18 | 1.5% |
| Mexico | 18 | 1.5% |
| Philippines | 5 | 0.4% |
| South Eastern Asia | 5 | 0.4% | View All 8 Rows |
Sex and Age in Fayette
Sex and Age in Fayette
The most populous age groups in Fayette are 35 to 39 Years (67 | 12.1%) for men and 35 to 39 Years (75 | 12.0%) for women.
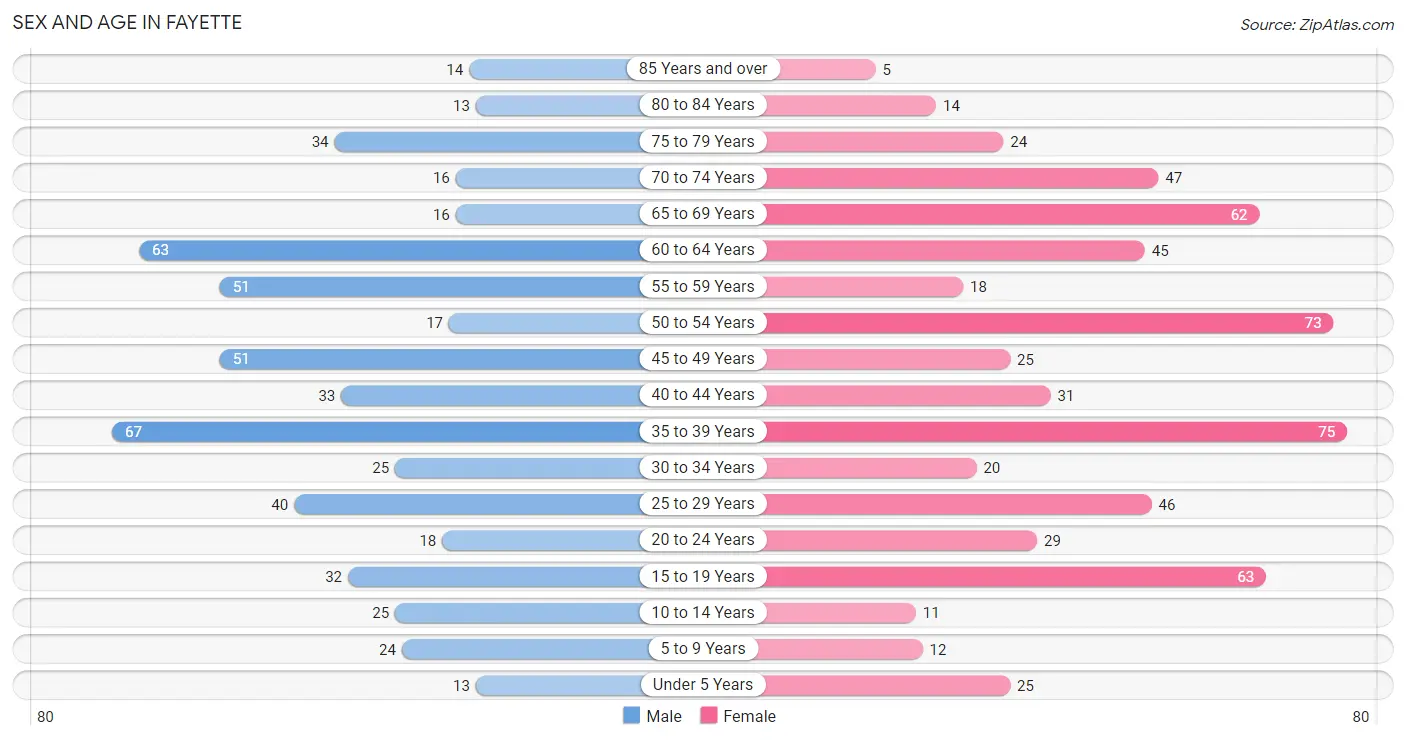
| Age Bracket | Male | Female |
| Under 5 Years | 13 (2.4%) | 25 (4.0%) |
| 5 to 9 Years | 24 (4.3%) | 12 (1.9%) |
| 10 to 14 Years | 25 (4.5%) | 11 (1.8%) |
| 15 to 19 Years | 32 (5.8%) | 63 (10.1%) |
| 20 to 24 Years | 18 (3.3%) | 29 (4.6%) |
| 25 to 29 Years | 40 (7.2%) | 46 (7.4%) |
| 30 to 34 Years | 25 (4.5%) | 20 (3.2%) |
| 35 to 39 Years | 67 (12.1%) | 75 (12.0%) |
| 40 to 44 Years | 33 (6.0%) | 31 (5.0%) |
| 45 to 49 Years | 51 (9.2%) | 25 (4.0%) |
| 50 to 54 Years | 17 (3.1%) | 73 (11.7%) |
| 55 to 59 Years | 51 (9.2%) | 18 (2.9%) |
| 60 to 64 Years | 63 (11.4%) | 45 (7.2%) |
| 65 to 69 Years | 16 (2.9%) | 62 (9.9%) |
| 70 to 74 Years | 16 (2.9%) | 47 (7.5%) |
| 75 to 79 Years | 34 (6.2%) | 24 (3.8%) |
| 80 to 84 Years | 13 (2.4%) | 14 (2.2%) |
| 85 Years and over | 14 (2.5%) | 5 (0.8%) |
| Total | 552 (100.0%) | 625 (100.0%) |
Families and Households in Fayette
Median Family Size in Fayette
The median family size in Fayette is 2.71 persons per family, with married-couple families (251 | 76.1%) accounting for the largest median family size of 2.8 persons per family. On the other hand, single female/mother families (64 | 19.4%) represent the smallest median family size with 2.38 persons per family.
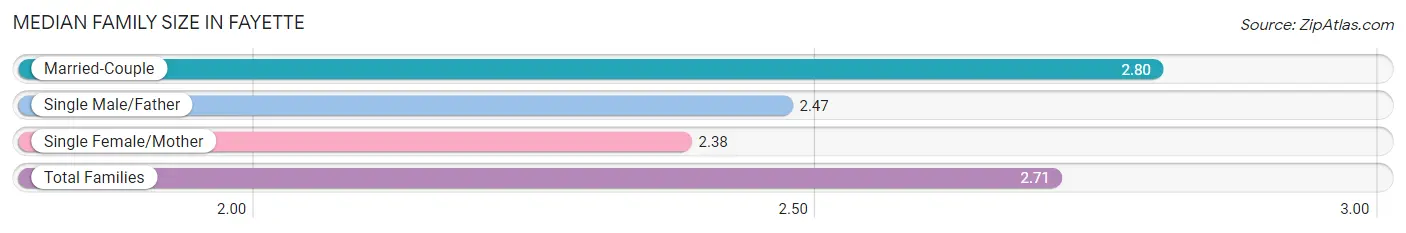
| Family Type | # Families | Family Size |
| Married-Couple | 251 (76.1%) | 2.80 |
| Single Male/Father | 15 (4.5%) | 2.47 |
| Single Female/Mother | 64 (19.4%) | 2.38 |
| Total Families | 330 (100.0%) | 2.71 |
Median Household Size in Fayette
The median household size in Fayette is 2.13 persons per household, with single male/father households (15 | 2.7%) accounting for the largest median household size of 3.53 persons per household. non-family households (223 | 40.3%) represent the smallest median household size with 1.17 persons per household.
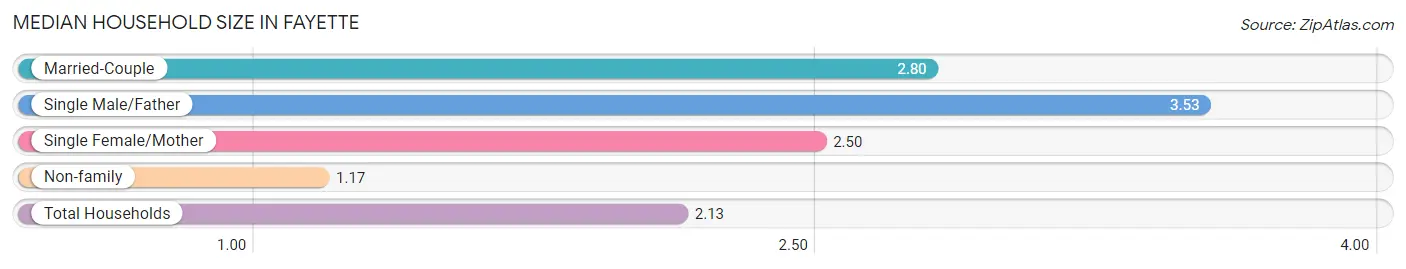
| Household Type | # Households | Household Size |
| Married-Couple | 251 (45.4%) | 2.80 |
| Single Male/Father | 15 (2.7%) | 3.53 |
| Single Female/Mother | 64 (11.6%) | 2.50 |
| Non-family | 223 (40.3%) | 1.17 |
| Total Households | 553 (100.0%) | 2.13 |
Household Size by Marriage Status in Fayette
Out of a total of 553 households in Fayette, 330 (59.7%) are family households, while 223 (40.3%) are nonfamily households. The most numerous type of family households are 2-person households, comprising 175, and the most common type of nonfamily households are 1-person households, comprising 192.
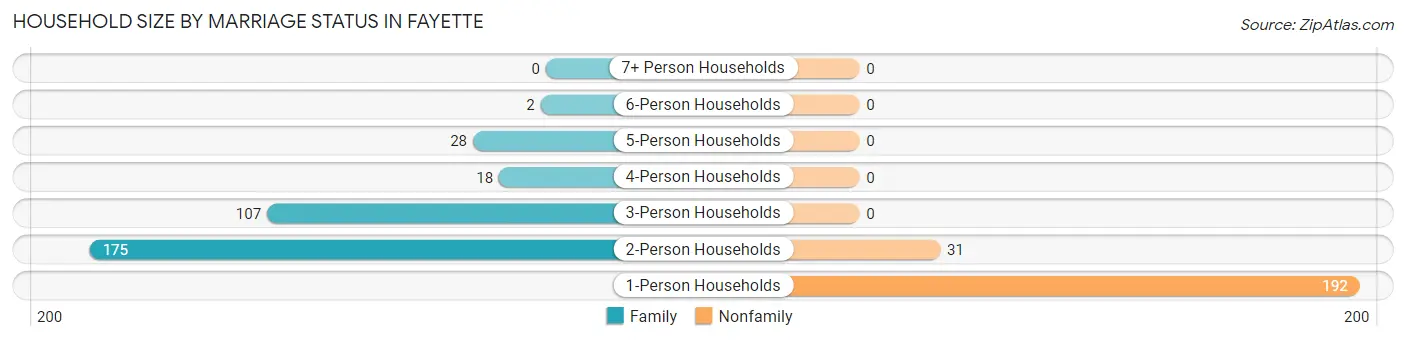
| Household Size | Family Households | Nonfamily Households |
| 1-Person Households | - | 192 (34.7%) |
| 2-Person Households | 175 (31.7%) | 31 (5.6%) |
| 3-Person Households | 107 (19.4%) | 0 (0.0%) |
| 4-Person Households | 18 (3.3%) | 0 (0.0%) |
| 5-Person Households | 28 (5.1%) | 0 (0.0%) |
| 6-Person Households | 2 (0.4%) | 0 (0.0%) |
| 7+ Person Households | 0 (0.0%) | 0 (0.0%) |
| Total | 330 (59.7%) | 223 (40.3%) |
Female Fertility in Fayette
Fertility by Age in Fayette
Average fertility rate in Fayette is 14.0 births per 1,000 women. Women in the age bracket of 20 to 34 years have the highest fertility rate with 42.0 births per 1,000 women. Women in the age bracket of 20 to 34 years acount for 100.0% of all women with births.
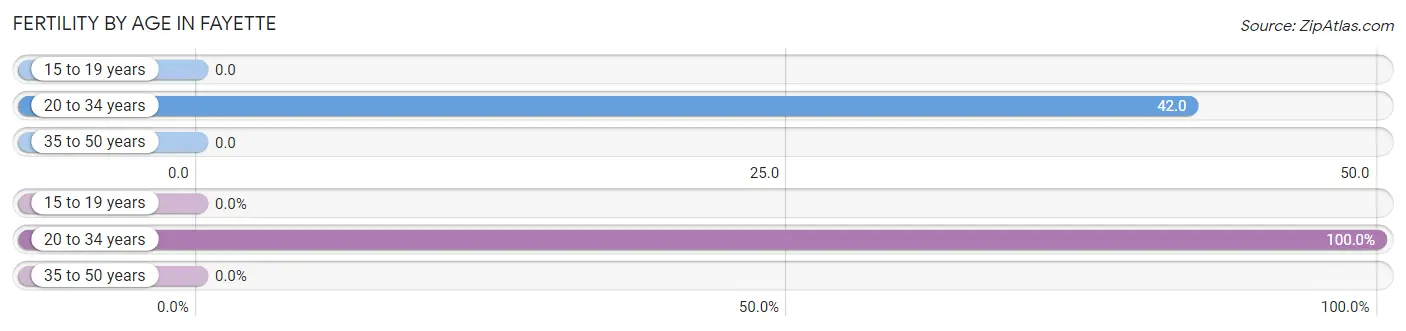
| Age Bracket | Women with Births | Births / 1,000 Women |
| 15 to 19 years | 0 (0.0%) | 0.0 |
| 20 to 34 years | 4 (100.0%) | 42.0 |
| 35 to 50 years | 0 (0.0%) | 0.0 |
| Total | 4 (100.0%) | 14.0 |
Fertility by Age by Marriage Status in Fayette
25.0% of women with births (4) in Fayette are married. The highest percentage of unmarried women with births falls into 20 to 34 years age bracket with 75.0% of them unmarried at the time of birth, while the lowest percentage of unmarried women with births belong to 20 to 34 years age bracket with 75.0% of them unmarried.
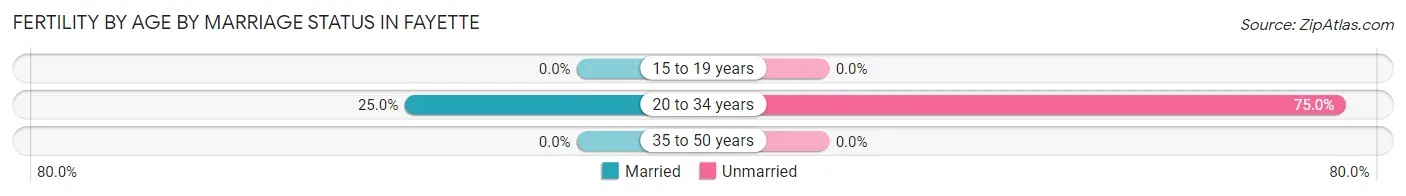
| Age Bracket | Married | Unmarried |
| 15 to 19 years | 0 (0.0%) | 0 (0.0%) |
| 20 to 34 years | 1 (25.0%) | 3 (75.0%) |
| 35 to 50 years | 0 (0.0%) | 0 (0.0%) |
| Total | 1 (25.0%) | 3 (75.0%) |
Fertility by Education in Fayette
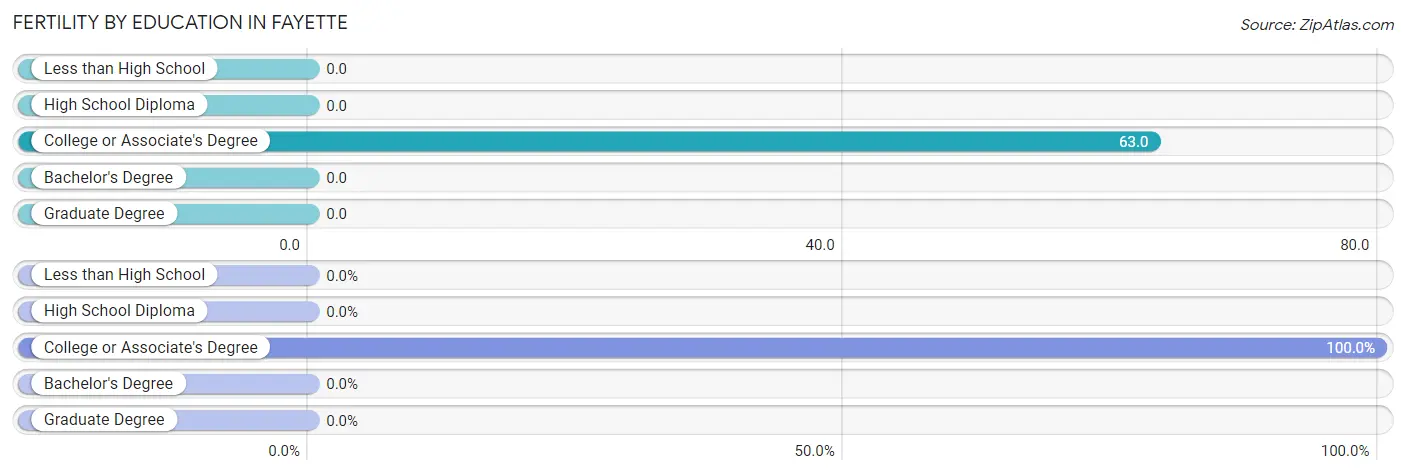
| Educational Attainment | Women with Births | Births / 1,000 Women |
| Less than High School | 0 (0.0%) | 0.0 |
| High School Diploma | 0 (0.0%) | 0.0 |
| College or Associate's Degree | 4 (100.0%) | 63.0 |
| Bachelor's Degree | 0 (0.0%) | 0.0 |
| Graduate Degree | 0 (0.0%) | 0.0 |
| Total | 4 (100.0%) | 14.0 |
Fertility by Education by Marriage Status in Fayette
75.0% of women with births in Fayette are unmarried. Women with the educational attainment of college or associate's degree are most likely to be married with 25.0% of them married at childbirth, while women with the educational attainment of college or associate's degree are least likely to be married with 75.0% of them unmarried at childbirth.
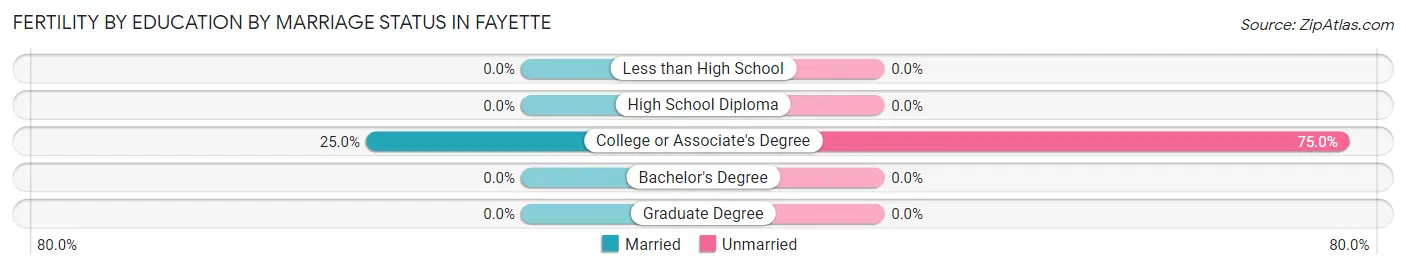
| Educational Attainment | Married | Unmarried |
| Less than High School | 0 (0.0%) | 0 (0.0%) |
| High School Diploma | 0 (0.0%) | 0 (0.0%) |
| College or Associate's Degree | 1 (25.0%) | 3 (75.0%) |
| Bachelor's Degree | 0 (0.0%) | 0 (0.0%) |
| Graduate Degree | 0 (0.0%) | 0 (0.0%) |
| Total | 1 (25.0%) | 3 (75.0%) |
Employment Characteristics in Fayette
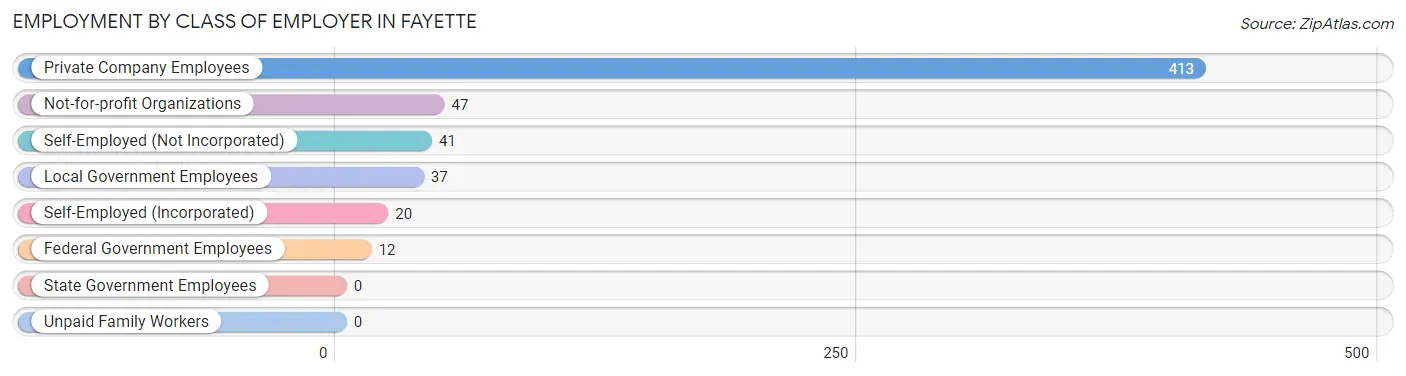
Employment by Class of Employer in Fayette
Among the 570 employed individuals in Fayette, private company employees (413 | 72.5%), not-for-profit organizations (47 | 8.3%), and self-employed (not incorporated) (41 | 7.2%) make up the most common classes of employment.
| Employer Class | # Employees | % Employees |
| Private Company Employees | 413 | 72.5% |
| Self-Employed (Incorporated) | 20 | 3.5% |
| Self-Employed (Not Incorporated) | 41 | 7.2% |
| Not-for-profit Organizations | 47 | 8.3% |
| Local Government Employees | 37 | 6.5% |
| State Government Employees | 0 | 0.0% |
| Federal Government Employees | 12 | 2.1% |
| Unpaid Family Workers | 0 | 0.0% |
| Total | 570 | 100.0% |
Employment Status by Age in Fayette
According to the labor force statistics for Fayette, out of the total population over 16 years of age (1,044), 58.3% or 609 individuals are in the labor force, with 5.3% or 32 of them unemployed. The age group with the highest labor force participation rate is 20 to 24 years, with 100.0% or 47 individuals in the labor force. Within the labor force, the 20 to 24 years age range has the highest percentage of unemployed individuals, with 48.9% or 23 of them being unemployed.
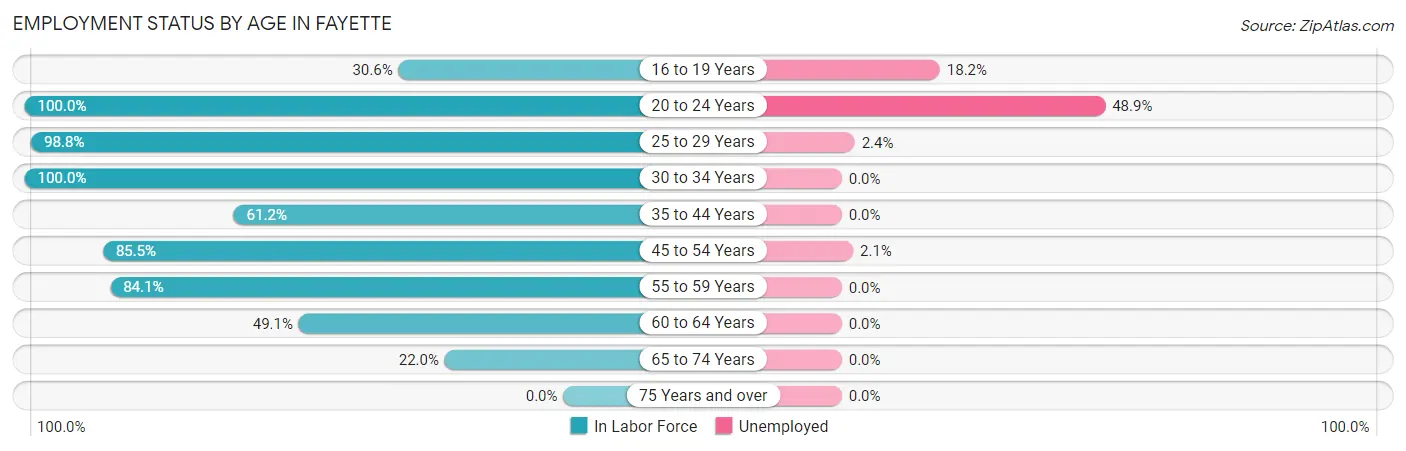
| Age Bracket | In Labor Force | Unemployed |
| 16 to 19 Years | 22 (30.6%) | 4 (18.2%) |
| 20 to 24 Years | 47 (100.0%) | 23 (48.9%) |
| 25 to 29 Years | 85 (98.8%) | 2 (2.4%) |
| 30 to 34 Years | 45 (100.0%) | 0 (0.0%) |
| 35 to 44 Years | 126 (61.2%) | 0 (0.0%) |
| 45 to 54 Years | 142 (85.5%) | 3 (2.1%) |
| 55 to 59 Years | 58 (84.1%) | 0 (0.0%) |
| 60 to 64 Years | 53 (49.1%) | 0 (0.0%) |
| 65 to 74 Years | 31 (22.0%) | 0 (0.0%) |
| 75 Years and over | 0 (0.0%) | 0 (0.0%) |
| Total | 609 (58.3%) | 32 (5.3%) |
Employment Status by Educational Attainment in Fayette
According to labor force statistics for Fayette, 74.9% of individuals (509) out of the total population between 25 and 64 years of age (680) are in the labor force, with 1.0% or 5 of them being unemployed. The group with the highest labor force participation rate are those with the educational attainment of bachelor's degree or higher, with 89.9% or 62 individuals in the labor force. Within the labor force, individuals with college / associate degree education have the highest percentage of unemployment, with 1.3% or 2 of them being unemployed.
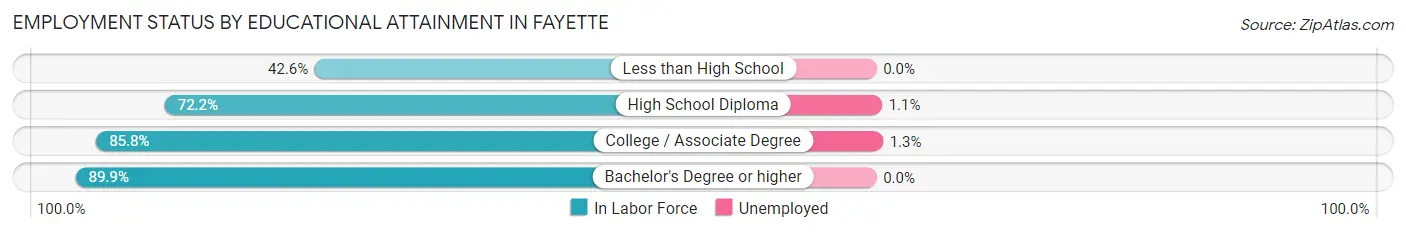
| Educational Attainment | In Labor Force | Unemployed |
| Less than High School | 26 (42.6%) | 0 (0.0%) |
| High School Diploma | 270 (72.2%) | 4 (1.1%) |
| College / Associate Degree | 151 (85.8%) | 2 (1.3%) |
| Bachelor's Degree or higher | 62 (89.9%) | 0 (0.0%) |
| Total | 509 (74.9%) | 7 (1.0%) |
Employment Occupations by Sex in Fayette
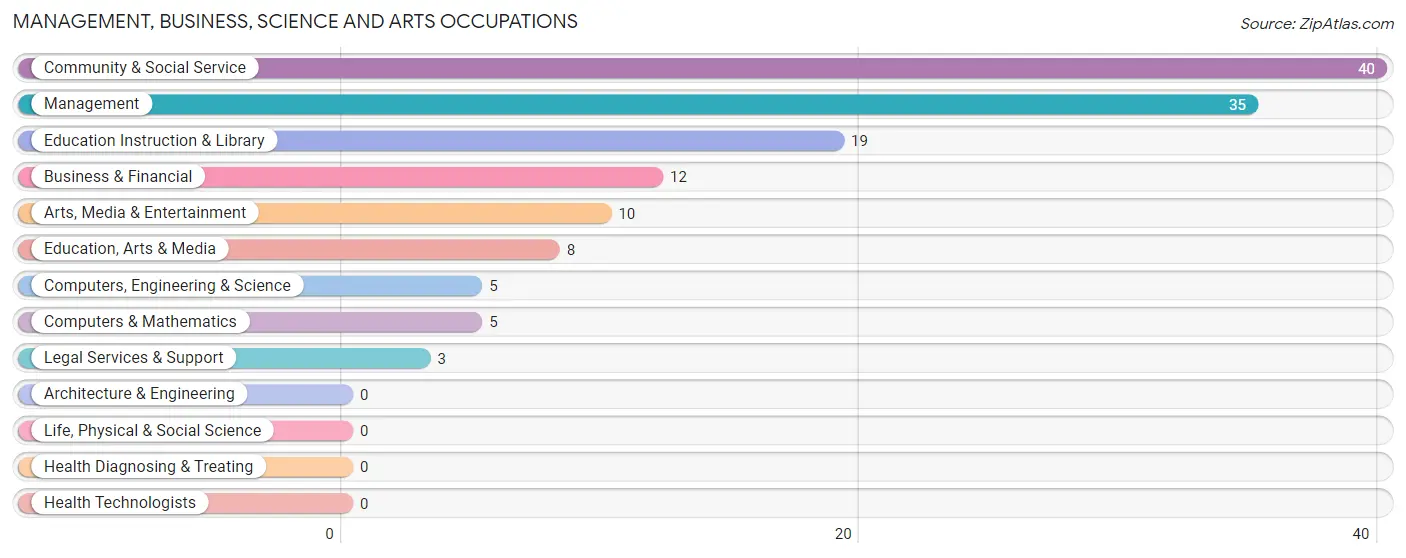
Management, Business, Science and Arts Occupations
The most common Management, Business, Science and Arts occupations in Fayette are Community & Social Service (40 | 6.9%), Management (35 | 6.1%), Education Instruction & Library (19 | 3.3%), Business & Financial (12 | 2.1%), and Arts, Media & Entertainment (10 | 1.7%).
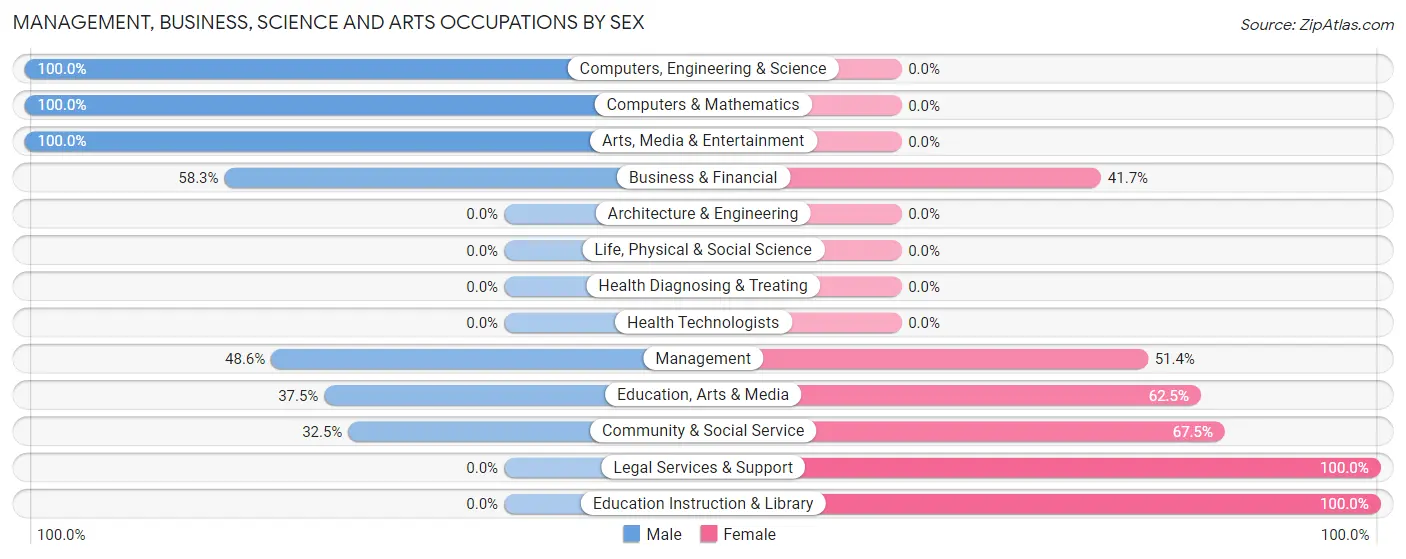
Management, Business, Science and Arts Occupations by Sex
Within the Management, Business, Science and Arts occupations in Fayette, the most male-oriented occupations are Computers, Engineering & Science (100.0%), Computers & Mathematics (100.0%), and Arts, Media & Entertainment (100.0%), while the most female-oriented occupations are Legal Services & Support (100.0%), Education Instruction & Library (100.0%), and Community & Social Service (67.5%).
| Occupation | Male | Female |
| Management | 17 (48.6%) | 18 (51.4%) |
| Business & Financial | 7 (58.3%) | 5 (41.7%) |
| Computers, Engineering & Science | 5 (100.0%) | 0 (0.0%) |
| Computers & Mathematics | 5 (100.0%) | 0 (0.0%) |
| Architecture & Engineering | 0 (0.0%) | 0 (0.0%) |
| Life, Physical & Social Science | 0 (0.0%) | 0 (0.0%) |
| Community & Social Service | 13 (32.5%) | 27 (67.5%) |
| Education, Arts & Media | 3 (37.5%) | 5 (62.5%) |
| Legal Services & Support | 0 (0.0%) | 3 (100.0%) |
| Education Instruction & Library | 0 (0.0%) | 19 (100.0%) |
| Arts, Media & Entertainment | 10 (100.0%) | 0 (0.0%) |
| Health Diagnosing & Treating | 0 (0.0%) | 0 (0.0%) |
| Health Technologists | 0 (0.0%) | 0 (0.0%) |
| Total (Category) | 42 (45.7%) | 50 (54.3%) |
| Total (Overall) | 263 (45.6%) | 314 (54.4%) |
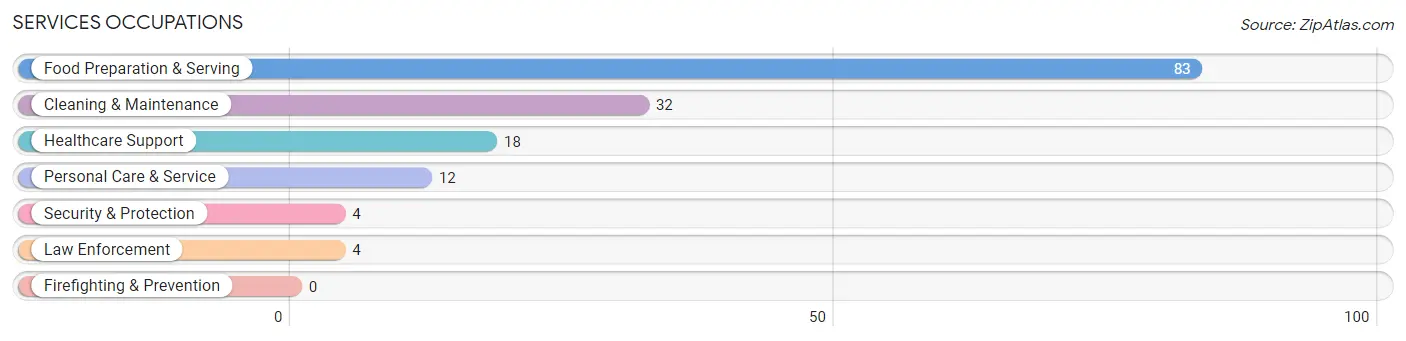
Services Occupations
The most common Services occupations in Fayette are Food Preparation & Serving (83 | 14.4%), Cleaning & Maintenance (32 | 5.6%), Healthcare Support (18 | 3.1%), Personal Care & Service (12 | 2.1%), and Security & Protection (4 | 0.7%).
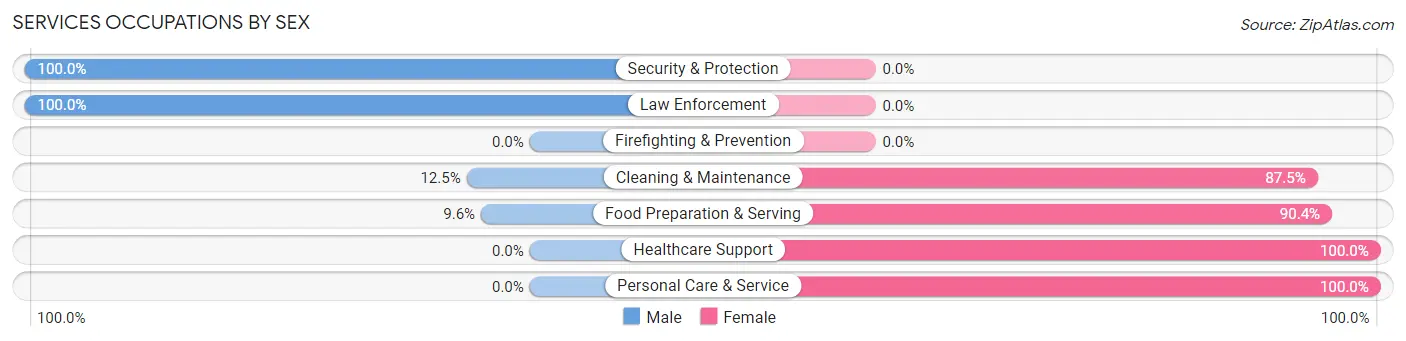
Services Occupations by Sex
Within the Services occupations in Fayette, the most male-oriented occupations are Security & Protection (100.0%), Law Enforcement (100.0%), and Cleaning & Maintenance (12.5%), while the most female-oriented occupations are Healthcare Support (100.0%), Personal Care & Service (100.0%), and Food Preparation & Serving (90.4%).
| Occupation | Male | Female |
| Healthcare Support | 0 (0.0%) | 18 (100.0%) |
| Security & Protection | 4 (100.0%) | 0 (0.0%) |
| Firefighting & Prevention | 0 (0.0%) | 0 (0.0%) |
| Law Enforcement | 4 (100.0%) | 0 (0.0%) |
| Food Preparation & Serving | 8 (9.6%) | 75 (90.4%) |
| Cleaning & Maintenance | 4 (12.5%) | 28 (87.5%) |
| Personal Care & Service | 0 (0.0%) | 12 (100.0%) |
| Total (Category) | 16 (10.7%) | 133 (89.3%) |
| Total (Overall) | 263 (45.6%) | 314 (54.4%) |
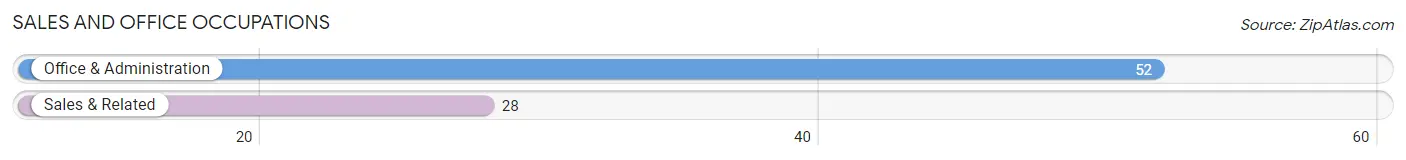
Sales and Office Occupations
The most common Sales and Office occupations in Fayette are Office & Administration (52 | 9.0%), and Sales & Related (28 | 4.9%).
Sales and Office Occupations by Sex
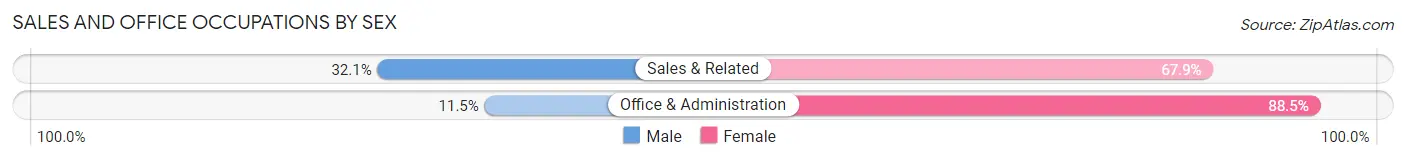
| Occupation | Male | Female |
| Sales & Related | 9 (32.1%) | 19 (67.9%) |
| Office & Administration | 6 (11.5%) | 46 (88.5%) |
| Total (Category) | 15 (18.8%) | 65 (81.2%) |
| Total (Overall) | 263 (45.6%) | 314 (54.4%) |
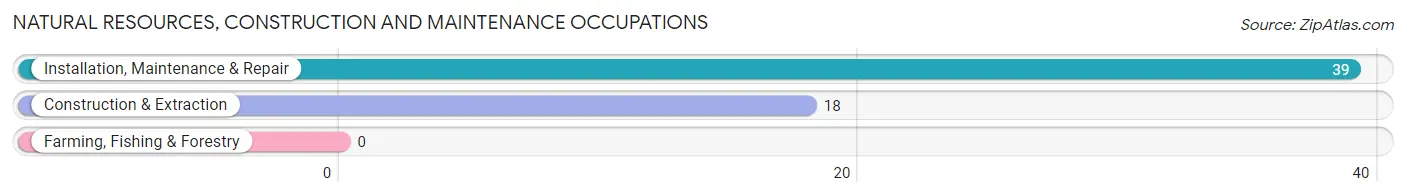
Natural Resources, Construction and Maintenance Occupations
The most common Natural Resources, Construction and Maintenance occupations in Fayette are Installation, Maintenance & Repair (39 | 6.8%), and Construction & Extraction (18 | 3.1%).
Natural Resources, Construction and Maintenance Occupations by Sex
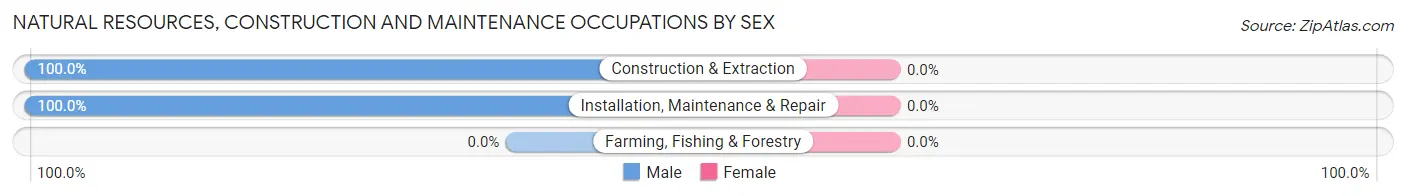
| Occupation | Male | Female |
| Farming, Fishing & Forestry | 0 (0.0%) | 0 (0.0%) |
| Construction & Extraction | 18 (100.0%) | 0 (0.0%) |
| Installation, Maintenance & Repair | 39 (100.0%) | 0 (0.0%) |
| Total (Category) | 57 (100.0%) | 0 (0.0%) |
| Total (Overall) | 263 (45.6%) | 314 (54.4%) |
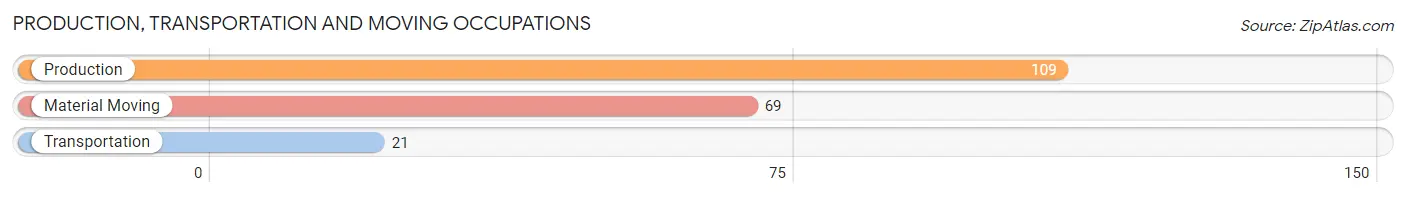
Production, Transportation and Moving Occupations
The most common Production, Transportation and Moving occupations in Fayette are Production (109 | 18.9%), Material Moving (69 | 12.0%), and Transportation (21 | 3.6%).
Production, Transportation and Moving Occupations by Sex
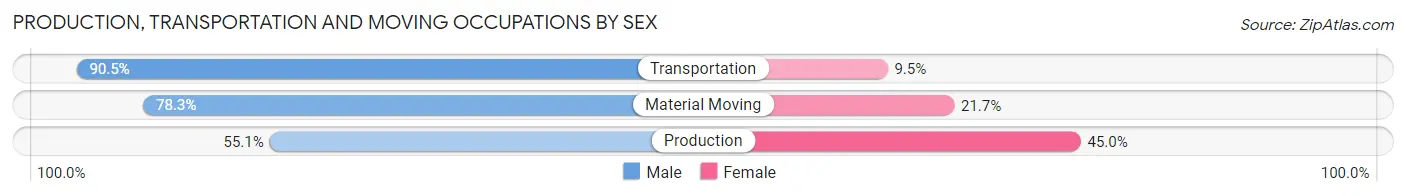
| Occupation | Male | Female |
| Production | 60 (55.0%) | 49 (45.0%) |
| Transportation | 19 (90.5%) | 2 (9.5%) |
| Material Moving | 54 (78.3%) | 15 (21.7%) |
| Total (Category) | 133 (66.8%) | 66 (33.2%) |
| Total (Overall) | 263 (45.6%) | 314 (54.4%) |
Employment Industries by Sex in Fayette
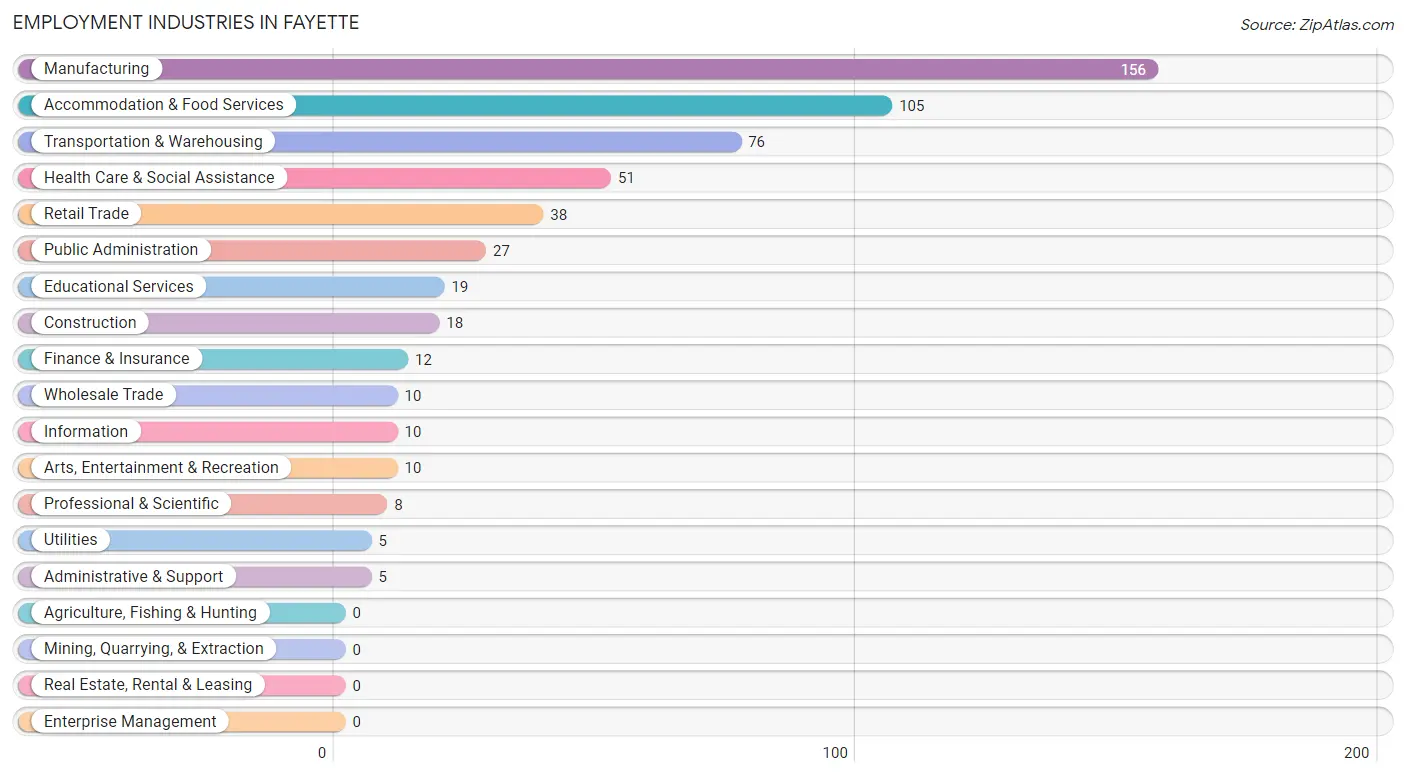
Employment Industries in Fayette
The major employment industries in Fayette include Manufacturing (156 | 27.0%), Accommodation & Food Services (105 | 18.2%), Transportation & Warehousing (76 | 13.2%), Health Care & Social Assistance (51 | 8.8%), and Retail Trade (38 | 6.6%).
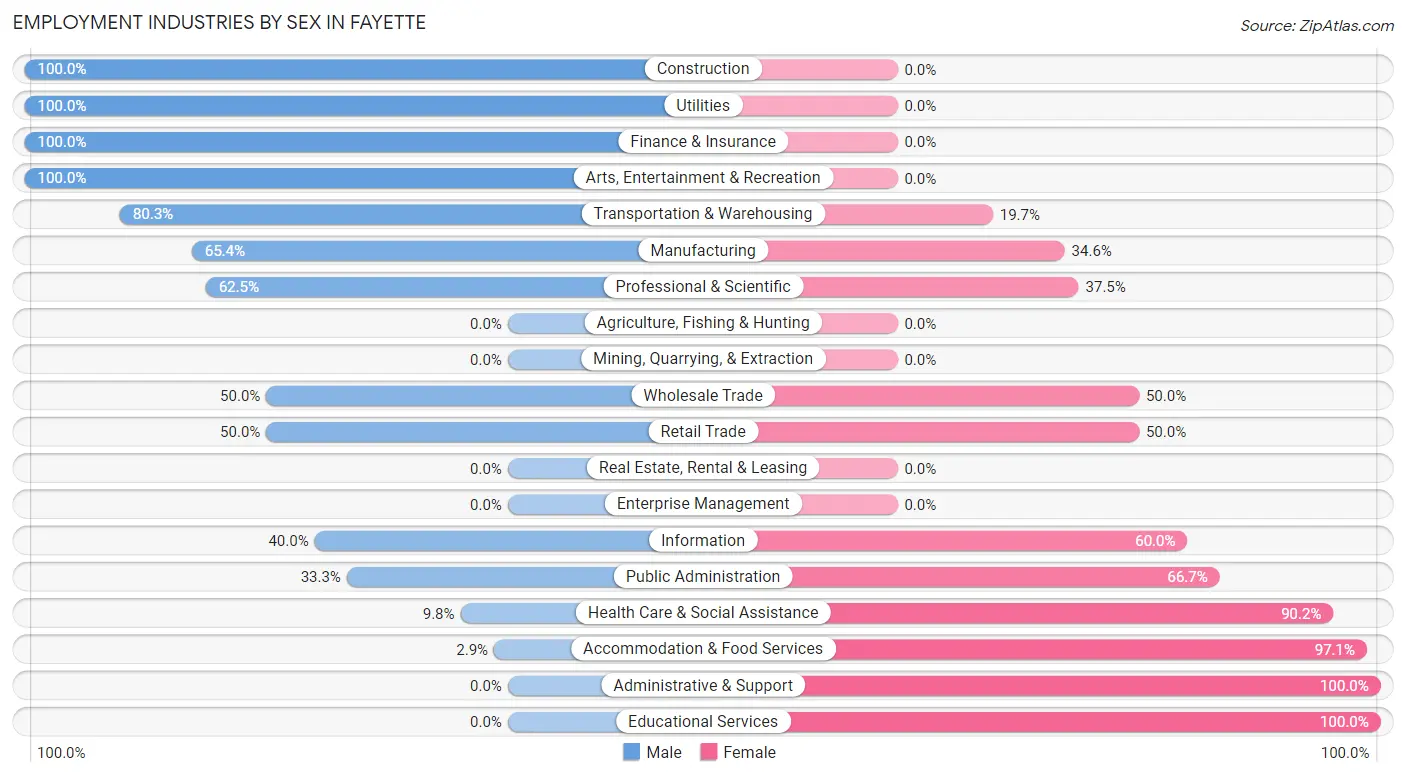
Employment Industries by Sex in Fayette
The Fayette industries that see more men than women are Construction (100.0%), Utilities (100.0%), and Finance & Insurance (100.0%), whereas the industries that tend to have a higher number of women are Administrative & Support (100.0%), Educational Services (100.0%), and Accommodation & Food Services (97.1%).
| Industry | Male | Female |
| Agriculture, Fishing & Hunting | 0 (0.0%) | 0 (0.0%) |
| Mining, Quarrying, & Extraction | 0 (0.0%) | 0 (0.0%) |
| Construction | 18 (100.0%) | 0 (0.0%) |
| Manufacturing | 102 (65.4%) | 54 (34.6%) |
| Wholesale Trade | 5 (50.0%) | 5 (50.0%) |
| Retail Trade | 19 (50.0%) | 19 (50.0%) |
| Transportation & Warehousing | 61 (80.3%) | 15 (19.7%) |
| Utilities | 5 (100.0%) | 0 (0.0%) |
| Information | 4 (40.0%) | 6 (60.0%) |
| Finance & Insurance | 12 (100.0%) | 0 (0.0%) |
| Real Estate, Rental & Leasing | 0 (0.0%) | 0 (0.0%) |
| Professional & Scientific | 5 (62.5%) | 3 (37.5%) |
| Enterprise Management | 0 (0.0%) | 0 (0.0%) |
| Administrative & Support | 0 (0.0%) | 5 (100.0%) |
| Educational Services | 0 (0.0%) | 19 (100.0%) |
| Health Care & Social Assistance | 5 (9.8%) | 46 (90.2%) |
| Arts, Entertainment & Recreation | 10 (100.0%) | 0 (0.0%) |
| Accommodation & Food Services | 3 (2.9%) | 102 (97.1%) |
| Public Administration | 9 (33.3%) | 18 (66.7%) |
| Total | 263 (45.6%) | 314 (54.4%) |
Education in Fayette
School Enrollment in Fayette
The most common levels of schooling among the 192 students in Fayette are high school (88 | 45.8%), middle school (32 | 16.7%), and college / undergraduate (30 | 15.6%).
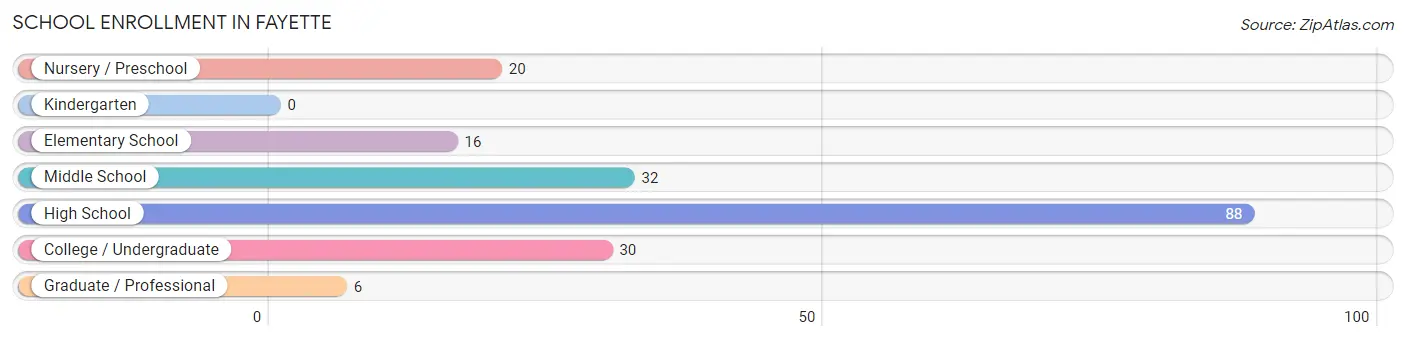
| School Level | # Students | % Students |
| Nursery / Preschool | 20 | 10.4% |
| Kindergarten | 0 | 0.0% |
| Elementary School | 16 | 8.3% |
| Middle School | 32 | 16.7% |
| High School | 88 | 45.8% |
| College / Undergraduate | 30 | 15.6% |
| Graduate / Professional | 6 | 3.1% |
| Total | 192 | 100.0% |
School Enrollment by Age by Funding Source in Fayette
Out of a total of 192 students who are enrolled in schools in Fayette, 19 (9.9%) attend a private institution, while the remaining 173 (90.1%) are enrolled in public schools. The age group of 20 to 24 year olds has the highest likelihood of being enrolled in private schools, with 10 (66.7% in the age bracket) enrolled. Conversely, the age group of 10 to 14 year olds has the lowest likelihood of being enrolled in a private school, with 36 (100.0% in the age bracket) attending a public institution.
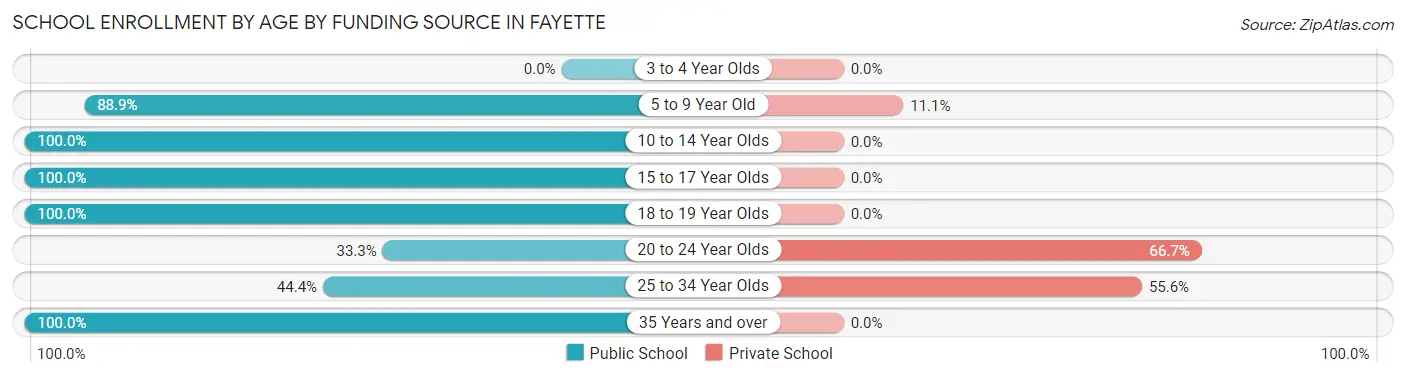
| Age Bracket | Public School | Private School |
| 3 to 4 Year Olds | 0 (0.0%) | 0 (0.0%) |
| 5 to 9 Year Old | 32 (88.9%) | 4 (11.1%) |
| 10 to 14 Year Olds | 36 (100.0%) | 0 (0.0%) |
| 15 to 17 Year Olds | 50 (100.0%) | 0 (0.0%) |
| 18 to 19 Year Olds | 45 (100.0%) | 0 (0.0%) |
| 20 to 24 Year Olds | 5 (33.3%) | 10 (66.7%) |
| 25 to 34 Year Olds | 4 (44.4%) | 5 (55.6%) |
| 35 Years and over | 1 (100.0%) | 0 (0.0%) |
| Total | 173 (90.1%) | 19 (9.9%) |
Educational Attainment by Field of Study in Fayette
Business (28 | 32.2%), arts & humanities (19 | 21.8%), education (14 | 16.1%), science & technology (9 | 10.3%), and engineering (5 | 5.8%) are the most common fields of study among 87 individuals in Fayette who have obtained a bachelor's degree or higher.
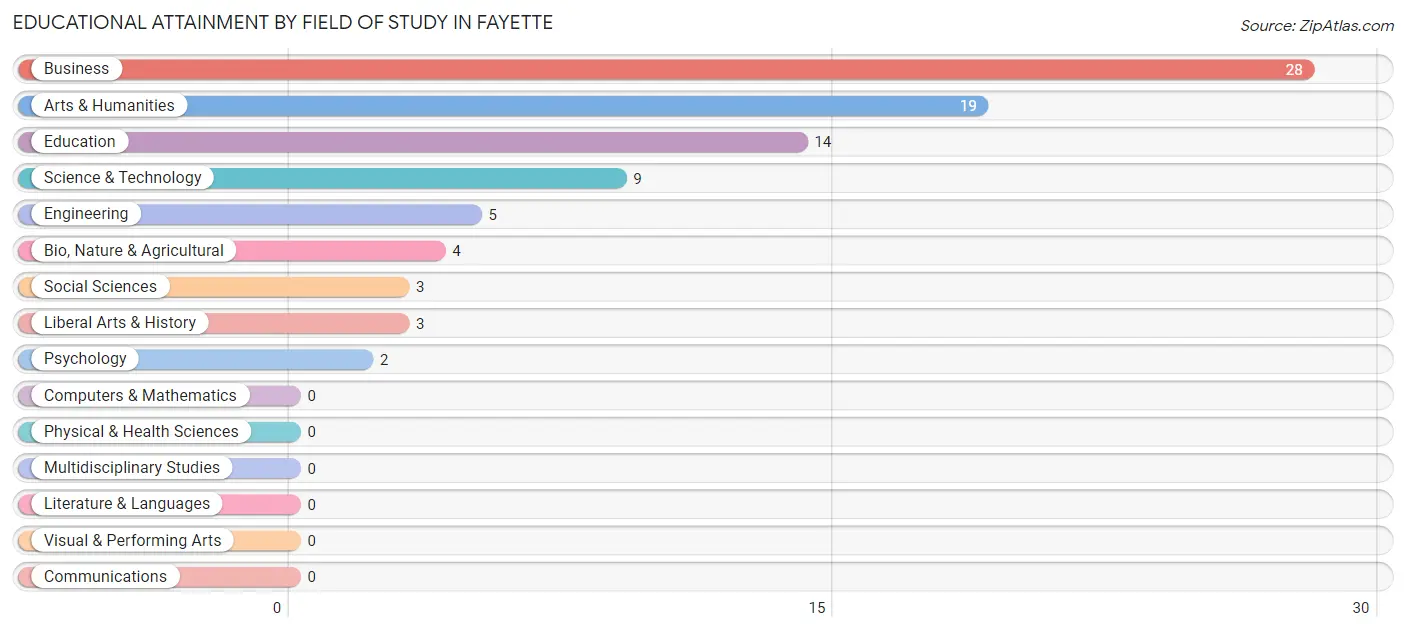
| Field of Study | # Graduates | % Graduates |
| Computers & Mathematics | 0 | 0.0% |
| Bio, Nature & Agricultural | 4 | 4.6% |
| Physical & Health Sciences | 0 | 0.0% |
| Psychology | 2 | 2.3% |
| Social Sciences | 3 | 3.5% |
| Engineering | 5 | 5.8% |
| Multidisciplinary Studies | 0 | 0.0% |
| Science & Technology | 9 | 10.3% |
| Business | 28 | 32.2% |
| Education | 14 | 16.1% |
| Literature & Languages | 0 | 0.0% |
| Liberal Arts & History | 3 | 3.5% |
| Visual & Performing Arts | 0 | 0.0% |
| Communications | 0 | 0.0% |
| Arts & Humanities | 19 | 21.8% |
| Total | 87 | 100.0% |
Transportation & Commute in Fayette
Vehicle Availability by Sex in Fayette
The most prevalent vehicle ownership categories in Fayette are males with 2 vehicles (97, accounting for 37.2%) and females with 2 vehicles (48, making up 31.4%).
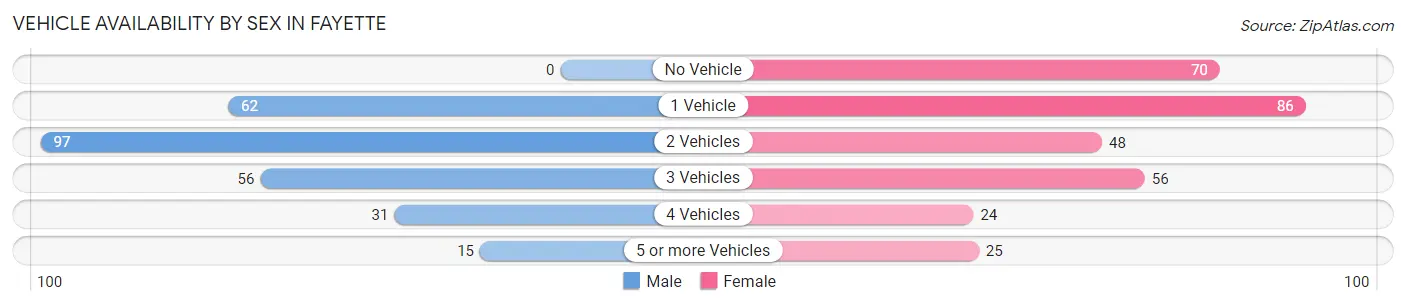
| Vehicles Available | Male | Female |
| No Vehicle | 0 (0.0%) | 70 (22.7%) |
| 1 Vehicle | 62 (23.7%) | 86 (27.8%) |
| 2 Vehicles | 97 (37.2%) | 48 (15.5%) |
| 3 Vehicles | 56 (21.5%) | 56 (18.1%) |
| 4 Vehicles | 31 (11.9%) | 24 (7.8%) |
| 5 or more Vehicles | 15 (5.8%) | 25 (8.1%) |
| Total | 261 (100.0%) | 309 (100.0%) |
Commute Time in Fayette
The most frequently occuring commute durations in Fayette are 10 to 14 minutes (93 commuters, 17.0%), 15 to 19 minutes (81 commuters, 14.8%), and 20 to 24 minutes (78 commuters, 14.3%).
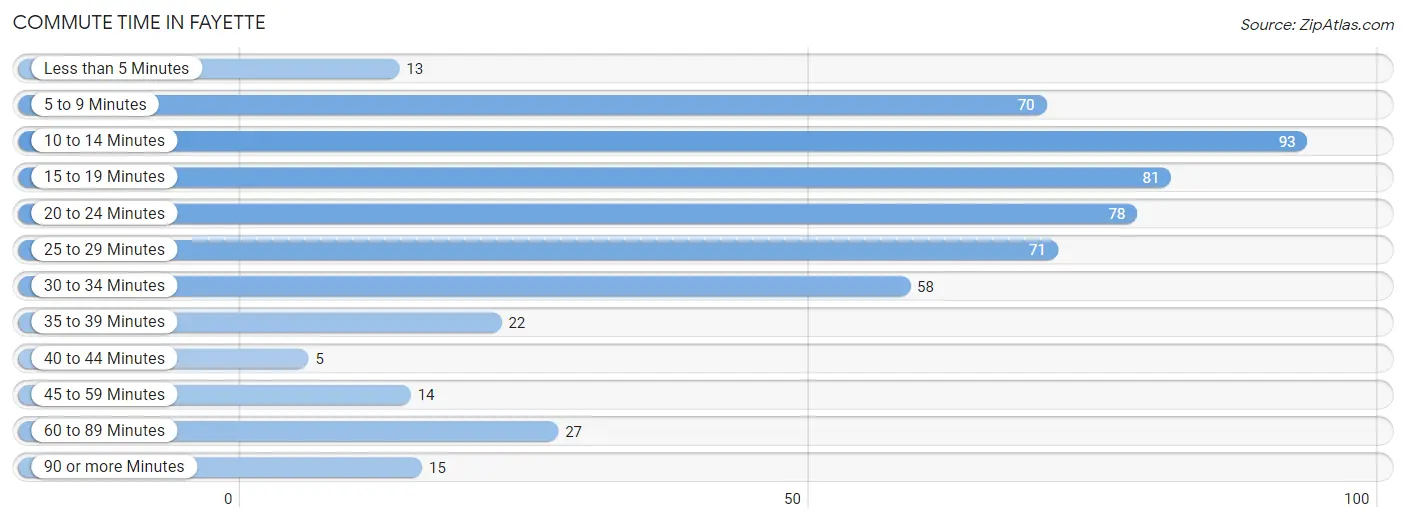
| Commute Time | # Commuters | % Commuters |
| Less than 5 Minutes | 13 | 2.4% |
| 5 to 9 Minutes | 70 | 12.8% |
| 10 to 14 Minutes | 93 | 17.0% |
| 15 to 19 Minutes | 81 | 14.8% |
| 20 to 24 Minutes | 78 | 14.3% |
| 25 to 29 Minutes | 71 | 13.0% |
| 30 to 34 Minutes | 58 | 10.6% |
| 35 to 39 Minutes | 22 | 4.0% |
| 40 to 44 Minutes | 5 | 0.9% |
| 45 to 59 Minutes | 14 | 2.6% |
| 60 to 89 Minutes | 27 | 4.9% |
| 90 or more Minutes | 15 | 2.7% |
Commute Time by Sex in Fayette
The most common commute times in Fayette are 15 to 19 minutes (52 commuters, 21.0%) for males and 10 to 14 minutes (82 commuters, 27.4%) for females.
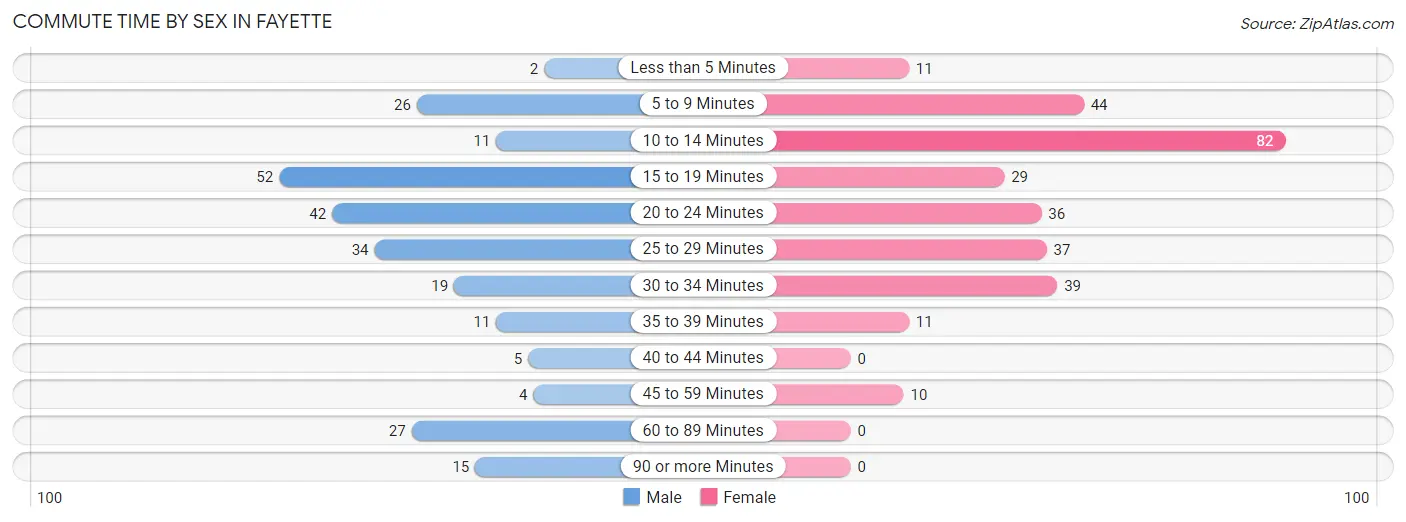
| Commute Time | Male | Female |
| Less than 5 Minutes | 2 (0.8%) | 11 (3.7%) |
| 5 to 9 Minutes | 26 (10.5%) | 44 (14.7%) |
| 10 to 14 Minutes | 11 (4.4%) | 82 (27.4%) |
| 15 to 19 Minutes | 52 (21.0%) | 29 (9.7%) |
| 20 to 24 Minutes | 42 (16.9%) | 36 (12.0%) |
| 25 to 29 Minutes | 34 (13.7%) | 37 (12.4%) |
| 30 to 34 Minutes | 19 (7.7%) | 39 (13.0%) |
| 35 to 39 Minutes | 11 (4.4%) | 11 (3.7%) |
| 40 to 44 Minutes | 5 (2.0%) | 0 (0.0%) |
| 45 to 59 Minutes | 4 (1.6%) | 10 (3.3%) |
| 60 to 89 Minutes | 27 (10.9%) | 0 (0.0%) |
| 90 or more Minutes | 15 (6.0%) | 0 (0.0%) |
Time of Departure to Work by Sex in Fayette
The most frequent times of departure to work in Fayette are 12:00 PM to 3:59 PM (94, 37.9%) for males and 10:00 AM to 10:59 AM (77, 25.8%) for females.
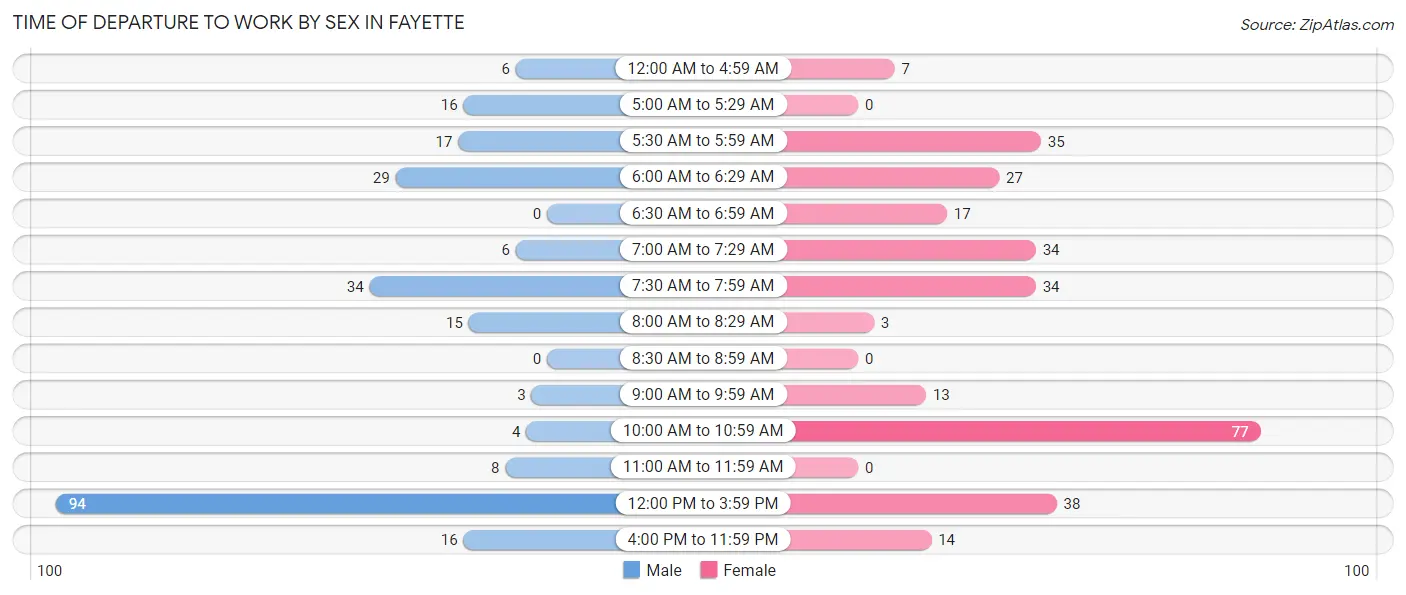
| Time of Departure | Male | Female |
| 12:00 AM to 4:59 AM | 6 (2.4%) | 7 (2.3%) |
| 5:00 AM to 5:29 AM | 16 (6.5%) | 0 (0.0%) |
| 5:30 AM to 5:59 AM | 17 (6.9%) | 35 (11.7%) |
| 6:00 AM to 6:29 AM | 29 (11.7%) | 27 (9.0%) |
| 6:30 AM to 6:59 AM | 0 (0.0%) | 17 (5.7%) |
| 7:00 AM to 7:29 AM | 6 (2.4%) | 34 (11.4%) |
| 7:30 AM to 7:59 AM | 34 (13.7%) | 34 (11.4%) |
| 8:00 AM to 8:29 AM | 15 (6.0%) | 3 (1.0%) |
| 8:30 AM to 8:59 AM | 0 (0.0%) | 0 (0.0%) |
| 9:00 AM to 9:59 AM | 3 (1.2%) | 13 (4.3%) |
| 10:00 AM to 10:59 AM | 4 (1.6%) | 77 (25.8%) |
| 11:00 AM to 11:59 AM | 8 (3.2%) | 0 (0.0%) |
| 12:00 PM to 3:59 PM | 94 (37.9%) | 38 (12.7%) |
| 4:00 PM to 11:59 PM | 16 (6.5%) | 14 (4.7%) |
| Total | 248 (100.0%) | 299 (100.0%) |
Housing Occupancy in Fayette
Occupancy by Ownership in Fayette
Of the total 553 dwellings in Fayette, owner-occupied units account for 289 (52.3%), while renter-occupied units make up 264 (47.7%).
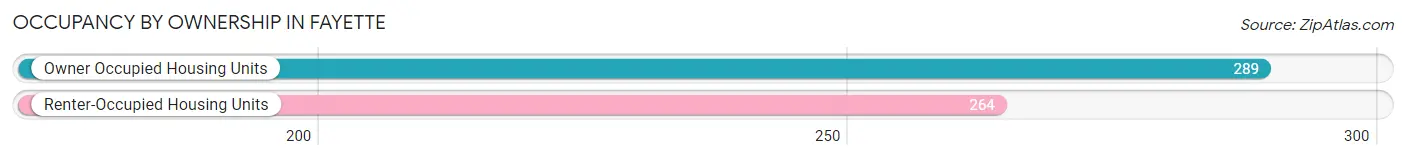
| Occupancy | # Housing Units | % Housing Units |
| Owner Occupied Housing Units | 289 | 52.3% |
| Renter-Occupied Housing Units | 264 | 47.7% |
| Total Occupied Housing Units | 553 | 100.0% |
Occupancy by Household Size in Fayette
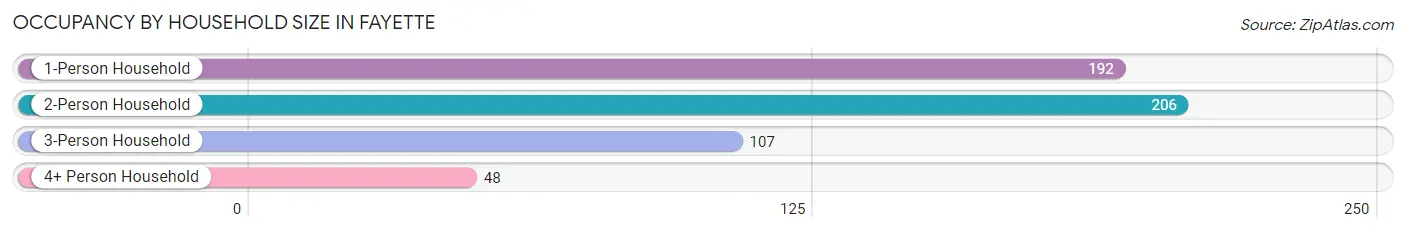
| Household Size | # Housing Units | % Housing Units |
| 1-Person Household | 192 | 34.7% |
| 2-Person Household | 206 | 37.2% |
| 3-Person Household | 107 | 19.4% |
| 4+ Person Household | 48 | 8.7% |
| Total Housing Units | 553 | 100.0% |
Occupancy by Ownership by Household Size in Fayette
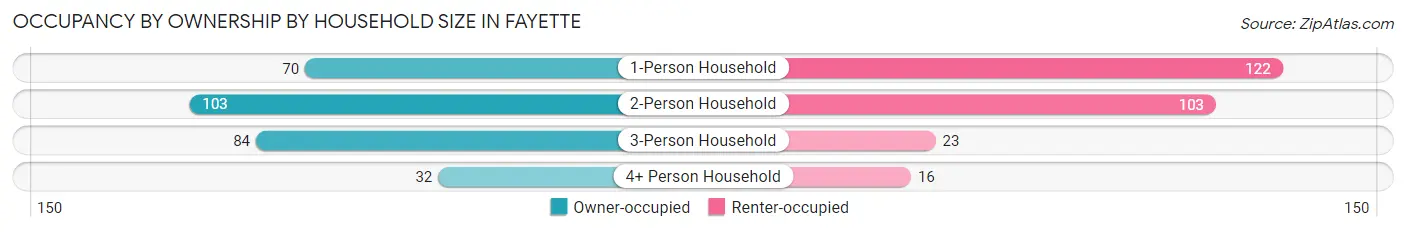
| Household Size | Owner-occupied | Renter-occupied |
| 1-Person Household | 70 (36.5%) | 122 (63.5%) |
| 2-Person Household | 103 (50.0%) | 103 (50.0%) |
| 3-Person Household | 84 (78.5%) | 23 (21.5%) |
| 4+ Person Household | 32 (66.7%) | 16 (33.3%) |
| Total Housing Units | 289 (52.3%) | 264 (47.7%) |
Occupancy by Educational Attainment in Fayette
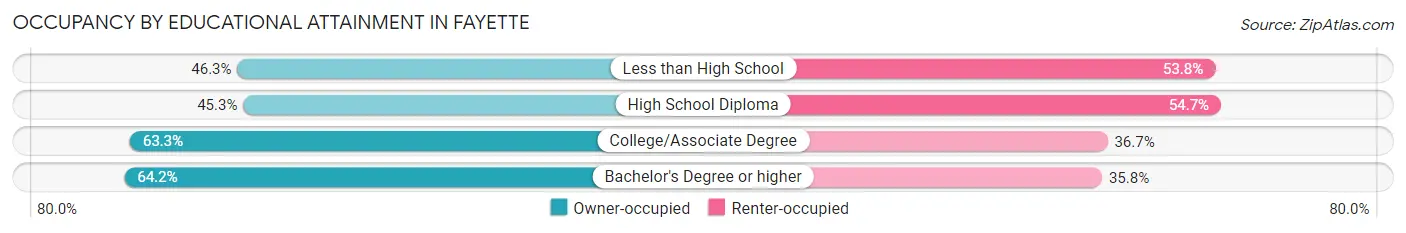
| Household Size | Owner-occupied | Renter-occupied |
| Less than High School | 37 (46.3%) | 43 (53.7%) |
| High School Diploma | 121 (45.3%) | 146 (54.7%) |
| College/Associate Degree | 88 (63.3%) | 51 (36.7%) |
| Bachelor's Degree or higher | 43 (64.2%) | 24 (35.8%) |
Occupancy by Age of Householder in Fayette
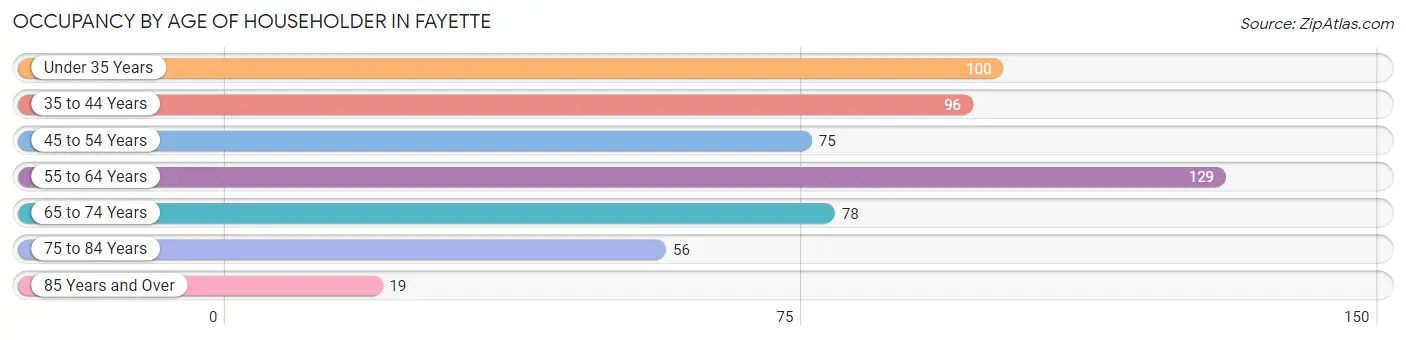
| Age Bracket | # Households | % Households |
| Under 35 Years | 100 | 18.1% |
| 35 to 44 Years | 96 | 17.4% |
| 45 to 54 Years | 75 | 13.6% |
| 55 to 64 Years | 129 | 23.3% |
| 65 to 74 Years | 78 | 14.1% |
| 75 to 84 Years | 56 | 10.1% |
| 85 Years and Over | 19 | 3.4% |
| Total | 553 | 100.0% |
Housing Finances in Fayette
Median Income by Occupancy in Fayette
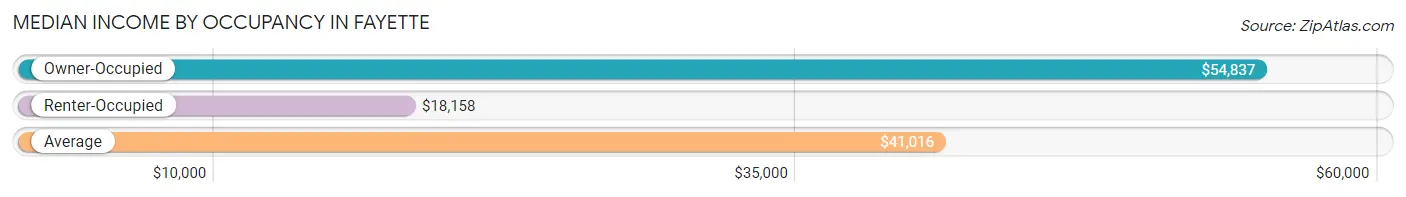
| Occupancy Type | # Households | Median Income |
| Owner-Occupied | 289 (52.3%) | $54,837 |
| Renter-Occupied | 264 (47.7%) | $18,158 |
| Average | 553 (100.0%) | $41,016 |
Occupancy by Householder Income Bracket in Fayette
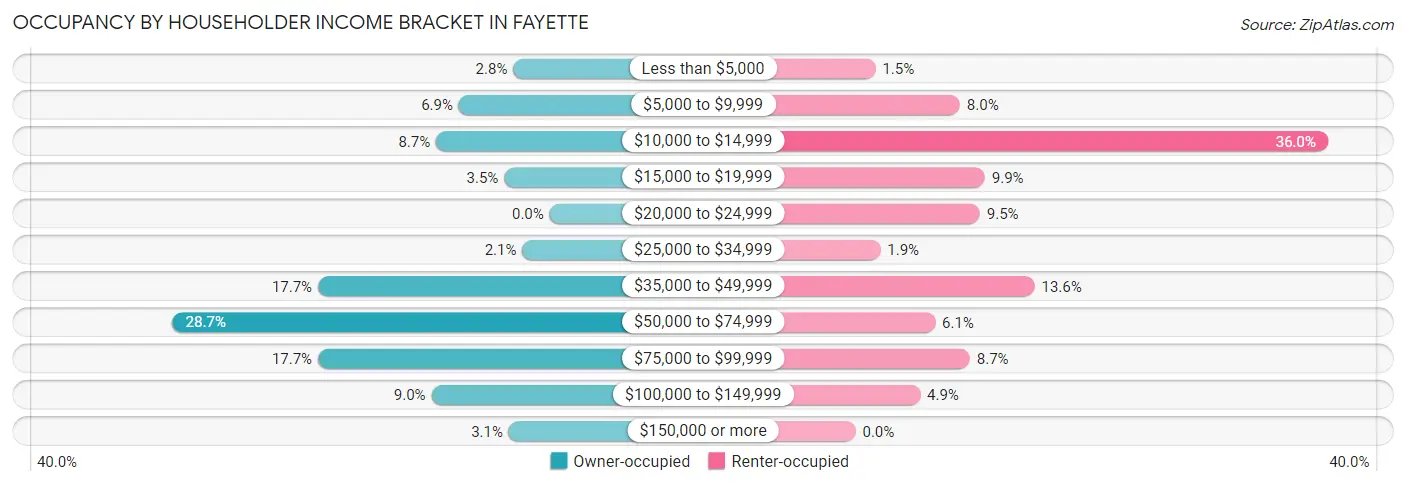
| Income Bracket | Owner-occupied | Renter-occupied |
| Less than $5,000 | 8 (2.8%) | 4 (1.5%) |
| $5,000 to $9,999 | 20 (6.9%) | 21 (8.0%) |
| $10,000 to $14,999 | 25 (8.6%) | 95 (36.0%) |
| $15,000 to $19,999 | 10 (3.5%) | 26 (9.9%) |
| $20,000 to $24,999 | 0 (0.0%) | 25 (9.5%) |
| $25,000 to $34,999 | 6 (2.1%) | 5 (1.9%) |
| $35,000 to $49,999 | 51 (17.6%) | 36 (13.6%) |
| $50,000 to $74,999 | 83 (28.7%) | 16 (6.1%) |
| $75,000 to $99,999 | 51 (17.6%) | 23 (8.7%) |
| $100,000 to $149,999 | 26 (9.0%) | 13 (4.9%) |
| $150,000 or more | 9 (3.1%) | 0 (0.0%) |
| Total | 289 (100.0%) | 264 (100.0%) |
Monthly Housing Cost Tiers in Fayette
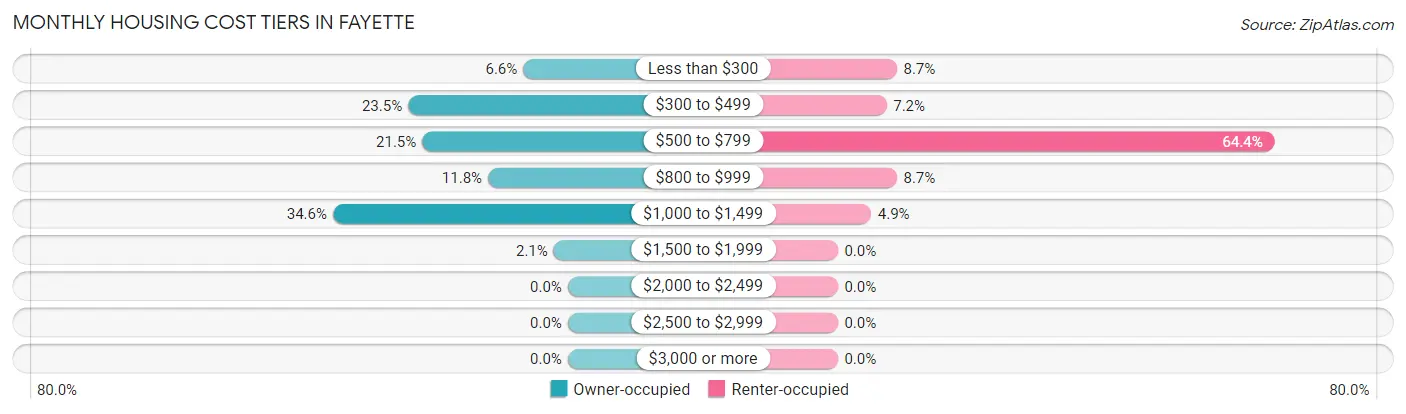
| Monthly Cost | Owner-occupied | Renter-occupied |
| Less than $300 | 19 (6.6%) | 23 (8.7%) |
| $300 to $499 | 68 (23.5%) | 19 (7.2%) |
| $500 to $799 | 62 (21.4%) | 170 (64.4%) |
| $800 to $999 | 34 (11.8%) | 23 (8.7%) |
| $1,000 to $1,499 | 100 (34.6%) | 13 (4.9%) |
| $1,500 to $1,999 | 6 (2.1%) | 0 (0.0%) |
| $2,000 to $2,499 | 0 (0.0%) | 0 (0.0%) |
| $2,500 to $2,999 | 0 (0.0%) | 0 (0.0%) |
| $3,000 or more | 0 (0.0%) | 0 (0.0%) |
| Total | 289 (100.0%) | 264 (100.0%) |
Physical Housing Characteristics in Fayette
Housing Structures in Fayette
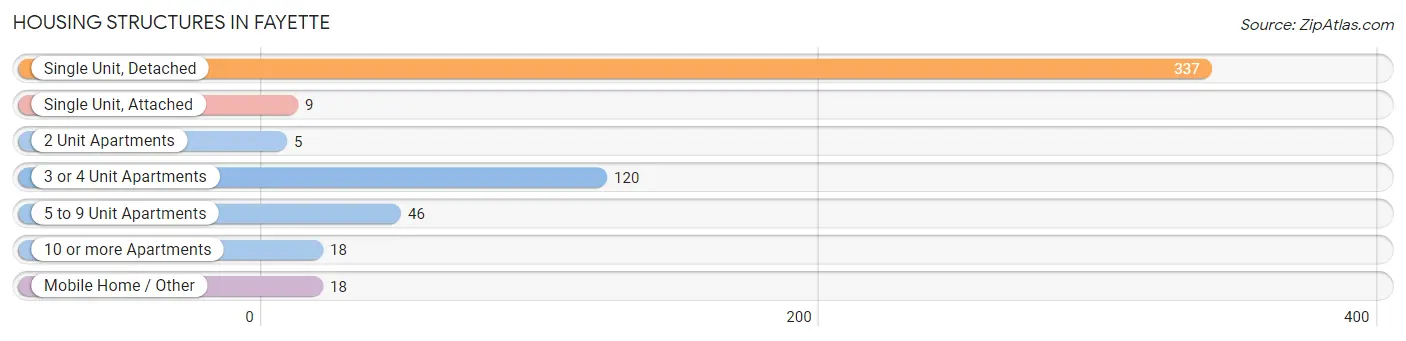
| Structure Type | # Housing Units | % Housing Units |
| Single Unit, Detached | 337 | 60.9% |
| Single Unit, Attached | 9 | 1.6% |
| 2 Unit Apartments | 5 | 0.9% |
| 3 or 4 Unit Apartments | 120 | 21.7% |
| 5 to 9 Unit Apartments | 46 | 8.3% |
| 10 or more Apartments | 18 | 3.3% |
| Mobile Home / Other | 18 | 3.3% |
| Total | 553 | 100.0% |
Housing Structures by Occupancy in Fayette
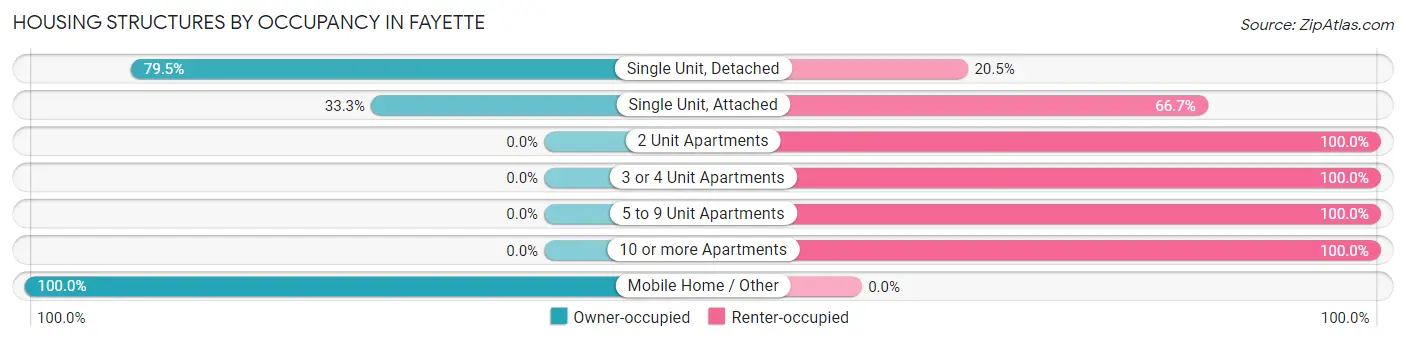
| Structure Type | Owner-occupied | Renter-occupied |
| Single Unit, Detached | 268 (79.5%) | 69 (20.5%) |
| Single Unit, Attached | 3 (33.3%) | 6 (66.7%) |
| 2 Unit Apartments | 0 (0.0%) | 5 (100.0%) |
| 3 or 4 Unit Apartments | 0 (0.0%) | 120 (100.0%) |
| 5 to 9 Unit Apartments | 0 (0.0%) | 46 (100.0%) |
| 10 or more Apartments | 0 (0.0%) | 18 (100.0%) |
| Mobile Home / Other | 18 (100.0%) | 0 (0.0%) |
| Total | 289 (52.3%) | 264 (47.7%) |
Housing Structures by Number of Rooms in Fayette
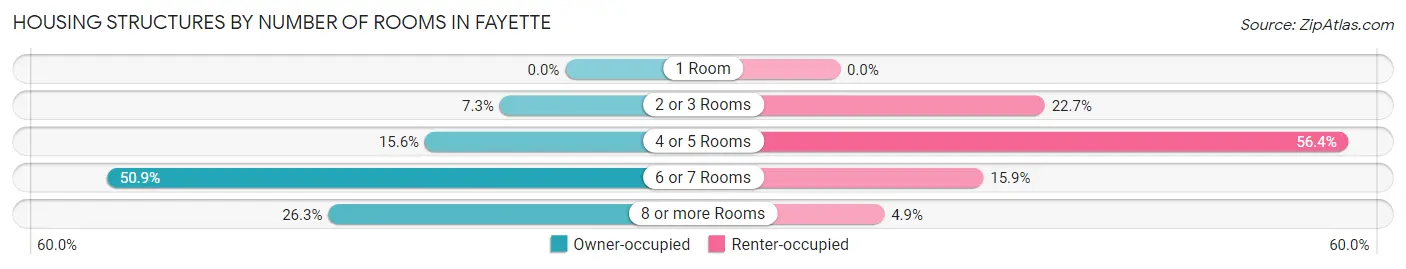
| Number of Rooms | Owner-occupied | Renter-occupied |
| 1 Room | 0 (0.0%) | 0 (0.0%) |
| 2 or 3 Rooms | 21 (7.3%) | 60 (22.7%) |
| 4 or 5 Rooms | 45 (15.6%) | 149 (56.4%) |
| 6 or 7 Rooms | 147 (50.9%) | 42 (15.9%) |
| 8 or more Rooms | 76 (26.3%) | 13 (4.9%) |
| Total | 289 (100.0%) | 264 (100.0%) |
Housing Structure by Heating Type in Fayette
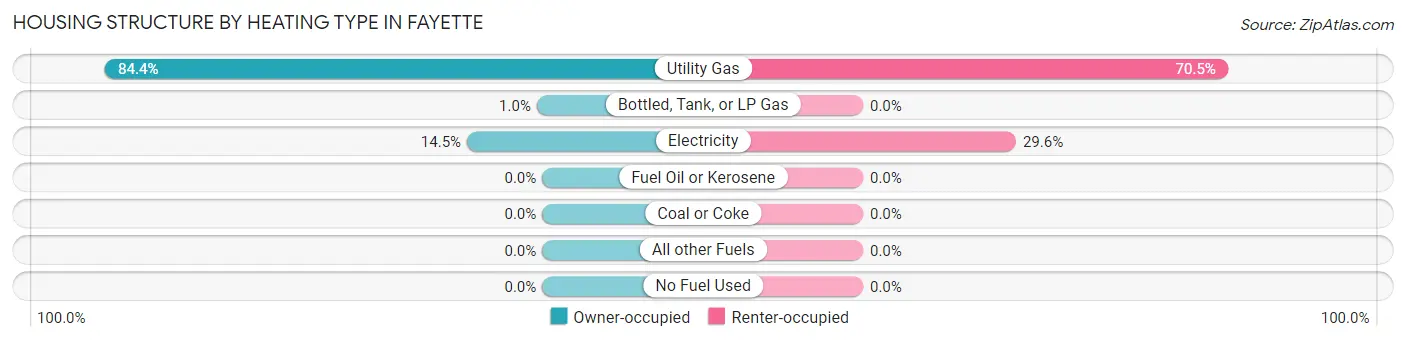
| Heating Type | Owner-occupied | Renter-occupied |
| Utility Gas | 244 (84.4%) | 186 (70.5%) |
| Bottled, Tank, or LP Gas | 3 (1.0%) | 0 (0.0%) |
| Electricity | 42 (14.5%) | 78 (29.5%) |
| Fuel Oil or Kerosene | 0 (0.0%) | 0 (0.0%) |
| Coal or Coke | 0 (0.0%) | 0 (0.0%) |
| All other Fuels | 0 (0.0%) | 0 (0.0%) |
| No Fuel Used | 0 (0.0%) | 0 (0.0%) |
| Total | 289 (100.0%) | 264 (100.0%) |
Household Vehicle Usage in Fayette
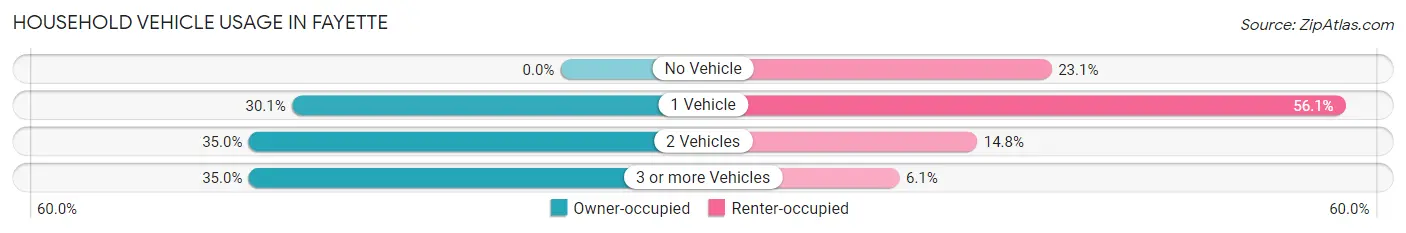
| Vehicles per Household | Owner-occupied | Renter-occupied |
| No Vehicle | 0 (0.0%) | 61 (23.1%) |
| 1 Vehicle | 87 (30.1%) | 148 (56.1%) |
| 2 Vehicles | 101 (34.9%) | 39 (14.8%) |
| 3 or more Vehicles | 101 (34.9%) | 16 (6.1%) |
| Total | 289 (100.0%) | 264 (100.0%) |
Real Estate & Mortgages in Fayette
Real Estate and Mortgage Overview in Fayette
| Characteristic | Without Mortgage | With Mortgage |
| Housing Units | 98 | 191 |
| Median Property Value | $82,900 | $80,300 |
| Median Household Income | $45,000 | $9 |
| Monthly Housing Costs | $403 | $0 |
| Real Estate Taxes | $1,234 | $9 |
Property Value by Mortgage Status in Fayette
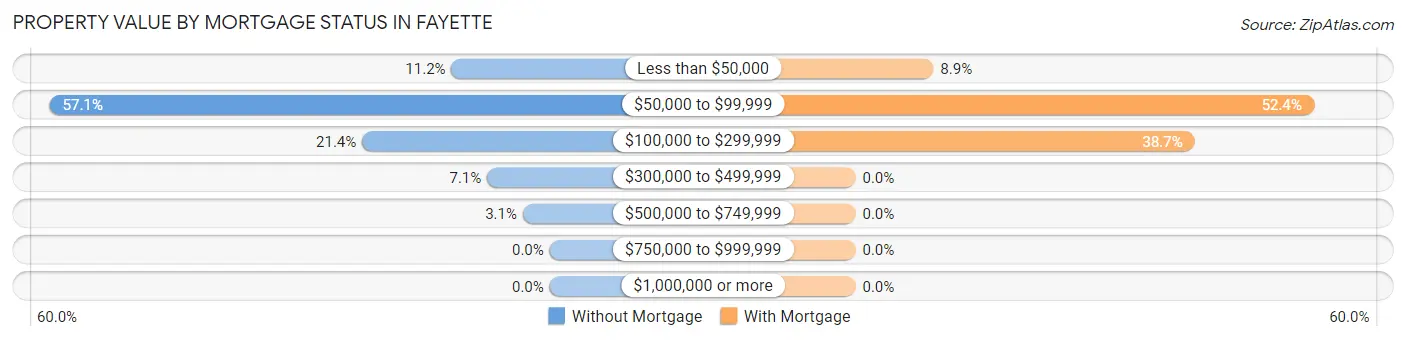
| Property Value | Without Mortgage | With Mortgage |
| Less than $50,000 | 11 (11.2%) | 17 (8.9%) |
| $50,000 to $99,999 | 56 (57.1%) | 100 (52.4%) |
| $100,000 to $299,999 | 21 (21.4%) | 74 (38.7%) |
| $300,000 to $499,999 | 7 (7.1%) | 0 (0.0%) |
| $500,000 to $749,999 | 3 (3.1%) | 0 (0.0%) |
| $750,000 to $999,999 | 0 (0.0%) | 0 (0.0%) |
| $1,000,000 or more | 0 (0.0%) | 0 (0.0%) |
| Total | 98 (100.0%) | 191 (100.0%) |
Household Income by Mortgage Status in Fayette
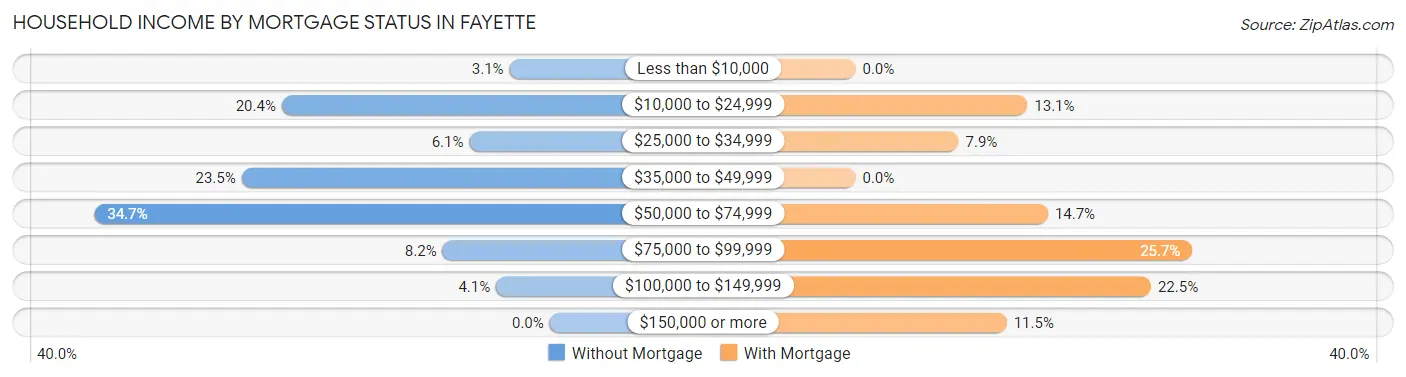
| Household Income | Without Mortgage | With Mortgage |
| Less than $10,000 | 3 (3.1%) | 0 (0.0%) |
| $10,000 to $24,999 | 20 (20.4%) | 25 (13.1%) |
| $25,000 to $34,999 | 6 (6.1%) | 15 (7.9%) |
| $35,000 to $49,999 | 23 (23.5%) | 0 (0.0%) |
| $50,000 to $74,999 | 34 (34.7%) | 28 (14.7%) |
| $75,000 to $99,999 | 8 (8.2%) | 49 (25.7%) |
| $100,000 to $149,999 | 4 (4.1%) | 43 (22.5%) |
| $150,000 or more | 0 (0.0%) | 22 (11.5%) |
| Total | 98 (100.0%) | 191 (100.0%) |
Property Value to Household Income Ratio in Fayette
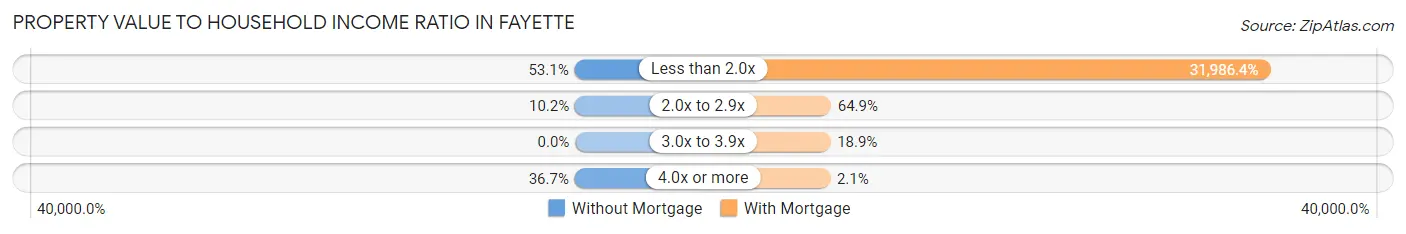
| Value-to-Income Ratio | Without Mortgage | With Mortgage |
| Less than 2.0x | 52 (53.1%) | 61,094 (31,986.4%) |
| 2.0x to 2.9x | 10 (10.2%) | 124 (64.9%) |
| 3.0x to 3.9x | 0 (0.0%) | 36 (18.9%) |
| 4.0x or more | 36 (36.7%) | 4 (2.1%) |
| Total | 98 (100.0%) | 191 (100.0%) |
Real Estate Taxes by Mortgage Status in Fayette
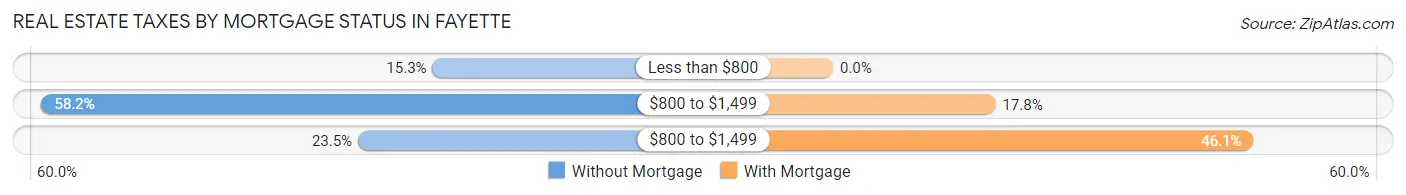
| Property Taxes | Without Mortgage | With Mortgage |
| Less than $800 | 15 (15.3%) | 0 (0.0%) |
| $800 to $1,499 | 57 (58.2%) | 34 (17.8%) |
| $800 to $1,499 | 23 (23.5%) | 88 (46.1%) |
| Total | 98 (100.0%) | 191 (100.0%) |
Health & Disability in Fayette
Health Insurance Coverage by Age in Fayette
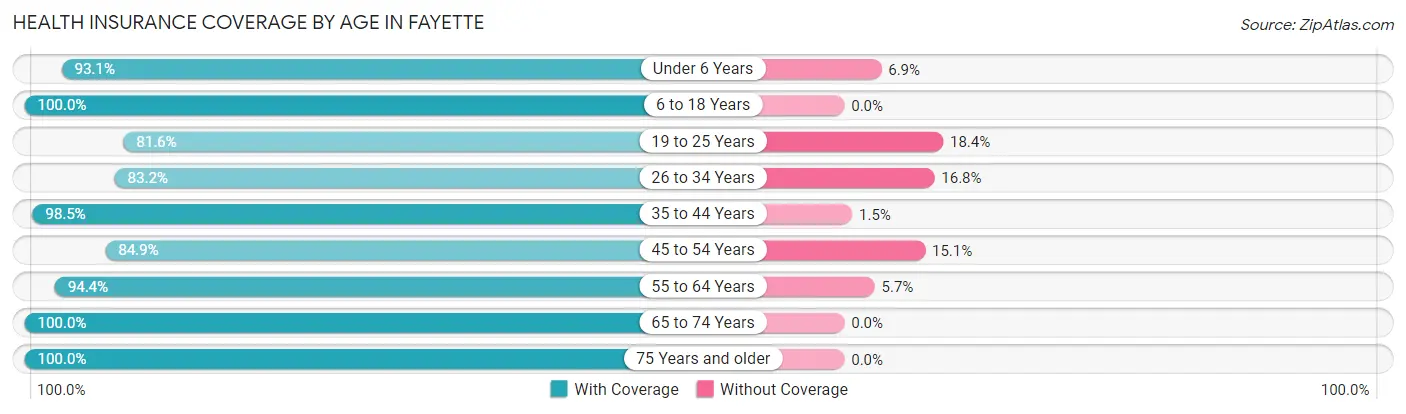
| Age Bracket | With Coverage | Without Coverage |
| Under 6 Years | 54 (93.1%) | 4 (6.9%) |
| 6 to 18 Years | 124 (100.0%) | 0 (0.0%) |
| 19 to 25 Years | 62 (81.6%) | 14 (18.4%) |
| 26 to 34 Years | 104 (83.2%) | 21 (16.8%) |
| 35 to 44 Years | 203 (98.5%) | 3 (1.5%) |
| 45 to 54 Years | 141 (84.9%) | 25 (15.1%) |
| 55 to 64 Years | 167 (94.4%) | 10 (5.7%) |
| 65 to 74 Years | 141 (100.0%) | 0 (0.0%) |
| 75 Years and older | 104 (100.0%) | 0 (0.0%) |
| Total | 1,100 (93.5%) | 77 (6.5%) |
Health Insurance Coverage by Citizenship Status in Fayette
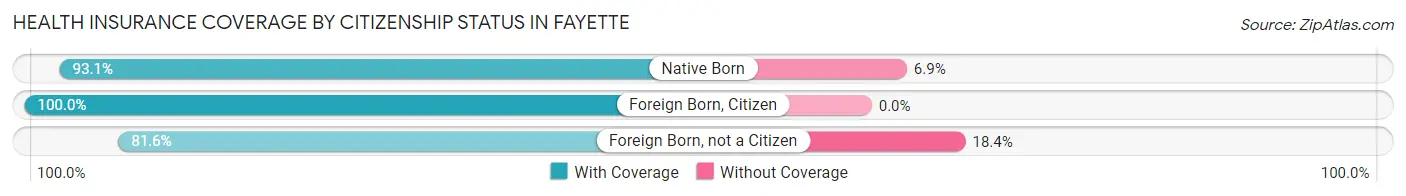
| Citizenship Status | With Coverage | Without Coverage |
| Native Born | 54 (93.1%) | 4 (6.9%) |
| Foreign Born, Citizen | 124 (100.0%) | 0 (0.0%) |
| Foreign Born, not a Citizen | 62 (81.6%) | 14 (18.4%) |
Health Insurance Coverage by Household Income in Fayette
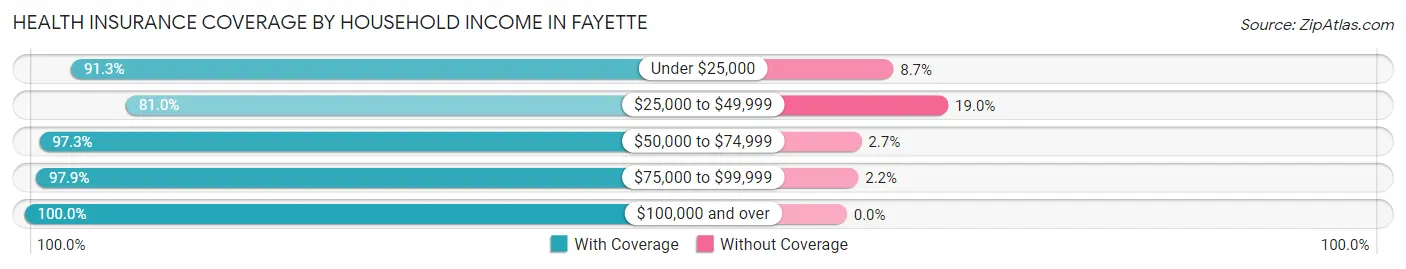
| Household Income | With Coverage | Without Coverage |
| Under $25,000 | 325 (91.3%) | 31 (8.7%) |
| $25,000 to $49,999 | 145 (81.0%) | 34 (19.0%) |
| $50,000 to $74,999 | 284 (97.3%) | 8 (2.7%) |
| $75,000 to $99,999 | 182 (97.9%) | 4 (2.1%) |
| $100,000 and over | 164 (100.0%) | 0 (0.0%) |
Public vs Private Health Insurance Coverage by Age in Fayette
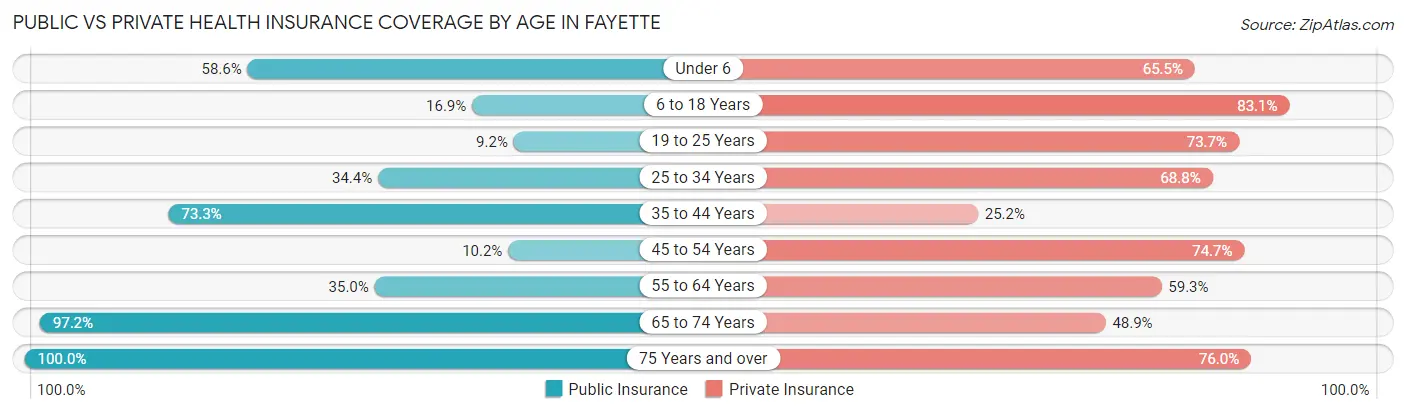
| Age Bracket | Public Insurance | Private Insurance |
| Under 6 | 34 (58.6%) | 38 (65.5%) |
| 6 to 18 Years | 21 (16.9%) | 103 (83.1%) |
| 19 to 25 Years | 7 (9.2%) | 56 (73.7%) |
| 25 to 34 Years | 43 (34.4%) | 86 (68.8%) |
| 35 to 44 Years | 151 (73.3%) | 52 (25.2%) |
| 45 to 54 Years | 17 (10.2%) | 124 (74.7%) |
| 55 to 64 Years | 62 (35.0%) | 105 (59.3%) |
| 65 to 74 Years | 137 (97.2%) | 69 (48.9%) |
| 75 Years and over | 104 (100.0%) | 79 (76.0%) |
| Total | 576 (48.9%) | 712 (60.5%) |
Disability Status by Sex by Age in Fayette
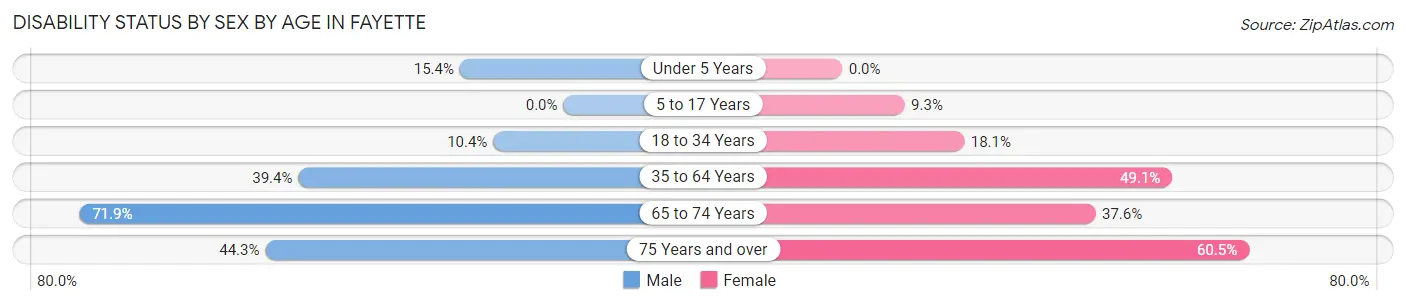
| Age Bracket | Male | Female |
| Under 5 Years | 2 (15.4%) | 0 (0.0%) |
| 5 to 17 Years | 0 (0.0%) | 5 (9.3%) |
| 18 to 34 Years | 10 (10.4%) | 23 (18.1%) |
| 35 to 64 Years | 111 (39.4%) | 131 (49.1%) |
| 65 to 74 Years | 23 (71.9%) | 41 (37.6%) |
| 75 Years and over | 27 (44.3%) | 26 (60.5%) |
Disability Class by Sex by Age in Fayette
Disability Class: Hearing Difficulty
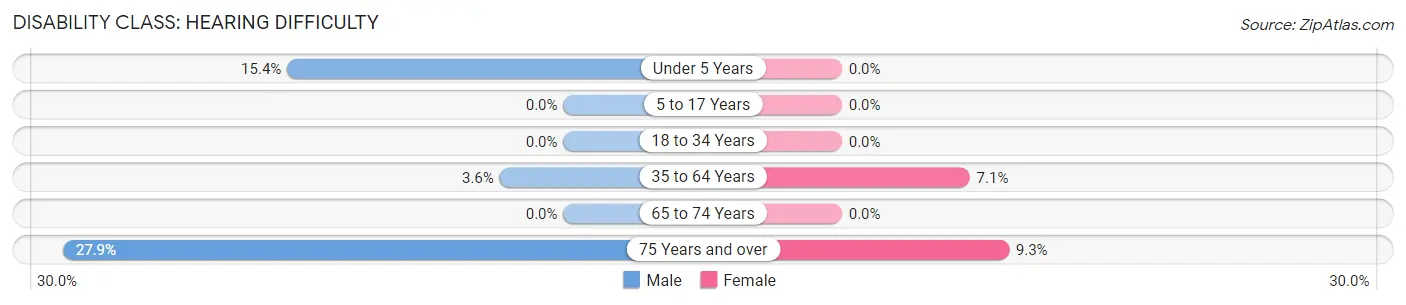
| Age Bracket | Male | Female |
| Under 5 Years | 2 (15.4%) | 0 (0.0%) |
| 5 to 17 Years | 0 (0.0%) | 0 (0.0%) |
| 18 to 34 Years | 0 (0.0%) | 0 (0.0%) |
| 35 to 64 Years | 10 (3.5%) | 19 (7.1%) |
| 65 to 74 Years | 0 (0.0%) | 0 (0.0%) |
| 75 Years and over | 17 (27.9%) | 4 (9.3%) |
Disability Class: Vision Difficulty
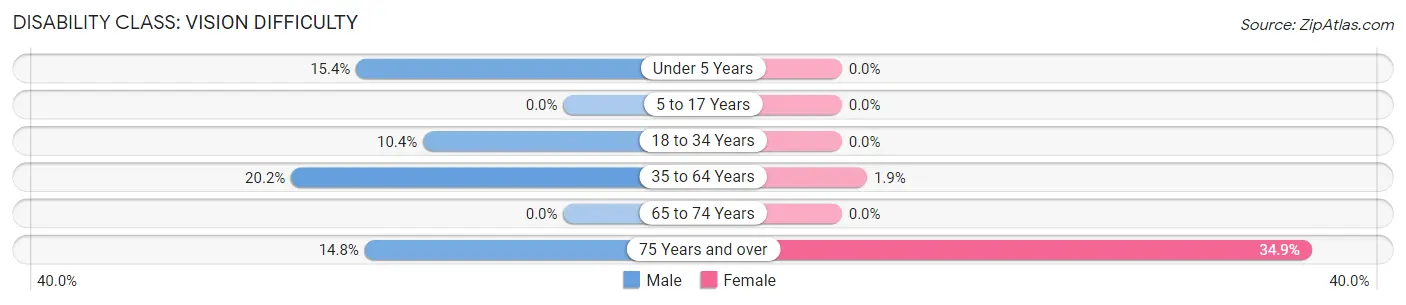
| Age Bracket | Male | Female |
| Under 5 Years | 2 (15.4%) | 0 (0.0%) |
| 5 to 17 Years | 0 (0.0%) | 0 (0.0%) |
| 18 to 34 Years | 10 (10.4%) | 0 (0.0%) |
| 35 to 64 Years | 57 (20.2%) | 5 (1.9%) |
| 65 to 74 Years | 0 (0.0%) | 0 (0.0%) |
| 75 Years and over | 9 (14.7%) | 15 (34.9%) |
Disability Class: Cognitive Difficulty
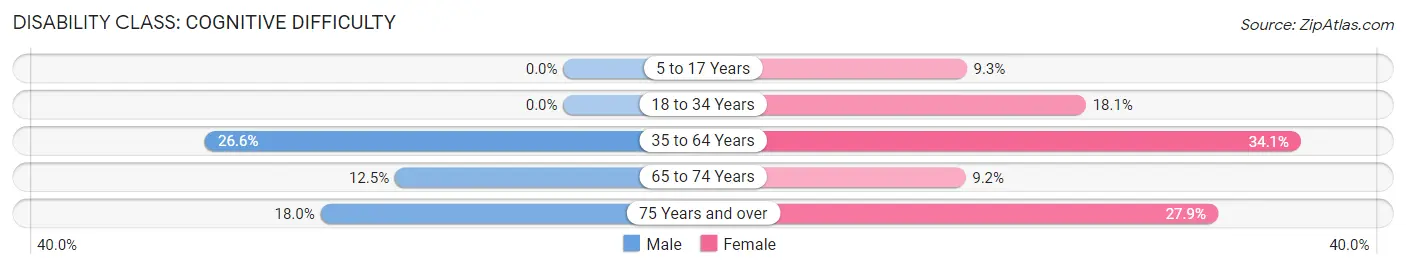
| Age Bracket | Male | Female |
| 5 to 17 Years | 0 (0.0%) | 5 (9.3%) |
| 18 to 34 Years | 0 (0.0%) | 23 (18.1%) |
| 35 to 64 Years | 75 (26.6%) | 91 (34.1%) |
| 65 to 74 Years | 4 (12.5%) | 10 (9.2%) |
| 75 Years and over | 11 (18.0%) | 12 (27.9%) |
Disability Class: Ambulatory Difficulty
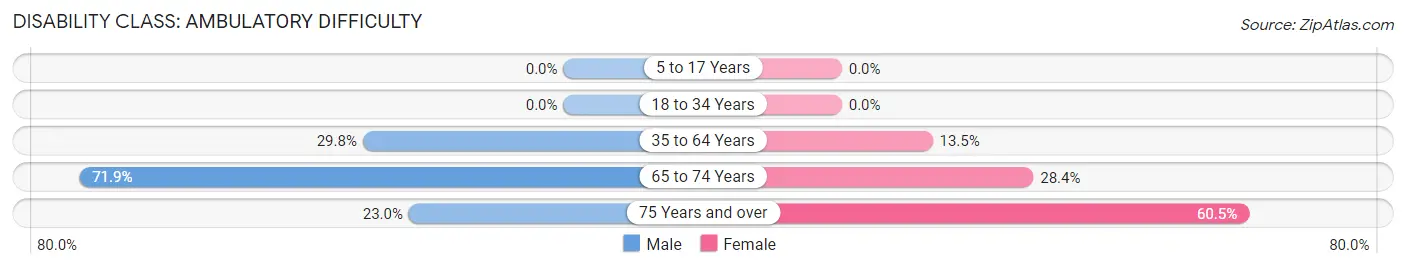
| Age Bracket | Male | Female |
| 5 to 17 Years | 0 (0.0%) | 0 (0.0%) |
| 18 to 34 Years | 0 (0.0%) | 0 (0.0%) |
| 35 to 64 Years | 84 (29.8%) | 36 (13.5%) |
| 65 to 74 Years | 23 (71.9%) | 31 (28.4%) |
| 75 Years and over | 14 (23.0%) | 26 (60.5%) |
Disability Class: Self-Care Difficulty
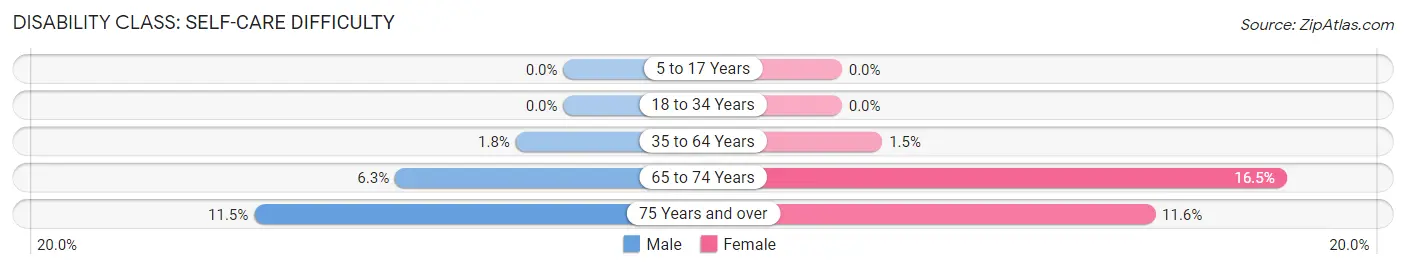
| Age Bracket | Male | Female |
| 5 to 17 Years | 0 (0.0%) | 0 (0.0%) |
| 18 to 34 Years | 0 (0.0%) | 0 (0.0%) |
| 35 to 64 Years | 5 (1.8%) | 4 (1.5%) |
| 65 to 74 Years | 2 (6.2%) | 18 (16.5%) |
| 75 Years and over | 7 (11.5%) | 5 (11.6%) |
Technology Access in Fayette
Computing Device Access in Fayette
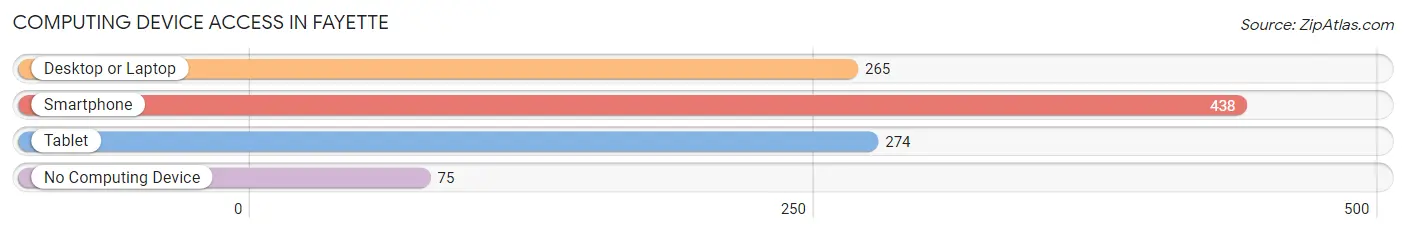
| Device Type | # Households | % Households |
| Desktop or Laptop | 265 | 47.9% |
| Smartphone | 438 | 79.2% |
| Tablet | 274 | 49.5% |
| No Computing Device | 75 | 13.6% |
| Total | 553 | 100.0% |
Internet Access in Fayette
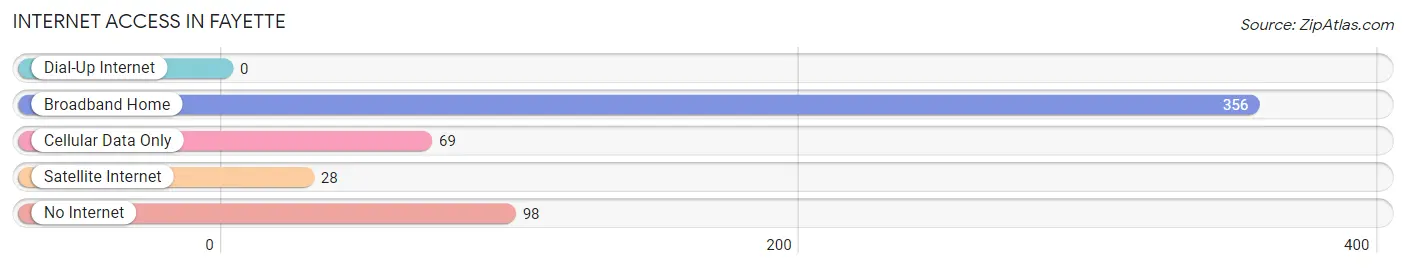
| Internet Type | # Households | % Households |
| Dial-Up Internet | 0 | 0.0% |
| Broadband Home | 356 | 64.4% |
| Cellular Data Only | 69 | 12.5% |
| Satellite Internet | 28 | 5.1% |
| No Internet | 98 | 17.7% |
| Total | 553 | 100.0% |
Fayette Summary
Fayette, Ohio is a small village located in Fulton County, Ohio. It is situated on the banks of the Maumee River, approximately 20 miles southwest of Toledo. The village has a population of approximately 1,000 people and is part of the Wauseon Metropolitan Statistical Area.
History
Fayette was founded in 1837 by a group of settlers from Pennsylvania. The village was named after the Marquis de Lafayette, a French military officer who fought alongside the American colonists during the Revolutionary War. The village was incorporated in 1845 and was the first village in Fulton County to be incorporated.
The village was an important stop on the Wabash and Erie Canal, which ran through the village from 1845 to 1874. The canal was an important transportation route for goods and people, and it helped to spur the growth of the village.
The village was also an important stop on the Toledo and Ohio Central Railroad, which ran through the village from 1881 to 1937. The railroad was an important transportation route for goods and people, and it helped to spur the growth of the village.
Geography
Fayette is located in northwestern Ohio, approximately 20 miles southwest of Toledo. The village is situated on the banks of the Maumee River, and is surrounded by farmland. The village is located in a rural area, and is surrounded by small towns and villages.
The village has a total area of 0.6 square miles, all of which is land. The village is located at an elevation of 690 feet above sea level.
Economy
The economy of Fayette is largely based on agriculture. The village is surrounded by farmland, and many of the residents are employed in the agricultural industry. The village also has a few small businesses, including a grocery store, a hardware store, and a few restaurants.
Demographics
As of the 2010 census, the village had a population of 1,000 people. The racial makeup of the village was 97.2% White, 0.7% African American, 0.2% Native American, 0.2% Asian, 0.2% from other races, and 1.7% from two or more races. Hispanic or Latino of any race were 0.7% of the population.
The median household income in the village was $41,250, and the median family income was $45,833. The per capita income for the village was $17,917. About 11.2% of families and 13.2% of the population were below the poverty line, including 16.7% of those under age 18 and 8.3% of those age 65 or over.
Common Questions
What is Per Capita Income in Fayette?
Per Capita income in Fayette is $22,472.
What is the Median Family Income in Fayette?
Median Family Income in Fayette is $57,500.
What is the Median Household income in Fayette?
Median Household Income in Fayette is $41,016.
What is Family Income Deficit in Fayette?
Family Income Deficit in Fayette is $7,684.
Families that are below poverty line in Fayette earn $7,684 less on average than the poverty threshold level.
What is Inequality or Gini Index in Fayette?
Inequality or Gini Index in Fayette is 0.44.
What is the Total Population of Fayette?
Total Population of Fayette is 1,177.
What is the Total Male Population of Fayette?
Total Male Population of Fayette is 552.
What is the Total Female Population of Fayette?
Total Female Population of Fayette is 625.
What is the Ratio of Males per 100 Females in Fayette?
There are 88.32 Males per 100 Females in Fayette.
What is the Ratio of Females per 100 Males in Fayette?
There are 113.22 Females per 100 Males in Fayette.
What is the Median Population Age in Fayette?
Median Population Age in Fayette is 44.9 Years.
What is the Average Family Size in Fayette
Average Family Size in Fayette is 2.7 People.
What is the Average Household Size in Fayette
Average Household Size in Fayette is 2.1 People.
How Large is the Labor Force in Fayette?
There are 609 People in the Labor Forcein in Fayette.
What is the Percentage of People in the Labor Force in Fayette?
58.3% of People are in the Labor Force in Fayette.
What is the Unemployment Rate in Fayette?
Unemployment Rate in Fayette is 5.3%.