West Unity, OH Map & Demographics
West Unity Map
West Unity Overview
$23,477
PER CAPITA INCOME
$63,438
AVG FAMILY INCOME
$57,778
AVG HOUSEHOLD INCOME
39.0%
WAGE / INCOME GAP [ % ]
61.0¢/ $1
WAGE / INCOME GAP [ $ ]
0.32
INEQUALITY / GINI INDEX
1,878
TOTAL POPULATION
936
MALE POPULATION
942
FEMALE POPULATION
99.36
MALES / 100 FEMALES
100.64
FEMALES / 100 MALES
30.9
MEDIAN AGE
3.1
AVG FAMILY SIZE
2.5
AVG HOUSEHOLD SIZE
946
LABOR FORCE [ PEOPLE ]
72.6%
PERCENT IN LABOR FORCE
8.7%
UNEMPLOYMENT RATE
West Unity Zip Codes
West Unity Area Codes
Income in West Unity
Income Overview in West Unity
Per Capita Income in West Unity is $23,477, while median incomes of families and households are $63,438 and $57,778 respectively.
| Characteristic | Number | Measure |
| Per Capita Income | 1,878 | $23,477 |
| Median Family Income | 463 | $63,438 |
| Mean Family Income | 463 | $65,683 |
| Median Household Income | 730 | $57,778 |
| Mean Household Income | 730 | $59,310 |
| Income Deficit | 463 | $0 |
| Wage / Income Gap (%) | 1,878 | 39.04% |
| Wage / Income Gap ($) | 1,878 | 60.96¢ per $1 |
| Gini / Inequality Index | 1,878 | 0.32 |
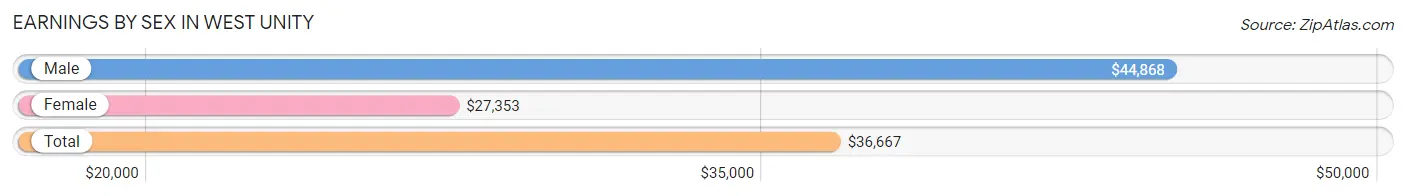
Earnings by Sex in West Unity
Average Earnings in West Unity are $36,667, $44,868 for men and $27,353 for women, a difference of 39.0%.
| Sex | Number | Average Earnings |
| Male | 454 (48.6%) | $44,868 |
| Female | 480 (51.4%) | $27,353 |
| Total | 934 (100.0%) | $36,667 |
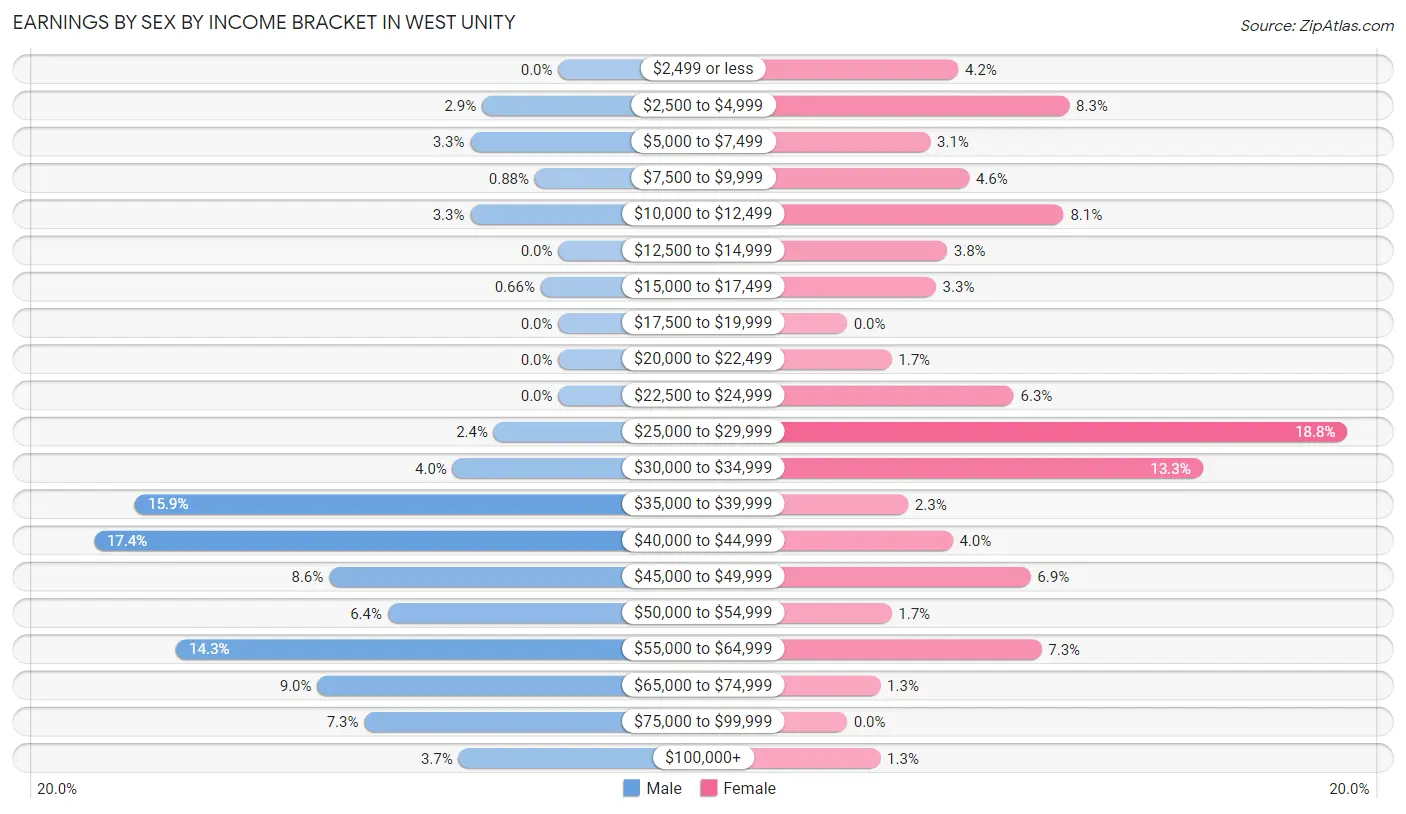
Earnings by Sex by Income Bracket in West Unity
The most common earnings brackets in West Unity are $40,000 to $44,999 for men (79 | 17.4%) and $25,000 to $29,999 for women (90 | 18.8%).
| Income | Male | Female |
| $2,499 or less | 0 (0.0%) | 20 (4.2%) |
| $2,500 to $4,999 | 13 (2.9%) | 40 (8.3%) |
| $5,000 to $7,499 | 15 (3.3%) | 15 (3.1%) |
| $7,500 to $9,999 | 4 (0.9%) | 22 (4.6%) |
| $10,000 to $12,499 | 15 (3.3%) | 39 (8.1%) |
| $12,500 to $14,999 | 0 (0.0%) | 18 (3.7%) |
| $15,000 to $17,499 | 3 (0.7%) | 16 (3.3%) |
| $17,500 to $19,999 | 0 (0.0%) | 0 (0.0%) |
| $20,000 to $22,499 | 0 (0.0%) | 8 (1.7%) |
| $22,500 to $24,999 | 0 (0.0%) | 30 (6.2%) |
| $25,000 to $29,999 | 11 (2.4%) | 90 (18.8%) |
| $30,000 to $34,999 | 18 (4.0%) | 64 (13.3%) |
| $35,000 to $39,999 | 72 (15.9%) | 11 (2.3%) |
| $40,000 to $44,999 | 79 (17.4%) | 19 (4.0%) |
| $45,000 to $49,999 | 39 (8.6%) | 33 (6.9%) |
| $50,000 to $54,999 | 29 (6.4%) | 8 (1.7%) |
| $55,000 to $64,999 | 65 (14.3%) | 35 (7.3%) |
| $65,000 to $74,999 | 41 (9.0%) | 6 (1.3%) |
| $75,000 to $99,999 | 33 (7.3%) | 0 (0.0%) |
| $100,000+ | 17 (3.7%) | 6 (1.3%) |
| Total | 454 (100.0%) | 480 (100.0%) |
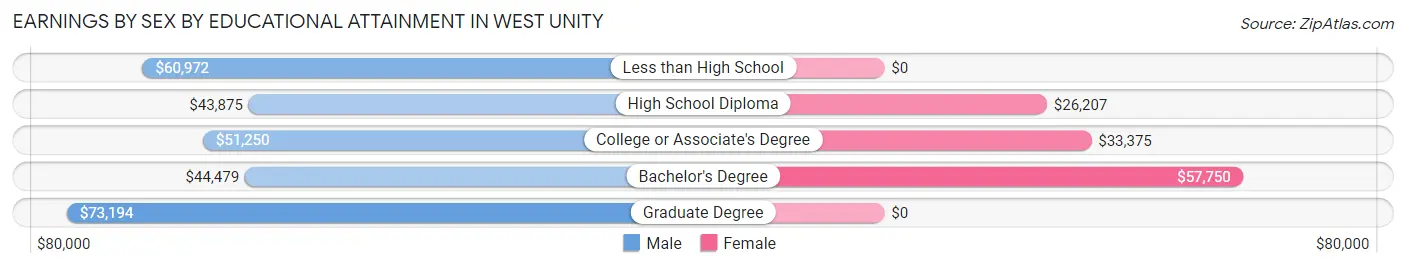
Earnings by Sex by Educational Attainment in West Unity
Average earnings in West Unity are $46,304 for men and $28,906 for women, a difference of 37.6%. Men with an educational attainment of graduate degree enjoy the highest average annual earnings of $73,194, while those with high school diploma education earn the least with $43,875. Women with an educational attainment of bachelor's degree earn the most with the average annual earnings of $57,750, while those with high school diploma education have the smallest earnings of $26,207.
| Educational Attainment | Male Income | Female Income |
| Less than High School | $60,972 | $0 |
| High School Diploma | $43,875 | $26,207 |
| College or Associate's Degree | $51,250 | $33,375 |
| Bachelor's Degree | $44,479 | $57,750 |
| Graduate Degree | $73,194 | $0 |
| Total | $46,304 | $28,906 |
Family Income in West Unity
Family Income Brackets in West Unity
According to the West Unity family income data, there are 139 families falling into the $50,000 to $74,999 income range, which is the most common income bracket and makes up 30.0% of all families. Conversely, the $200,000+ income bracket is the least frequent group with only 3 families (0.6%) belonging to this category.
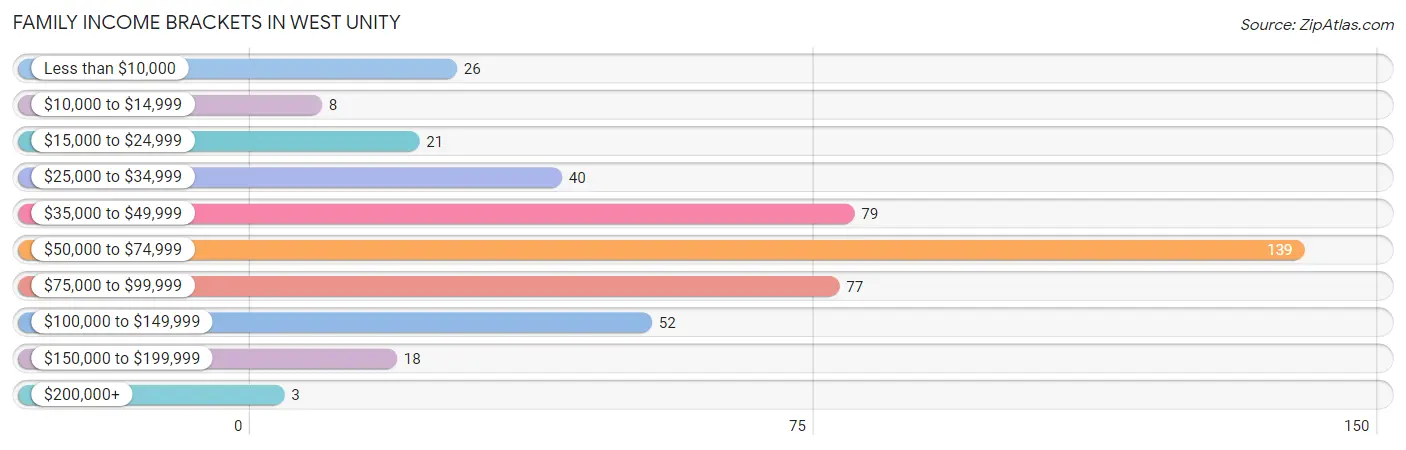
| Income Bracket | # Families | % Families |
| Less than $10,000 | 26 | 5.6% |
| $10,000 to $14,999 | 8 | 1.7% |
| $15,000 to $24,999 | 21 | 4.5% |
| $25,000 to $34,999 | 40 | 8.6% |
| $35,000 to $49,999 | 79 | 17.1% |
| $50,000 to $74,999 | 139 | 30.0% |
| $75,000 to $99,999 | 77 | 16.6% |
| $100,000 to $149,999 | 52 | 11.2% |
| $150,000 to $199,999 | 18 | 3.9% |
| $200,000+ | 3 | 0.6% |
Family Income by Famaliy Size in West Unity
2-person families (193 | 41.7%) account for the highest median family income in West Unity with $71,719 per family, while 2-person families (193 | 41.7%) have the highest median income of $35,860 per family member.
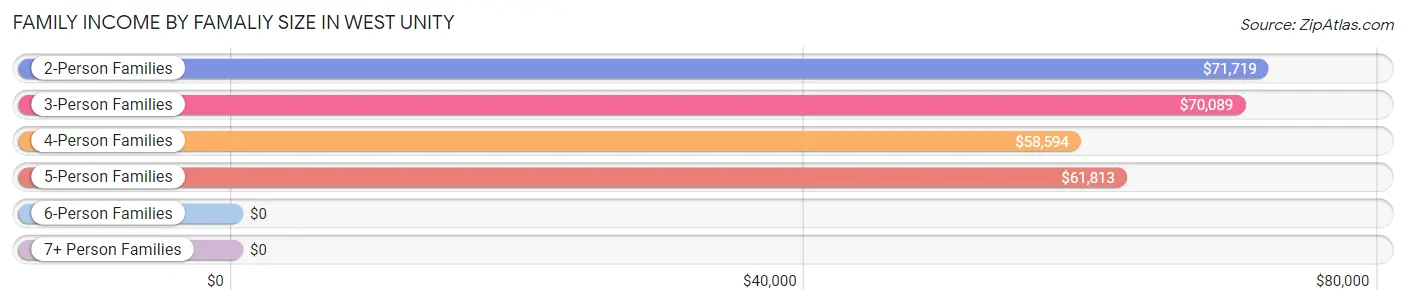
| Income Bracket | # Families | Median Income |
| 2-Person Families | 193 (41.7%) | $71,719 |
| 3-Person Families | 127 (27.4%) | $70,089 |
| 4-Person Families | 79 (17.1%) | $58,594 |
| 5-Person Families | 47 (10.2%) | $61,813 |
| 6-Person Families | 17 (3.7%) | $0 |
| 7+ Person Families | 0 (0.0%) | $0 |
| Total | 463 (100.0%) | $63,438 |
Family Income by Number of Earners in West Unity
The median family income in West Unity is $63,438, with families comprising 3+ earners (27) having the highest median family income of $114,583, while families with no earners (79) have the lowest median family income of $26,719, accounting for 5.8% and 17.1% of families, respectively.
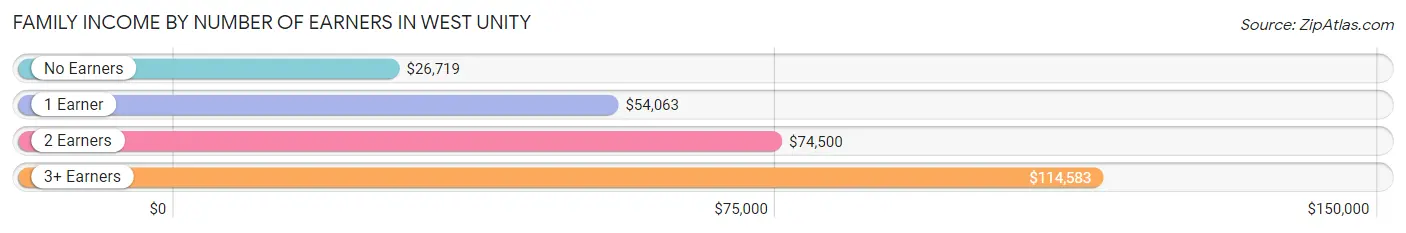
| Number of Earners | # Families | Median Income |
| No Earners | 79 (17.1%) | $26,719 |
| 1 Earner | 199 (43.0%) | $54,063 |
| 2 Earners | 158 (34.1%) | $74,500 |
| 3+ Earners | 27 (5.8%) | $114,583 |
| Total | 463 (100.0%) | $63,438 |
Household Income in West Unity
Household Income Brackets in West Unity
With 218 households falling in the category, the $50,000 to $74,999 income range is the most frequent in West Unity, accounting for 29.9% of all households. In contrast, only 3 households (0.4%) fall into the $200,000+ income bracket, making it the least populous group.
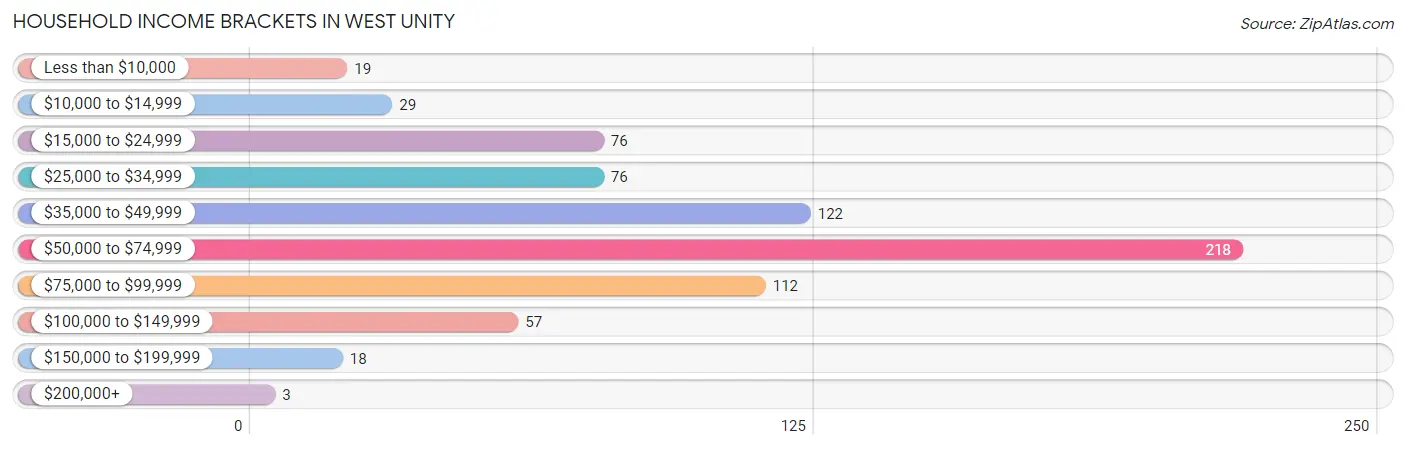
| Income Bracket | # Households | % Households |
| Less than $10,000 | 19 | 2.6% |
| $10,000 to $14,999 | 29 | 4.0% |
| $15,000 to $24,999 | 76 | 10.4% |
| $25,000 to $34,999 | 76 | 10.4% |
| $35,000 to $49,999 | 122 | 16.7% |
| $50,000 to $74,999 | 218 | 29.9% |
| $75,000 to $99,999 | 112 | 15.3% |
| $100,000 to $149,999 | 57 | 7.8% |
| $150,000 to $199,999 | 18 | 2.5% |
| $200,000+ | 3 | 0.4% |
Household Income by Householder Age in West Unity
The median household income in West Unity is $57,778, with the highest median household income of $70,089 found in the 45 to 64 years age bracket for the primary householder. A total of 257 households (35.2%) fall into this category. Meanwhile, the 15 to 24 years age bracket for the primary householder has the lowest median household income of $0, with 16 households (2.2%) in this group.
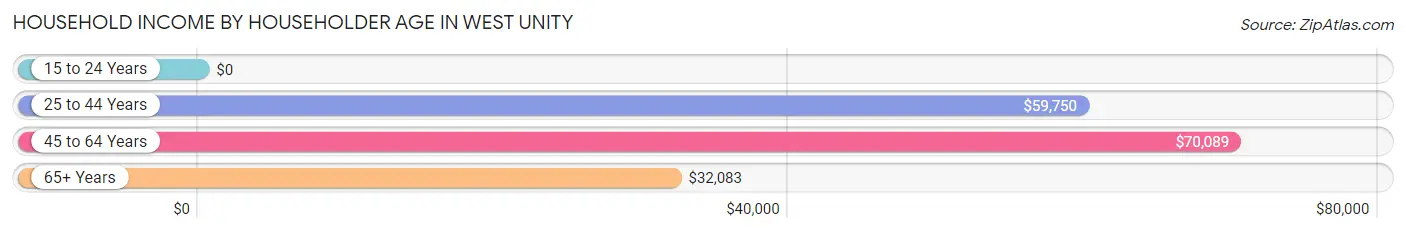
| Income Bracket | # Households | Median Income |
| 15 to 24 Years | 16 (2.2%) | $0 |
| 25 to 44 Years | 328 (44.9%) | $59,750 |
| 45 to 64 Years | 257 (35.2%) | $70,089 |
| 65+ Years | 129 (17.7%) | $32,083 |
| Total | 730 (100.0%) | $57,778 |
Poverty in West Unity
Income Below Poverty by Sex and Age in West Unity
With 18.1% poverty level for males and 16.2% for females among the residents of West Unity, 16 and 17 year old males and 5 year old females are the most vulnerable to poverty, with 4 males (50.0%) and 20 females (80.0%) in their respective age groups living below the poverty level.
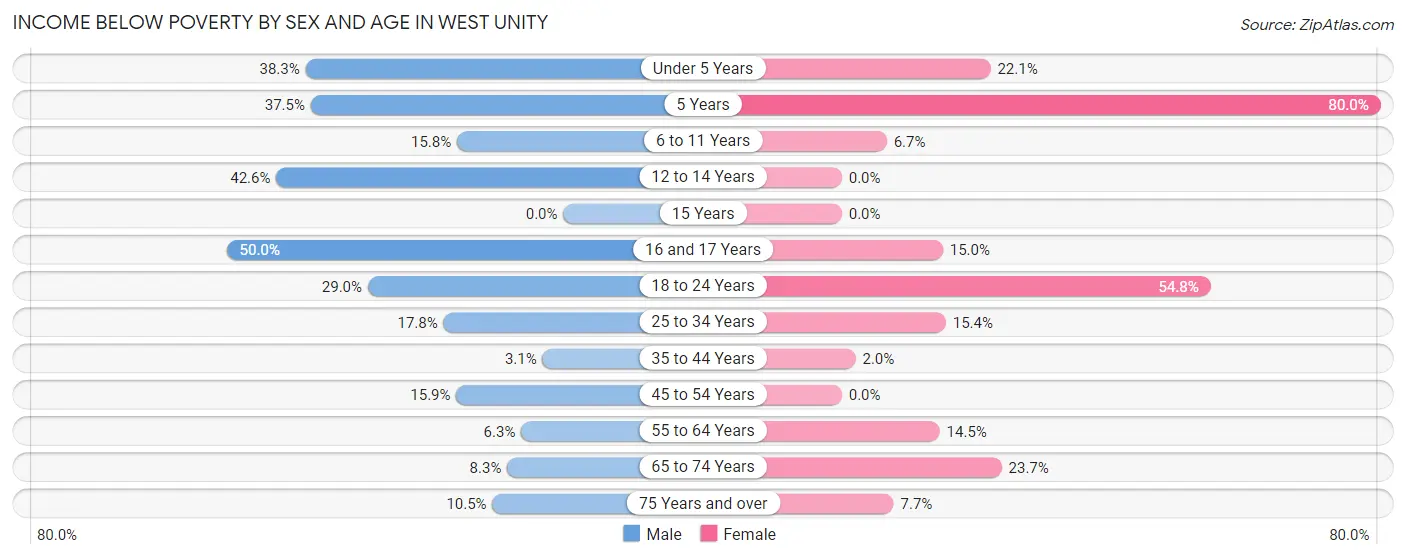
| Age Bracket | Male | Female |
| Under 5 Years | 49 (38.3%) | 17 (22.1%) |
| 5 Years | 3 (37.5%) | 20 (80.0%) |
| 6 to 11 Years | 15 (15.8%) | 6 (6.7%) |
| 12 to 14 Years | 26 (42.6%) | 0 (0.0%) |
| 15 Years | 0 (0.0%) | 0 (0.0%) |
| 16 and 17 Years | 4 (50.0%) | 3 (15.0%) |
| 18 to 24 Years | 9 (29.0%) | 46 (54.8%) |
| 25 to 34 Years | 29 (17.8%) | 23 (15.4%) |
| 35 to 44 Years | 3 (3.1%) | 3 (2.0%) |
| 45 to 54 Years | 17 (15.9%) | 0 (0.0%) |
| 55 to 64 Years | 8 (6.2%) | 17 (14.5%) |
| 65 to 74 Years | 4 (8.3%) | 14 (23.7%) |
| 75 Years and over | 2 (10.5%) | 4 (7.7%) |
| Total | 169 (18.1%) | 153 (16.2%) |
Income Above Poverty by Sex and Age in West Unity
According to the poverty statistics in West Unity, males aged 15 years and females aged 12 to 14 years are the age groups that are most secure financially, with 100.0% of males and 100.0% of females in these age groups living above the poverty line.
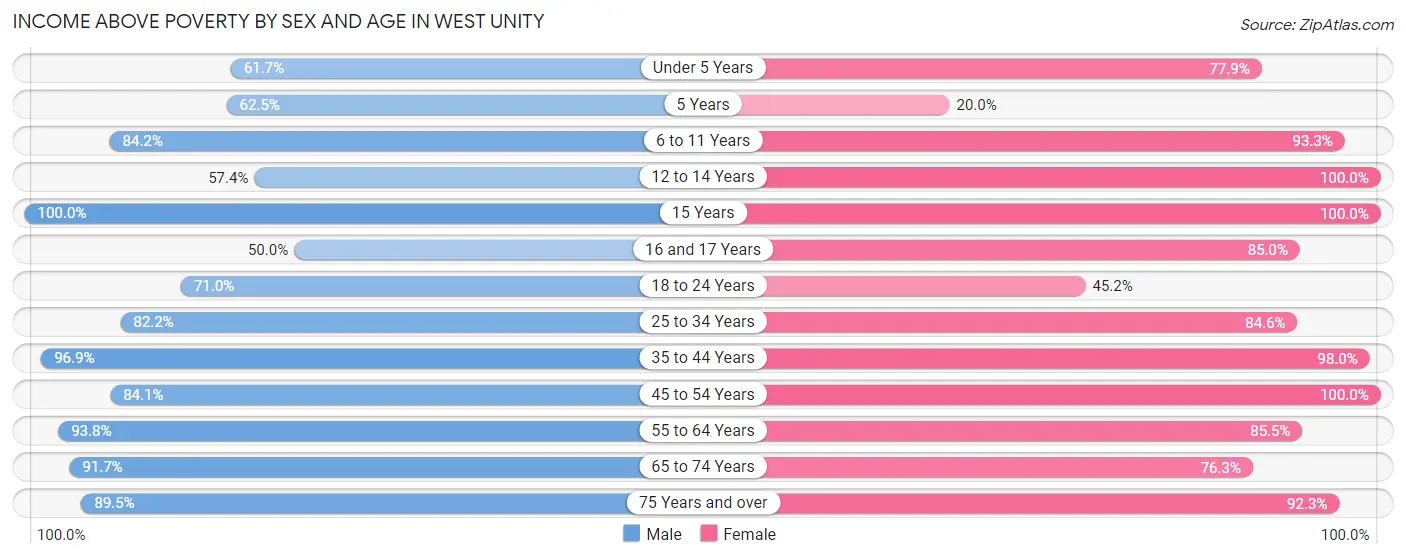
| Age Bracket | Male | Female |
| Under 5 Years | 79 (61.7%) | 60 (77.9%) |
| 5 Years | 5 (62.5%) | 5 (20.0%) |
| 6 to 11 Years | 80 (84.2%) | 84 (93.3%) |
| 12 to 14 Years | 35 (57.4%) | 36 (100.0%) |
| 15 Years | 43 (100.0%) | 12 (100.0%) |
| 16 and 17 Years | 4 (50.0%) | 17 (85.0%) |
| 18 to 24 Years | 22 (71.0%) | 38 (45.2%) |
| 25 to 34 Years | 134 (82.2%) | 126 (84.6%) |
| 35 to 44 Years | 94 (96.9%) | 144 (98.0%) |
| 45 to 54 Years | 90 (84.1%) | 74 (100.0%) |
| 55 to 64 Years | 120 (93.8%) | 100 (85.5%) |
| 65 to 74 Years | 44 (91.7%) | 45 (76.3%) |
| 75 Years and over | 17 (89.5%) | 48 (92.3%) |
| Total | 767 (81.9%) | 789 (83.8%) |
Income Below Poverty Among Married-Couple Families in West Unity
The poverty statistics for married-couple families in West Unity show that 1.8% or 5 of the total 286 families live below the poverty line. Families with 1 or 2 children have the highest poverty rate of 3.0%, comprising of 3 families. On the other hand, families with 3 or 4 children have the lowest poverty rate of 0.0%, which includes 0 families.
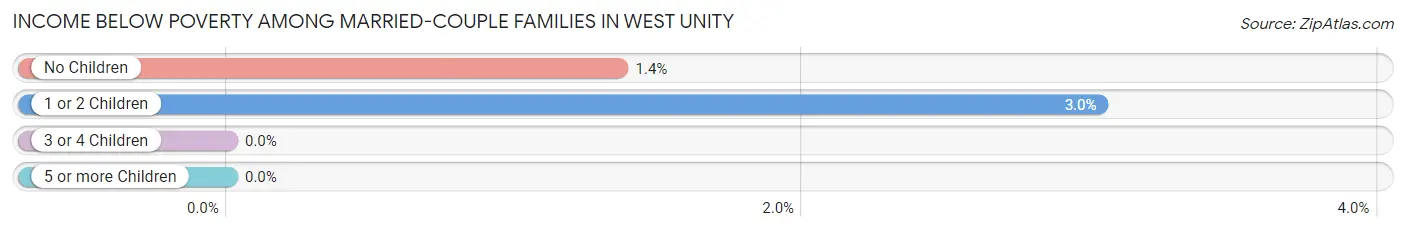
| Children | Above Poverty | Below Poverty |
| No Children | 145 (98.6%) | 2 (1.4%) |
| 1 or 2 Children | 96 (97.0%) | 3 (3.0%) |
| 3 or 4 Children | 40 (100.0%) | 0 (0.0%) |
| 5 or more Children | 0 (0.0%) | 0 (0.0%) |
| Total | 281 (98.3%) | 5 (1.8%) |
Income Below Poverty Among Single-Parent Households in West Unity
According to the poverty data in West Unity, 59.7% or 40 single-father households and 9.1% or 10 single-mother households are living below the poverty line. Among single-father households, those with no children have the highest poverty rate, with 11 households (100.0%) experiencing poverty. Likewise, among single-mother households, those with 1 or 2 children have the highest poverty rate, with 10 households (12.5%) falling below the poverty line.
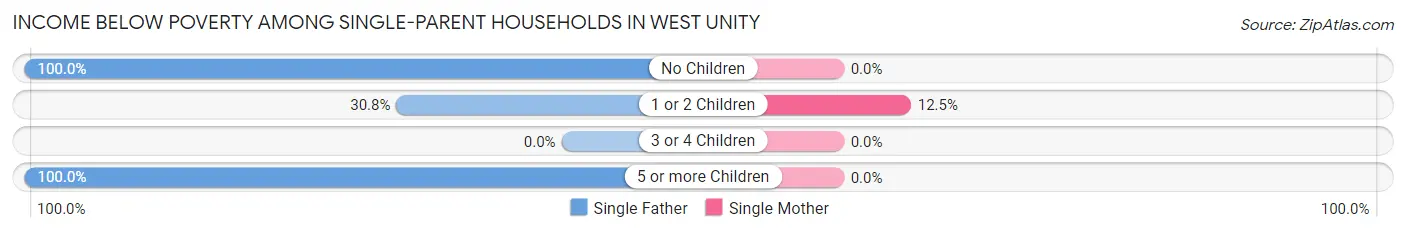
| Children | Single Father | Single Mother |
| No Children | 11 (100.0%) | 0 (0.0%) |
| 1 or 2 Children | 12 (30.8%) | 10 (12.5%) |
| 3 or 4 Children | 0 (0.0%) | 0 (0.0%) |
| 5 or more Children | 17 (100.0%) | 0 (0.0%) |
| Total | 40 (59.7%) | 10 (9.1%) |
Income Below Poverty Among Married-Couple vs Single-Parent Households in West Unity
The poverty data for West Unity shows that 5 of the married-couple family households (1.8%) and 50 of the single-parent households (28.2%) are living below the poverty level. Within the married-couple family households, those with 1 or 2 children have the highest poverty rate, with 3 households (3.0%) falling below the poverty line. Among the single-parent households, those with 5 or more children have the highest poverty rate, with 17 household (100.0%) living below poverty.
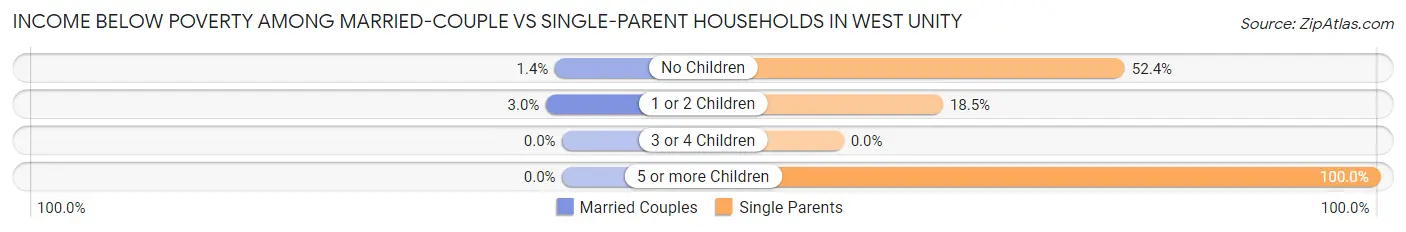
| Children | Married-Couple Families | Single-Parent Households |
| No Children | 2 (1.4%) | 11 (52.4%) |
| 1 or 2 Children | 3 (3.0%) | 22 (18.5%) |
| 3 or 4 Children | 0 (0.0%) | 0 (0.0%) |
| 5 or more Children | 0 (0.0%) | 17 (100.0%) |
| Total | 5 (1.8%) | 50 (28.2%) |
Race in West Unity
The most populous races in West Unity are White / Caucasian (1,626 | 86.6%), Hispanic or Latino (247 | 13.2%), and Two or more Races (159 | 8.5%).
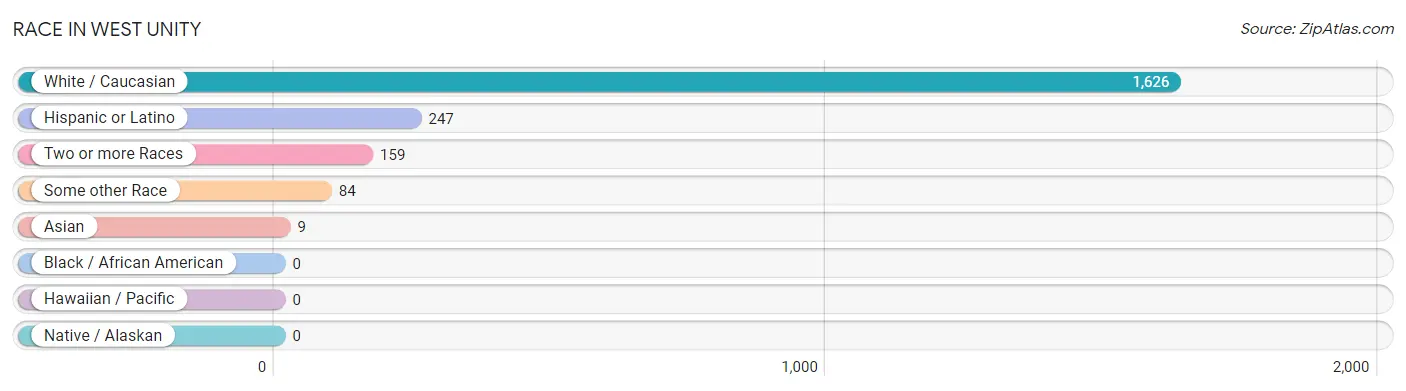
| Race | # Population | % Population |
| Asian | 9 | 0.5% |
| Black / African American | 0 | 0.0% |
| Hawaiian / Pacific | 0 | 0.0% |
| Hispanic or Latino | 247 | 13.2% |
| Native / Alaskan | 0 | 0.0% |
| White / Caucasian | 1,626 | 86.6% |
| Two or more Races | 159 | 8.5% |
| Some other Race | 84 | 4.5% |
| Total | 1,878 | 100.0% |
Ancestry in West Unity
The most populous ancestries reported in West Unity are German (648 | 34.5%), Irish (192 | 10.2%), Mexican (191 | 10.2%), American (131 | 7.0%), and English (116 | 6.2%), together accounting for 68.0% of all West Unity residents.
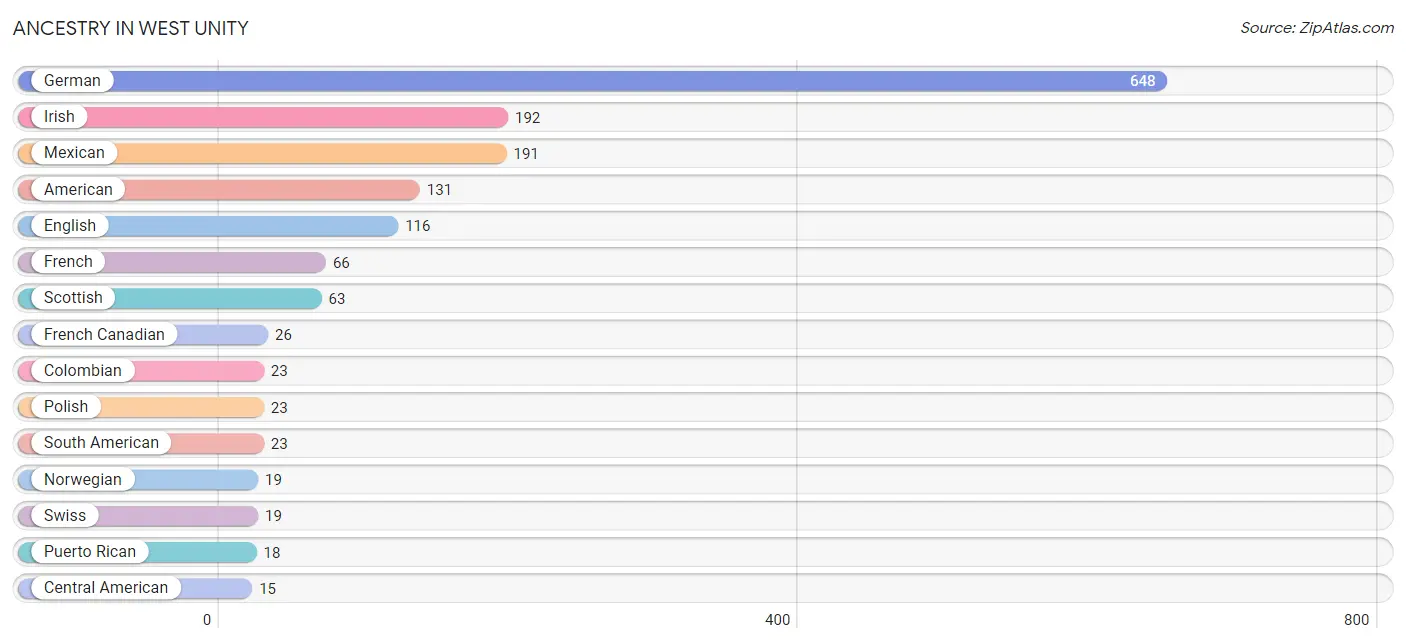
| Ancestry | # Population | % Population |
| American | 131 | 7.0% |
| British | 2 | 0.1% |
| Central American | 15 | 0.8% |
| Colombian | 23 | 1.2% |
| Czech | 3 | 0.2% |
| Danish | 2 | 0.1% |
| Dutch | 2 | 0.1% |
| English | 116 | 6.2% |
| European | 4 | 0.2% |
| French | 66 | 3.5% |
| French Canadian | 26 | 1.4% |
| German | 648 | 34.5% |
| Greek | 7 | 0.4% |
| Guatemalan | 15 | 0.8% |
| Guyanese | 3 | 0.2% |
| Hungarian | 10 | 0.5% |
| Irish | 192 | 10.2% |
| Korean | 9 | 0.5% |
| Mexican | 191 | 10.2% |
| Norwegian | 19 | 1.0% |
| Polish | 23 | 1.2% |
| Puerto Rican | 18 | 1.0% |
| Romanian | 4 | 0.2% |
| Scandinavian | 9 | 0.5% |
| Scotch-Irish | 9 | 0.5% |
| Scottish | 63 | 3.4% |
| South American | 23 | 1.2% |
| Swiss | 19 | 1.0% | View All 28 Rows |
Immigrants in West Unity
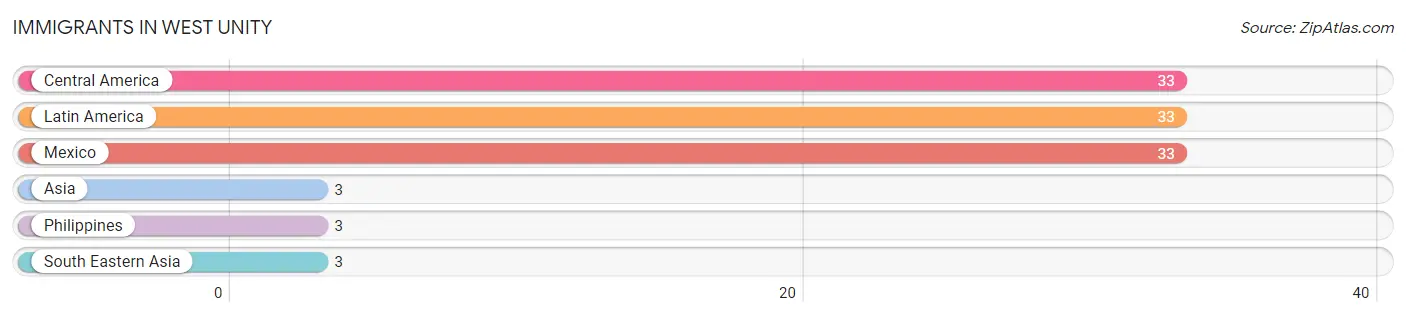
The most numerous immigrant groups reported in West Unity came from Central America (33 | 1.8%), Latin America (33 | 1.8%), Mexico (33 | 1.8%), Asia (3 | 0.2%), and Philippines (3 | 0.2%), together accounting for 5.6% of all West Unity residents.
| Immigration Origin | # Population | % Population |
| Asia | 3 | 0.2% |
| Central America | 33 | 1.8% |
| Latin America | 33 | 1.8% |
| Mexico | 33 | 1.8% |
| Philippines | 3 | 0.2% |
| South Eastern Asia | 3 | 0.2% | View All 6 Rows |
Sex and Age in West Unity
Sex and Age in West Unity
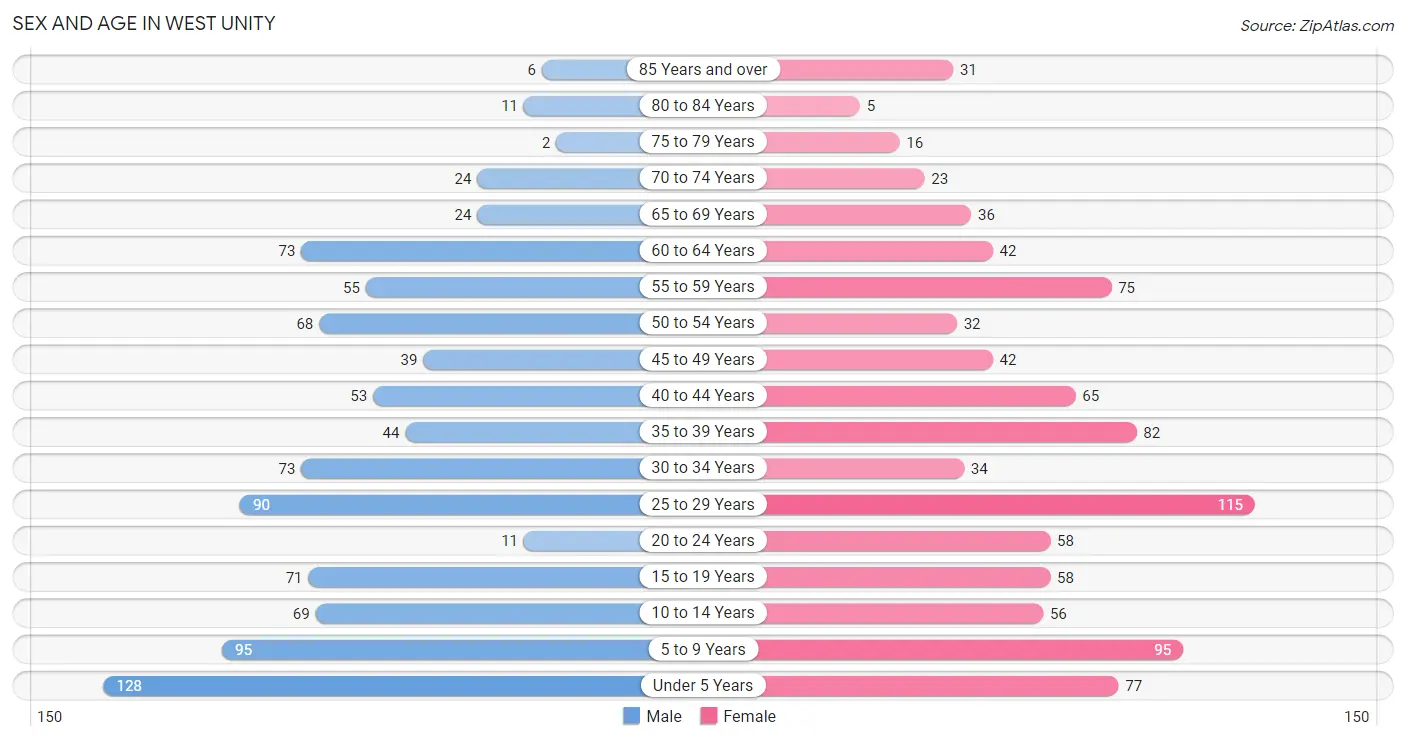
The most populous age groups in West Unity are Under 5 Years (128 | 13.7%) for men and 25 to 29 Years (115 | 12.2%) for women.
| Age Bracket | Male | Female |
| Under 5 Years | 128 (13.7%) | 77 (8.2%) |
| 5 to 9 Years | 95 (10.2%) | 95 (10.1%) |
| 10 to 14 Years | 69 (7.4%) | 56 (5.9%) |
| 15 to 19 Years | 71 (7.6%) | 58 (6.2%) |
| 20 to 24 Years | 11 (1.2%) | 58 (6.2%) |
| 25 to 29 Years | 90 (9.6%) | 115 (12.2%) |
| 30 to 34 Years | 73 (7.8%) | 34 (3.6%) |
| 35 to 39 Years | 44 (4.7%) | 82 (8.7%) |
| 40 to 44 Years | 53 (5.7%) | 65 (6.9%) |
| 45 to 49 Years | 39 (4.2%) | 42 (4.5%) |
| 50 to 54 Years | 68 (7.3%) | 32 (3.4%) |
| 55 to 59 Years | 55 (5.9%) | 75 (8.0%) |
| 60 to 64 Years | 73 (7.8%) | 42 (4.5%) |
| 65 to 69 Years | 24 (2.6%) | 36 (3.8%) |
| 70 to 74 Years | 24 (2.6%) | 23 (2.4%) |
| 75 to 79 Years | 2 (0.2%) | 16 (1.7%) |
| 80 to 84 Years | 11 (1.2%) | 5 (0.5%) |
| 85 Years and over | 6 (0.6%) | 31 (3.3%) |
| Total | 936 (100.0%) | 942 (100.0%) |
Families and Households in West Unity
Median Family Size in West Unity
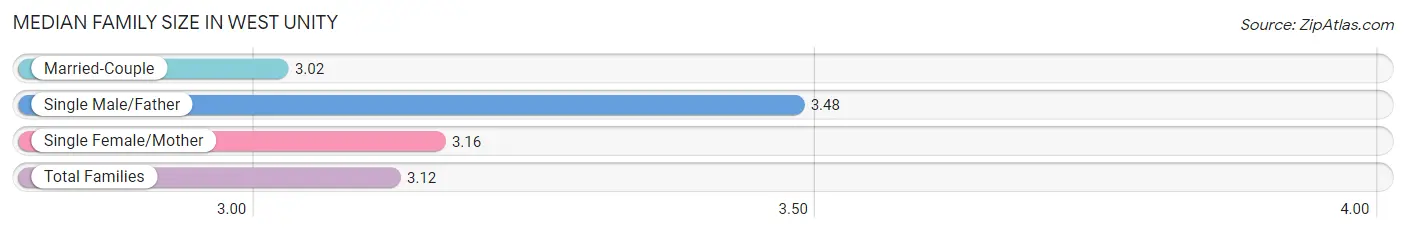
The median family size in West Unity is 3.12 persons per family, with single male/father families (67 | 14.5%) accounting for the largest median family size of 3.48 persons per family. On the other hand, married-couple families (286 | 61.8%) represent the smallest median family size with 3.02 persons per family.
| Family Type | # Families | Family Size |
| Married-Couple | 286 (61.8%) | 3.02 |
| Single Male/Father | 67 (14.5%) | 3.48 |
| Single Female/Mother | 110 (23.8%) | 3.16 |
| Total Families | 463 (100.0%) | 3.12 |
Median Household Size in West Unity
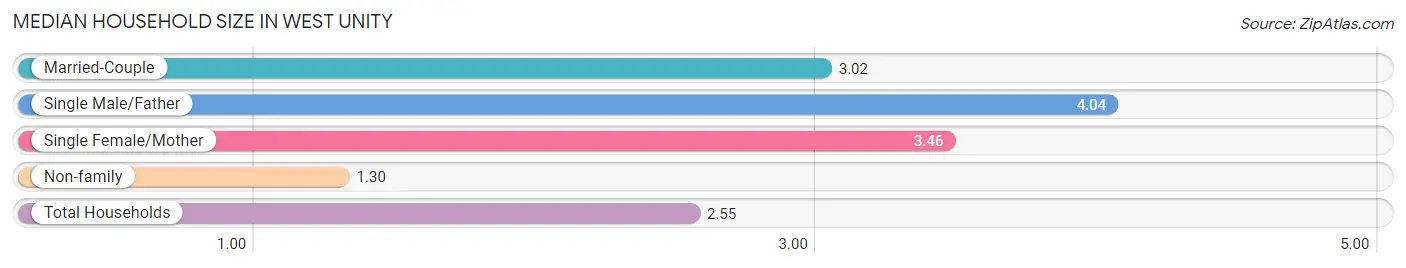
The median household size in West Unity is 2.55 persons per household, with single male/father households (67 | 9.2%) accounting for the largest median household size of 4.04 persons per household. non-family households (267 | 36.6%) represent the smallest median household size with 1.30 persons per household.
| Household Type | # Households | Household Size |
| Married-Couple | 286 (39.2%) | 3.02 |
| Single Male/Father | 67 (9.2%) | 4.04 |
| Single Female/Mother | 110 (15.1%) | 3.46 |
| Non-family | 267 (36.6%) | 1.30 |
| Total Households | 730 (100.0%) | 2.55 |
Household Size by Marriage Status in West Unity
Out of a total of 730 households in West Unity, 463 (63.4%) are family households, while 267 (36.6%) are nonfamily households. The most numerous type of family households are 2-person households, comprising 168, and the most common type of nonfamily households are 1-person households, comprising 190.
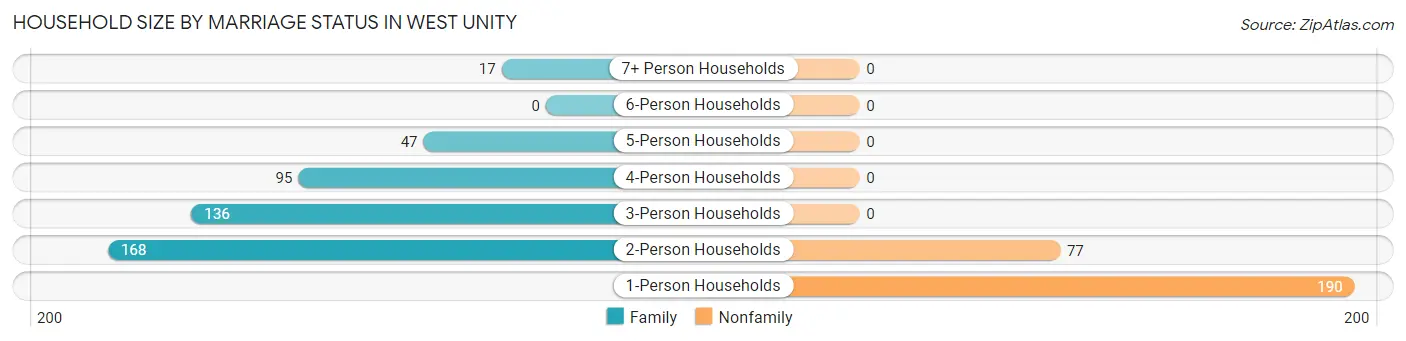
| Household Size | Family Households | Nonfamily Households |
| 1-Person Households | - | 190 (26.0%) |
| 2-Person Households | 168 (23.0%) | 77 (10.5%) |
| 3-Person Households | 136 (18.6%) | 0 (0.0%) |
| 4-Person Households | 95 (13.0%) | 0 (0.0%) |
| 5-Person Households | 47 (6.4%) | 0 (0.0%) |
| 6-Person Households | 0 (0.0%) | 0 (0.0%) |
| 7+ Person Households | 17 (2.3%) | 0 (0.0%) |
| Total | 463 (63.4%) | 267 (36.6%) |
Female Fertility in West Unity
Fertility by Age in West Unity
Average fertility rate in West Unity is 35.0 births per 1,000 women. Women in the age bracket of 15 to 19 years have the highest fertility rate with 207.0 births per 1,000 women. Women in the age bracket of 15 to 19 years acount for 75.0% of all women with births.
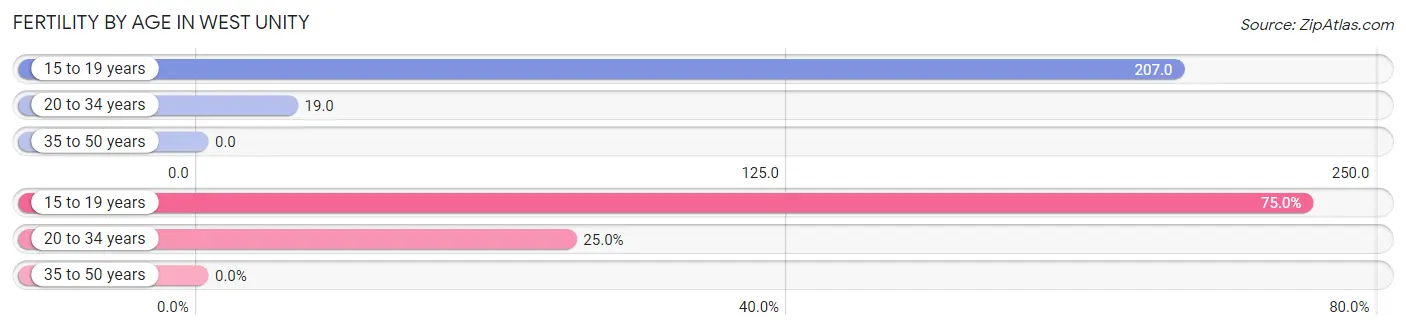
| Age Bracket | Women with Births | Births / 1,000 Women |
| 15 to 19 years | 12 (75.0%) | 207.0 |
| 20 to 34 years | 4 (25.0%) | 19.0 |
| 35 to 50 years | 0 (0.0%) | 0.0 |
| Total | 16 (100.0%) | 35.0 |
Fertility by Age by Marriage Status in West Unity
25.0% of women with births (16) in West Unity are married. The highest percentage of unmarried women with births falls into 15 to 19 years age bracket with 100.0% of them unmarried at the time of birth, while the lowest percentage of unmarried women with births belong to 20 to 34 years age bracket with 0.0% of them unmarried.
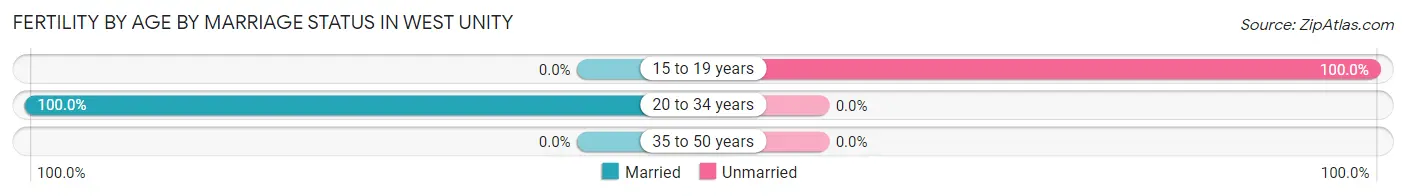
| Age Bracket | Married | Unmarried |
| 15 to 19 years | 0 (0.0%) | 12 (100.0%) |
| 20 to 34 years | 4 (100.0%) | 0 (0.0%) |
| 35 to 50 years | 0 (0.0%) | 0 (0.0%) |
| Total | 4 (25.0%) | 12 (75.0%) |
Fertility by Education in West Unity
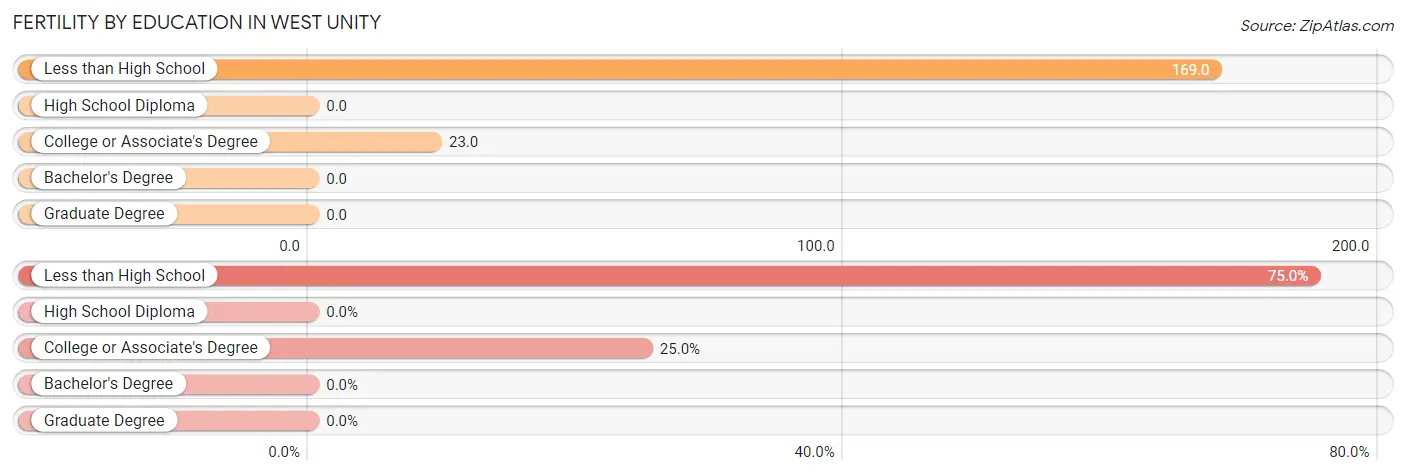
| Educational Attainment | Women with Births | Births / 1,000 Women |
| Less than High School | 12 (75.0%) | 169.0 |
| High School Diploma | 0 (0.0%) | 0.0 |
| College or Associate's Degree | 4 (25.0%) | 23.0 |
| Bachelor's Degree | 0 (0.0%) | 0.0 |
| Graduate Degree | 0 (0.0%) | 0.0 |
| Total | 16 (100.0%) | 35.0 |
Fertility by Education by Marriage Status in West Unity
75.0% of women with births in West Unity are unmarried. Women with the educational attainment of college or associate's degree are most likely to be married with 100.0% of them married at childbirth, while women with the educational attainment of less than high school are least likely to be married with 100.0% of them unmarried at childbirth.
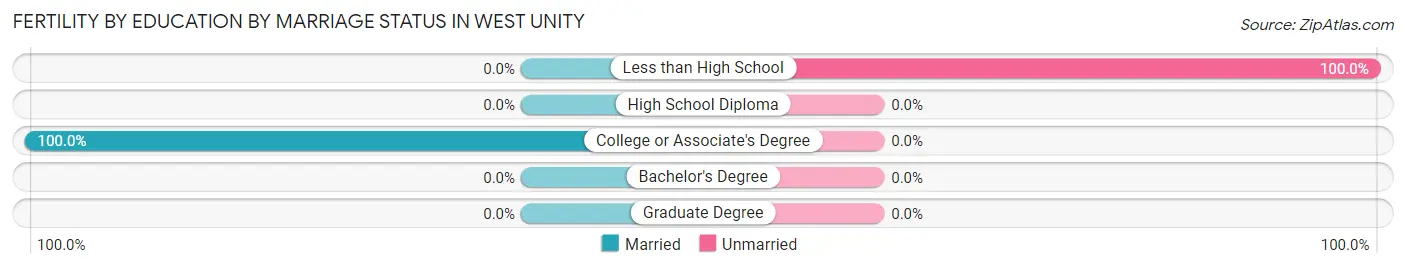
| Educational Attainment | Married | Unmarried |
| Less than High School | 0 (0.0%) | 12 (100.0%) |
| High School Diploma | 0 (0.0%) | 0 (0.0%) |
| College or Associate's Degree | 4 (100.0%) | 0 (0.0%) |
| Bachelor's Degree | 0 (0.0%) | 0 (0.0%) |
| Graduate Degree | 0 (0.0%) | 0 (0.0%) |
| Total | 4 (25.0%) | 12 (75.0%) |
Employment Characteristics in West Unity
Employment by Class of Employer in West Unity
Among the 831 employed individuals in West Unity, private company employees (680 | 81.8%), local government employees (76 | 9.1%), and not-for-profit organizations (52 | 6.3%) make up the most common classes of employment.
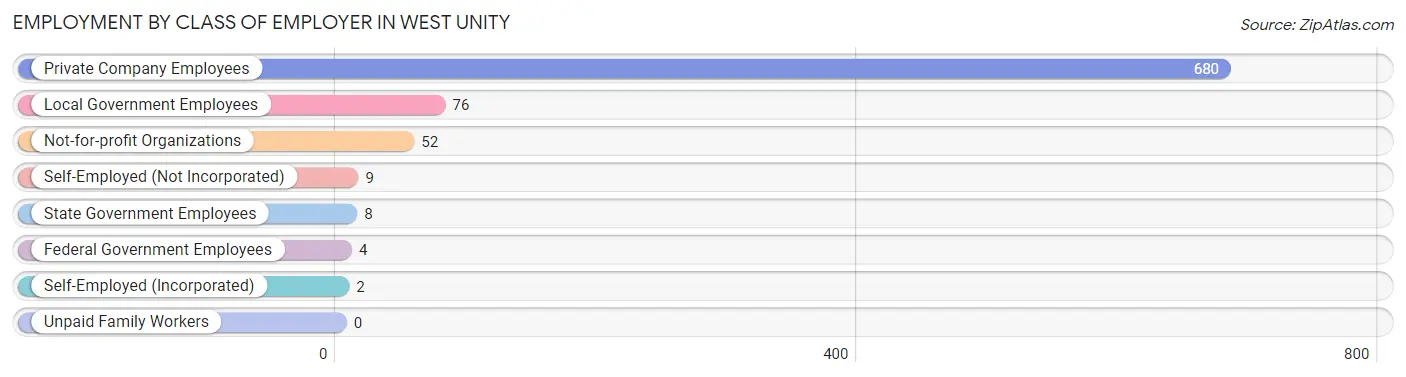
| Employer Class | # Employees | % Employees |
| Private Company Employees | 680 | 81.8% |
| Self-Employed (Incorporated) | 2 | 0.2% |
| Self-Employed (Not Incorporated) | 9 | 1.1% |
| Not-for-profit Organizations | 52 | 6.3% |
| Local Government Employees | 76 | 9.1% |
| State Government Employees | 8 | 1.0% |
| Federal Government Employees | 4 | 0.5% |
| Unpaid Family Workers | 0 | 0.0% |
| Total | 831 | 100.0% |
Employment Status by Age in West Unity
According to the labor force statistics for West Unity, out of the total population over 16 years of age (1,303), 72.6% or 946 individuals are in the labor force, with 8.7% or 82 of them unemployed. The age group with the highest labor force participation rate is 20 to 24 years, with 100.0% or 69 individuals in the labor force. Within the labor force, the 75 years and over age range has the highest percentage of unemployed individuals, with 69.2% or 9 of them being unemployed.
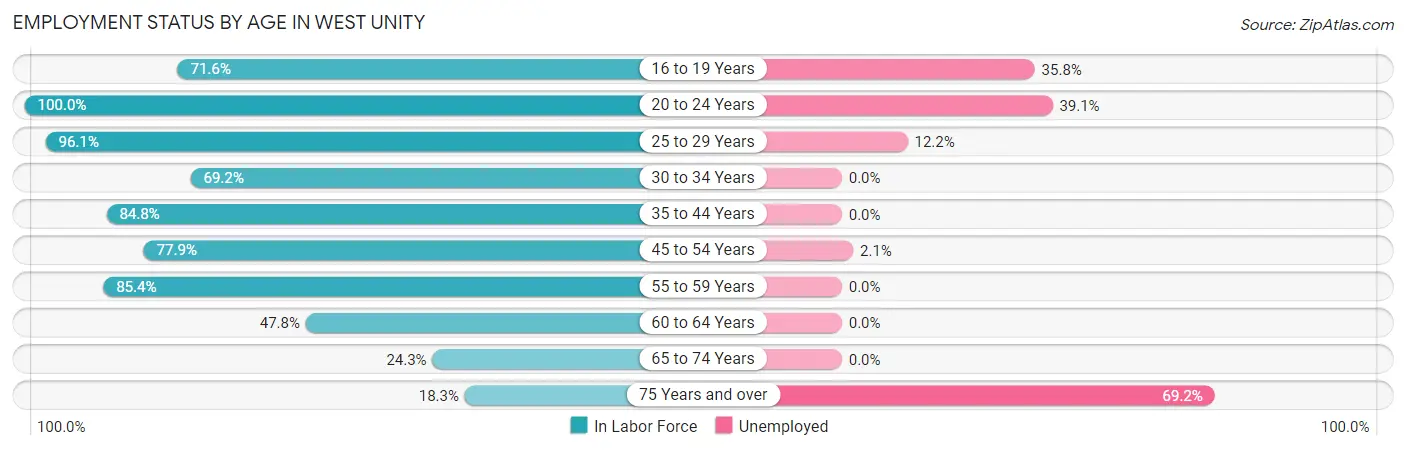
| Age Bracket | In Labor Force | Unemployed |
| 16 to 19 Years | 53 (71.6%) | 19 (35.8%) |
| 20 to 24 Years | 69 (100.0%) | 27 (39.1%) |
| 25 to 29 Years | 197 (96.1%) | 24 (12.2%) |
| 30 to 34 Years | 74 (69.2%) | 0 (0.0%) |
| 35 to 44 Years | 207 (84.8%) | 0 (0.0%) |
| 45 to 54 Years | 141 (77.9%) | 3 (2.1%) |
| 55 to 59 Years | 111 (85.4%) | 0 (0.0%) |
| 60 to 64 Years | 55 (47.8%) | 0 (0.0%) |
| 65 to 74 Years | 26 (24.3%) | 0 (0.0%) |
| 75 Years and over | 13 (18.3%) | 9 (69.2%) |
| Total | 946 (72.6%) | 82 (8.7%) |
Employment Status by Educational Attainment in West Unity
According to labor force statistics for West Unity, 79.9% of individuals (785) out of the total population between 25 and 64 years of age (982) are in the labor force, with 3.4% or 27 of them being unemployed. The group with the highest labor force participation rate are those with the educational attainment of college / associate degree, with 86.0% or 319 individuals in the labor force. Within the labor force, individuals with college / associate degree education have the highest percentage of unemployment, with 8.5% or 27 of them being unemployed.
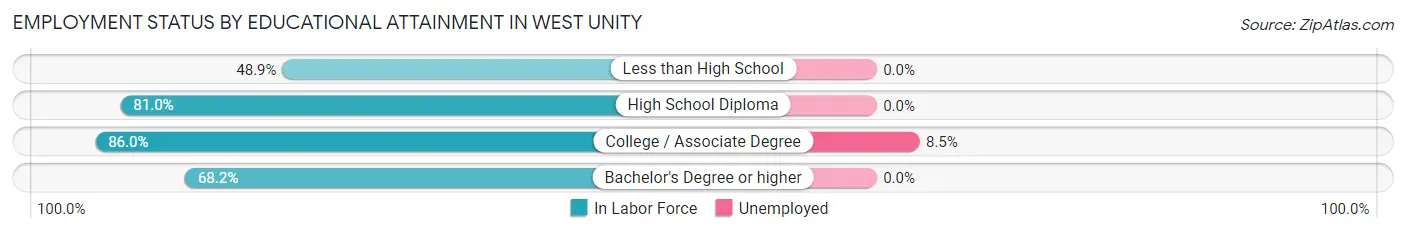
| Educational Attainment | In Labor Force | Unemployed |
| Less than High School | 23 (48.9%) | 0 (0.0%) |
| High School Diploma | 370 (81.0%) | 0 (0.0%) |
| College / Associate Degree | 319 (86.0%) | 32 (8.5%) |
| Bachelor's Degree or higher | 73 (68.2%) | 0 (0.0%) |
| Total | 785 (79.9%) | 33 (3.4%) |
Employment Occupations by Sex in West Unity
Management, Business, Science and Arts Occupations
The most common Management, Business, Science and Arts occupations in West Unity are Community & Social Service (83 | 9.6%), Education Instruction & Library (46 | 5.3%), Management (44 | 5.1%), Health Diagnosing & Treating (37 | 4.3%), and Education, Arts & Media (21 | 2.4%).
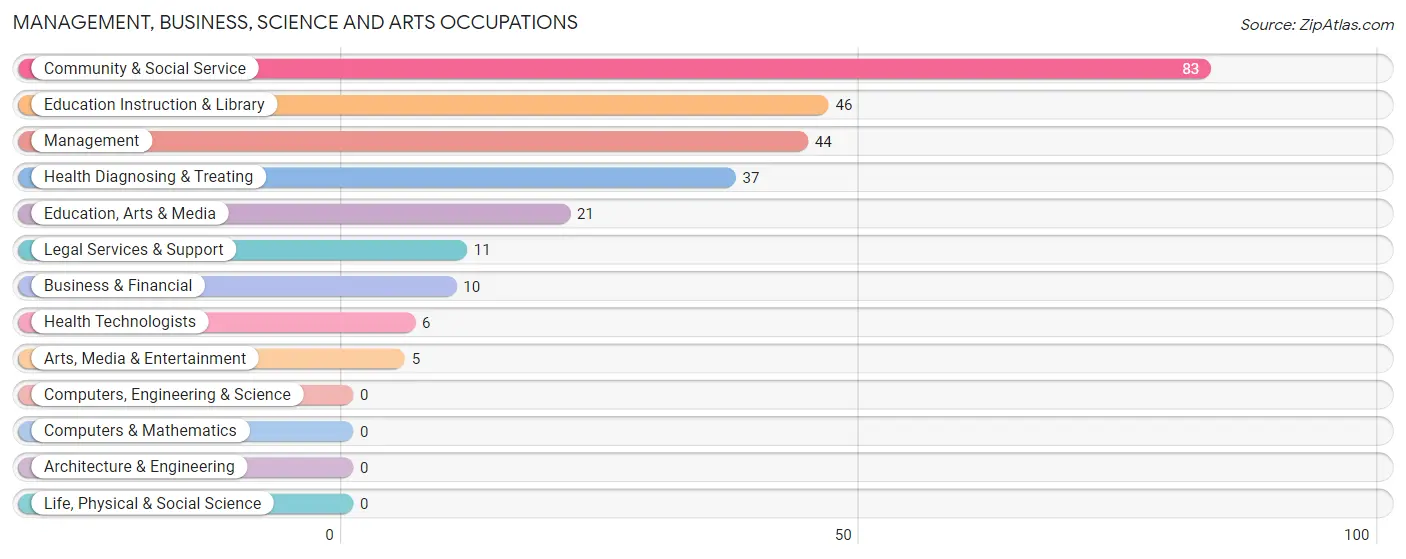
Management, Business, Science and Arts Occupations by Sex
Within the Management, Business, Science and Arts occupations in West Unity, the most male-oriented occupations are Management (70.5%), Education, Arts & Media (61.9%), and Arts, Media & Entertainment (60.0%), while the most female-oriented occupations are Legal Services & Support (100.0%), Health Diagnosing & Treating (100.0%), and Health Technologists (100.0%).
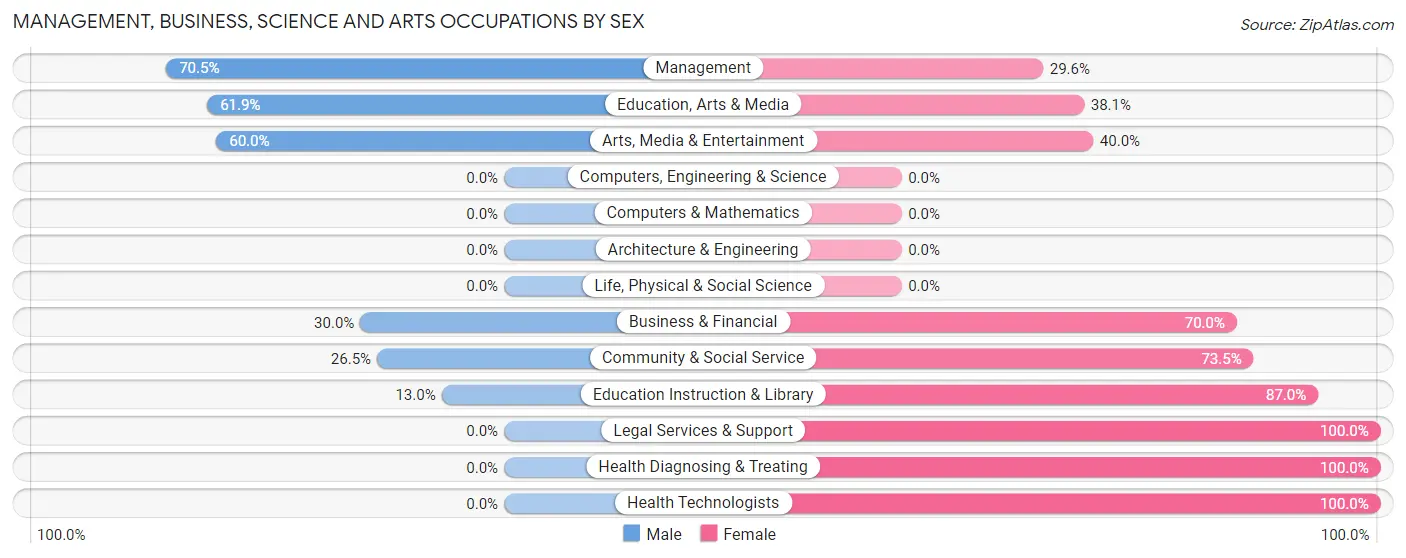
| Occupation | Male | Female |
| Management | 31 (70.5%) | 13 (29.5%) |
| Business & Financial | 3 (30.0%) | 7 (70.0%) |
| Computers, Engineering & Science | 0 (0.0%) | 0 (0.0%) |
| Computers & Mathematics | 0 (0.0%) | 0 (0.0%) |
| Architecture & Engineering | 0 (0.0%) | 0 (0.0%) |
| Life, Physical & Social Science | 0 (0.0%) | 0 (0.0%) |
| Community & Social Service | 22 (26.5%) | 61 (73.5%) |
| Education, Arts & Media | 13 (61.9%) | 8 (38.1%) |
| Legal Services & Support | 0 (0.0%) | 11 (100.0%) |
| Education Instruction & Library | 6 (13.0%) | 40 (87.0%) |
| Arts, Media & Entertainment | 3 (60.0%) | 2 (40.0%) |
| Health Diagnosing & Treating | 0 (0.0%) | 37 (100.0%) |
| Health Technologists | 0 (0.0%) | 6 (100.0%) |
| Total (Category) | 56 (32.2%) | 118 (67.8%) |
| Total (Overall) | 439 (50.8%) | 425 (49.2%) |
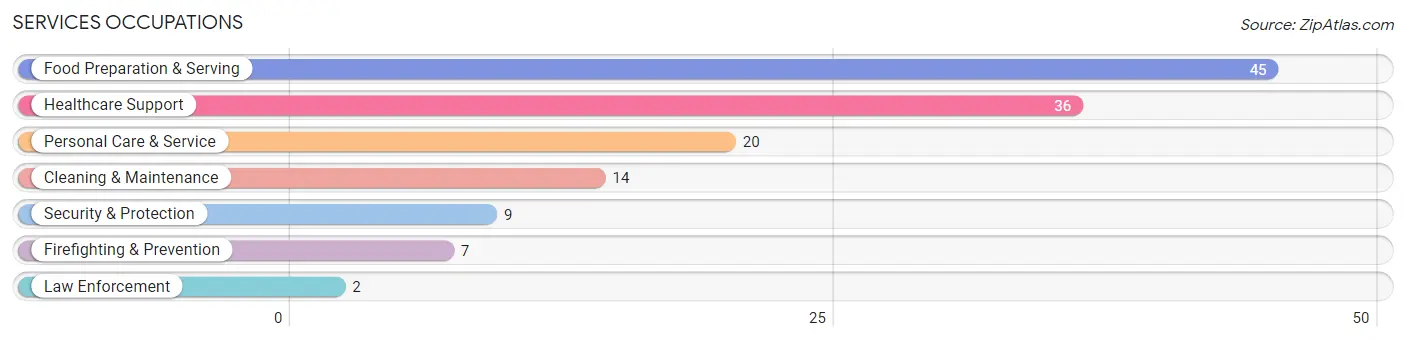
Services Occupations
The most common Services occupations in West Unity are Food Preparation & Serving (45 | 5.2%), Healthcare Support (36 | 4.2%), Personal Care & Service (20 | 2.3%), Cleaning & Maintenance (14 | 1.6%), and Security & Protection (9 | 1.0%).
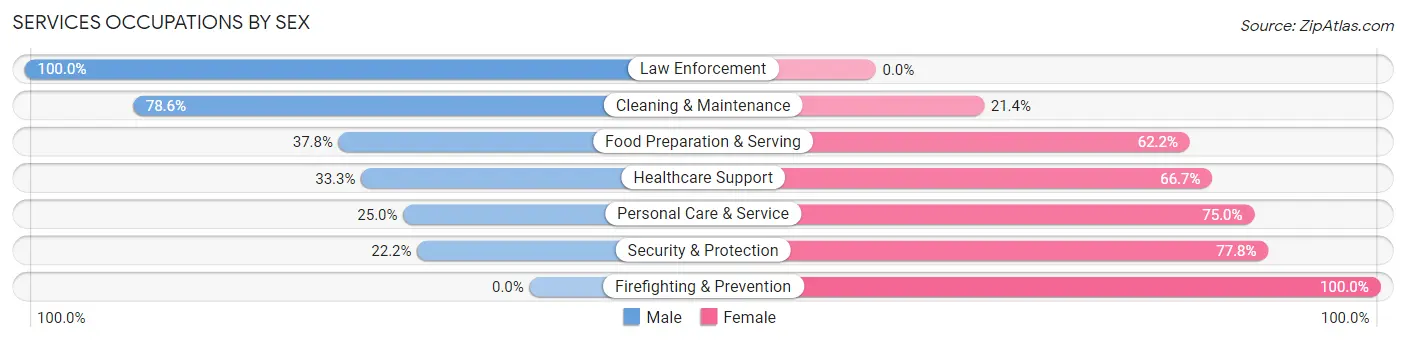
Services Occupations by Sex
Within the Services occupations in West Unity, the most male-oriented occupations are Law Enforcement (100.0%), Cleaning & Maintenance (78.6%), and Food Preparation & Serving (37.8%), while the most female-oriented occupations are Firefighting & Prevention (100.0%), Security & Protection (77.8%), and Personal Care & Service (75.0%).
| Occupation | Male | Female |
| Healthcare Support | 12 (33.3%) | 24 (66.7%) |
| Security & Protection | 2 (22.2%) | 7 (77.8%) |
| Firefighting & Prevention | 0 (0.0%) | 7 (100.0%) |
| Law Enforcement | 2 (100.0%) | 0 (0.0%) |
| Food Preparation & Serving | 17 (37.8%) | 28 (62.2%) |
| Cleaning & Maintenance | 11 (78.6%) | 3 (21.4%) |
| Personal Care & Service | 5 (25.0%) | 15 (75.0%) |
| Total (Category) | 47 (37.9%) | 77 (62.1%) |
| Total (Overall) | 439 (50.8%) | 425 (49.2%) |
Sales and Office Occupations
The most common Sales and Office occupations in West Unity are Sales & Related (97 | 11.2%), and Office & Administration (52 | 6.0%).
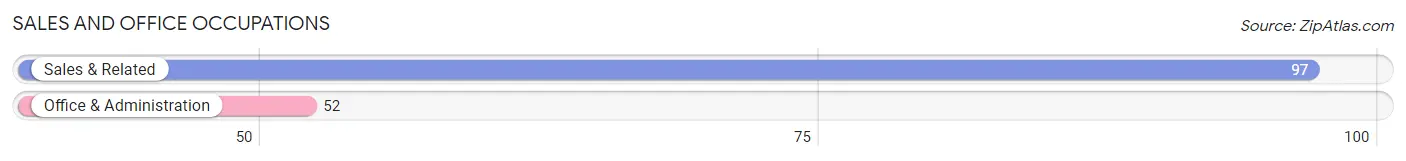
Sales and Office Occupations by Sex
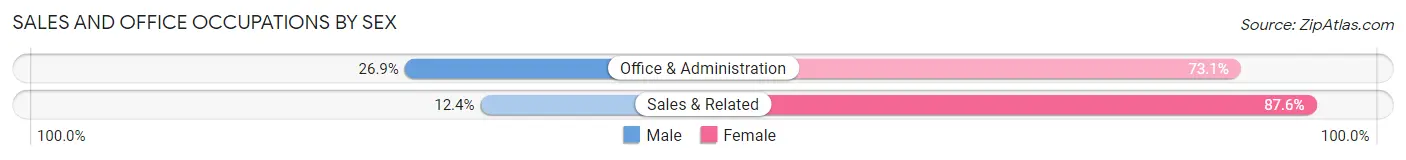
| Occupation | Male | Female |
| Sales & Related | 12 (12.4%) | 85 (87.6%) |
| Office & Administration | 14 (26.9%) | 38 (73.1%) |
| Total (Category) | 26 (17.4%) | 123 (82.6%) |
| Total (Overall) | 439 (50.8%) | 425 (49.2%) |
Natural Resources, Construction and Maintenance Occupations
The most common Natural Resources, Construction and Maintenance occupations in West Unity are Construction & Extraction (47 | 5.4%), and Installation, Maintenance & Repair (24 | 2.8%).
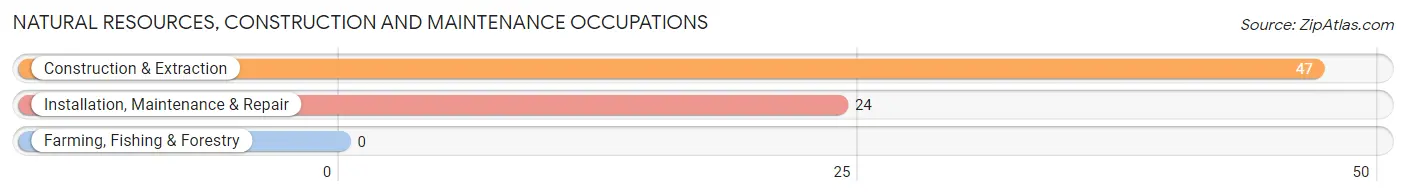
Natural Resources, Construction and Maintenance Occupations by Sex
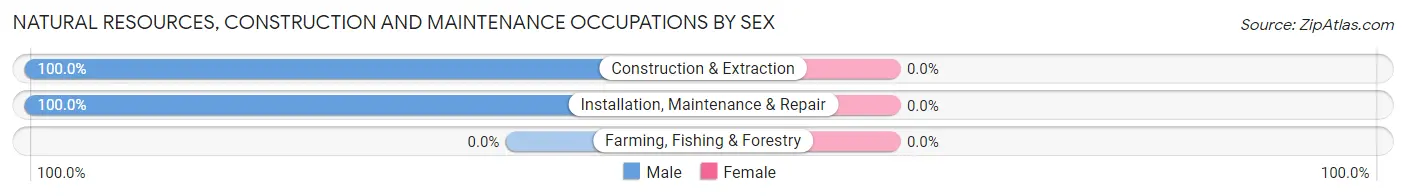
| Occupation | Male | Female |
| Farming, Fishing & Forestry | 0 (0.0%) | 0 (0.0%) |
| Construction & Extraction | 47 (100.0%) | 0 (0.0%) |
| Installation, Maintenance & Repair | 24 (100.0%) | 0 (0.0%) |
| Total (Category) | 71 (100.0%) | 0 (0.0%) |
| Total (Overall) | 439 (50.8%) | 425 (49.2%) |
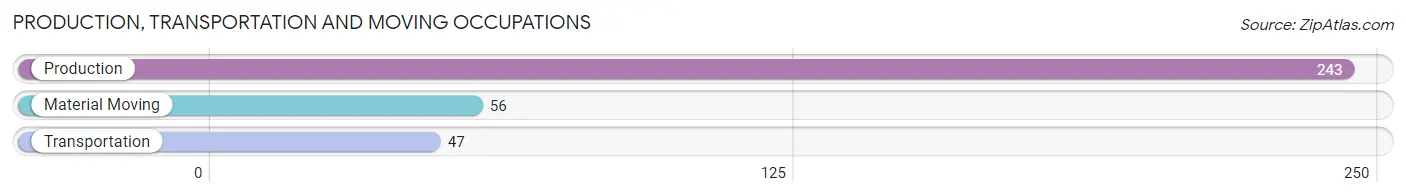
Production, Transportation and Moving Occupations
The most common Production, Transportation and Moving occupations in West Unity are Production (243 | 28.1%), Material Moving (56 | 6.5%), and Transportation (47 | 5.4%).
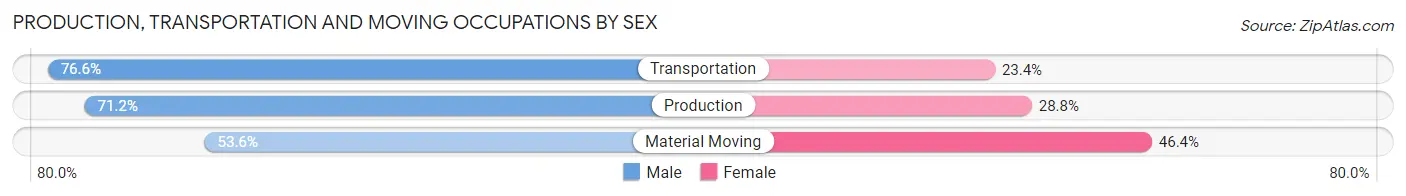
Production, Transportation and Moving Occupations by Sex
| Occupation | Male | Female |
| Production | 173 (71.2%) | 70 (28.8%) |
| Transportation | 36 (76.6%) | 11 (23.4%) |
| Material Moving | 30 (53.6%) | 26 (46.4%) |
| Total (Category) | 239 (69.1%) | 107 (30.9%) |
| Total (Overall) | 439 (50.8%) | 425 (49.2%) |
Employment Industries by Sex in West Unity
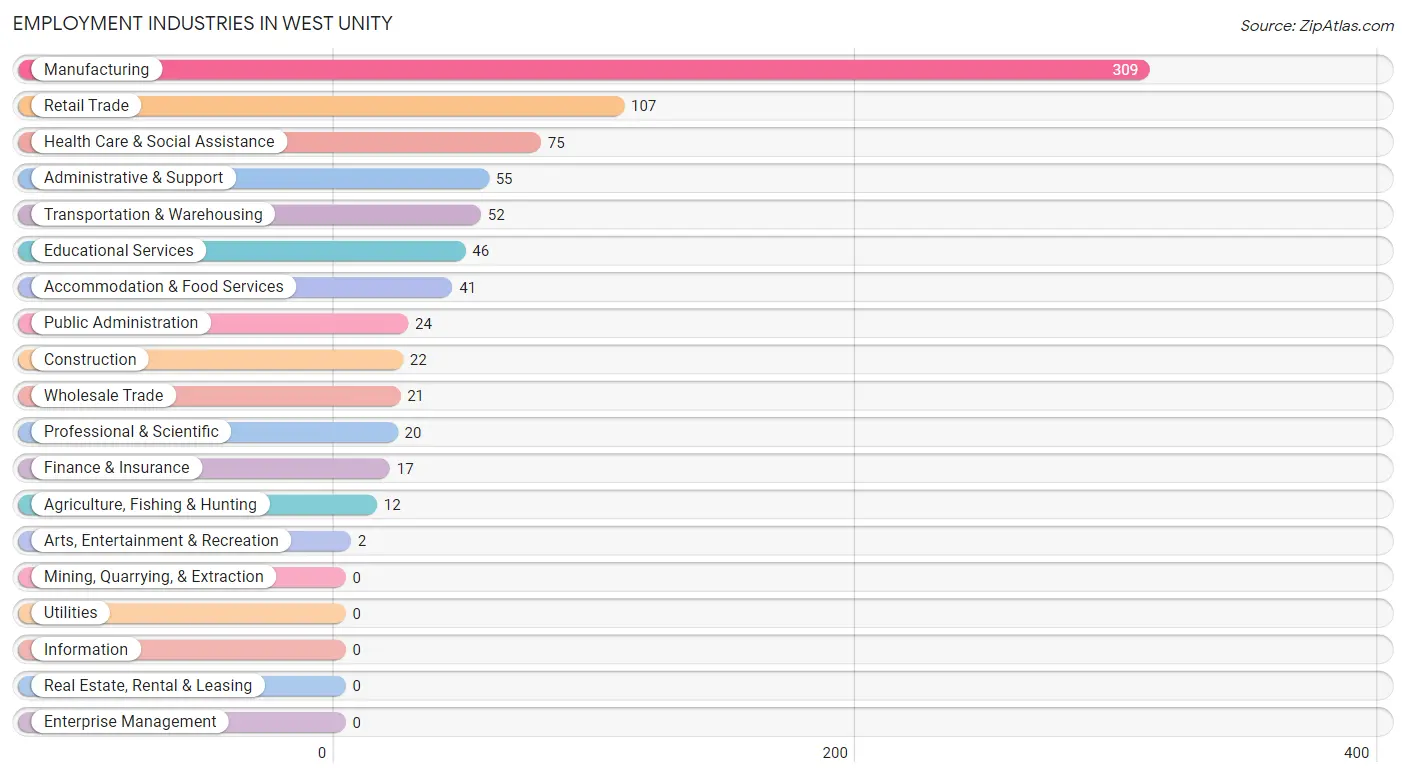
Employment Industries in West Unity
The major employment industries in West Unity include Manufacturing (309 | 35.8%), Retail Trade (107 | 12.4%), Health Care & Social Assistance (75 | 8.7%), Administrative & Support (55 | 6.4%), and Transportation & Warehousing (52 | 6.0%).
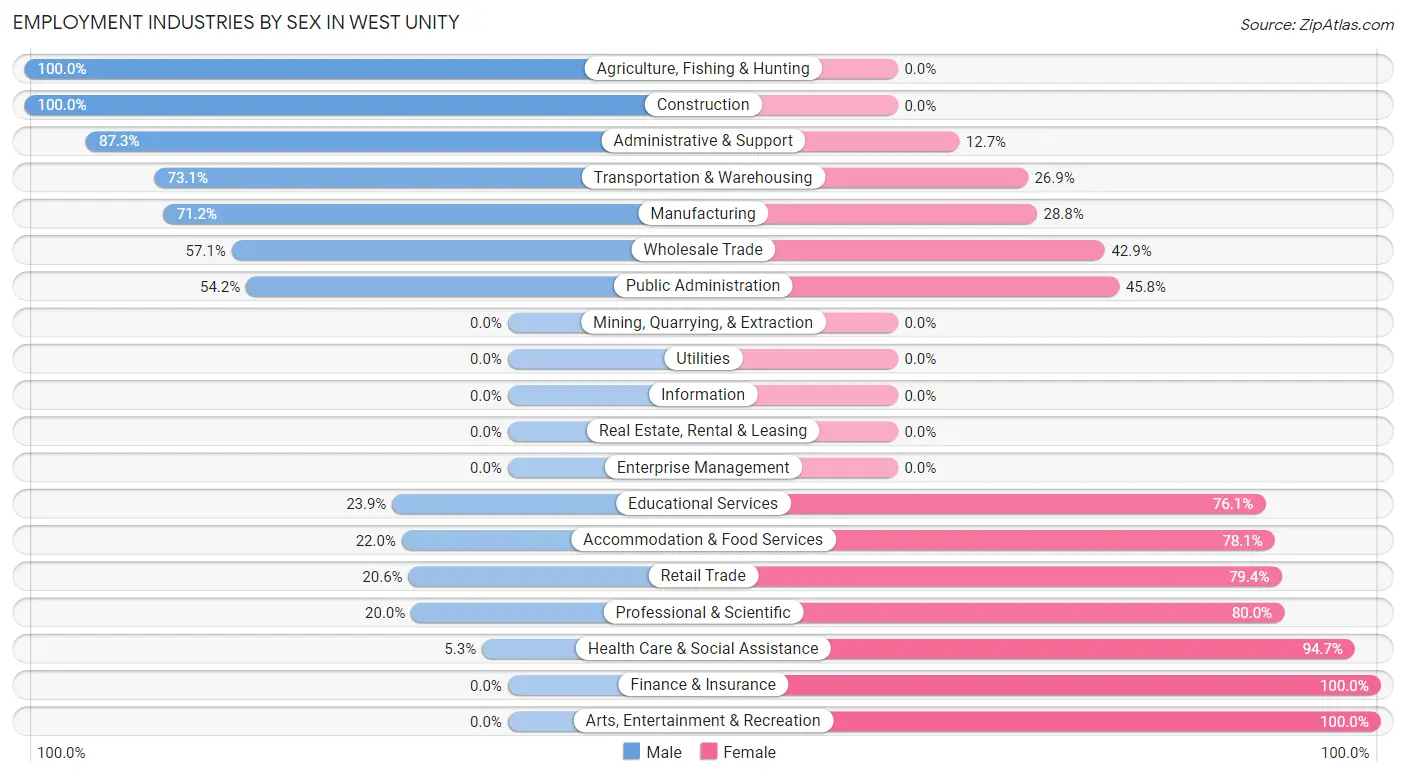
Employment Industries by Sex in West Unity
The West Unity industries that see more men than women are Agriculture, Fishing & Hunting (100.0%), Construction (100.0%), and Administrative & Support (87.3%), whereas the industries that tend to have a higher number of women are Finance & Insurance (100.0%), Arts, Entertainment & Recreation (100.0%), and Health Care & Social Assistance (94.7%).
| Industry | Male | Female |
| Agriculture, Fishing & Hunting | 12 (100.0%) | 0 (0.0%) |
| Mining, Quarrying, & Extraction | 0 (0.0%) | 0 (0.0%) |
| Construction | 22 (100.0%) | 0 (0.0%) |
| Manufacturing | 220 (71.2%) | 89 (28.8%) |
| Wholesale Trade | 12 (57.1%) | 9 (42.9%) |
| Retail Trade | 22 (20.6%) | 85 (79.4%) |
| Transportation & Warehousing | 38 (73.1%) | 14 (26.9%) |
| Utilities | 0 (0.0%) | 0 (0.0%) |
| Information | 0 (0.0%) | 0 (0.0%) |
| Finance & Insurance | 0 (0.0%) | 17 (100.0%) |
| Real Estate, Rental & Leasing | 0 (0.0%) | 0 (0.0%) |
| Professional & Scientific | 4 (20.0%) | 16 (80.0%) |
| Enterprise Management | 0 (0.0%) | 0 (0.0%) |
| Administrative & Support | 48 (87.3%) | 7 (12.7%) |
| Educational Services | 11 (23.9%) | 35 (76.1%) |
| Health Care & Social Assistance | 4 (5.3%) | 71 (94.7%) |
| Arts, Entertainment & Recreation | 0 (0.0%) | 2 (100.0%) |
| Accommodation & Food Services | 9 (22.0%) | 32 (78.0%) |
| Public Administration | 13 (54.2%) | 11 (45.8%) |
| Total | 439 (50.8%) | 425 (49.2%) |
Education in West Unity
School Enrollment in West Unity
The most common levels of schooling among the 505 students in West Unity are high school (128 | 25.4%), elementary school (123 | 24.4%), and middle school (99 | 19.6%).
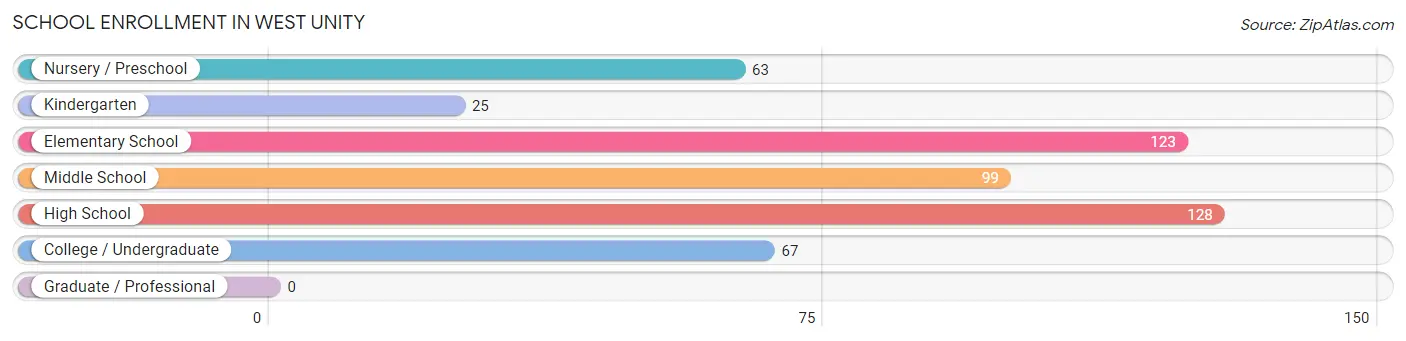
| School Level | # Students | % Students |
| Nursery / Preschool | 63 | 12.5% |
| Kindergarten | 25 | 5.0% |
| Elementary School | 123 | 24.4% |
| Middle School | 99 | 19.6% |
| High School | 128 | 25.4% |
| College / Undergraduate | 67 | 13.3% |
| Graduate / Professional | 0 | 0.0% |
| Total | 505 | 100.0% |
School Enrollment by Age by Funding Source in West Unity
Out of a total of 505 students who are enrolled in schools in West Unity, 90 (17.8%) attend a private institution, while the remaining 415 (82.2%) are enrolled in public schools. The age group of 25 to 34 year olds has the highest likelihood of being enrolled in private schools, with 44 (83.0% in the age bracket) enrolled. Conversely, the age group of 3 to 4 year olds has the lowest likelihood of being enrolled in a private school, with 35 (100.0% in the age bracket) attending a public institution.
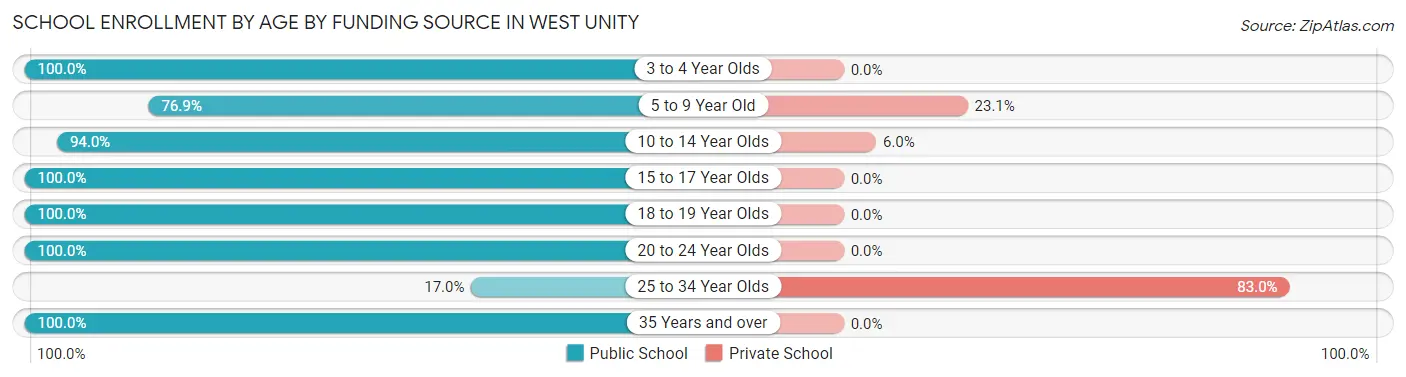
| Age Bracket | Public School | Private School |
| 3 to 4 Year Olds | 35 (100.0%) | 0 (0.0%) |
| 5 to 9 Year Old | 130 (76.9%) | 39 (23.1%) |
| 10 to 14 Year Olds | 109 (94.0%) | 7 (6.0%) |
| 15 to 17 Year Olds | 83 (100.0%) | 0 (0.0%) |
| 18 to 19 Year Olds | 35 (100.0%) | 0 (0.0%) |
| 20 to 24 Year Olds | 11 (100.0%) | 0 (0.0%) |
| 25 to 34 Year Olds | 9 (17.0%) | 44 (83.0%) |
| 35 Years and over | 3 (100.0%) | 0 (0.0%) |
| Total | 415 (82.2%) | 90 (17.8%) |
Educational Attainment by Field of Study in West Unity
Education (34 | 23.8%), engineering (30 | 21.0%), business (24 | 16.8%), science & technology (12 | 8.4%), and communications (12 | 8.4%) are the most common fields of study among 143 individuals in West Unity who have obtained a bachelor's degree or higher.
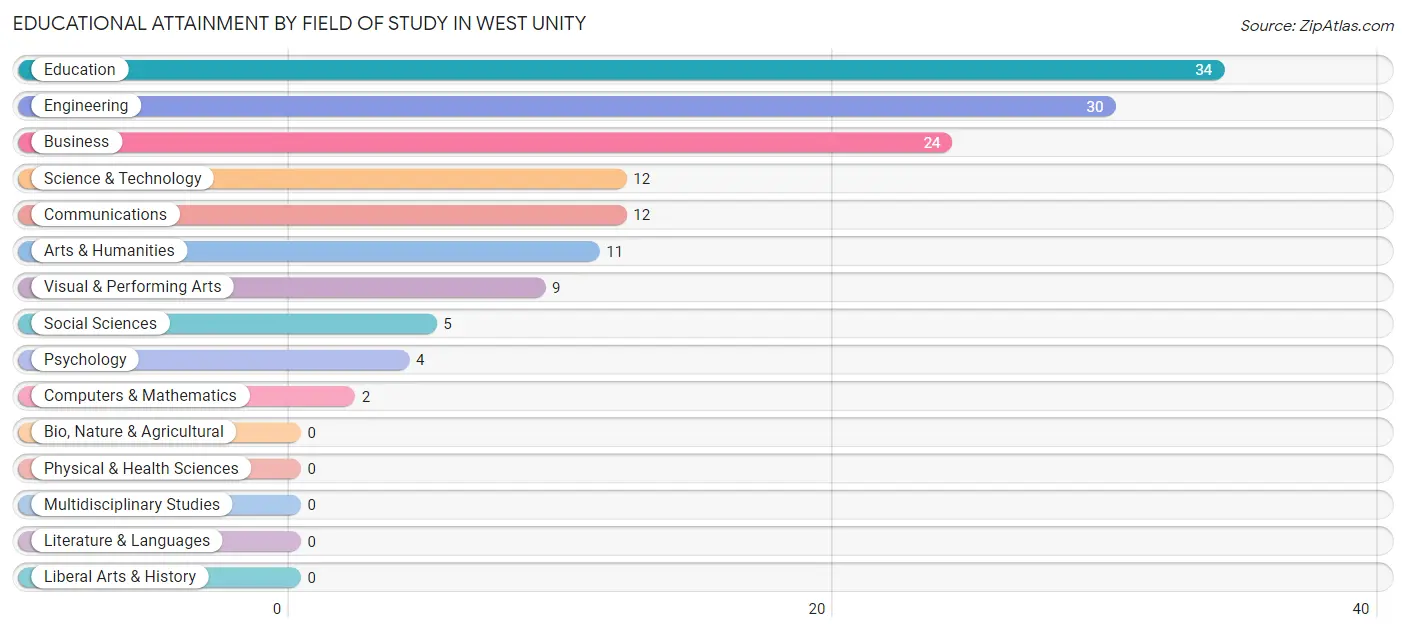
| Field of Study | # Graduates | % Graduates |
| Computers & Mathematics | 2 | 1.4% |
| Bio, Nature & Agricultural | 0 | 0.0% |
| Physical & Health Sciences | 0 | 0.0% |
| Psychology | 4 | 2.8% |
| Social Sciences | 5 | 3.5% |
| Engineering | 30 | 21.0% |
| Multidisciplinary Studies | 0 | 0.0% |
| Science & Technology | 12 | 8.4% |
| Business | 24 | 16.8% |
| Education | 34 | 23.8% |
| Literature & Languages | 0 | 0.0% |
| Liberal Arts & History | 0 | 0.0% |
| Visual & Performing Arts | 9 | 6.3% |
| Communications | 12 | 8.4% |
| Arts & Humanities | 11 | 7.7% |
| Total | 143 | 100.0% |
Transportation & Commute in West Unity
Vehicle Availability by Sex in West Unity
The most prevalent vehicle ownership categories in West Unity are males with 2 vehicles (181, accounting for 42.8%) and females with 2 vehicles (194, making up 44.8%).
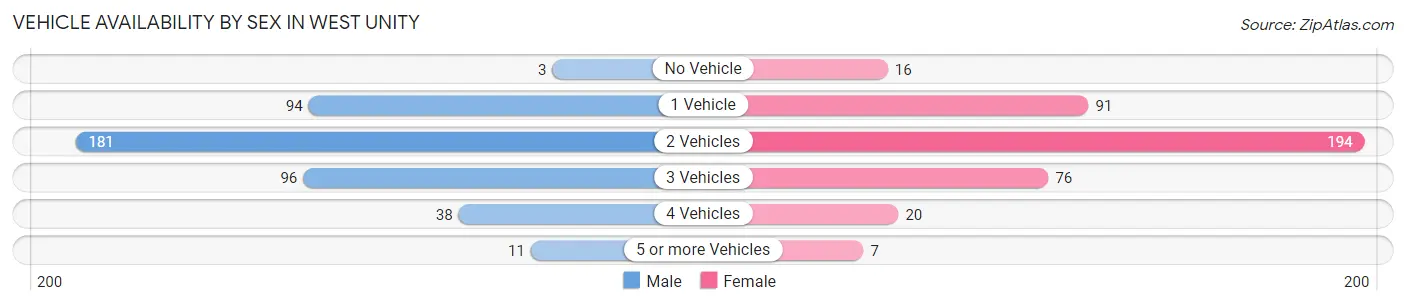
| Vehicles Available | Male | Female |
| No Vehicle | 3 (0.7%) | 16 (4.0%) |
| 1 Vehicle | 94 (22.2%) | 91 (22.5%) |
| 2 Vehicles | 181 (42.8%) | 194 (48.0%) |
| 3 Vehicles | 96 (22.7%) | 76 (18.8%) |
| 4 Vehicles | 38 (9.0%) | 20 (5.0%) |
| 5 or more Vehicles | 11 (2.6%) | 7 (1.7%) |
| Total | 423 (100.0%) | 404 (100.0%) |
Commute Time in West Unity
The most frequently occuring commute durations in West Unity are 15 to 19 minutes (233 commuters, 28.7%), 30 to 34 minutes (129 commuters, 15.9%), and less than 5 minutes (90 commuters, 11.1%).
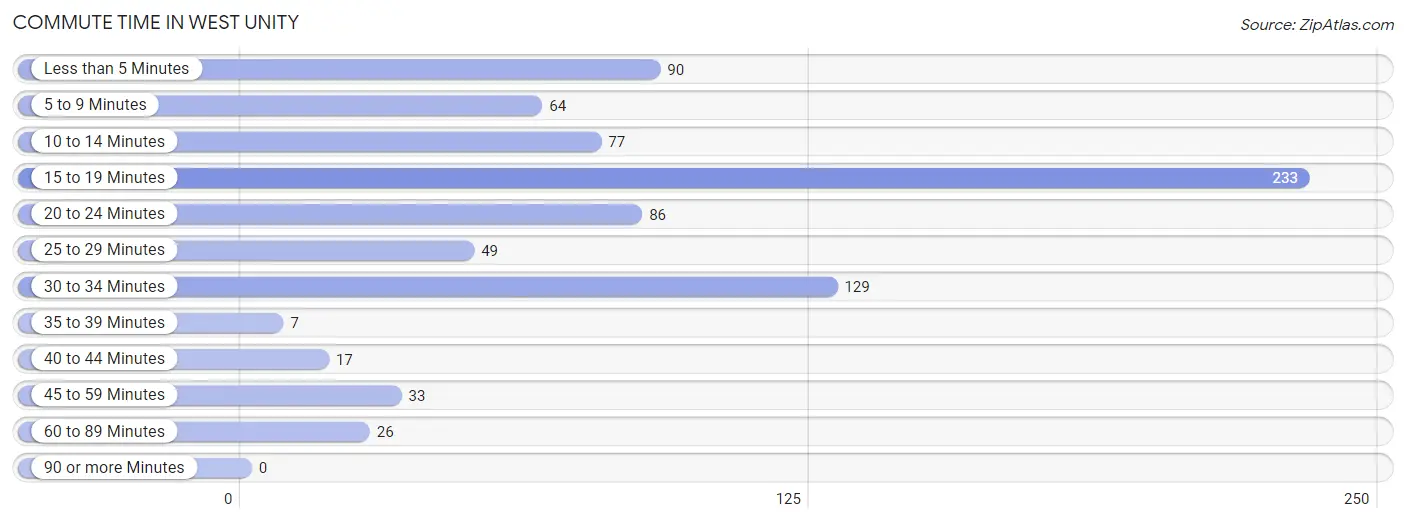
| Commute Time | # Commuters | % Commuters |
| Less than 5 Minutes | 90 | 11.1% |
| 5 to 9 Minutes | 64 | 7.9% |
| 10 to 14 Minutes | 77 | 9.5% |
| 15 to 19 Minutes | 233 | 28.7% |
| 20 to 24 Minutes | 86 | 10.6% |
| 25 to 29 Minutes | 49 | 6.0% |
| 30 to 34 Minutes | 129 | 15.9% |
| 35 to 39 Minutes | 7 | 0.9% |
| 40 to 44 Minutes | 17 | 2.1% |
| 45 to 59 Minutes | 33 | 4.1% |
| 60 to 89 Minutes | 26 | 3.2% |
| 90 or more Minutes | 0 | 0.0% |
Commute Time by Sex in West Unity
The most common commute times in West Unity are 15 to 19 minutes (157 commuters, 37.5%) for males and 30 to 34 minutes (79 commuters, 20.2%) for females.
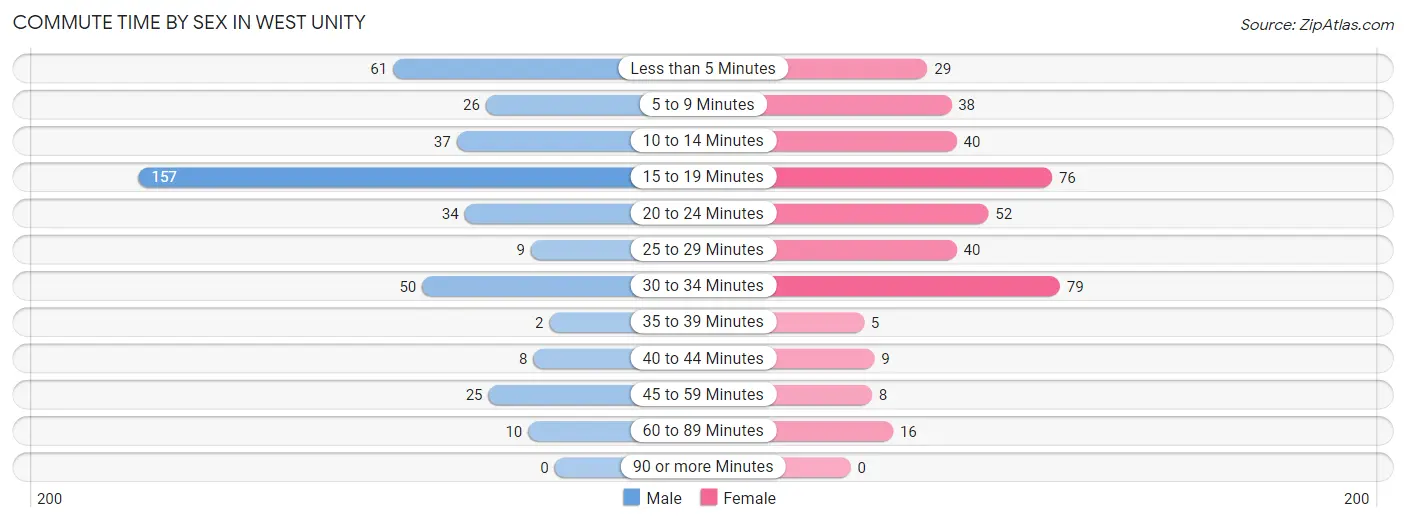
| Commute Time | Male | Female |
| Less than 5 Minutes | 61 (14.6%) | 29 (7.4%) |
| 5 to 9 Minutes | 26 (6.2%) | 38 (9.7%) |
| 10 to 14 Minutes | 37 (8.8%) | 40 (10.2%) |
| 15 to 19 Minutes | 157 (37.5%) | 76 (19.4%) |
| 20 to 24 Minutes | 34 (8.1%) | 52 (13.3%) |
| 25 to 29 Minutes | 9 (2.1%) | 40 (10.2%) |
| 30 to 34 Minutes | 50 (11.9%) | 79 (20.2%) |
| 35 to 39 Minutes | 2 (0.5%) | 5 (1.3%) |
| 40 to 44 Minutes | 8 (1.9%) | 9 (2.3%) |
| 45 to 59 Minutes | 25 (6.0%) | 8 (2.0%) |
| 60 to 89 Minutes | 10 (2.4%) | 16 (4.1%) |
| 90 or more Minutes | 0 (0.0%) | 0 (0.0%) |
Time of Departure to Work by Sex in West Unity
The most frequent times of departure to work in West Unity are 4:00 PM to 11:59 PM (75, 17.9%) for males and 12:00 PM to 3:59 PM (89, 22.7%) for females.
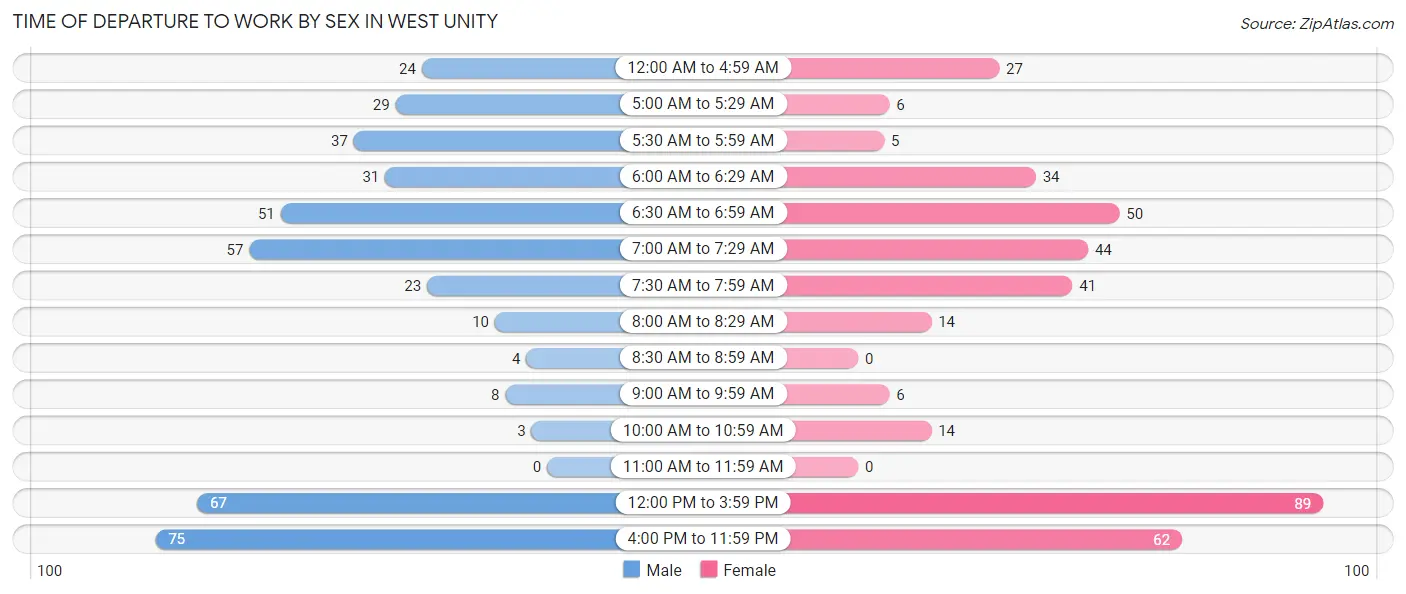
| Time of Departure | Male | Female |
| 12:00 AM to 4:59 AM | 24 (5.7%) | 27 (6.9%) |
| 5:00 AM to 5:29 AM | 29 (6.9%) | 6 (1.5%) |
| 5:30 AM to 5:59 AM | 37 (8.8%) | 5 (1.3%) |
| 6:00 AM to 6:29 AM | 31 (7.4%) | 34 (8.7%) |
| 6:30 AM to 6:59 AM | 51 (12.2%) | 50 (12.8%) |
| 7:00 AM to 7:29 AM | 57 (13.6%) | 44 (11.2%) |
| 7:30 AM to 7:59 AM | 23 (5.5%) | 41 (10.5%) |
| 8:00 AM to 8:29 AM | 10 (2.4%) | 14 (3.6%) |
| 8:30 AM to 8:59 AM | 4 (0.9%) | 0 (0.0%) |
| 9:00 AM to 9:59 AM | 8 (1.9%) | 6 (1.5%) |
| 10:00 AM to 10:59 AM | 3 (0.7%) | 14 (3.6%) |
| 11:00 AM to 11:59 AM | 0 (0.0%) | 0 (0.0%) |
| 12:00 PM to 3:59 PM | 67 (16.0%) | 89 (22.7%) |
| 4:00 PM to 11:59 PM | 75 (17.9%) | 62 (15.8%) |
| Total | 419 (100.0%) | 392 (100.0%) |
Housing Occupancy in West Unity
Occupancy by Ownership in West Unity
Of the total 730 dwellings in West Unity, owner-occupied units account for 450 (61.6%), while renter-occupied units make up 280 (38.4%).
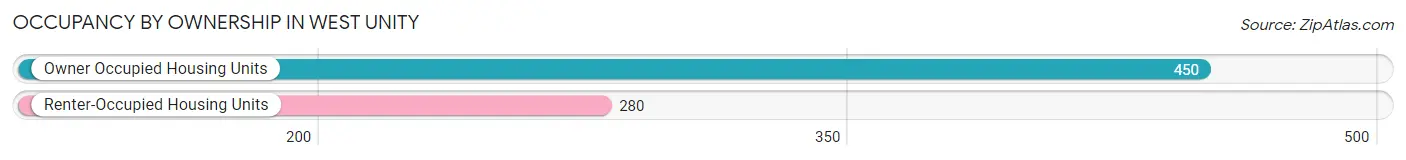
| Occupancy | # Housing Units | % Housing Units |
| Owner Occupied Housing Units | 450 | 61.6% |
| Renter-Occupied Housing Units | 280 | 38.4% |
| Total Occupied Housing Units | 730 | 100.0% |
Occupancy by Household Size in West Unity
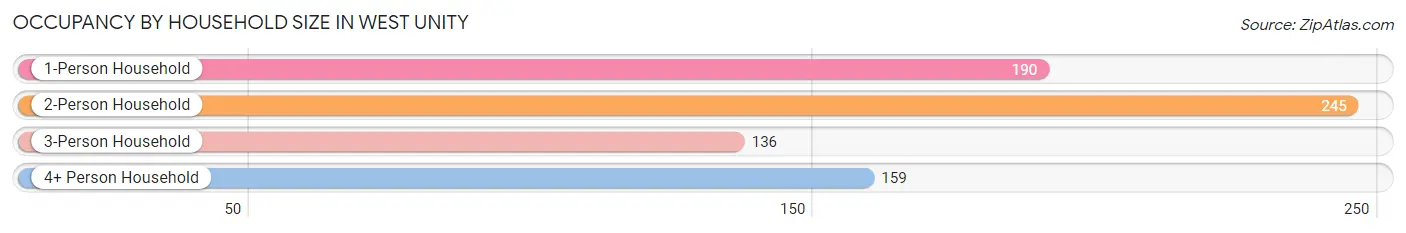
| Household Size | # Housing Units | % Housing Units |
| 1-Person Household | 190 | 26.0% |
| 2-Person Household | 245 | 33.6% |
| 3-Person Household | 136 | 18.6% |
| 4+ Person Household | 159 | 21.8% |
| Total Housing Units | 730 | 100.0% |
Occupancy by Ownership by Household Size in West Unity
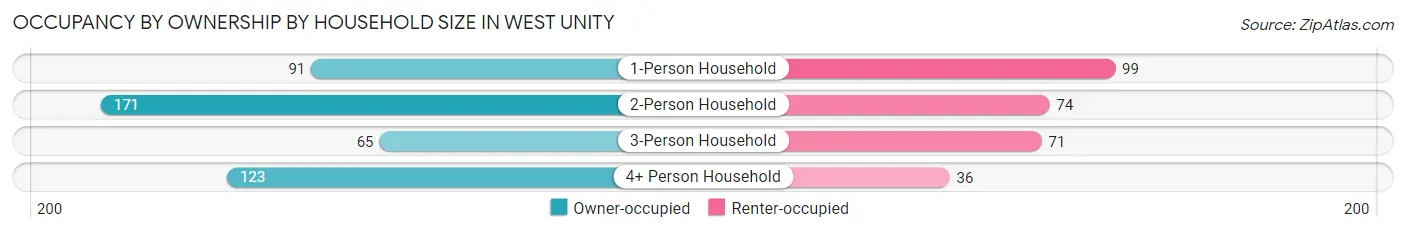
| Household Size | Owner-occupied | Renter-occupied |
| 1-Person Household | 91 (47.9%) | 99 (52.1%) |
| 2-Person Household | 171 (69.8%) | 74 (30.2%) |
| 3-Person Household | 65 (47.8%) | 71 (52.2%) |
| 4+ Person Household | 123 (77.4%) | 36 (22.6%) |
| Total Housing Units | 450 (61.6%) | 280 (38.4%) |
Occupancy by Educational Attainment in West Unity
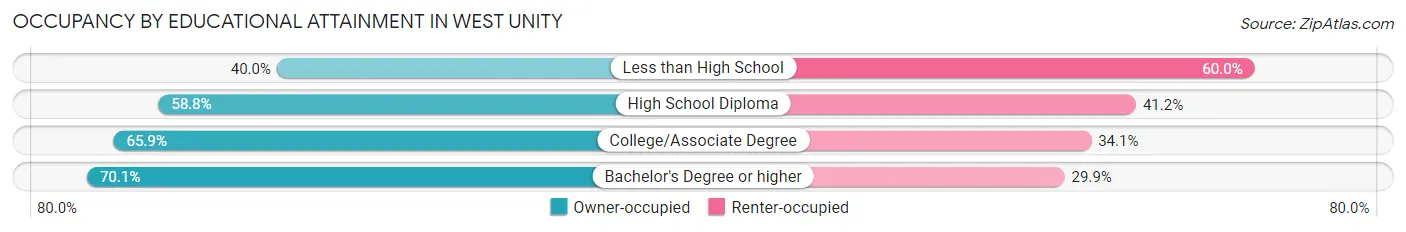
| Household Size | Owner-occupied | Renter-occupied |
| Less than High School | 18 (40.0%) | 27 (60.0%) |
| High School Diploma | 194 (58.8%) | 136 (41.2%) |
| College/Associate Degree | 170 (65.9%) | 88 (34.1%) |
| Bachelor's Degree or higher | 68 (70.1%) | 29 (29.9%) |
Occupancy by Age of Householder in West Unity
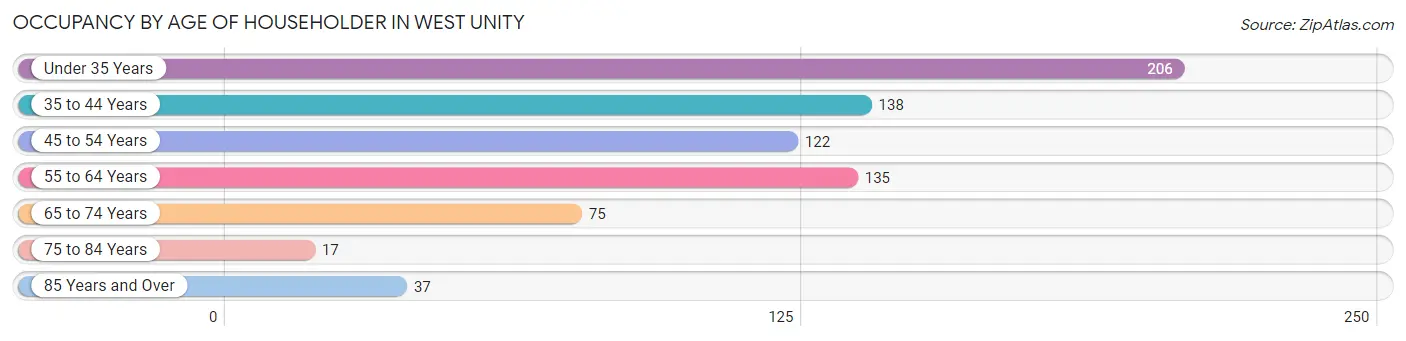
| Age Bracket | # Households | % Households |
| Under 35 Years | 206 | 28.2% |
| 35 to 44 Years | 138 | 18.9% |
| 45 to 54 Years | 122 | 16.7% |
| 55 to 64 Years | 135 | 18.5% |
| 65 to 74 Years | 75 | 10.3% |
| 75 to 84 Years | 17 | 2.3% |
| 85 Years and Over | 37 | 5.1% |
| Total | 730 | 100.0% |
Housing Finances in West Unity
Median Income by Occupancy in West Unity
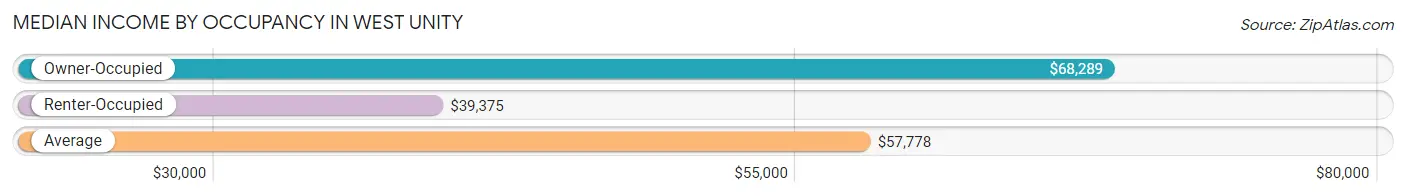
| Occupancy Type | # Households | Median Income |
| Owner-Occupied | 450 (61.6%) | $68,289 |
| Renter-Occupied | 280 (38.4%) | $39,375 |
| Average | 730 (100.0%) | $57,778 |
Occupancy by Householder Income Bracket in West Unity
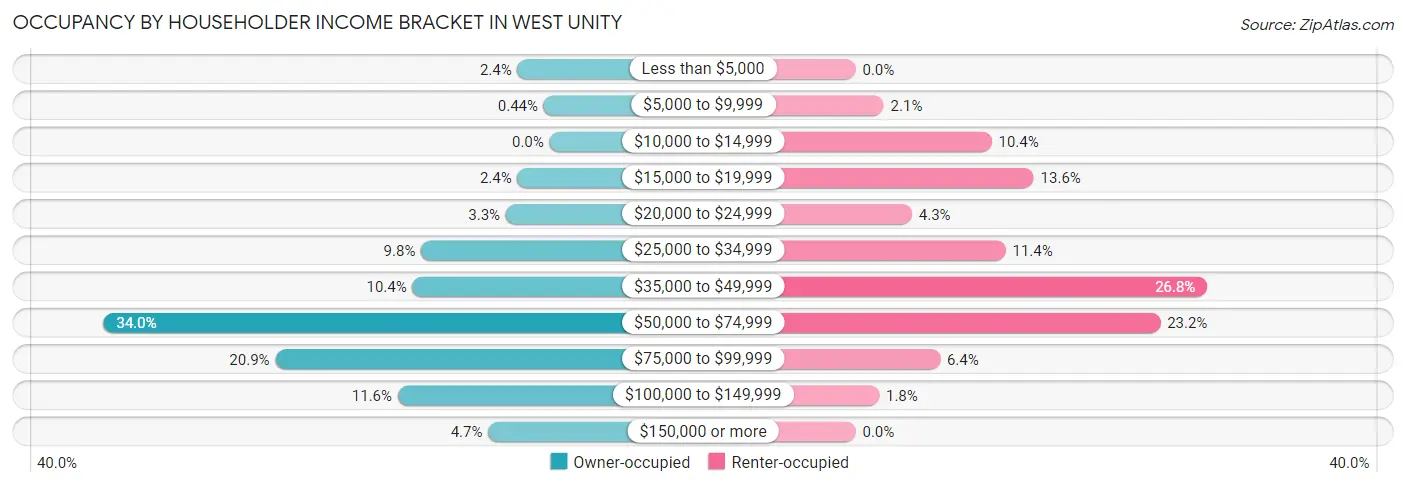
| Income Bracket | Owner-occupied | Renter-occupied |
| Less than $5,000 | 11 (2.4%) | 0 (0.0%) |
| $5,000 to $9,999 | 2 (0.4%) | 6 (2.1%) |
| $10,000 to $14,999 | 0 (0.0%) | 29 (10.4%) |
| $15,000 to $19,999 | 11 (2.4%) | 38 (13.6%) |
| $20,000 to $24,999 | 15 (3.3%) | 12 (4.3%) |
| $25,000 to $34,999 | 44 (9.8%) | 32 (11.4%) |
| $35,000 to $49,999 | 47 (10.4%) | 75 (26.8%) |
| $50,000 to $74,999 | 153 (34.0%) | 65 (23.2%) |
| $75,000 to $99,999 | 94 (20.9%) | 18 (6.4%) |
| $100,000 to $149,999 | 52 (11.6%) | 5 (1.8%) |
| $150,000 or more | 21 (4.7%) | 0 (0.0%) |
| Total | 450 (100.0%) | 280 (100.0%) |
Monthly Housing Cost Tiers in West Unity
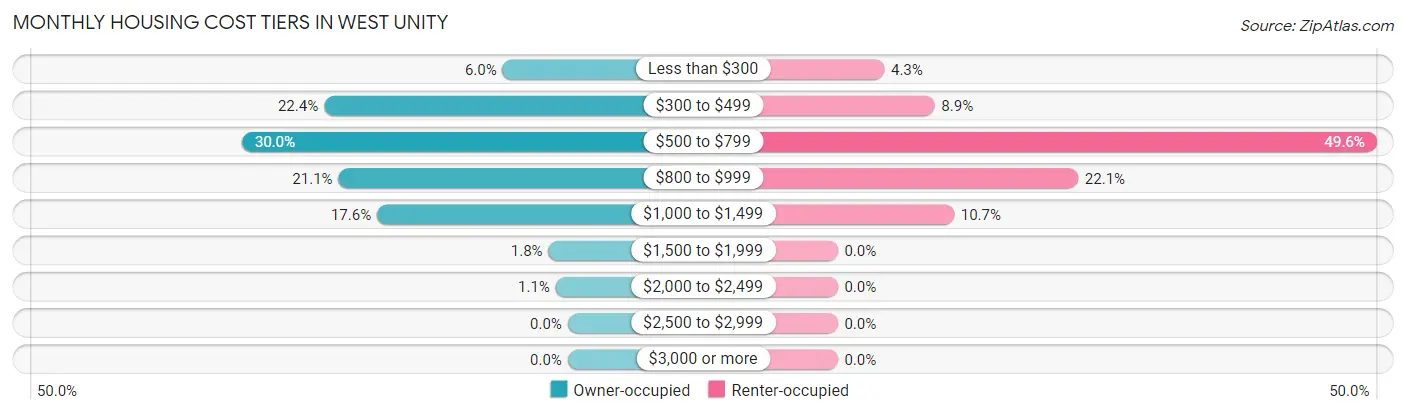
| Monthly Cost | Owner-occupied | Renter-occupied |
| Less than $300 | 27 (6.0%) | 12 (4.3%) |
| $300 to $499 | 101 (22.4%) | 25 (8.9%) |
| $500 to $799 | 135 (30.0%) | 139 (49.6%) |
| $800 to $999 | 95 (21.1%) | 62 (22.1%) |
| $1,000 to $1,499 | 79 (17.6%) | 30 (10.7%) |
| $1,500 to $1,999 | 8 (1.8%) | 0 (0.0%) |
| $2,000 to $2,499 | 5 (1.1%) | 0 (0.0%) |
| $2,500 to $2,999 | 0 (0.0%) | 0 (0.0%) |
| $3,000 or more | 0 (0.0%) | 0 (0.0%) |
| Total | 450 (100.0%) | 280 (100.0%) |
Physical Housing Characteristics in West Unity
Housing Structures in West Unity
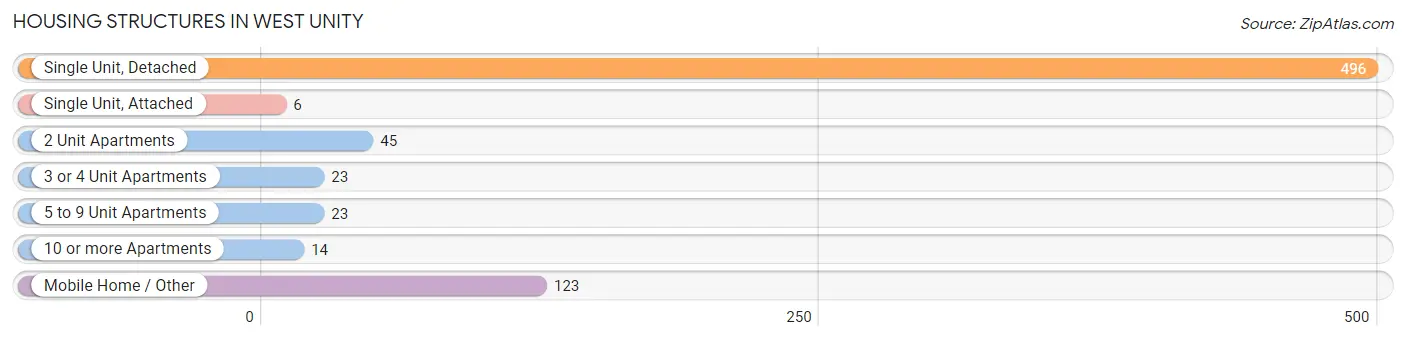
| Structure Type | # Housing Units | % Housing Units |
| Single Unit, Detached | 496 | 67.9% |
| Single Unit, Attached | 6 | 0.8% |
| 2 Unit Apartments | 45 | 6.2% |
| 3 or 4 Unit Apartments | 23 | 3.2% |
| 5 to 9 Unit Apartments | 23 | 3.2% |
| 10 or more Apartments | 14 | 1.9% |
| Mobile Home / Other | 123 | 16.9% |
| Total | 730 | 100.0% |
Housing Structures by Occupancy in West Unity
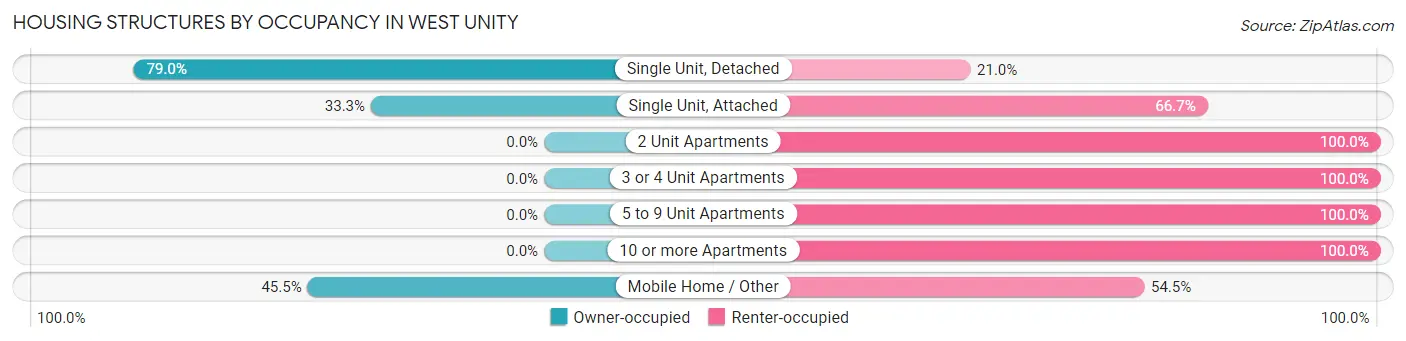
| Structure Type | Owner-occupied | Renter-occupied |
| Single Unit, Detached | 392 (79.0%) | 104 (21.0%) |
| Single Unit, Attached | 2 (33.3%) | 4 (66.7%) |
| 2 Unit Apartments | 0 (0.0%) | 45 (100.0%) |
| 3 or 4 Unit Apartments | 0 (0.0%) | 23 (100.0%) |
| 5 to 9 Unit Apartments | 0 (0.0%) | 23 (100.0%) |
| 10 or more Apartments | 0 (0.0%) | 14 (100.0%) |
| Mobile Home / Other | 56 (45.5%) | 67 (54.5%) |
| Total | 450 (61.6%) | 280 (38.4%) |
Housing Structures by Number of Rooms in West Unity
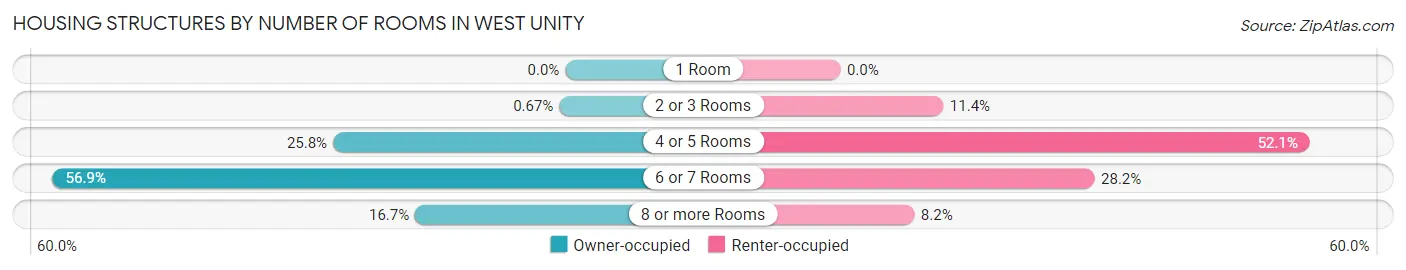
| Number of Rooms | Owner-occupied | Renter-occupied |
| 1 Room | 0 (0.0%) | 0 (0.0%) |
| 2 or 3 Rooms | 3 (0.7%) | 32 (11.4%) |
| 4 or 5 Rooms | 116 (25.8%) | 146 (52.1%) |
| 6 or 7 Rooms | 256 (56.9%) | 79 (28.2%) |
| 8 or more Rooms | 75 (16.7%) | 23 (8.2%) |
| Total | 450 (100.0%) | 280 (100.0%) |
Housing Structure by Heating Type in West Unity
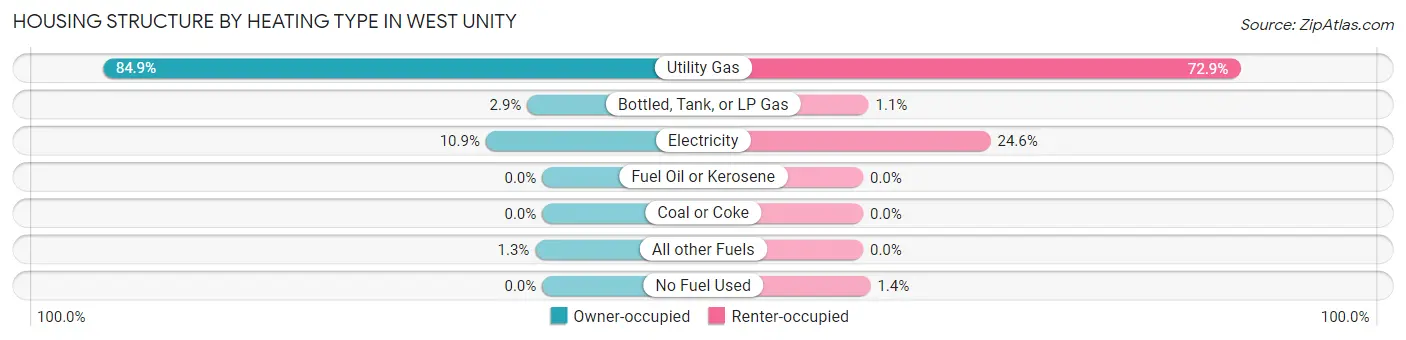
| Heating Type | Owner-occupied | Renter-occupied |
| Utility Gas | 382 (84.9%) | 204 (72.9%) |
| Bottled, Tank, or LP Gas | 13 (2.9%) | 3 (1.1%) |
| Electricity | 49 (10.9%) | 69 (24.6%) |
| Fuel Oil or Kerosene | 0 (0.0%) | 0 (0.0%) |
| Coal or Coke | 0 (0.0%) | 0 (0.0%) |
| All other Fuels | 6 (1.3%) | 0 (0.0%) |
| No Fuel Used | 0 (0.0%) | 4 (1.4%) |
| Total | 450 (100.0%) | 280 (100.0%) |
Household Vehicle Usage in West Unity
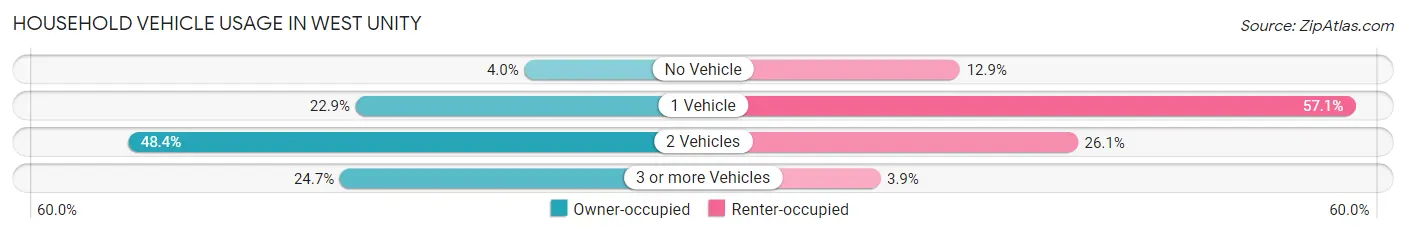
| Vehicles per Household | Owner-occupied | Renter-occupied |
| No Vehicle | 18 (4.0%) | 36 (12.9%) |
| 1 Vehicle | 103 (22.9%) | 160 (57.1%) |
| 2 Vehicles | 218 (48.4%) | 73 (26.1%) |
| 3 or more Vehicles | 111 (24.7%) | 11 (3.9%) |
| Total | 450 (100.0%) | 280 (100.0%) |
Real Estate & Mortgages in West Unity
Real Estate and Mortgage Overview in West Unity
| Characteristic | Without Mortgage | With Mortgage |
| Housing Units | 191 | 259 |
| Median Property Value | $93,400 | $111,800 |
| Median Household Income | $69,583 | $15 |
| Monthly Housing Costs | $391 | $0 |
| Real Estate Taxes | $1,250 | $0 |
Property Value by Mortgage Status in West Unity
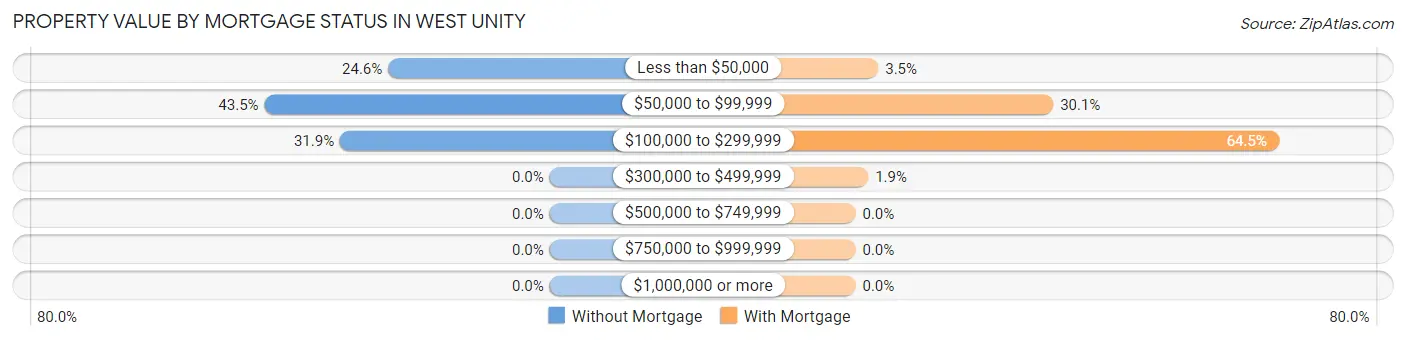
| Property Value | Without Mortgage | With Mortgage |
| Less than $50,000 | 47 (24.6%) | 9 (3.5%) |
| $50,000 to $99,999 | 83 (43.5%) | 78 (30.1%) |
| $100,000 to $299,999 | 61 (31.9%) | 167 (64.5%) |
| $300,000 to $499,999 | 0 (0.0%) | 5 (1.9%) |
| $500,000 to $749,999 | 0 (0.0%) | 0 (0.0%) |
| $750,000 to $999,999 | 0 (0.0%) | 0 (0.0%) |
| $1,000,000 or more | 0 (0.0%) | 0 (0.0%) |
| Total | 191 (100.0%) | 259 (100.0%) |
Household Income by Mortgage Status in West Unity
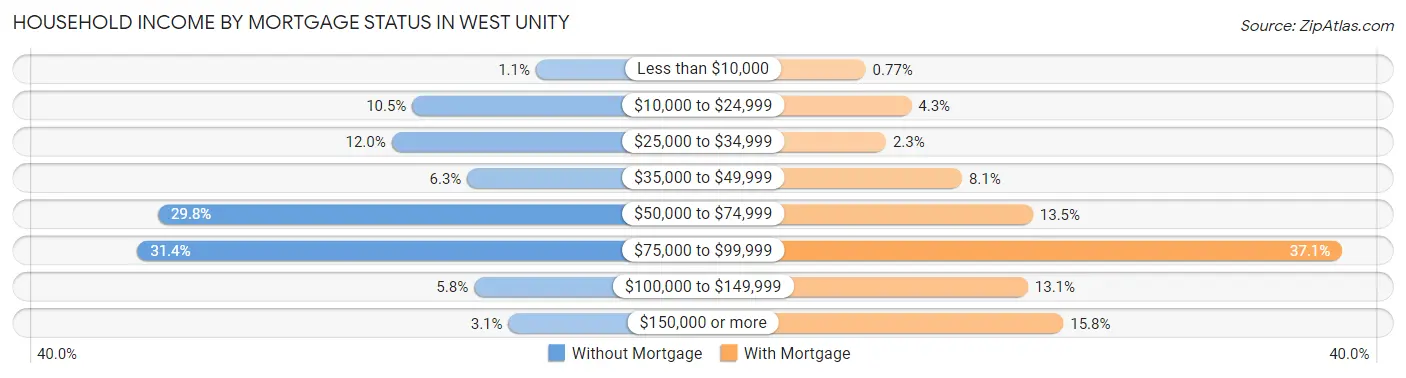
| Household Income | Without Mortgage | With Mortgage |
| Less than $10,000 | 2 (1.1%) | 2 (0.8%) |
| $10,000 to $24,999 | 20 (10.5%) | 11 (4.3%) |
| $25,000 to $34,999 | 23 (12.0%) | 6 (2.3%) |
| $35,000 to $49,999 | 12 (6.3%) | 21 (8.1%) |
| $50,000 to $74,999 | 57 (29.8%) | 35 (13.5%) |
| $75,000 to $99,999 | 60 (31.4%) | 96 (37.1%) |
| $100,000 to $149,999 | 11 (5.8%) | 34 (13.1%) |
| $150,000 or more | 6 (3.1%) | 41 (15.8%) |
| Total | 191 (100.0%) | 259 (100.0%) |
Property Value to Household Income Ratio in West Unity
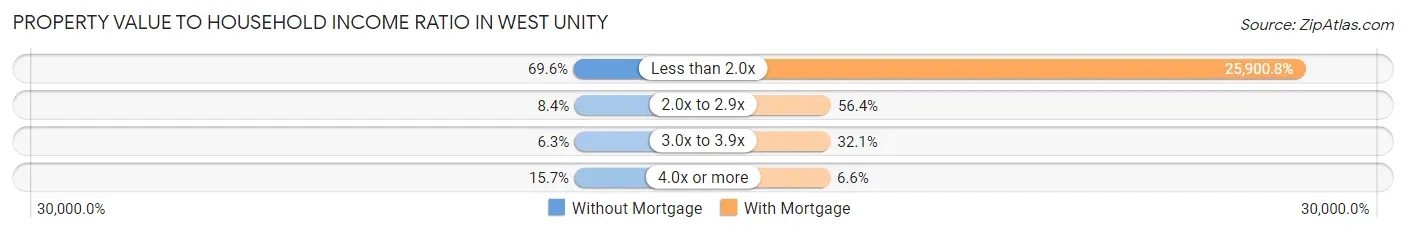
| Value-to-Income Ratio | Without Mortgage | With Mortgage |
| Less than 2.0x | 133 (69.6%) | 67,083 (25,900.8%) |
| 2.0x to 2.9x | 16 (8.4%) | 146 (56.4%) |
| 3.0x to 3.9x | 12 (6.3%) | 83 (32.1%) |
| 4.0x or more | 30 (15.7%) | 17 (6.6%) |
| Total | 191 (100.0%) | 259 (100.0%) |
Real Estate Taxes by Mortgage Status in West Unity
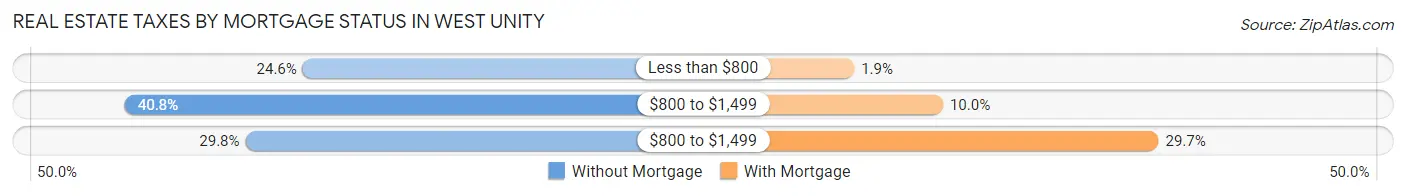
| Property Taxes | Without Mortgage | With Mortgage |
| Less than $800 | 47 (24.6%) | 5 (1.9%) |
| $800 to $1,499 | 78 (40.8%) | 26 (10.0%) |
| $800 to $1,499 | 57 (29.8%) | 77 (29.7%) |
| Total | 191 (100.0%) | 259 (100.0%) |
Health & Disability in West Unity
Health Insurance Coverage by Age in West Unity
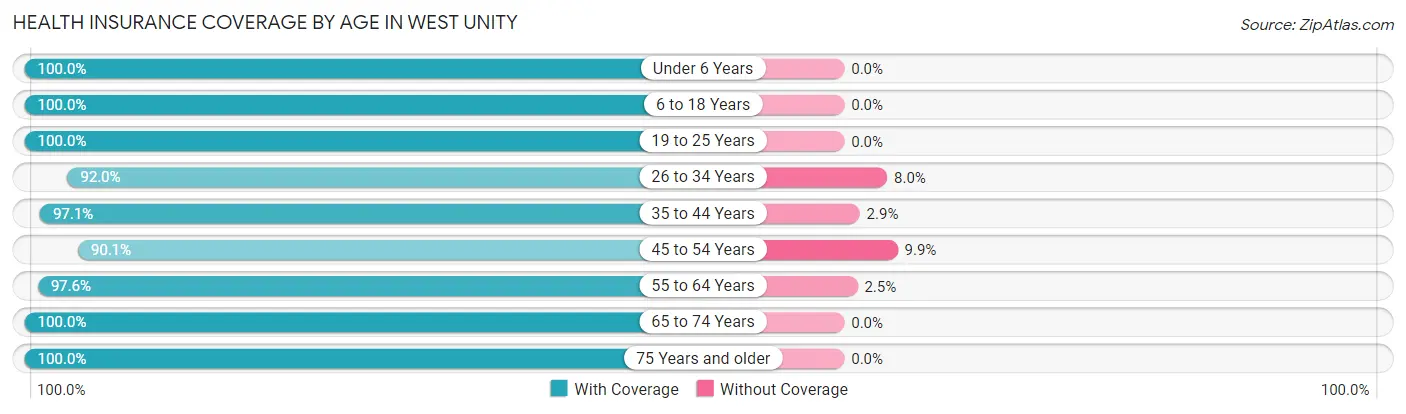
| Age Bracket | With Coverage | Without Coverage |
| Under 6 Years | 238 (100.0%) | 0 (0.0%) |
| 6 to 18 Years | 411 (100.0%) | 0 (0.0%) |
| 19 to 25 Years | 118 (100.0%) | 0 (0.0%) |
| 26 to 34 Years | 242 (92.0%) | 21 (8.0%) |
| 35 to 44 Years | 237 (97.1%) | 7 (2.9%) |
| 45 to 54 Years | 163 (90.1%) | 18 (9.9%) |
| 55 to 64 Years | 239 (97.6%) | 6 (2.5%) |
| 65 to 74 Years | 107 (100.0%) | 0 (0.0%) |
| 75 Years and older | 71 (100.0%) | 0 (0.0%) |
| Total | 1,826 (97.2%) | 52 (2.8%) |
Health Insurance Coverage by Citizenship Status in West Unity
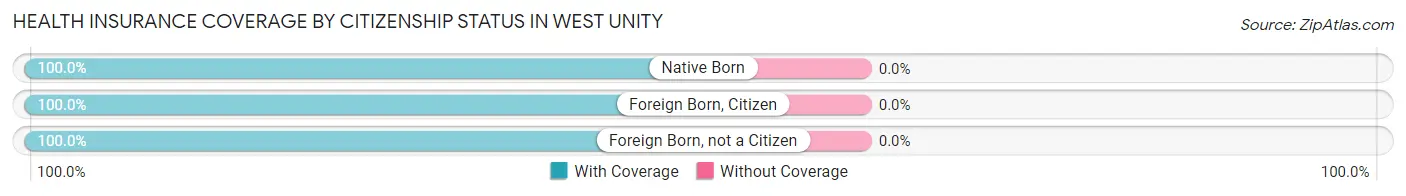
| Citizenship Status | With Coverage | Without Coverage |
| Native Born | 238 (100.0%) | 0 (0.0%) |
| Foreign Born, Citizen | 411 (100.0%) | 0 (0.0%) |
| Foreign Born, not a Citizen | 118 (100.0%) | 0 (0.0%) |
Health Insurance Coverage by Household Income in West Unity
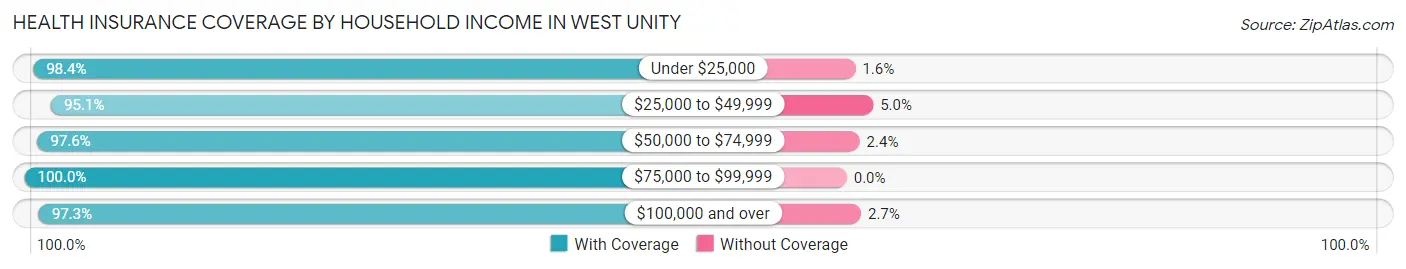
| Household Income | With Coverage | Without Coverage |
| Under $25,000 | 182 (98.4%) | 3 (1.6%) |
| $25,000 to $49,999 | 538 (95.1%) | 28 (5.0%) |
| $50,000 to $74,999 | 607 (97.6%) | 15 (2.4%) |
| $75,000 to $99,999 | 265 (100.0%) | 0 (0.0%) |
| $100,000 and over | 219 (97.3%) | 6 (2.7%) |
Public vs Private Health Insurance Coverage by Age in West Unity
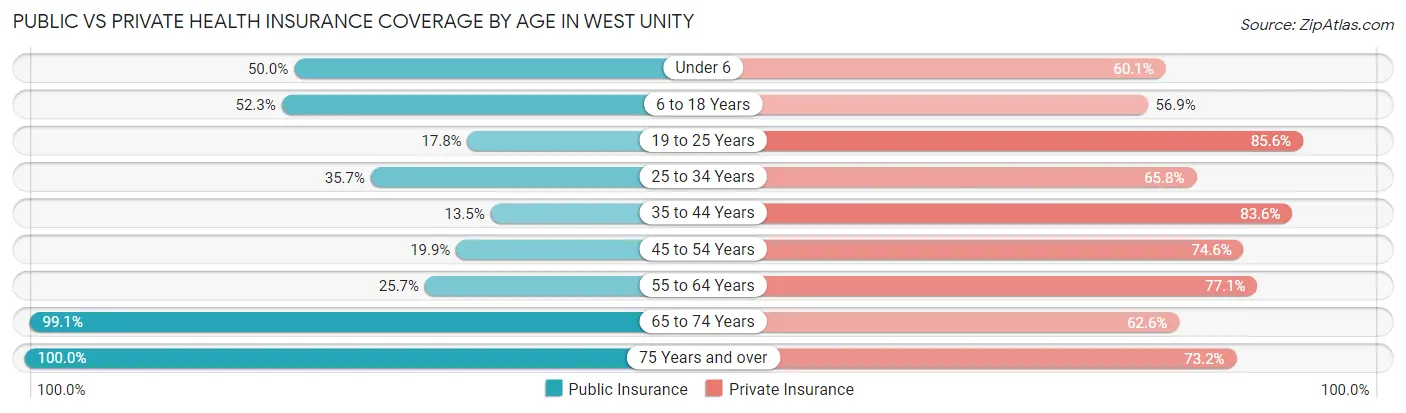
| Age Bracket | Public Insurance | Private Insurance |
| Under 6 | 119 (50.0%) | 143 (60.1%) |
| 6 to 18 Years | 215 (52.3%) | 234 (56.9%) |
| 19 to 25 Years | 21 (17.8%) | 101 (85.6%) |
| 25 to 34 Years | 94 (35.7%) | 173 (65.8%) |
| 35 to 44 Years | 33 (13.5%) | 204 (83.6%) |
| 45 to 54 Years | 36 (19.9%) | 135 (74.6%) |
| 55 to 64 Years | 63 (25.7%) | 189 (77.1%) |
| 65 to 74 Years | 106 (99.1%) | 67 (62.6%) |
| 75 Years and over | 71 (100.0%) | 52 (73.2%) |
| Total | 758 (40.4%) | 1,298 (69.1%) |
Disability Status by Sex by Age in West Unity
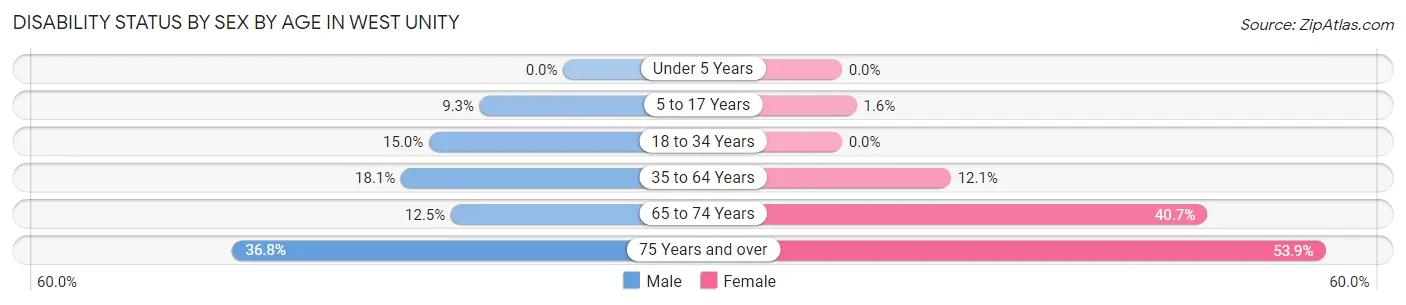
| Age Bracket | Male | Female |
| Under 5 Years | 0 (0.0%) | 0 (0.0%) |
| 5 to 17 Years | 20 (9.3%) | 3 (1.6%) |
| 18 to 34 Years | 29 (14.9%) | 0 (0.0%) |
| 35 to 64 Years | 60 (18.1%) | 41 (12.1%) |
| 65 to 74 Years | 6 (12.5%) | 24 (40.7%) |
| 75 Years and over | 7 (36.8%) | 28 (53.8%) |
Disability Class by Sex by Age in West Unity
Disability Class: Hearing Difficulty
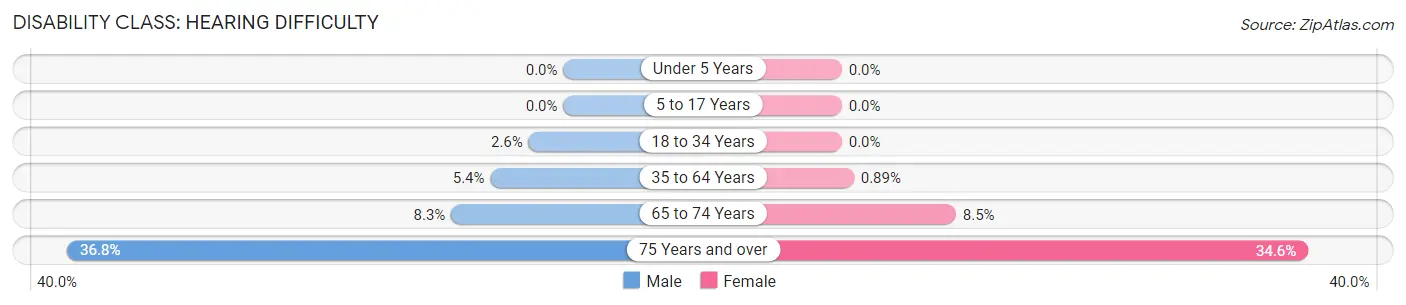
| Age Bracket | Male | Female |
| Under 5 Years | 0 (0.0%) | 0 (0.0%) |
| 5 to 17 Years | 0 (0.0%) | 0 (0.0%) |
| 18 to 34 Years | 5 (2.6%) | 0 (0.0%) |
| 35 to 64 Years | 18 (5.4%) | 3 (0.9%) |
| 65 to 74 Years | 4 (8.3%) | 5 (8.5%) |
| 75 Years and over | 7 (36.8%) | 18 (34.6%) |
Disability Class: Vision Difficulty
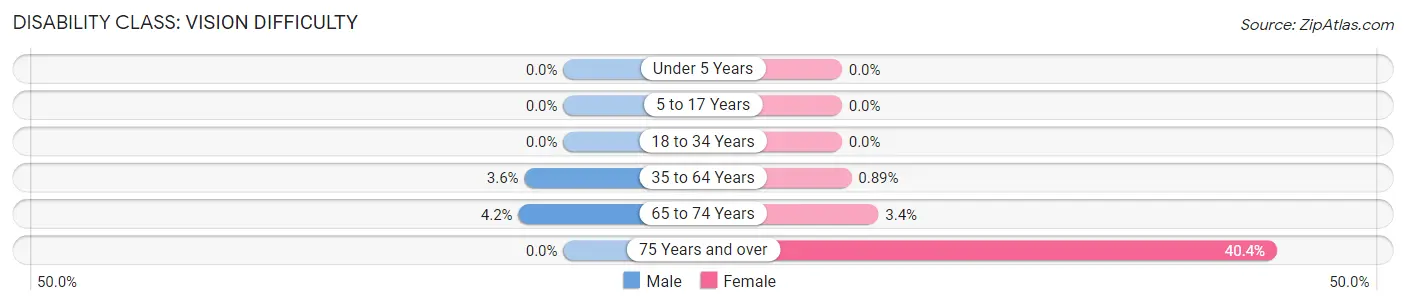
| Age Bracket | Male | Female |
| Under 5 Years | 0 (0.0%) | 0 (0.0%) |
| 5 to 17 Years | 0 (0.0%) | 0 (0.0%) |
| 18 to 34 Years | 0 (0.0%) | 0 (0.0%) |
| 35 to 64 Years | 12 (3.6%) | 3 (0.9%) |
| 65 to 74 Years | 2 (4.2%) | 2 (3.4%) |
| 75 Years and over | 0 (0.0%) | 21 (40.4%) |
Disability Class: Cognitive Difficulty
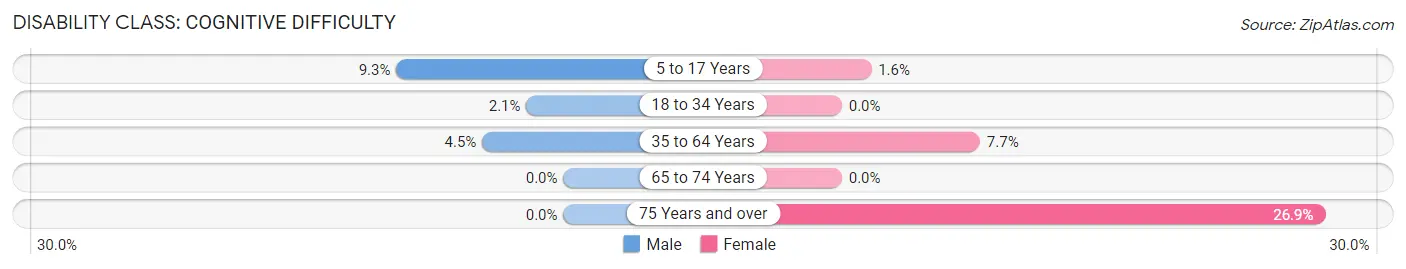
| Age Bracket | Male | Female |
| 5 to 17 Years | 20 (9.3%) | 3 (1.6%) |
| 18 to 34 Years | 4 (2.1%) | 0 (0.0%) |
| 35 to 64 Years | 15 (4.5%) | 26 (7.7%) |
| 65 to 74 Years | 0 (0.0%) | 0 (0.0%) |
| 75 Years and over | 0 (0.0%) | 14 (26.9%) |
Disability Class: Ambulatory Difficulty
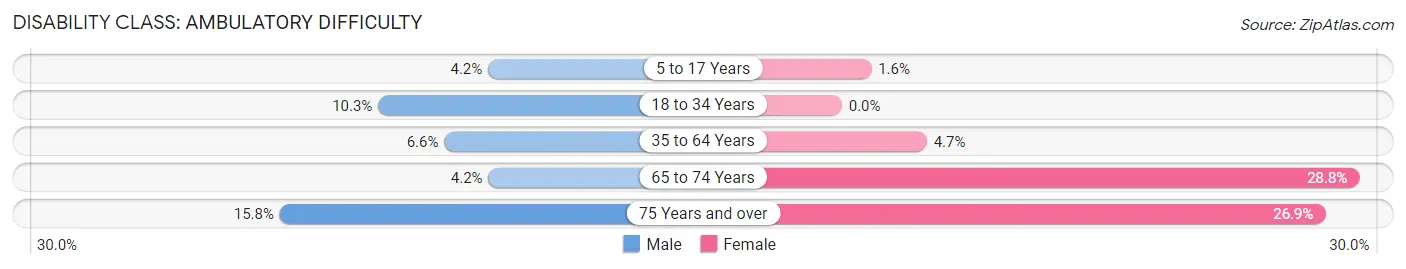
| Age Bracket | Male | Female |
| 5 to 17 Years | 9 (4.2%) | 3 (1.6%) |
| 18 to 34 Years | 20 (10.3%) | 0 (0.0%) |
| 35 to 64 Years | 22 (6.6%) | 16 (4.7%) |
| 65 to 74 Years | 2 (4.2%) | 17 (28.8%) |
| 75 Years and over | 3 (15.8%) | 14 (26.9%) |
Disability Class: Self-Care Difficulty
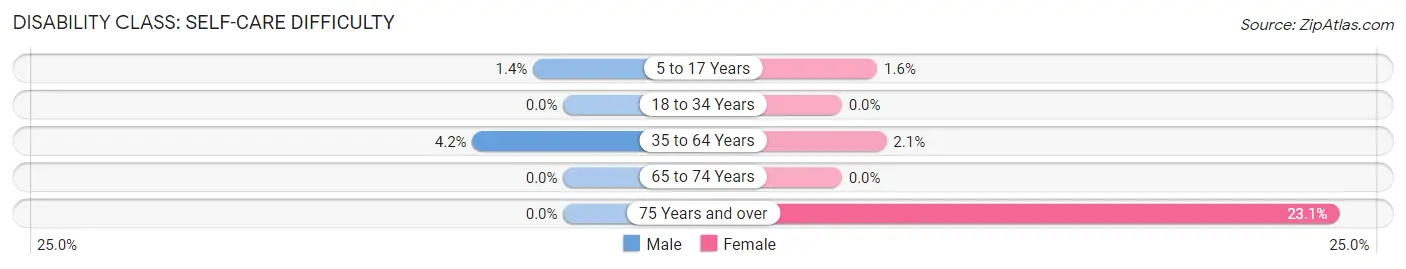
| Age Bracket | Male | Female |
| 5 to 17 Years | 3 (1.4%) | 3 (1.6%) |
| 18 to 34 Years | 0 (0.0%) | 0 (0.0%) |
| 35 to 64 Years | 14 (4.2%) | 7 (2.1%) |
| 65 to 74 Years | 0 (0.0%) | 0 (0.0%) |
| 75 Years and over | 0 (0.0%) | 12 (23.1%) |
Technology Access in West Unity
Computing Device Access in West Unity
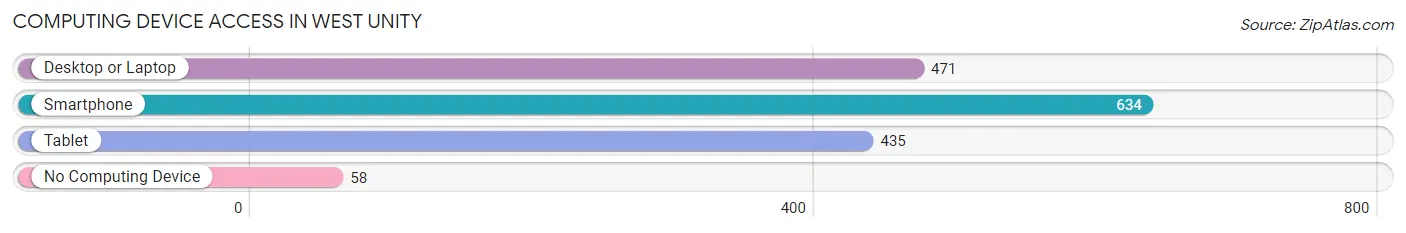
| Device Type | # Households | % Households |
| Desktop or Laptop | 471 | 64.5% |
| Smartphone | 634 | 86.9% |
| Tablet | 435 | 59.6% |
| No Computing Device | 58 | 8.0% |
| Total | 730 | 100.0% |
Internet Access in West Unity
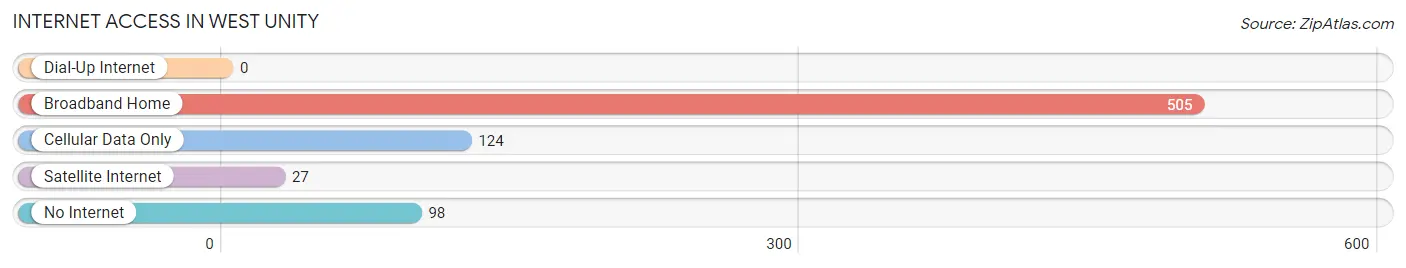
| Internet Type | # Households | % Households |
| Dial-Up Internet | 0 | 0.0% |
| Broadband Home | 505 | 69.2% |
| Cellular Data Only | 124 | 17.0% |
| Satellite Internet | 27 | 3.7% |
| No Internet | 98 | 13.4% |
| Total | 730 | 100.0% |
West Unity Summary
History
West Unity is a village located in Williams County, Ohio, United States. It is situated along the St. Joseph River, approximately 10 miles east of the county seat of Bryan. The village was founded in 1837 by a group of settlers from New York, led by John and Mary Ann (Horton) West. The village was named after the West family, and the name was later changed to West Unity.
The village was originally a farming community, but in the late 19th century, it became a center for the lumber industry. The lumber industry was a major source of employment for the village, and it was also a major contributor to the local economy. The village was also home to several other industries, including a brickyard, a sawmill, and a grist mill.
In the early 20th century, West Unity experienced a period of growth and prosperity. The village was home to several businesses, including a bank, a hotel, a movie theater, and a variety of stores. The village also had a public library, a post office, and a fire department.
In the late 20th century, West Unity experienced a period of decline. The lumber industry declined, and many of the businesses in the village closed. The population of the village also declined, and by the year 2000, the population was just over 1,000.
Geography
West Unity is located in Williams County, Ohio, approximately 10 miles east of the county seat of Bryan. The village is situated along the St. Joseph River, and is surrounded by farmland. The village is located in the Great Black Swamp region of Ohio, and is part of the Great Black Swamp National Wildlife Refuge.
The village has a total area of 1.2 square miles, all of which is land. The village is located at an elevation of 845 feet above sea level. The climate in West Unity is classified as humid continental, with hot summers and cold winters.
Economy
West Unity is a small village with a population of just over 1,000. The village is primarily a residential community, and the economy is largely based on agriculture and tourism. The village is home to several small businesses, including a grocery store, a hardware store, and a few restaurants.
The village is also home to several manufacturing companies, including a plastics manufacturer and a metal fabrication company. The village is also home to a number of small farms, which produce a variety of crops, including corn, soybeans, and wheat.
Demographics
As of the 2010 census, the population of West Unity was 1,072. The racial makeup of the village was 97.3% White, 0.7% African American, 0.2% Native American, 0.2% Asian, 0.2% from other races, and 1.6% from two or more races. Hispanic or Latino of any race were 1.2% of the population.
The median household income in West Unity was $41,250, and the median family income was $48,750. The per capita income for the village was $19,945. About 11.2% of families and 13.2% of the population were below the poverty line, including 17.2% of those under age 18 and 8.3% of those age 65 or over.
Common Questions
What is Per Capita Income in West Unity?
Per Capita income in West Unity is $23,477.
What is the Median Family Income in West Unity?
Median Family Income in West Unity is $63,438.
What is the Median Household income in West Unity?
Median Household Income in West Unity is $57,778.
What is Income or Wage Gap in West Unity?
Income or Wage Gap in West Unity is 39.0%.
Women in West Unity earn 61.0 cents for every dollar earned by a man.
What is Inequality or Gini Index in West Unity?
Inequality or Gini Index in West Unity is 0.32.
What is the Total Population of West Unity?
Total Population of West Unity is 1,878.
What is the Total Male Population of West Unity?
Total Male Population of West Unity is 936.
What is the Total Female Population of West Unity?
Total Female Population of West Unity is 942.
What is the Ratio of Males per 100 Females in West Unity?
There are 99.36 Males per 100 Females in West Unity.
What is the Ratio of Females per 100 Males in West Unity?
There are 100.64 Females per 100 Males in West Unity.
What is the Median Population Age in West Unity?
Median Population Age in West Unity is 30.9 Years.
What is the Average Family Size in West Unity
Average Family Size in West Unity is 3.1 People.
What is the Average Household Size in West Unity
Average Household Size in West Unity is 2.5 People.
How Large is the Labor Force in West Unity?
There are 946 People in the Labor Forcein in West Unity.
What is the Percentage of People in the Labor Force in West Unity?
72.6% of People are in the Labor Force in West Unity.
What is the Unemployment Rate in West Unity?
Unemployment Rate in West Unity is 8.7%.