Lake Lorelei, OH Map & Demographics
Lake Lorelei Map
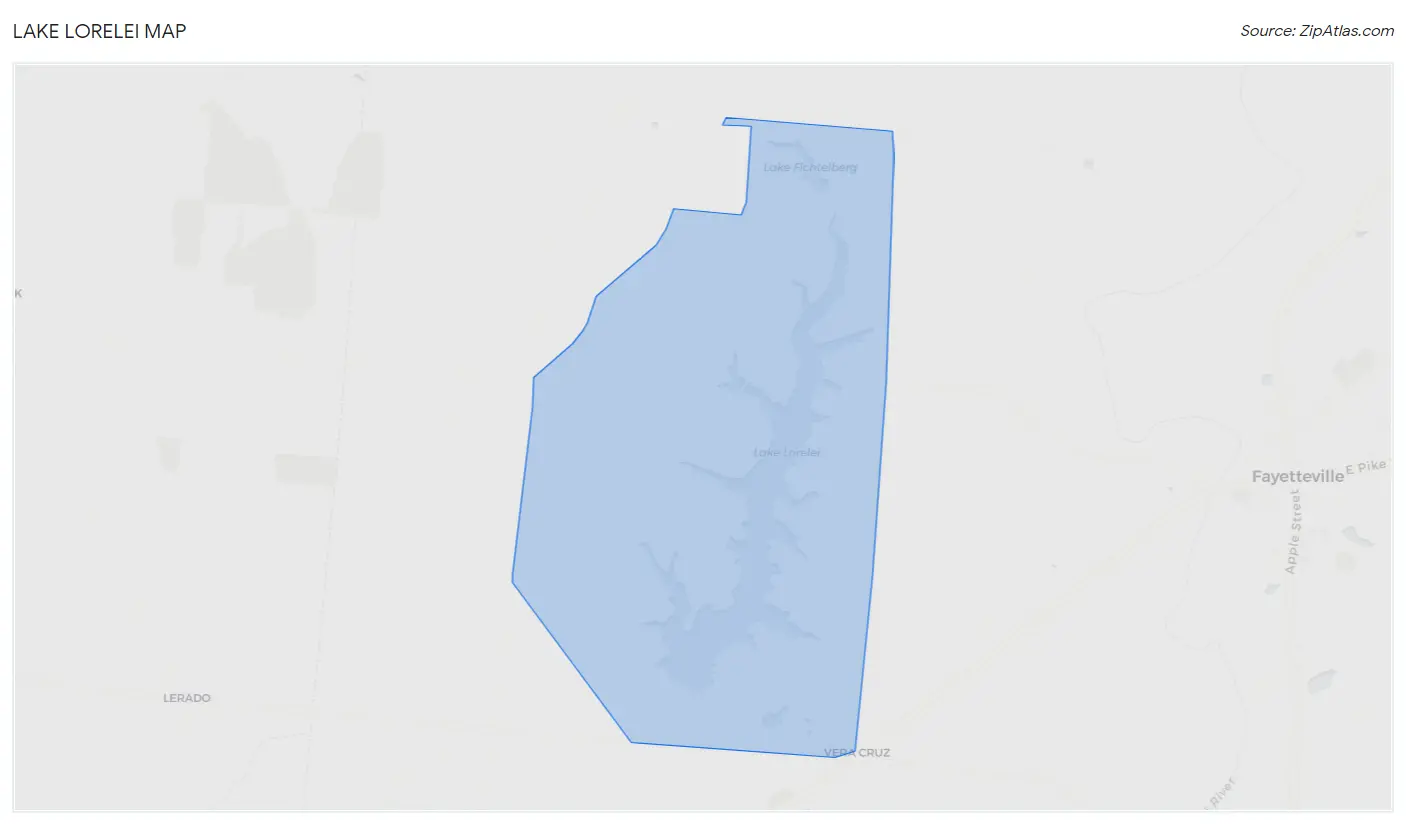
Lake Lorelei Overview
$38,165
PER CAPITA INCOME
$93,214
AVG FAMILY INCOME
$92,108
AVG HOUSEHOLD INCOME
18.6%
WAGE / INCOME GAP [ % ]
81.4¢/ $1
WAGE / INCOME GAP [ $ ]
0.32
INEQUALITY / GINI INDEX
1,143
TOTAL POPULATION
538
MALE POPULATION
605
FEMALE POPULATION
88.93
MALES / 100 FEMALES
112.45
FEMALES / 100 MALES
51.1
MEDIAN AGE
2.8
AVG FAMILY SIZE
2.4
AVG HOUSEHOLD SIZE
557
LABOR FORCE [ PEOPLE ]
59.0%
PERCENT IN LABOR FORCE
4.7%
UNEMPLOYMENT RATE
Income in Lake Lorelei
Income Overview in Lake Lorelei
Per Capita Income in Lake Lorelei is $38,165, while median incomes of families and households are $93,214 and $92,108 respectively.
| Characteristic | Number | Measure |
| Per Capita Income | 1,143 | $38,165 |
| Median Family Income | 348 | $93,214 |
| Mean Family Income | 348 | $100,630 |
| Median Household Income | 470 | $92,108 |
| Mean Household Income | 470 | $100,126 |
| Income Deficit | 348 | $0 |
| Wage / Income Gap (%) | 1,143 | 18.61% |
| Wage / Income Gap ($) | 1,143 | 81.39¢ per $1 |
| Gini / Inequality Index | 1,143 | 0.32 |
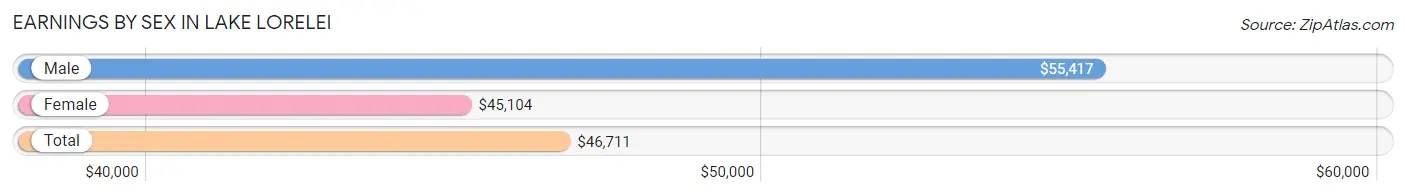
Earnings by Sex in Lake Lorelei
Average Earnings in Lake Lorelei are $46,711, $55,417 for men and $45,104 for women, a difference of 18.6%.
| Sex | Number | Average Earnings |
| Male | 299 (52.3%) | $55,417 |
| Female | 273 (47.7%) | $45,104 |
| Total | 572 (100.0%) | $46,711 |
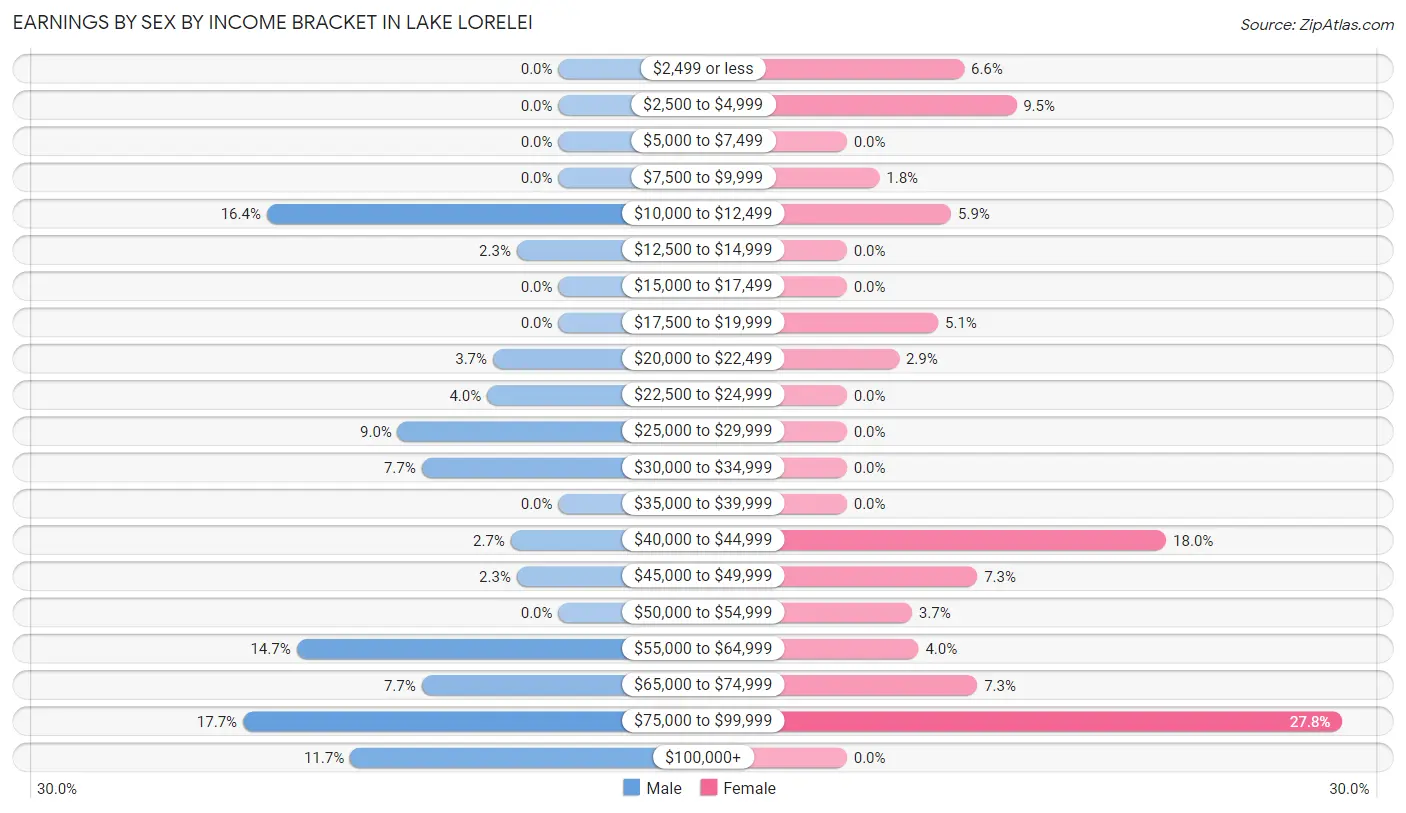
Earnings by Sex by Income Bracket in Lake Lorelei
The most common earnings brackets in Lake Lorelei are $75,000 to $99,999 for men (53 | 17.7%) and $75,000 to $99,999 for women (76 | 27.8%).
| Income | Male | Female |
| $2,499 or less | 0 (0.0%) | 18 (6.6%) |
| $2,500 to $4,999 | 0 (0.0%) | 26 (9.5%) |
| $5,000 to $7,499 | 0 (0.0%) | 0 (0.0%) |
| $7,500 to $9,999 | 0 (0.0%) | 5 (1.8%) |
| $10,000 to $12,499 | 49 (16.4%) | 16 (5.9%) |
| $12,500 to $14,999 | 7 (2.3%) | 0 (0.0%) |
| $15,000 to $17,499 | 0 (0.0%) | 0 (0.0%) |
| $17,500 to $19,999 | 0 (0.0%) | 14 (5.1%) |
| $20,000 to $22,499 | 11 (3.7%) | 8 (2.9%) |
| $22,500 to $24,999 | 12 (4.0%) | 0 (0.0%) |
| $25,000 to $29,999 | 27 (9.0%) | 0 (0.0%) |
| $30,000 to $34,999 | 23 (7.7%) | 0 (0.0%) |
| $35,000 to $39,999 | 0 (0.0%) | 0 (0.0%) |
| $40,000 to $44,999 | 8 (2.7%) | 49 (17.9%) |
| $45,000 to $49,999 | 7 (2.3%) | 20 (7.3%) |
| $50,000 to $54,999 | 0 (0.0%) | 10 (3.7%) |
| $55,000 to $64,999 | 44 (14.7%) | 11 (4.0%) |
| $65,000 to $74,999 | 23 (7.7%) | 20 (7.3%) |
| $75,000 to $99,999 | 53 (17.7%) | 76 (27.8%) |
| $100,000+ | 35 (11.7%) | 0 (0.0%) |
| Total | 299 (100.0%) | 273 (100.0%) |
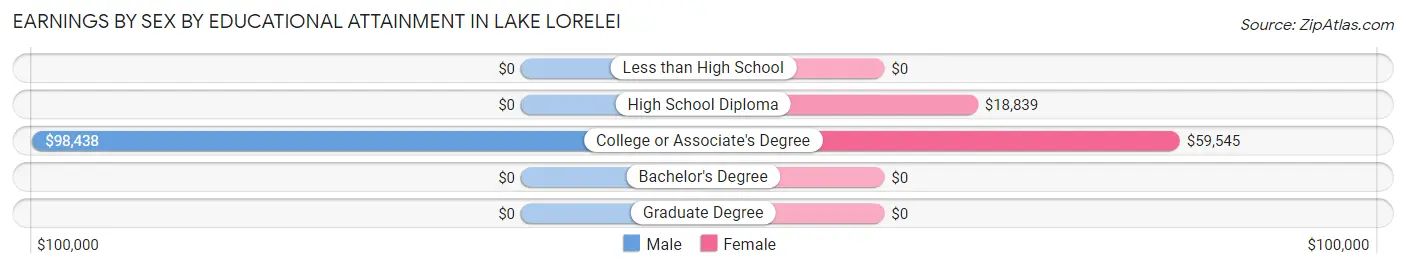
Earnings by Sex by Educational Attainment in Lake Lorelei
Average earnings in Lake Lorelei are $55,871 for men and $49,688 for women, a difference of 11.1%. Men with an educational attainment of college or associate's degree enjoy the highest average annual earnings of $98,438, while those with college or associate's degree education earn the least with $98,438. Women with an educational attainment of college or associate's degree earn the most with the average annual earnings of $59,545, while those with high school diploma education have the smallest earnings of $18,839.
| Educational Attainment | Male Income | Female Income |
| Less than High School | - | - |
| High School Diploma | - | - |
| College or Associate's Degree | $98,438 | $59,545 |
| Bachelor's Degree | - | - |
| Graduate Degree | - | - |
| Total | $55,871 | $49,688 |
Family Income in Lake Lorelei
Family Income Brackets in Lake Lorelei
According to the Lake Lorelei family income data, there are 118 families falling into the $100,000 to $149,999 income range, which is the most common income bracket and makes up 33.9% of all families.
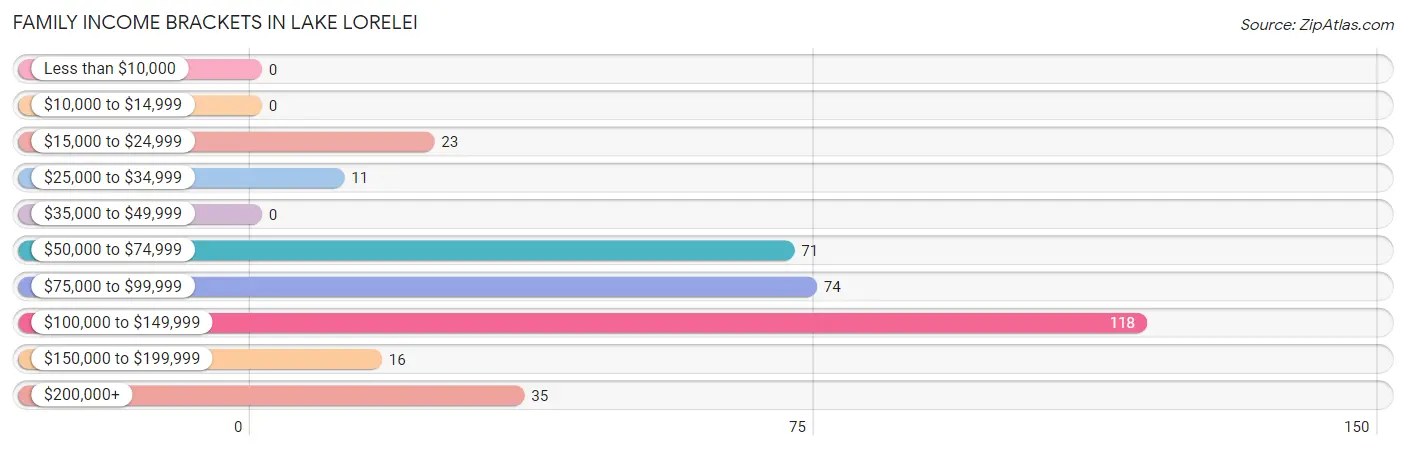
| Income Bracket | # Families | % Families |
| Less than $10,000 | 0 | 0.0% |
| $10,000 to $14,999 | 0 | 0.0% |
| $15,000 to $24,999 | 23 | 6.6% |
| $25,000 to $34,999 | 11 | 3.2% |
| $35,000 to $49,999 | 0 | 0.0% |
| $50,000 to $74,999 | 71 | 20.4% |
| $75,000 to $99,999 | 74 | 21.3% |
| $100,000 to $149,999 | 118 | 33.9% |
| $150,000 to $199,999 | 16 | 4.6% |
| $200,000+ | 35 | 10.1% |
Family Income by Famaliy Size in Lake Lorelei
3-person families (111 | 31.9%) account for the highest median family income in Lake Lorelei with $119,358 per family, while 2-person families (177 | 50.9%) have the highest median income of $45,276 per family member.
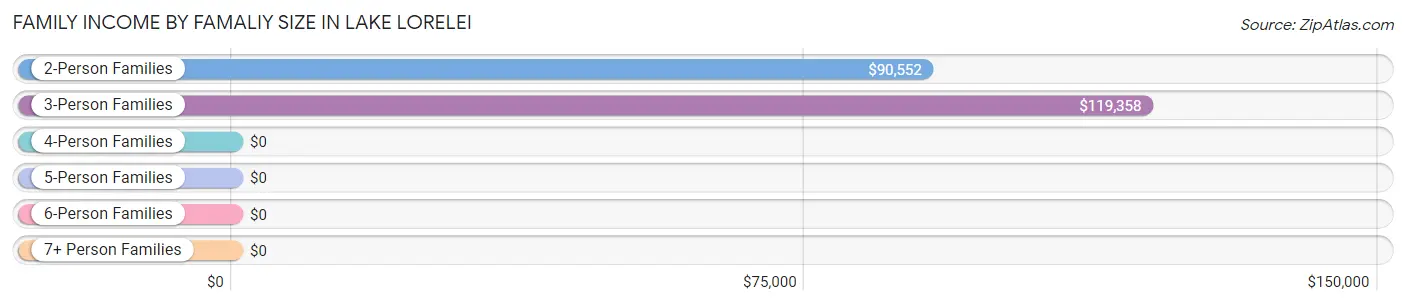
| Income Bracket | # Families | Median Income |
| 2-Person Families | 177 (50.9%) | $90,552 |
| 3-Person Families | 111 (31.9%) | $119,358 |
| 4-Person Families | 14 (4.0%) | $0 |
| 5-Person Families | 0 (0.0%) | $0 |
| 6-Person Families | 35 (10.1%) | $0 |
| 7+ Person Families | 11 (3.2%) | $0 |
| Total | 348 (100.0%) | $93,214 |
Family Income by Number of Earners in Lake Lorelei
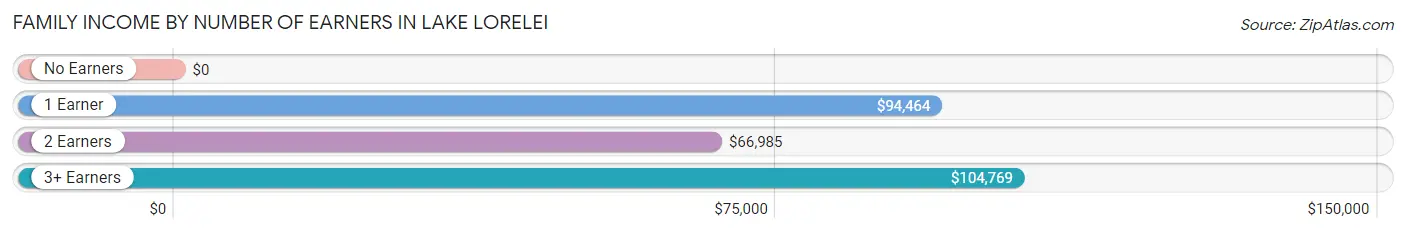
| Number of Earners | # Families | Median Income |
| No Earners | 35 (10.1%) | $0 |
| 1 Earner | 193 (55.5%) | $94,464 |
| 2 Earners | 71 (20.4%) | $66,985 |
| 3+ Earners | 49 (14.1%) | $104,769 |
| Total | 348 (100.0%) | $93,214 |
Household Income in Lake Lorelei
Household Income Brackets in Lake Lorelei
With 150 households falling in the category, the $100,000 to $149,999 income range is the most frequent in Lake Lorelei, accounting for 31.9% of all households.
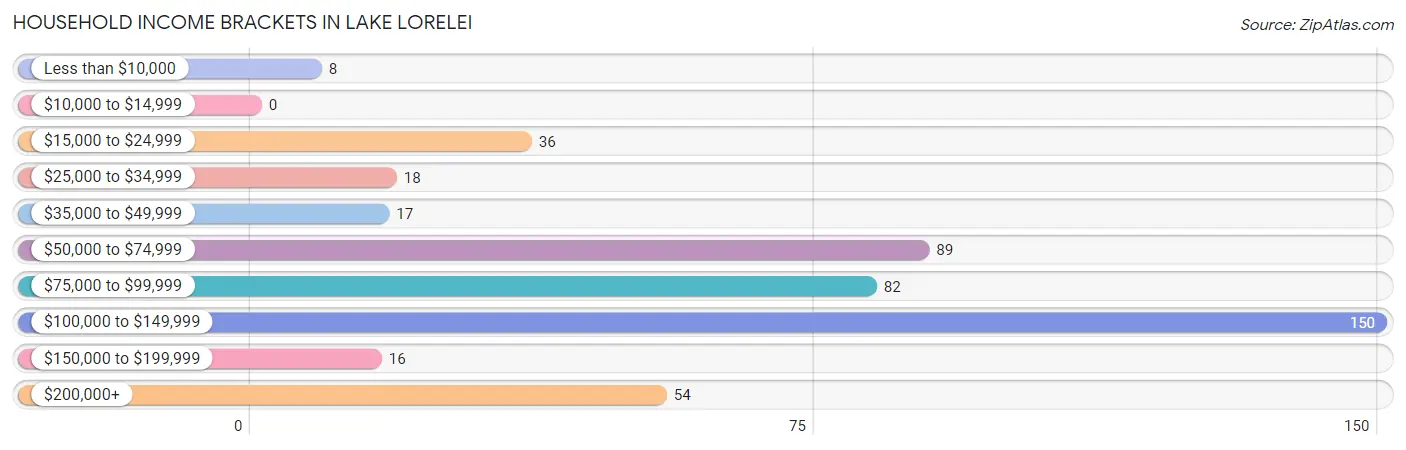
| Income Bracket | # Households | % Households |
| Less than $10,000 | 8 | 1.7% |
| $10,000 to $14,999 | 0 | 0.0% |
| $15,000 to $24,999 | 36 | 7.7% |
| $25,000 to $34,999 | 18 | 3.8% |
| $35,000 to $49,999 | 17 | 3.6% |
| $50,000 to $74,999 | 89 | 18.9% |
| $75,000 to $99,999 | 82 | 17.4% |
| $100,000 to $149,999 | 150 | 31.9% |
| $150,000 to $199,999 | 16 | 3.4% |
| $200,000+ | 54 | 11.5% |
Household Income by Householder Age in Lake Lorelei
The median household income in Lake Lorelei is $92,108, with the highest median household income of $117,568 found in the 45 to 64 years age bracket for the primary householder. A total of 148 households (31.5%) fall into this category. Meanwhile, the 15 to 24 years age bracket for the primary householder has the lowest median household income of $0, with 11 households (2.3%) in this group.
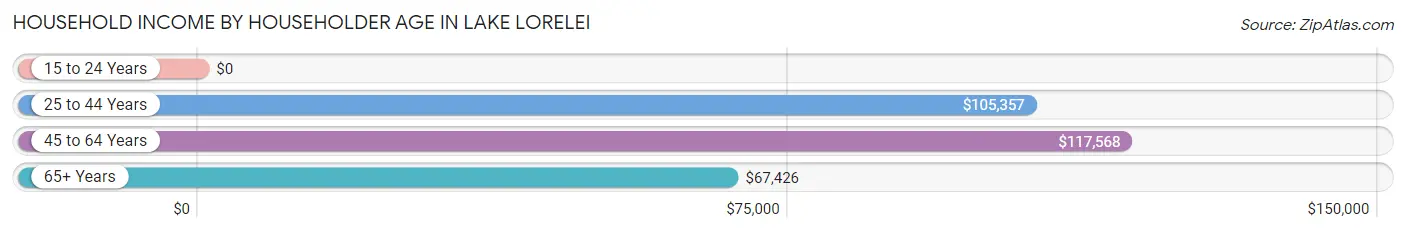
| Income Bracket | # Households | Median Income |
| 15 to 24 Years | 11 (2.3%) | $0 |
| 25 to 44 Years | 80 (17.0%) | $105,357 |
| 45 to 64 Years | 148 (31.5%) | $117,568 |
| 65+ Years | 231 (49.1%) | $67,426 |
| Total | 470 (100.0%) | $92,108 |
Poverty in Lake Lorelei
Income Below Poverty by Sex and Age in Lake Lorelei
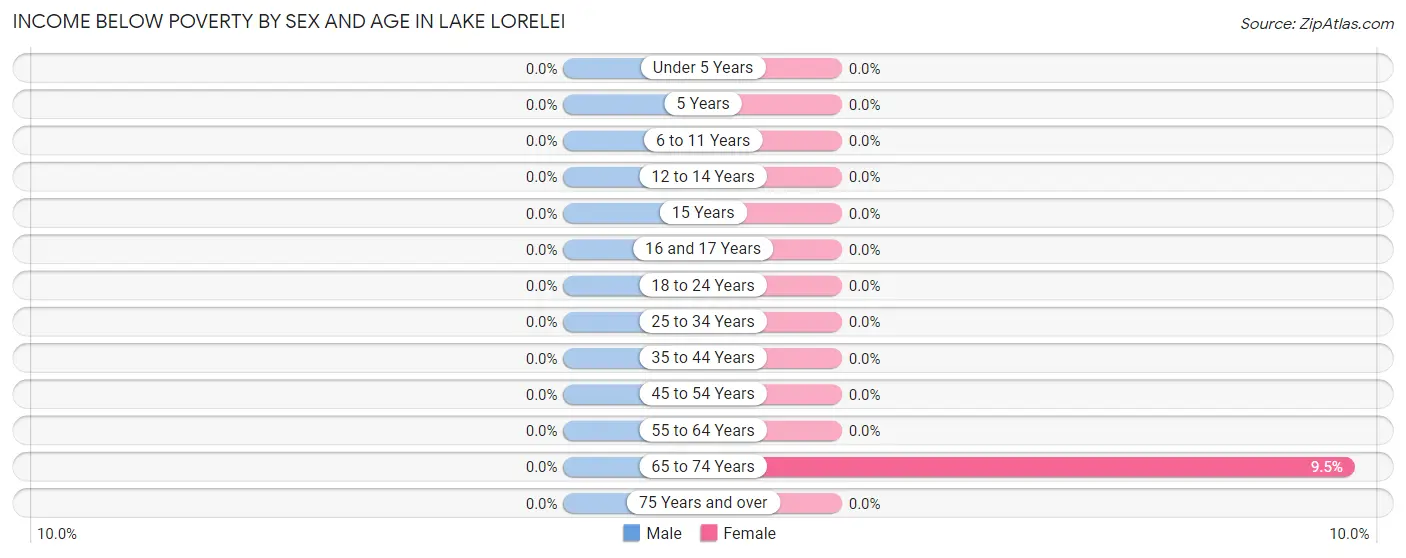
| Age Bracket | Male | Female |
| Under 5 Years | 0 (0.0%) | 0 (0.0%) |
| 5 Years | 0 (0.0%) | 0 (0.0%) |
| 6 to 11 Years | 0 (0.0%) | 0 (0.0%) |
| 12 to 14 Years | 0 (0.0%) | 0 (0.0%) |
| 15 Years | 0 (0.0%) | 0 (0.0%) |
| 16 and 17 Years | 0 (0.0%) | 0 (0.0%) |
| 18 to 24 Years | 0 (0.0%) | 0 (0.0%) |
| 25 to 34 Years | 0 (0.0%) | 0 (0.0%) |
| 35 to 44 Years | 0 (0.0%) | 0 (0.0%) |
| 45 to 54 Years | 0 (0.0%) | 0 (0.0%) |
| 55 to 64 Years | 0 (0.0%) | 0 (0.0%) |
| 65 to 74 Years | 0 (0.0%) | 8 (9.5%) |
| 75 Years and over | 0 (0.0%) | 0 (0.0%) |
| Total | 0 (0.0%) | 8 (1.3%) |
Income Above Poverty by Sex and Age in Lake Lorelei
According to the poverty statistics in Lake Lorelei, males aged under 5 years and females aged under 5 years are the age groups that are most secure financially, with 100.0% of males and 100.0% of females in these age groups living above the poverty line.
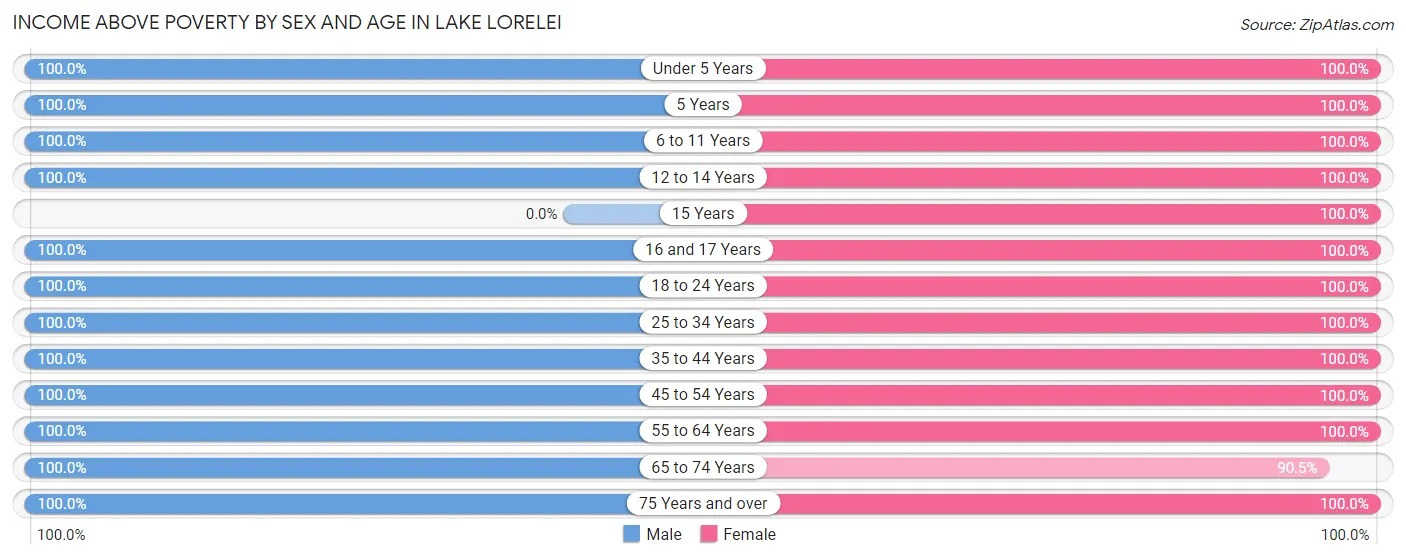
| Age Bracket | Male | Female |
| Under 5 Years | 22 (100.0%) | 31 (100.0%) |
| 5 Years | 26 (100.0%) | 23 (100.0%) |
| 6 to 11 Years | 14 (100.0%) | 30 (100.0%) |
| 12 to 14 Years | 9 (100.0%) | 9 (100.0%) |
| 15 Years | 0 (0.0%) | 35 (100.0%) |
| 16 and 17 Years | 25 (100.0%) | 9 (100.0%) |
| 18 to 24 Years | 12 (100.0%) | 37 (100.0%) |
| 25 to 34 Years | 36 (100.0%) | 21 (100.0%) |
| 35 to 44 Years | 70 (100.0%) | 87 (100.0%) |
| 45 to 54 Years | 18 (100.0%) | 79 (100.0%) |
| 55 to 64 Years | 119 (100.0%) | 112 (100.0%) |
| 65 to 74 Years | 164 (100.0%) | 76 (90.5%) |
| 75 Years and over | 23 (100.0%) | 48 (100.0%) |
| Total | 538 (100.0%) | 597 (98.7%) |
Income Below Poverty Among Married-Couple Families in Lake Lorelei
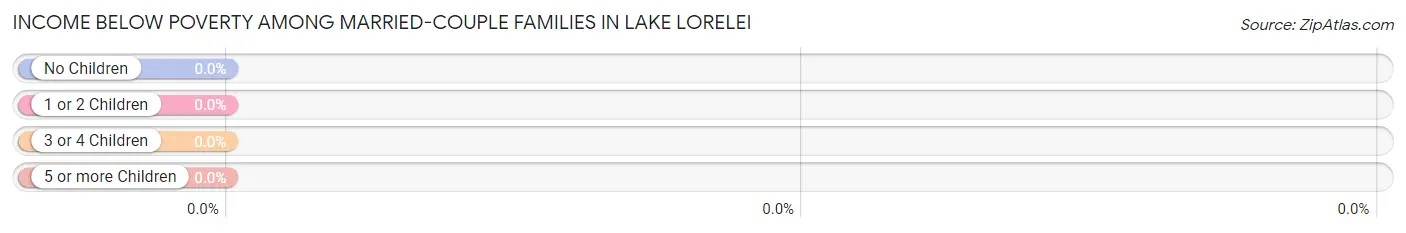
| Children | Above Poverty | Below Poverty |
| No Children | 221 (100.0%) | 0 (0.0%) |
| 1 or 2 Children | 19 (100.0%) | 0 (0.0%) |
| 3 or 4 Children | 46 (100.0%) | 0 (0.0%) |
| 5 or more Children | 0 (0.0%) | 0 (0.0%) |
| Total | 286 (100.0%) | 0 (0.0%) |
Income Below Poverty Among Single-Parent Households in Lake Lorelei
| Children | Single Father | Single Mother |
| No Children | 0 (0.0%) | 0 (0.0%) |
| 1 or 2 Children | 0 (0.0%) | 0 (0.0%) |
| 3 or 4 Children | 0 (0.0%) | 0 (0.0%) |
| 5 or more Children | 0 (0.0%) | 0 (0.0%) |
| Total | 0 (0.0%) | 0 (0.0%) |
Income Below Poverty Among Married-Couple vs Single-Parent Households in Lake Lorelei
| Children | Married-Couple Families | Single-Parent Households |
| No Children | 0 (0.0%) | 0 (0.0%) |
| 1 or 2 Children | 0 (0.0%) | 0 (0.0%) |
| 3 or 4 Children | 0 (0.0%) | 0 (0.0%) |
| 5 or more Children | 0 (0.0%) | 0 (0.0%) |
| Total | 0 (0.0%) | 0 (0.0%) |
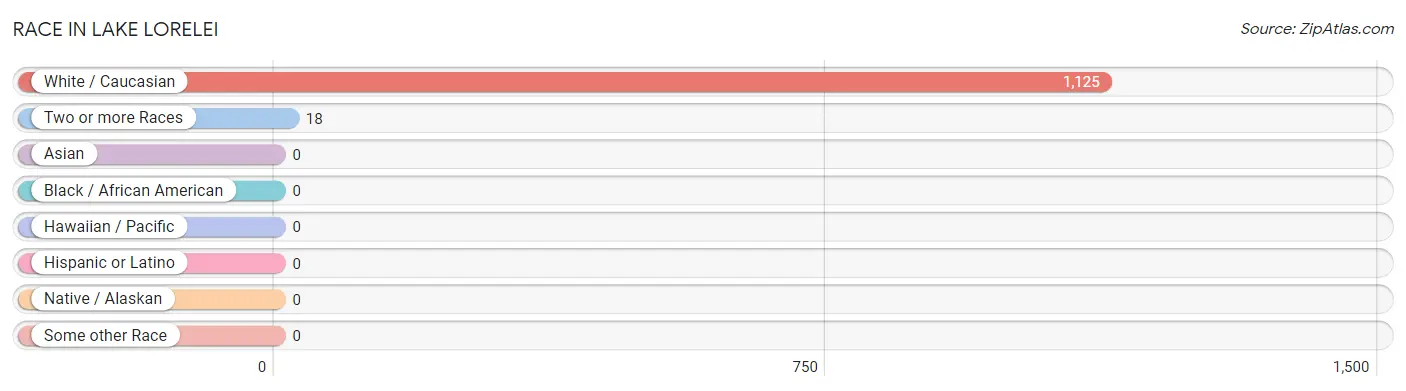
Race in Lake Lorelei
The most populous races in Lake Lorelei are White / Caucasian (1,125 | 98.4%), and Two or more Races (18 | 1.6%).
| Race | # Population | % Population |
| Asian | 0 | 0.0% |
| Black / African American | 0 | 0.0% |
| Hawaiian / Pacific | 0 | 0.0% |
| Hispanic or Latino | 0 | 0.0% |
| Native / Alaskan | 0 | 0.0% |
| White / Caucasian | 1,125 | 98.4% |
| Two or more Races | 18 | 1.6% |
| Some other Race | 0 | 0.0% |
| Total | 1,143 | 100.0% |
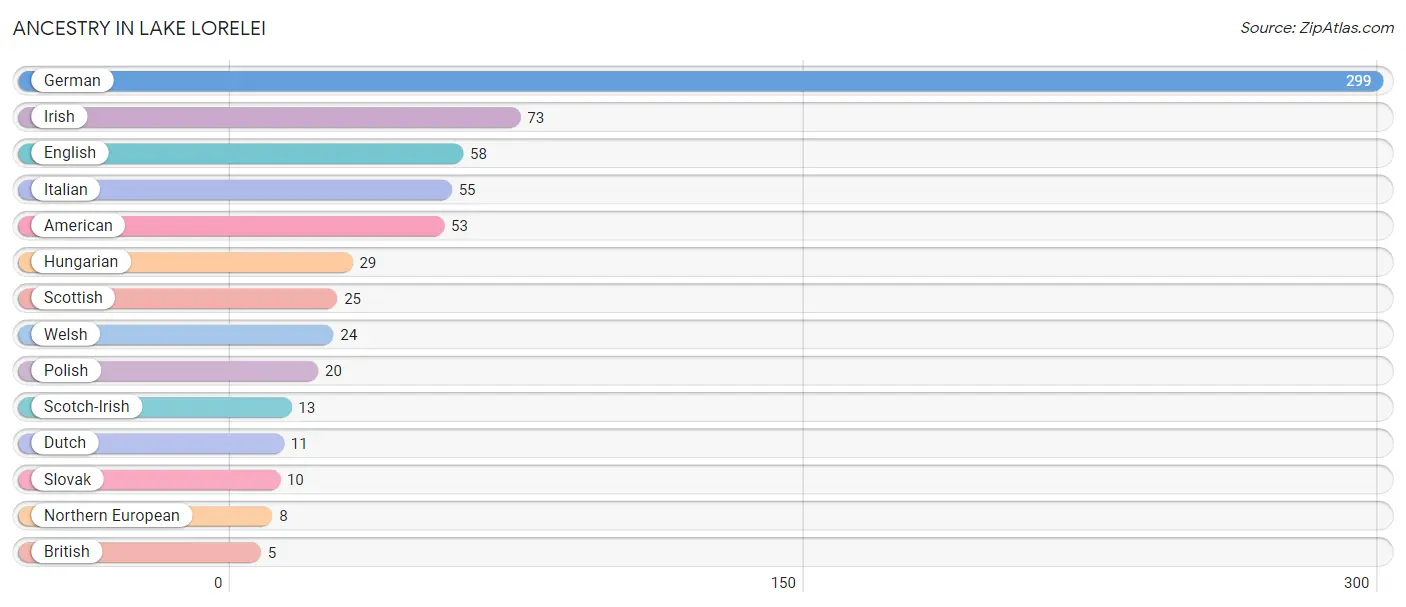
Ancestry in Lake Lorelei
The most populous ancestries reported in Lake Lorelei are German (299 | 26.2%), Irish (73 | 6.4%), English (58 | 5.1%), Italian (55 | 4.8%), and American (53 | 4.6%), together accounting for 47.1% of all Lake Lorelei residents.
| Ancestry | # Population | % Population |
| American | 53 | 4.6% |
| British | 5 | 0.4% |
| Dutch | 11 | 1.0% |
| English | 58 | 5.1% |
| German | 299 | 26.2% |
| Hungarian | 29 | 2.5% |
| Irish | 73 | 6.4% |
| Italian | 55 | 4.8% |
| Northern European | 8 | 0.7% |
| Polish | 20 | 1.8% |
| Scotch-Irish | 13 | 1.1% |
| Scottish | 25 | 2.2% |
| Slovak | 10 | 0.9% |
| Welsh | 24 | 2.1% | View All 14 Rows |
Immigrants in Lake Lorelei

| Immigration Origin | # Population | % Population | View All 0 Rows |
Sex and Age in Lake Lorelei
Sex and Age in Lake Lorelei
The most populous age groups in Lake Lorelei are 70 to 74 Years (107 | 19.9%) for men and 15 to 19 Years (70 | 11.6%) for women.
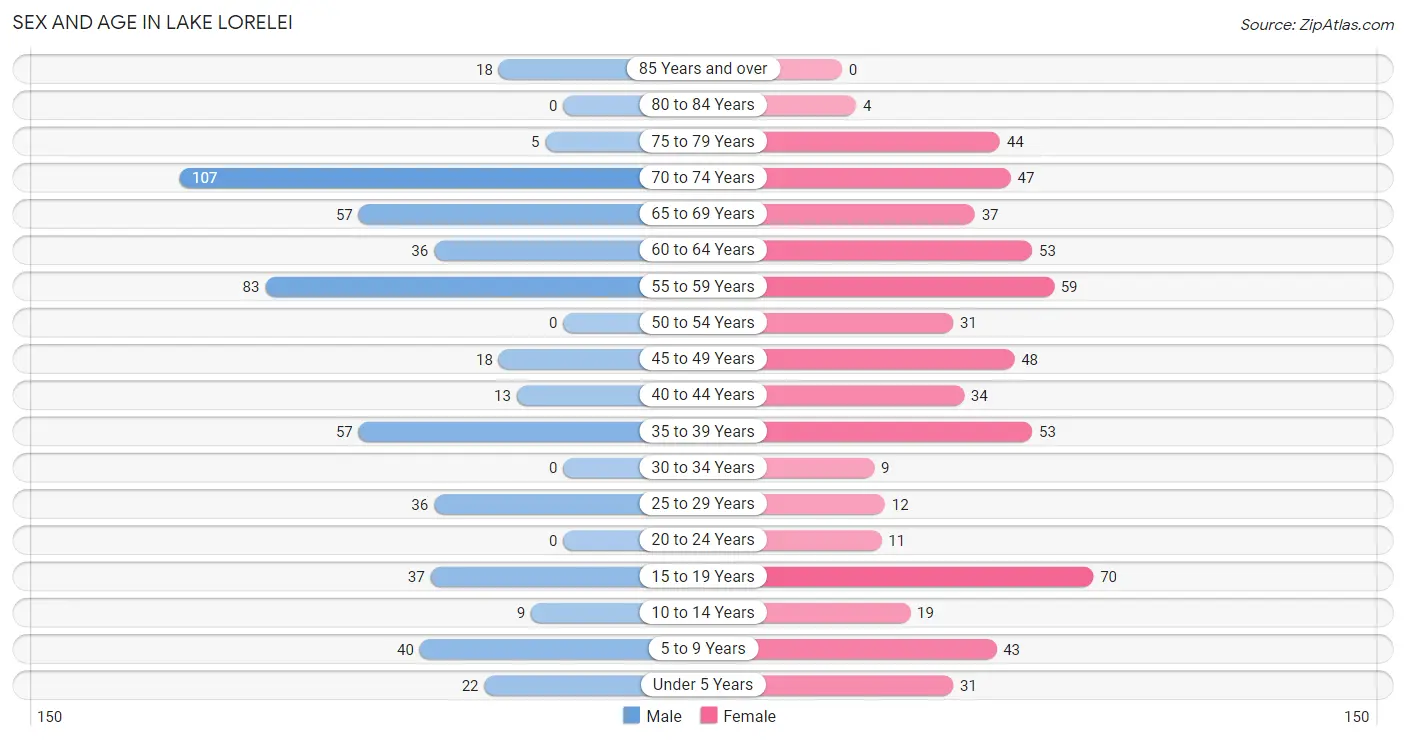
| Age Bracket | Male | Female |
| Under 5 Years | 22 (4.1%) | 31 (5.1%) |
| 5 to 9 Years | 40 (7.4%) | 43 (7.1%) |
| 10 to 14 Years | 9 (1.7%) | 19 (3.1%) |
| 15 to 19 Years | 37 (6.9%) | 70 (11.6%) |
| 20 to 24 Years | 0 (0.0%) | 11 (1.8%) |
| 25 to 29 Years | 36 (6.7%) | 12 (2.0%) |
| 30 to 34 Years | 0 (0.0%) | 9 (1.5%) |
| 35 to 39 Years | 57 (10.6%) | 53 (8.8%) |
| 40 to 44 Years | 13 (2.4%) | 34 (5.6%) |
| 45 to 49 Years | 18 (3.4%) | 48 (7.9%) |
| 50 to 54 Years | 0 (0.0%) | 31 (5.1%) |
| 55 to 59 Years | 83 (15.4%) | 59 (9.8%) |
| 60 to 64 Years | 36 (6.7%) | 53 (8.8%) |
| 65 to 69 Years | 57 (10.6%) | 37 (6.1%) |
| 70 to 74 Years | 107 (19.9%) | 47 (7.8%) |
| 75 to 79 Years | 5 (0.9%) | 44 (7.3%) |
| 80 to 84 Years | 0 (0.0%) | 4 (0.7%) |
| 85 Years and over | 18 (3.4%) | 0 (0.0%) |
| Total | 538 (100.0%) | 605 (100.0%) |
Families and Households in Lake Lorelei
Median Family Size in Lake Lorelei
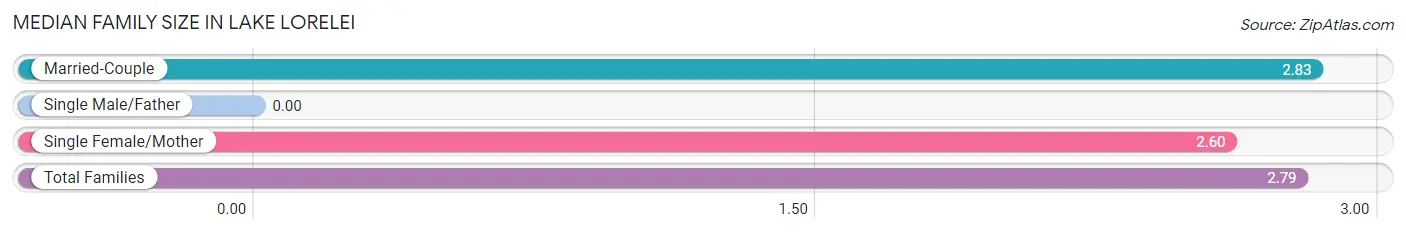
| Family Type | # Families | Family Size |
| Married-Couple | 286 (82.2%) | 2.83 |
| Single Male/Father | 0 (0.0%) | - |
| Single Female/Mother | 62 (17.8%) | 2.60 |
| Total Families | 348 (100.0%) | 2.79 |
Median Household Size in Lake Lorelei
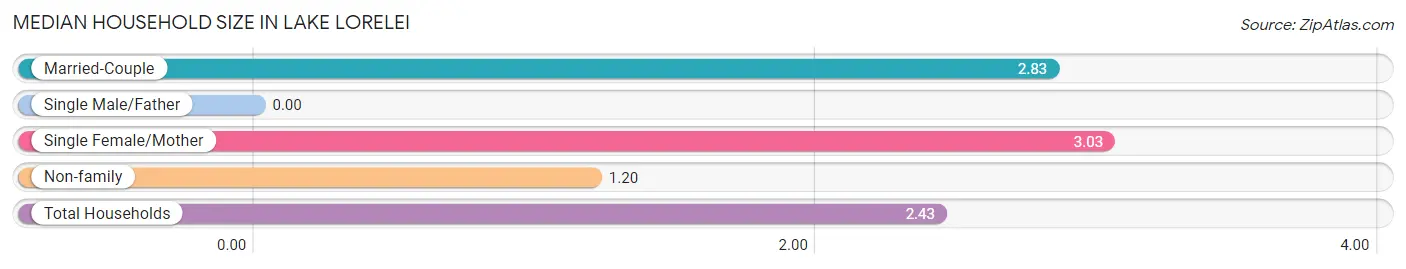
| Household Type | # Households | Household Size |
| Married-Couple | 286 (60.9%) | 2.83 |
| Single Male/Father | 0 (0.0%) | - |
| Single Female/Mother | 62 (13.2%) | 3.03 |
| Non-family | 122 (26.0%) | 1.20 |
| Total Households | 470 (100.0%) | 2.43 |
Household Size by Marriage Status in Lake Lorelei
Out of a total of 470 households in Lake Lorelei, 348 (74.0%) are family households, while 122 (26.0%) are nonfamily households. The most numerous type of family households are 2-person households, comprising 177, and the most common type of nonfamily households are 1-person households, comprising 94.
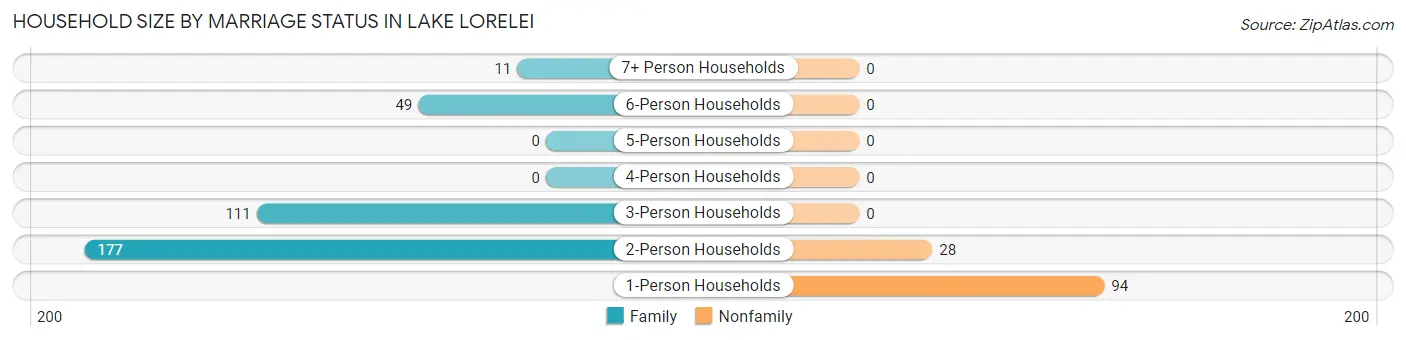
| Household Size | Family Households | Nonfamily Households |
| 1-Person Households | - | 94 (20.0%) |
| 2-Person Households | 177 (37.7%) | 28 (6.0%) |
| 3-Person Households | 111 (23.6%) | 0 (0.0%) |
| 4-Person Households | 0 (0.0%) | 0 (0.0%) |
| 5-Person Households | 0 (0.0%) | 0 (0.0%) |
| 6-Person Households | 49 (10.4%) | 0 (0.0%) |
| 7+ Person Households | 11 (2.3%) | 0 (0.0%) |
| Total | 348 (74.0%) | 122 (26.0%) |
Female Fertility in Lake Lorelei
Fertility by Age in Lake Lorelei
Average fertility rate in Lake Lorelei is 16.0 births per 1,000 women. Women in the age bracket of 20 to 34 years have the highest fertility rate with 125.0 births per 1,000 women. Women in the age bracket of 20 to 34 years acount for 100.0% of all women with births.
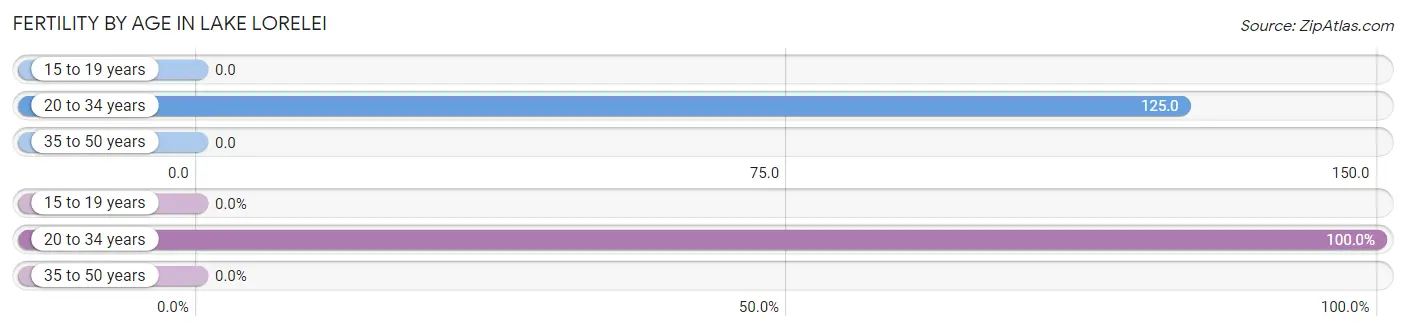
| Age Bracket | Women with Births | Births / 1,000 Women |
| 15 to 19 years | 0 (0.0%) | 0.0 |
| 20 to 34 years | 4 (100.0%) | 125.0 |
| 35 to 50 years | 0 (0.0%) | 0.0 |
| Total | 4 (100.0%) | 16.0 |
Fertility by Age by Marriage Status in Lake Lorelei
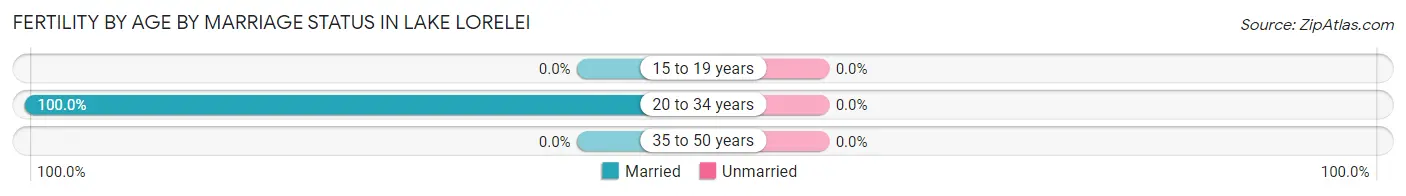
| Age Bracket | Married | Unmarried |
| 15 to 19 years | 0 (0.0%) | 0 (0.0%) |
| 20 to 34 years | 4 (100.0%) | 0 (0.0%) |
| 35 to 50 years | 0 (0.0%) | 0 (0.0%) |
| Total | 4 (100.0%) | 0 (0.0%) |
Fertility by Education in Lake Lorelei
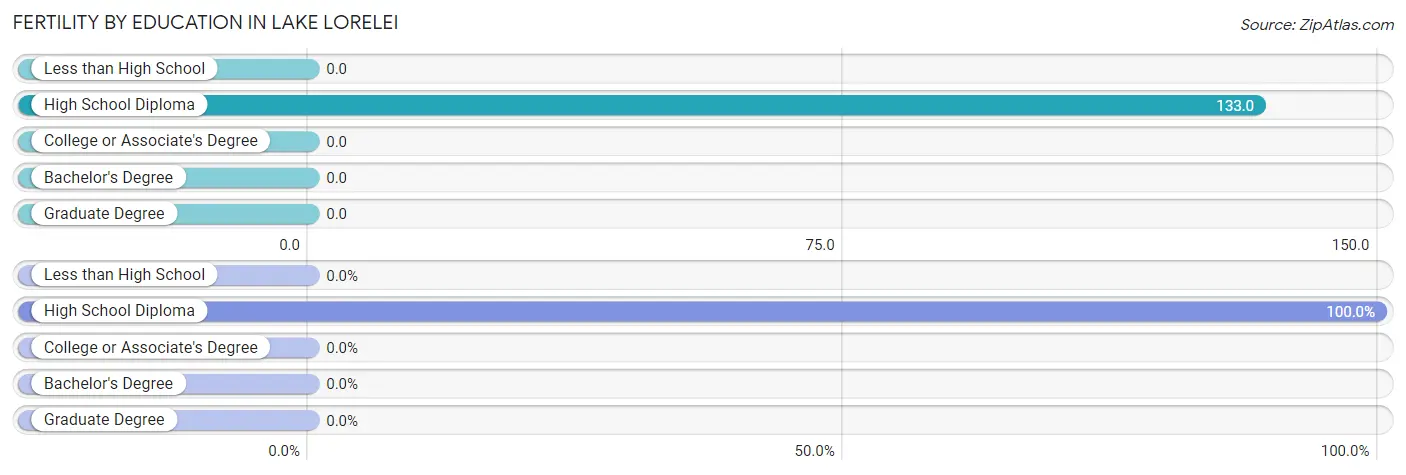
| Educational Attainment | Women with Births | Births / 1,000 Women |
| Less than High School | 0 (0.0%) | 0.0 |
| High School Diploma | 4 (100.0%) | 133.0 |
| College or Associate's Degree | 0 (0.0%) | 0.0 |
| Bachelor's Degree | 0 (0.0%) | 0.0 |
| Graduate Degree | 0 (0.0%) | 0.0 |
| Total | 4 (100.0%) | 16.0 |
Fertility by Education by Marriage Status in Lake Lorelei
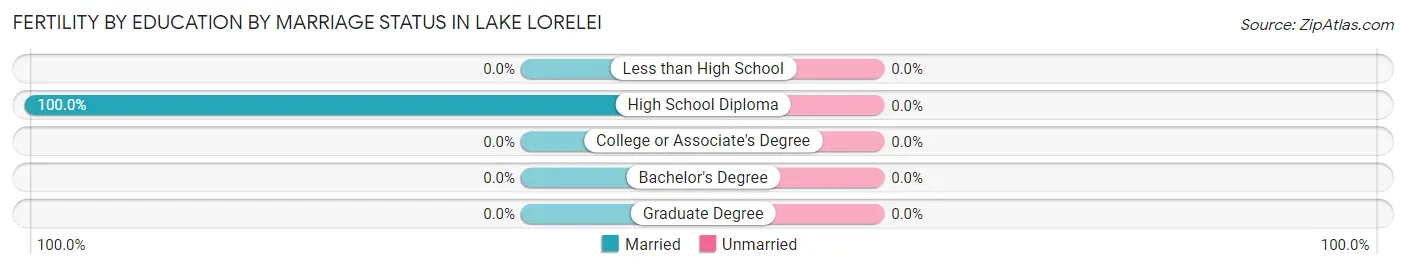
| Educational Attainment | Married | Unmarried |
| Less than High School | 0 (0.0%) | 0 (0.0%) |
| High School Diploma | 4 (100.0%) | 0 (0.0%) |
| College or Associate's Degree | 0 (0.0%) | 0 (0.0%) |
| Bachelor's Degree | 0 (0.0%) | 0 (0.0%) |
| Graduate Degree | 0 (0.0%) | 0 (0.0%) |
| Total | 4 (100.0%) | 0 (0.0%) |
Employment Characteristics in Lake Lorelei
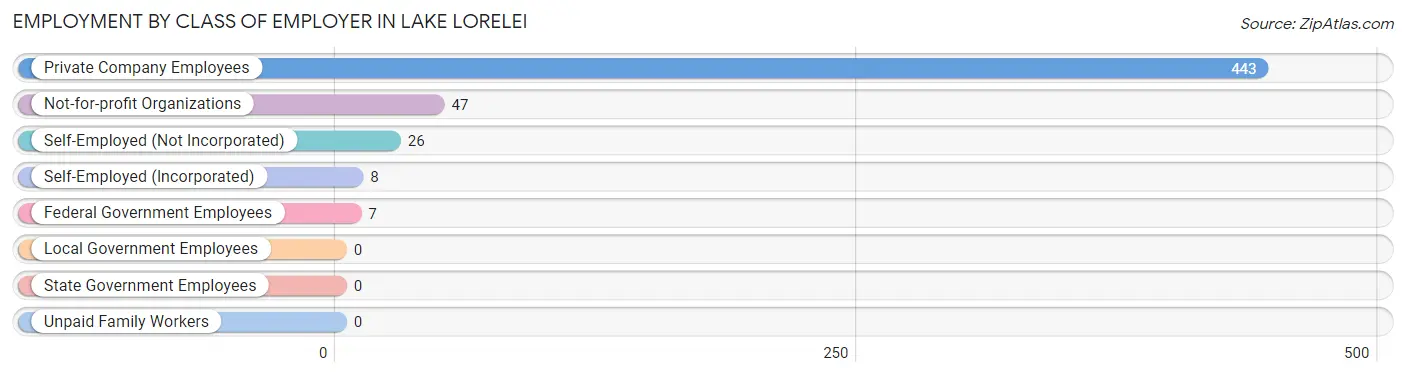
Employment by Class of Employer in Lake Lorelei
Among the 531 employed individuals in Lake Lorelei, private company employees (443 | 83.4%), not-for-profit organizations (47 | 8.8%), and self-employed (not incorporated) (26 | 4.9%) make up the most common classes of employment.
| Employer Class | # Employees | % Employees |
| Private Company Employees | 443 | 83.4% |
| Self-Employed (Incorporated) | 8 | 1.5% |
| Self-Employed (Not Incorporated) | 26 | 4.9% |
| Not-for-profit Organizations | 47 | 8.8% |
| Local Government Employees | 0 | 0.0% |
| State Government Employees | 0 | 0.0% |
| Federal Government Employees | 7 | 1.3% |
| Unpaid Family Workers | 0 | 0.0% |
| Total | 531 | 100.0% |
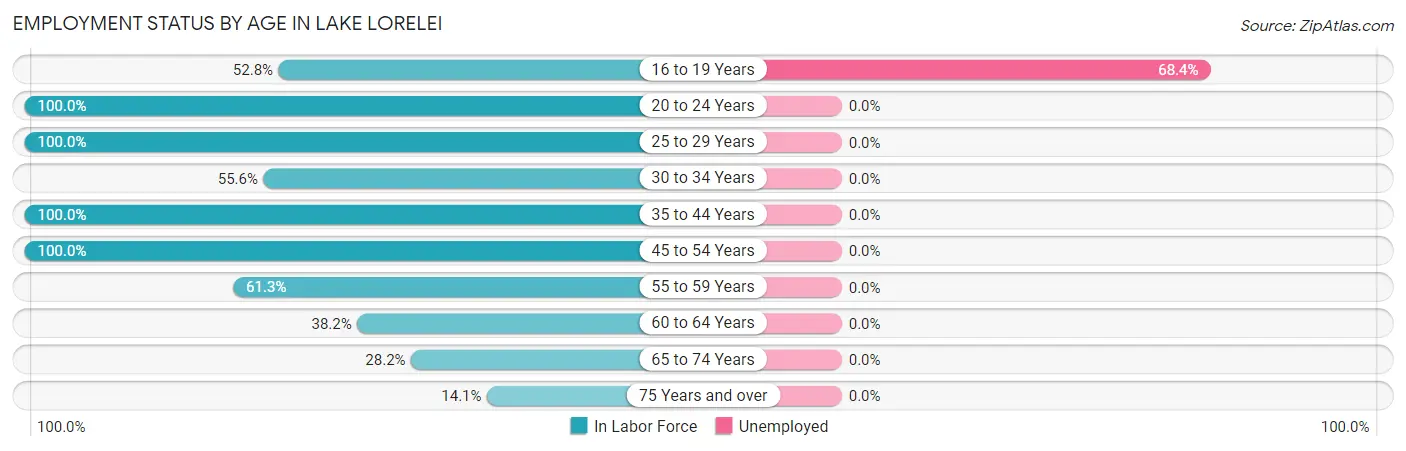
Employment Status by Age in Lake Lorelei
According to the labor force statistics for Lake Lorelei, out of the total population over 16 years of age (944), 59.0% or 557 individuals are in the labor force, with 4.7% or 26 of them unemployed. The age group with the highest labor force participation rate is 20 to 24 years, with 100.0% or 11 individuals in the labor force. Within the labor force, the 16 to 19 years age range has the highest percentage of unemployed individuals, with 68.4% or 26 of them being unemployed.
| Age Bracket | In Labor Force | Unemployed |
| 16 to 19 Years | 38 (52.8%) | 26 (68.4%) |
| 20 to 24 Years | 11 (100.0%) | 0 (0.0%) |
| 25 to 29 Years | 48 (100.0%) | 0 (0.0%) |
| 30 to 34 Years | 5 (55.6%) | 0 (0.0%) |
| 35 to 44 Years | 157 (100.0%) | 0 (0.0%) |
| 45 to 54 Years | 97 (100.0%) | 0 (0.0%) |
| 55 to 59 Years | 87 (61.3%) | 0 (0.0%) |
| 60 to 64 Years | 34 (38.2%) | 0 (0.0%) |
| 65 to 74 Years | 70 (28.2%) | 0 (0.0%) |
| 75 Years and over | 10 (14.1%) | 0 (0.0%) |
| Total | 557 (59.0%) | 26 (4.7%) |
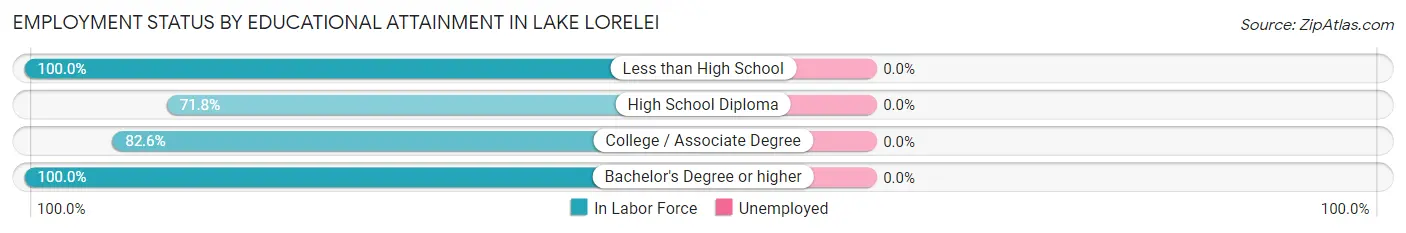
Employment Status by Educational Attainment in Lake Lorelei
| Educational Attainment | In Labor Force | Unemployed |
| Less than High School | 7 (100.0%) | 0 (0.0%) |
| High School Diploma | 206 (71.8%) | 0 (0.0%) |
| College / Associate Degree | 157 (82.6%) | 0 (0.0%) |
| Bachelor's Degree or higher | 58 (100.0%) | 0 (0.0%) |
| Total | 428 (79.0%) | 0 (0.0%) |
Employment Occupations by Sex in Lake Lorelei
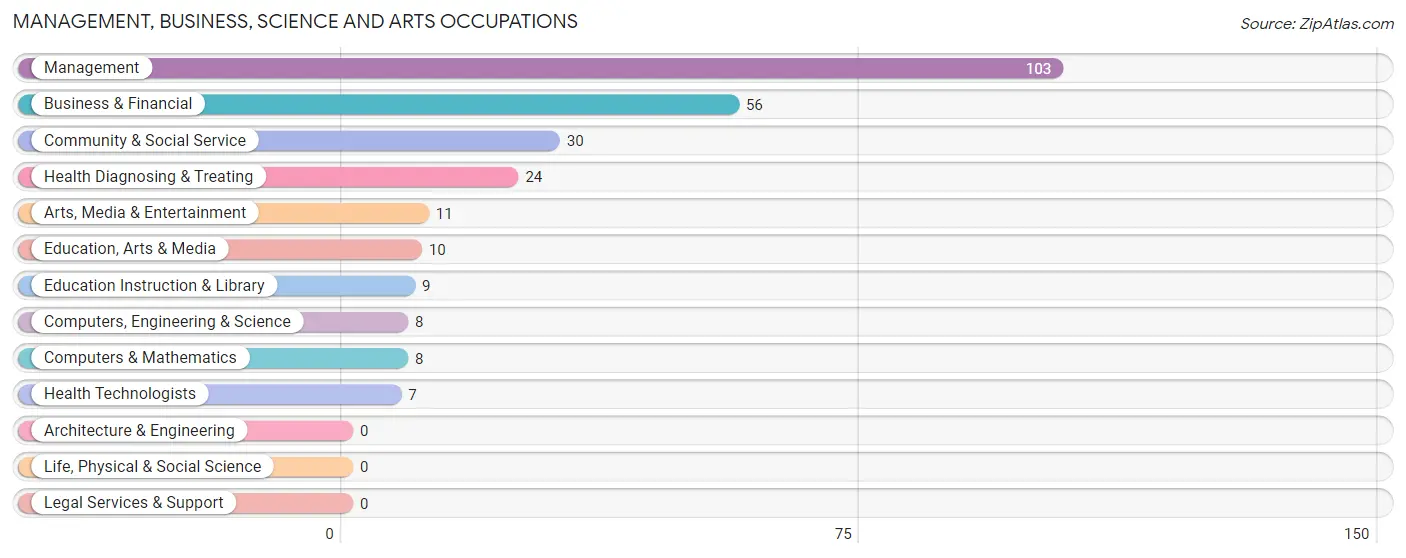
Management, Business, Science and Arts Occupations
The most common Management, Business, Science and Arts occupations in Lake Lorelei are Management (103 | 19.4%), Business & Financial (56 | 10.5%), Community & Social Service (30 | 5.7%), Health Diagnosing & Treating (24 | 4.5%), and Arts, Media & Entertainment (11 | 2.1%).
Management, Business, Science and Arts Occupations by Sex
Within the Management, Business, Science and Arts occupations in Lake Lorelei, the most male-oriented occupations are Business & Financial (91.1%), and Management (23.3%), while the most female-oriented occupations are Computers, Engineering & Science (100.0%), Computers & Mathematics (100.0%), and Community & Social Service (100.0%).
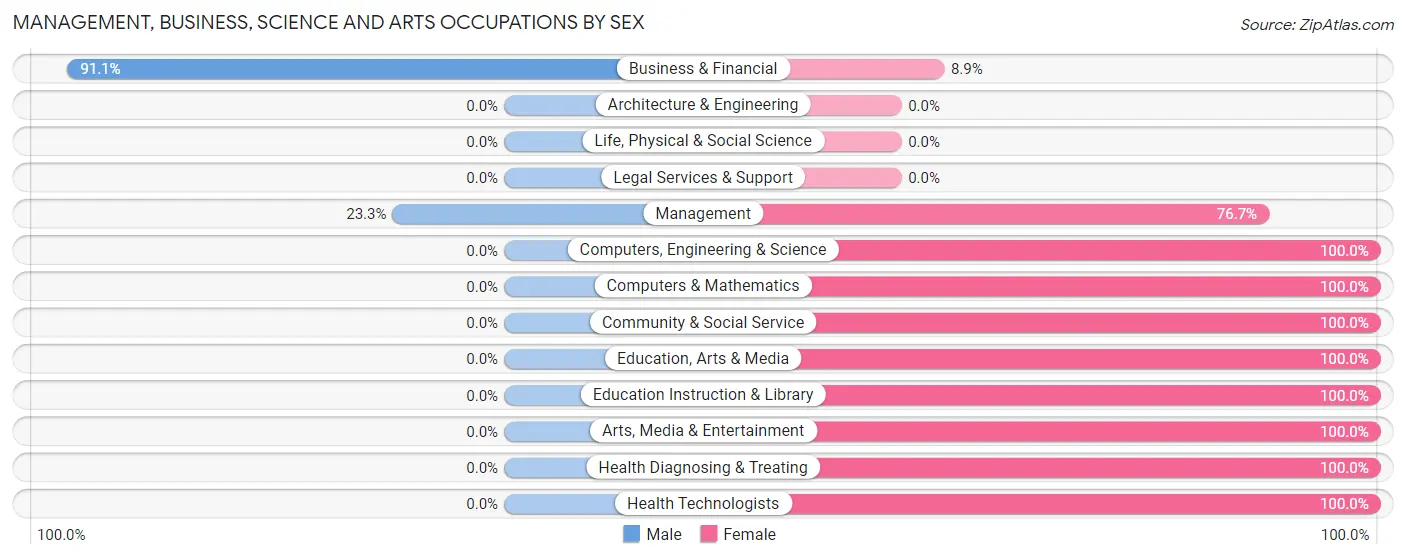
| Occupation | Male | Female |
| Management | 24 (23.3%) | 79 (76.7%) |
| Business & Financial | 51 (91.1%) | 5 (8.9%) |
| Computers, Engineering & Science | 0 (0.0%) | 8 (100.0%) |
| Computers & Mathematics | 0 (0.0%) | 8 (100.0%) |
| Architecture & Engineering | 0 (0.0%) | 0 (0.0%) |
| Life, Physical & Social Science | 0 (0.0%) | 0 (0.0%) |
| Community & Social Service | 0 (0.0%) | 30 (100.0%) |
| Education, Arts & Media | 0 (0.0%) | 10 (100.0%) |
| Legal Services & Support | 0 (0.0%) | 0 (0.0%) |
| Education Instruction & Library | 0 (0.0%) | 9 (100.0%) |
| Arts, Media & Entertainment | 0 (0.0%) | 11 (100.0%) |
| Health Diagnosing & Treating | 0 (0.0%) | 24 (100.0%) |
| Health Technologists | 0 (0.0%) | 7 (100.0%) |
| Total (Category) | 75 (33.9%) | 146 (66.1%) |
| Total (Overall) | 299 (56.3%) | 232 (43.7%) |
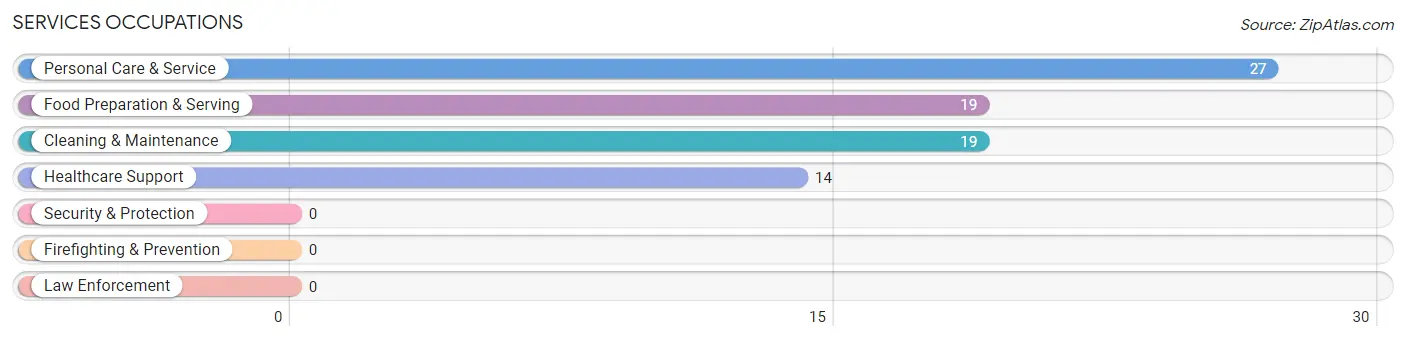
Services Occupations
The most common Services occupations in Lake Lorelei are Personal Care & Service (27 | 5.1%), Food Preparation & Serving (19 | 3.6%), Cleaning & Maintenance (19 | 3.6%), and Healthcare Support (14 | 2.6%).
Services Occupations by Sex
Within the Services occupations in Lake Lorelei, the most male-oriented occupations are Cleaning & Maintenance (100.0%), and Food Preparation & Serving (57.9%), while the most female-oriented occupations are Healthcare Support (100.0%), Personal Care & Service (100.0%), and Food Preparation & Serving (42.1%).
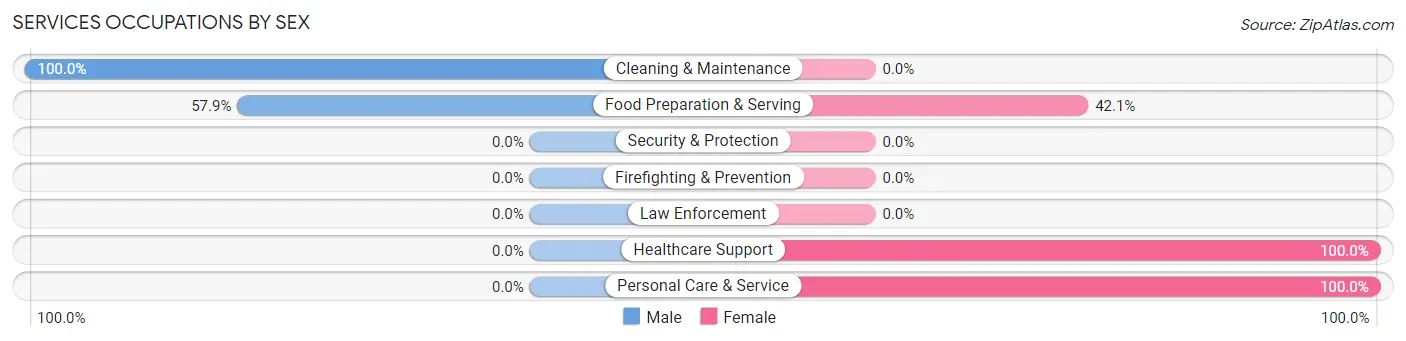
| Occupation | Male | Female |
| Healthcare Support | 0 (0.0%) | 14 (100.0%) |
| Security & Protection | 0 (0.0%) | 0 (0.0%) |
| Firefighting & Prevention | 0 (0.0%) | 0 (0.0%) |
| Law Enforcement | 0 (0.0%) | 0 (0.0%) |
| Food Preparation & Serving | 11 (57.9%) | 8 (42.1%) |
| Cleaning & Maintenance | 19 (100.0%) | 0 (0.0%) |
| Personal Care & Service | 0 (0.0%) | 27 (100.0%) |
| Total (Category) | 30 (38.0%) | 49 (62.0%) |
| Total (Overall) | 299 (56.3%) | 232 (43.7%) |
Sales and Office Occupations
The most common Sales and Office occupations in Lake Lorelei are Office & Administration (48 | 9.0%), and Sales & Related (20 | 3.8%).
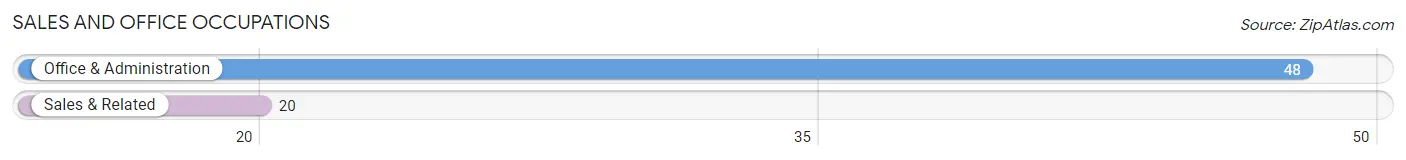
Sales and Office Occupations by Sex
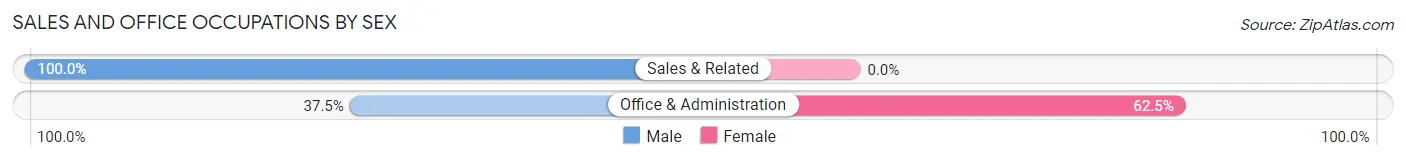
| Occupation | Male | Female |
| Sales & Related | 20 (100.0%) | 0 (0.0%) |
| Office & Administration | 18 (37.5%) | 30 (62.5%) |
| Total (Category) | 38 (55.9%) | 30 (44.1%) |
| Total (Overall) | 299 (56.3%) | 232 (43.7%) |
Natural Resources, Construction and Maintenance Occupations
The most common Natural Resources, Construction and Maintenance occupations in Lake Lorelei are , and Installation, Maintenance & Repair (7 | 1.3%).
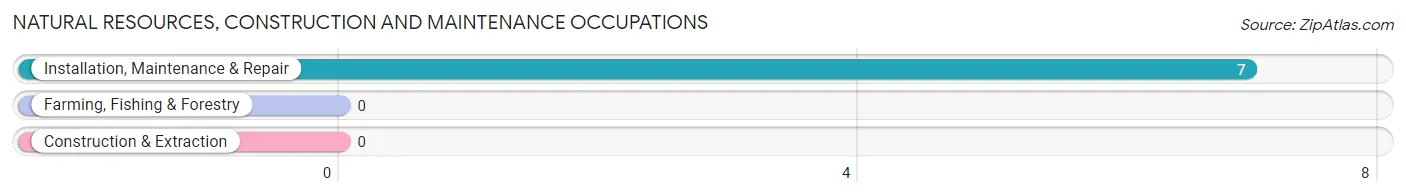
Natural Resources, Construction and Maintenance Occupations by Sex
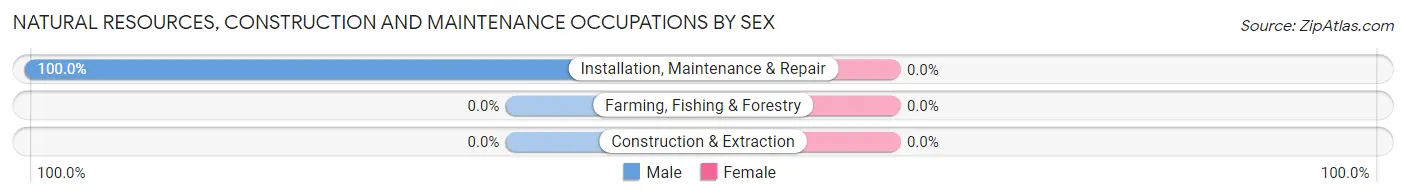
| Occupation | Male | Female |
| Farming, Fishing & Forestry | 0 (0.0%) | 0 (0.0%) |
| Construction & Extraction | 0 (0.0%) | 0 (0.0%) |
| Installation, Maintenance & Repair | 7 (100.0%) | 0 (0.0%) |
| Total (Category) | 7 (100.0%) | 0 (0.0%) |
| Total (Overall) | 299 (56.3%) | 232 (43.7%) |
Production, Transportation and Moving Occupations
The most common Production, Transportation and Moving occupations in Lake Lorelei are Production (72 | 13.6%), Transportation (59 | 11.1%), and Material Moving (25 | 4.7%).
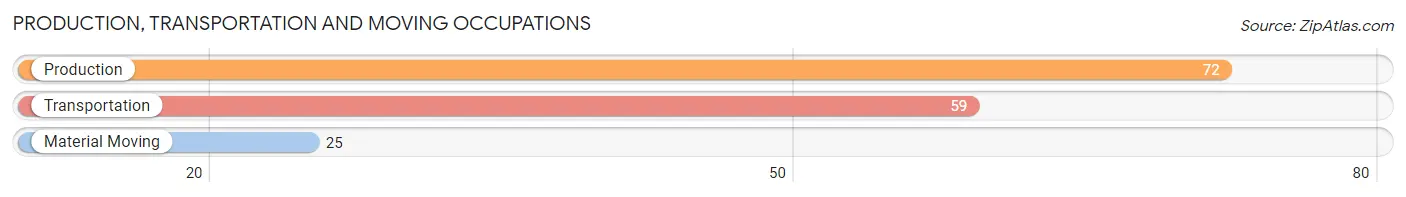
Production, Transportation and Moving Occupations by Sex
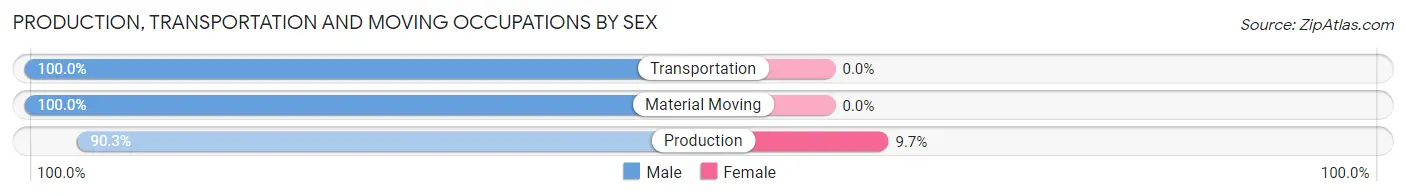
| Occupation | Male | Female |
| Production | 65 (90.3%) | 7 (9.7%) |
| Transportation | 59 (100.0%) | 0 (0.0%) |
| Material Moving | 25 (100.0%) | 0 (0.0%) |
| Total (Category) | 149 (95.5%) | 7 (4.5%) |
| Total (Overall) | 299 (56.3%) | 232 (43.7%) |
Employment Industries by Sex in Lake Lorelei
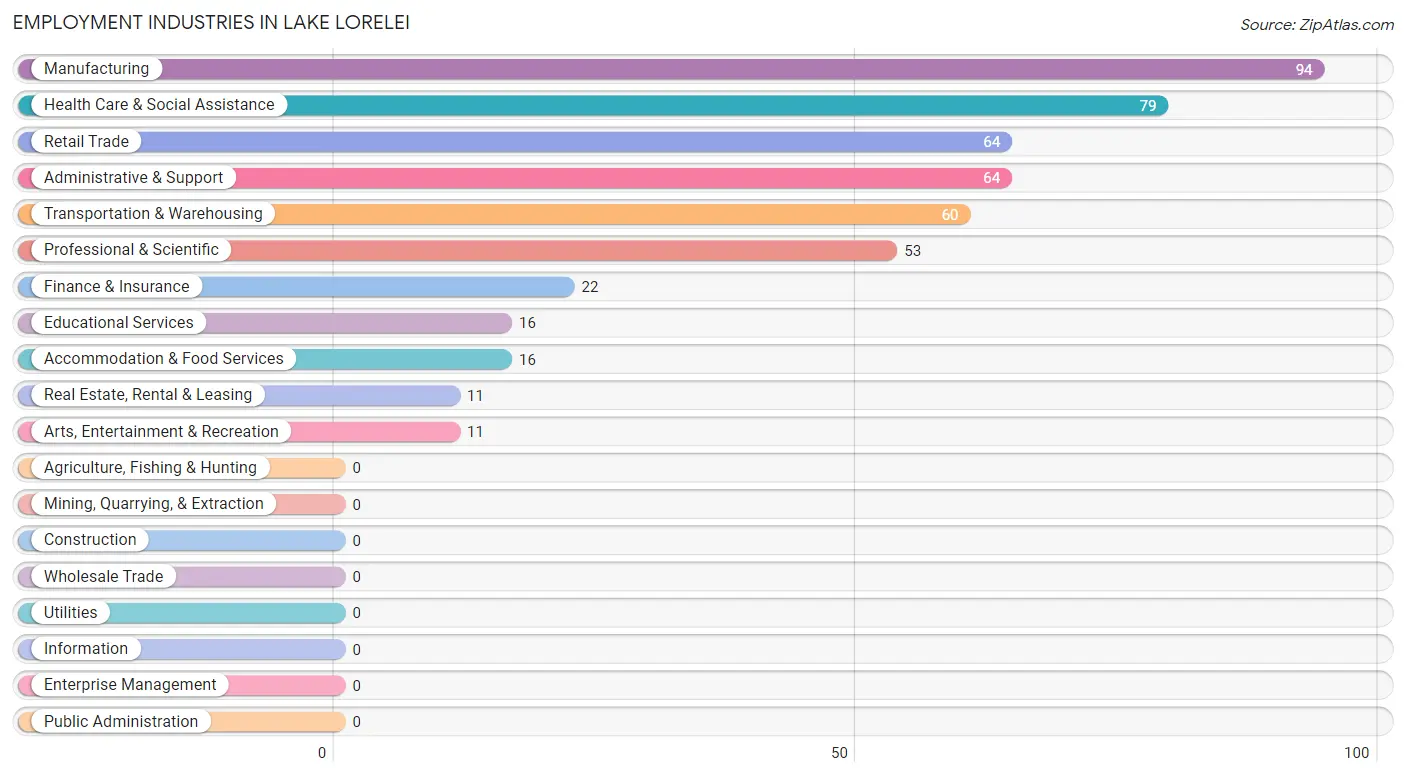
Employment Industries in Lake Lorelei
The major employment industries in Lake Lorelei include Manufacturing (94 | 17.7%), Health Care & Social Assistance (79 | 14.9%), Retail Trade (64 | 12.0%), Administrative & Support (64 | 12.0%), and Transportation & Warehousing (60 | 11.3%).
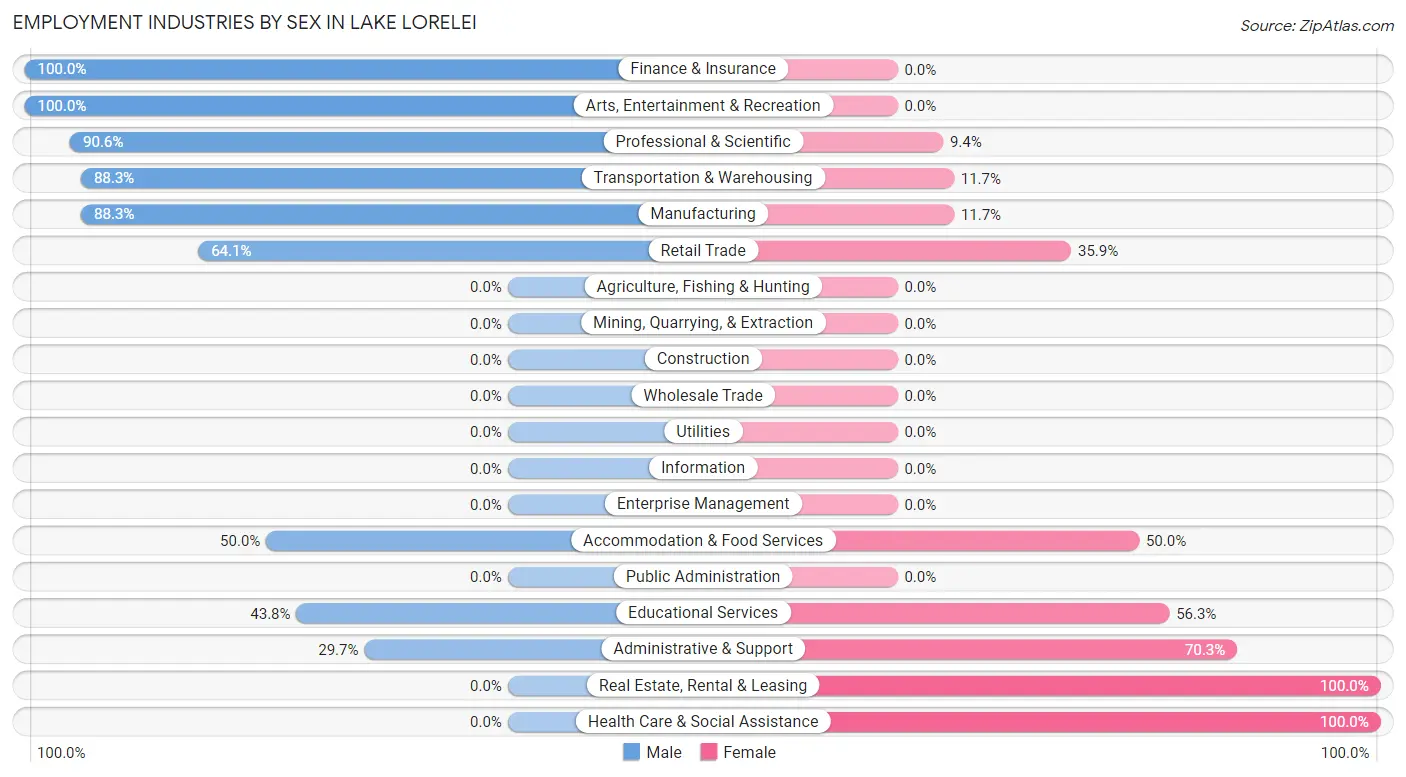
Employment Industries by Sex in Lake Lorelei
The Lake Lorelei industries that see more men than women are Finance & Insurance (100.0%), Arts, Entertainment & Recreation (100.0%), and Professional & Scientific (90.6%), whereas the industries that tend to have a higher number of women are Real Estate, Rental & Leasing (100.0%), Health Care & Social Assistance (100.0%), and Administrative & Support (70.3%).
| Industry | Male | Female |
| Agriculture, Fishing & Hunting | 0 (0.0%) | 0 (0.0%) |
| Mining, Quarrying, & Extraction | 0 (0.0%) | 0 (0.0%) |
| Construction | 0 (0.0%) | 0 (0.0%) |
| Manufacturing | 83 (88.3%) | 11 (11.7%) |
| Wholesale Trade | 0 (0.0%) | 0 (0.0%) |
| Retail Trade | 41 (64.1%) | 23 (35.9%) |
| Transportation & Warehousing | 53 (88.3%) | 7 (11.7%) |
| Utilities | 0 (0.0%) | 0 (0.0%) |
| Information | 0 (0.0%) | 0 (0.0%) |
| Finance & Insurance | 22 (100.0%) | 0 (0.0%) |
| Real Estate, Rental & Leasing | 0 (0.0%) | 11 (100.0%) |
| Professional & Scientific | 48 (90.6%) | 5 (9.4%) |
| Enterprise Management | 0 (0.0%) | 0 (0.0%) |
| Administrative & Support | 19 (29.7%) | 45 (70.3%) |
| Educational Services | 7 (43.8%) | 9 (56.2%) |
| Health Care & Social Assistance | 0 (0.0%) | 79 (100.0%) |
| Arts, Entertainment & Recreation | 11 (100.0%) | 0 (0.0%) |
| Accommodation & Food Services | 8 (50.0%) | 8 (50.0%) |
| Public Administration | 0 (0.0%) | 0 (0.0%) |
| Total | 299 (56.3%) | 232 (43.7%) |
Education in Lake Lorelei
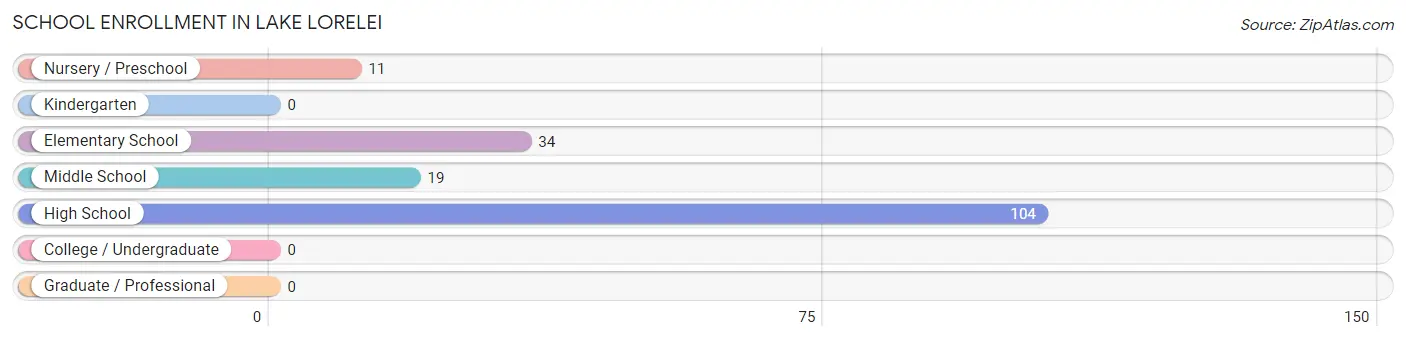
School Enrollment in Lake Lorelei
The most common levels of schooling among the 168 students in Lake Lorelei are high school (104 | 61.9%), elementary school (34 | 20.2%), and middle school (19 | 11.3%).
| School Level | # Students | % Students |
| Nursery / Preschool | 11 | 6.6% |
| Kindergarten | 0 | 0.0% |
| Elementary School | 34 | 20.2% |
| Middle School | 19 | 11.3% |
| High School | 104 | 61.9% |
| College / Undergraduate | 0 | 0.0% |
| Graduate / Professional | 0 | 0.0% |
| Total | 168 | 100.0% |
School Enrollment by Age by Funding Source in Lake Lorelei
Out of a total of 168 students who are enrolled in schools in Lake Lorelei, 8 (4.8%) attend a private institution, while the remaining 160 (95.2%) are enrolled in public schools. The age group of 15 to 17 year olds has the highest likelihood of being enrolled in private schools, with 8 (11.6% in the age bracket) enrolled. Conversely, the age group of 5 to 9 year old has the lowest likelihood of being enrolled in a private school, with 45 (100.0% in the age bracket) attending a public institution.
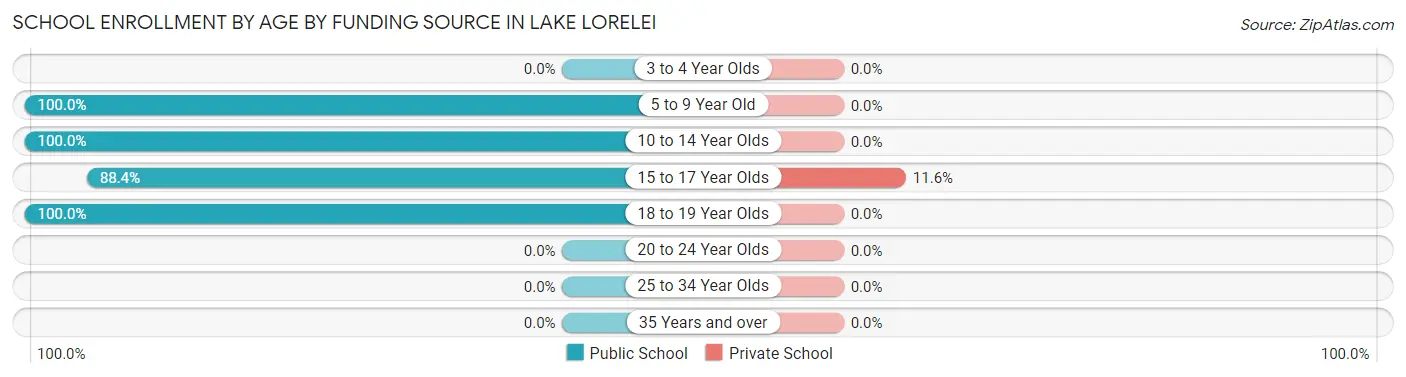
| Age Bracket | Public School | Private School |
| 3 to 4 Year Olds | 0 (0.0%) | 0 (0.0%) |
| 5 to 9 Year Old | 45 (100.0%) | 0 (0.0%) |
| 10 to 14 Year Olds | 28 (100.0%) | 0 (0.0%) |
| 15 to 17 Year Olds | 61 (88.4%) | 8 (11.6%) |
| 18 to 19 Year Olds | 26 (100.0%) | 0 (0.0%) |
| 20 to 24 Year Olds | 0 (0.0%) | 0 (0.0%) |
| 25 to 34 Year Olds | 0 (0.0%) | 0 (0.0%) |
| 35 Years and over | 0 (0.0%) | 0 (0.0%) |
| Total | 160 (95.2%) | 8 (4.8%) |
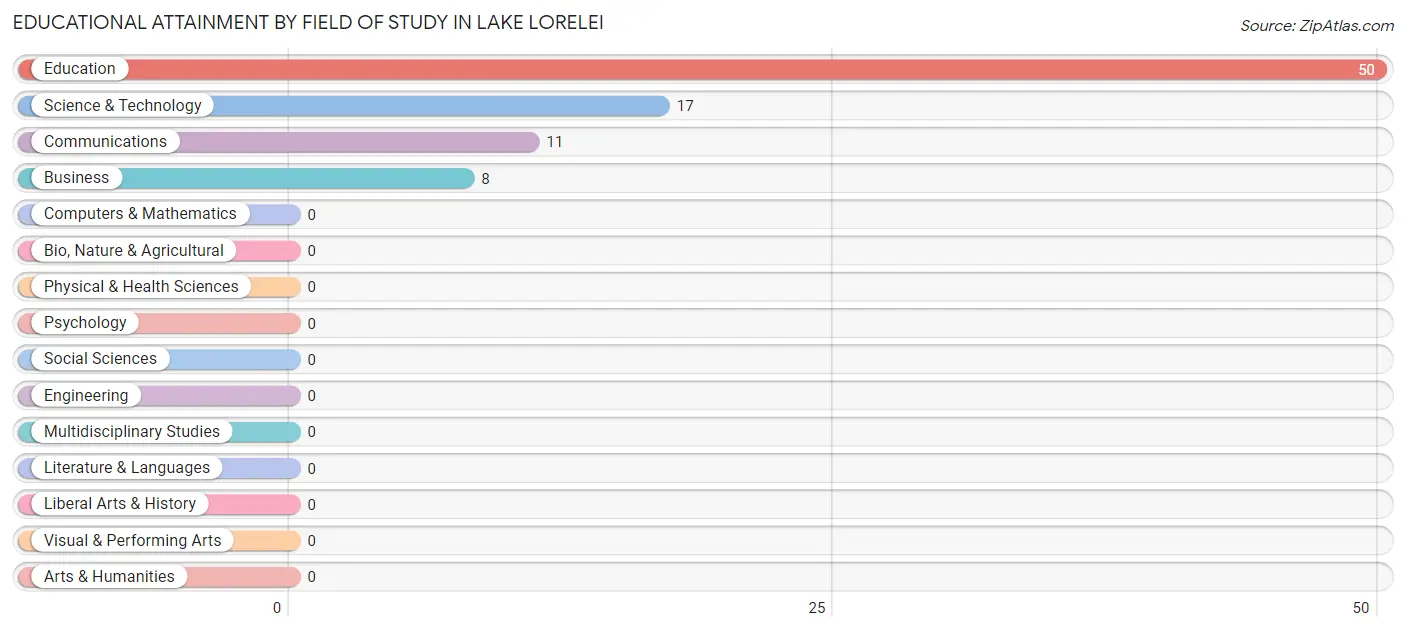
Educational Attainment by Field of Study in Lake Lorelei
Education (50 | 58.1%), science & technology (17 | 19.8%), communications (11 | 12.8%), and business (8 | 9.3%) are the most common fields of study among 86 individuals in Lake Lorelei who have obtained a bachelor's degree or higher.
| Field of Study | # Graduates | % Graduates |
| Computers & Mathematics | 0 | 0.0% |
| Bio, Nature & Agricultural | 0 | 0.0% |
| Physical & Health Sciences | 0 | 0.0% |
| Psychology | 0 | 0.0% |
| Social Sciences | 0 | 0.0% |
| Engineering | 0 | 0.0% |
| Multidisciplinary Studies | 0 | 0.0% |
| Science & Technology | 17 | 19.8% |
| Business | 8 | 9.3% |
| Education | 50 | 58.1% |
| Literature & Languages | 0 | 0.0% |
| Liberal Arts & History | 0 | 0.0% |
| Visual & Performing Arts | 0 | 0.0% |
| Communications | 11 | 12.8% |
| Arts & Humanities | 0 | 0.0% |
| Total | 86 | 100.0% |
Transportation & Commute in Lake Lorelei
Vehicle Availability by Sex in Lake Lorelei
The most prevalent vehicle ownership categories in Lake Lorelei are males with 2 vehicles (148, accounting for 49.5%) and females with 2 vehicles (107, making up 63.8%).
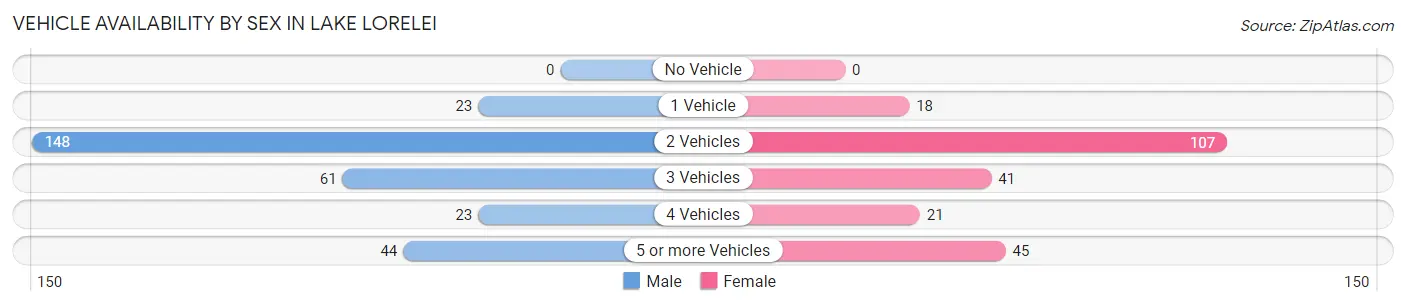
| Vehicles Available | Male | Female |
| No Vehicle | 0 (0.0%) | 0 (0.0%) |
| 1 Vehicle | 23 (7.7%) | 18 (7.8%) |
| 2 Vehicles | 148 (49.5%) | 107 (46.1%) |
| 3 Vehicles | 61 (20.4%) | 41 (17.7%) |
| 4 Vehicles | 23 (7.7%) | 21 (9.0%) |
| 5 or more Vehicles | 44 (14.7%) | 45 (19.4%) |
| Total | 299 (100.0%) | 232 (100.0%) |
Commute Time in Lake Lorelei
The most frequently occuring commute durations in Lake Lorelei are 30 to 34 minutes (123 commuters, 27.3%), 45 to 59 minutes (80 commuters, 17.8%), and 20 to 24 minutes (63 commuters, 14.0%).
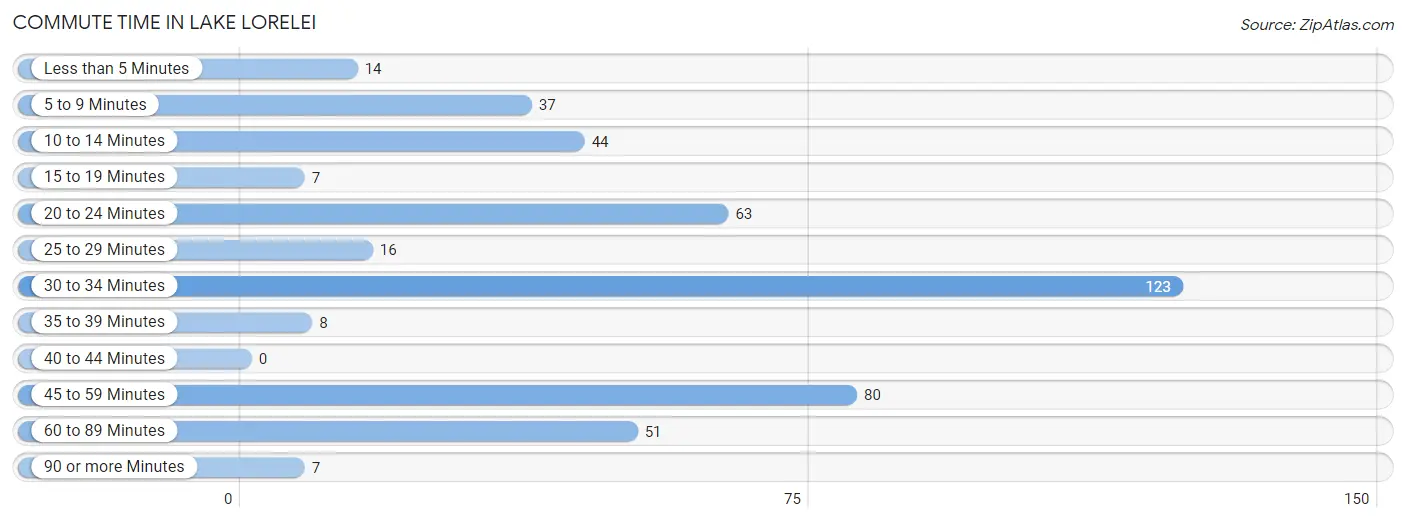
| Commute Time | # Commuters | % Commuters |
| Less than 5 Minutes | 14 | 3.1% |
| 5 to 9 Minutes | 37 | 8.2% |
| 10 to 14 Minutes | 44 | 9.8% |
| 15 to 19 Minutes | 7 | 1.6% |
| 20 to 24 Minutes | 63 | 14.0% |
| 25 to 29 Minutes | 16 | 3.6% |
| 30 to 34 Minutes | 123 | 27.3% |
| 35 to 39 Minutes | 8 | 1.8% |
| 40 to 44 Minutes | 0 | 0.0% |
| 45 to 59 Minutes | 80 | 17.8% |
| 60 to 89 Minutes | 51 | 11.3% |
| 90 or more Minutes | 7 | 1.6% |
Commute Time by Sex in Lake Lorelei
The most common commute times in Lake Lorelei are 30 to 34 minutes (69 commuters, 23.1%) for males and 30 to 34 minutes (54 commuters, 35.8%) for females.
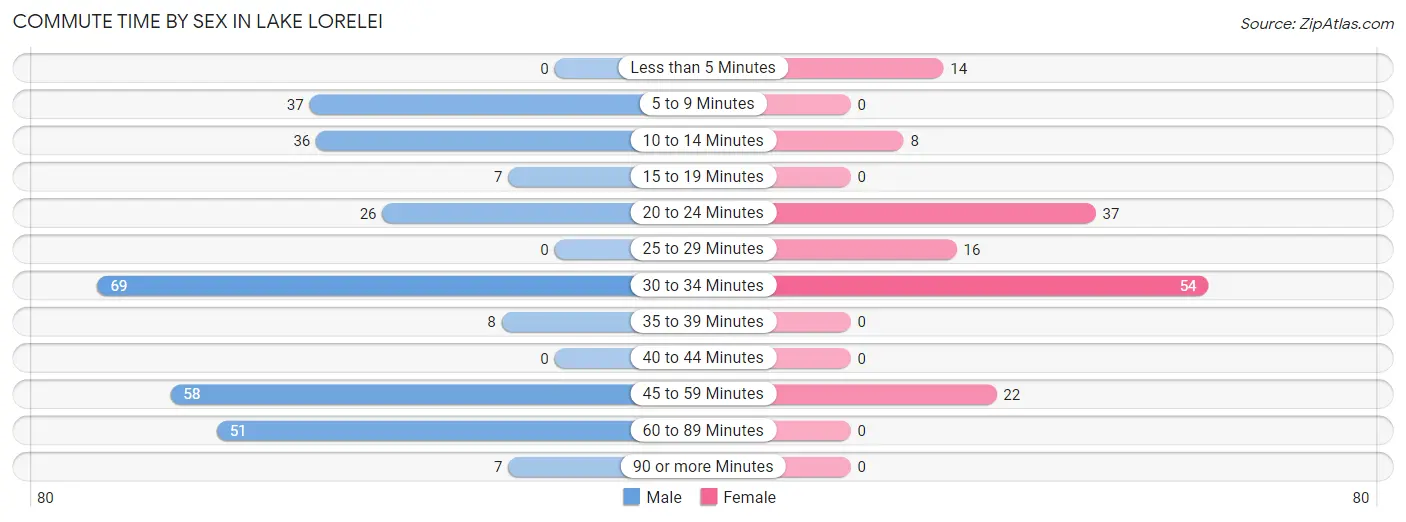
| Commute Time | Male | Female |
| Less than 5 Minutes | 0 (0.0%) | 14 (9.3%) |
| 5 to 9 Minutes | 37 (12.4%) | 0 (0.0%) |
| 10 to 14 Minutes | 36 (12.0%) | 8 (5.3%) |
| 15 to 19 Minutes | 7 (2.3%) | 0 (0.0%) |
| 20 to 24 Minutes | 26 (8.7%) | 37 (24.5%) |
| 25 to 29 Minutes | 0 (0.0%) | 16 (10.6%) |
| 30 to 34 Minutes | 69 (23.1%) | 54 (35.8%) |
| 35 to 39 Minutes | 8 (2.7%) | 0 (0.0%) |
| 40 to 44 Minutes | 0 (0.0%) | 0 (0.0%) |
| 45 to 59 Minutes | 58 (19.4%) | 22 (14.6%) |
| 60 to 89 Minutes | 51 (17.1%) | 0 (0.0%) |
| 90 or more Minutes | 7 (2.3%) | 0 (0.0%) |
Time of Departure to Work by Sex in Lake Lorelei
The most frequent times of departure to work in Lake Lorelei are 12:00 AM to 4:59 AM (91, 30.4%) for males and 8:00 AM to 8:29 AM (43, 28.5%) for females.
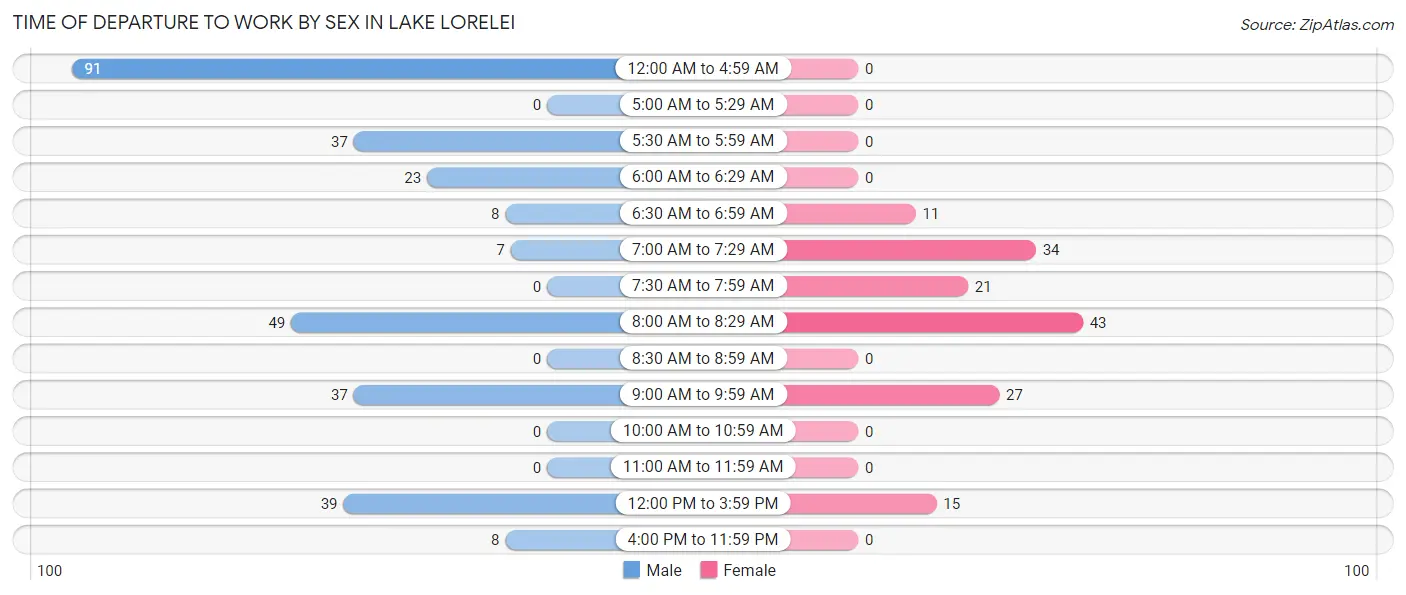
| Time of Departure | Male | Female |
| 12:00 AM to 4:59 AM | 91 (30.4%) | 0 (0.0%) |
| 5:00 AM to 5:29 AM | 0 (0.0%) | 0 (0.0%) |
| 5:30 AM to 5:59 AM | 37 (12.4%) | 0 (0.0%) |
| 6:00 AM to 6:29 AM | 23 (7.7%) | 0 (0.0%) |
| 6:30 AM to 6:59 AM | 8 (2.7%) | 11 (7.3%) |
| 7:00 AM to 7:29 AM | 7 (2.3%) | 34 (22.5%) |
| 7:30 AM to 7:59 AM | 0 (0.0%) | 21 (13.9%) |
| 8:00 AM to 8:29 AM | 49 (16.4%) | 43 (28.5%) |
| 8:30 AM to 8:59 AM | 0 (0.0%) | 0 (0.0%) |
| 9:00 AM to 9:59 AM | 37 (12.4%) | 27 (17.9%) |
| 10:00 AM to 10:59 AM | 0 (0.0%) | 0 (0.0%) |
| 11:00 AM to 11:59 AM | 0 (0.0%) | 0 (0.0%) |
| 12:00 PM to 3:59 PM | 39 (13.0%) | 15 (9.9%) |
| 4:00 PM to 11:59 PM | 8 (2.7%) | 0 (0.0%) |
| Total | 299 (100.0%) | 151 (100.0%) |
Housing Occupancy in Lake Lorelei
Occupancy by Ownership in Lake Lorelei
Of the total 470 dwellings in Lake Lorelei, owner-occupied units account for 462 (98.3%), while renter-occupied units make up 8 (1.7%).
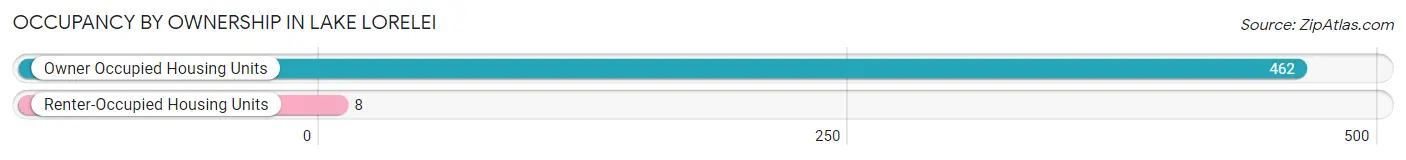
| Occupancy | # Housing Units | % Housing Units |
| Owner Occupied Housing Units | 462 | 98.3% |
| Renter-Occupied Housing Units | 8 | 1.7% |
| Total Occupied Housing Units | 470 | 100.0% |
Occupancy by Household Size in Lake Lorelei
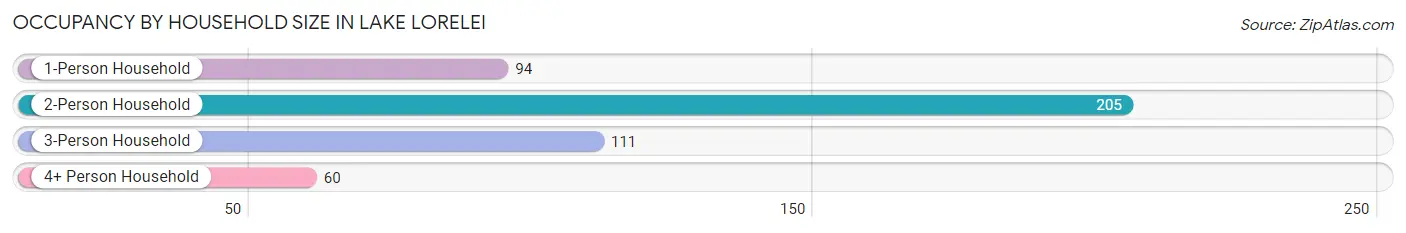
| Household Size | # Housing Units | % Housing Units |
| 1-Person Household | 94 | 20.0% |
| 2-Person Household | 205 | 43.6% |
| 3-Person Household | 111 | 23.6% |
| 4+ Person Household | 60 | 12.8% |
| Total Housing Units | 470 | 100.0% |
Occupancy by Ownership by Household Size in Lake Lorelei
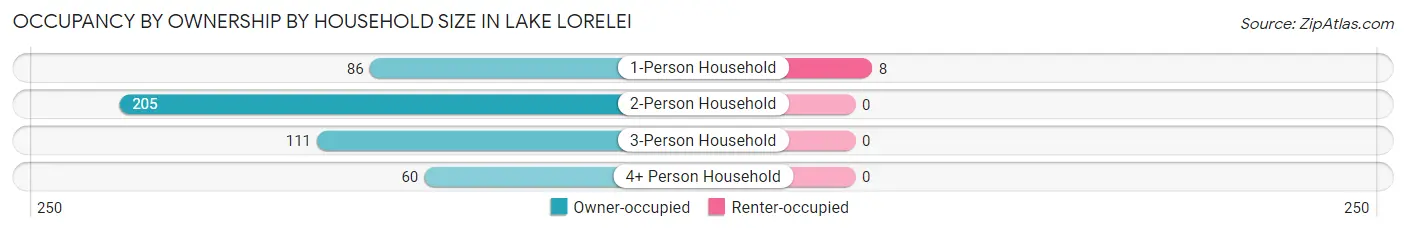
| Household Size | Owner-occupied | Renter-occupied |
| 1-Person Household | 86 (91.5%) | 8 (8.5%) |
| 2-Person Household | 205 (100.0%) | 0 (0.0%) |
| 3-Person Household | 111 (100.0%) | 0 (0.0%) |
| 4+ Person Household | 60 (100.0%) | 0 (0.0%) |
| Total Housing Units | 462 (98.3%) | 8 (1.7%) |
Occupancy by Educational Attainment in Lake Lorelei
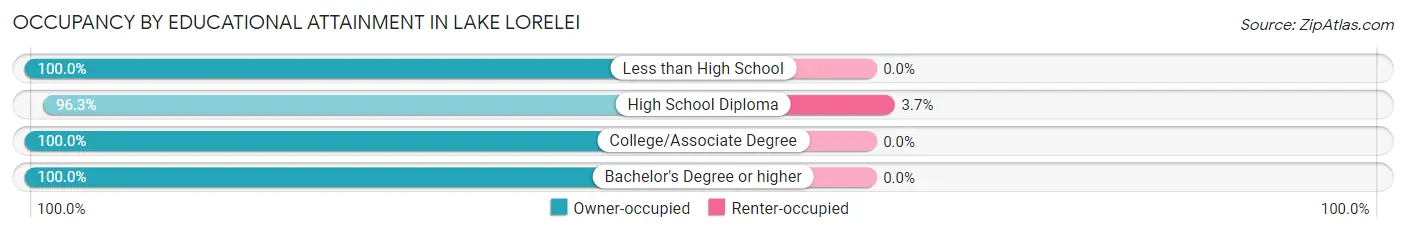
| Household Size | Owner-occupied | Renter-occupied |
| Less than High School | 35 (100.0%) | 0 (0.0%) |
| High School Diploma | 210 (96.3%) | 8 (3.7%) |
| College/Associate Degree | 178 (100.0%) | 0 (0.0%) |
| Bachelor's Degree or higher | 39 (100.0%) | 0 (0.0%) |
Occupancy by Age of Householder in Lake Lorelei
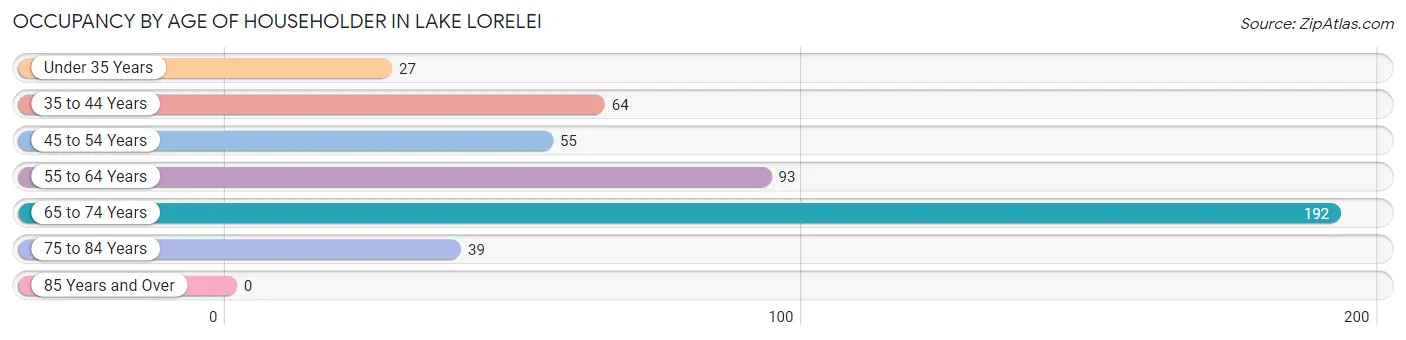
| Age Bracket | # Households | % Households |
| Under 35 Years | 27 | 5.7% |
| 35 to 44 Years | 64 | 13.6% |
| 45 to 54 Years | 55 | 11.7% |
| 55 to 64 Years | 93 | 19.8% |
| 65 to 74 Years | 192 | 40.8% |
| 75 to 84 Years | 39 | 8.3% |
| 85 Years and Over | 0 | 0.0% |
| Total | 470 | 100.0% |
Housing Finances in Lake Lorelei
Median Income by Occupancy in Lake Lorelei
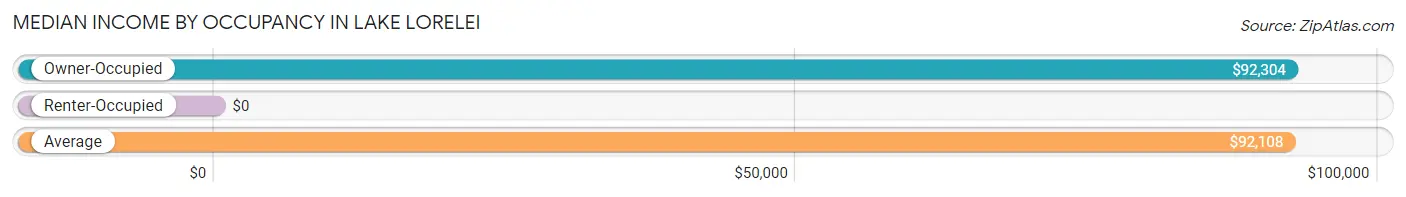
| Occupancy Type | # Households | Median Income |
| Owner-Occupied | 462 (98.3%) | $92,304 |
| Renter-Occupied | 8 (1.7%) | $0 |
| Average | 470 (100.0%) | $92,108 |
Occupancy by Householder Income Bracket in Lake Lorelei
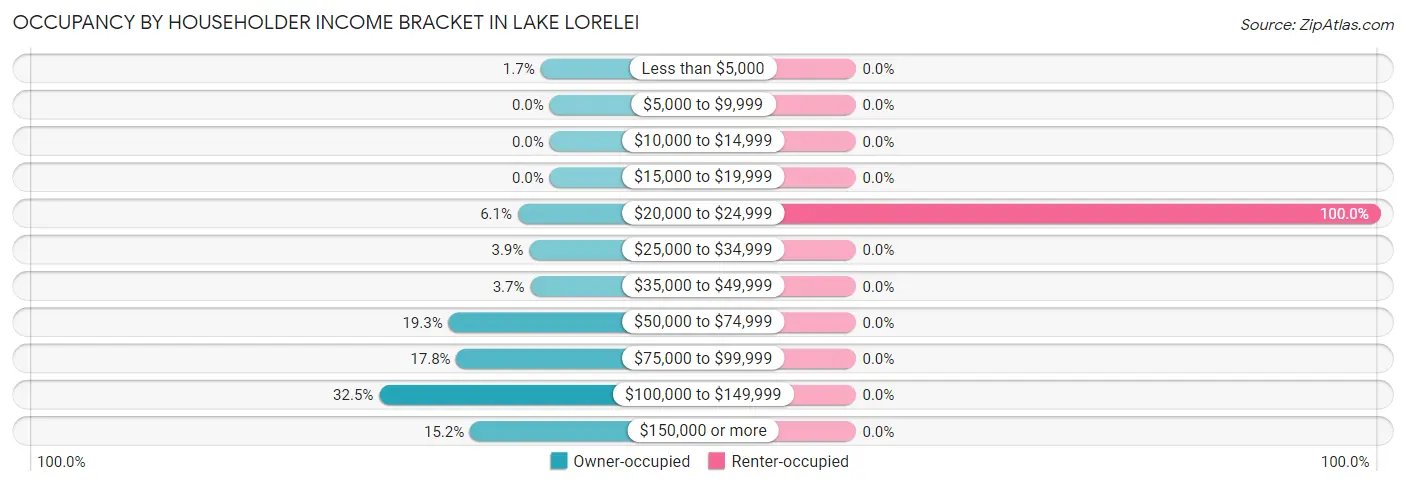
| Income Bracket | Owner-occupied | Renter-occupied |
| Less than $5,000 | 8 (1.7%) | 0 (0.0%) |
| $5,000 to $9,999 | 0 (0.0%) | 0 (0.0%) |
| $10,000 to $14,999 | 0 (0.0%) | 0 (0.0%) |
| $15,000 to $19,999 | 0 (0.0%) | 0 (0.0%) |
| $20,000 to $24,999 | 28 (6.1%) | 8 (100.0%) |
| $25,000 to $34,999 | 18 (3.9%) | 0 (0.0%) |
| $35,000 to $49,999 | 17 (3.7%) | 0 (0.0%) |
| $50,000 to $74,999 | 89 (19.3%) | 0 (0.0%) |
| $75,000 to $99,999 | 82 (17.7%) | 0 (0.0%) |
| $100,000 to $149,999 | 150 (32.5%) | 0 (0.0%) |
| $150,000 or more | 70 (15.1%) | 0 (0.0%) |
| Total | 462 (100.0%) | 8 (100.0%) |
Monthly Housing Cost Tiers in Lake Lorelei
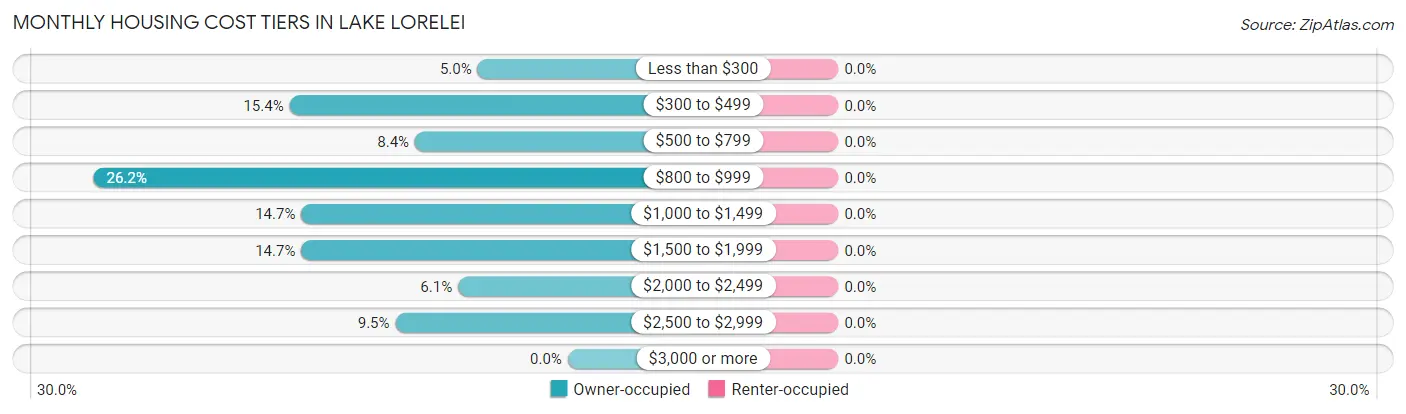
| Monthly Cost | Owner-occupied | Renter-occupied |
| Less than $300 | 23 (5.0%) | 0 (0.0%) |
| $300 to $499 | 71 (15.4%) | 0 (0.0%) |
| $500 to $799 | 39 (8.4%) | 0 (0.0%) |
| $800 to $999 | 121 (26.2%) | 0 (0.0%) |
| $1,000 to $1,499 | 68 (14.7%) | 0 (0.0%) |
| $1,500 to $1,999 | 68 (14.7%) | 0 (0.0%) |
| $2,000 to $2,499 | 28 (6.1%) | 0 (0.0%) |
| $2,500 to $2,999 | 44 (9.5%) | 0 (0.0%) |
| $3,000 or more | 0 (0.0%) | 0 (0.0%) |
| Total | 462 (100.0%) | 8 (100.0%) |
Physical Housing Characteristics in Lake Lorelei
Housing Structures in Lake Lorelei
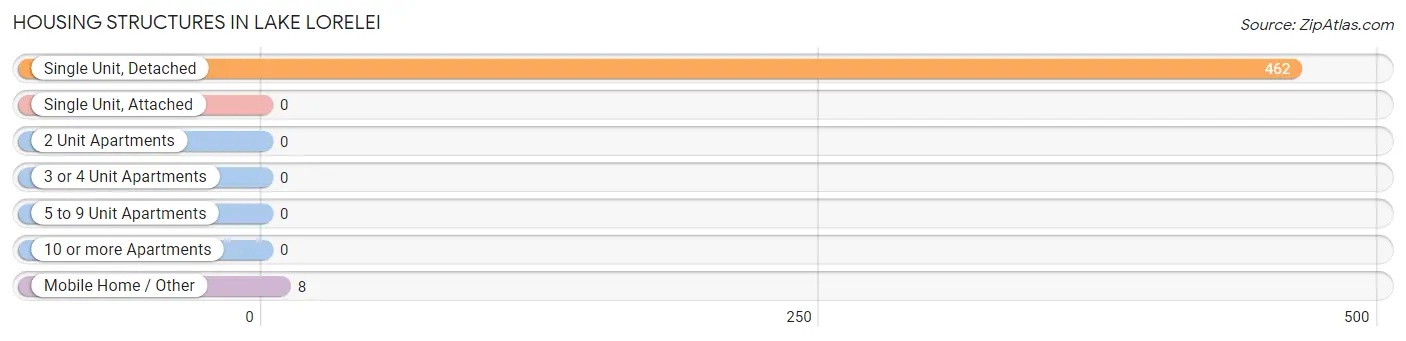
| Structure Type | # Housing Units | % Housing Units |
| Single Unit, Detached | 462 | 98.3% |
| Single Unit, Attached | 0 | 0.0% |
| 2 Unit Apartments | 0 | 0.0% |
| 3 or 4 Unit Apartments | 0 | 0.0% |
| 5 to 9 Unit Apartments | 0 | 0.0% |
| 10 or more Apartments | 0 | 0.0% |
| Mobile Home / Other | 8 | 1.7% |
| Total | 470 | 100.0% |
Housing Structures by Occupancy in Lake Lorelei
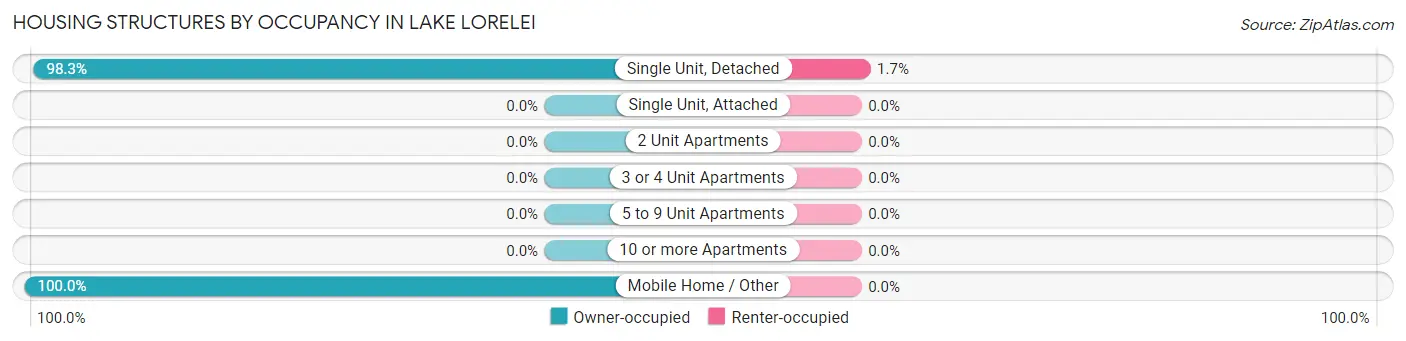
| Structure Type | Owner-occupied | Renter-occupied |
| Single Unit, Detached | 454 (98.3%) | 8 (1.7%) |
| Single Unit, Attached | 0 (0.0%) | 0 (0.0%) |
| 2 Unit Apartments | 0 (0.0%) | 0 (0.0%) |
| 3 or 4 Unit Apartments | 0 (0.0%) | 0 (0.0%) |
| 5 to 9 Unit Apartments | 0 (0.0%) | 0 (0.0%) |
| 10 or more Apartments | 0 (0.0%) | 0 (0.0%) |
| Mobile Home / Other | 8 (100.0%) | 0 (0.0%) |
| Total | 462 (98.3%) | 8 (1.7%) |
Housing Structures by Number of Rooms in Lake Lorelei
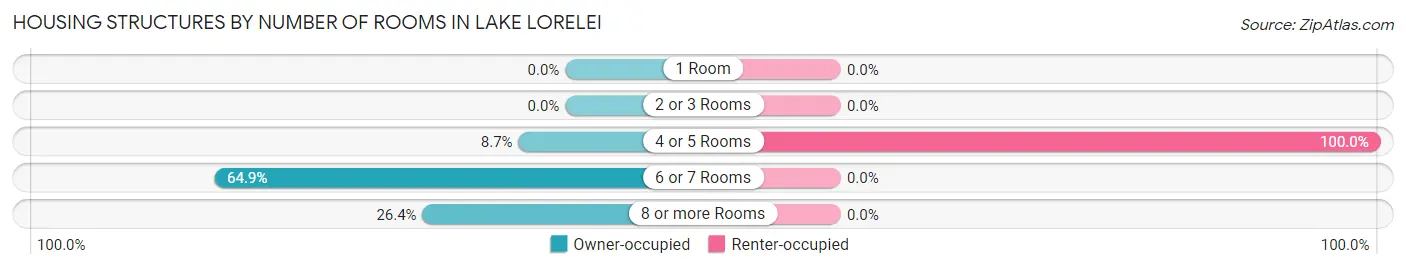
| Number of Rooms | Owner-occupied | Renter-occupied |
| 1 Room | 0 (0.0%) | 0 (0.0%) |
| 2 or 3 Rooms | 0 (0.0%) | 0 (0.0%) |
| 4 or 5 Rooms | 40 (8.7%) | 8 (100.0%) |
| 6 or 7 Rooms | 300 (64.9%) | 0 (0.0%) |
| 8 or more Rooms | 122 (26.4%) | 0 (0.0%) |
| Total | 462 (100.0%) | 8 (100.0%) |
Housing Structure by Heating Type in Lake Lorelei
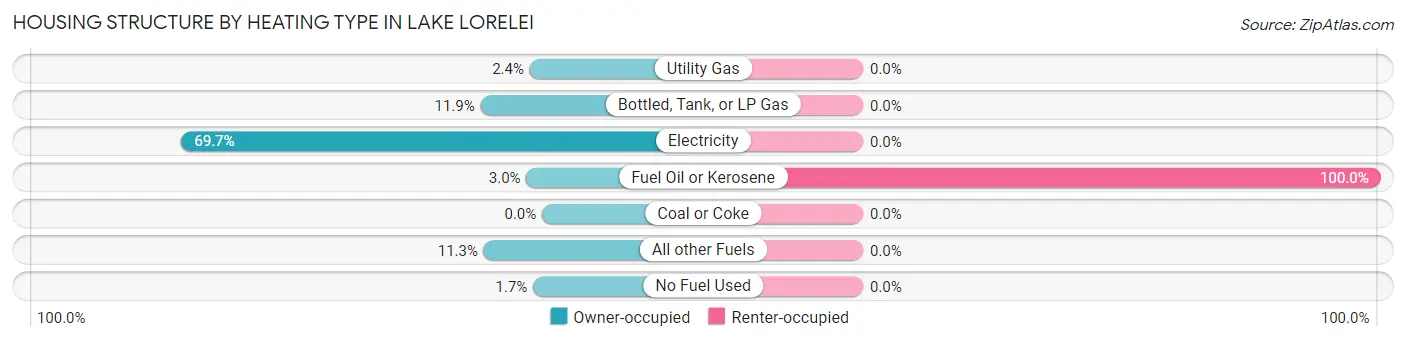
| Heating Type | Owner-occupied | Renter-occupied |
| Utility Gas | 11 (2.4%) | 0 (0.0%) |
| Bottled, Tank, or LP Gas | 55 (11.9%) | 0 (0.0%) |
| Electricity | 322 (69.7%) | 0 (0.0%) |
| Fuel Oil or Kerosene | 14 (3.0%) | 8 (100.0%) |
| Coal or Coke | 0 (0.0%) | 0 (0.0%) |
| All other Fuels | 52 (11.3%) | 0 (0.0%) |
| No Fuel Used | 8 (1.7%) | 0 (0.0%) |
| Total | 462 (100.0%) | 8 (100.0%) |
Household Vehicle Usage in Lake Lorelei
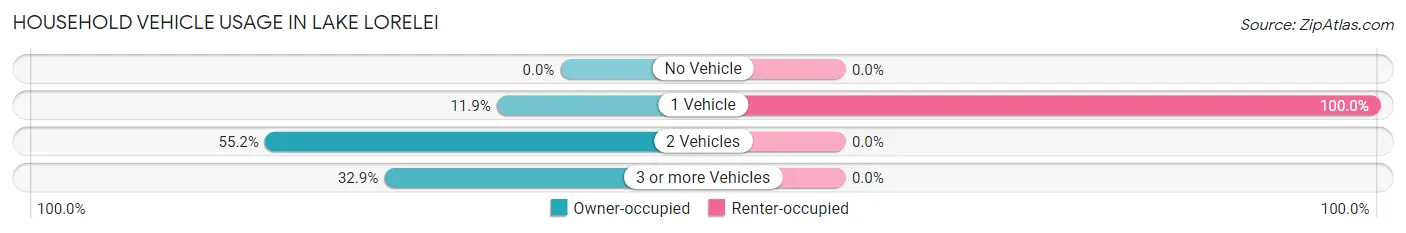
| Vehicles per Household | Owner-occupied | Renter-occupied |
| No Vehicle | 0 (0.0%) | 0 (0.0%) |
| 1 Vehicle | 55 (11.9%) | 8 (100.0%) |
| 2 Vehicles | 255 (55.2%) | 0 (0.0%) |
| 3 or more Vehicles | 152 (32.9%) | 0 (0.0%) |
| Total | 462 (100.0%) | 8 (100.0%) |
Real Estate & Mortgages in Lake Lorelei
Real Estate and Mortgage Overview in Lake Lorelei
| Characteristic | Without Mortgage | With Mortgage |
| Housing Units | 123 | 339 |
| Median Property Value | $175,700 | $234,700 |
| Median Household Income | $65,662 | $70 |
| Monthly Housing Costs | $427 | $0 |
| Real Estate Taxes | $1,807 | $0 |
Property Value by Mortgage Status in Lake Lorelei
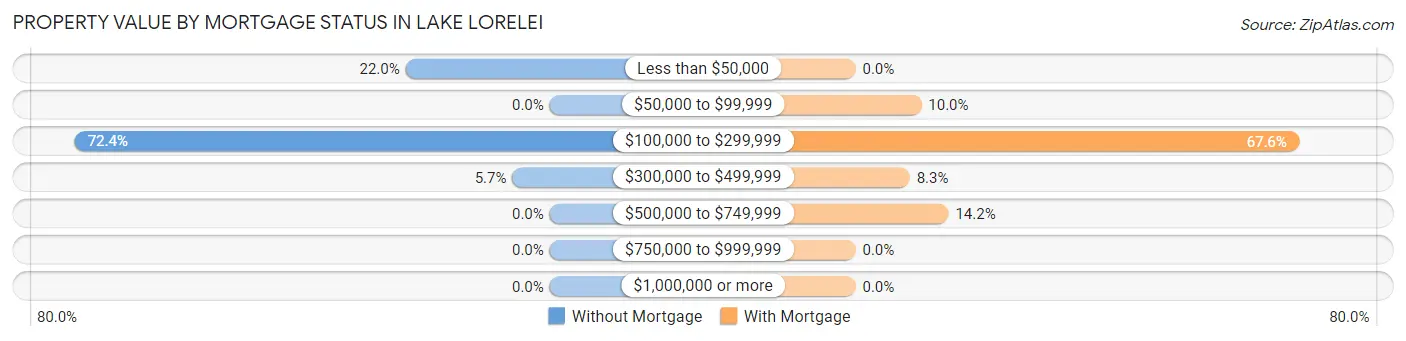
| Property Value | Without Mortgage | With Mortgage |
| Less than $50,000 | 27 (22.0%) | 0 (0.0%) |
| $50,000 to $99,999 | 0 (0.0%) | 34 (10.0%) |
| $100,000 to $299,999 | 89 (72.4%) | 229 (67.5%) |
| $300,000 to $499,999 | 7 (5.7%) | 28 (8.3%) |
| $500,000 to $749,999 | 0 (0.0%) | 48 (14.2%) |
| $750,000 to $999,999 | 0 (0.0%) | 0 (0.0%) |
| $1,000,000 or more | 0 (0.0%) | 0 (0.0%) |
| Total | 123 (100.0%) | 339 (100.0%) |
Household Income by Mortgage Status in Lake Lorelei
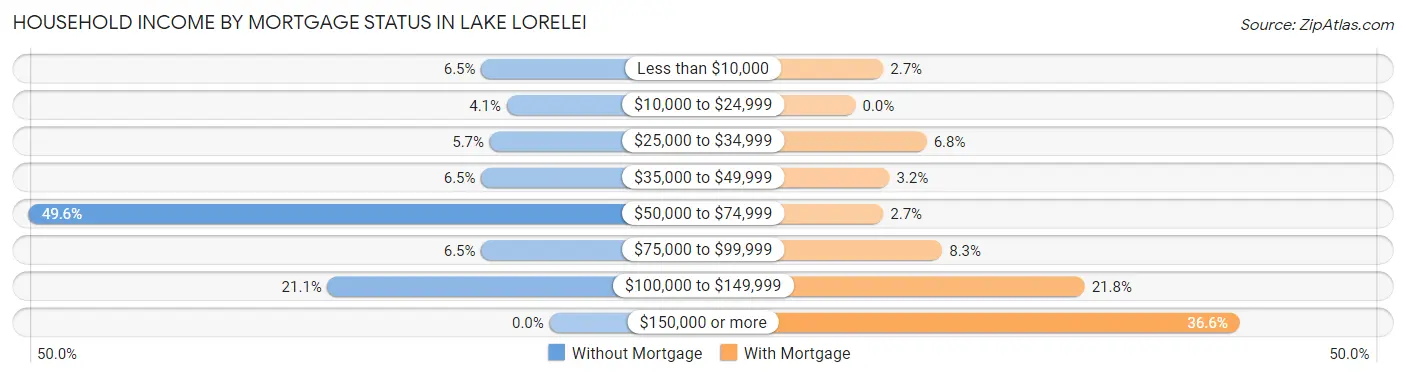
| Household Income | Without Mortgage | With Mortgage |
| Less than $10,000 | 8 (6.5%) | 9 (2.6%) |
| $10,000 to $24,999 | 5 (4.1%) | 0 (0.0%) |
| $25,000 to $34,999 | 7 (5.7%) | 23 (6.8%) |
| $35,000 to $49,999 | 8 (6.5%) | 11 (3.2%) |
| $50,000 to $74,999 | 61 (49.6%) | 9 (2.6%) |
| $75,000 to $99,999 | 8 (6.5%) | 28 (8.3%) |
| $100,000 to $149,999 | 26 (21.1%) | 74 (21.8%) |
| $150,000 or more | 0 (0.0%) | 124 (36.6%) |
| Total | 123 (100.0%) | 339 (100.0%) |
Property Value to Household Income Ratio in Lake Lorelei
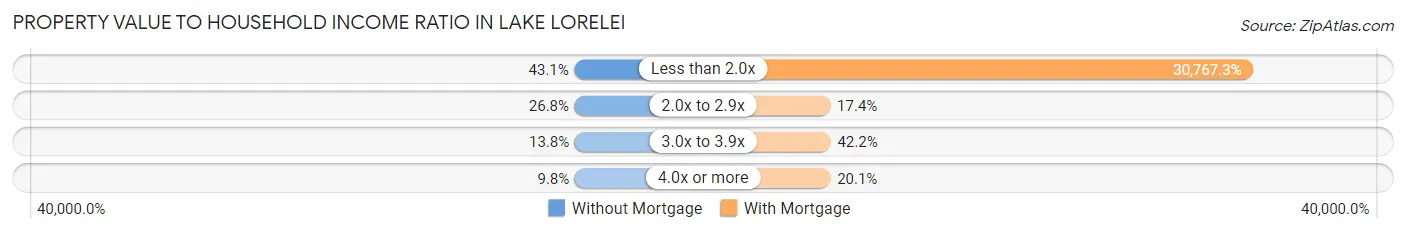
| Value-to-Income Ratio | Without Mortgage | With Mortgage |
| Less than 2.0x | 53 (43.1%) | 104,301 (30,767.3%) |
| 2.0x to 2.9x | 33 (26.8%) | 59 (17.4%) |
| 3.0x to 3.9x | 17 (13.8%) | 143 (42.2%) |
| 4.0x or more | 12 (9.8%) | 68 (20.1%) |
| Total | 123 (100.0%) | 339 (100.0%) |
Real Estate Taxes by Mortgage Status in Lake Lorelei
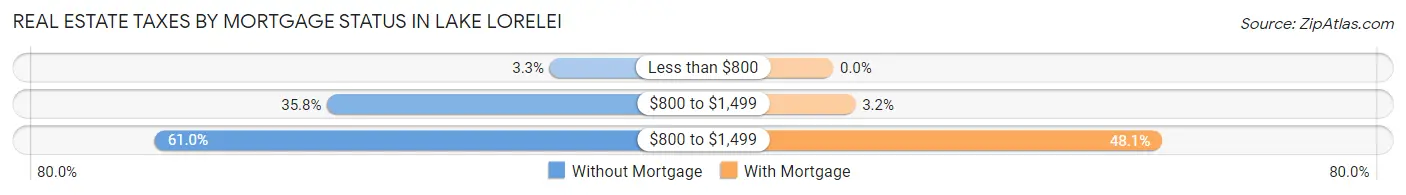
| Property Taxes | Without Mortgage | With Mortgage |
| Less than $800 | 4 (3.3%) | 0 (0.0%) |
| $800 to $1,499 | 44 (35.8%) | 11 (3.2%) |
| $800 to $1,499 | 75 (61.0%) | 163 (48.1%) |
| Total | 123 (100.0%) | 339 (100.0%) |
Health & Disability in Lake Lorelei
Health Insurance Coverage by Age in Lake Lorelei
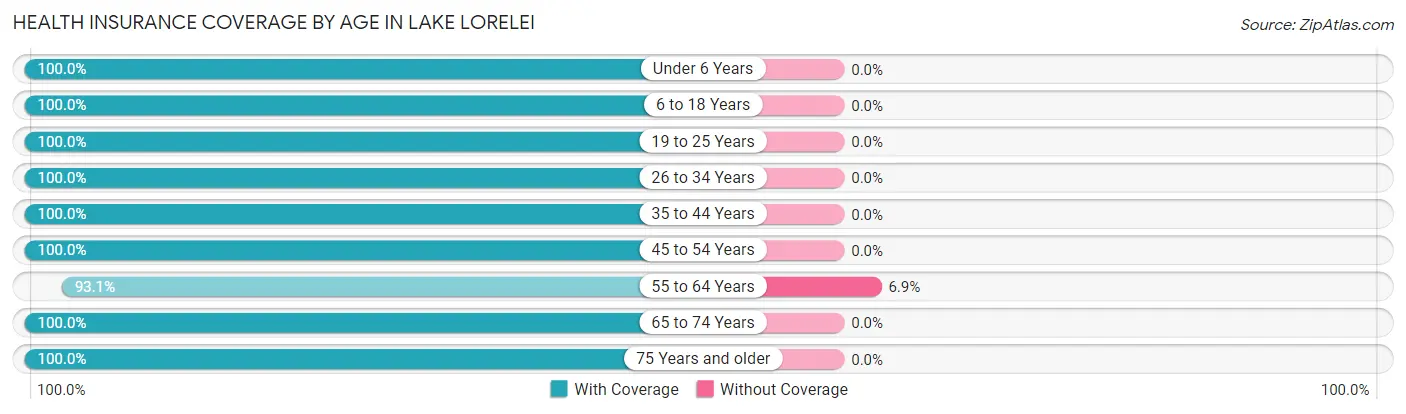
| Age Bracket | With Coverage | Without Coverage |
| Under 6 Years | 102 (100.0%) | 0 (0.0%) |
| 6 to 18 Years | 157 (100.0%) | 0 (0.0%) |
| 19 to 25 Years | 35 (100.0%) | 0 (0.0%) |
| 26 to 34 Years | 45 (100.0%) | 0 (0.0%) |
| 35 to 44 Years | 157 (100.0%) | 0 (0.0%) |
| 45 to 54 Years | 97 (100.0%) | 0 (0.0%) |
| 55 to 64 Years | 215 (93.1%) | 16 (6.9%) |
| 65 to 74 Years | 248 (100.0%) | 0 (0.0%) |
| 75 Years and older | 71 (100.0%) | 0 (0.0%) |
| Total | 1,127 (98.6%) | 16 (1.4%) |
Health Insurance Coverage by Citizenship Status in Lake Lorelei
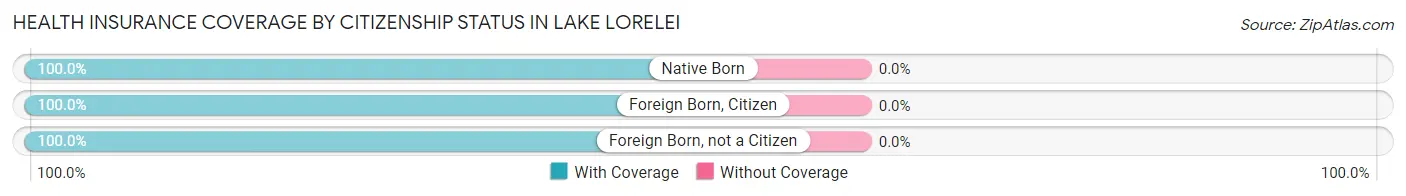
| Citizenship Status | With Coverage | Without Coverage |
| Native Born | 102 (100.0%) | 0 (0.0%) |
| Foreign Born, Citizen | 157 (100.0%) | 0 (0.0%) |
| Foreign Born, not a Citizen | 35 (100.0%) | 0 (0.0%) |
Health Insurance Coverage by Household Income in Lake Lorelei
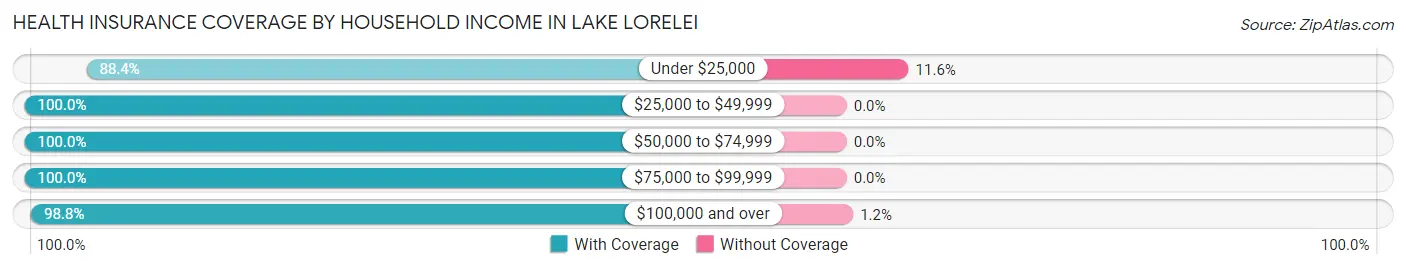
| Household Income | With Coverage | Without Coverage |
| Under $25,000 | 61 (88.4%) | 8 (11.6%) |
| $25,000 to $49,999 | 58 (100.0%) | 0 (0.0%) |
| $50,000 to $74,999 | 160 (100.0%) | 0 (0.0%) |
| $75,000 to $99,999 | 197 (100.0%) | 0 (0.0%) |
| $100,000 and over | 651 (98.8%) | 8 (1.2%) |
Public vs Private Health Insurance Coverage by Age in Lake Lorelei
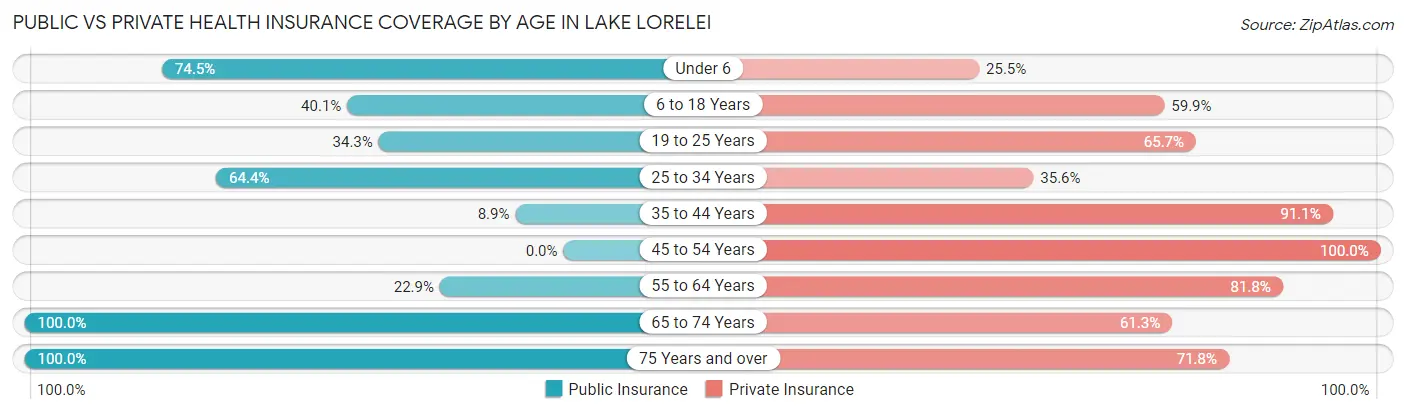
| Age Bracket | Public Insurance | Private Insurance |
| Under 6 | 76 (74.5%) | 26 (25.5%) |
| 6 to 18 Years | 63 (40.1%) | 94 (59.9%) |
| 19 to 25 Years | 12 (34.3%) | 23 (65.7%) |
| 25 to 34 Years | 29 (64.4%) | 16 (35.6%) |
| 35 to 44 Years | 14 (8.9%) | 143 (91.1%) |
| 45 to 54 Years | 0 (0.0%) | 97 (100.0%) |
| 55 to 64 Years | 53 (22.9%) | 189 (81.8%) |
| 65 to 74 Years | 248 (100.0%) | 152 (61.3%) |
| 75 Years and over | 71 (100.0%) | 51 (71.8%) |
| Total | 566 (49.5%) | 791 (69.2%) |
Disability Status by Sex by Age in Lake Lorelei
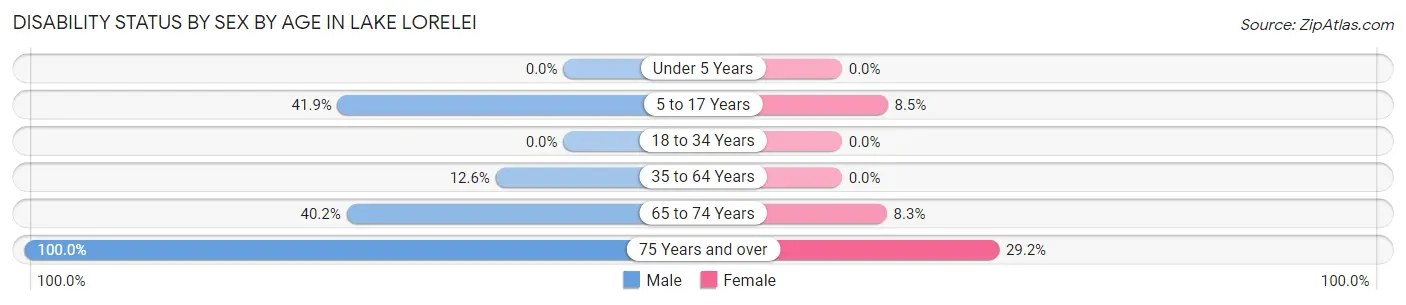
| Age Bracket | Male | Female |
| Under 5 Years | 0 (0.0%) | 0 (0.0%) |
| 5 to 17 Years | 31 (41.9%) | 9 (8.5%) |
| 18 to 34 Years | 0 (0.0%) | 0 (0.0%) |
| 35 to 64 Years | 26 (12.6%) | 0 (0.0%) |
| 65 to 74 Years | 66 (40.2%) | 7 (8.3%) |
| 75 Years and over | 23 (100.0%) | 14 (29.2%) |
Disability Class by Sex by Age in Lake Lorelei
Disability Class: Hearing Difficulty
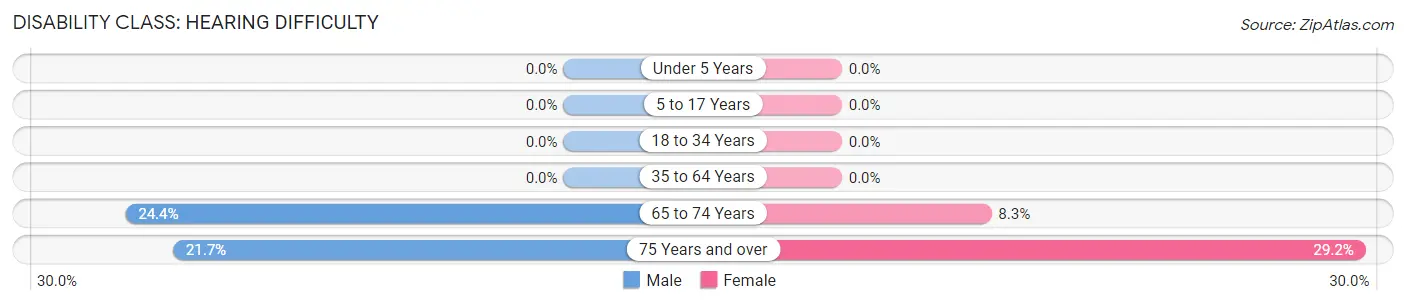
| Age Bracket | Male | Female |
| Under 5 Years | 0 (0.0%) | 0 (0.0%) |
| 5 to 17 Years | 0 (0.0%) | 0 (0.0%) |
| 18 to 34 Years | 0 (0.0%) | 0 (0.0%) |
| 35 to 64 Years | 0 (0.0%) | 0 (0.0%) |
| 65 to 74 Years | 40 (24.4%) | 7 (8.3%) |
| 75 Years and over | 5 (21.7%) | 14 (29.2%) |
Disability Class: Vision Difficulty
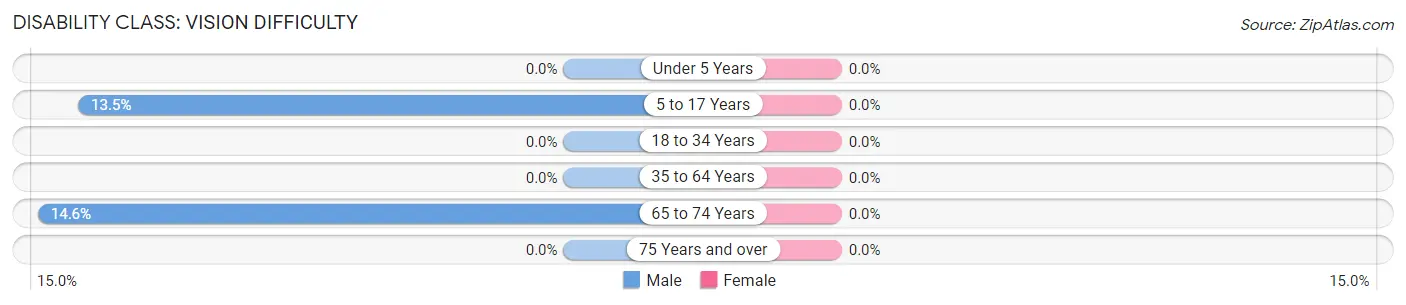
| Age Bracket | Male | Female |
| Under 5 Years | 0 (0.0%) | 0 (0.0%) |
| 5 to 17 Years | 10 (13.5%) | 0 (0.0%) |
| 18 to 34 Years | 0 (0.0%) | 0 (0.0%) |
| 35 to 64 Years | 0 (0.0%) | 0 (0.0%) |
| 65 to 74 Years | 24 (14.6%) | 0 (0.0%) |
| 75 Years and over | 0 (0.0%) | 0 (0.0%) |
Disability Class: Cognitive Difficulty
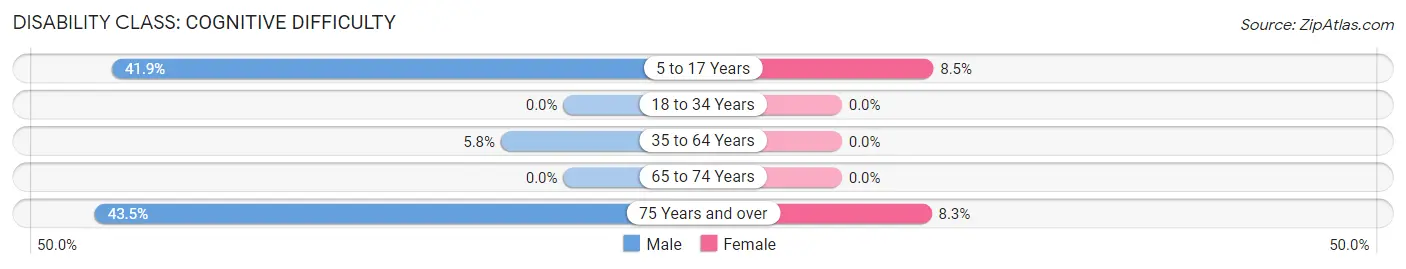
| Age Bracket | Male | Female |
| 5 to 17 Years | 31 (41.9%) | 9 (8.5%) |
| 18 to 34 Years | 0 (0.0%) | 0 (0.0%) |
| 35 to 64 Years | 12 (5.8%) | 0 (0.0%) |
| 65 to 74 Years | 0 (0.0%) | 0 (0.0%) |
| 75 Years and over | 10 (43.5%) | 4 (8.3%) |
Disability Class: Ambulatory Difficulty
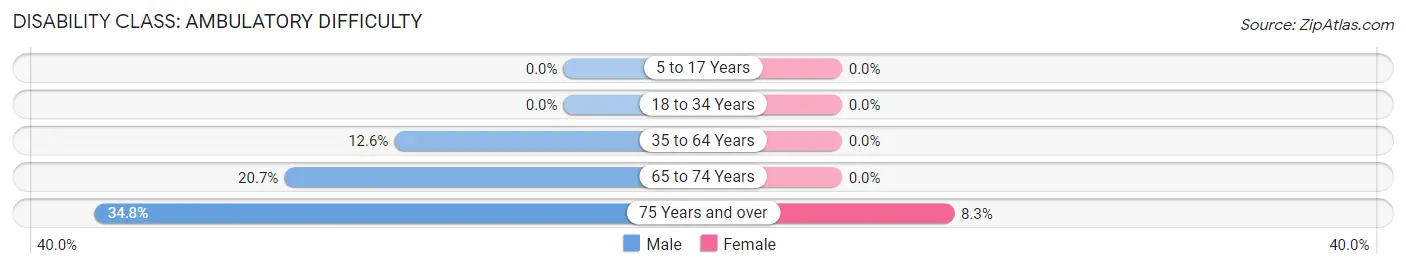
| Age Bracket | Male | Female |
| 5 to 17 Years | 0 (0.0%) | 0 (0.0%) |
| 18 to 34 Years | 0 (0.0%) | 0 (0.0%) |
| 35 to 64 Years | 26 (12.6%) | 0 (0.0%) |
| 65 to 74 Years | 34 (20.7%) | 0 (0.0%) |
| 75 Years and over | 8 (34.8%) | 4 (8.3%) |
Disability Class: Self-Care Difficulty
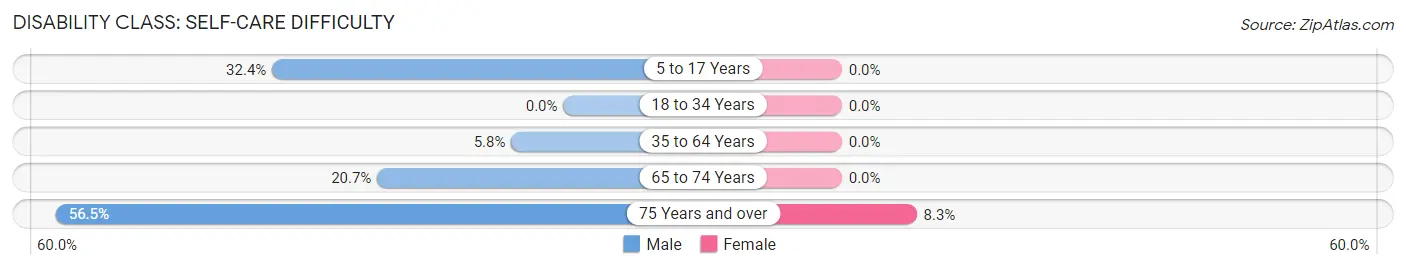
| Age Bracket | Male | Female |
| 5 to 17 Years | 24 (32.4%) | 0 (0.0%) |
| 18 to 34 Years | 0 (0.0%) | 0 (0.0%) |
| 35 to 64 Years | 12 (5.8%) | 0 (0.0%) |
| 65 to 74 Years | 34 (20.7%) | 0 (0.0%) |
| 75 Years and over | 13 (56.5%) | 4 (8.3%) |
Technology Access in Lake Lorelei
Computing Device Access in Lake Lorelei
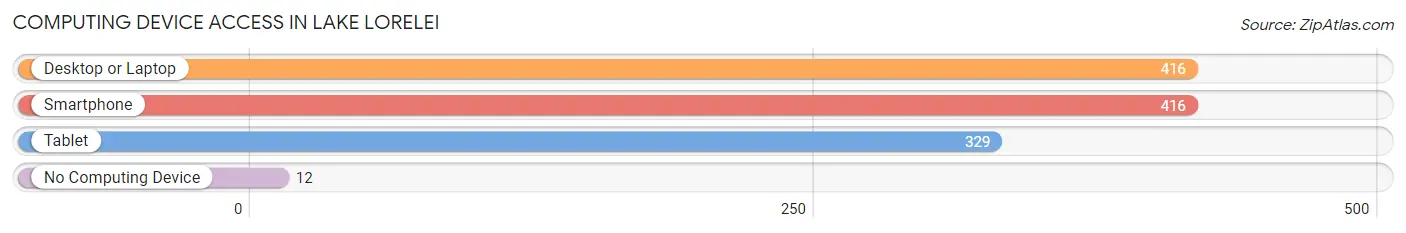
| Device Type | # Households | % Households |
| Desktop or Laptop | 416 | 88.5% |
| Smartphone | 416 | 88.5% |
| Tablet | 329 | 70.0% |
| No Computing Device | 12 | 2.5% |
| Total | 470 | 100.0% |
Internet Access in Lake Lorelei
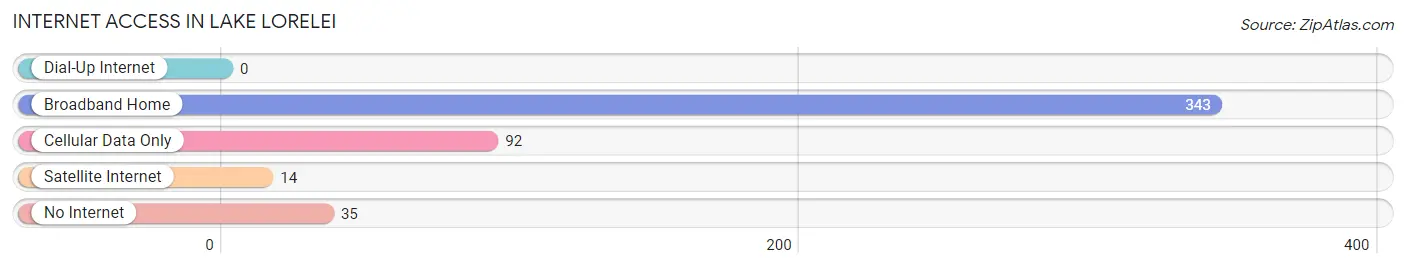
| Internet Type | # Households | % Households |
| Dial-Up Internet | 0 | 0.0% |
| Broadband Home | 343 | 73.0% |
| Cellular Data Only | 92 | 19.6% |
| Satellite Internet | 14 | 3.0% |
| No Internet | 35 | 7.4% |
| Total | 470 | 100.0% |
Lake Lorelei Summary
History
Lake Lorelei is a small unincorporated community located in Brown County, Ohio. It is situated on the banks of the Little Miami River, and is home to a population of approximately 1,000 people. The community was founded in the early 1800s by German immigrants who were looking for a place to settle and start a new life. The area was originally known as “Lorelei”, after the German legend of a beautiful woman who lured sailors to their death with her singing. The name was later changed to “Lake Lorelei” when a man-made lake was created in the area in the late 1800s.
The area was primarily agricultural until the early 1900s, when the first industry began to move into the area. The first industry was a paper mill, which was followed by a sawmill and a grist mill. These industries provided employment for many of the local residents, and helped to spur the growth of the community.
In the 1950s, the area began to experience a population boom as people moved to the area to take advantage of the new industries. This growth continued until the late 1970s, when the paper mill closed and the population began to decline.
Geography
Lake Lorelei is located in Brown County, Ohio, approximately 30 miles east of Cincinnati. The community is situated on the banks of the Little Miami River, and is surrounded by rolling hills and farmland. The area is known for its scenic beauty, and is home to a variety of wildlife, including deer, wild turkeys, and bald eagles.
The climate in Lake Lorelei is typical of the Midwest, with hot summers and cold winters. The average temperature in the summer is around 75 degrees Fahrenheit, and the average temperature in the winter is around 30 degrees Fahrenheit. The area receives an average of 40 inches of precipitation per year, with most of it falling in the spring and summer months.
Economy
The economy of Lake Lorelei is primarily based on agriculture and tourism. The area is home to several farms, which produce a variety of crops, including corn, soybeans, and wheat. The area is also home to several wineries, which attract tourists from all over the region.
In addition to agriculture and tourism, the area is home to several small businesses, including restaurants, retail stores, and service providers. The area is also home to a few manufacturing companies, which produce a variety of products, including furniture and automotive parts.
Demographics
As of the 2010 census, the population of Lake Lorelei was 1,000 people. The racial makeup of the community was 97.2% White, 0.7% African American, 0.2% Native American, 0.2% Asian, and 1.7% from other races. The median household income was $45,000, and the median age was 42 years.
The majority of the population is affiliated with the Christian faith, with the largest denominations being Catholic, Methodist, and Baptist. The area is also home to a small Jewish community.
Conclusion
Lake Lorelei is a small unincorporated community located in Brown County, Ohio. It is situated on the banks of the Little Miami River, and is home to a population of approximately 1,000 people. The area is known for its scenic beauty, and is home to a variety of wildlife. The economy of the area is primarily based on agriculture and tourism, and the area is home to several small businesses. The population of the area is primarily White, with the median household income being $45,000 and the median age being 42 years.
Common Questions
What is Per Capita Income in Lake Lorelei?
Per Capita income in Lake Lorelei is $38,165.
What is the Median Family Income in Lake Lorelei?
Median Family Income in Lake Lorelei is $93,214.
What is the Median Household income in Lake Lorelei?
Median Household Income in Lake Lorelei is $92,108.
What is Income or Wage Gap in Lake Lorelei?
Income or Wage Gap in Lake Lorelei is 18.6%.
Women in Lake Lorelei earn 81.4 cents for every dollar earned by a man.
What is Inequality or Gini Index in Lake Lorelei?
Inequality or Gini Index in Lake Lorelei is 0.32.
What is the Total Population of Lake Lorelei?
Total Population of Lake Lorelei is 1,143.
What is the Total Male Population of Lake Lorelei?
Total Male Population of Lake Lorelei is 538.
What is the Total Female Population of Lake Lorelei?
Total Female Population of Lake Lorelei is 605.
What is the Ratio of Males per 100 Females in Lake Lorelei?
There are 88.93 Males per 100 Females in Lake Lorelei.
What is the Ratio of Females per 100 Males in Lake Lorelei?
There are 112.45 Females per 100 Males in Lake Lorelei.
What is the Median Population Age in Lake Lorelei?
Median Population Age in Lake Lorelei is 51.1 Years.
What is the Average Family Size in Lake Lorelei
Average Family Size in Lake Lorelei is 2.8 People.
What is the Average Household Size in Lake Lorelei
Average Household Size in Lake Lorelei is 2.4 People.
How Large is the Labor Force in Lake Lorelei?
There are 557 People in the Labor Forcein in Lake Lorelei.
What is the Percentage of People in the Labor Force in Lake Lorelei?
59.0% of People are in the Labor Force in Lake Lorelei.
What is the Unemployment Rate in Lake Lorelei?
Unemployment Rate in Lake Lorelei is 4.7%.