Brecon, OH Map & Demographics
Brecon Map
Brecon Overview
$31,111
PER CAPITA INCOME
$68,890
AVG HOUSEHOLD INCOME
63.1%
WAGE / INCOME GAP [ % ]
36.9¢/ $1
WAGE / INCOME GAP [ $ ]
0.20
INEQUALITY / GINI INDEX
559
TOTAL POPULATION
230
MALE POPULATION
329
FEMALE POPULATION
69.91
MALES / 100 FEMALES
143.04
FEMALES / 100 MALES
35.3
MEDIAN AGE
5.0
AVG FAMILY SIZE
2.2
AVG HOUSEHOLD SIZE
163
LABOR FORCE [ PEOPLE ]
41.6%
PERCENT IN LABOR FORCE
15.3%
UNEMPLOYMENT RATE
Income in Brecon
Income Overview in Brecon
| Characteristic | Number | Measure |
| Per Capita Income | 559 | $31,111 |
| Median Family Income | 76 | $0 |
| Mean Family Income | 76 | $78,124 |
| Median Household Income | 253 | $68,890 |
| Mean Household Income | 253 | $69,190 |
| Income Deficit | 76 | $0 |
| Wage / Income Gap (%) | 559 | 63.11% |
| Wage / Income Gap ($) | 559 | 36.89¢ per $1 |
| Gini / Inequality Index | 559 | 0.20 |
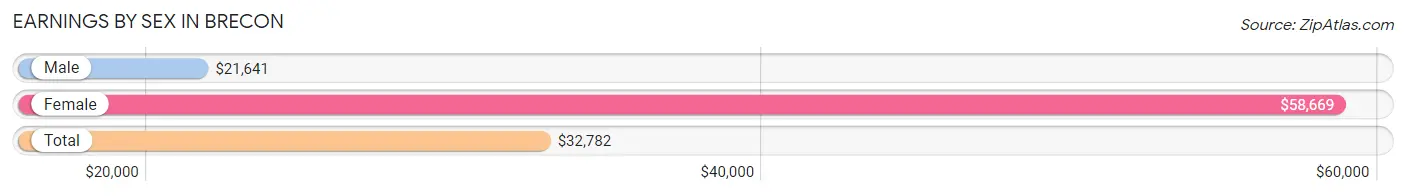
Earnings by Sex in Brecon
Average Earnings in Brecon are $32,782, $21,641 for men and $58,669 for women, a difference of 63.1%.
| Sex | Number | Average Earnings |
| Male | 84 (51.5%) | $21,641 |
| Female | 79 (48.5%) | $58,669 |
| Total | 163 (100.0%) | $32,782 |
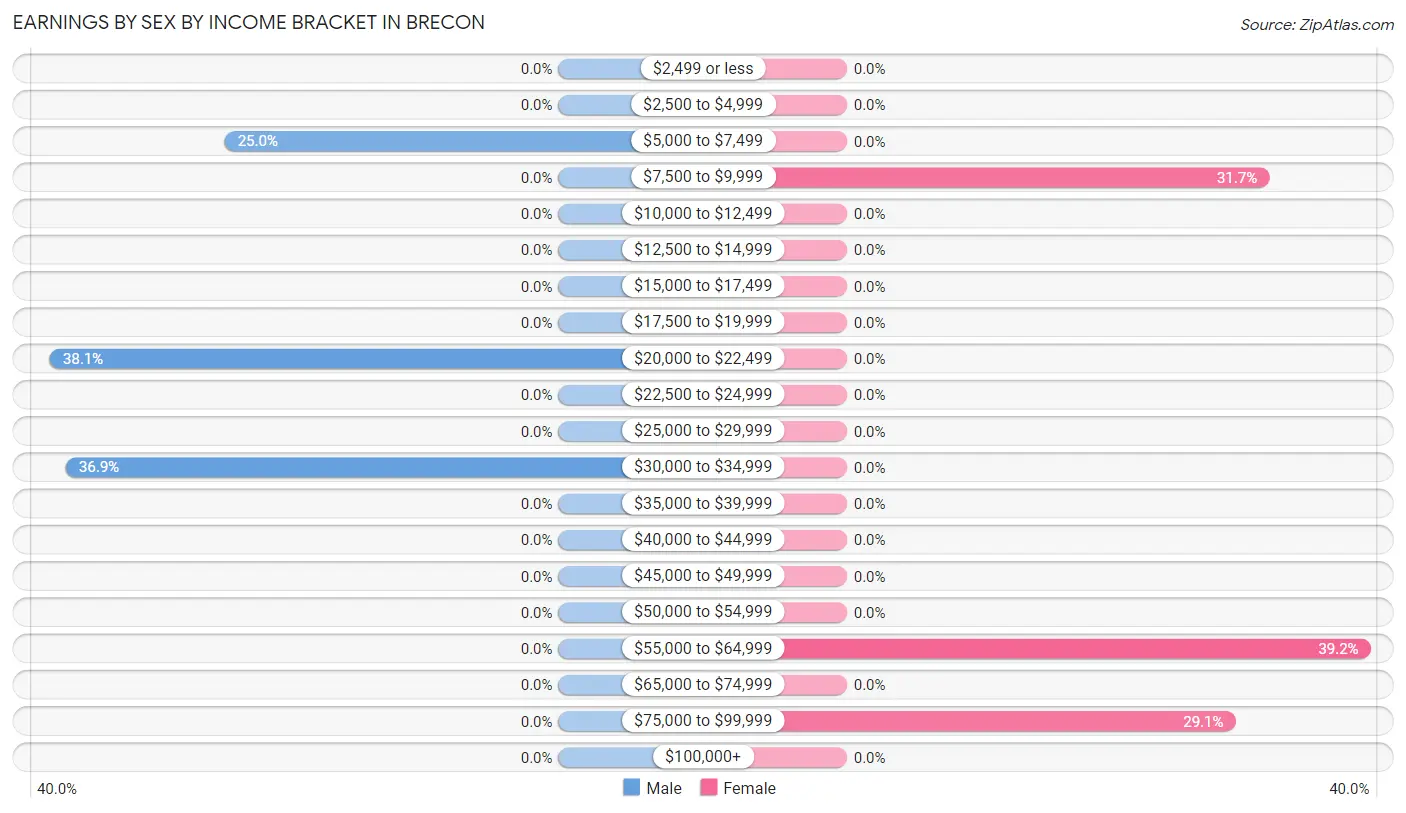
Earnings by Sex by Income Bracket in Brecon
The most common earnings brackets in Brecon are $20,000 to $22,499 for men (32 | 38.1%) and $55,000 to $64,999 for women (31 | 39.2%).
| Income | Male | Female |
| $2,499 or less | 0 (0.0%) | 0 (0.0%) |
| $2,500 to $4,999 | 0 (0.0%) | 0 (0.0%) |
| $5,000 to $7,499 | 21 (25.0%) | 0 (0.0%) |
| $7,500 to $9,999 | 0 (0.0%) | 25 (31.7%) |
| $10,000 to $12,499 | 0 (0.0%) | 0 (0.0%) |
| $12,500 to $14,999 | 0 (0.0%) | 0 (0.0%) |
| $15,000 to $17,499 | 0 (0.0%) | 0 (0.0%) |
| $17,500 to $19,999 | 0 (0.0%) | 0 (0.0%) |
| $20,000 to $22,499 | 32 (38.1%) | 0 (0.0%) |
| $22,500 to $24,999 | 0 (0.0%) | 0 (0.0%) |
| $25,000 to $29,999 | 0 (0.0%) | 0 (0.0%) |
| $30,000 to $34,999 | 31 (36.9%) | 0 (0.0%) |
| $35,000 to $39,999 | 0 (0.0%) | 0 (0.0%) |
| $40,000 to $44,999 | 0 (0.0%) | 0 (0.0%) |
| $45,000 to $49,999 | 0 (0.0%) | 0 (0.0%) |
| $50,000 to $54,999 | 0 (0.0%) | 0 (0.0%) |
| $55,000 to $64,999 | 0 (0.0%) | 31 (39.2%) |
| $65,000 to $74,999 | 0 (0.0%) | 0 (0.0%) |
| $75,000 to $99,999 | 0 (0.0%) | 23 (29.1%) |
| $100,000+ | 0 (0.0%) | 0 (0.0%) |
| Total | 84 (100.0%) | 79 (100.0%) |
Earnings by Sex by Educational Attainment in Brecon
| Educational Attainment | Male Income | Female Income |
| Less than High School | - | - |
| High School Diploma | - | - |
| College or Associate's Degree | - | - |
| Bachelor's Degree | - | - |
| Graduate Degree | - | - |
| Total | - | - |
Family Income in Brecon
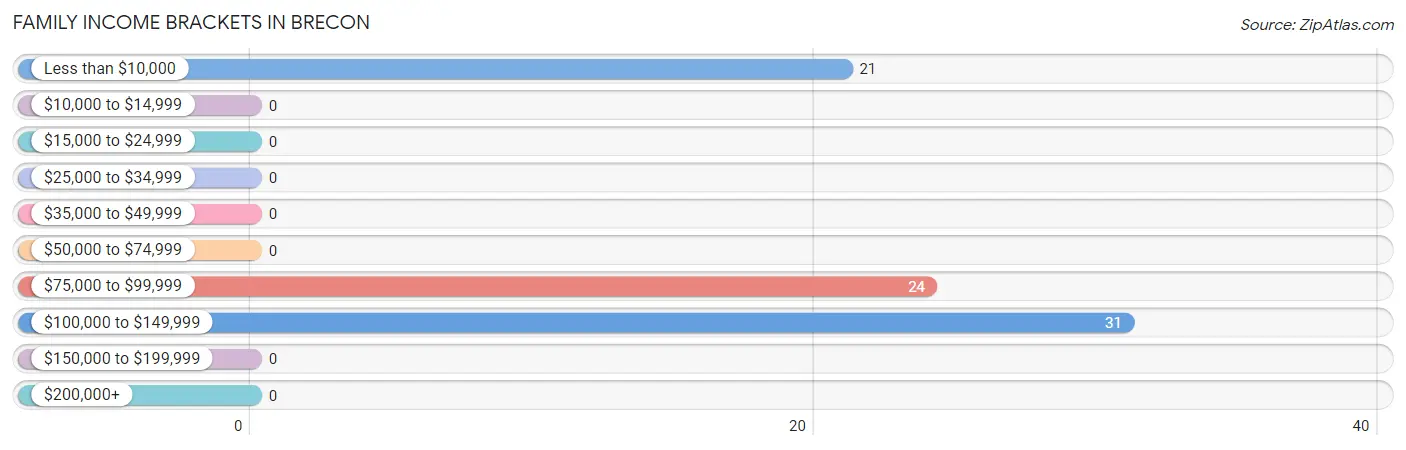
Family Income Brackets in Brecon
According to the Brecon family income data, there are 31 families falling into the $100,000 to $149,999 income range, which is the most common income bracket and makes up 40.8% of all families.
| Income Bracket | # Families | % Families |
| Less than $10,000 | 21 | 27.6% |
| $10,000 to $14,999 | 0 | 0.0% |
| $15,000 to $24,999 | 0 | 0.0% |
| $25,000 to $34,999 | 0 | 0.0% |
| $35,000 to $49,999 | 0 | 0.0% |
| $50,000 to $74,999 | 0 | 0.0% |
| $75,000 to $99,999 | 24 | 31.6% |
| $100,000 to $149,999 | 31 | 40.8% |
| $150,000 to $199,999 | 0 | 0.0% |
| $200,000+ | 0 | 0.0% |
Family Income by Famaliy Size in Brecon
| Income Bracket | # Families | Median Income |
| 2-Person Families | 0 (0.0%) | $0 |
| 3-Person Families | 0 (0.0%) | $0 |
| 4-Person Families | 31 (40.8%) | $0 |
| 5-Person Families | 21 (27.6%) | $0 |
| 6-Person Families | 24 (31.6%) | $0 |
| 7+ Person Families | 0 (0.0%) | $0 |
| Total | 76 (100.0%) | $0 |
Family Income by Number of Earners in Brecon
| Number of Earners | # Families | Median Income |
| No Earners | 0 (0.0%) | $0 |
| 1 Earner | 45 (59.2%) | $0 |
| 2 Earners | 0 (0.0%) | $0 |
| 3+ Earners | 31 (40.8%) | $0 |
| Total | 76 (100.0%) | $0 |
Household Income in Brecon
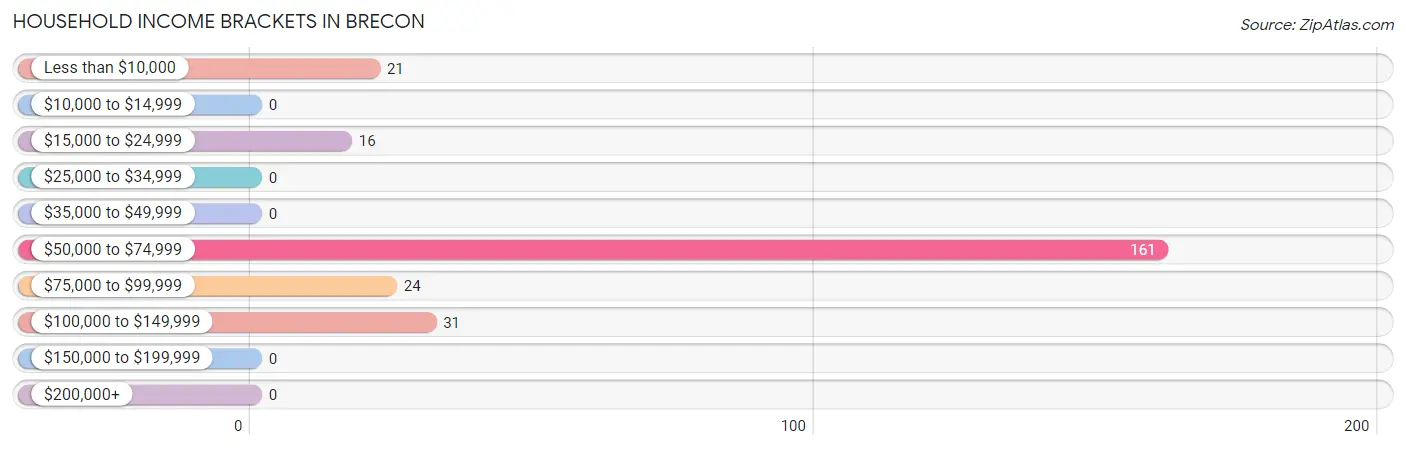
Household Income Brackets in Brecon
With 161 households falling in the category, the $50,000 to $74,999 income range is the most frequent in Brecon, accounting for 63.6% of all households.
| Income Bracket | # Households | % Households |
| Less than $10,000 | 21 | 8.3% |
| $10,000 to $14,999 | 0 | 0.0% |
| $15,000 to $24,999 | 16 | 6.3% |
| $25,000 to $34,999 | 0 | 0.0% |
| $35,000 to $49,999 | 0 | 0.0% |
| $50,000 to $74,999 | 161 | 63.6% |
| $75,000 to $99,999 | 24 | 9.5% |
| $100,000 to $149,999 | 31 | 12.3% |
| $150,000 to $199,999 | 0 | 0.0% |
| $200,000+ | 0 | 0.0% |
Household Income by Householder Age in Brecon
| Income Bracket | # Households | Median Income |
| 15 to 24 Years | 0 (0.0%) | $0 |
| 25 to 44 Years | 45 (17.8%) | $0 |
| 45 to 64 Years | 31 (12.2%) | $0 |
| 65+ Years | 177 (70.0%) | $0 |
| Total | 253 (100.0%) | $68,890 |
Poverty in Brecon
Income Below Poverty by Sex and Age in Brecon
With 31.7% poverty level for males and 14.9% for females among the residents of Brecon, 6 to 11 year old males and 35 to 44 year old females are the most vulnerable to poverty, with 25 males (100.0%) and 28 females (100.0%) in their respective age groups living below the poverty level.
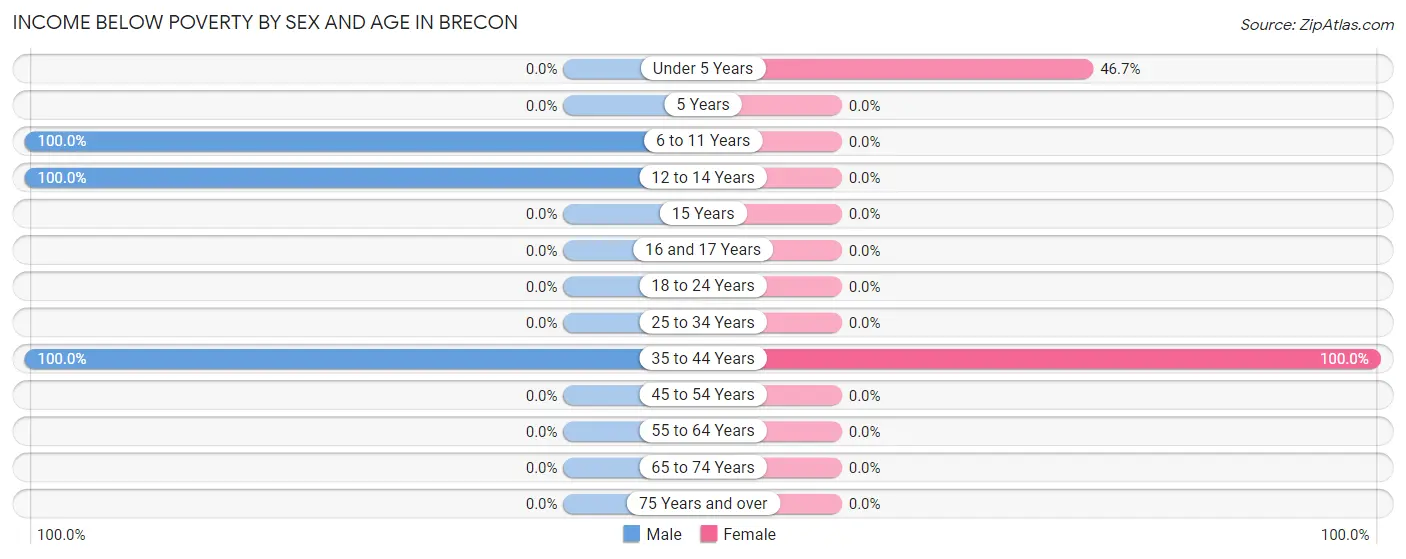
| Age Bracket | Male | Female |
| Under 5 Years | 0 (0.0%) | 21 (46.7%) |
| 5 Years | 0 (0.0%) | 0 (0.0%) |
| 6 to 11 Years | 25 (100.0%) | 0 (0.0%) |
| 12 to 14 Years | 27 (100.0%) | 0 (0.0%) |
| 15 Years | 0 (0.0%) | 0 (0.0%) |
| 16 and 17 Years | 0 (0.0%) | 0 (0.0%) |
| 18 to 24 Years | 0 (0.0%) | 0 (0.0%) |
| 25 to 34 Years | 0 (0.0%) | 0 (0.0%) |
| 35 to 44 Years | 21 (100.0%) | 28 (100.0%) |
| 45 to 54 Years | 0 (0.0%) | 0 (0.0%) |
| 55 to 64 Years | 0 (0.0%) | 0 (0.0%) |
| 65 to 74 Years | 0 (0.0%) | 0 (0.0%) |
| 75 Years and over | 0 (0.0%) | 0 (0.0%) |
| Total | 73 (31.7%) | 49 (14.9%) |
Income Above Poverty by Sex and Age in Brecon
According to the poverty statistics in Brecon, males aged under 5 years and females aged 18 to 24 years are the age groups that are most secure financially, with 100.0% of males and 100.0% of females in these age groups living above the poverty line.
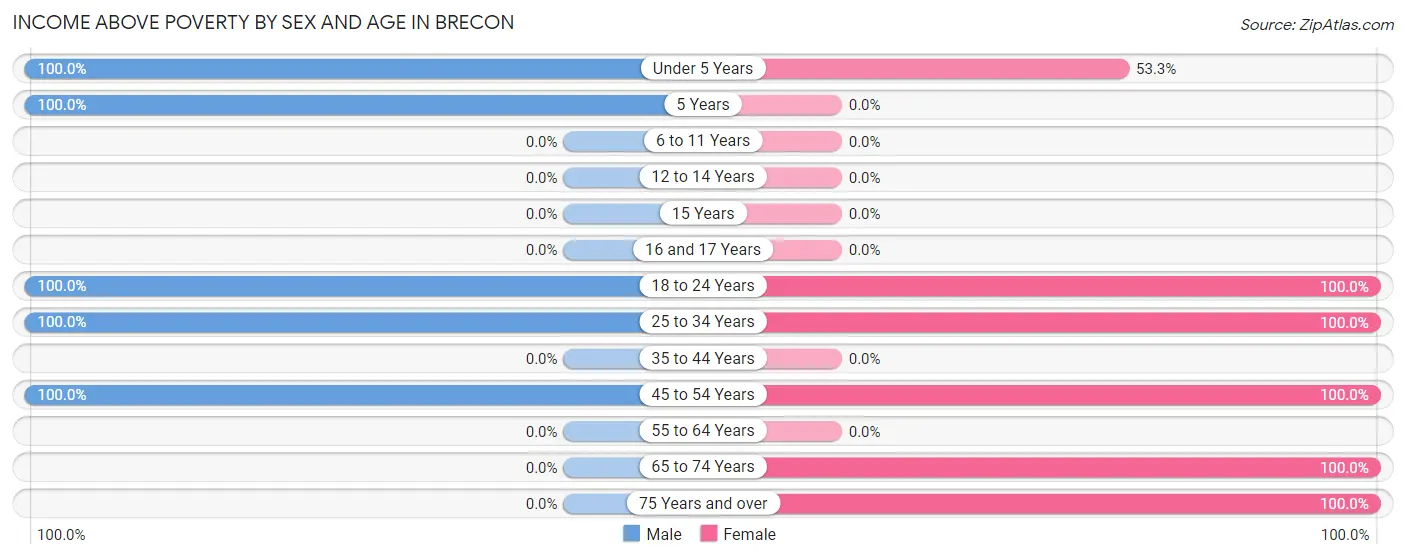
| Age Bracket | Male | Female |
| Under 5 Years | 46 (100.0%) | 24 (53.3%) |
| 5 Years | 24 (100.0%) | 0 (0.0%) |
| 6 to 11 Years | 0 (0.0%) | 0 (0.0%) |
| 12 to 14 Years | 0 (0.0%) | 0 (0.0%) |
| 15 Years | 0 (0.0%) | 0 (0.0%) |
| 16 and 17 Years | 0 (0.0%) | 0 (0.0%) |
| 18 to 24 Years | 32 (100.0%) | 25 (100.0%) |
| 25 to 34 Years | 24 (100.0%) | 23 (100.0%) |
| 35 to 44 Years | 0 (0.0%) | 0 (0.0%) |
| 45 to 54 Years | 31 (100.0%) | 31 (100.0%) |
| 55 to 64 Years | 0 (0.0%) | 0 (0.0%) |
| 65 to 74 Years | 0 (0.0%) | 161 (100.0%) |
| 75 Years and over | 0 (0.0%) | 16 (100.0%) |
| Total | 157 (68.3%) | 280 (85.1%) |
Income Below Poverty Among Married-Couple Families in Brecon
The poverty statistics for married-couple families in Brecon show that 27.6% or 21 of the total 76 families live below the poverty line. Families with 3 or 4 children have the highest poverty rate of 46.7%, comprising of 21 families. On the other hand, families with no children have the lowest poverty rate of 0.0%, which includes 0 families.
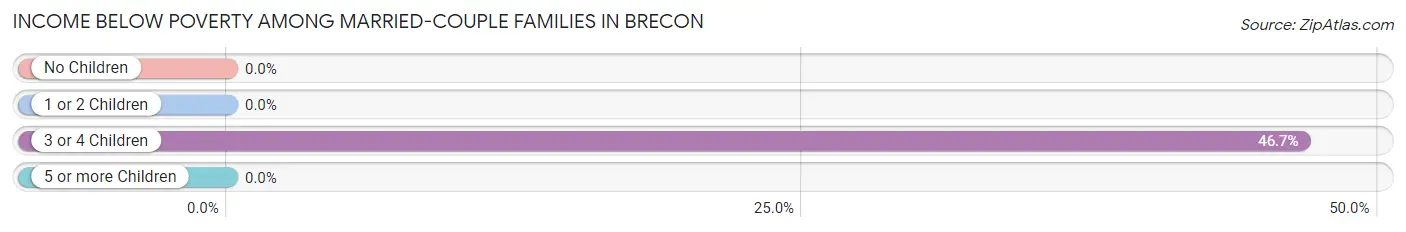
| Children | Above Poverty | Below Poverty |
| No Children | 31 (100.0%) | 0 (0.0%) |
| 1 or 2 Children | 0 (0.0%) | 0 (0.0%) |
| 3 or 4 Children | 24 (53.3%) | 21 (46.7%) |
| 5 or more Children | 0 (0.0%) | 0 (0.0%) |
| Total | 55 (72.4%) | 21 (27.6%) |
Income Below Poverty Among Single-Parent Households in Brecon
| Children | Single Father | Single Mother |
| No Children | 0 (0.0%) | 0 (0.0%) |
| 1 or 2 Children | 0 (0.0%) | 0 (0.0%) |
| 3 or 4 Children | 0 (0.0%) | 0 (0.0%) |
| 5 or more Children | 0 (0.0%) | 0 (0.0%) |
| Total | 0 (0.0%) | 0 (0.0%) |
Income Below Poverty Among Married-Couple vs Single-Parent Households in Brecon
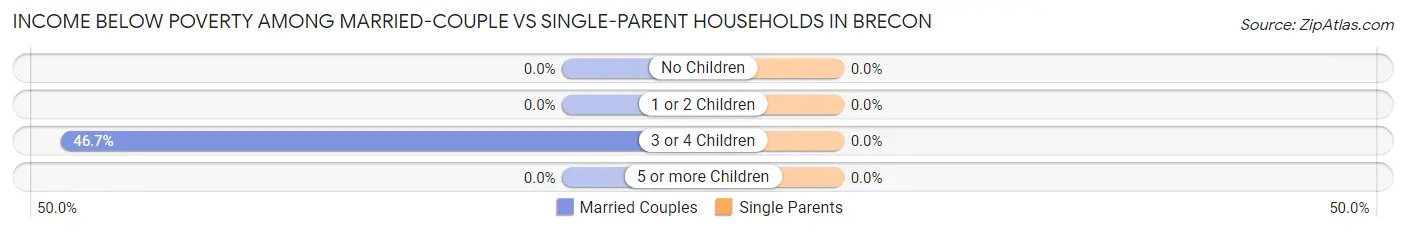
| Children | Married-Couple Families | Single-Parent Households |
| No Children | 0 (0.0%) | 0 (0.0%) |
| 1 or 2 Children | 0 (0.0%) | 0 (0.0%) |
| 3 or 4 Children | 21 (46.7%) | 0 (0.0%) |
| 5 or more Children | 0 (0.0%) | 0 (0.0%) |
| Total | 21 (27.6%) | 0 (0.0%) |
Race in Brecon
The most populous races in Brecon are White / Caucasian (437 | 78.2%), Hispanic or Latino (122 | 21.8%), and Some other Race (122 | 21.8%).
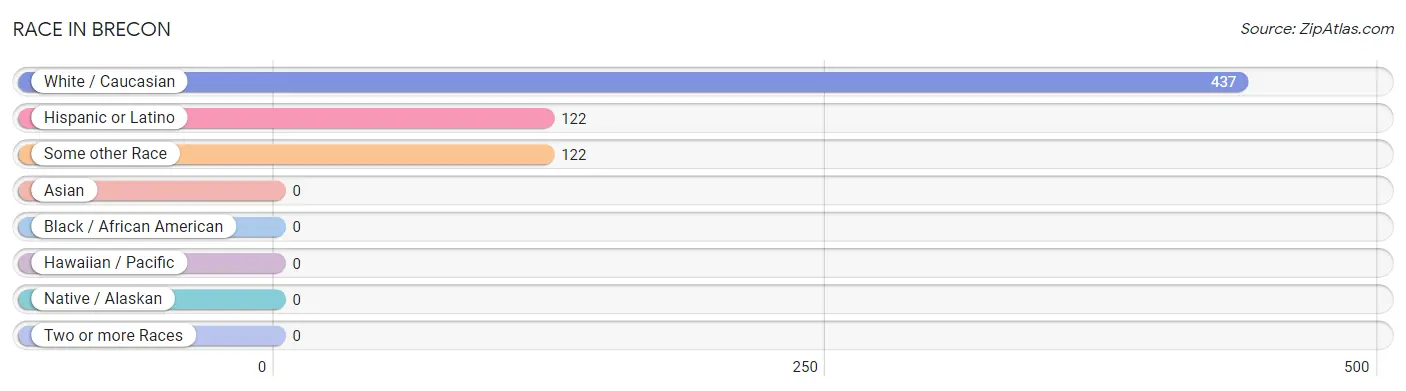
| Race | # Population | % Population |
| Asian | 0 | 0.0% |
| Black / African American | 0 | 0.0% |
| Hawaiian / Pacific | 0 | 0.0% |
| Hispanic or Latino | 122 | 21.8% |
| Native / Alaskan | 0 | 0.0% |
| White / Caucasian | 437 | 78.2% |
| Two or more Races | 0 | 0.0% |
| Some other Race | 122 | 21.8% |
| Total | 559 | 100.0% |
Ancestry in Brecon
The most populous ancestries reported in Brecon are German (161 | 28.8%), Central American (122 | 21.8%), and Guatemalan (122 | 21.8%), together accounting for 72.4% of all Brecon residents.
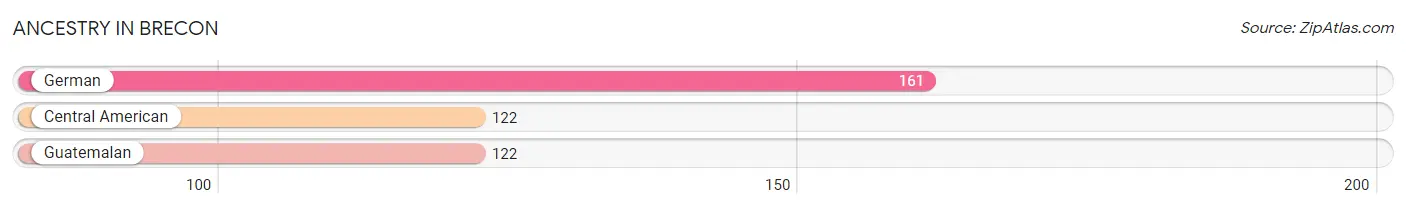
| Ancestry | # Population | % Population |
| Central American | 122 | 21.8% |
| German | 161 | 28.8% |
| Guatemalan | 122 | 21.8% | View All 3 Rows |
Immigrants in Brecon
The most numerous immigrant groups reported in Brecon came from Central America (122 | 21.8%), Guatemala (122 | 21.8%), and Latin America (122 | 21.8%), together accounting for 65.5% of all Brecon residents.
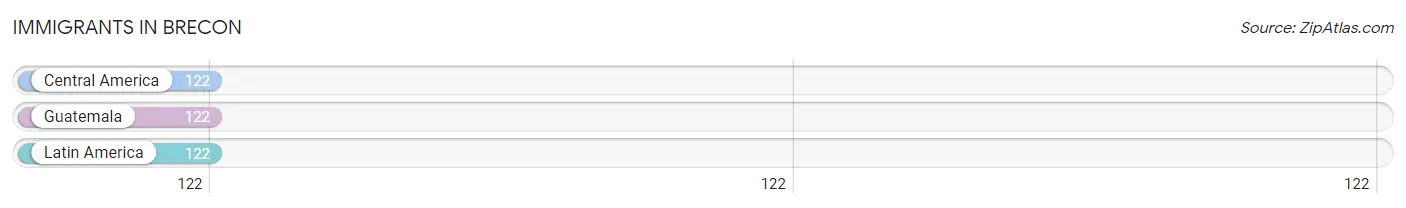
| Immigration Origin | # Population | % Population |
| Central America | 122 | 21.8% |
| Guatemala | 122 | 21.8% |
| Latin America | 122 | 21.8% | View All 3 Rows |
Sex and Age in Brecon
Sex and Age in Brecon
The most populous age groups in Brecon are 5 to 9 Years (49 | 21.3%) for men and 70 to 74 Years (161 | 48.9%) for women.
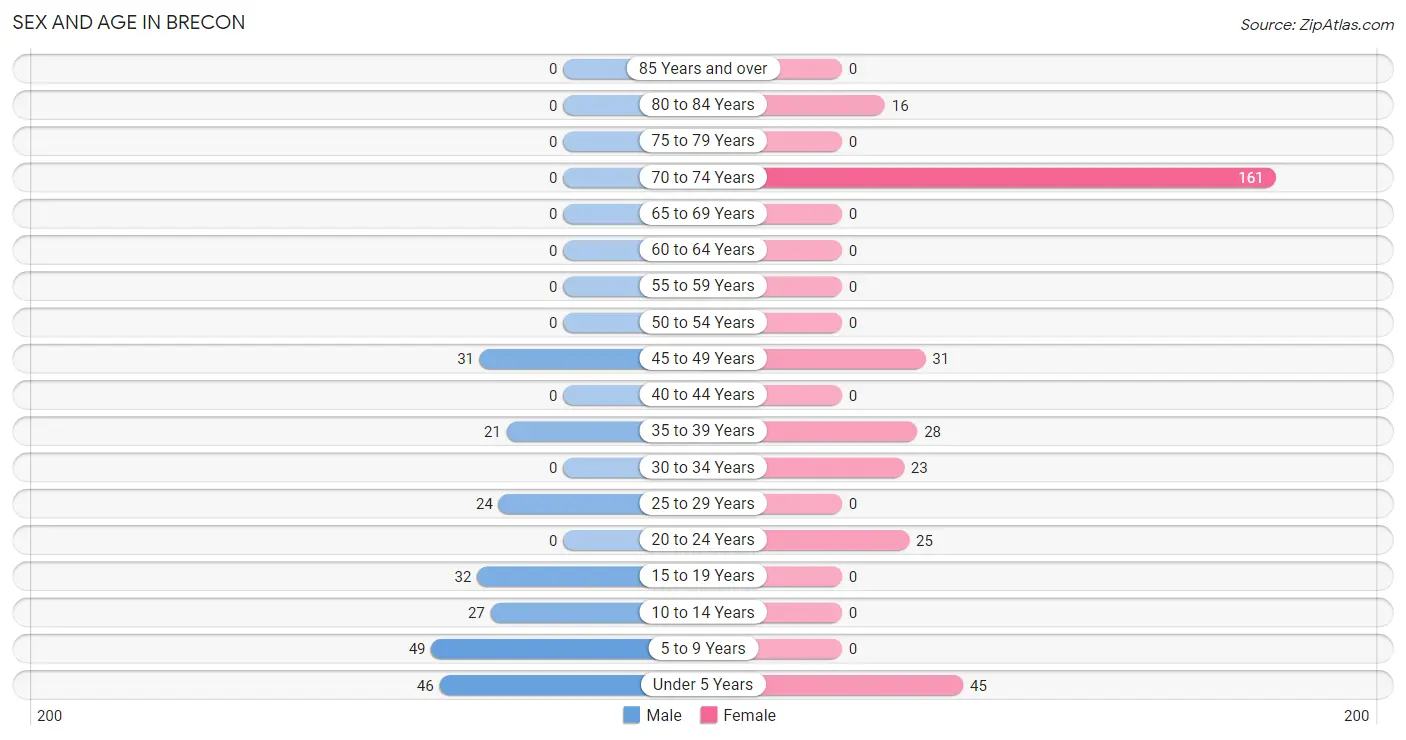
| Age Bracket | Male | Female |
| Under 5 Years | 46 (20.0%) | 45 (13.7%) |
| 5 to 9 Years | 49 (21.3%) | 0 (0.0%) |
| 10 to 14 Years | 27 (11.7%) | 0 (0.0%) |
| 15 to 19 Years | 32 (13.9%) | 0 (0.0%) |
| 20 to 24 Years | 0 (0.0%) | 25 (7.6%) |
| 25 to 29 Years | 24 (10.4%) | 0 (0.0%) |
| 30 to 34 Years | 0 (0.0%) | 23 (7.0%) |
| 35 to 39 Years | 21 (9.1%) | 28 (8.5%) |
| 40 to 44 Years | 0 (0.0%) | 0 (0.0%) |
| 45 to 49 Years | 31 (13.5%) | 31 (9.4%) |
| 50 to 54 Years | 0 (0.0%) | 0 (0.0%) |
| 55 to 59 Years | 0 (0.0%) | 0 (0.0%) |
| 60 to 64 Years | 0 (0.0%) | 0 (0.0%) |
| 65 to 69 Years | 0 (0.0%) | 0 (0.0%) |
| 70 to 74 Years | 0 (0.0%) | 161 (48.9%) |
| 75 to 79 Years | 0 (0.0%) | 0 (0.0%) |
| 80 to 84 Years | 0 (0.0%) | 16 (4.9%) |
| 85 Years and over | 0 (0.0%) | 0 (0.0%) |
| Total | 230 (100.0%) | 329 (100.0%) |
Families and Households in Brecon
Median Family Size in Brecon
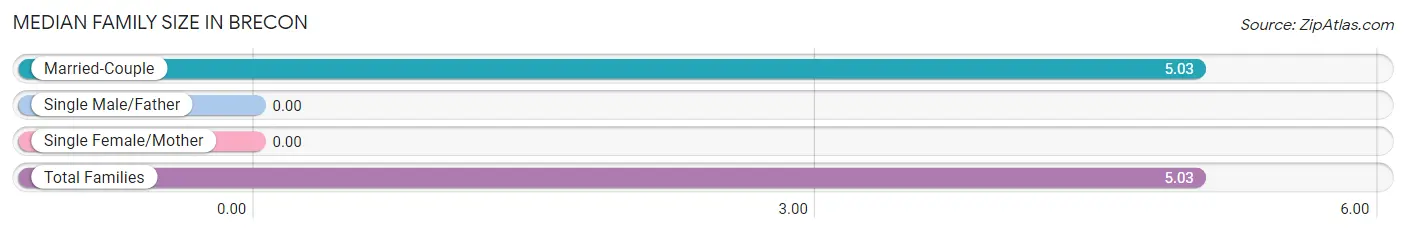
| Family Type | # Families | Family Size |
| Married-Couple | 76 (100.0%) | 5.03 |
| Single Male/Father | 0 (0.0%) | - |
| Single Female/Mother | 0 (0.0%) | - |
| Total Families | 76 (100.0%) | 5.03 |
Median Household Size in Brecon
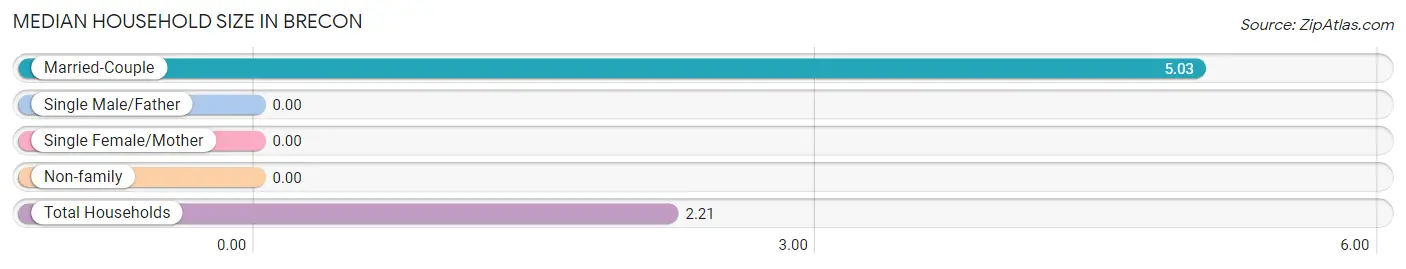
| Household Type | # Households | Household Size |
| Married-Couple | 76 (30.0%) | 5.03 |
| Single Male/Father | 0 (0.0%) | - |
| Single Female/Mother | 0 (0.0%) | - |
| Non-family | 177 (70.0%) | - |
| Total Households | 253 (100.0%) | 2.21 |
Household Size by Marriage Status in Brecon
Out of a total of 253 households in Brecon, 76 (30.0%) are family households, while 177 (70.0%) are nonfamily households. The most numerous type of family households are 4-person households, comprising 31, and the most common type of nonfamily households are 1-person households, comprising 177.
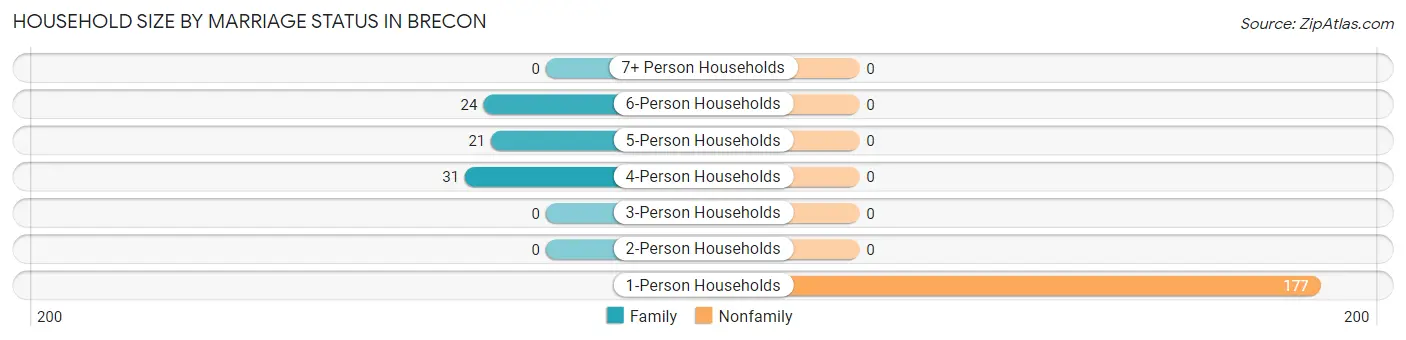
| Household Size | Family Households | Nonfamily Households |
| 1-Person Households | - | 177 (70.0%) |
| 2-Person Households | 0 (0.0%) | 0 (0.0%) |
| 3-Person Households | 0 (0.0%) | 0 (0.0%) |
| 4-Person Households | 31 (12.2%) | 0 (0.0%) |
| 5-Person Households | 21 (8.3%) | 0 (0.0%) |
| 6-Person Households | 24 (9.5%) | 0 (0.0%) |
| 7+ Person Households | 0 (0.0%) | 0 (0.0%) |
| Total | 76 (30.0%) | 177 (70.0%) |
Female Fertility in Brecon
Fertility by Age in Brecon
Average fertility rate in Brecon is 215.0 births per 1,000 women. Women in the age bracket of 20 to 34 years have the highest fertility rate with 479.0 births per 1,000 women. Women in the age bracket of 20 to 34 years acount for 100.0% of all women with births.
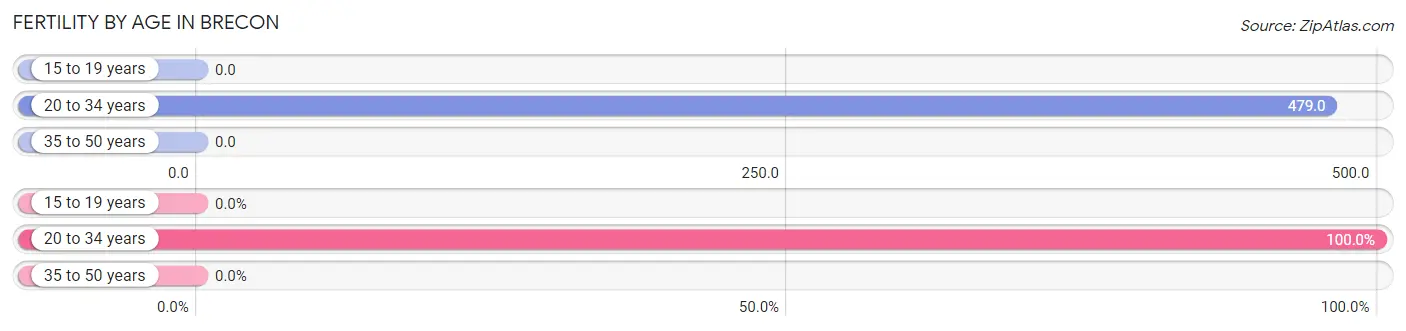
| Age Bracket | Women with Births | Births / 1,000 Women |
| 15 to 19 years | 0 (0.0%) | 0.0 |
| 20 to 34 years | 23 (100.0%) | 479.0 |
| 35 to 50 years | 0 (0.0%) | 0.0 |
| Total | 23 (100.0%) | 215.0 |
Fertility by Age by Marriage Status in Brecon
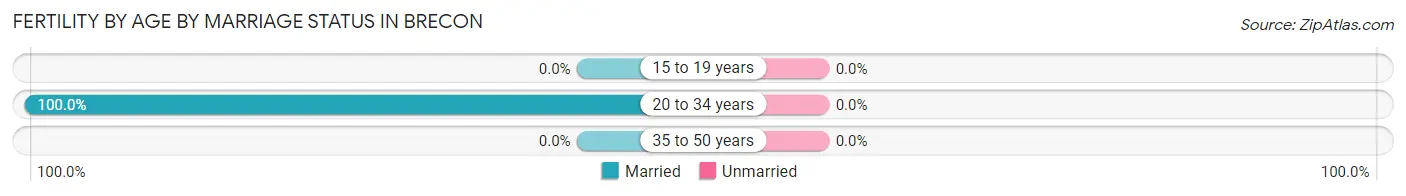
| Age Bracket | Married | Unmarried |
| 15 to 19 years | 0 (0.0%) | 0 (0.0%) |
| 20 to 34 years | 23 (100.0%) | 0 (0.0%) |
| 35 to 50 years | 0 (0.0%) | 0 (0.0%) |
| Total | 23 (100.0%) | 0 (0.0%) |
Fertility by Education in Brecon
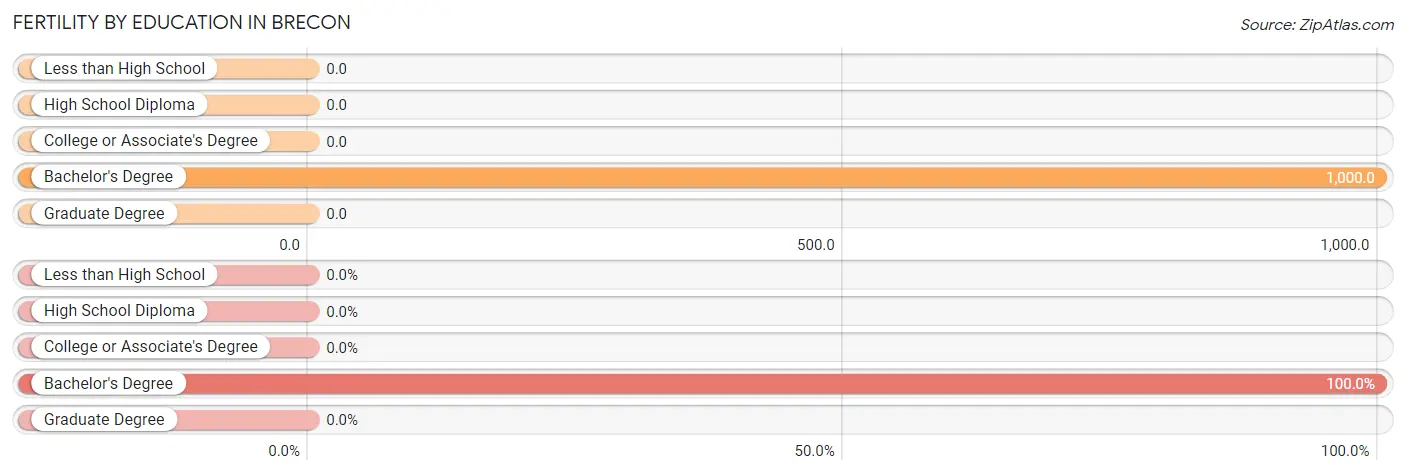
| Educational Attainment | Women with Births | Births / 1,000 Women |
| Less than High School | 0 (0.0%) | 0.0 |
| High School Diploma | 0 (0.0%) | 0.0 |
| College or Associate's Degree | 0 (0.0%) | 0.0 |
| Bachelor's Degree | 23 (100.0%) | 1,000.0 |
| Graduate Degree | 0 (0.0%) | 0.0 |
| Total | 23 (100.0%) | 215.0 |
Fertility by Education by Marriage Status in Brecon
| Educational Attainment | Married | Unmarried |
| Less than High School | 0 (0.0%) | 0 (0.0%) |
| High School Diploma | 0 (0.0%) | 0 (0.0%) |
| College or Associate's Degree | 0 (0.0%) | 0 (0.0%) |
| Bachelor's Degree | 23 (100.0%) | 0 (0.0%) |
| Graduate Degree | 0 (0.0%) | 0 (0.0%) |
| Total | 23 (100.0%) | 0 (0.0%) |
Employment Characteristics in Brecon
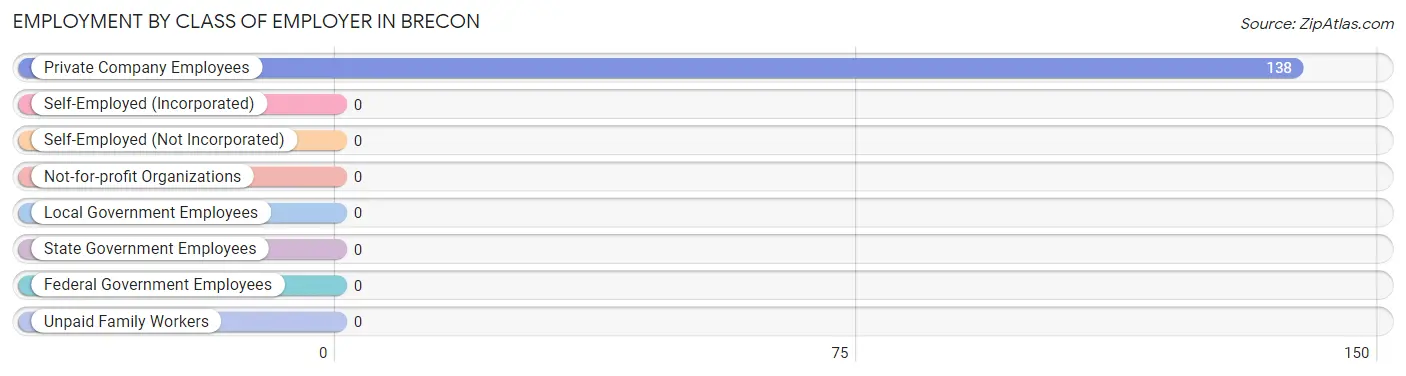
Employment by Class of Employer in Brecon
Among the 138 employed individuals in Brecon, , and private company employees (138 | 100.0%) make up the most common classes of employment.
| Employer Class | # Employees | % Employees |
| Private Company Employees | 138 | 100.0% |
| Self-Employed (Incorporated) | 0 | 0.0% |
| Self-Employed (Not Incorporated) | 0 | 0.0% |
| Not-for-profit Organizations | 0 | 0.0% |
| Local Government Employees | 0 | 0.0% |
| State Government Employees | 0 | 0.0% |
| Federal Government Employees | 0 | 0.0% |
| Unpaid Family Workers | 0 | 0.0% |
| Total | 138 | 100.0% |
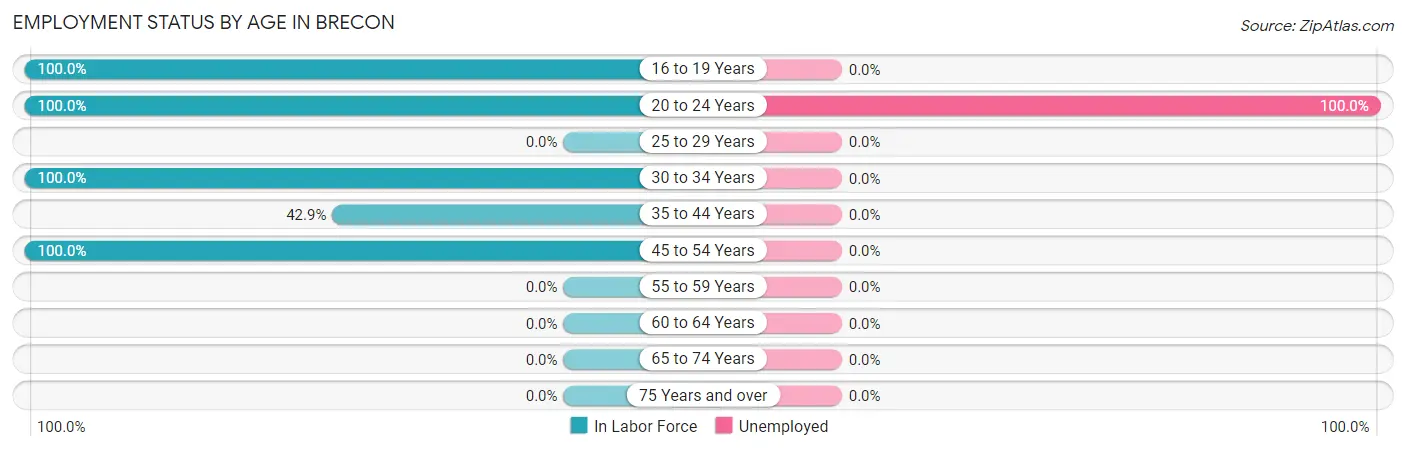
Employment Status by Age in Brecon
According to the labor force statistics for Brecon, out of the total population over 16 years of age (392), 41.6% or 163 individuals are in the labor force, with 15.3% or 25 of them unemployed. The age group with the highest labor force participation rate is 16 to 19 years, with 100.0% or 32 individuals in the labor force. Within the labor force, the 20 to 24 years age range has the highest percentage of unemployed individuals, with 100.0% or 25 of them being unemployed.
| Age Bracket | In Labor Force | Unemployed |
| 16 to 19 Years | 32 (100.0%) | 0 (0.0%) |
| 20 to 24 Years | 25 (100.0%) | 25 (100.0%) |
| 25 to 29 Years | 0 (0.0%) | 0 (0.0%) |
| 30 to 34 Years | 23 (100.0%) | 0 (0.0%) |
| 35 to 44 Years | 21 (42.9%) | 0 (0.0%) |
| 45 to 54 Years | 62 (100.0%) | 0 (0.0%) |
| 55 to 59 Years | 0 (0.0%) | 0 (0.0%) |
| 60 to 64 Years | 0 (0.0%) | 0 (0.0%) |
| 65 to 74 Years | 0 (0.0%) | 0 (0.0%) |
| 75 Years and over | 0 (0.0%) | 0 (0.0%) |
| Total | 163 (41.6%) | 25 (15.3%) |
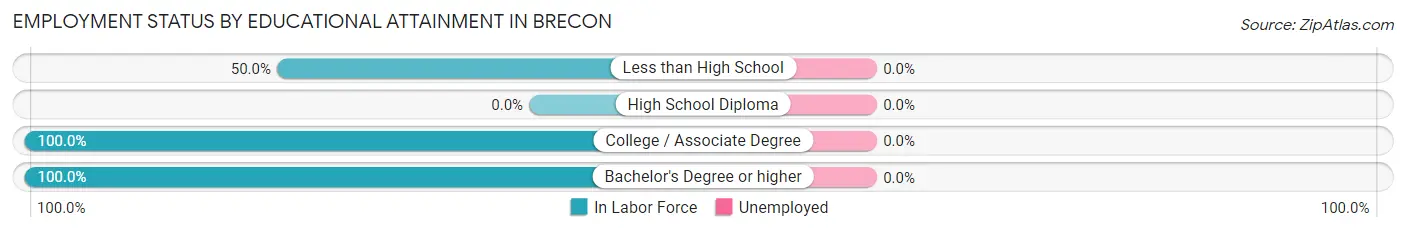
Employment Status by Educational Attainment in Brecon
| Educational Attainment | In Labor Force | Unemployed |
| Less than High School | 52 (50.0%) | 0 (0.0%) |
| High School Diploma | 0 (0.0%) | 0 (0.0%) |
| College / Associate Degree | 31 (100.0%) | 0 (0.0%) |
| Bachelor's Degree or higher | 23 (100.0%) | 0 (0.0%) |
| Total | 106 (67.1%) | 0 (0.0%) |
Employment Occupations by Sex in Brecon
Management, Business, Science and Arts Occupations
The most common Management, Business, Science and Arts occupations in Brecon are Health Diagnosing & Treating (54 | 39.1%), and Health Technologists (23 | 16.7%).
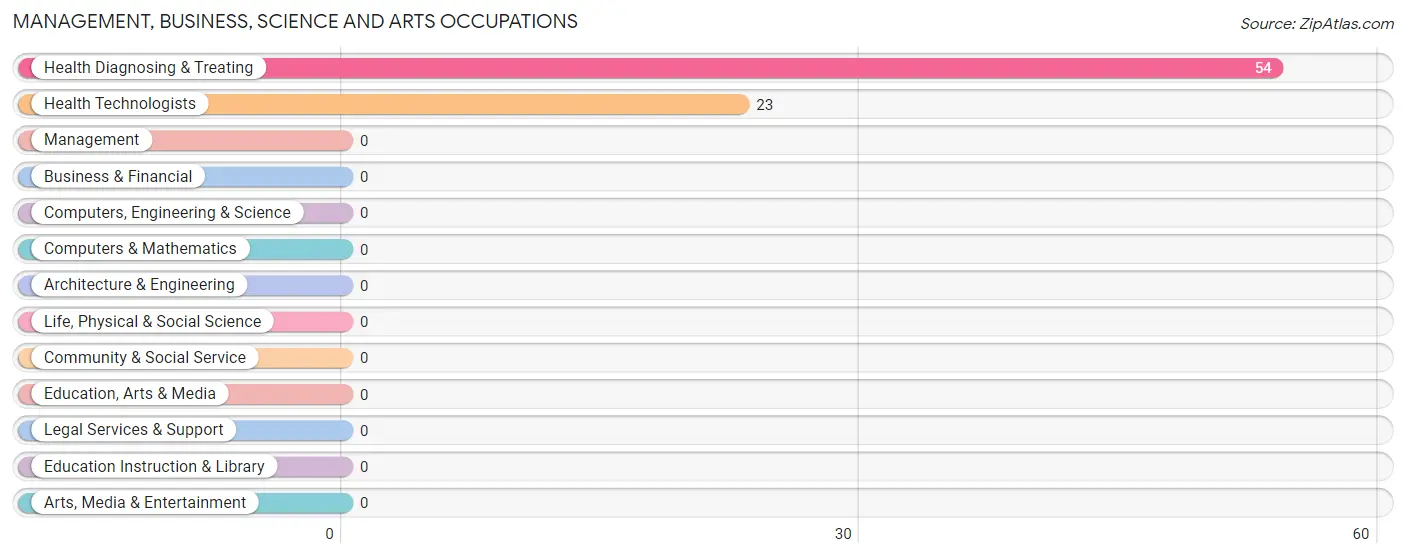
Management, Business, Science and Arts Occupations by Sex
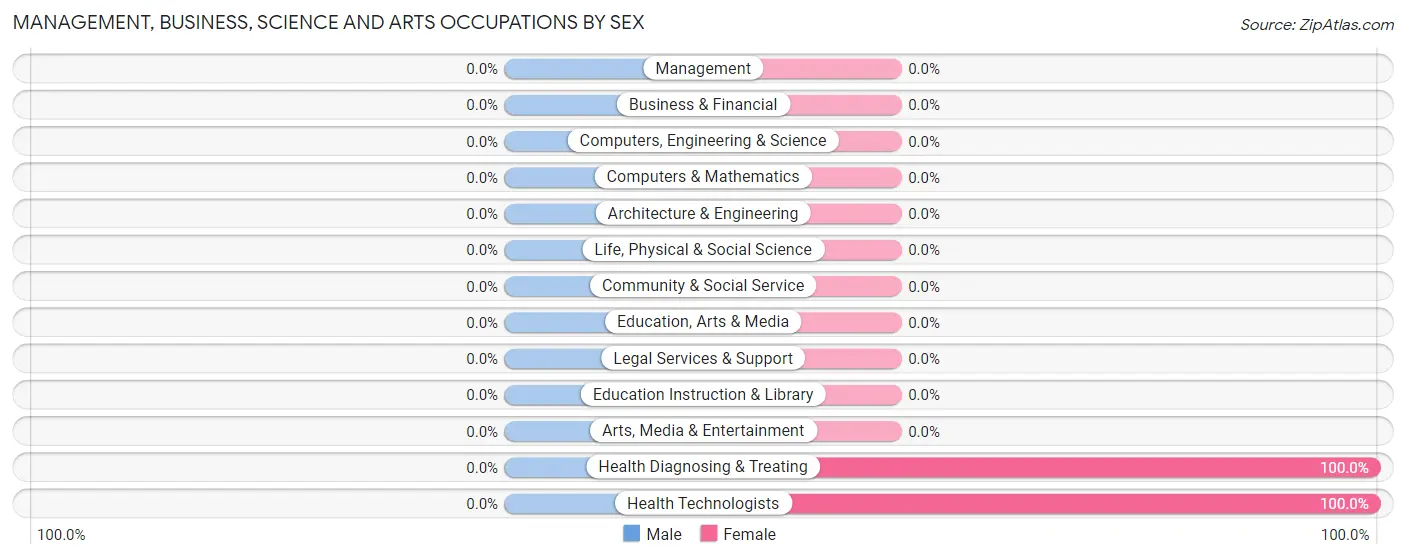
| Occupation | Male | Female |
| Management | 0 (0.0%) | 0 (0.0%) |
| Business & Financial | 0 (0.0%) | 0 (0.0%) |
| Computers, Engineering & Science | 0 (0.0%) | 0 (0.0%) |
| Computers & Mathematics | 0 (0.0%) | 0 (0.0%) |
| Architecture & Engineering | 0 (0.0%) | 0 (0.0%) |
| Life, Physical & Social Science | 0 (0.0%) | 0 (0.0%) |
| Community & Social Service | 0 (0.0%) | 0 (0.0%) |
| Education, Arts & Media | 0 (0.0%) | 0 (0.0%) |
| Legal Services & Support | 0 (0.0%) | 0 (0.0%) |
| Education Instruction & Library | 0 (0.0%) | 0 (0.0%) |
| Arts, Media & Entertainment | 0 (0.0%) | 0 (0.0%) |
| Health Diagnosing & Treating | 0 (0.0%) | 54 (100.0%) |
| Health Technologists | 0 (0.0%) | 23 (100.0%) |
| Total (Category) | 0 (0.0%) | 54 (100.0%) |
| Total (Overall) | 84 (60.9%) | 54 (39.1%) |
Services Occupations
The most common Services occupations in Brecon are , and Food Preparation & Serving (32 | 23.2%).
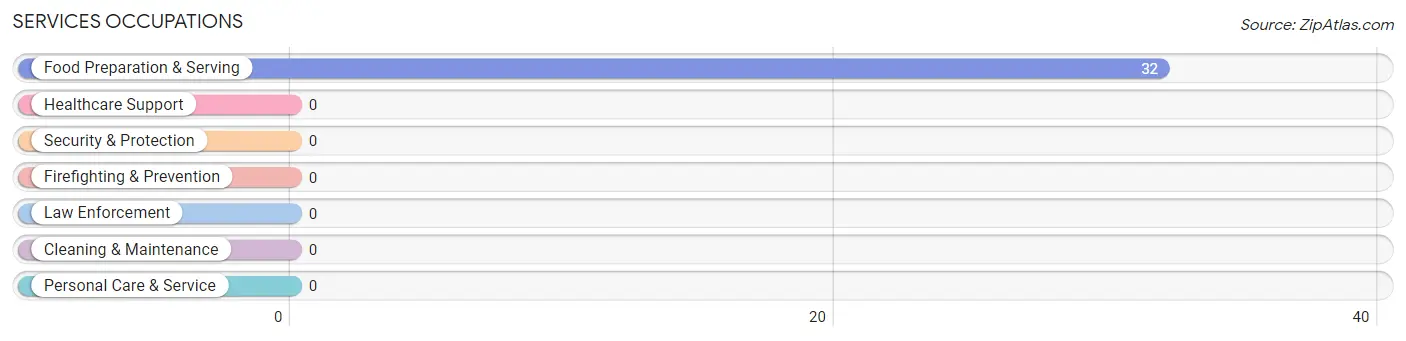
Services Occupations by Sex
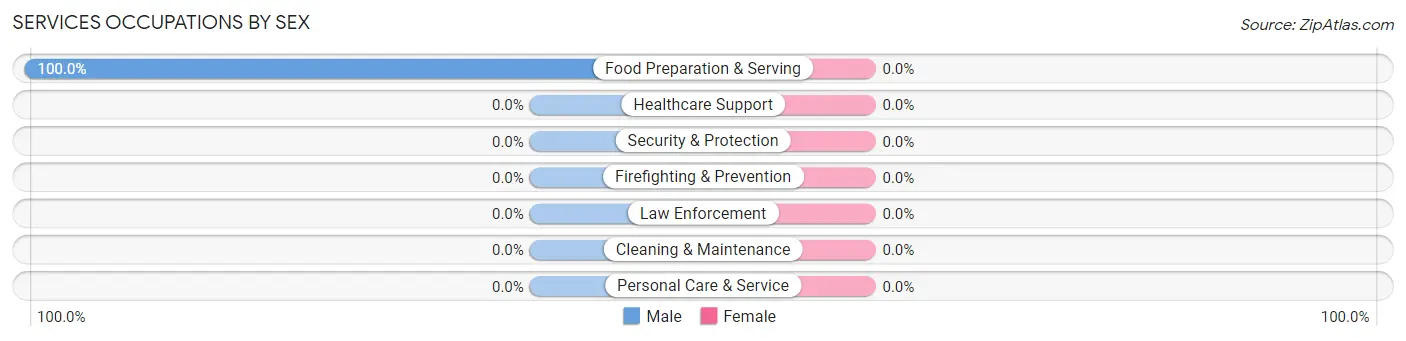
| Occupation | Male | Female |
| Healthcare Support | 0 (0.0%) | 0 (0.0%) |
| Security & Protection | 0 (0.0%) | 0 (0.0%) |
| Firefighting & Prevention | 0 (0.0%) | 0 (0.0%) |
| Law Enforcement | 0 (0.0%) | 0 (0.0%) |
| Food Preparation & Serving | 32 (100.0%) | 0 (0.0%) |
| Cleaning & Maintenance | 0 (0.0%) | 0 (0.0%) |
| Personal Care & Service | 0 (0.0%) | 0 (0.0%) |
| Total (Category) | 32 (100.0%) | 0 (0.0%) |
| Total (Overall) | 84 (60.9%) | 54 (39.1%) |
Sales and Office Occupations
Sales and Office Occupations by Sex
| Occupation | Male | Female |
| Sales & Related | 0 (0.0%) | 0 (0.0%) |
| Office & Administration | 0 (0.0%) | 0 (0.0%) |
| Total (Category) | 0 (0.0%) | 0 (0.0%) |
| Total (Overall) | 84 (60.9%) | 54 (39.1%) |
Natural Resources, Construction and Maintenance Occupations
The most common Natural Resources, Construction and Maintenance occupations in Brecon are , and Construction & Extraction (21 | 15.2%).
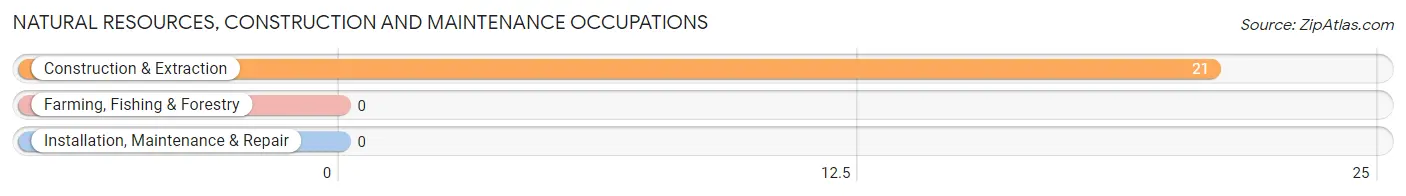
Natural Resources, Construction and Maintenance Occupations by Sex
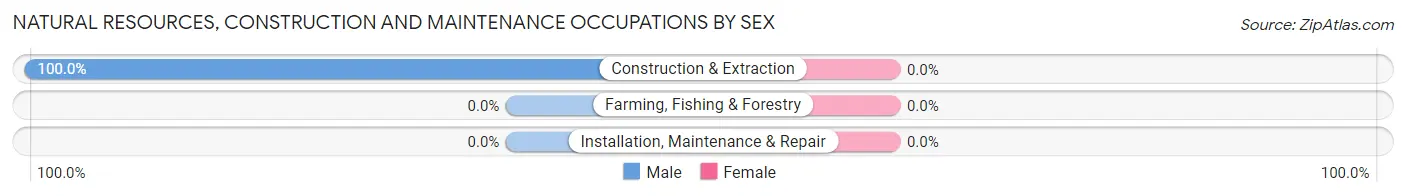
| Occupation | Male | Female |
| Farming, Fishing & Forestry | 0 (0.0%) | 0 (0.0%) |
| Construction & Extraction | 21 (100.0%) | 0 (0.0%) |
| Installation, Maintenance & Repair | 0 (0.0%) | 0 (0.0%) |
| Total (Category) | 21 (100.0%) | 0 (0.0%) |
| Total (Overall) | 84 (60.9%) | 54 (39.1%) |
Production, Transportation and Moving Occupations
The most common Production, Transportation and Moving occupations in Brecon are , and Transportation (31 | 22.5%).
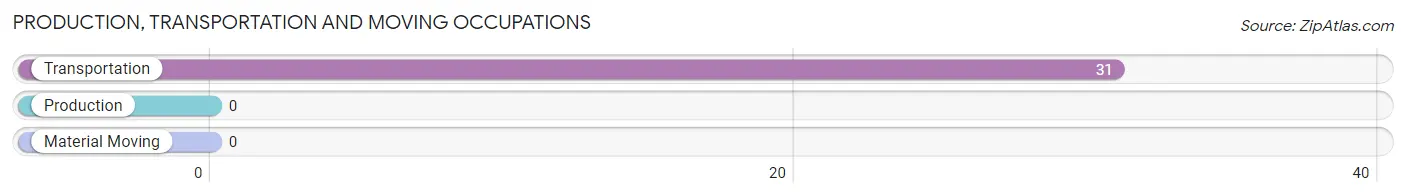
Production, Transportation and Moving Occupations by Sex
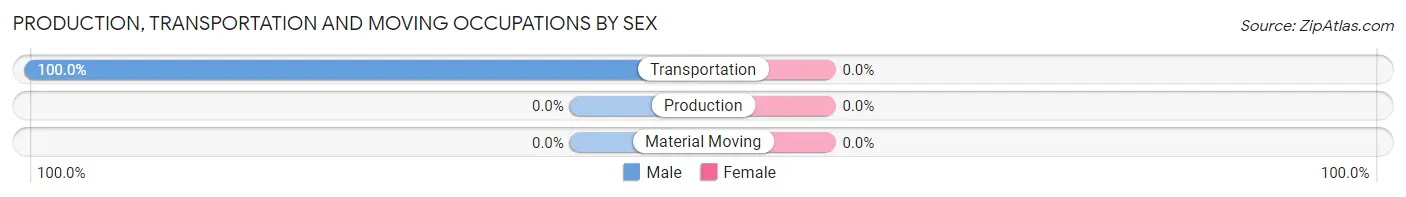
| Occupation | Male | Female |
| Production | 0 (0.0%) | 0 (0.0%) |
| Transportation | 31 (100.0%) | 0 (0.0%) |
| Material Moving | 0 (0.0%) | 0 (0.0%) |
| Total (Category) | 31 (100.0%) | 0 (0.0%) |
| Total (Overall) | 84 (60.9%) | 54 (39.1%) |
Employment Industries by Sex in Brecon
Employment Industries in Brecon
The major employment industries in Brecon include Health Care & Social Assistance (54 | 39.1%), Accommodation & Food Services (32 | 23.2%), Retail Trade (31 | 22.5%), and Construction (21 | 15.2%).
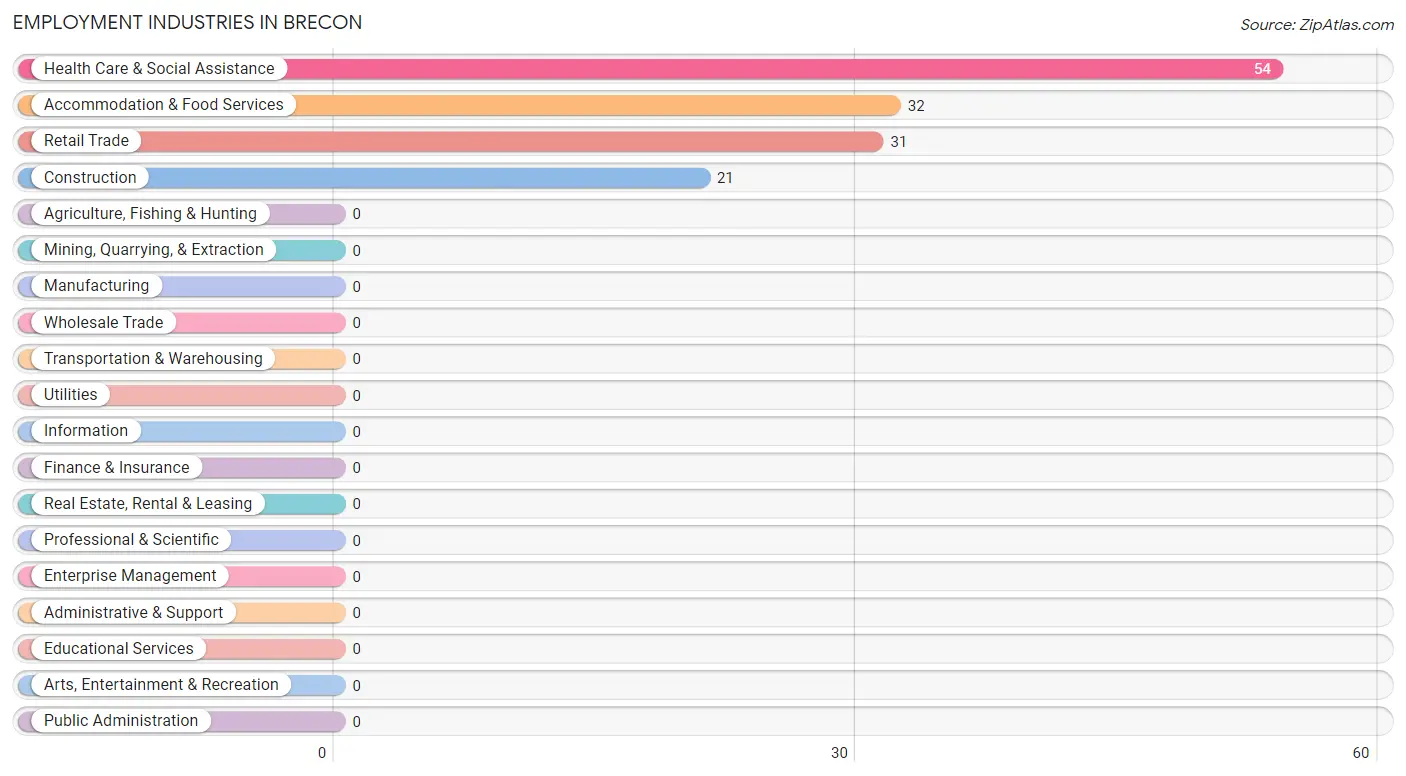
Employment Industries by Sex in Brecon
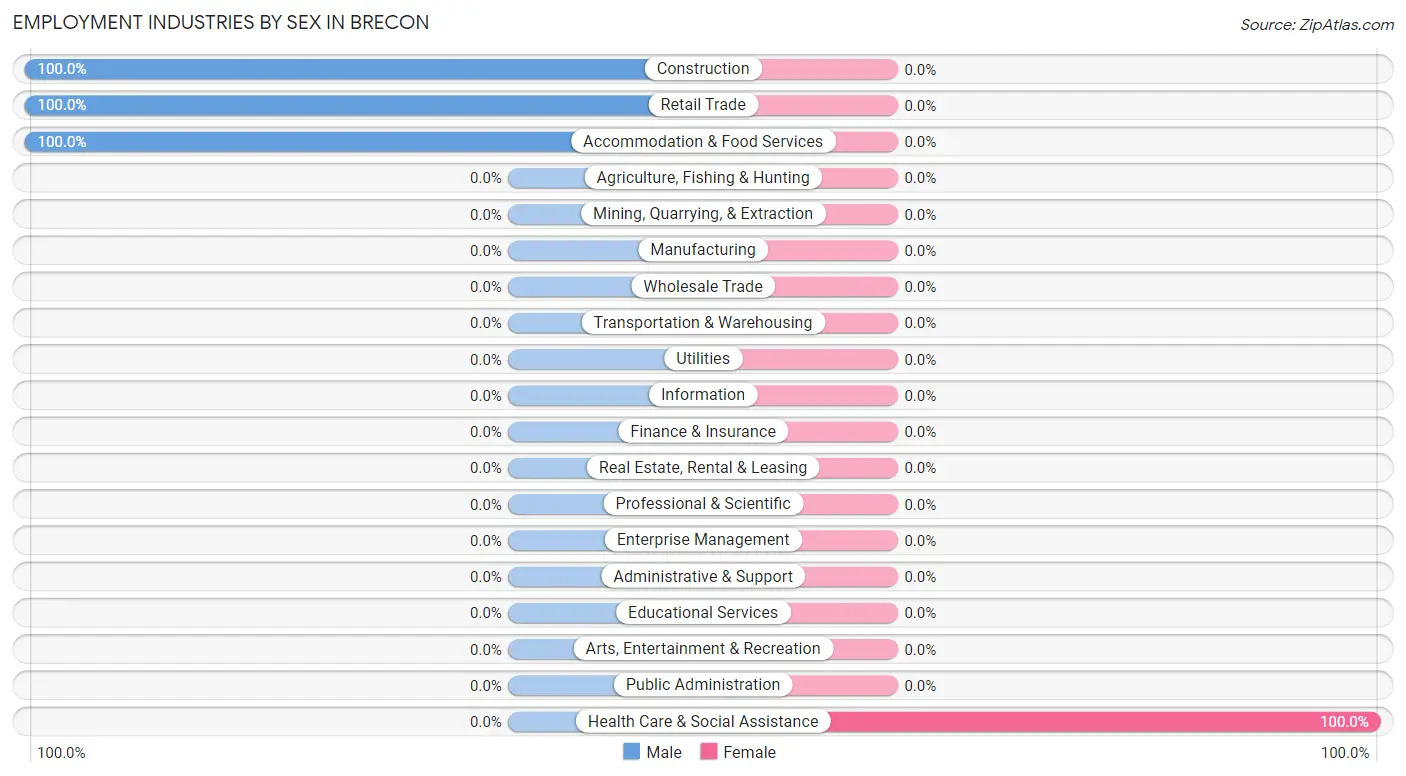
| Industry | Male | Female |
| Agriculture, Fishing & Hunting | 0 (0.0%) | 0 (0.0%) |
| Mining, Quarrying, & Extraction | 0 (0.0%) | 0 (0.0%) |
| Construction | 21 (100.0%) | 0 (0.0%) |
| Manufacturing | 0 (0.0%) | 0 (0.0%) |
| Wholesale Trade | 0 (0.0%) | 0 (0.0%) |
| Retail Trade | 31 (100.0%) | 0 (0.0%) |
| Transportation & Warehousing | 0 (0.0%) | 0 (0.0%) |
| Utilities | 0 (0.0%) | 0 (0.0%) |
| Information | 0 (0.0%) | 0 (0.0%) |
| Finance & Insurance | 0 (0.0%) | 0 (0.0%) |
| Real Estate, Rental & Leasing | 0 (0.0%) | 0 (0.0%) |
| Professional & Scientific | 0 (0.0%) | 0 (0.0%) |
| Enterprise Management | 0 (0.0%) | 0 (0.0%) |
| Administrative & Support | 0 (0.0%) | 0 (0.0%) |
| Educational Services | 0 (0.0%) | 0 (0.0%) |
| Health Care & Social Assistance | 0 (0.0%) | 54 (100.0%) |
| Arts, Entertainment & Recreation | 0 (0.0%) | 0 (0.0%) |
| Accommodation & Food Services | 32 (100.0%) | 0 (0.0%) |
| Public Administration | 0 (0.0%) | 0 (0.0%) |
| Total | 84 (60.9%) | 54 (39.1%) |
Education in Brecon
School Enrollment in Brecon
The most common levels of schooling among the 97 students in Brecon are kindergarten (45 | 46.4%), middle school (27 | 27.8%), and elementary school (25 | 25.8%).
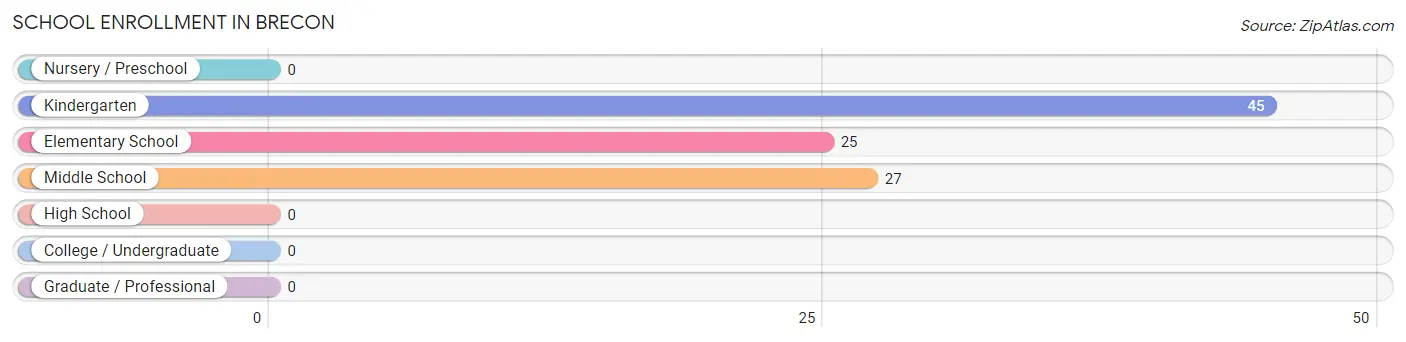
| School Level | # Students | % Students |
| Nursery / Preschool | 0 | 0.0% |
| Kindergarten | 45 | 46.4% |
| Elementary School | 25 | 25.8% |
| Middle School | 27 | 27.8% |
| High School | 0 | 0.0% |
| College / Undergraduate | 0 | 0.0% |
| Graduate / Professional | 0 | 0.0% |
| Total | 97 | 100.0% |
School Enrollment by Age by Funding Source in Brecon
Out of a total of 97 students who are enrolled in schools in Brecon, 24 (24.7%) attend a private institution, while the remaining 73 (75.3%) are enrolled in public schools. The age group of 5 to 9 year old has the highest likelihood of being enrolled in private schools, with 24 (49.0% in the age bracket) enrolled. Conversely, the age group of 3 to 4 year olds has the lowest likelihood of being enrolled in a private school, with 21 (100.0% in the age bracket) attending a public institution.
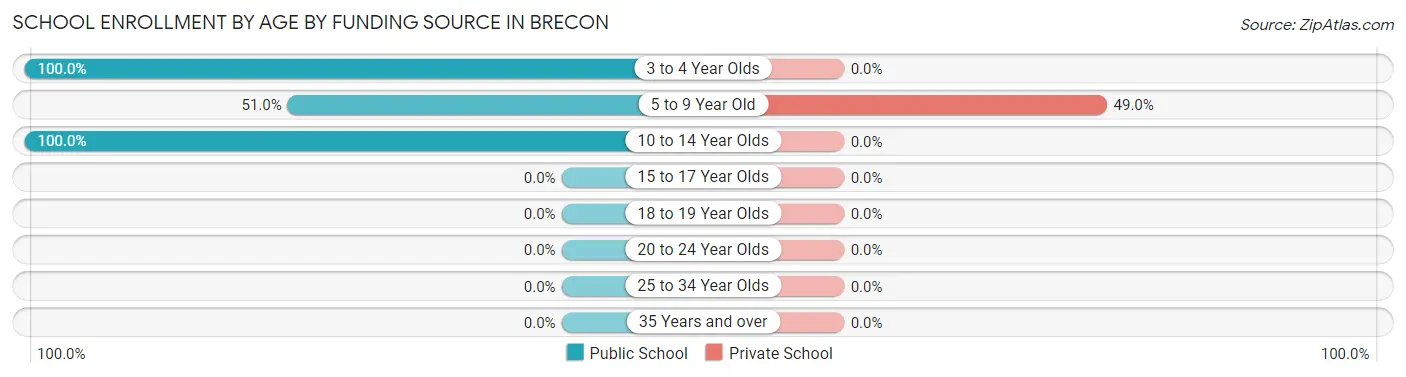
| Age Bracket | Public School | Private School |
| 3 to 4 Year Olds | 21 (100.0%) | 0 (0.0%) |
| 5 to 9 Year Old | 25 (51.0%) | 24 (49.0%) |
| 10 to 14 Year Olds | 27 (100.0%) | 0 (0.0%) |
| 15 to 17 Year Olds | 0 (0.0%) | 0 (0.0%) |
| 18 to 19 Year Olds | 0 (0.0%) | 0 (0.0%) |
| 20 to 24 Year Olds | 0 (0.0%) | 0 (0.0%) |
| 25 to 34 Year Olds | 0 (0.0%) | 0 (0.0%) |
| 35 Years and over | 0 (0.0%) | 0 (0.0%) |
| Total | 73 (75.3%) | 24 (24.7%) |
Educational Attainment by Field of Study in Brecon
Education (161 | 87.5%), and engineering (23 | 12.5%) are the most common fields of study among 184 individuals in Brecon who have obtained a bachelor's degree or higher.
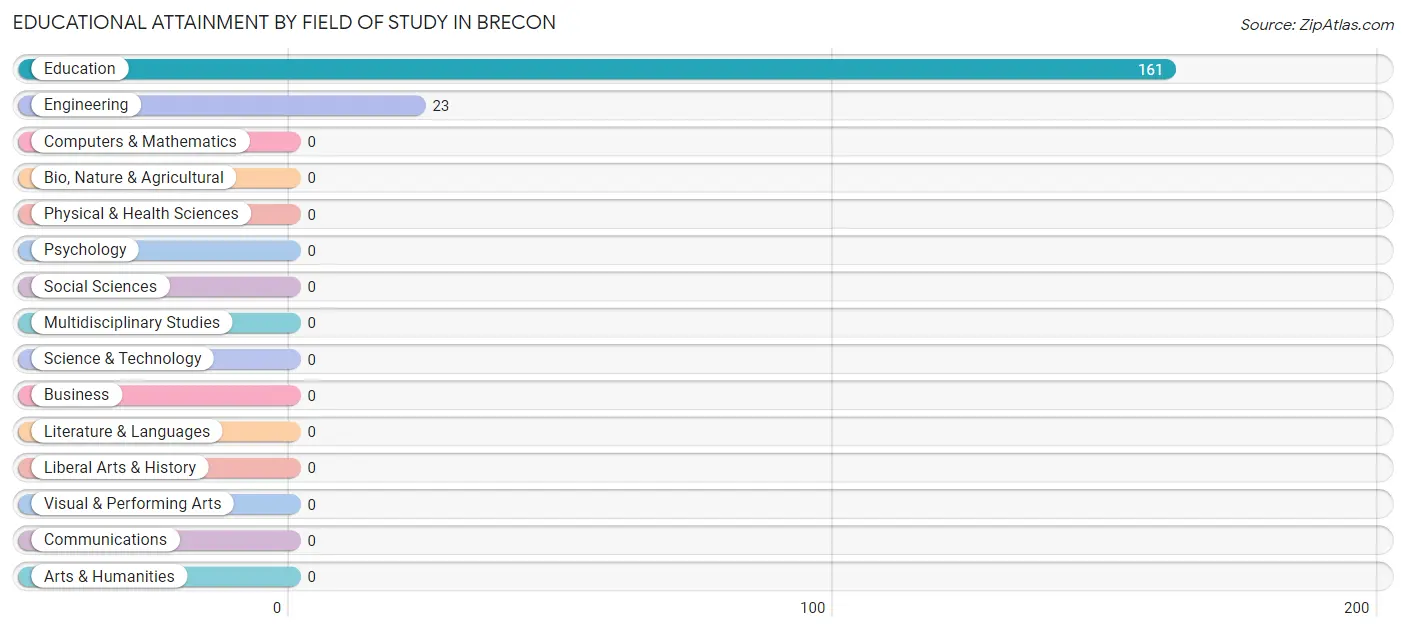
| Field of Study | # Graduates | % Graduates |
| Computers & Mathematics | 0 | 0.0% |
| Bio, Nature & Agricultural | 0 | 0.0% |
| Physical & Health Sciences | 0 | 0.0% |
| Psychology | 0 | 0.0% |
| Social Sciences | 0 | 0.0% |
| Engineering | 23 | 12.5% |
| Multidisciplinary Studies | 0 | 0.0% |
| Science & Technology | 0 | 0.0% |
| Business | 0 | 0.0% |
| Education | 161 | 87.5% |
| Literature & Languages | 0 | 0.0% |
| Liberal Arts & History | 0 | 0.0% |
| Visual & Performing Arts | 0 | 0.0% |
| Communications | 0 | 0.0% |
| Arts & Humanities | 0 | 0.0% |
| Total | 184 | 100.0% |
Transportation & Commute in Brecon
Vehicle Availability by Sex in Brecon
The most prevalent vehicle ownership categories in Brecon are males with 2 vehicles (63, accounting for 75.0%) and females with 2 vehicles (54, making up 116.7%).
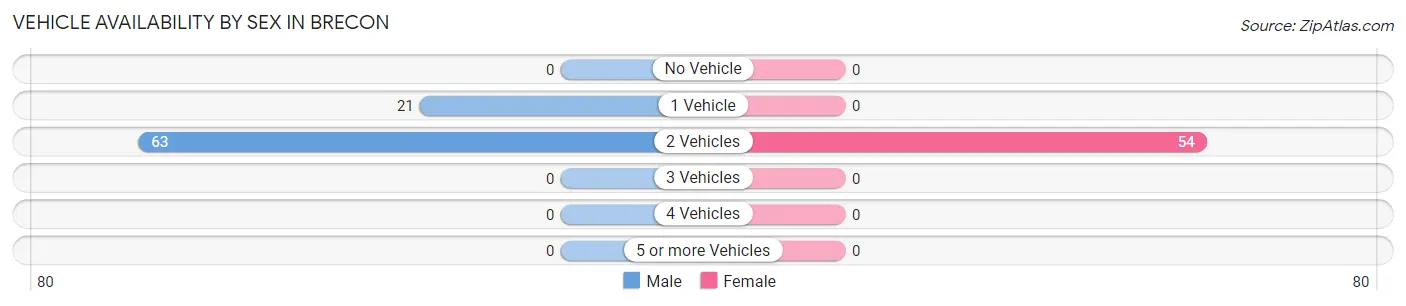
| Vehicles Available | Male | Female |
| No Vehicle | 0 (0.0%) | 0 (0.0%) |
| 1 Vehicle | 21 (25.0%) | 0 (0.0%) |
| 2 Vehicles | 63 (75.0%) | 54 (100.0%) |
| 3 Vehicles | 0 (0.0%) | 0 (0.0%) |
| 4 Vehicles | 0 (0.0%) | 0 (0.0%) |
| 5 or more Vehicles | 0 (0.0%) | 0 (0.0%) |
| Total | 84 (100.0%) | 54 (100.0%) |
Commute Time in Brecon
The most frequently occuring commute durations in Brecon are 30 to 34 minutes (32 commuters, 23.2%), 10 to 14 minutes (31 commuters, 22.5%), and 25 to 29 minutes (31 commuters, 22.5%).
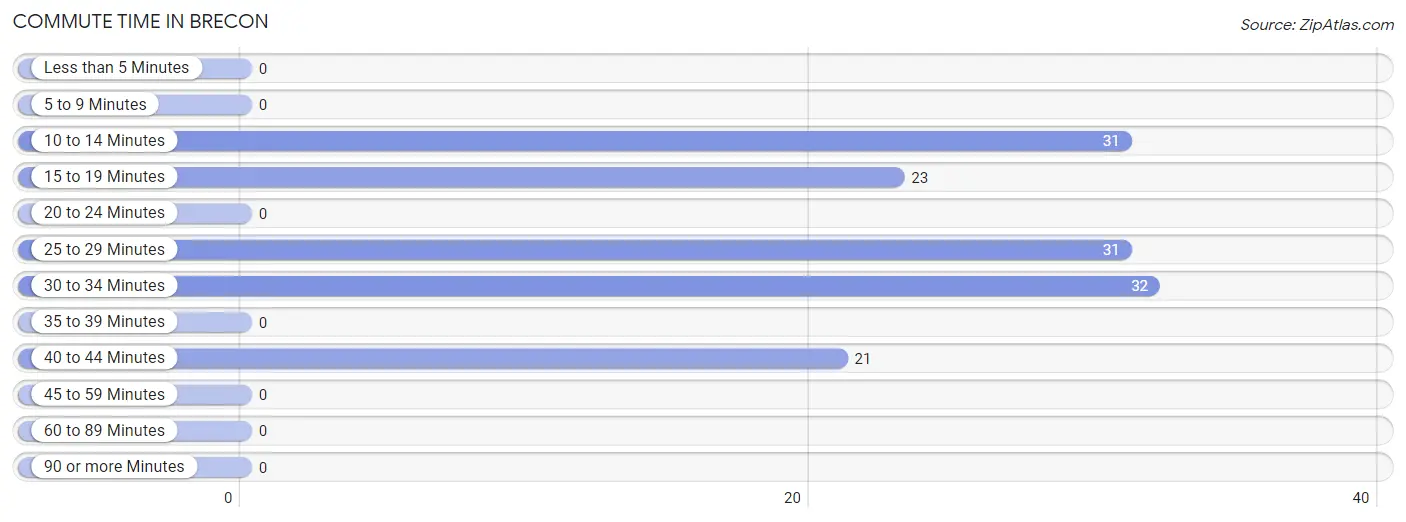
| Commute Time | # Commuters | % Commuters |
| Less than 5 Minutes | 0 | 0.0% |
| 5 to 9 Minutes | 0 | 0.0% |
| 10 to 14 Minutes | 31 | 22.5% |
| 15 to 19 Minutes | 23 | 16.7% |
| 20 to 24 Minutes | 0 | 0.0% |
| 25 to 29 Minutes | 31 | 22.5% |
| 30 to 34 Minutes | 32 | 23.2% |
| 35 to 39 Minutes | 0 | 0.0% |
| 40 to 44 Minutes | 21 | 15.2% |
| 45 to 59 Minutes | 0 | 0.0% |
| 60 to 89 Minutes | 0 | 0.0% |
| 90 or more Minutes | 0 | 0.0% |
Commute Time by Sex in Brecon
The most common commute times in Brecon are 30 to 34 minutes (32 commuters, 38.1%) for males and 25 to 29 minutes (31 commuters, 57.4%) for females.
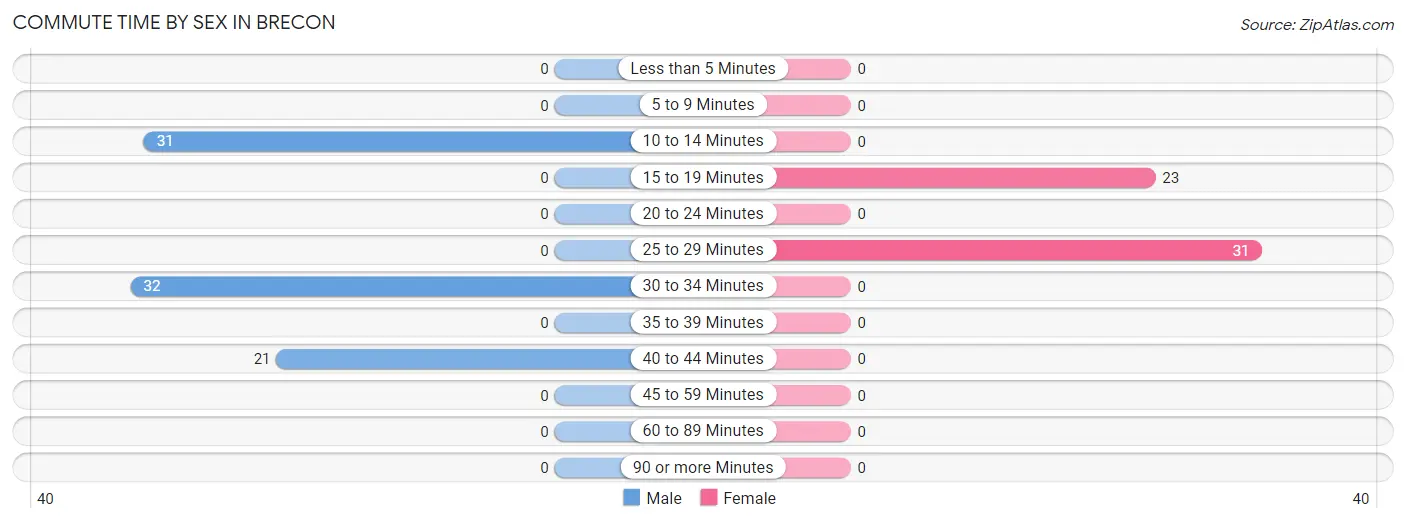
| Commute Time | Male | Female |
| Less than 5 Minutes | 0 (0.0%) | 0 (0.0%) |
| 5 to 9 Minutes | 0 (0.0%) | 0 (0.0%) |
| 10 to 14 Minutes | 31 (36.9%) | 0 (0.0%) |
| 15 to 19 Minutes | 0 (0.0%) | 23 (42.6%) |
| 20 to 24 Minutes | 0 (0.0%) | 0 (0.0%) |
| 25 to 29 Minutes | 0 (0.0%) | 31 (57.4%) |
| 30 to 34 Minutes | 32 (38.1%) | 0 (0.0%) |
| 35 to 39 Minutes | 0 (0.0%) | 0 (0.0%) |
| 40 to 44 Minutes | 21 (25.0%) | 0 (0.0%) |
| 45 to 59 Minutes | 0 (0.0%) | 0 (0.0%) |
| 60 to 89 Minutes | 0 (0.0%) | 0 (0.0%) |
| 90 or more Minutes | 0 (0.0%) | 0 (0.0%) |
Time of Departure to Work by Sex in Brecon
The most frequent times of departure to work in Brecon are 12:00 PM to 3:59 PM (32, 38.1%) for males and 12:00 AM to 4:59 AM (31, 57.4%) for females.
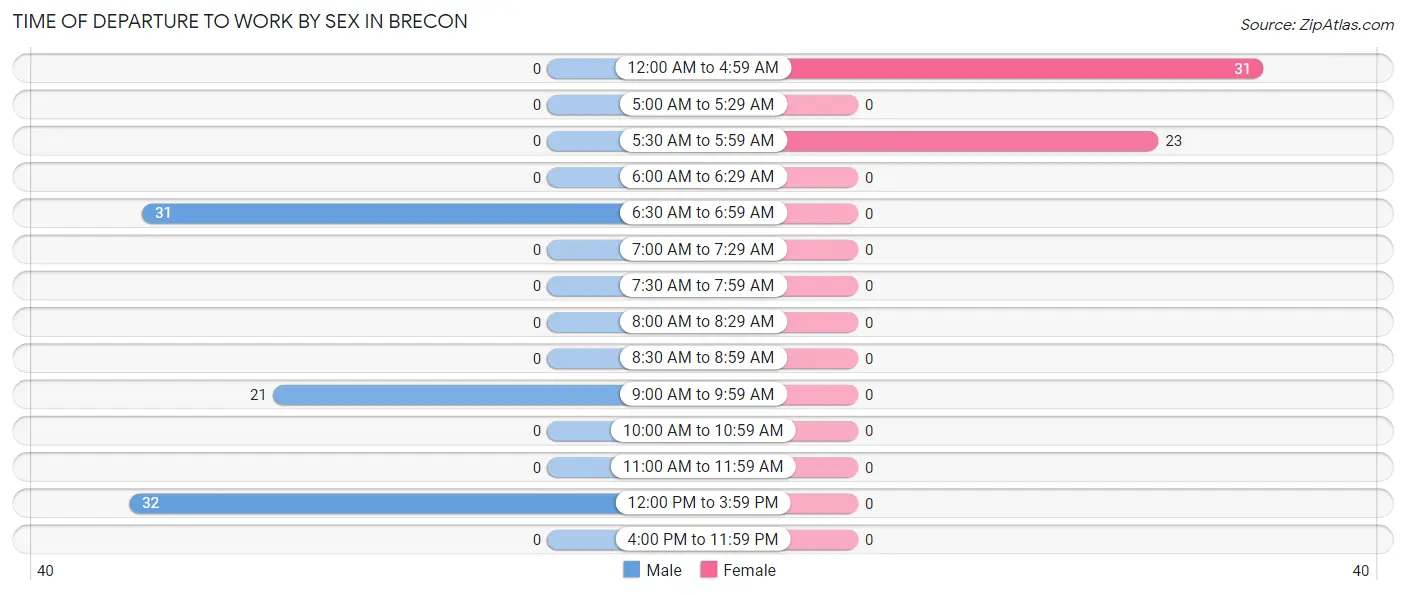
| Time of Departure | Male | Female |
| 12:00 AM to 4:59 AM | 0 (0.0%) | 31 (57.4%) |
| 5:00 AM to 5:29 AM | 0 (0.0%) | 0 (0.0%) |
| 5:30 AM to 5:59 AM | 0 (0.0%) | 23 (42.6%) |
| 6:00 AM to 6:29 AM | 0 (0.0%) | 0 (0.0%) |
| 6:30 AM to 6:59 AM | 31 (36.9%) | 0 (0.0%) |
| 7:00 AM to 7:29 AM | 0 (0.0%) | 0 (0.0%) |
| 7:30 AM to 7:59 AM | 0 (0.0%) | 0 (0.0%) |
| 8:00 AM to 8:29 AM | 0 (0.0%) | 0 (0.0%) |
| 8:30 AM to 8:59 AM | 0 (0.0%) | 0 (0.0%) |
| 9:00 AM to 9:59 AM | 21 (25.0%) | 0 (0.0%) |
| 10:00 AM to 10:59 AM | 0 (0.0%) | 0 (0.0%) |
| 11:00 AM to 11:59 AM | 0 (0.0%) | 0 (0.0%) |
| 12:00 PM to 3:59 PM | 32 (38.1%) | 0 (0.0%) |
| 4:00 PM to 11:59 PM | 0 (0.0%) | 0 (0.0%) |
| Total | 84 (100.0%) | 54 (100.0%) |
Housing Occupancy in Brecon
Occupancy by Ownership in Brecon
Of the total 253 dwellings in Brecon, owner-occupied units account for 232 (91.7%), while renter-occupied units make up 21 (8.3%).
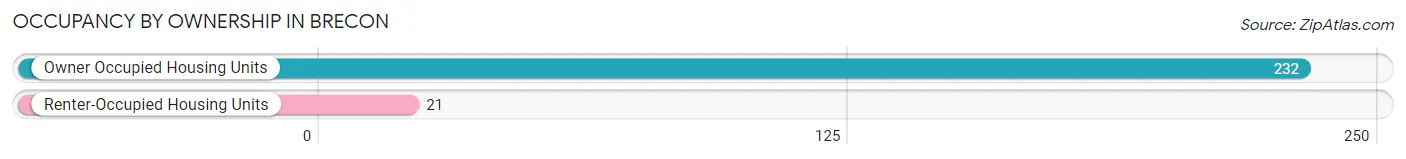
| Occupancy | # Housing Units | % Housing Units |
| Owner Occupied Housing Units | 232 | 91.7% |
| Renter-Occupied Housing Units | 21 | 8.3% |
| Total Occupied Housing Units | 253 | 100.0% |
Occupancy by Household Size in Brecon
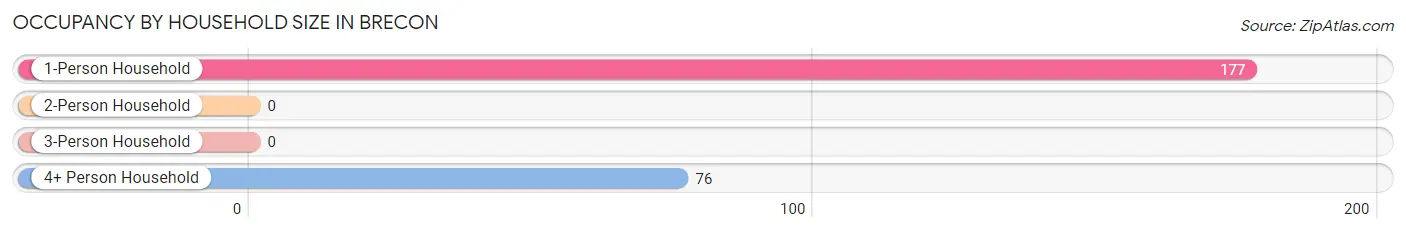
| Household Size | # Housing Units | % Housing Units |
| 1-Person Household | 177 | 70.0% |
| 2-Person Household | 0 | 0.0% |
| 3-Person Household | 0 | 0.0% |
| 4+ Person Household | 76 | 30.0% |
| Total Housing Units | 253 | 100.0% |
Occupancy by Ownership by Household Size in Brecon
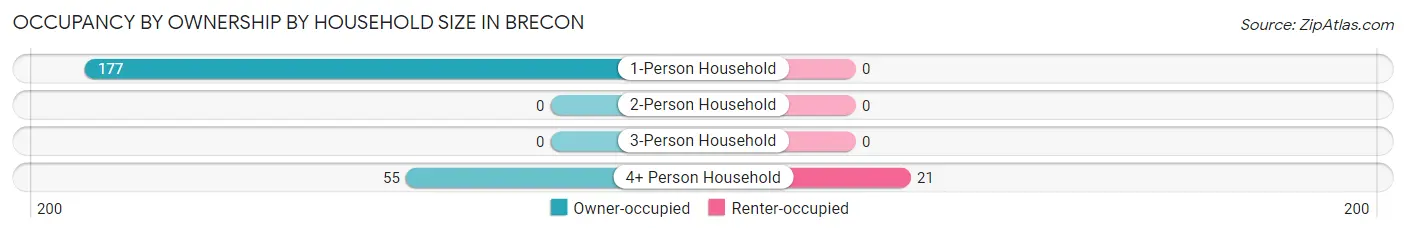
| Household Size | Owner-occupied | Renter-occupied |
| 1-Person Household | 177 (100.0%) | 0 (0.0%) |
| 2-Person Household | 0 (0.0%) | 0 (0.0%) |
| 3-Person Household | 0 (0.0%) | 0 (0.0%) |
| 4+ Person Household | 55 (72.4%) | 21 (27.6%) |
| Total Housing Units | 232 (91.7%) | 21 (8.3%) |
Occupancy by Educational Attainment in Brecon
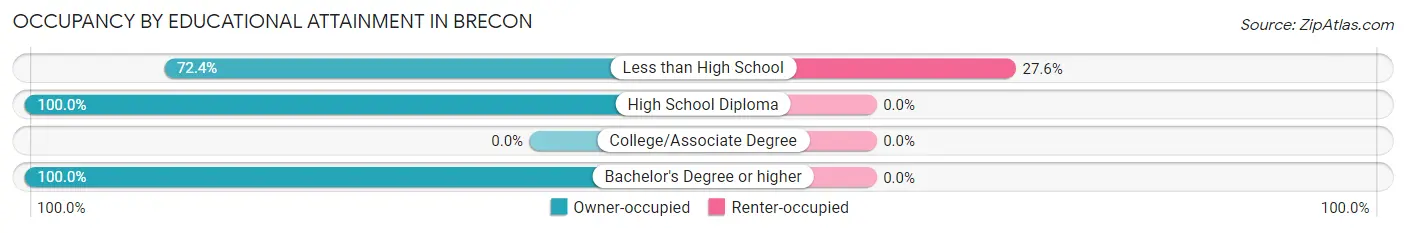
| Household Size | Owner-occupied | Renter-occupied |
| Less than High School | 55 (72.4%) | 21 (27.6%) |
| High School Diploma | 16 (100.0%) | 0 (0.0%) |
| College/Associate Degree | 0 (0.0%) | 0 (0.0%) |
| Bachelor's Degree or higher | 161 (100.0%) | 0 (0.0%) |
Occupancy by Age of Householder in Brecon
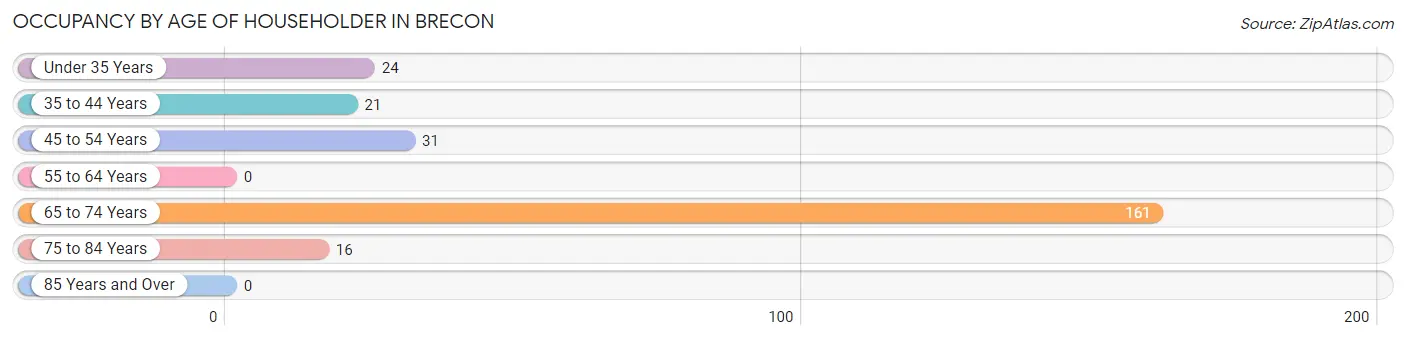
| Age Bracket | # Households | % Households |
| Under 35 Years | 24 | 9.5% |
| 35 to 44 Years | 21 | 8.3% |
| 45 to 54 Years | 31 | 12.2% |
| 55 to 64 Years | 0 | 0.0% |
| 65 to 74 Years | 161 | 63.6% |
| 75 to 84 Years | 16 | 6.3% |
| 85 Years and Over | 0 | 0.0% |
| Total | 253 | 100.0% |
Housing Finances in Brecon
Median Income by Occupancy in Brecon
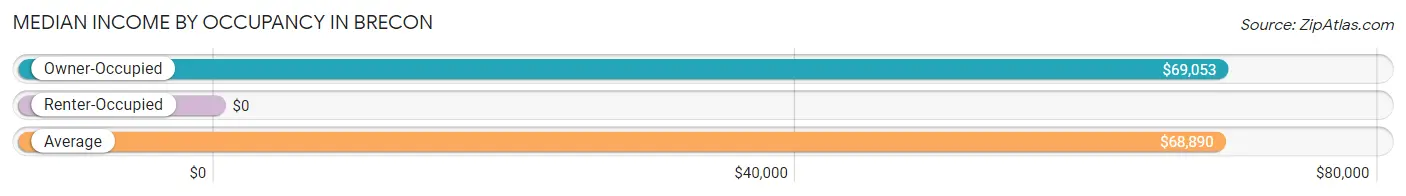
| Occupancy Type | # Households | Median Income |
| Owner-Occupied | 232 (91.7%) | $69,053 |
| Renter-Occupied | 21 (8.3%) | $0 |
| Average | 253 (100.0%) | $68,890 |
Occupancy by Householder Income Bracket in Brecon
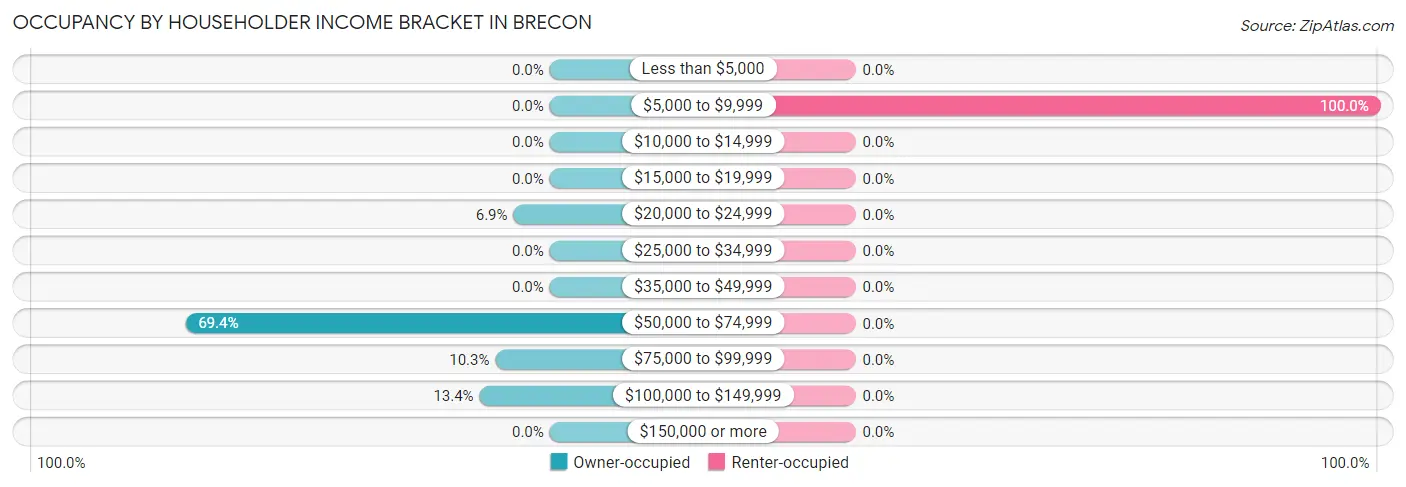
| Income Bracket | Owner-occupied | Renter-occupied |
| Less than $5,000 | 0 (0.0%) | 0 (0.0%) |
| $5,000 to $9,999 | 0 (0.0%) | 21 (100.0%) |
| $10,000 to $14,999 | 0 (0.0%) | 0 (0.0%) |
| $15,000 to $19,999 | 0 (0.0%) | 0 (0.0%) |
| $20,000 to $24,999 | 16 (6.9%) | 0 (0.0%) |
| $25,000 to $34,999 | 0 (0.0%) | 0 (0.0%) |
| $35,000 to $49,999 | 0 (0.0%) | 0 (0.0%) |
| $50,000 to $74,999 | 161 (69.4%) | 0 (0.0%) |
| $75,000 to $99,999 | 24 (10.3%) | 0 (0.0%) |
| $100,000 to $149,999 | 31 (13.4%) | 0 (0.0%) |
| $150,000 or more | 0 (0.0%) | 0 (0.0%) |
| Total | 232 (100.0%) | 21 (100.0%) |
Monthly Housing Cost Tiers in Brecon
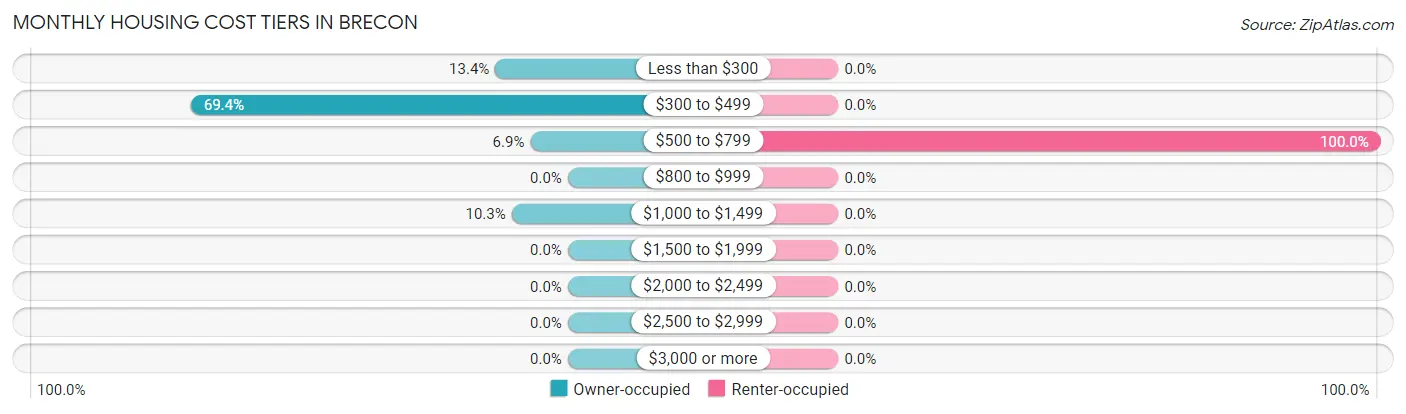
| Monthly Cost | Owner-occupied | Renter-occupied |
| Less than $300 | 31 (13.4%) | 0 (0.0%) |
| $300 to $499 | 161 (69.4%) | 0 (0.0%) |
| $500 to $799 | 16 (6.9%) | 21 (100.0%) |
| $800 to $999 | 0 (0.0%) | 0 (0.0%) |
| $1,000 to $1,499 | 24 (10.3%) | 0 (0.0%) |
| $1,500 to $1,999 | 0 (0.0%) | 0 (0.0%) |
| $2,000 to $2,499 | 0 (0.0%) | 0 (0.0%) |
| $2,500 to $2,999 | 0 (0.0%) | 0 (0.0%) |
| $3,000 or more | 0 (0.0%) | 0 (0.0%) |
| Total | 232 (100.0%) | 21 (100.0%) |
Physical Housing Characteristics in Brecon
Housing Structures in Brecon
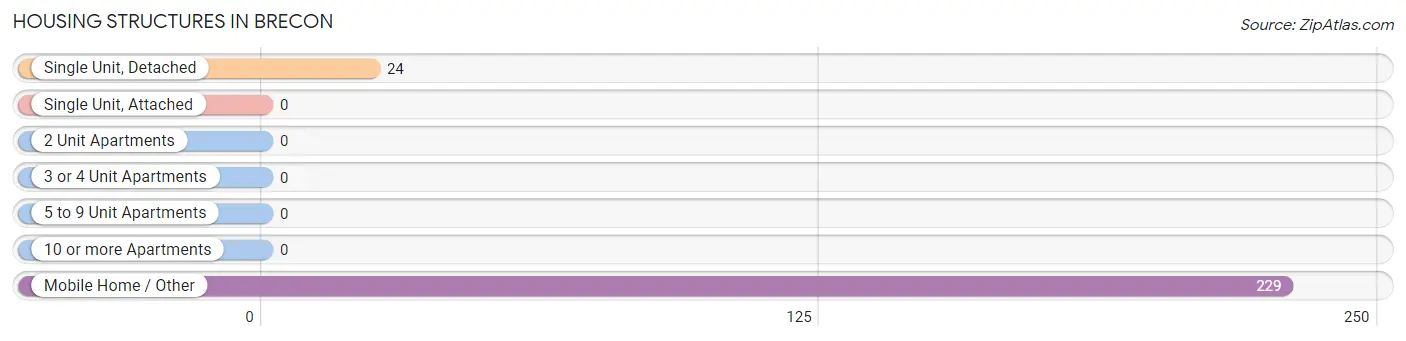
| Structure Type | # Housing Units | % Housing Units |
| Single Unit, Detached | 24 | 9.5% |
| Single Unit, Attached | 0 | 0.0% |
| 2 Unit Apartments | 0 | 0.0% |
| 3 or 4 Unit Apartments | 0 | 0.0% |
| 5 to 9 Unit Apartments | 0 | 0.0% |
| 10 or more Apartments | 0 | 0.0% |
| Mobile Home / Other | 229 | 90.5% |
| Total | 253 | 100.0% |
Housing Structures by Occupancy in Brecon
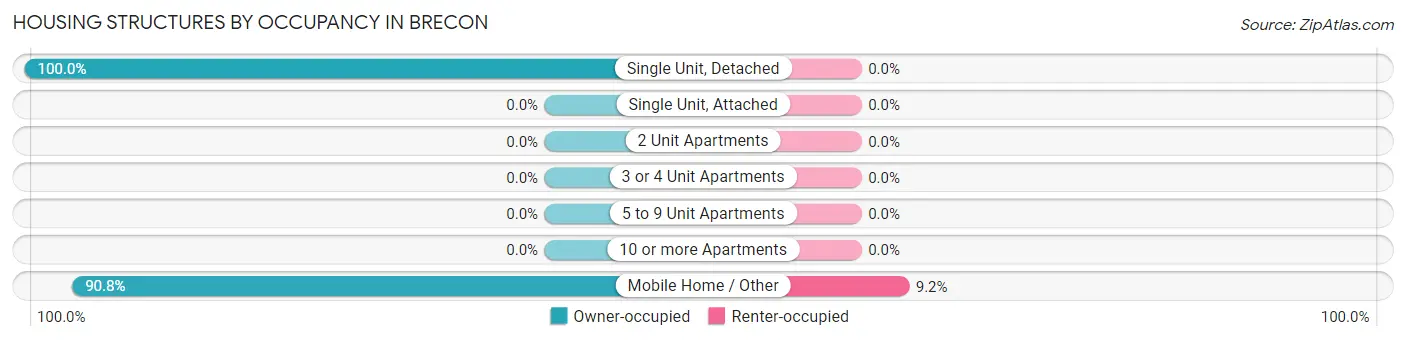
| Structure Type | Owner-occupied | Renter-occupied |
| Single Unit, Detached | 24 (100.0%) | 0 (0.0%) |
| Single Unit, Attached | 0 (0.0%) | 0 (0.0%) |
| 2 Unit Apartments | 0 (0.0%) | 0 (0.0%) |
| 3 or 4 Unit Apartments | 0 (0.0%) | 0 (0.0%) |
| 5 to 9 Unit Apartments | 0 (0.0%) | 0 (0.0%) |
| 10 or more Apartments | 0 (0.0%) | 0 (0.0%) |
| Mobile Home / Other | 208 (90.8%) | 21 (9.2%) |
| Total | 232 (91.7%) | 21 (8.3%) |
Housing Structures by Number of Rooms in Brecon
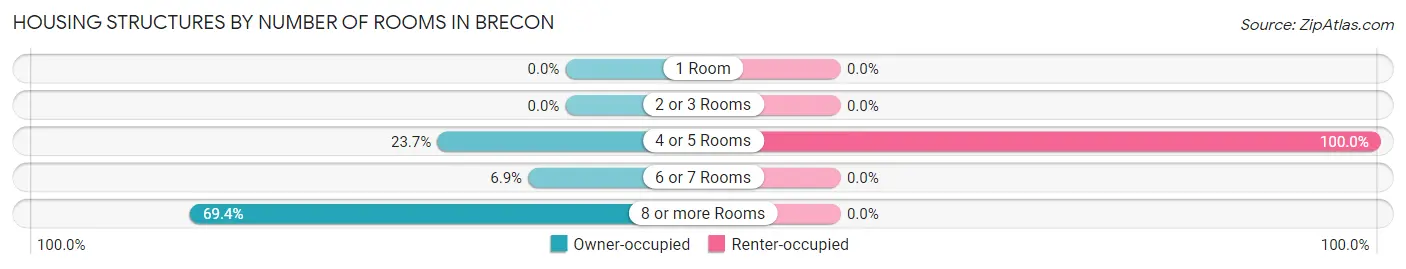
| Number of Rooms | Owner-occupied | Renter-occupied |
| 1 Room | 0 (0.0%) | 0 (0.0%) |
| 2 or 3 Rooms | 0 (0.0%) | 0 (0.0%) |
| 4 or 5 Rooms | 55 (23.7%) | 21 (100.0%) |
| 6 or 7 Rooms | 16 (6.9%) | 0 (0.0%) |
| 8 or more Rooms | 161 (69.4%) | 0 (0.0%) |
| Total | 232 (100.0%) | 21 (100.0%) |
Housing Structure by Heating Type in Brecon
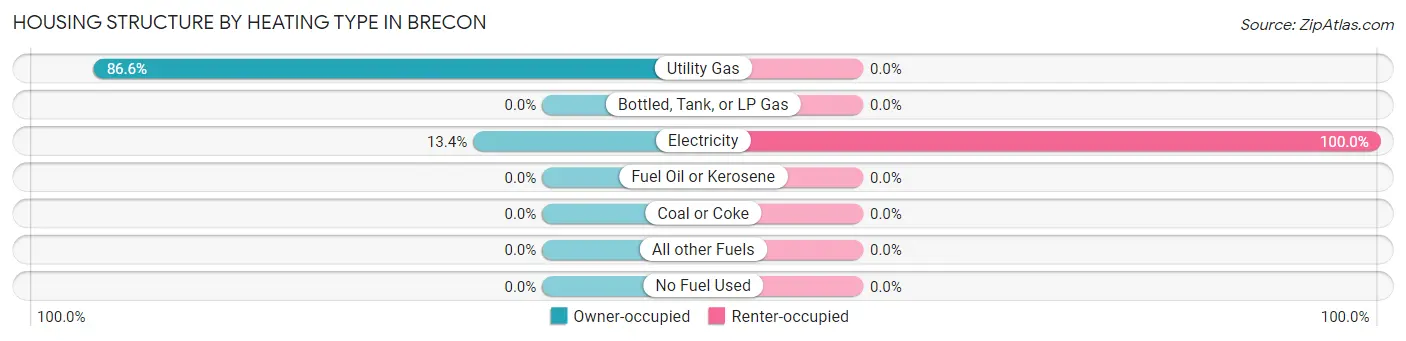
| Heating Type | Owner-occupied | Renter-occupied |
| Utility Gas | 201 (86.6%) | 0 (0.0%) |
| Bottled, Tank, or LP Gas | 0 (0.0%) | 0 (0.0%) |
| Electricity | 31 (13.4%) | 21 (100.0%) |
| Fuel Oil or Kerosene | 0 (0.0%) | 0 (0.0%) |
| Coal or Coke | 0 (0.0%) | 0 (0.0%) |
| All other Fuels | 0 (0.0%) | 0 (0.0%) |
| No Fuel Used | 0 (0.0%) | 0 (0.0%) |
| Total | 232 (100.0%) | 21 (100.0%) |
Household Vehicle Usage in Brecon
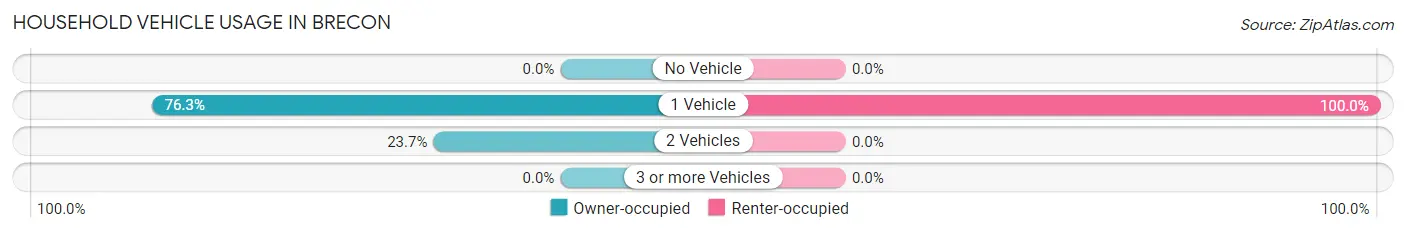
| Vehicles per Household | Owner-occupied | Renter-occupied |
| No Vehicle | 0 (0.0%) | 0 (0.0%) |
| 1 Vehicle | 177 (76.3%) | 21 (100.0%) |
| 2 Vehicles | 55 (23.7%) | 0 (0.0%) |
| 3 or more Vehicles | 0 (0.0%) | 0 (0.0%) |
| Total | 232 (100.0%) | 21 (100.0%) |
Real Estate & Mortgages in Brecon
Real Estate and Mortgage Overview in Brecon
| Characteristic | Without Mortgage | With Mortgage |
| Housing Units | 208 | 24 |
| Median Property Value | $63,500 | $0 |
| Median Household Income | $68,866 | $0 |
| Monthly Housing Costs | $445 | $0 |
| Real Estate Taxes | - | - |
Property Value by Mortgage Status in Brecon
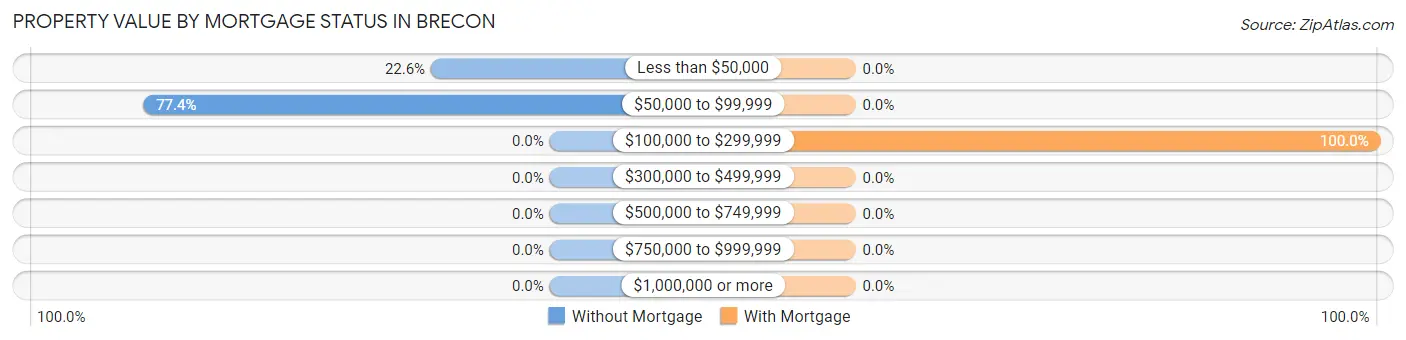
| Property Value | Without Mortgage | With Mortgage |
| Less than $50,000 | 47 (22.6%) | 0 (0.0%) |
| $50,000 to $99,999 | 161 (77.4%) | 0 (0.0%) |
| $100,000 to $299,999 | 0 (0.0%) | 24 (100.0%) |
| $300,000 to $499,999 | 0 (0.0%) | 0 (0.0%) |
| $500,000 to $749,999 | 0 (0.0%) | 0 (0.0%) |
| $750,000 to $999,999 | 0 (0.0%) | 0 (0.0%) |
| $1,000,000 or more | 0 (0.0%) | 0 (0.0%) |
| Total | 208 (100.0%) | 24 (100.0%) |
Household Income by Mortgage Status in Brecon
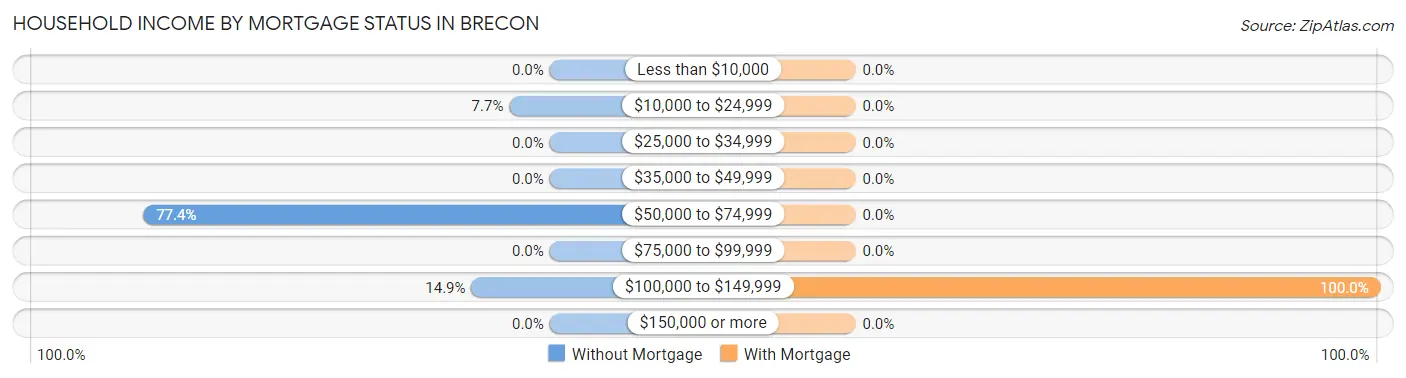
| Household Income | Without Mortgage | With Mortgage |
| Less than $10,000 | 0 (0.0%) | 0 (0.0%) |
| $10,000 to $24,999 | 16 (7.7%) | 0 (0.0%) |
| $25,000 to $34,999 | 0 (0.0%) | 0 (0.0%) |
| $35,000 to $49,999 | 0 (0.0%) | 0 (0.0%) |
| $50,000 to $74,999 | 161 (77.4%) | 0 (0.0%) |
| $75,000 to $99,999 | 0 (0.0%) | 0 (0.0%) |
| $100,000 to $149,999 | 31 (14.9%) | 24 (100.0%) |
| $150,000 or more | 0 (0.0%) | 0 (0.0%) |
| Total | 208 (100.0%) | 24 (100.0%) |
Property Value to Household Income Ratio in Brecon
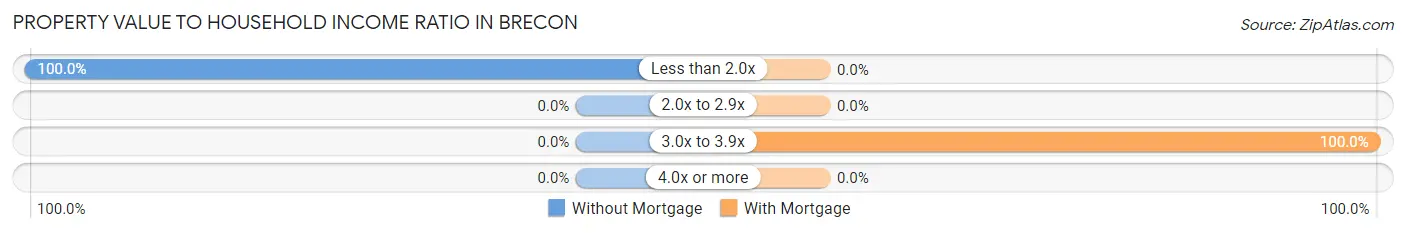
| Value-to-Income Ratio | Without Mortgage | With Mortgage |
| Less than 2.0x | 208 (100.0%) | 0 (0.0%) |
| 2.0x to 2.9x | 0 (0.0%) | 0 (0.0%) |
| 3.0x to 3.9x | 0 (0.0%) | 24 (100.0%) |
| 4.0x or more | 0 (0.0%) | 0 (0.0%) |
| Total | 208 (100.0%) | 24 (100.0%) |
Real Estate Taxes by Mortgage Status in Brecon
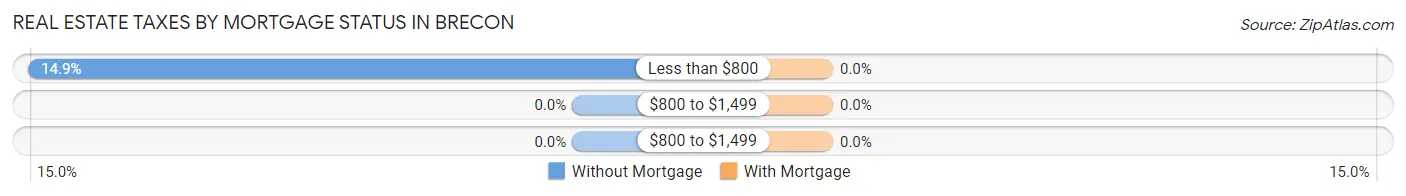
| Property Taxes | Without Mortgage | With Mortgage |
| Less than $800 | 31 (14.9%) | 0 (0.0%) |
| $800 to $1,499 | 0 (0.0%) | 0 (0.0%) |
| $800 to $1,499 | 0 (0.0%) | 0 (0.0%) |
| Total | 208 (100.0%) | 24 (100.0%) |
Health & Disability in Brecon
Health Insurance Coverage by Age in Brecon
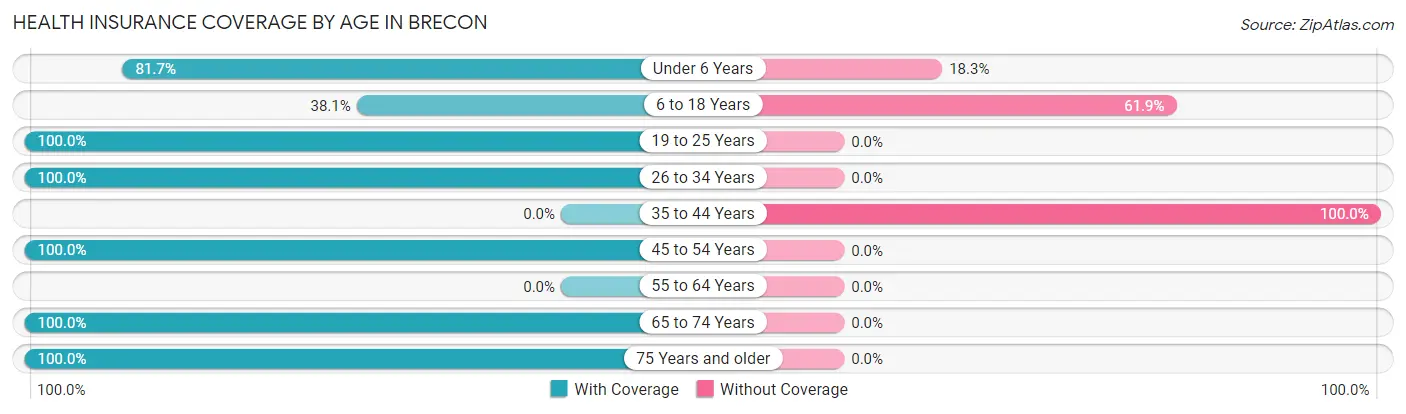
| Age Bracket | With Coverage | Without Coverage |
| Under 6 Years | 94 (81.7%) | 21 (18.3%) |
| 6 to 18 Years | 32 (38.1%) | 52 (61.9%) |
| 19 to 25 Years | 25 (100.0%) | 0 (0.0%) |
| 26 to 34 Years | 47 (100.0%) | 0 (0.0%) |
| 35 to 44 Years | 0 (0.0%) | 49 (100.0%) |
| 45 to 54 Years | 62 (100.0%) | 0 (0.0%) |
| 55 to 64 Years | 0 (0.0%) | 0 (0.0%) |
| 65 to 74 Years | 161 (100.0%) | 0 (0.0%) |
| 75 Years and older | 16 (100.0%) | 0 (0.0%) |
| Total | 437 (78.2%) | 122 (21.8%) |
Health Insurance Coverage by Citizenship Status in Brecon
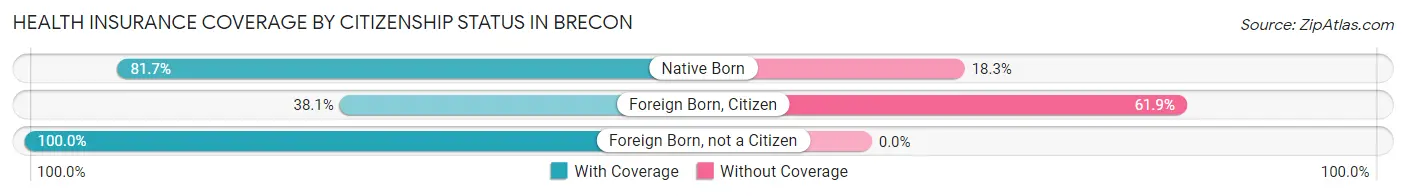
| Citizenship Status | With Coverage | Without Coverage |
| Native Born | 94 (81.7%) | 21 (18.3%) |
| Foreign Born, Citizen | 32 (38.1%) | 52 (61.9%) |
| Foreign Born, not a Citizen | 25 (100.0%) | 0 (0.0%) |
Health Insurance Coverage by Household Income in Brecon
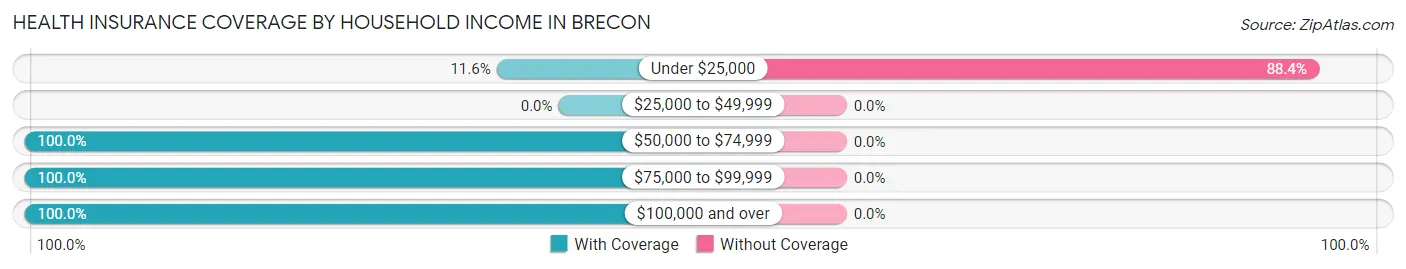
| Household Income | With Coverage | Without Coverage |
| Under $25,000 | 16 (11.6%) | 122 (88.4%) |
| $25,000 to $49,999 | 0 (0.0%) | 0 (0.0%) |
| $50,000 to $74,999 | 161 (100.0%) | 0 (0.0%) |
| $75,000 to $99,999 | 141 (100.0%) | 0 (0.0%) |
| $100,000 and over | 119 (100.0%) | 0 (0.0%) |
Public vs Private Health Insurance Coverage by Age in Brecon
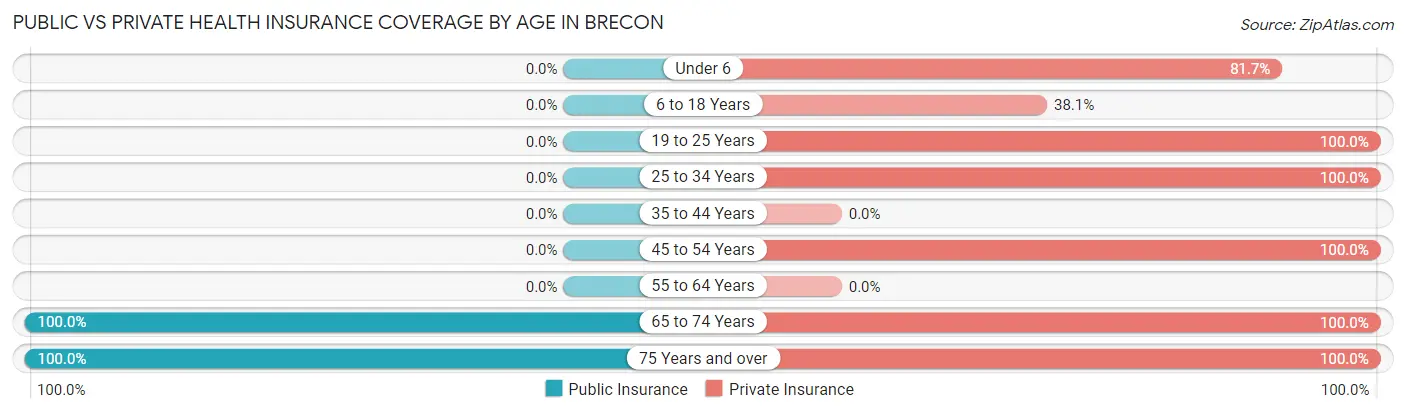
| Age Bracket | Public Insurance | Private Insurance |
| Under 6 | 0 (0.0%) | 94 (81.7%) |
| 6 to 18 Years | 0 (0.0%) | 32 (38.1%) |
| 19 to 25 Years | 0 (0.0%) | 25 (100.0%) |
| 25 to 34 Years | 0 (0.0%) | 47 (100.0%) |
| 35 to 44 Years | 0 (0.0%) | 0 (0.0%) |
| 45 to 54 Years | 0 (0.0%) | 62 (100.0%) |
| 55 to 64 Years | 0 (0.0%) | 0 (0.0%) |
| 65 to 74 Years | 161 (100.0%) | 161 (100.0%) |
| 75 Years and over | 16 (100.0%) | 16 (100.0%) |
| Total | 177 (31.7%) | 437 (78.2%) |
Disability Status by Sex by Age in Brecon
| Age Bracket | Male | Female |
| Under 5 Years | 0 (0.0%) | 0 (0.0%) |
| 5 to 17 Years | 0 (0.0%) | 0 (0.0%) |
| 18 to 34 Years | 0 (0.0%) | 0 (0.0%) |
| 35 to 64 Years | 0 (0.0%) | 0 (0.0%) |
| 65 to 74 Years | 0 (0.0%) | 0 (0.0%) |
| 75 Years and over | 0 (0.0%) | 0 (0.0%) |
Disability Class by Sex by Age in Brecon
Disability Class: Hearing Difficulty
| Age Bracket | Male | Female |
| Under 5 Years | 0 (0.0%) | 0 (0.0%) |
| 5 to 17 Years | 0 (0.0%) | 0 (0.0%) |
| 18 to 34 Years | 0 (0.0%) | 0 (0.0%) |
| 35 to 64 Years | 0 (0.0%) | 0 (0.0%) |
| 65 to 74 Years | 0 (0.0%) | 0 (0.0%) |
| 75 Years and over | 0 (0.0%) | 0 (0.0%) |
Disability Class: Vision Difficulty
| Age Bracket | Male | Female |
| Under 5 Years | 0 (0.0%) | 0 (0.0%) |
| 5 to 17 Years | 0 (0.0%) | 0 (0.0%) |
| 18 to 34 Years | 0 (0.0%) | 0 (0.0%) |
| 35 to 64 Years | 0 (0.0%) | 0 (0.0%) |
| 65 to 74 Years | 0 (0.0%) | 0 (0.0%) |
| 75 Years and over | 0 (0.0%) | 0 (0.0%) |
Disability Class: Cognitive Difficulty
| Age Bracket | Male | Female |
| 5 to 17 Years | 0 (0.0%) | 0 (0.0%) |
| 18 to 34 Years | 0 (0.0%) | 0 (0.0%) |
| 35 to 64 Years | 0 (0.0%) | 0 (0.0%) |
| 65 to 74 Years | 0 (0.0%) | 0 (0.0%) |
| 75 Years and over | 0 (0.0%) | 0 (0.0%) |
Disability Class: Ambulatory Difficulty
| Age Bracket | Male | Female |
| 5 to 17 Years | 0 (0.0%) | 0 (0.0%) |
| 18 to 34 Years | 0 (0.0%) | 0 (0.0%) |
| 35 to 64 Years | 0 (0.0%) | 0 (0.0%) |
| 65 to 74 Years | 0 (0.0%) | 0 (0.0%) |
| 75 Years and over | 0 (0.0%) | 0 (0.0%) |
Disability Class: Self-Care Difficulty
| Age Bracket | Male | Female |
| 5 to 17 Years | 0 (0.0%) | 0 (0.0%) |
| 18 to 34 Years | 0 (0.0%) | 0 (0.0%) |
| 35 to 64 Years | 0 (0.0%) | 0 (0.0%) |
| 65 to 74 Years | 0 (0.0%) | 0 (0.0%) |
| 75 Years and over | 0 (0.0%) | 0 (0.0%) |
Technology Access in Brecon
Computing Device Access in Brecon
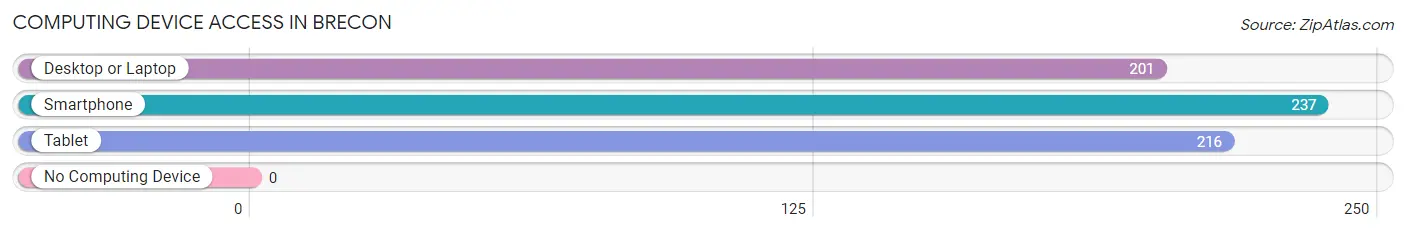
| Device Type | # Households | % Households |
| Desktop or Laptop | 201 | 79.4% |
| Smartphone | 237 | 93.7% |
| Tablet | 216 | 85.4% |
| No Computing Device | 0 | 0.0% |
| Total | 253 | 100.0% |
Internet Access in Brecon
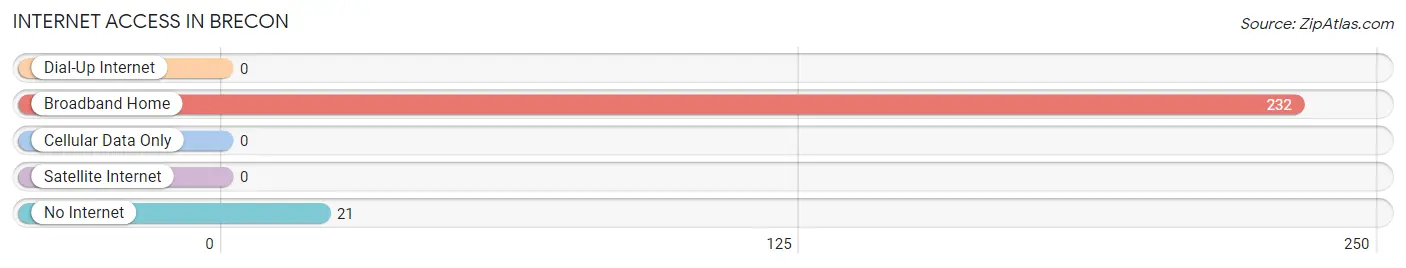
| Internet Type | # Households | % Households |
| Dial-Up Internet | 0 | 0.0% |
| Broadband Home | 232 | 91.7% |
| Cellular Data Only | 0 | 0.0% |
| Satellite Internet | 0 | 0.0% |
| No Internet | 21 | 8.3% |
| Total | 253 | 100.0% |
Brecon Summary
Brecon is a small village located in the state of Ohio, United States. It is situated in the southeastern part of the state, in the county of Muskingum. The village is located on the banks of the Muskingum River, and is part of the Zanesville Metropolitan Statistical Area. The population of Brecon was estimated to be around 1,000 in 2020.
History
The area that is now Brecon was first settled in the early 1800s by a group of settlers from Pennsylvania. The village was originally known as “Breckenridge”, after the family of the same name who were among the first settlers. The name was later changed to Brecon, after the Welsh town of Brecon. The village was officially incorporated in 1837.
In the late 1800s, Brecon was a thriving agricultural community. The village was home to several mills, including a grist mill, a saw mill, and a woolen mill. The village also had a blacksmith shop, a general store, and a post office.
In the early 1900s, Brecon began to decline as the local economy shifted away from agriculture. The mills and other businesses closed, and the population began to decline. The village was nearly abandoned by the mid-1900s, but has since seen a resurgence in recent years.
Geography
Brecon is located in southeastern Ohio, in Muskingum County. The village is situated on the banks of the Muskingum River, and is part of the Zanesville Metropolitan Statistical Area. The village is located approximately 25 miles east of Zanesville, and about 50 miles south of Columbus.
The terrain around Brecon is mostly flat, with some rolling hills. The village is surrounded by farmland, and is home to several small lakes and ponds. The climate in Brecon is humid continental, with hot summers and cold winters.
Economy
The economy of Brecon is largely based on agriculture. The village is home to several farms, which produce a variety of crops, including corn, soybeans, and wheat. The village also has a few small businesses, including a general store, a gas station, and a restaurant.
The village is also home to a few small manufacturing companies, which produce a variety of products, including furniture, clothing, and automotive parts. The village is also home to a few small service businesses, including a hair salon and a car repair shop.
Demographics
The population of Brecon was estimated to be around 1,000 in 2020. The village is predominantly white, with a small minority population. The median household income in Brecon is around $45,000, and the median home value is around $100,000. The village has a low unemployment rate, and a high rate of homeownership.
Common Questions
What is Per Capita Income in Brecon?
Per Capita income in Brecon is $31,111.
What is the Median Household income in Brecon?
Median Household Income in Brecon is $68,890.
What is Income or Wage Gap in Brecon?
Income or Wage Gap in Brecon is 63.1%.
Women in Brecon earn 36.9 cents for every dollar earned by a man.
What is Inequality or Gini Index in Brecon?
Inequality or Gini Index in Brecon is 0.20.
What is the Total Population of Brecon?
Total Population of Brecon is 559.
What is the Total Male Population of Brecon?
Total Male Population of Brecon is 230.
What is the Total Female Population of Brecon?
Total Female Population of Brecon is 329.
What is the Ratio of Males per 100 Females in Brecon?
There are 69.91 Males per 100 Females in Brecon.
What is the Ratio of Females per 100 Males in Brecon?
There are 143.04 Females per 100 Males in Brecon.
What is the Median Population Age in Brecon?
Median Population Age in Brecon is 35.3 Years.
What is the Average Family Size in Brecon
Average Family Size in Brecon is 5.0 People.
What is the Average Household Size in Brecon
Average Household Size in Brecon is 2.2 People.
How Large is the Labor Force in Brecon?
There are 163 People in the Labor Forcein in Brecon.
What is the Percentage of People in the Labor Force in Brecon?
41.6% of People are in the Labor Force in Brecon.
What is the Unemployment Rate in Brecon?
Unemployment Rate in Brecon is 15.3%.