Peninsula, OH Map & Demographics
Peninsula Map
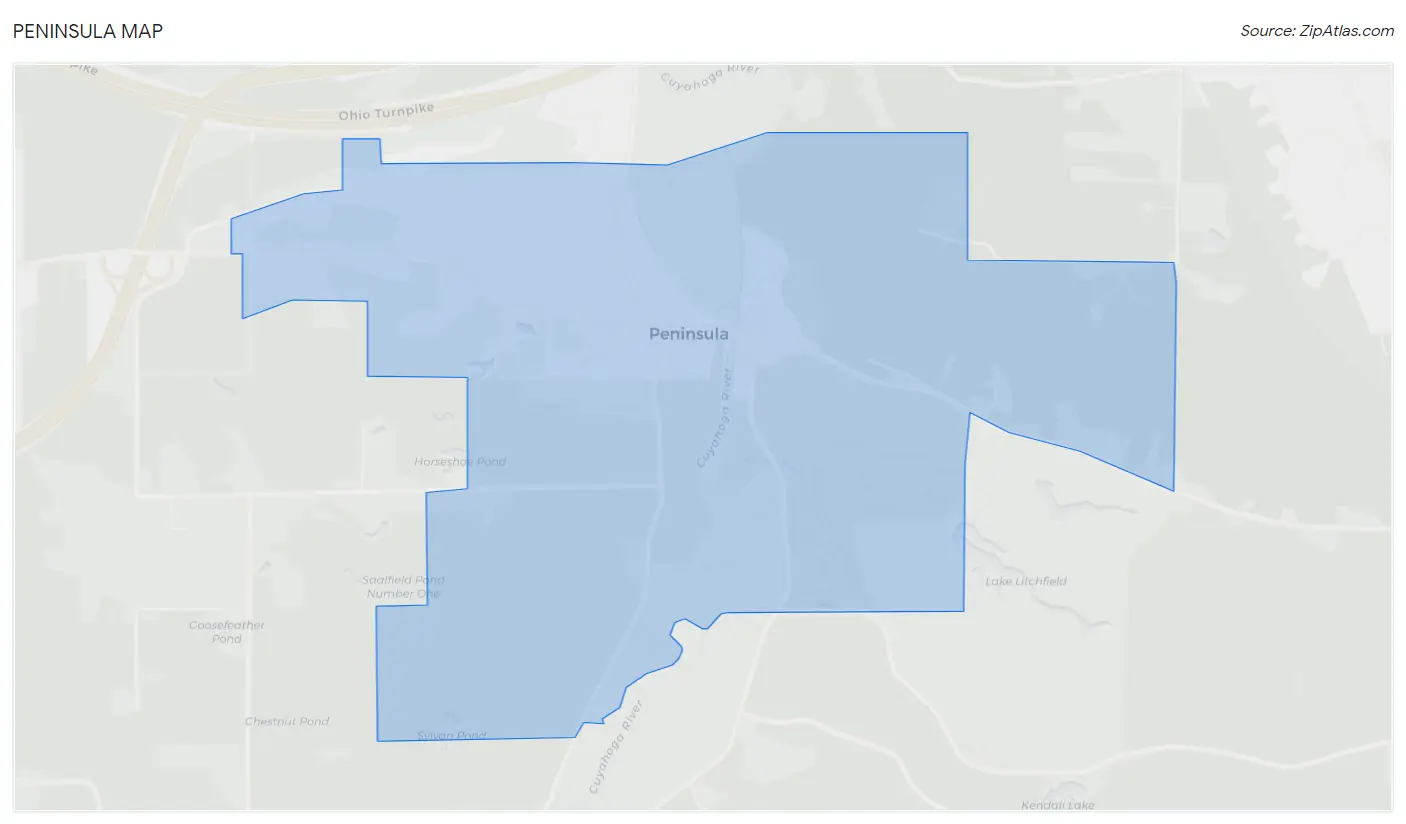
Peninsula Overview
$63,534
PER CAPITA INCOME
$121,250
AVG FAMILY INCOME
$121,111
AVG HOUSEHOLD INCOME
35.5%
WAGE / INCOME GAP [ % ]
64.5¢/ $1
WAGE / INCOME GAP [ $ ]
0.40
INEQUALITY / GINI INDEX
633
TOTAL POPULATION
304
MALE POPULATION
329
FEMALE POPULATION
92.40
MALES / 100 FEMALES
108.22
FEMALES / 100 MALES
51.1
MEDIAN AGE
2.6
AVG FAMILY SIZE
2.3
AVG HOUSEHOLD SIZE
381
LABOR FORCE [ PEOPLE ]
70.6%
PERCENT IN LABOR FORCE
4.5%
UNEMPLOYMENT RATE
Peninsula Zip Codes
Peninsula Area Codes
Income in Peninsula
Income Overview in Peninsula
Per Capita Income in Peninsula is $63,534, while median incomes of families and households are $121,250 and $121,111 respectively.
| Characteristic | Number | Measure |
| Per Capita Income | 633 | $63,534 |
| Median Family Income | 197 | $121,250 |
| Mean Family Income | 197 | $161,435 |
| Median Household Income | 274 | $121,111 |
| Mean Household Income | 274 | $147,694 |
| Income Deficit | 197 | $0 |
| Wage / Income Gap (%) | 633 | 35.46% |
| Wage / Income Gap ($) | 633 | 64.54¢ per $1 |
| Gini / Inequality Index | 633 | 0.40 |
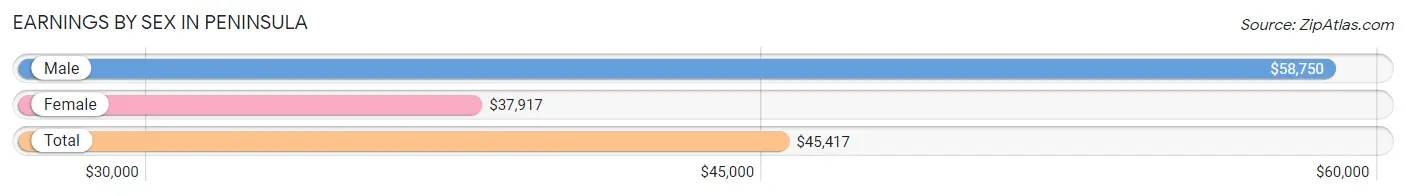
Earnings by Sex in Peninsula
Average Earnings in Peninsula are $45,417, $58,750 for men and $37,917 for women, a difference of 35.5%.
| Sex | Number | Average Earnings |
| Male | 185 (46.5%) | $58,750 |
| Female | 213 (53.5%) | $37,917 |
| Total | 398 (100.0%) | $45,417 |
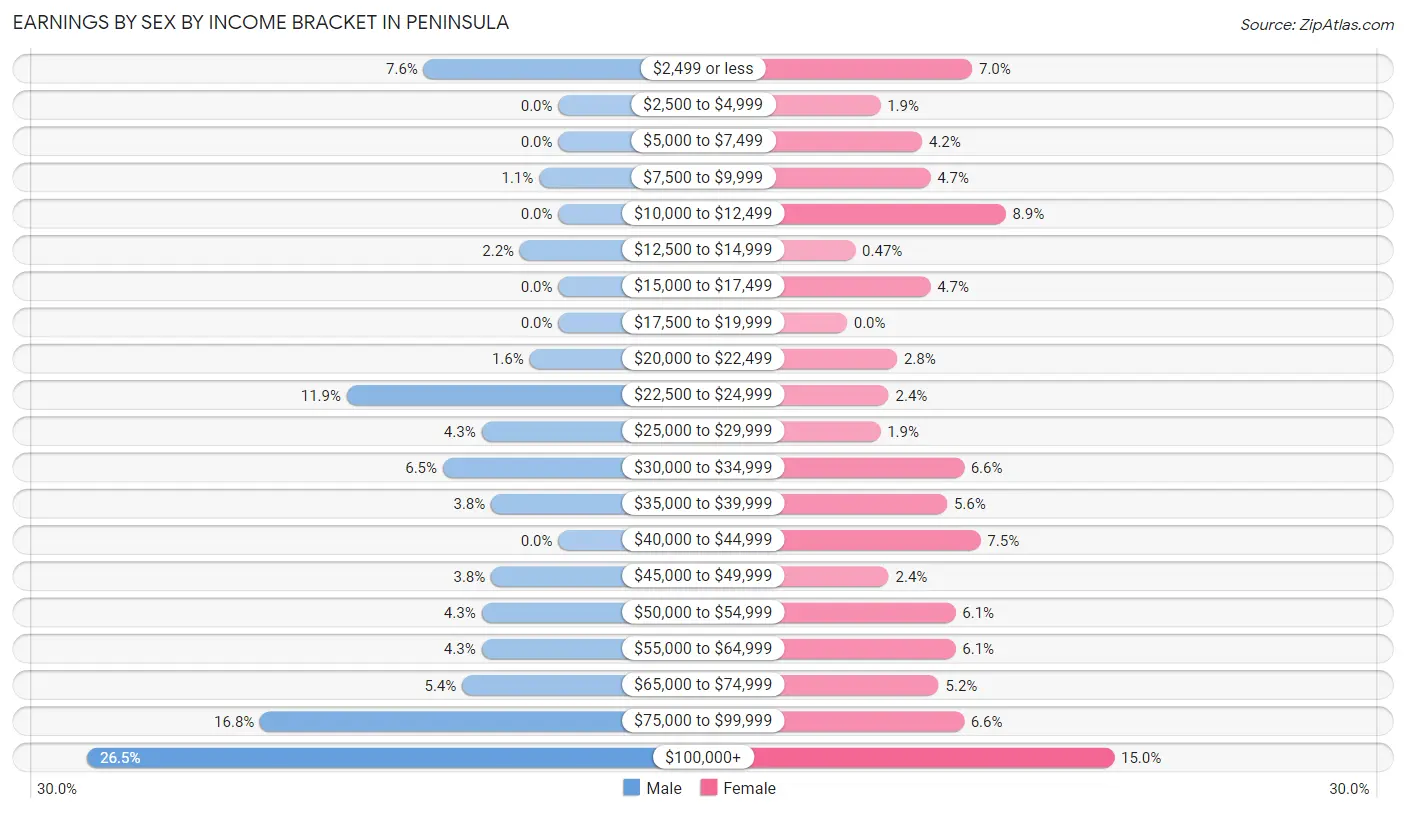
Earnings by Sex by Income Bracket in Peninsula
The most common earnings brackets in Peninsula are $100,000+ for men (49 | 26.5%) and $100,000+ for women (32 | 15.0%).
| Income | Male | Female |
| $2,499 or less | 14 (7.6%) | 15 (7.0%) |
| $2,500 to $4,999 | 0 (0.0%) | 4 (1.9%) |
| $5,000 to $7,499 | 0 (0.0%) | 9 (4.2%) |
| $7,500 to $9,999 | 2 (1.1%) | 10 (4.7%) |
| $10,000 to $12,499 | 0 (0.0%) | 19 (8.9%) |
| $12,500 to $14,999 | 4 (2.2%) | 1 (0.5%) |
| $15,000 to $17,499 | 0 (0.0%) | 10 (4.7%) |
| $17,500 to $19,999 | 0 (0.0%) | 0 (0.0%) |
| $20,000 to $22,499 | 3 (1.6%) | 6 (2.8%) |
| $22,500 to $24,999 | 22 (11.9%) | 5 (2.4%) |
| $25,000 to $29,999 | 8 (4.3%) | 4 (1.9%) |
| $30,000 to $34,999 | 12 (6.5%) | 14 (6.6%) |
| $35,000 to $39,999 | 7 (3.8%) | 12 (5.6%) |
| $40,000 to $44,999 | 0 (0.0%) | 16 (7.5%) |
| $45,000 to $49,999 | 7 (3.8%) | 5 (2.4%) |
| $50,000 to $54,999 | 8 (4.3%) | 13 (6.1%) |
| $55,000 to $64,999 | 8 (4.3%) | 13 (6.1%) |
| $65,000 to $74,999 | 10 (5.4%) | 11 (5.2%) |
| $75,000 to $99,999 | 31 (16.8%) | 14 (6.6%) |
| $100,000+ | 49 (26.5%) | 32 (15.0%) |
| Total | 185 (100.0%) | 213 (100.0%) |
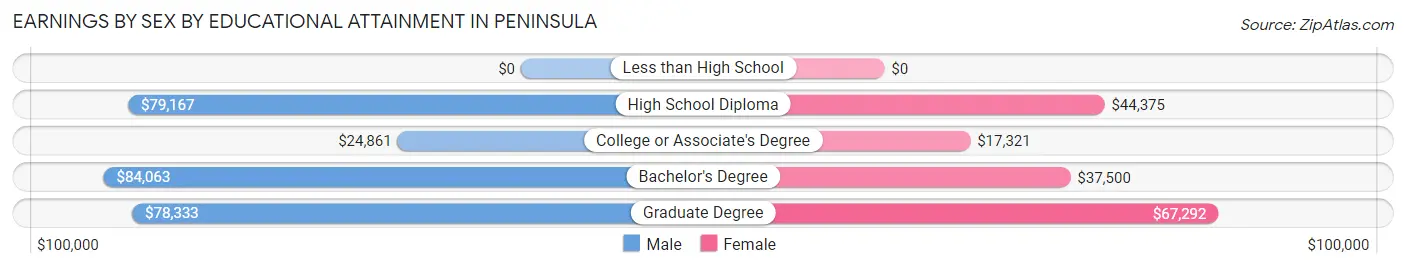
Earnings by Sex by Educational Attainment in Peninsula
Average earnings in Peninsula are $69,375 for men and $43,977 for women, a difference of 36.6%. Men with an educational attainment of bachelor's degree enjoy the highest average annual earnings of $84,063, while those with college or associate's degree education earn the least with $24,861. Women with an educational attainment of graduate degree earn the most with the average annual earnings of $67,292, while those with college or associate's degree education have the smallest earnings of $17,321.
| Educational Attainment | Male Income | Female Income |
| Less than High School | - | - |
| High School Diploma | $79,167 | $44,375 |
| College or Associate's Degree | $24,861 | $17,321 |
| Bachelor's Degree | $84,063 | $37,500 |
| Graduate Degree | $78,333 | $67,292 |
| Total | $69,375 | $43,977 |
Family Income in Peninsula
Family Income Brackets in Peninsula
According to the Peninsula family income data, there are 63 families falling into the $100,000 to $149,999 income range, which is the most common income bracket and makes up 32.0% of all families.
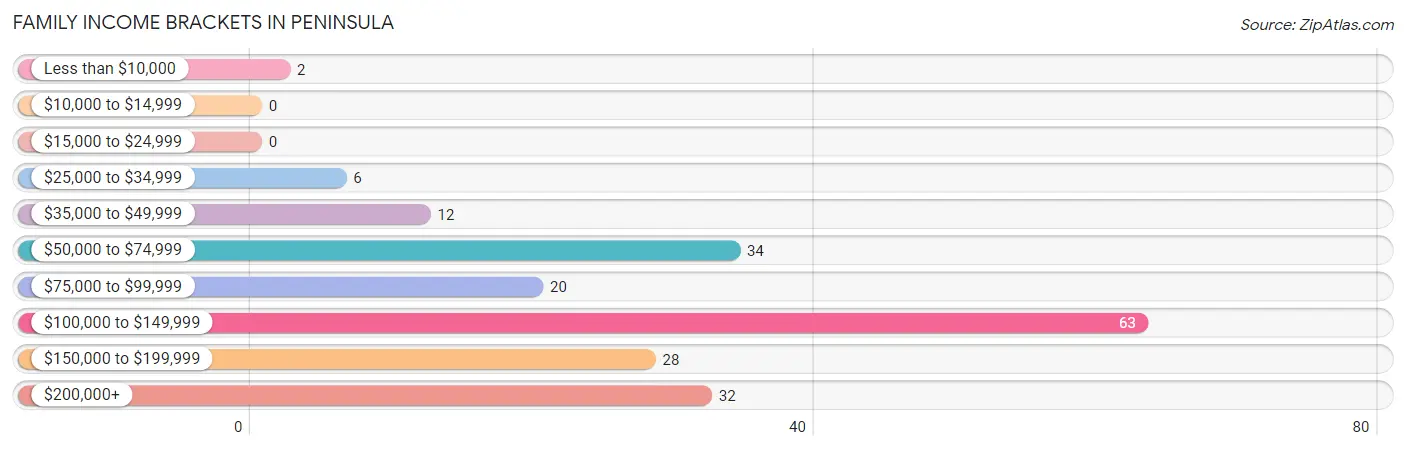
| Income Bracket | # Families | % Families |
| Less than $10,000 | 2 | 1.0% |
| $10,000 to $14,999 | 0 | 0.0% |
| $15,000 to $24,999 | 0 | 0.0% |
| $25,000 to $34,999 | 6 | 3.0% |
| $35,000 to $49,999 | 12 | 6.1% |
| $50,000 to $74,999 | 34 | 17.3% |
| $75,000 to $99,999 | 20 | 10.2% |
| $100,000 to $149,999 | 63 | 32.0% |
| $150,000 to $199,999 | 28 | 14.2% |
| $200,000+ | 32 | 16.2% |
Family Income by Famaliy Size in Peninsula
3-person families (18 | 9.1%) account for the highest median family income in Peninsula with $138,333 per family, while 2-person families (135 | 68.5%) have the highest median income of $62,812 per family member.
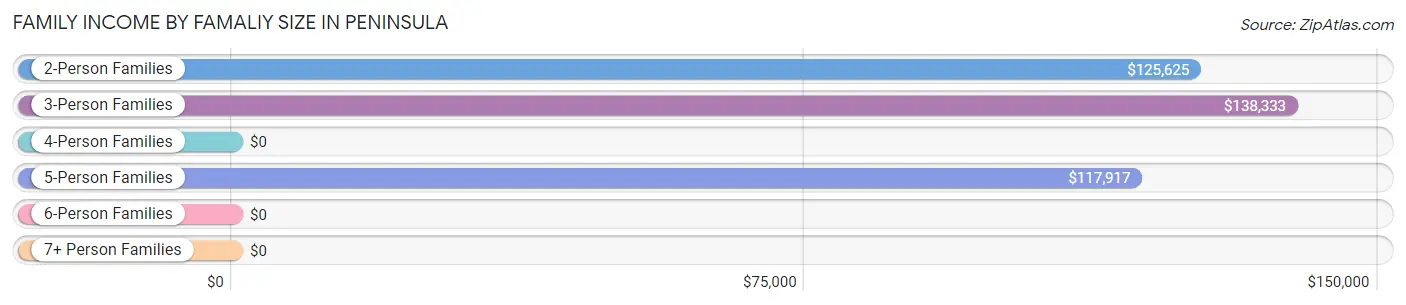
| Income Bracket | # Families | Median Income |
| 2-Person Families | 135 (68.5%) | $125,625 |
| 3-Person Families | 18 (9.1%) | $138,333 |
| 4-Person Families | 31 (15.7%) | $0 |
| 5-Person Families | 11 (5.6%) | $117,917 |
| 6-Person Families | 0 (0.0%) | $0 |
| 7+ Person Families | 2 (1.0%) | $0 |
| Total | 197 (100.0%) | $121,250 |
Family Income by Number of Earners in Peninsula
The median family income in Peninsula is $121,250, with families comprising 2 earners (98) having the highest median family income of $130,000, while families with 3+ earners (14) have the lowest median family income of $55,500, accounting for 49.7% and 7.1% of families, respectively.
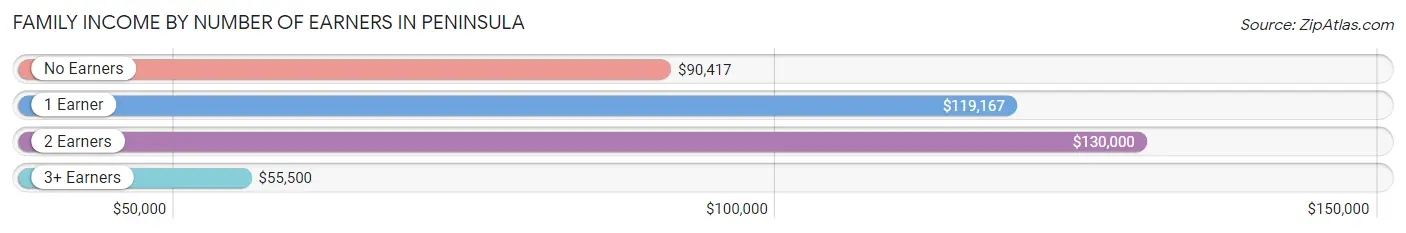
| Number of Earners | # Families | Median Income |
| No Earners | 19 (9.6%) | $90,417 |
| 1 Earner | 66 (33.5%) | $119,167 |
| 2 Earners | 98 (49.7%) | $130,000 |
| 3+ Earners | 14 (7.1%) | $55,500 |
| Total | 197 (100.0%) | $121,250 |
Household Income in Peninsula
Household Income Brackets in Peninsula
With 101 households falling in the category, the $100,000 to $149,999 income range is the most frequent in Peninsula, accounting for 36.9% of all households.
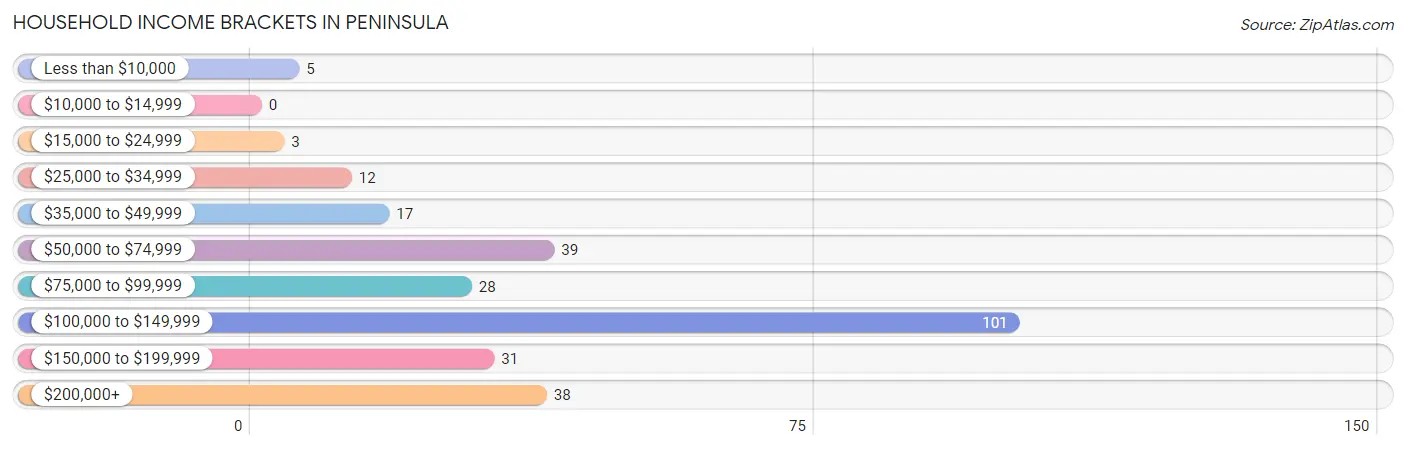
| Income Bracket | # Households | % Households |
| Less than $10,000 | 5 | 1.8% |
| $10,000 to $14,999 | 0 | 0.0% |
| $15,000 to $24,999 | 3 | 1.1% |
| $25,000 to $34,999 | 12 | 4.4% |
| $35,000 to $49,999 | 17 | 6.2% |
| $50,000 to $74,999 | 39 | 14.2% |
| $75,000 to $99,999 | 28 | 10.2% |
| $100,000 to $149,999 | 101 | 36.9% |
| $150,000 to $199,999 | 31 | 11.3% |
| $200,000+ | 38 | 13.9% |
Household Income by Householder Age in Peninsula
The median household income in Peninsula is $121,111, with the highest median household income of $125,833 found in the 25 to 44 years age bracket for the primary householder. A total of 78 households (28.5%) fall into this category. Meanwhile, the 15 to 24 years age bracket for the primary householder has the lowest median household income of $0, with 2 households (0.7%) in this group.
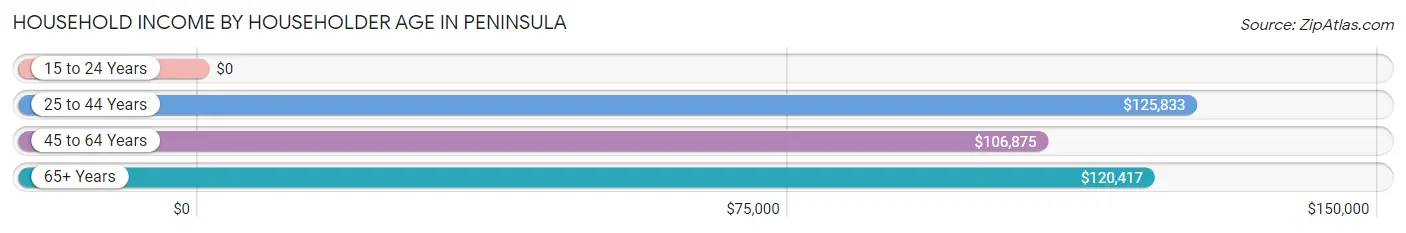
| Income Bracket | # Households | Median Income |
| 15 to 24 Years | 2 (0.7%) | $0 |
| 25 to 44 Years | 78 (28.5%) | $125,833 |
| 45 to 64 Years | 95 (34.7%) | $106,875 |
| 65+ Years | 99 (36.1%) | $120,417 |
| Total | 274 (100.0%) | $121,111 |
Poverty in Peninsula
Income Below Poverty by Sex and Age in Peninsula
With 1.6% poverty level for males and 9.4% for females among the residents of Peninsula, 18 to 24 year old males and 16 and 17 year old females are the most vulnerable to poverty, with 2 males (50.0%) and 6 females (100.0%) in their respective age groups living below the poverty level.
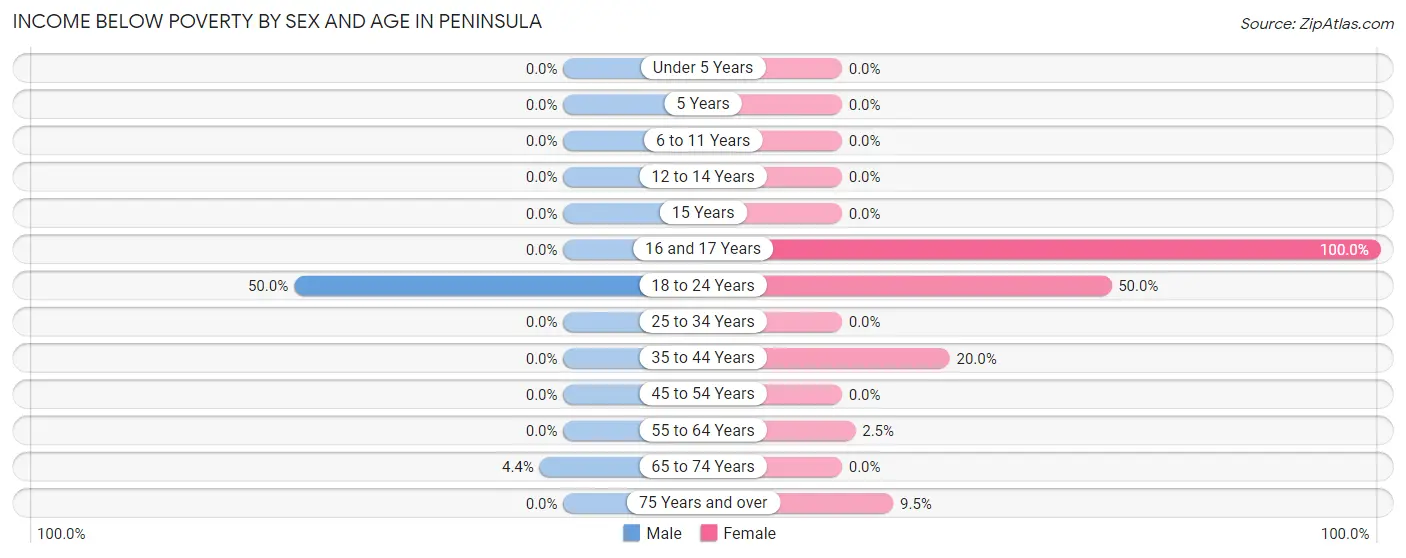
| Age Bracket | Male | Female |
| Under 5 Years | 0 (0.0%) | 0 (0.0%) |
| 5 Years | 0 (0.0%) | 0 (0.0%) |
| 6 to 11 Years | 0 (0.0%) | 0 (0.0%) |
| 12 to 14 Years | 0 (0.0%) | 0 (0.0%) |
| 15 Years | 0 (0.0%) | 0 (0.0%) |
| 16 and 17 Years | 0 (0.0%) | 6 (100.0%) |
| 18 to 24 Years | 2 (50.0%) | 15 (50.0%) |
| 25 to 34 Years | 0 (0.0%) | 0 (0.0%) |
| 35 to 44 Years | 0 (0.0%) | 6 (20.0%) |
| 45 to 54 Years | 0 (0.0%) | 0 (0.0%) |
| 55 to 64 Years | 0 (0.0%) | 2 (2.5%) |
| 65 to 74 Years | 3 (4.4%) | 0 (0.0%) |
| 75 Years and over | 0 (0.0%) | 2 (9.5%) |
| Total | 5 (1.6%) | 31 (9.4%) |
Income Above Poverty by Sex and Age in Peninsula
According to the poverty statistics in Peninsula, males aged under 5 years and females aged under 5 years are the age groups that are most secure financially, with 100.0% of males and 100.0% of females in these age groups living above the poverty line.
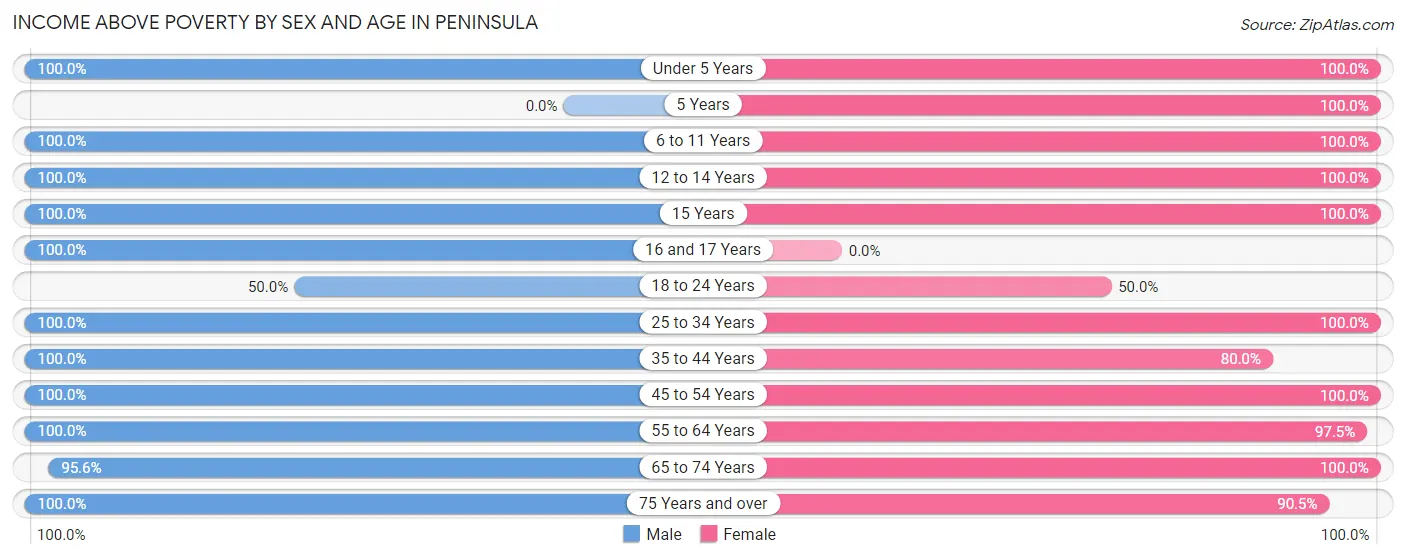
| Age Bracket | Male | Female |
| Under 5 Years | 5 (100.0%) | 3 (100.0%) |
| 5 Years | 0 (0.0%) | 5 (100.0%) |
| 6 to 11 Years | 31 (100.0%) | 18 (100.0%) |
| 12 to 14 Years | 14 (100.0%) | 7 (100.0%) |
| 15 Years | 7 (100.0%) | 3 (100.0%) |
| 16 and 17 Years | 6 (100.0%) | 0 (0.0%) |
| 18 to 24 Years | 2 (50.0%) | 15 (50.0%) |
| 25 to 34 Years | 40 (100.0%) | 40 (100.0%) |
| 35 to 44 Years | 21 (100.0%) | 24 (80.0%) |
| 45 to 54 Years | 39 (100.0%) | 39 (100.0%) |
| 55 to 64 Years | 56 (100.0%) | 78 (97.5%) |
| 65 to 74 Years | 65 (95.6%) | 47 (100.0%) |
| 75 Years and over | 13 (100.0%) | 19 (90.5%) |
| Total | 299 (98.4%) | 298 (90.6%) |
Income Below Poverty Among Married-Couple Families in Peninsula
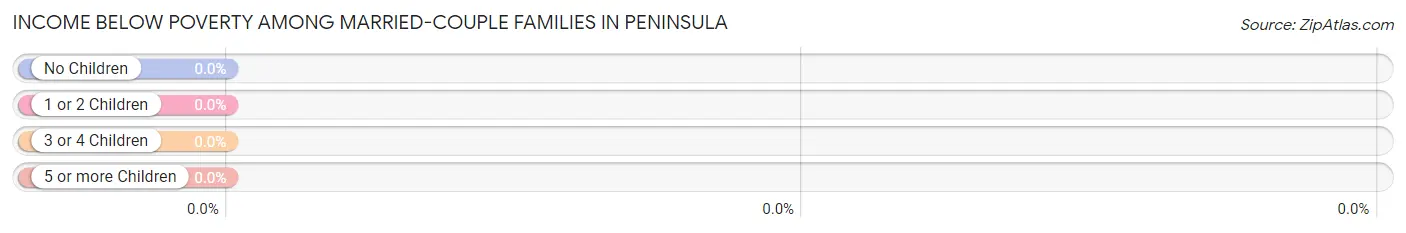
| Children | Above Poverty | Below Poverty |
| No Children | 130 (100.0%) | 0 (0.0%) |
| 1 or 2 Children | 38 (100.0%) | 0 (0.0%) |
| 3 or 4 Children | 4 (100.0%) | 0 (0.0%) |
| 5 or more Children | 0 (0.0%) | 0 (0.0%) |
| Total | 172 (100.0%) | 0 (0.0%) |
Income Below Poverty Among Single-Parent Households in Peninsula
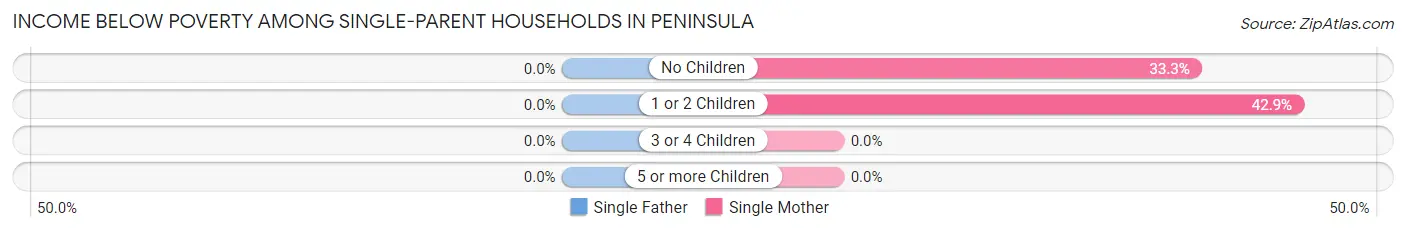
| Children | Single Father | Single Mother |
| No Children | 0 (0.0%) | 2 (33.3%) |
| 1 or 2 Children | 0 (0.0%) | 6 (42.9%) |
| 3 or 4 Children | 0 (0.0%) | 0 (0.0%) |
| 5 or more Children | 0 (0.0%) | 0 (0.0%) |
| Total | 0 (0.0%) | 8 (40.0%) |
Income Below Poverty Among Married-Couple vs Single-Parent Households in Peninsula
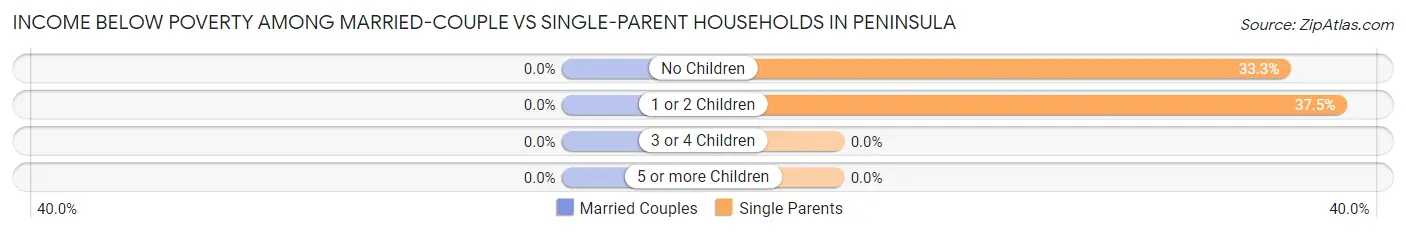
| Children | Married-Couple Families | Single-Parent Households |
| No Children | 0 (0.0%) | 2 (33.3%) |
| 1 or 2 Children | 0 (0.0%) | 6 (37.5%) |
| 3 or 4 Children | 0 (0.0%) | 0 (0.0%) |
| 5 or more Children | 0 (0.0%) | 0 (0.0%) |
| Total | 0 (0.0%) | 8 (32.0%) |
Race in Peninsula
The most populous races in Peninsula are White / Caucasian (594 | 93.8%), Two or more Races (34 | 5.4%), and Hispanic or Latino (8 | 1.3%).
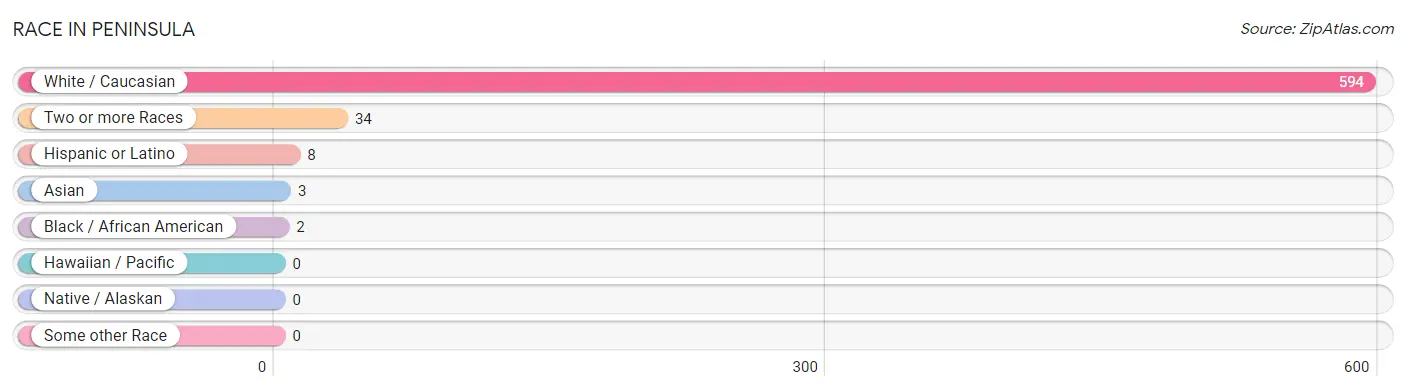
| Race | # Population | % Population |
| Asian | 3 | 0.5% |
| Black / African American | 2 | 0.3% |
| Hawaiian / Pacific | 0 | 0.0% |
| Hispanic or Latino | 8 | 1.3% |
| Native / Alaskan | 0 | 0.0% |
| White / Caucasian | 594 | 93.8% |
| Two or more Races | 34 | 5.4% |
| Some other Race | 0 | 0.0% |
| Total | 633 | 100.0% |
Ancestry in Peninsula
The most populous ancestries reported in Peninsula are German (165 | 26.1%), Irish (162 | 25.6%), Italian (83 | 13.1%), Polish (76 | 12.0%), and English (58 | 9.2%), together accounting for 85.9% of all Peninsula residents.
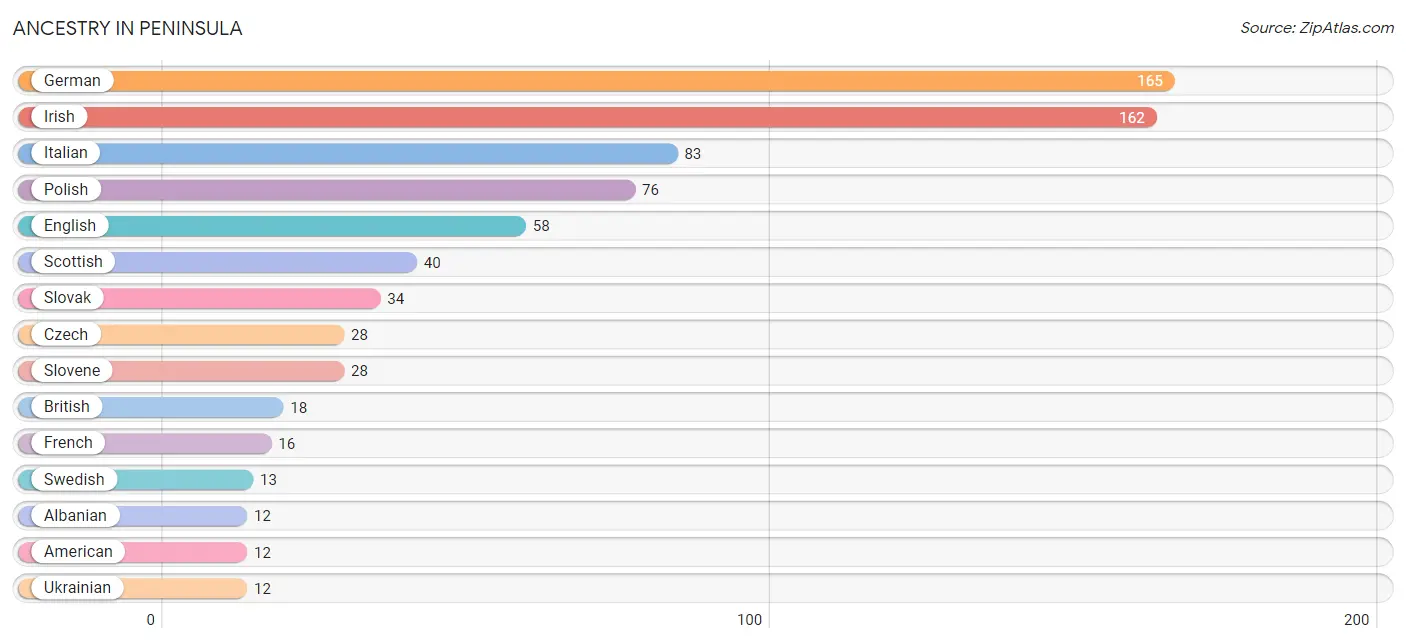
| Ancestry | # Population | % Population |
| Albanian | 12 | 1.9% |
| American | 12 | 1.9% |
| Arab | 4 | 0.6% |
| Bhutanese | 5 | 0.8% |
| British | 18 | 2.8% |
| Canadian | 3 | 0.5% |
| Colombian | 4 | 0.6% |
| Croatian | 3 | 0.5% |
| Czech | 28 | 4.4% |
| Dutch | 2 | 0.3% |
| English | 58 | 9.2% |
| European | 10 | 1.6% |
| French | 16 | 2.5% |
| German | 165 | 26.1% |
| Hungarian | 10 | 1.6% |
| Irish | 162 | 25.6% |
| Italian | 83 | 13.1% |
| Lebanese | 4 | 0.6% |
| Northern European | 3 | 0.5% |
| Polish | 76 | 12.0% |
| Russian | 3 | 0.5% |
| Scotch-Irish | 3 | 0.5% |
| Scottish | 40 | 6.3% |
| Slovak | 34 | 5.4% |
| Slovene | 28 | 4.4% |
| South American | 4 | 0.6% |
| Spanish | 4 | 0.6% |
| Swedish | 13 | 2.1% |
| Swiss | 3 | 0.5% |
| Ukrainian | 12 | 1.9% | View All 30 Rows |
Immigrants in Peninsula
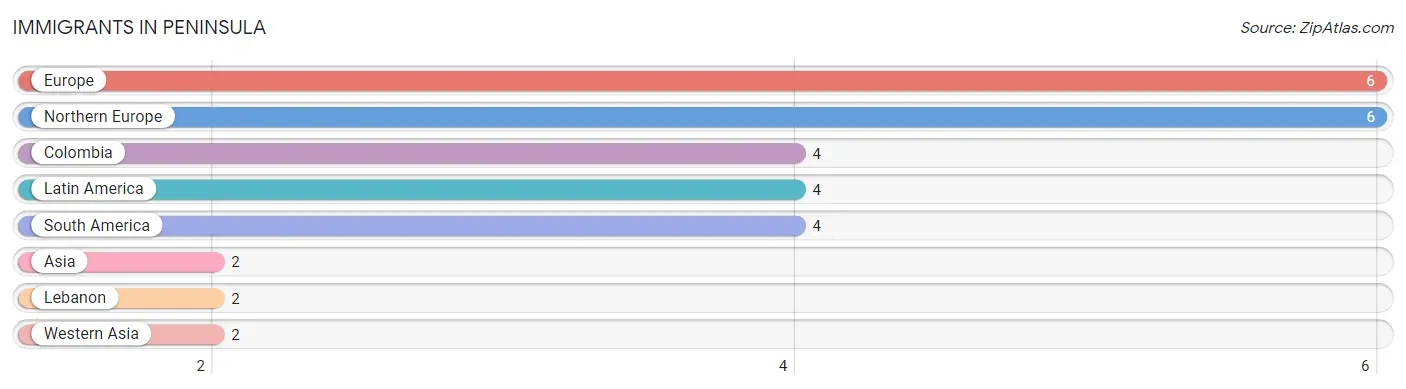
The most numerous immigrant groups reported in Peninsula came from Europe (6 | 0.9%), Northern Europe (6 | 0.9%), Colombia (4 | 0.6%), Latin America (4 | 0.6%), and South America (4 | 0.6%), together accounting for 3.8% of all Peninsula residents.
| Immigration Origin | # Population | % Population |
| Asia | 2 | 0.3% |
| Colombia | 4 | 0.6% |
| Europe | 6 | 0.9% |
| Latin America | 4 | 0.6% |
| Lebanon | 2 | 0.3% |
| Northern Europe | 6 | 0.9% |
| South America | 4 | 0.6% |
| Western Asia | 2 | 0.3% | View All 8 Rows |
Sex and Age in Peninsula
Sex and Age in Peninsula
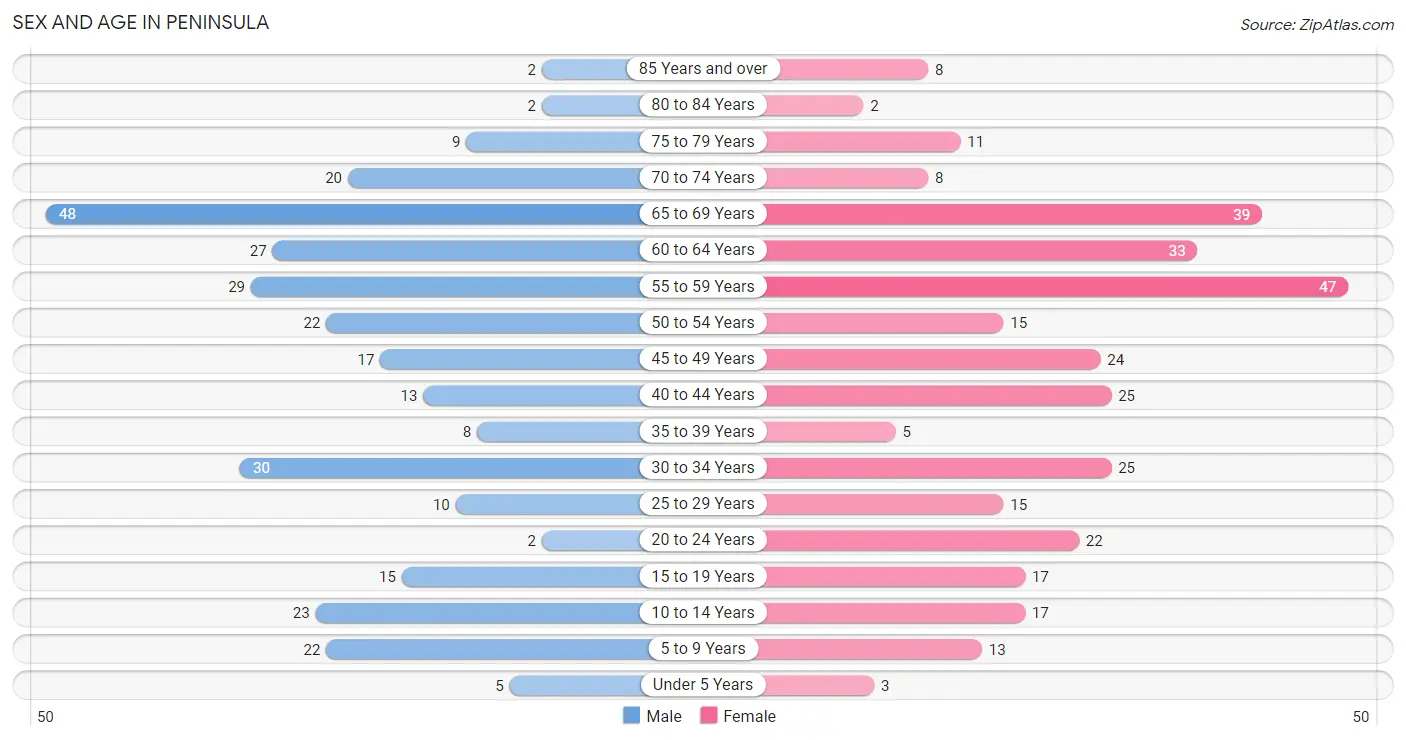
The most populous age groups in Peninsula are 65 to 69 Years (48 | 15.8%) for men and 55 to 59 Years (47 | 14.3%) for women.
| Age Bracket | Male | Female |
| Under 5 Years | 5 (1.6%) | 3 (0.9%) |
| 5 to 9 Years | 22 (7.2%) | 13 (4.0%) |
| 10 to 14 Years | 23 (7.6%) | 17 (5.2%) |
| 15 to 19 Years | 15 (4.9%) | 17 (5.2%) |
| 20 to 24 Years | 2 (0.7%) | 22 (6.7%) |
| 25 to 29 Years | 10 (3.3%) | 15 (4.6%) |
| 30 to 34 Years | 30 (9.9%) | 25 (7.6%) |
| 35 to 39 Years | 8 (2.6%) | 5 (1.5%) |
| 40 to 44 Years | 13 (4.3%) | 25 (7.6%) |
| 45 to 49 Years | 17 (5.6%) | 24 (7.3%) |
| 50 to 54 Years | 22 (7.2%) | 15 (4.6%) |
| 55 to 59 Years | 29 (9.5%) | 47 (14.3%) |
| 60 to 64 Years | 27 (8.9%) | 33 (10.0%) |
| 65 to 69 Years | 48 (15.8%) | 39 (11.8%) |
| 70 to 74 Years | 20 (6.6%) | 8 (2.4%) |
| 75 to 79 Years | 9 (3.0%) | 11 (3.3%) |
| 80 to 84 Years | 2 (0.7%) | 2 (0.6%) |
| 85 Years and over | 2 (0.7%) | 8 (2.4%) |
| Total | 304 (100.0%) | 329 (100.0%) |
Families and Households in Peninsula
Median Family Size in Peninsula
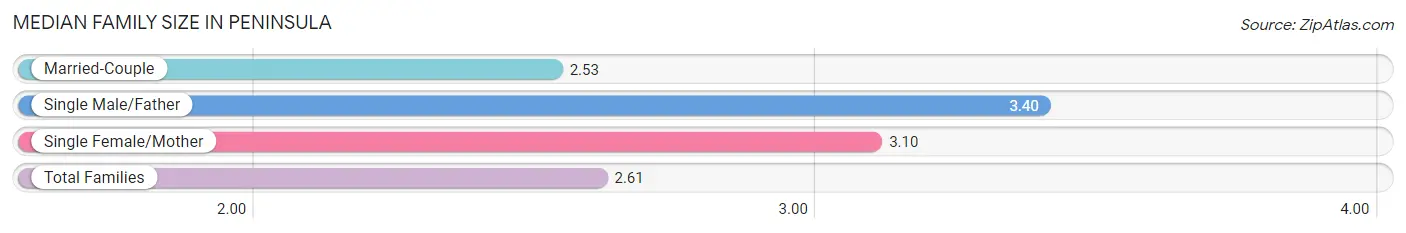
The median family size in Peninsula is 2.61 persons per family, with single male/father families (5 | 2.5%) accounting for the largest median family size of 3.4 persons per family. On the other hand, married-couple families (172 | 87.3%) represent the smallest median family size with 2.53 persons per family.
| Family Type | # Families | Family Size |
| Married-Couple | 172 (87.3%) | 2.53 |
| Single Male/Father | 5 (2.5%) | 3.40 |
| Single Female/Mother | 20 (10.2%) | 3.10 |
| Total Families | 197 (100.0%) | 2.61 |
Median Household Size in Peninsula
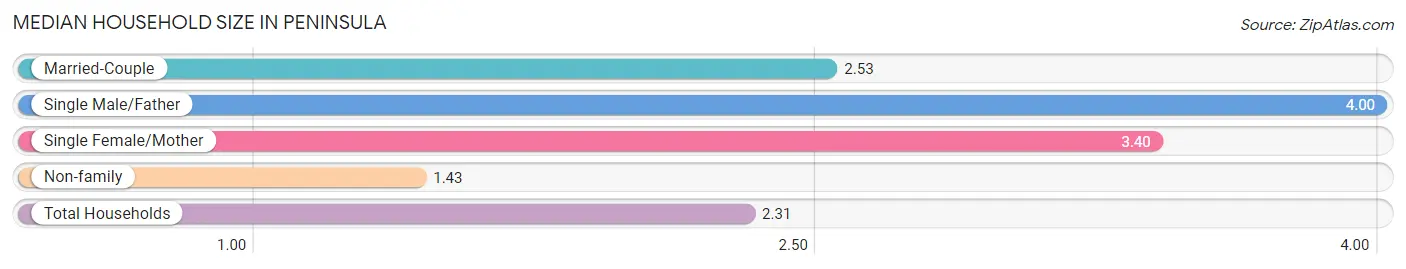
The median household size in Peninsula is 2.31 persons per household, with single male/father households (5 | 1.8%) accounting for the largest median household size of 4 persons per household. non-family households (77 | 28.1%) represent the smallest median household size with 1.43 persons per household.
| Household Type | # Households | Household Size |
| Married-Couple | 172 (62.8%) | 2.53 |
| Single Male/Father | 5 (1.8%) | 4.00 |
| Single Female/Mother | 20 (7.3%) | 3.40 |
| Non-family | 77 (28.1%) | 1.43 |
| Total Households | 274 (100.0%) | 2.31 |
Household Size by Marriage Status in Peninsula
Out of a total of 274 households in Peninsula, 197 (71.9%) are family households, while 77 (28.1%) are nonfamily households. The most numerous type of family households are 2-person households, comprising 128, and the most common type of nonfamily households are 1-person households, comprising 51.
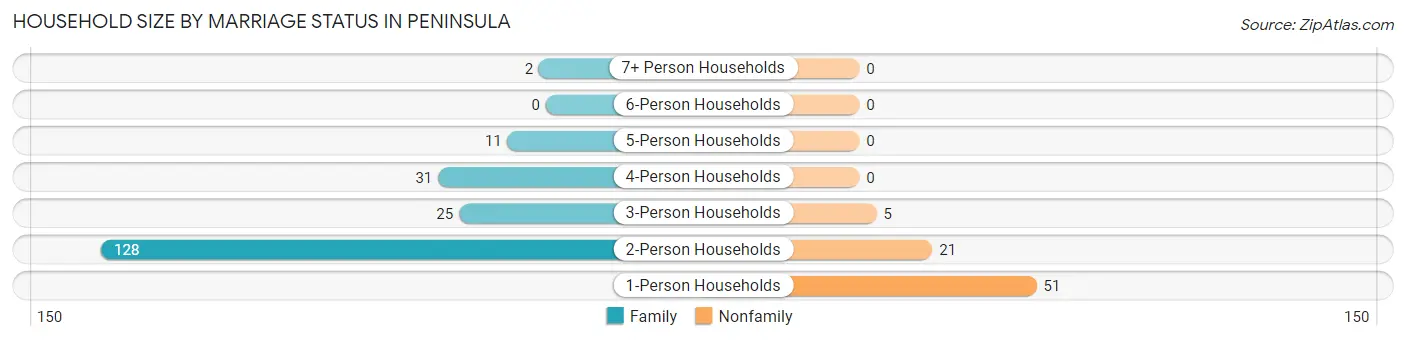
| Household Size | Family Households | Nonfamily Households |
| 1-Person Households | - | 51 (18.6%) |
| 2-Person Households | 128 (46.7%) | 21 (7.7%) |
| 3-Person Households | 25 (9.1%) | 5 (1.8%) |
| 4-Person Households | 31 (11.3%) | 0 (0.0%) |
| 5-Person Households | 11 (4.0%) | 0 (0.0%) |
| 6-Person Households | 0 (0.0%) | 0 (0.0%) |
| 7+ Person Households | 2 (0.7%) | 0 (0.0%) |
| Total | 197 (71.9%) | 77 (28.1%) |
Female Fertility in Peninsula
Fertility by Age in Peninsula
| Age Bracket | Women with Births | Births / 1,000 Women |
| 15 to 19 years | 0 (0.0%) | 0.0 |
| 20 to 34 years | 0 (0.0%) | 0.0 |
| 35 to 50 years | 0 (0.0%) | 0.0 |
| Total | 0 (0.0%) | 0.0 |
Fertility by Age by Marriage Status in Peninsula
| Age Bracket | Married | Unmarried |
| 15 to 19 years | 0 (0.0%) | 0 (0.0%) |
| 20 to 34 years | 0 (0.0%) | 0 (0.0%) |
| 35 to 50 years | 0 (0.0%) | 0 (0.0%) |
| Total | 0 (0.0%) | 0 (0.0%) |
Fertility by Education in Peninsula
| Educational Attainment | Women with Births | Births / 1,000 Women |
| Less than High School | 0 (0.0%) | 0.0 |
| High School Diploma | 0 (0.0%) | 0.0 |
| College or Associate's Degree | 0 (0.0%) | 0.0 |
| Bachelor's Degree | 0 (0.0%) | 0.0 |
| Graduate Degree | 0 (0.0%) | 0.0 |
| Total | 0 (0.0%) | 0.0 |
Fertility by Education by Marriage Status in Peninsula
| Educational Attainment | Married | Unmarried |
| Less than High School | 0 (0.0%) | 0 (0.0%) |
| High School Diploma | 0 (0.0%) | 0 (0.0%) |
| College or Associate's Degree | 0 (0.0%) | 0 (0.0%) |
| Bachelor's Degree | 0 (0.0%) | 0 (0.0%) |
| Graduate Degree | 0 (0.0%) | 0 (0.0%) |
| Total | 0 (0.0%) | 0 (0.0%) |
Employment Characteristics in Peninsula
Employment by Class of Employer in Peninsula
Among the 364 employed individuals in Peninsula, private company employees (194 | 53.3%), self-employed (incorporated) (49 | 13.5%), and self-employed (not incorporated) (46 | 12.6%) make up the most common classes of employment.
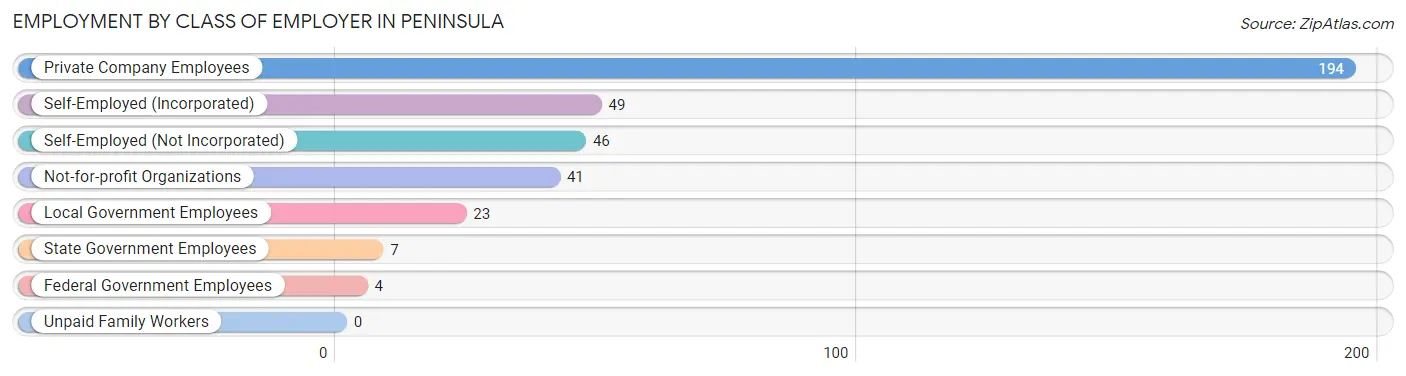
| Employer Class | # Employees | % Employees |
| Private Company Employees | 194 | 53.3% |
| Self-Employed (Incorporated) | 49 | 13.5% |
| Self-Employed (Not Incorporated) | 46 | 12.6% |
| Not-for-profit Organizations | 41 | 11.3% |
| Local Government Employees | 23 | 6.3% |
| State Government Employees | 7 | 1.9% |
| Federal Government Employees | 4 | 1.1% |
| Unpaid Family Workers | 0 | 0.0% |
| Total | 364 | 100.0% |
Employment Status by Age in Peninsula
According to the labor force statistics for Peninsula, out of the total population over 16 years of age (540), 70.6% or 381 individuals are in the labor force, with 4.5% or 17 of them unemployed. The age group with the highest labor force participation rate is 20 to 24 years, with 100.0% or 24 individuals in the labor force. Within the labor force, the 16 to 19 years age range has the highest percentage of unemployed individuals, with 100.0% or 12 of them being unemployed.
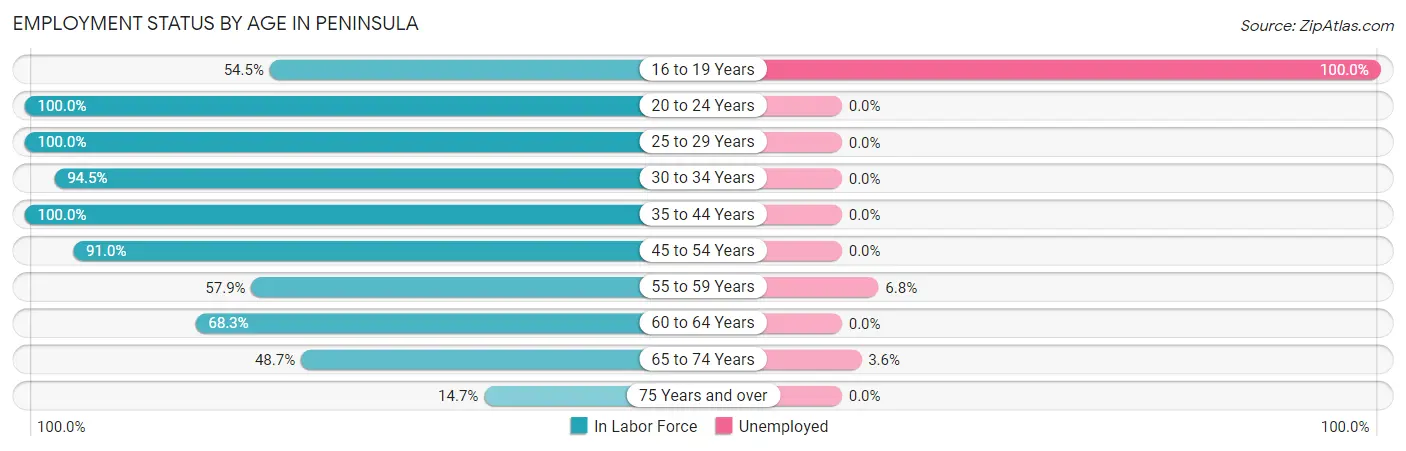
| Age Bracket | In Labor Force | Unemployed |
| 16 to 19 Years | 12 (54.5%) | 12 (100.0%) |
| 20 to 24 Years | 24 (100.0%) | 0 (0.0%) |
| 25 to 29 Years | 25 (100.0%) | 0 (0.0%) |
| 30 to 34 Years | 52 (94.5%) | 0 (0.0%) |
| 35 to 44 Years | 51 (100.0%) | 0 (0.0%) |
| 45 to 54 Years | 71 (91.0%) | 0 (0.0%) |
| 55 to 59 Years | 44 (57.9%) | 3 (6.8%) |
| 60 to 64 Years | 41 (68.3%) | 0 (0.0%) |
| 65 to 74 Years | 56 (48.7%) | 2 (3.6%) |
| 75 Years and over | 5 (14.7%) | 0 (0.0%) |
| Total | 381 (70.6%) | 17 (4.5%) |
Employment Status by Educational Attainment in Peninsula
According to labor force statistics for Peninsula, 82.3% of individuals (284) out of the total population between 25 and 64 years of age (345) are in the labor force, with 1.1% or 3 of them being unemployed. The group with the highest labor force participation rate are those with the educational attainment of bachelor's degree or higher, with 93.2% or 193 individuals in the labor force. Within the labor force, individuals with college / associate degree education have the highest percentage of unemployment, with 4.6% or 3 of them being unemployed.
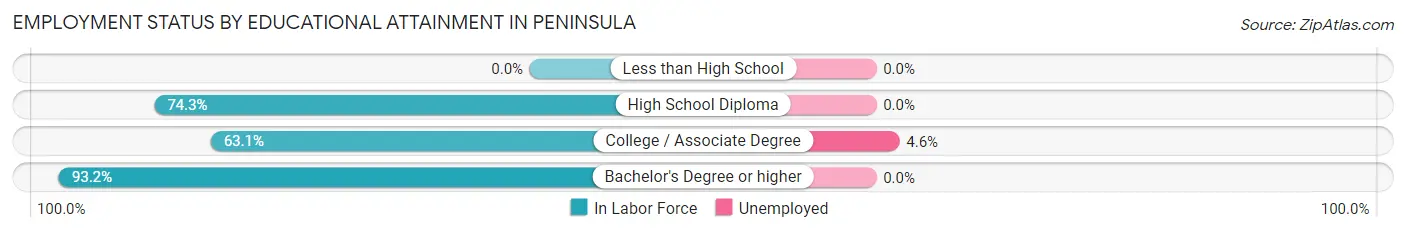
| Educational Attainment | In Labor Force | Unemployed |
| Less than High School | 0 (0.0%) | 0 (0.0%) |
| High School Diploma | 26 (74.3%) | 0 (0.0%) |
| College / Associate Degree | 65 (63.1%) | 5 (4.6%) |
| Bachelor's Degree or higher | 193 (93.2%) | 0 (0.0%) |
| Total | 284 (82.3%) | 4 (1.1%) |
Employment Occupations by Sex in Peninsula
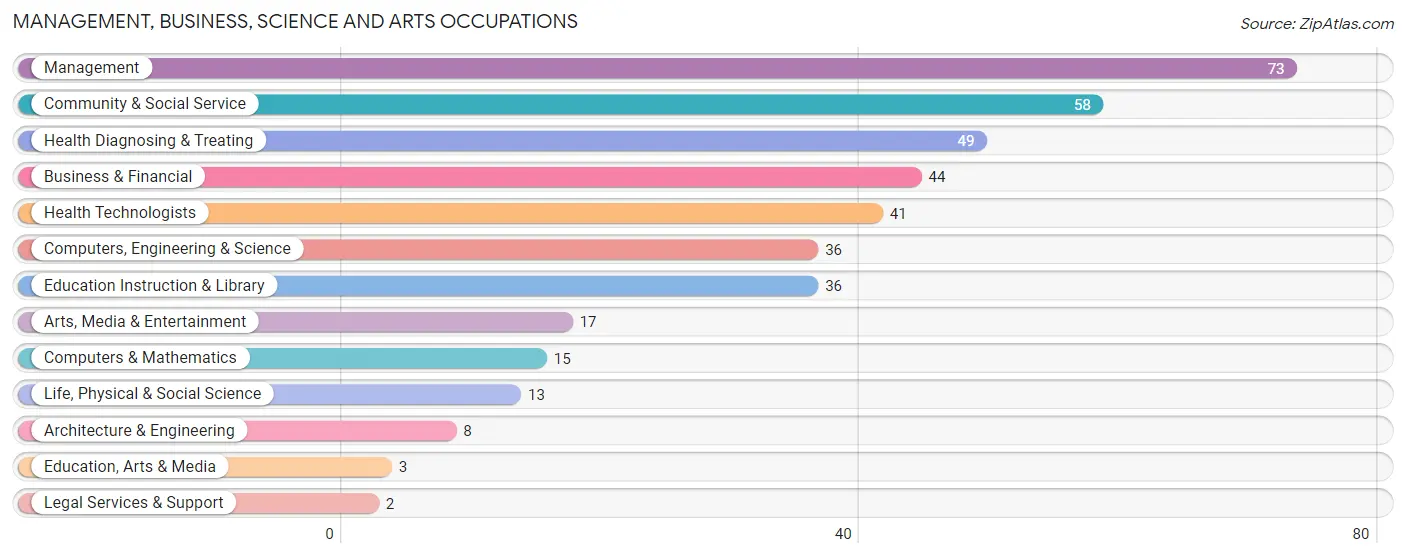
Management, Business, Science and Arts Occupations
The most common Management, Business, Science and Arts occupations in Peninsula are Management (73 | 20.1%), Community & Social Service (58 | 15.9%), Health Diagnosing & Treating (49 | 13.5%), Business & Financial (44 | 12.1%), and Health Technologists (41 | 11.3%).
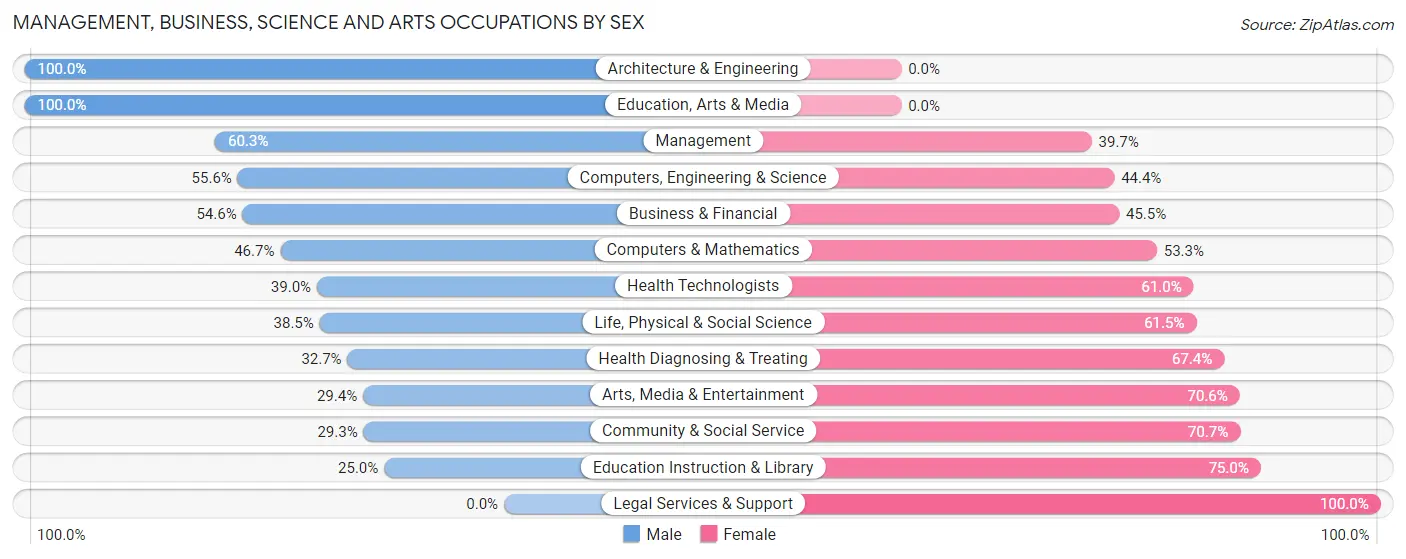
Management, Business, Science and Arts Occupations by Sex
Within the Management, Business, Science and Arts occupations in Peninsula, the most male-oriented occupations are Architecture & Engineering (100.0%), Education, Arts & Media (100.0%), and Management (60.3%), while the most female-oriented occupations are Legal Services & Support (100.0%), Education Instruction & Library (75.0%), and Community & Social Service (70.7%).
| Occupation | Male | Female |
| Management | 44 (60.3%) | 29 (39.7%) |
| Business & Financial | 24 (54.5%) | 20 (45.5%) |
| Computers, Engineering & Science | 20 (55.6%) | 16 (44.4%) |
| Computers & Mathematics | 7 (46.7%) | 8 (53.3%) |
| Architecture & Engineering | 8 (100.0%) | 0 (0.0%) |
| Life, Physical & Social Science | 5 (38.5%) | 8 (61.5%) |
| Community & Social Service | 17 (29.3%) | 41 (70.7%) |
| Education, Arts & Media | 3 (100.0%) | 0 (0.0%) |
| Legal Services & Support | 0 (0.0%) | 2 (100.0%) |
| Education Instruction & Library | 9 (25.0%) | 27 (75.0%) |
| Arts, Media & Entertainment | 5 (29.4%) | 12 (70.6%) |
| Health Diagnosing & Treating | 16 (32.7%) | 33 (67.3%) |
| Health Technologists | 16 (39.0%) | 25 (61.0%) |
| Total (Category) | 121 (46.5%) | 139 (53.5%) |
| Total (Overall) | 161 (44.2%) | 203 (55.8%) |
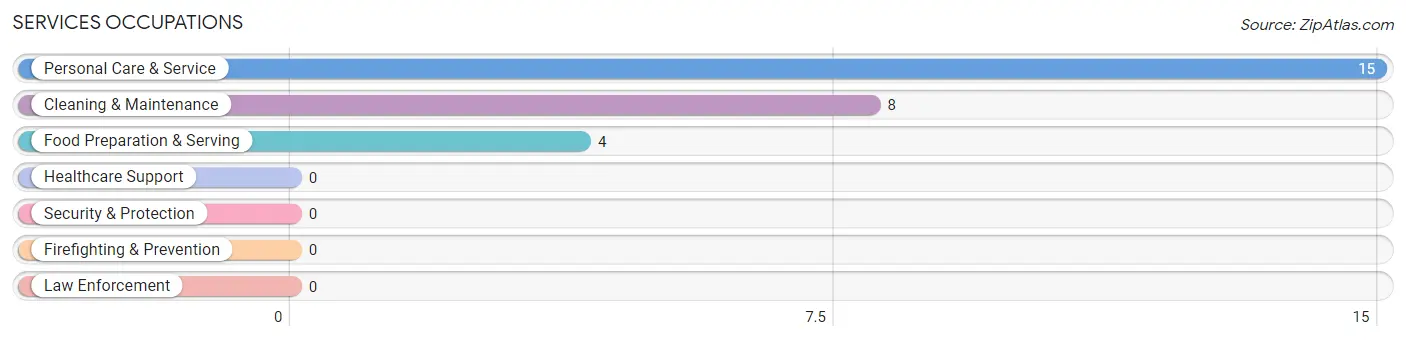
Services Occupations
The most common Services occupations in Peninsula are Personal Care & Service (15 | 4.1%), Cleaning & Maintenance (8 | 2.2%), and Food Preparation & Serving (4 | 1.1%).
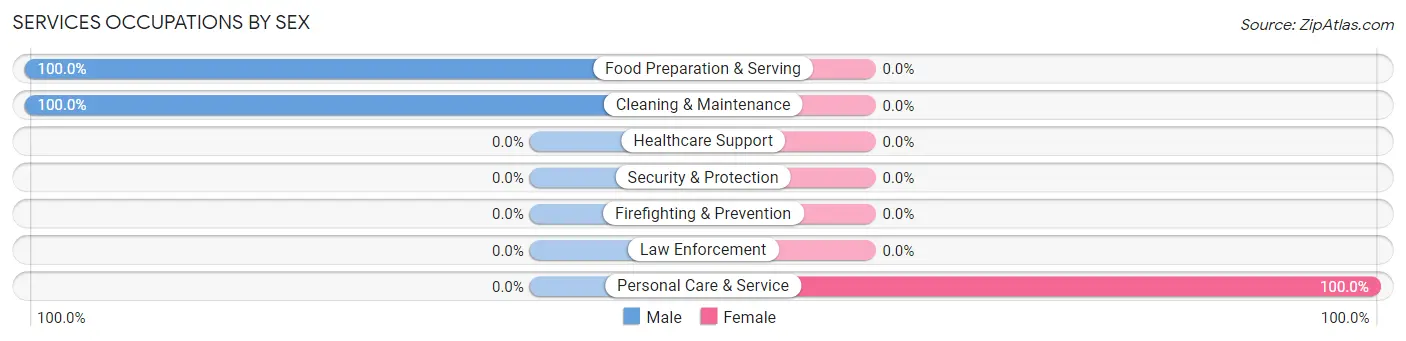
Services Occupations by Sex
| Occupation | Male | Female |
| Healthcare Support | 0 (0.0%) | 0 (0.0%) |
| Security & Protection | 0 (0.0%) | 0 (0.0%) |
| Firefighting & Prevention | 0 (0.0%) | 0 (0.0%) |
| Law Enforcement | 0 (0.0%) | 0 (0.0%) |
| Food Preparation & Serving | 4 (100.0%) | 0 (0.0%) |
| Cleaning & Maintenance | 8 (100.0%) | 0 (0.0%) |
| Personal Care & Service | 0 (0.0%) | 15 (100.0%) |
| Total (Category) | 12 (44.4%) | 15 (55.6%) |
| Total (Overall) | 161 (44.2%) | 203 (55.8%) |
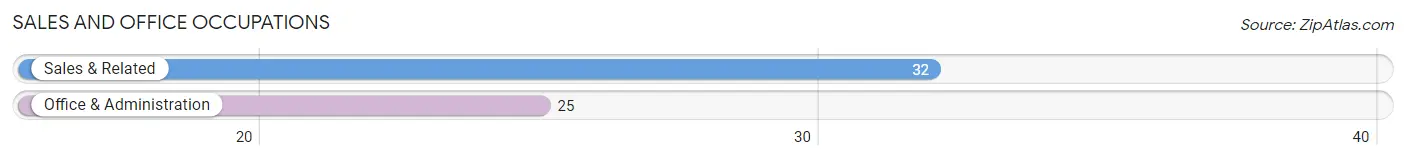
Sales and Office Occupations
The most common Sales and Office occupations in Peninsula are Sales & Related (32 | 8.8%), and Office & Administration (25 | 6.9%).
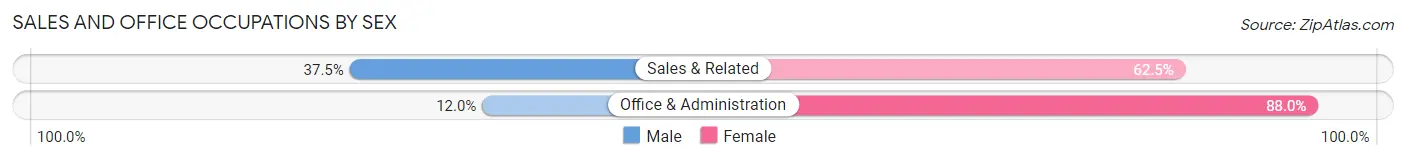
Sales and Office Occupations by Sex
| Occupation | Male | Female |
| Sales & Related | 12 (37.5%) | 20 (62.5%) |
| Office & Administration | 3 (12.0%) | 22 (88.0%) |
| Total (Category) | 15 (26.3%) | 42 (73.7%) |
| Total (Overall) | 161 (44.2%) | 203 (55.8%) |
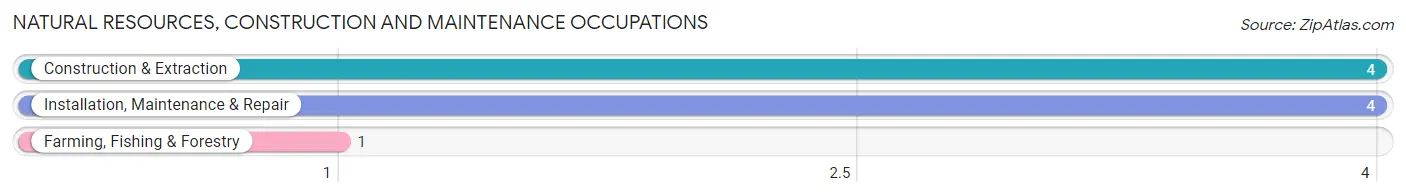
Natural Resources, Construction and Maintenance Occupations
The most common Natural Resources, Construction and Maintenance occupations in Peninsula are Construction & Extraction (4 | 1.1%), Installation, Maintenance & Repair (4 | 1.1%), and Farming, Fishing & Forestry (1 | 0.3%).
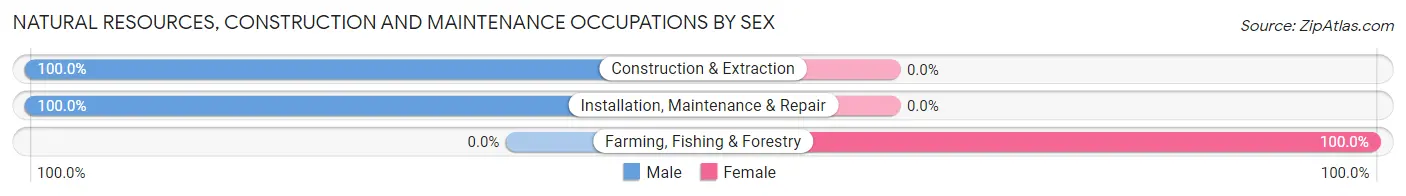
Natural Resources, Construction and Maintenance Occupations by Sex
| Occupation | Male | Female |
| Farming, Fishing & Forestry | 0 (0.0%) | 1 (100.0%) |
| Construction & Extraction | 4 (100.0%) | 0 (0.0%) |
| Installation, Maintenance & Repair | 4 (100.0%) | 0 (0.0%) |
| Total (Category) | 8 (88.9%) | 1 (11.1%) |
| Total (Overall) | 161 (44.2%) | 203 (55.8%) |
Production, Transportation and Moving Occupations
The most common Production, Transportation and Moving occupations in Peninsula are Production (6 | 1.7%), Transportation (3 | 0.8%), and Material Moving (2 | 0.5%).
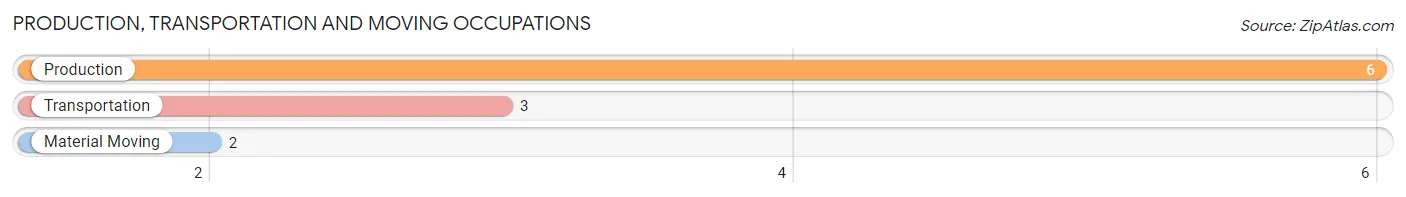
Production, Transportation and Moving Occupations by Sex
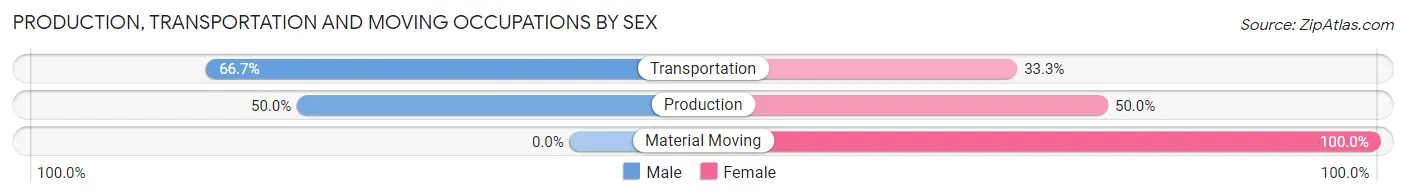
| Occupation | Male | Female |
| Production | 3 (50.0%) | 3 (50.0%) |
| Transportation | 2 (66.7%) | 1 (33.3%) |
| Material Moving | 0 (0.0%) | 2 (100.0%) |
| Total (Category) | 5 (45.5%) | 6 (54.5%) |
| Total (Overall) | 161 (44.2%) | 203 (55.8%) |
Employment Industries by Sex in Peninsula
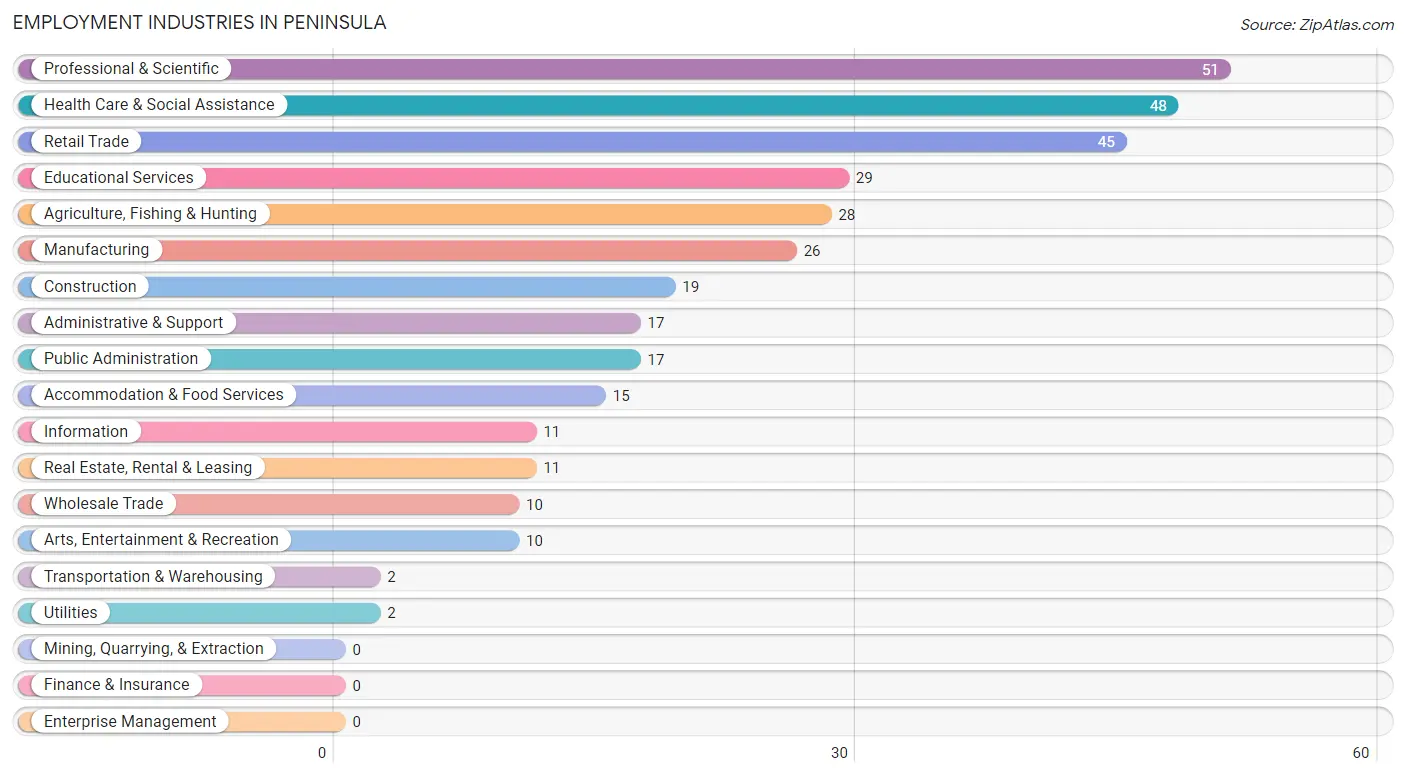
Employment Industries in Peninsula
The major employment industries in Peninsula include Professional & Scientific (51 | 14.0%), Health Care & Social Assistance (48 | 13.2%), Retail Trade (45 | 12.4%), Educational Services (29 | 8.0%), and Agriculture, Fishing & Hunting (28 | 7.7%).
Employment Industries by Sex in Peninsula
The Peninsula industries that see more men than women are Transportation & Warehousing (100.0%), Utilities (100.0%), and Construction (68.4%), whereas the industries that tend to have a higher number of women are Information (100.0%), Accommodation & Food Services (100.0%), and Wholesale Trade (80.0%).
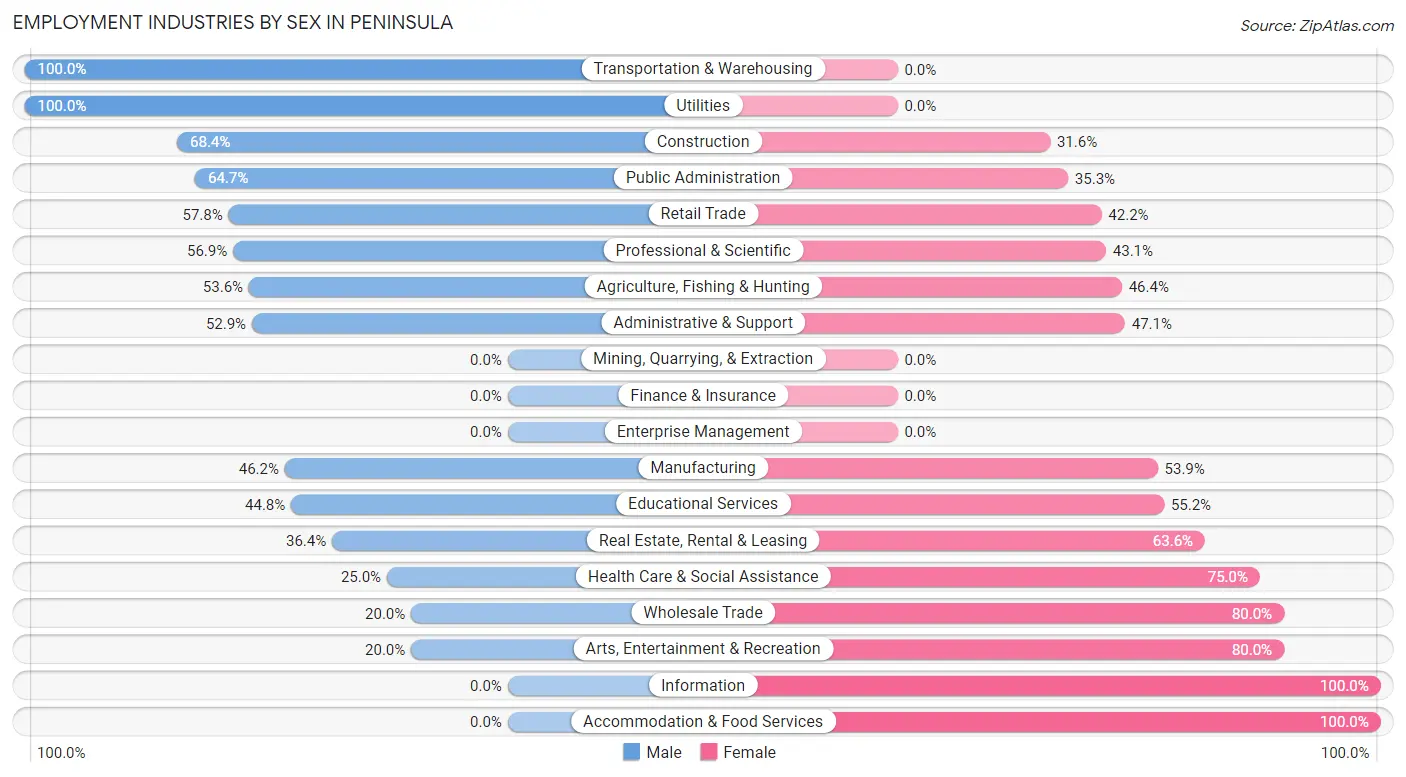
| Industry | Male | Female |
| Agriculture, Fishing & Hunting | 15 (53.6%) | 13 (46.4%) |
| Mining, Quarrying, & Extraction | 0 (0.0%) | 0 (0.0%) |
| Construction | 13 (68.4%) | 6 (31.6%) |
| Manufacturing | 12 (46.2%) | 14 (53.8%) |
| Wholesale Trade | 2 (20.0%) | 8 (80.0%) |
| Retail Trade | 26 (57.8%) | 19 (42.2%) |
| Transportation & Warehousing | 2 (100.0%) | 0 (0.0%) |
| Utilities | 2 (100.0%) | 0 (0.0%) |
| Information | 0 (0.0%) | 11 (100.0%) |
| Finance & Insurance | 0 (0.0%) | 0 (0.0%) |
| Real Estate, Rental & Leasing | 4 (36.4%) | 7 (63.6%) |
| Professional & Scientific | 29 (56.9%) | 22 (43.1%) |
| Enterprise Management | 0 (0.0%) | 0 (0.0%) |
| Administrative & Support | 9 (52.9%) | 8 (47.1%) |
| Educational Services | 13 (44.8%) | 16 (55.2%) |
| Health Care & Social Assistance | 12 (25.0%) | 36 (75.0%) |
| Arts, Entertainment & Recreation | 2 (20.0%) | 8 (80.0%) |
| Accommodation & Food Services | 0 (0.0%) | 15 (100.0%) |
| Public Administration | 11 (64.7%) | 6 (35.3%) |
| Total | 161 (44.2%) | 203 (55.8%) |
Education in Peninsula
School Enrollment in Peninsula
The most common levels of schooling among the 144 students in Peninsula are elementary school (36 | 25.0%), high school (33 | 22.9%), and middle school (31 | 21.5%).
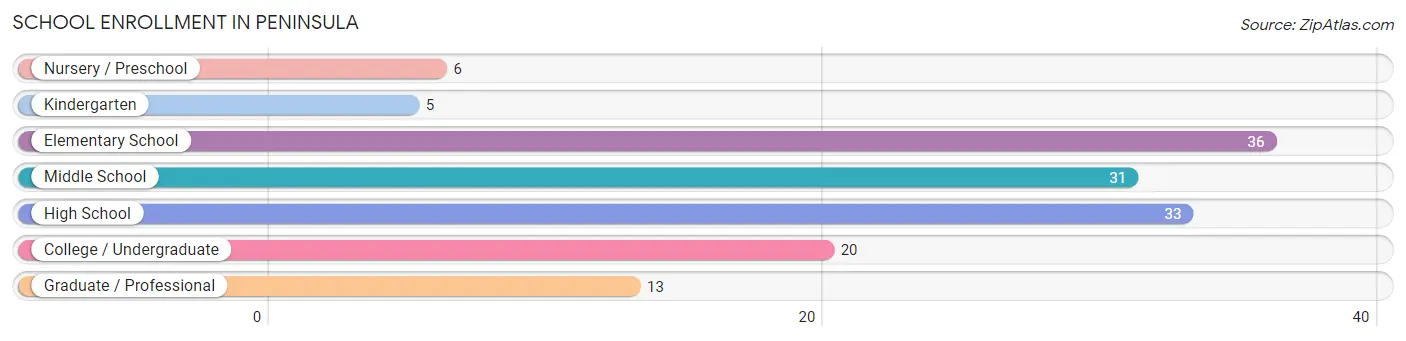
| School Level | # Students | % Students |
| Nursery / Preschool | 6 | 4.2% |
| Kindergarten | 5 | 3.5% |
| Elementary School | 36 | 25.0% |
| Middle School | 31 | 21.5% |
| High School | 33 | 22.9% |
| College / Undergraduate | 20 | 13.9% |
| Graduate / Professional | 13 | 9.0% |
| Total | 144 | 100.0% |
School Enrollment by Age by Funding Source in Peninsula
Out of a total of 144 students who are enrolled in schools in Peninsula, 41 (28.5%) attend a private institution, while the remaining 103 (71.5%) are enrolled in public schools. The age group of 3 to 4 year olds has the highest likelihood of being enrolled in private schools, with 6 (100.0% in the age bracket) enrolled. Conversely, the age group of 18 to 19 year olds has the lowest likelihood of being enrolled in a private school, with 10 (100.0% in the age bracket) attending a public institution.
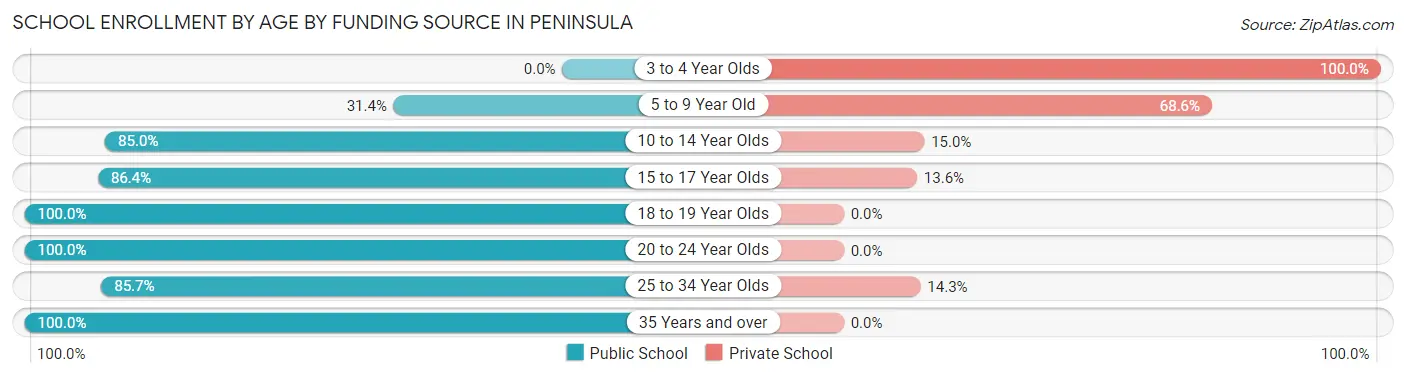
| Age Bracket | Public School | Private School |
| 3 to 4 Year Olds | 0 (0.0%) | 6 (100.0%) |
| 5 to 9 Year Old | 11 (31.4%) | 24 (68.6%) |
| 10 to 14 Year Olds | 34 (85.0%) | 6 (15.0%) |
| 15 to 17 Year Olds | 19 (86.4%) | 3 (13.6%) |
| 18 to 19 Year Olds | 10 (100.0%) | 0 (0.0%) |
| 20 to 24 Year Olds | 15 (100.0%) | 0 (0.0%) |
| 25 to 34 Year Olds | 12 (85.7%) | 2 (14.3%) |
| 35 Years and over | 2 (100.0%) | 0 (0.0%) |
| Total | 103 (71.5%) | 41 (28.5%) |
Educational Attainment by Field of Study in Peninsula
Business (47 | 14.8%), education (38 | 11.9%), science & technology (36 | 11.3%), literature & languages (30 | 9.4%), and engineering (27 | 8.5%) are the most common fields of study among 318 individuals in Peninsula who have obtained a bachelor's degree or higher.
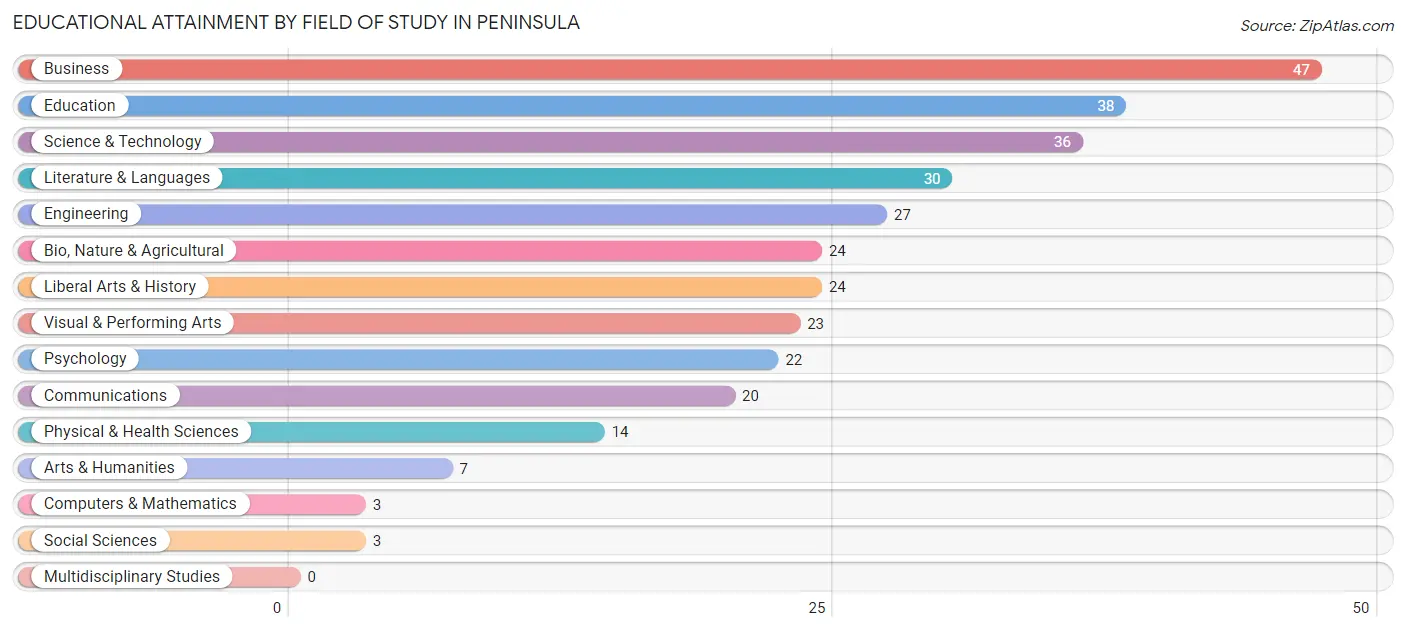
| Field of Study | # Graduates | % Graduates |
| Computers & Mathematics | 3 | 0.9% |
| Bio, Nature & Agricultural | 24 | 7.5% |
| Physical & Health Sciences | 14 | 4.4% |
| Psychology | 22 | 6.9% |
| Social Sciences | 3 | 0.9% |
| Engineering | 27 | 8.5% |
| Multidisciplinary Studies | 0 | 0.0% |
| Science & Technology | 36 | 11.3% |
| Business | 47 | 14.8% |
| Education | 38 | 11.9% |
| Literature & Languages | 30 | 9.4% |
| Liberal Arts & History | 24 | 7.5% |
| Visual & Performing Arts | 23 | 7.2% |
| Communications | 20 | 6.3% |
| Arts & Humanities | 7 | 2.2% |
| Total | 318 | 100.0% |
Transportation & Commute in Peninsula
Vehicle Availability by Sex in Peninsula
The most prevalent vehicle ownership categories in Peninsula are males with 2 vehicles (79, accounting for 49.1%) and females with 2 vehicles (87, making up 38.9%).
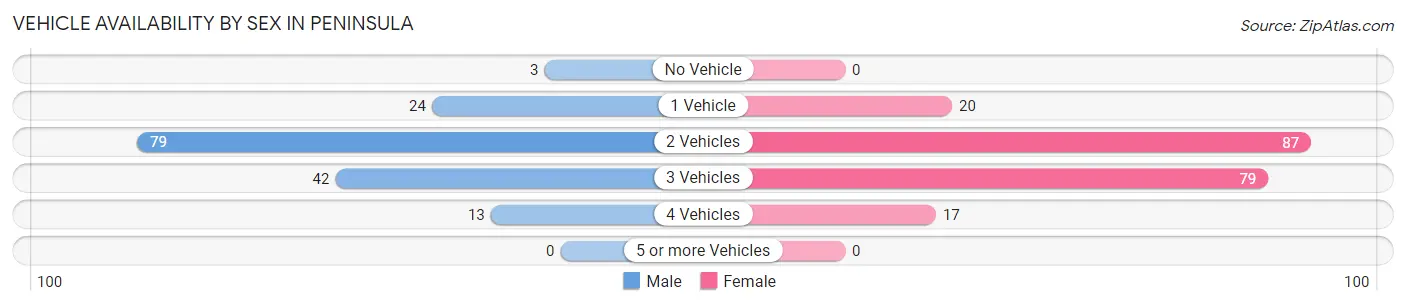
| Vehicles Available | Male | Female |
| No Vehicle | 3 (1.9%) | 0 (0.0%) |
| 1 Vehicle | 24 (14.9%) | 20 (9.9%) |
| 2 Vehicles | 79 (49.1%) | 87 (42.9%) |
| 3 Vehicles | 42 (26.1%) | 79 (38.9%) |
| 4 Vehicles | 13 (8.1%) | 17 (8.4%) |
| 5 or more Vehicles | 0 (0.0%) | 0 (0.0%) |
| Total | 161 (100.0%) | 203 (100.0%) |
Commute Time in Peninsula
The most frequently occuring commute durations in Peninsula are 30 to 34 minutes (59 commuters, 22.1%), 20 to 24 minutes (53 commuters, 19.9%), and 15 to 19 minutes (49 commuters, 18.3%).
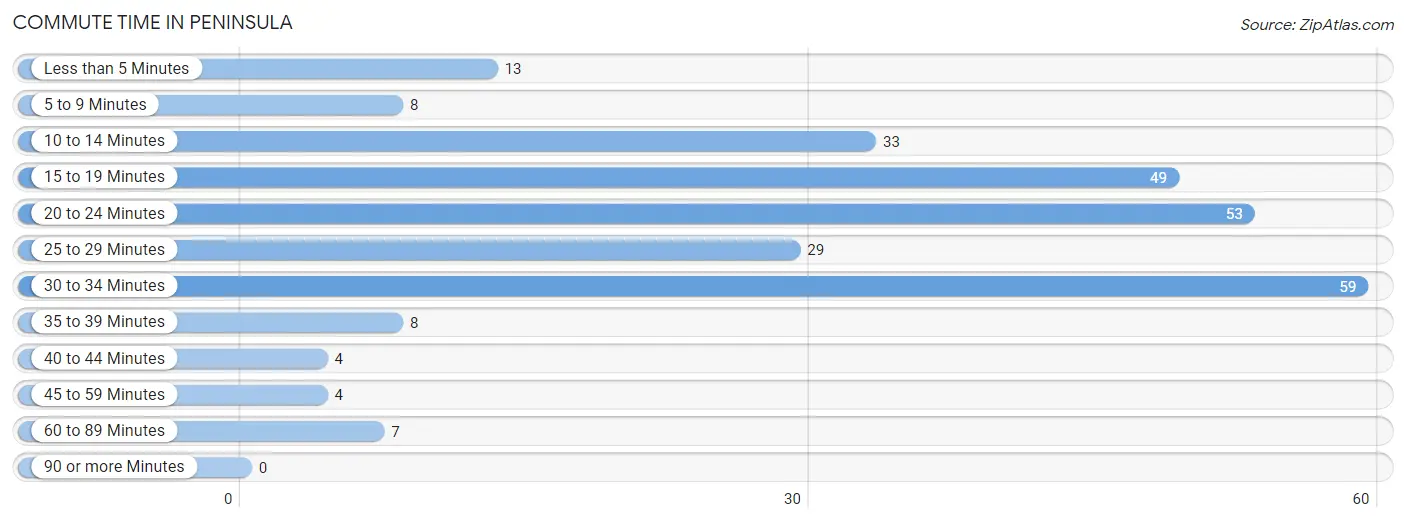
| Commute Time | # Commuters | % Commuters |
| Less than 5 Minutes | 13 | 4.9% |
| 5 to 9 Minutes | 8 | 3.0% |
| 10 to 14 Minutes | 33 | 12.4% |
| 15 to 19 Minutes | 49 | 18.3% |
| 20 to 24 Minutes | 53 | 19.9% |
| 25 to 29 Minutes | 29 | 10.9% |
| 30 to 34 Minutes | 59 | 22.1% |
| 35 to 39 Minutes | 8 | 3.0% |
| 40 to 44 Minutes | 4 | 1.5% |
| 45 to 59 Minutes | 4 | 1.5% |
| 60 to 89 Minutes | 7 | 2.6% |
| 90 or more Minutes | 0 | 0.0% |
Commute Time by Sex in Peninsula
The most common commute times in Peninsula are 20 to 24 minutes (24 commuters, 19.4%) for males and 30 to 34 minutes (35 commuters, 24.5%) for females.
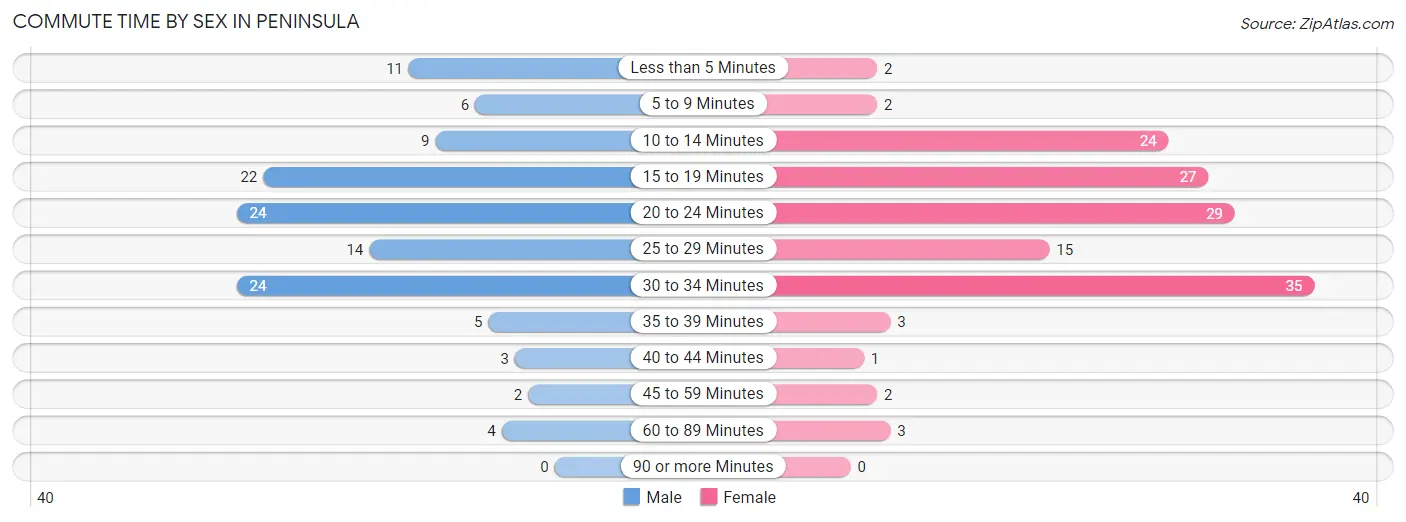
| Commute Time | Male | Female |
| Less than 5 Minutes | 11 (8.9%) | 2 (1.4%) |
| 5 to 9 Minutes | 6 (4.8%) | 2 (1.4%) |
| 10 to 14 Minutes | 9 (7.3%) | 24 (16.8%) |
| 15 to 19 Minutes | 22 (17.7%) | 27 (18.9%) |
| 20 to 24 Minutes | 24 (19.4%) | 29 (20.3%) |
| 25 to 29 Minutes | 14 (11.3%) | 15 (10.5%) |
| 30 to 34 Minutes | 24 (19.4%) | 35 (24.5%) |
| 35 to 39 Minutes | 5 (4.0%) | 3 (2.1%) |
| 40 to 44 Minutes | 3 (2.4%) | 1 (0.7%) |
| 45 to 59 Minutes | 2 (1.6%) | 2 (1.4%) |
| 60 to 89 Minutes | 4 (3.2%) | 3 (2.1%) |
| 90 or more Minutes | 0 (0.0%) | 0 (0.0%) |
Time of Departure to Work by Sex in Peninsula
The most frequent times of departure to work in Peninsula are 7:30 AM to 7:59 AM (36, 29.0%) for males and 8:00 AM to 8:29 AM (24, 16.8%) for females.
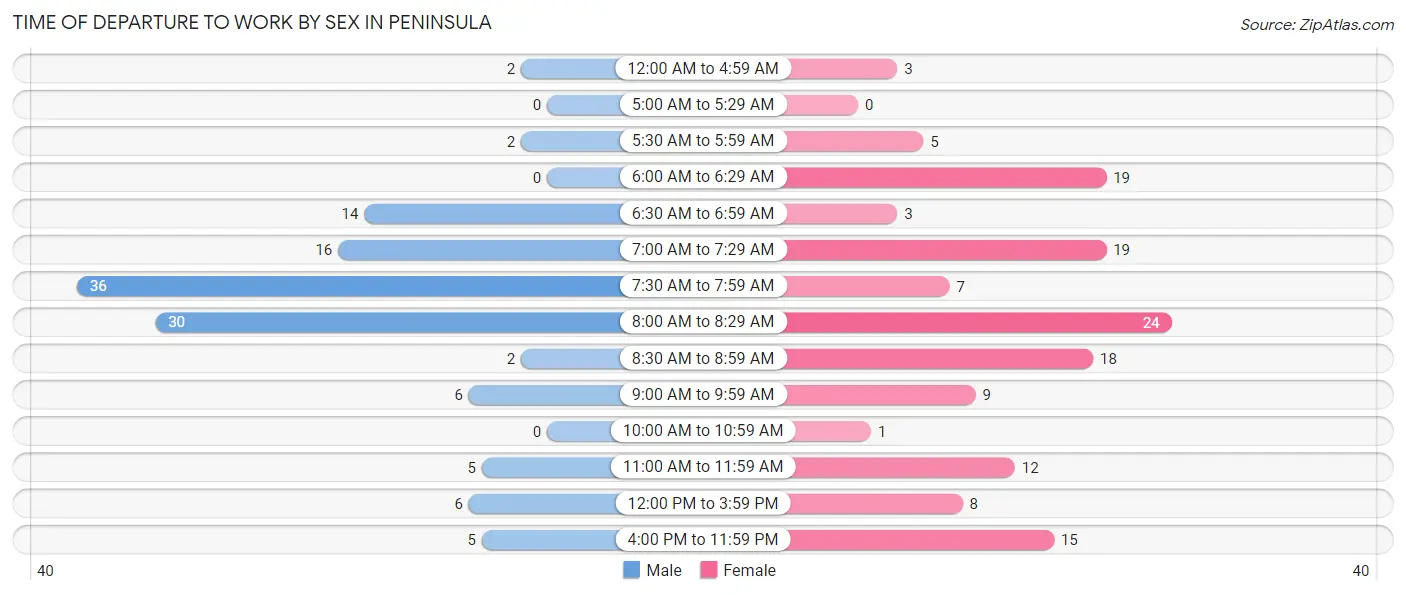
| Time of Departure | Male | Female |
| 12:00 AM to 4:59 AM | 2 (1.6%) | 3 (2.1%) |
| 5:00 AM to 5:29 AM | 0 (0.0%) | 0 (0.0%) |
| 5:30 AM to 5:59 AM | 2 (1.6%) | 5 (3.5%) |
| 6:00 AM to 6:29 AM | 0 (0.0%) | 19 (13.3%) |
| 6:30 AM to 6:59 AM | 14 (11.3%) | 3 (2.1%) |
| 7:00 AM to 7:29 AM | 16 (12.9%) | 19 (13.3%) |
| 7:30 AM to 7:59 AM | 36 (29.0%) | 7 (4.9%) |
| 8:00 AM to 8:29 AM | 30 (24.2%) | 24 (16.8%) |
| 8:30 AM to 8:59 AM | 2 (1.6%) | 18 (12.6%) |
| 9:00 AM to 9:59 AM | 6 (4.8%) | 9 (6.3%) |
| 10:00 AM to 10:59 AM | 0 (0.0%) | 1 (0.7%) |
| 11:00 AM to 11:59 AM | 5 (4.0%) | 12 (8.4%) |
| 12:00 PM to 3:59 PM | 6 (4.8%) | 8 (5.6%) |
| 4:00 PM to 11:59 PM | 5 (4.0%) | 15 (10.5%) |
| Total | 124 (100.0%) | 143 (100.0%) |
Housing Occupancy in Peninsula
Occupancy by Ownership in Peninsula
Of the total 274 dwellings in Peninsula, owner-occupied units account for 228 (83.2%), while renter-occupied units make up 46 (16.8%).
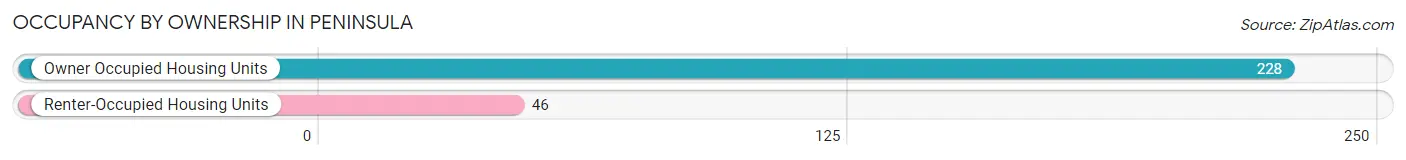
| Occupancy | # Housing Units | % Housing Units |
| Owner Occupied Housing Units | 228 | 83.2% |
| Renter-Occupied Housing Units | 46 | 16.8% |
| Total Occupied Housing Units | 274 | 100.0% |
Occupancy by Household Size in Peninsula
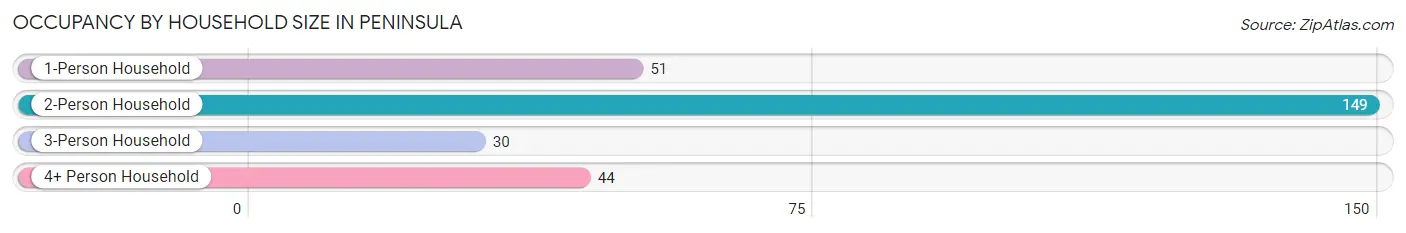
| Household Size | # Housing Units | % Housing Units |
| 1-Person Household | 51 | 18.6% |
| 2-Person Household | 149 | 54.4% |
| 3-Person Household | 30 | 11.0% |
| 4+ Person Household | 44 | 16.1% |
| Total Housing Units | 274 | 100.0% |
Occupancy by Ownership by Household Size in Peninsula
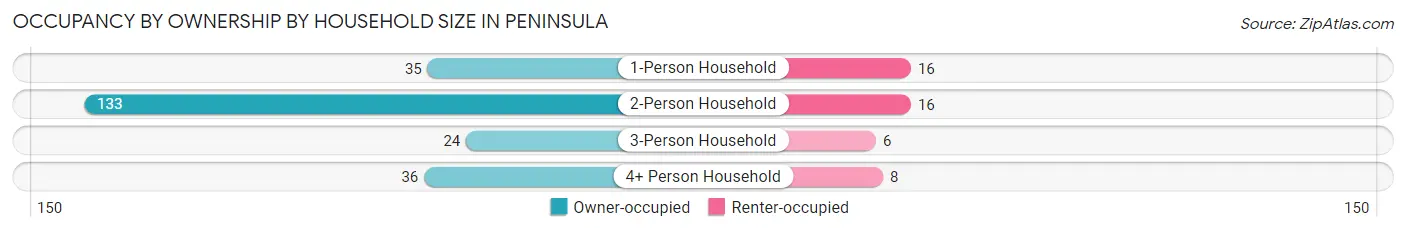
| Household Size | Owner-occupied | Renter-occupied |
| 1-Person Household | 35 (68.6%) | 16 (31.4%) |
| 2-Person Household | 133 (89.3%) | 16 (10.7%) |
| 3-Person Household | 24 (80.0%) | 6 (20.0%) |
| 4+ Person Household | 36 (81.8%) | 8 (18.2%) |
| Total Housing Units | 228 (83.2%) | 46 (16.8%) |
Occupancy by Educational Attainment in Peninsula
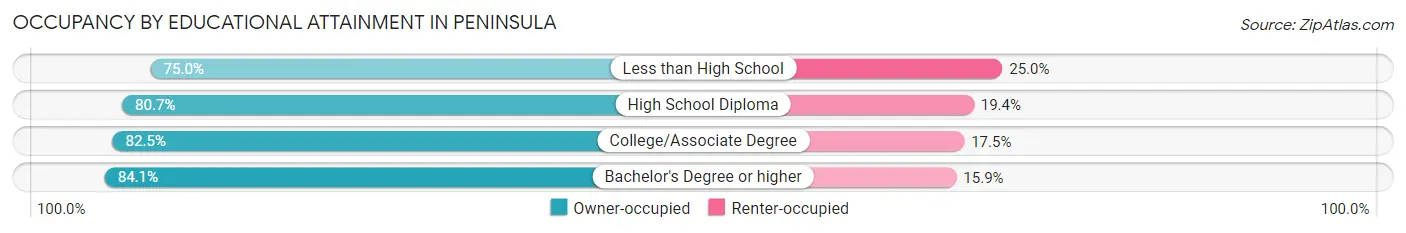
| Household Size | Owner-occupied | Renter-occupied |
| Less than High School | 3 (75.0%) | 1 (25.0%) |
| High School Diploma | 25 (80.6%) | 6 (19.4%) |
| College/Associate Degree | 52 (82.5%) | 11 (17.5%) |
| Bachelor's Degree or higher | 148 (84.1%) | 28 (15.9%) |
Occupancy by Age of Householder in Peninsula
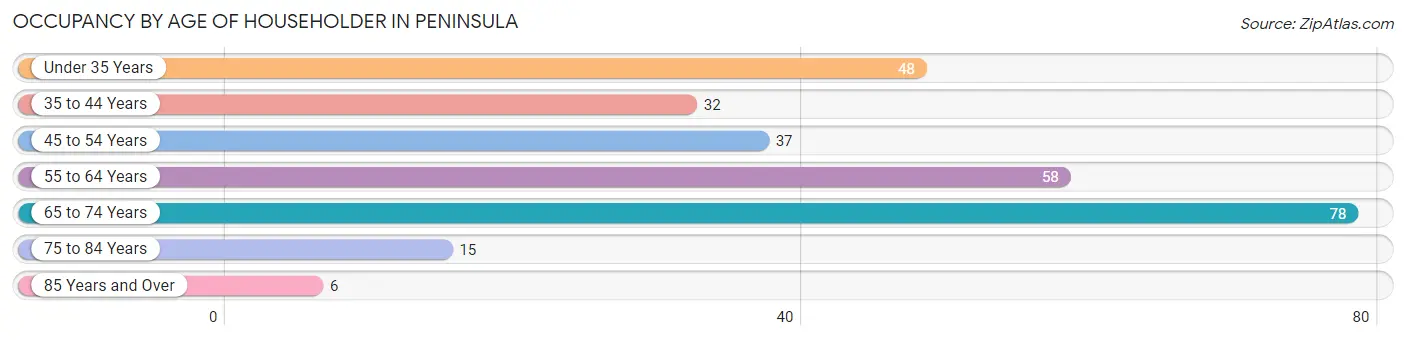
| Age Bracket | # Households | % Households |
| Under 35 Years | 48 | 17.5% |
| 35 to 44 Years | 32 | 11.7% |
| 45 to 54 Years | 37 | 13.5% |
| 55 to 64 Years | 58 | 21.2% |
| 65 to 74 Years | 78 | 28.5% |
| 75 to 84 Years | 15 | 5.5% |
| 85 Years and Over | 6 | 2.2% |
| Total | 274 | 100.0% |
Housing Finances in Peninsula
Median Income by Occupancy in Peninsula
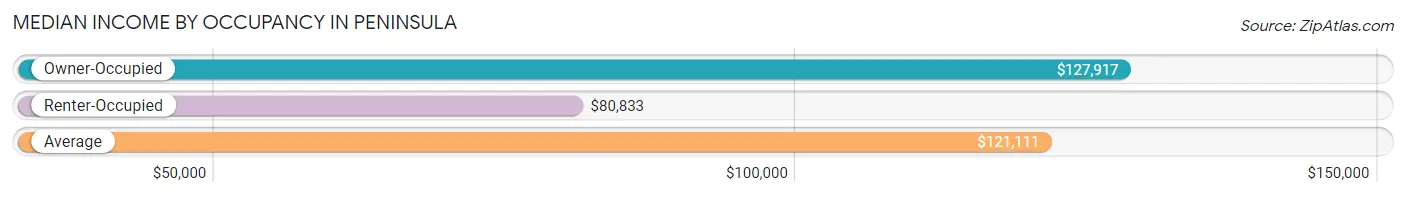
| Occupancy Type | # Households | Median Income |
| Owner-Occupied | 228 (83.2%) | $127,917 |
| Renter-Occupied | 46 (16.8%) | $80,833 |
| Average | 274 (100.0%) | $121,111 |
Occupancy by Householder Income Bracket in Peninsula
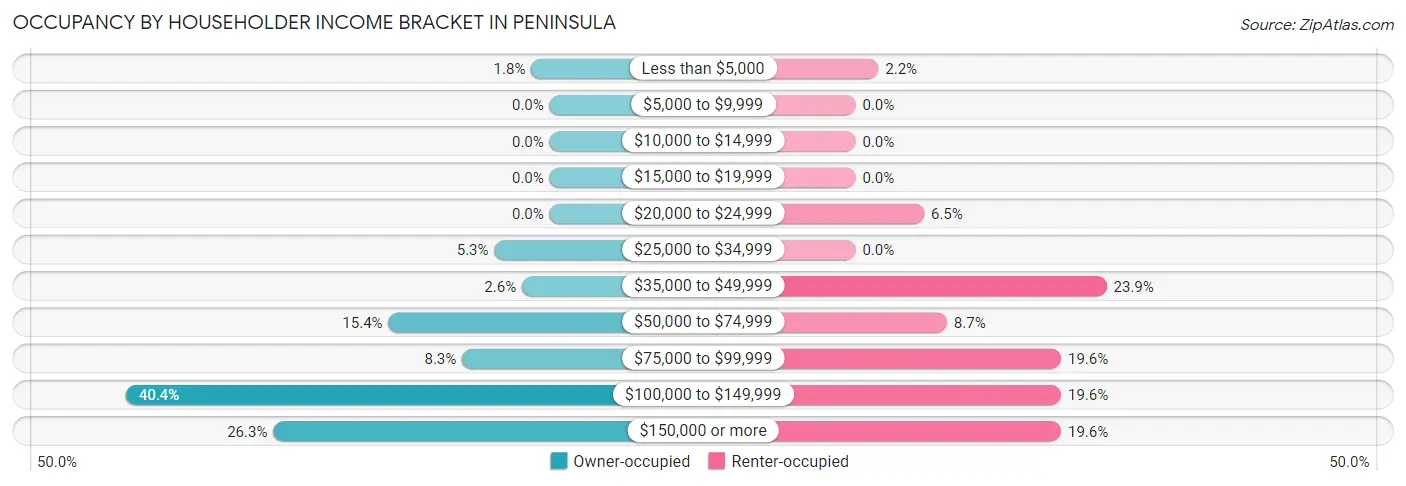
| Income Bracket | Owner-occupied | Renter-occupied |
| Less than $5,000 | 4 (1.8%) | 1 (2.2%) |
| $5,000 to $9,999 | 0 (0.0%) | 0 (0.0%) |
| $10,000 to $14,999 | 0 (0.0%) | 0 (0.0%) |
| $15,000 to $19,999 | 0 (0.0%) | 0 (0.0%) |
| $20,000 to $24,999 | 0 (0.0%) | 3 (6.5%) |
| $25,000 to $34,999 | 12 (5.3%) | 0 (0.0%) |
| $35,000 to $49,999 | 6 (2.6%) | 11 (23.9%) |
| $50,000 to $74,999 | 35 (15.3%) | 4 (8.7%) |
| $75,000 to $99,999 | 19 (8.3%) | 9 (19.6%) |
| $100,000 to $149,999 | 92 (40.4%) | 9 (19.6%) |
| $150,000 or more | 60 (26.3%) | 9 (19.6%) |
| Total | 228 (100.0%) | 46 (100.0%) |
Monthly Housing Cost Tiers in Peninsula
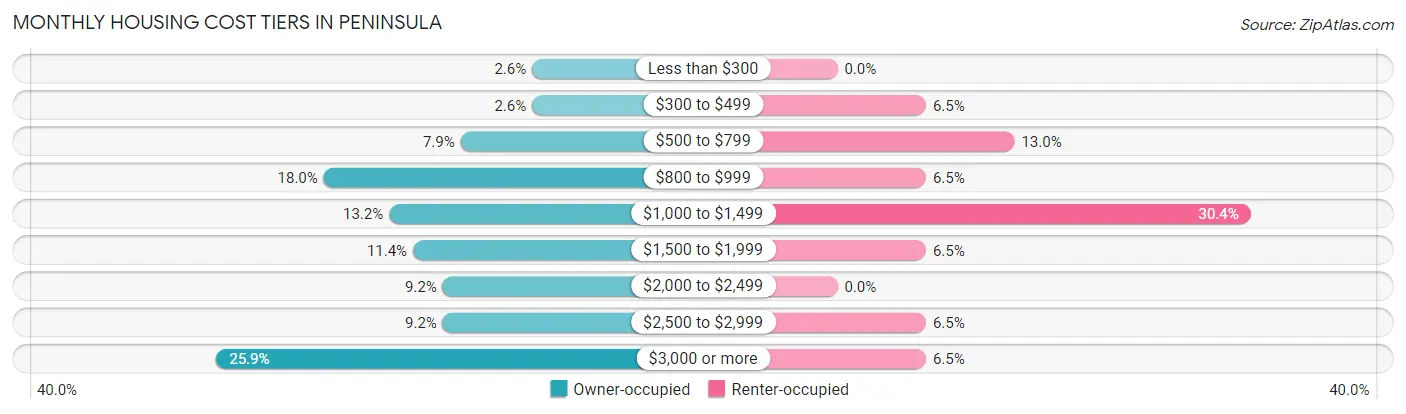
| Monthly Cost | Owner-occupied | Renter-occupied |
| Less than $300 | 6 (2.6%) | 0 (0.0%) |
| $300 to $499 | 6 (2.6%) | 3 (6.5%) |
| $500 to $799 | 18 (7.9%) | 6 (13.0%) |
| $800 to $999 | 41 (18.0%) | 3 (6.5%) |
| $1,000 to $1,499 | 30 (13.2%) | 14 (30.4%) |
| $1,500 to $1,999 | 26 (11.4%) | 3 (6.5%) |
| $2,000 to $2,499 | 21 (9.2%) | 0 (0.0%) |
| $2,500 to $2,999 | 21 (9.2%) | 3 (6.5%) |
| $3,000 or more | 59 (25.9%) | 3 (6.5%) |
| Total | 228 (100.0%) | 46 (100.0%) |
Physical Housing Characteristics in Peninsula
Housing Structures in Peninsula
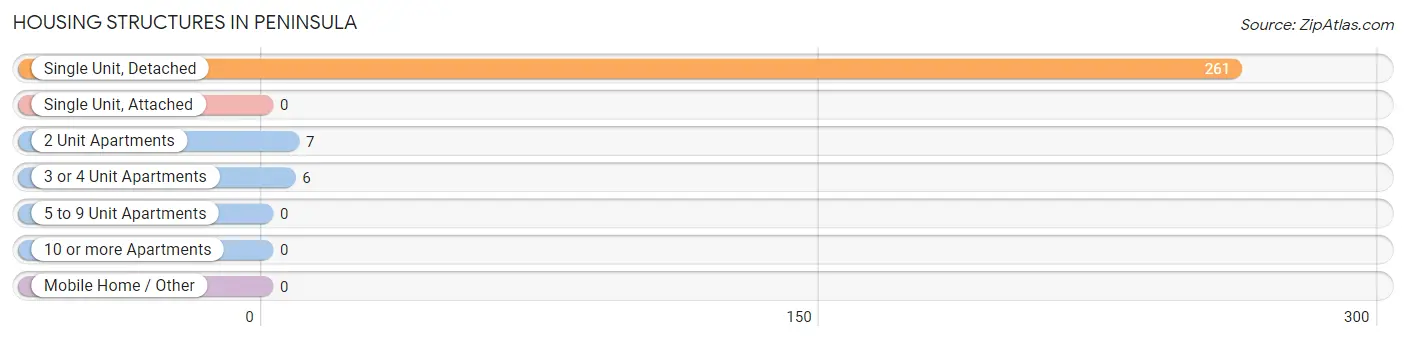
| Structure Type | # Housing Units | % Housing Units |
| Single Unit, Detached | 261 | 95.3% |
| Single Unit, Attached | 0 | 0.0% |
| 2 Unit Apartments | 7 | 2.5% |
| 3 or 4 Unit Apartments | 6 | 2.2% |
| 5 to 9 Unit Apartments | 0 | 0.0% |
| 10 or more Apartments | 0 | 0.0% |
| Mobile Home / Other | 0 | 0.0% |
| Total | 274 | 100.0% |
Housing Structures by Occupancy in Peninsula
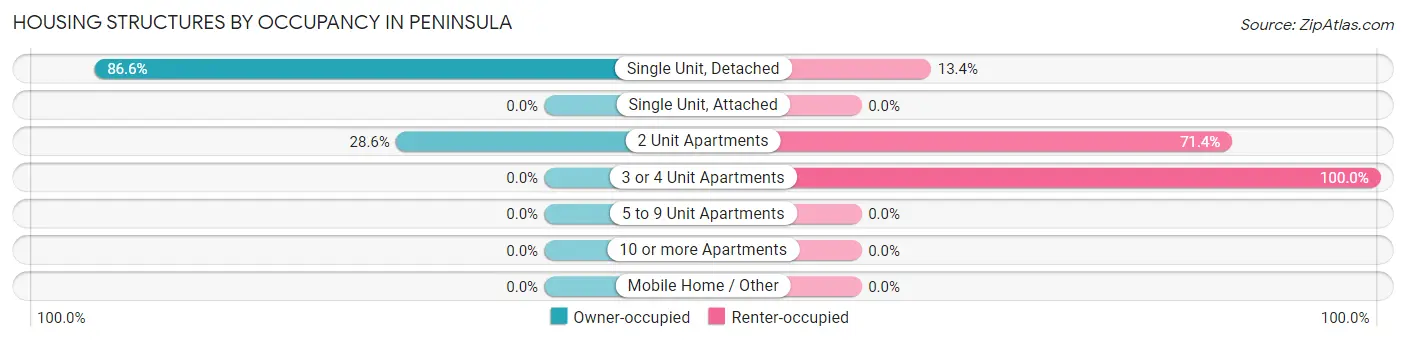
| Structure Type | Owner-occupied | Renter-occupied |
| Single Unit, Detached | 226 (86.6%) | 35 (13.4%) |
| Single Unit, Attached | 0 (0.0%) | 0 (0.0%) |
| 2 Unit Apartments | 2 (28.6%) | 5 (71.4%) |
| 3 or 4 Unit Apartments | 0 (0.0%) | 6 (100.0%) |
| 5 to 9 Unit Apartments | 0 (0.0%) | 0 (0.0%) |
| 10 or more Apartments | 0 (0.0%) | 0 (0.0%) |
| Mobile Home / Other | 0 (0.0%) | 0 (0.0%) |
| Total | 228 (83.2%) | 46 (16.8%) |
Housing Structures by Number of Rooms in Peninsula
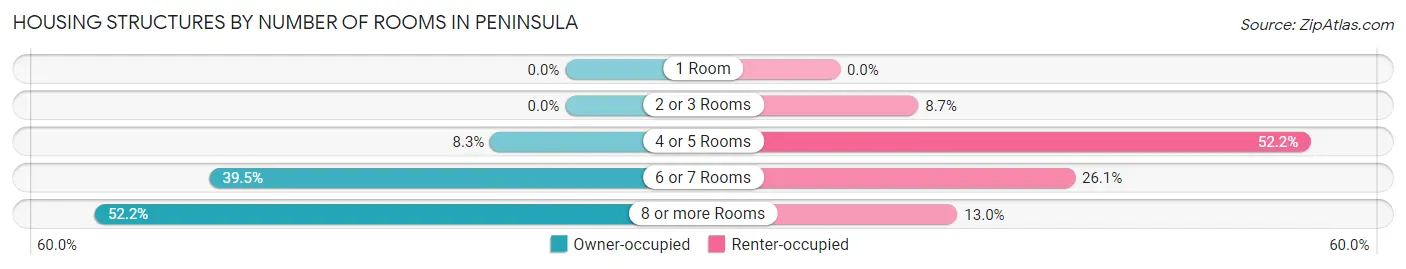
| Number of Rooms | Owner-occupied | Renter-occupied |
| 1 Room | 0 (0.0%) | 0 (0.0%) |
| 2 or 3 Rooms | 0 (0.0%) | 4 (8.7%) |
| 4 or 5 Rooms | 19 (8.3%) | 24 (52.2%) |
| 6 or 7 Rooms | 90 (39.5%) | 12 (26.1%) |
| 8 or more Rooms | 119 (52.2%) | 6 (13.0%) |
| Total | 228 (100.0%) | 46 (100.0%) |
Housing Structure by Heating Type in Peninsula
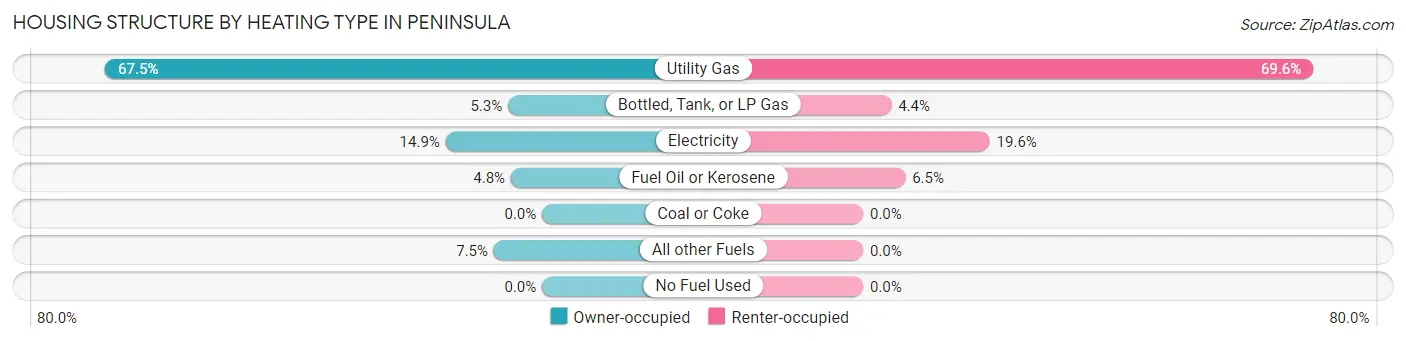
| Heating Type | Owner-occupied | Renter-occupied |
| Utility Gas | 154 (67.5%) | 32 (69.6%) |
| Bottled, Tank, or LP Gas | 12 (5.3%) | 2 (4.3%) |
| Electricity | 34 (14.9%) | 9 (19.6%) |
| Fuel Oil or Kerosene | 11 (4.8%) | 3 (6.5%) |
| Coal or Coke | 0 (0.0%) | 0 (0.0%) |
| All other Fuels | 17 (7.5%) | 0 (0.0%) |
| No Fuel Used | 0 (0.0%) | 0 (0.0%) |
| Total | 228 (100.0%) | 46 (100.0%) |
Household Vehicle Usage in Peninsula
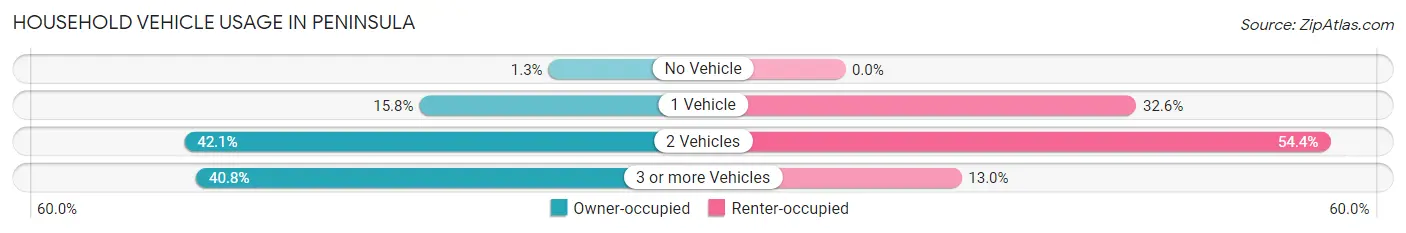
| Vehicles per Household | Owner-occupied | Renter-occupied |
| No Vehicle | 3 (1.3%) | 0 (0.0%) |
| 1 Vehicle | 36 (15.8%) | 15 (32.6%) |
| 2 Vehicles | 96 (42.1%) | 25 (54.3%) |
| 3 or more Vehicles | 93 (40.8%) | 6 (13.0%) |
| Total | 228 (100.0%) | 46 (100.0%) |
Real Estate & Mortgages in Peninsula
Real Estate and Mortgage Overview in Peninsula
| Characteristic | Without Mortgage | With Mortgage |
| Housing Units | 78 | 150 |
| Median Property Value | $421,400 | $408,300 |
| Median Household Income | $83,750 | $46 |
| Monthly Housing Costs | $832 | $54 |
| Real Estate Taxes | $7,024 | $0 |
Property Value by Mortgage Status in Peninsula
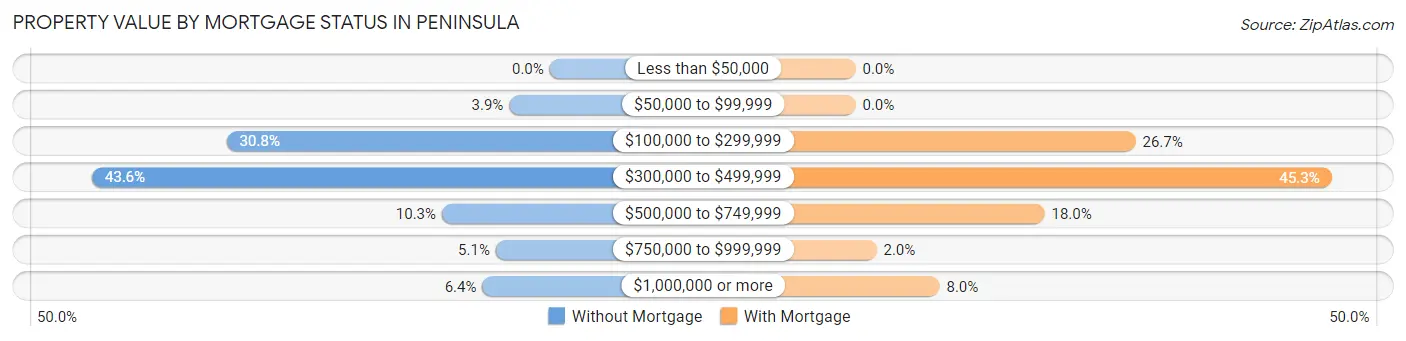
| Property Value | Without Mortgage | With Mortgage |
| Less than $50,000 | 0 (0.0%) | 0 (0.0%) |
| $50,000 to $99,999 | 3 (3.8%) | 0 (0.0%) |
| $100,000 to $299,999 | 24 (30.8%) | 40 (26.7%) |
| $300,000 to $499,999 | 34 (43.6%) | 68 (45.3%) |
| $500,000 to $749,999 | 8 (10.3%) | 27 (18.0%) |
| $750,000 to $999,999 | 4 (5.1%) | 3 (2.0%) |
| $1,000,000 or more | 5 (6.4%) | 12 (8.0%) |
| Total | 78 (100.0%) | 150 (100.0%) |
Household Income by Mortgage Status in Peninsula
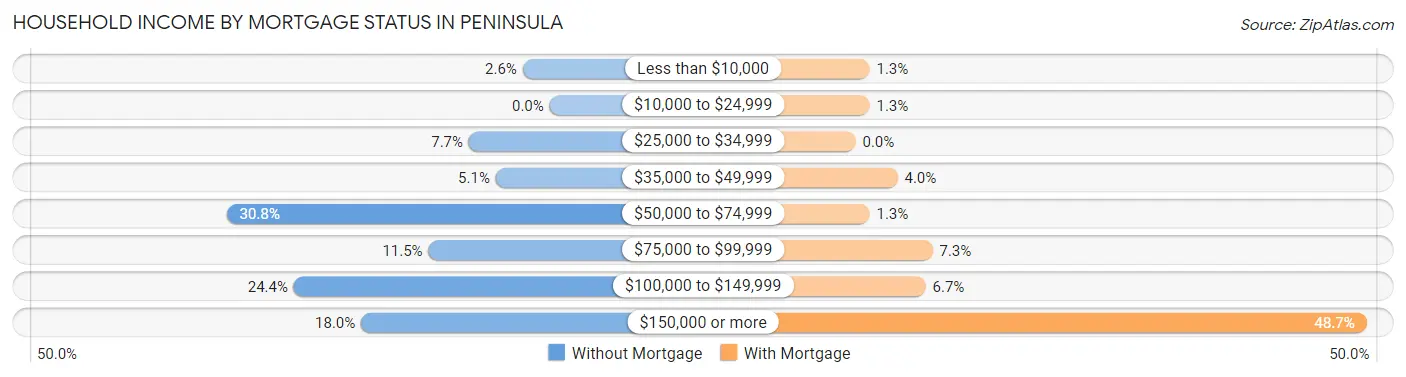
| Household Income | Without Mortgage | With Mortgage |
| Less than $10,000 | 2 (2.6%) | 2 (1.3%) |
| $10,000 to $24,999 | 0 (0.0%) | 2 (1.3%) |
| $25,000 to $34,999 | 6 (7.7%) | 0 (0.0%) |
| $35,000 to $49,999 | 4 (5.1%) | 6 (4.0%) |
| $50,000 to $74,999 | 24 (30.8%) | 2 (1.3%) |
| $75,000 to $99,999 | 9 (11.5%) | 11 (7.3%) |
| $100,000 to $149,999 | 19 (24.4%) | 10 (6.7%) |
| $150,000 or more | 14 (17.9%) | 73 (48.7%) |
| Total | 78 (100.0%) | 150 (100.0%) |
Property Value to Household Income Ratio in Peninsula
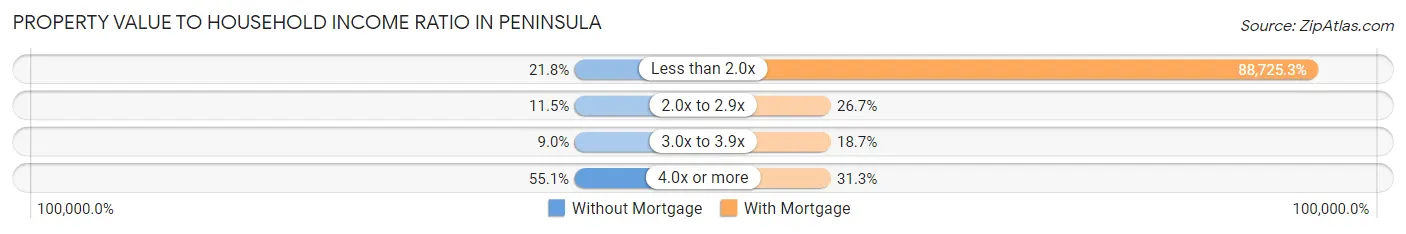
| Value-to-Income Ratio | Without Mortgage | With Mortgage |
| Less than 2.0x | 17 (21.8%) | 133,088 (88,725.3%) |
| 2.0x to 2.9x | 9 (11.5%) | 40 (26.7%) |
| 3.0x to 3.9x | 7 (9.0%) | 28 (18.7%) |
| 4.0x or more | 43 (55.1%) | 47 (31.3%) |
| Total | 78 (100.0%) | 150 (100.0%) |
Real Estate Taxes by Mortgage Status in Peninsula
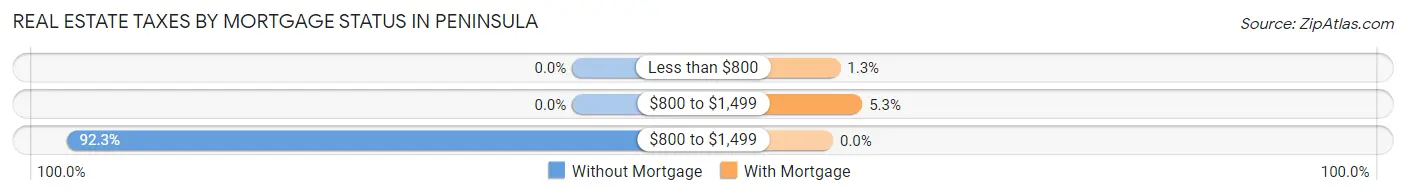
| Property Taxes | Without Mortgage | With Mortgage |
| Less than $800 | 0 (0.0%) | 2 (1.3%) |
| $800 to $1,499 | 0 (0.0%) | 8 (5.3%) |
| $800 to $1,499 | 72 (92.3%) | 0 (0.0%) |
| Total | 78 (100.0%) | 150 (100.0%) |
Health & Disability in Peninsula
Health Insurance Coverage by Age in Peninsula
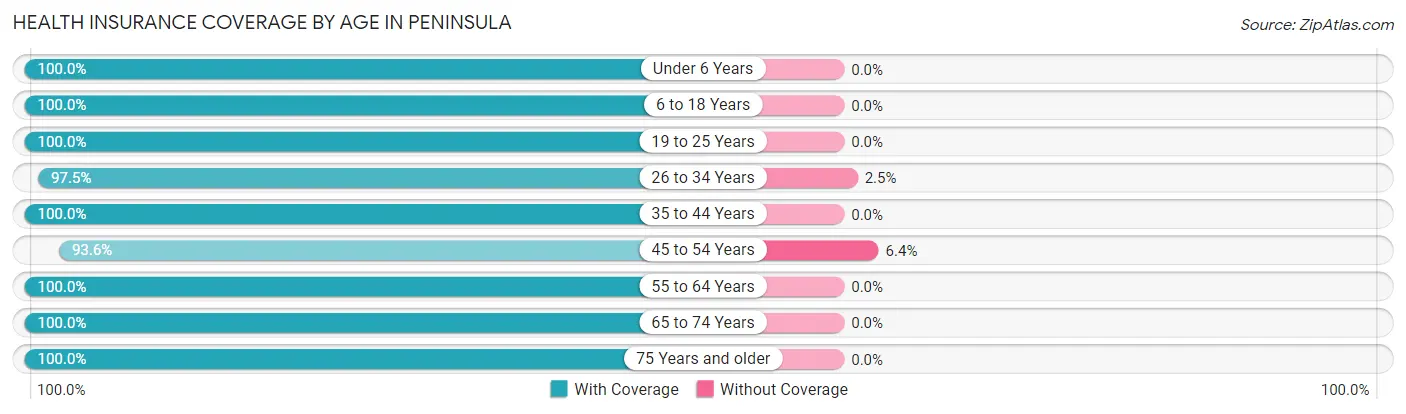
| Age Bracket | With Coverage | Without Coverage |
| Under 6 Years | 13 (100.0%) | 0 (0.0%) |
| 6 to 18 Years | 102 (100.0%) | 0 (0.0%) |
| 19 to 25 Years | 24 (100.0%) | 0 (0.0%) |
| 26 to 34 Years | 78 (97.5%) | 2 (2.5%) |
| 35 to 44 Years | 51 (100.0%) | 0 (0.0%) |
| 45 to 54 Years | 73 (93.6%) | 5 (6.4%) |
| 55 to 64 Years | 136 (100.0%) | 0 (0.0%) |
| 65 to 74 Years | 115 (100.0%) | 0 (0.0%) |
| 75 Years and older | 34 (100.0%) | 0 (0.0%) |
| Total | 626 (98.9%) | 7 (1.1%) |
Health Insurance Coverage by Citizenship Status in Peninsula
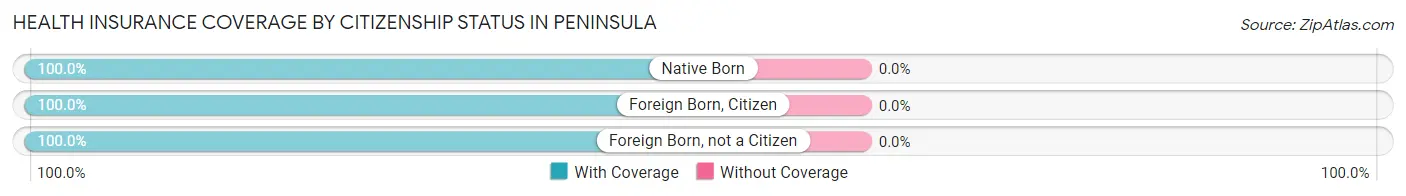
| Citizenship Status | With Coverage | Without Coverage |
| Native Born | 13 (100.0%) | 0 (0.0%) |
| Foreign Born, Citizen | 102 (100.0%) | 0 (0.0%) |
| Foreign Born, not a Citizen | 24 (100.0%) | 0 (0.0%) |
Health Insurance Coverage by Household Income in Peninsula
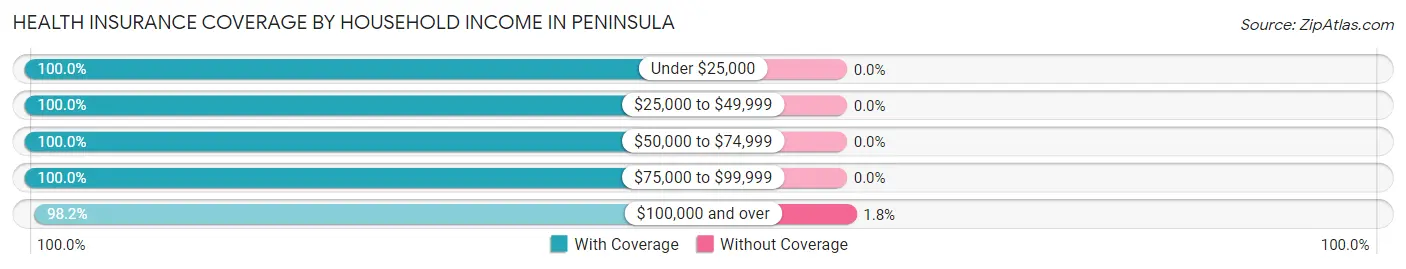
| Household Income | With Coverage | Without Coverage |
| Under $25,000 | 10 (100.0%) | 0 (0.0%) |
| $25,000 to $49,999 | 81 (100.0%) | 0 (0.0%) |
| $50,000 to $74,999 | 92 (100.0%) | 0 (0.0%) |
| $75,000 to $99,999 | 59 (100.0%) | 0 (0.0%) |
| $100,000 and over | 384 (98.2%) | 7 (1.8%) |
Public vs Private Health Insurance Coverage by Age in Peninsula
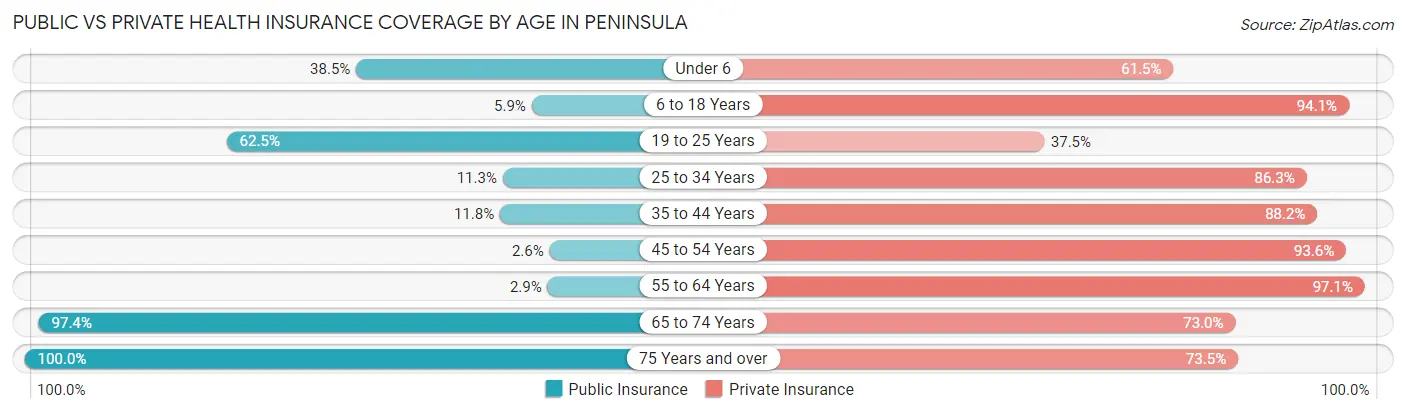
| Age Bracket | Public Insurance | Private Insurance |
| Under 6 | 5 (38.5%) | 8 (61.5%) |
| 6 to 18 Years | 6 (5.9%) | 96 (94.1%) |
| 19 to 25 Years | 15 (62.5%) | 9 (37.5%) |
| 25 to 34 Years | 9 (11.3%) | 69 (86.3%) |
| 35 to 44 Years | 6 (11.8%) | 45 (88.2%) |
| 45 to 54 Years | 2 (2.6%) | 73 (93.6%) |
| 55 to 64 Years | 4 (2.9%) | 132 (97.1%) |
| 65 to 74 Years | 112 (97.4%) | 84 (73.0%) |
| 75 Years and over | 34 (100.0%) | 25 (73.5%) |
| Total | 193 (30.5%) | 541 (85.5%) |
Disability Status by Sex by Age in Peninsula
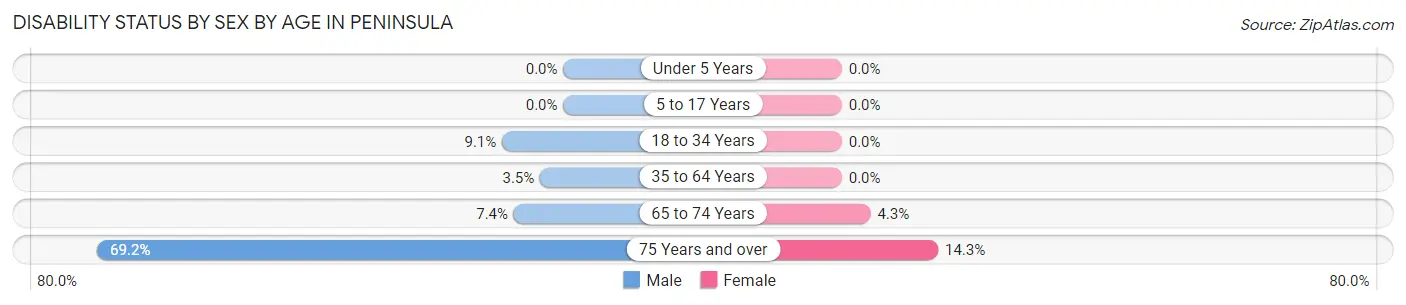
| Age Bracket | Male | Female |
| Under 5 Years | 0 (0.0%) | 0 (0.0%) |
| 5 to 17 Years | 0 (0.0%) | 0 (0.0%) |
| 18 to 34 Years | 4 (9.1%) | 0 (0.0%) |
| 35 to 64 Years | 4 (3.5%) | 0 (0.0%) |
| 65 to 74 Years | 5 (7.3%) | 2 (4.3%) |
| 75 Years and over | 9 (69.2%) | 3 (14.3%) |
Disability Class by Sex by Age in Peninsula
Disability Class: Hearing Difficulty
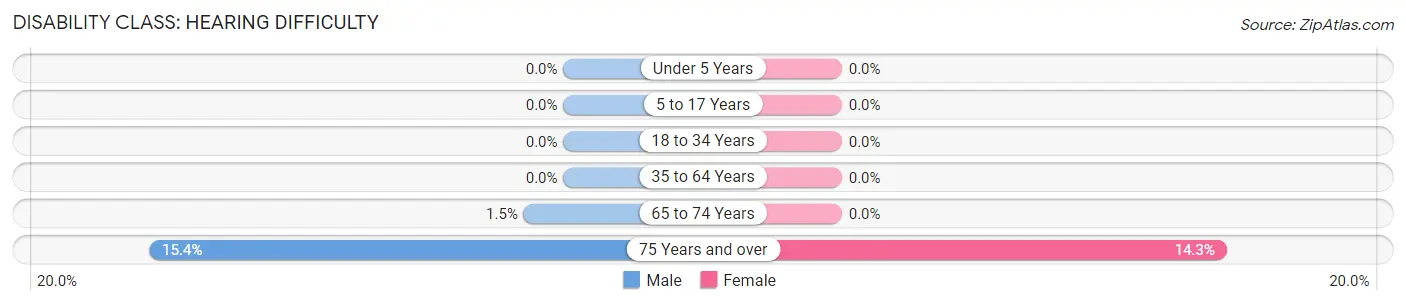
| Age Bracket | Male | Female |
| Under 5 Years | 0 (0.0%) | 0 (0.0%) |
| 5 to 17 Years | 0 (0.0%) | 0 (0.0%) |
| 18 to 34 Years | 0 (0.0%) | 0 (0.0%) |
| 35 to 64 Years | 0 (0.0%) | 0 (0.0%) |
| 65 to 74 Years | 1 (1.5%) | 0 (0.0%) |
| 75 Years and over | 2 (15.4%) | 3 (14.3%) |
Disability Class: Vision Difficulty
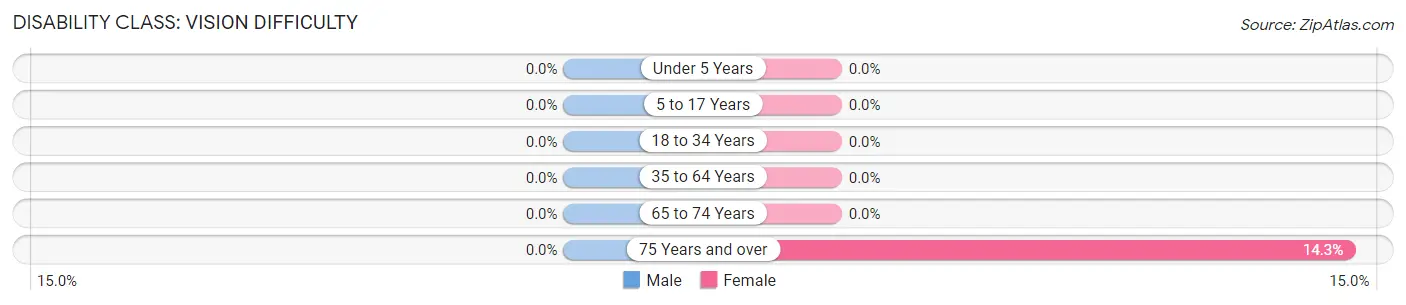
| Age Bracket | Male | Female |
| Under 5 Years | 0 (0.0%) | 0 (0.0%) |
| 5 to 17 Years | 0 (0.0%) | 0 (0.0%) |
| 18 to 34 Years | 0 (0.0%) | 0 (0.0%) |
| 35 to 64 Years | 0 (0.0%) | 0 (0.0%) |
| 65 to 74 Years | 0 (0.0%) | 0 (0.0%) |
| 75 Years and over | 0 (0.0%) | 3 (14.3%) |
Disability Class: Cognitive Difficulty
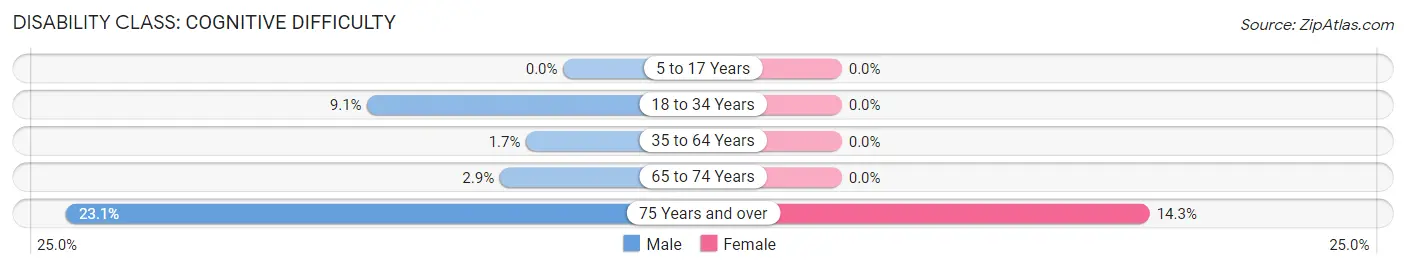
| Age Bracket | Male | Female |
| 5 to 17 Years | 0 (0.0%) | 0 (0.0%) |
| 18 to 34 Years | 4 (9.1%) | 0 (0.0%) |
| 35 to 64 Years | 2 (1.7%) | 0 (0.0%) |
| 65 to 74 Years | 2 (2.9%) | 0 (0.0%) |
| 75 Years and over | 3 (23.1%) | 3 (14.3%) |
Disability Class: Ambulatory Difficulty
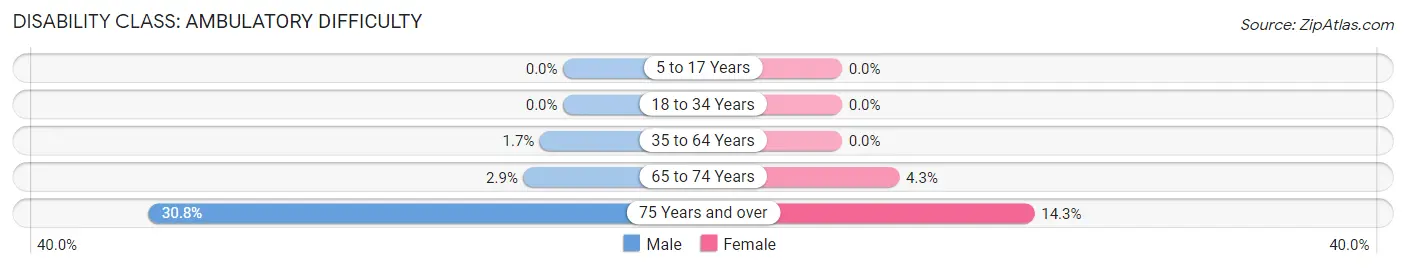
| Age Bracket | Male | Female |
| 5 to 17 Years | 0 (0.0%) | 0 (0.0%) |
| 18 to 34 Years | 0 (0.0%) | 0 (0.0%) |
| 35 to 64 Years | 2 (1.7%) | 0 (0.0%) |
| 65 to 74 Years | 2 (2.9%) | 2 (4.3%) |
| 75 Years and over | 4 (30.8%) | 3 (14.3%) |
Disability Class: Self-Care Difficulty
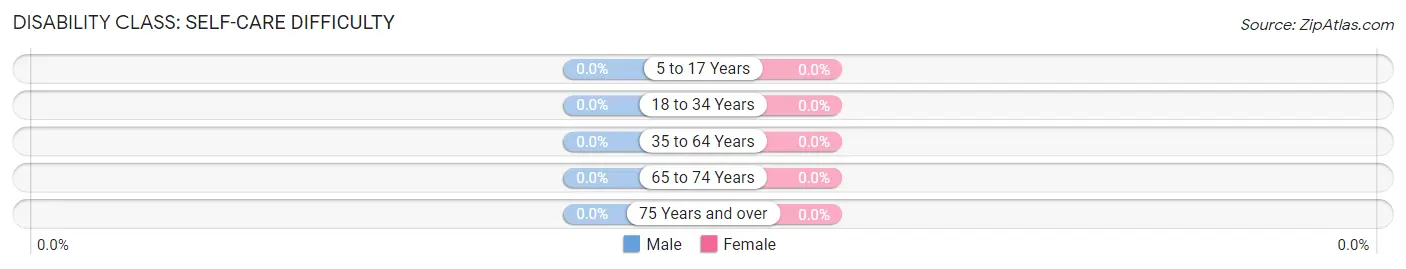
| Age Bracket | Male | Female |
| 5 to 17 Years | 0 (0.0%) | 0 (0.0%) |
| 18 to 34 Years | 0 (0.0%) | 0 (0.0%) |
| 35 to 64 Years | 0 (0.0%) | 0 (0.0%) |
| 65 to 74 Years | 0 (0.0%) | 0 (0.0%) |
| 75 Years and over | 0 (0.0%) | 0 (0.0%) |
Technology Access in Peninsula
Computing Device Access in Peninsula
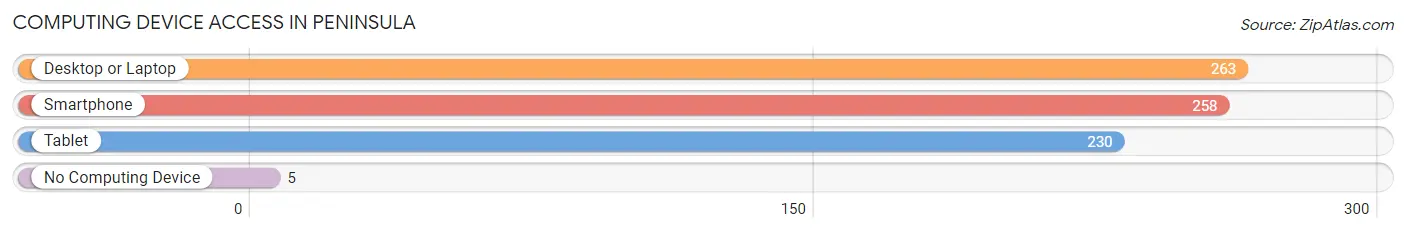
| Device Type | # Households | % Households |
| Desktop or Laptop | 263 | 96.0% |
| Smartphone | 258 | 94.2% |
| Tablet | 230 | 83.9% |
| No Computing Device | 5 | 1.8% |
| Total | 274 | 100.0% |
Internet Access in Peninsula
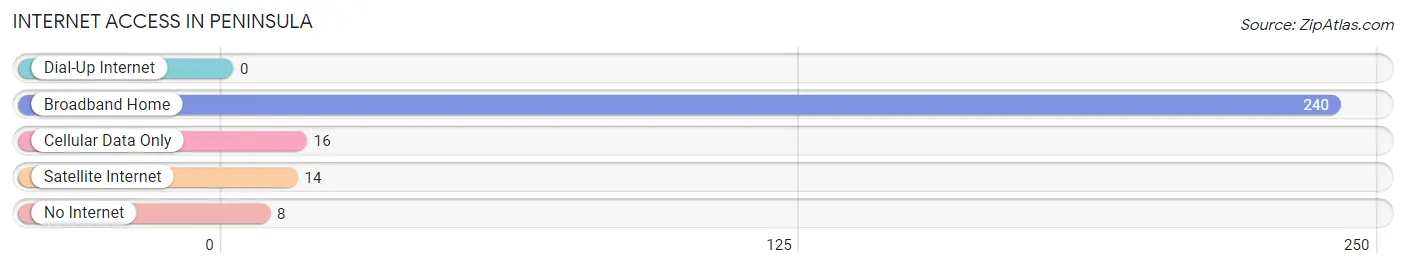
| Internet Type | # Households | % Households |
| Dial-Up Internet | 0 | 0.0% |
| Broadband Home | 240 | 87.6% |
| Cellular Data Only | 16 | 5.8% |
| Satellite Internet | 14 | 5.1% |
| No Internet | 8 | 2.9% |
| Total | 274 | 100.0% |
Peninsula Summary
Peninsula, Ohio is a small village located in the Cuyahoga Valley National Park in Summit County, Ohio. The village is situated on the south side of the Cuyahoga River, approximately 20 miles south of Cleveland. The village is home to approximately 1,500 people and is part of the Akron Metropolitan Statistical Area.
History
The area that is now Peninsula was first settled in 1810 by a group of settlers from Connecticut. The settlers named the area Peninsula because of its location on the Cuyahoga River. The village was officially incorporated in 1837.
In the late 19th century, Peninsula was a popular tourist destination due to its proximity to the Cuyahoga Valley National Park. The village was home to several resorts and hotels, as well as a popular amusement park.
In the early 20th century, Peninsula was a popular destination for wealthy Clevelanders looking to escape the city. The village was home to several large estates, including the estate of John D. Rockefeller.
Geography
Peninsula is located in Summit County, Ohio. The village is situated on the south side of the Cuyahoga River, approximately 20 miles south of Cleveland. The village is bordered by the Cuyahoga Valley National Park to the north and the city of Akron to the south.
The village is located in a hilly region of the Cuyahoga Valley. The terrain is mostly wooded, with some open fields and meadows. The village is located at an elevation of 890 feet above sea level.
Economy
The economy of Peninsula is largely based on tourism. The village is home to several resorts and hotels, as well as a popular amusement park. The village is also home to several wineries and breweries, as well as several restaurants and shops.
The village is also home to several small businesses, including a local newspaper, a hardware store, and a grocery store. The village is also home to several small manufacturing companies.
Demographics
As of the 2010 census, the population of Peninsula was 1,500. The racial makeup of the village was 97.3% White, 0.7% African American, 0.3% Native American, 0.3% Asian, and 1.3% from other races. Hispanic or Latino of any race were 1.3% of the population.
The median household income in Peninsula was $50,000, and the median family income was $60,000. The per capita income in the village was $25,000. About 8.3% of families and 10.3% of the population were below the poverty line, including 14.3% of those under age 18 and 5.3% of those age 65 or over.
Common Questions
What is Per Capita Income in Peninsula?
Per Capita income in Peninsula is $63,534.
What is the Median Family Income in Peninsula?
Median Family Income in Peninsula is $121,250.
What is the Median Household income in Peninsula?
Median Household Income in Peninsula is $121,111.
What is Income or Wage Gap in Peninsula?
Income or Wage Gap in Peninsula is 35.5%.
Women in Peninsula earn 64.5 cents for every dollar earned by a man.
What is Inequality or Gini Index in Peninsula?
Inequality or Gini Index in Peninsula is 0.40.
What is the Total Population of Peninsula?
Total Population of Peninsula is 633.
What is the Total Male Population of Peninsula?
Total Male Population of Peninsula is 304.
What is the Total Female Population of Peninsula?
Total Female Population of Peninsula is 329.
What is the Ratio of Males per 100 Females in Peninsula?
There are 92.40 Males per 100 Females in Peninsula.
What is the Ratio of Females per 100 Males in Peninsula?
There are 108.22 Females per 100 Males in Peninsula.
What is the Median Population Age in Peninsula?
Median Population Age in Peninsula is 51.1 Years.
What is the Average Family Size in Peninsula
Average Family Size in Peninsula is 2.6 People.
What is the Average Household Size in Peninsula
Average Household Size in Peninsula is 2.3 People.
How Large is the Labor Force in Peninsula?
There are 381 People in the Labor Forcein in Peninsula.
What is the Percentage of People in the Labor Force in Peninsula?
70.6% of People are in the Labor Force in Peninsula.
What is the Unemployment Rate in Peninsula?
Unemployment Rate in Peninsula is 4.5%.