Pulaski, OH Map & Demographics
Pulaski Map
Pulaski Overview
$20,539
PER CAPITA INCOME
$40,417
AVG FAMILY INCOME
$55,357
AVG HOUSEHOLD INCOME
0.19
INEQUALITY / GINI INDEX
114
TOTAL POPULATION
78
MALE POPULATION
36
FEMALE POPULATION
216.67
MALES / 100 FEMALES
46.15
FEMALES / 100 MALES
26.6
MEDIAN AGE
2.6
AVG FAMILY SIZE
2.7
AVG HOUSEHOLD SIZE
54
LABOR FORCE [ PEOPLE ]
54.5%
PERCENT IN LABOR FORCE
20.4%
UNEMPLOYMENT RATE
Income in Pulaski
Income Overview in Pulaski
Per Capita Income in Pulaski is $20,539, while median incomes of families and households are $40,417 and $55,357 respectively.
| Characteristic | Number | Measure |
| Per Capita Income | 114 | $20,539 |
| Median Family Income | 34 | $40,417 |
| Mean Family Income | 34 | $38,071 |
| Median Household Income | 42 | $55,357 |
| Mean Household Income | 42 | $54,424 |
| Income Deficit | 34 | $0 |
| Wage / Income Gap (%) | 114 | 0.00% |
| Wage / Income Gap ($) | 114 | 100.00¢ per $1 |
| Gini / Inequality Index | 114 | 0.19 |
Earnings by Sex in Pulaski
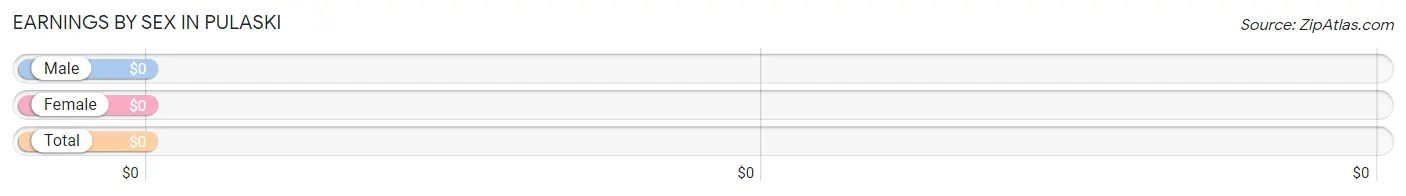
| Sex | Number | Average Earnings |
| Male | 36 (56.2%) | $0 |
| Female | 28 (43.8%) | $0 |
| Total | 64 (100.0%) | $0 |
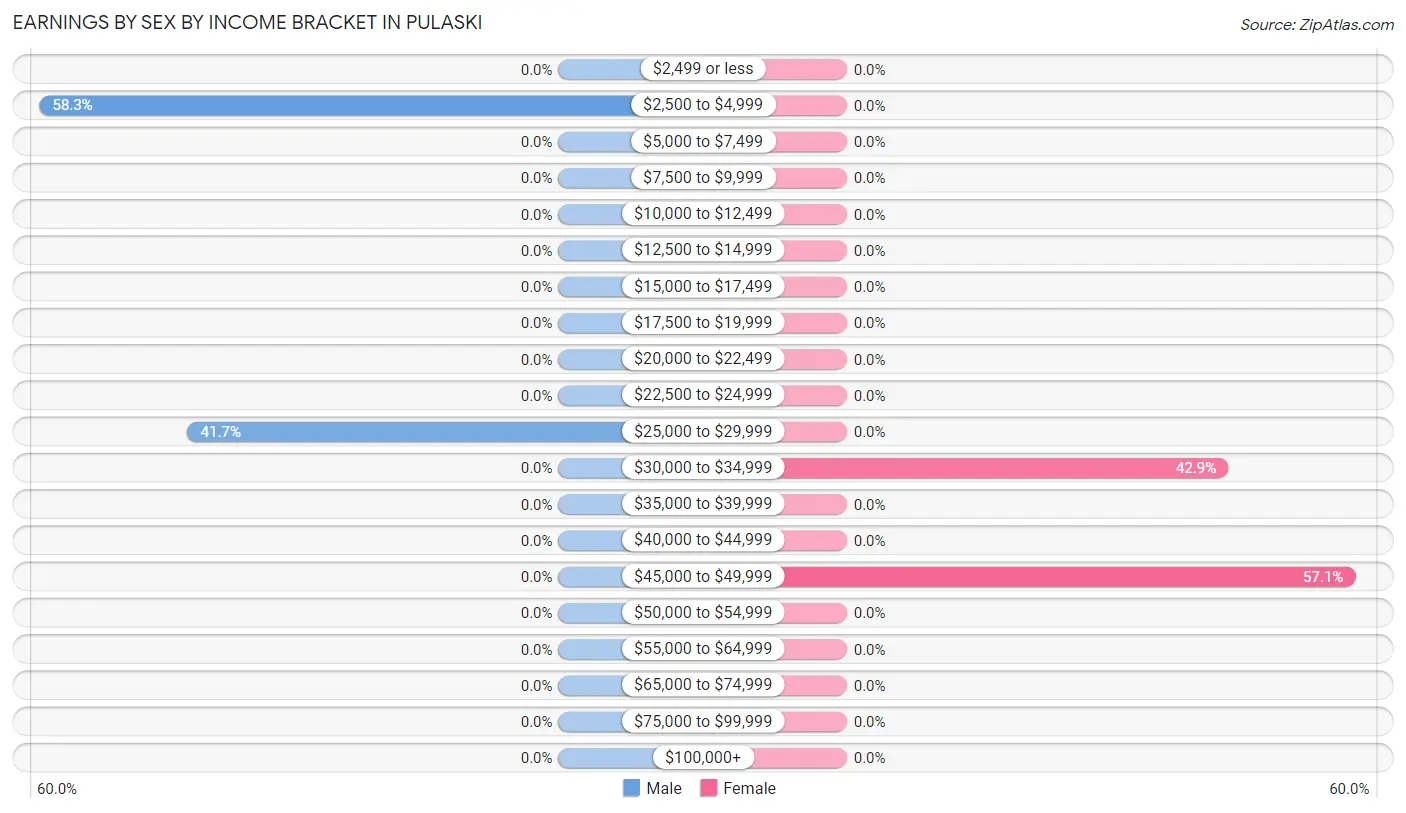
Earnings by Sex by Income Bracket in Pulaski
The most common earnings brackets in Pulaski are $2,500 to $4,999 for men (21 | 58.3%) and $45,000 to $49,999 for women (16 | 57.1%).
| Income | Male | Female |
| $2,499 or less | 0 (0.0%) | 0 (0.0%) |
| $2,500 to $4,999 | 21 (58.3%) | 0 (0.0%) |
| $5,000 to $7,499 | 0 (0.0%) | 0 (0.0%) |
| $7,500 to $9,999 | 0 (0.0%) | 0 (0.0%) |
| $10,000 to $12,499 | 0 (0.0%) | 0 (0.0%) |
| $12,500 to $14,999 | 0 (0.0%) | 0 (0.0%) |
| $15,000 to $17,499 | 0 (0.0%) | 0 (0.0%) |
| $17,500 to $19,999 | 0 (0.0%) | 0 (0.0%) |
| $20,000 to $22,499 | 0 (0.0%) | 0 (0.0%) |
| $22,500 to $24,999 | 0 (0.0%) | 0 (0.0%) |
| $25,000 to $29,999 | 15 (41.7%) | 0 (0.0%) |
| $30,000 to $34,999 | 0 (0.0%) | 12 (42.9%) |
| $35,000 to $39,999 | 0 (0.0%) | 0 (0.0%) |
| $40,000 to $44,999 | 0 (0.0%) | 0 (0.0%) |
| $45,000 to $49,999 | 0 (0.0%) | 16 (57.1%) |
| $50,000 to $54,999 | 0 (0.0%) | 0 (0.0%) |
| $55,000 to $64,999 | 0 (0.0%) | 0 (0.0%) |
| $65,000 to $74,999 | 0 (0.0%) | 0 (0.0%) |
| $75,000 to $99,999 | 0 (0.0%) | 0 (0.0%) |
| $100,000+ | 0 (0.0%) | 0 (0.0%) |
| Total | 36 (100.0%) | 28 (100.0%) |
Earnings by Sex by Educational Attainment in Pulaski
| Educational Attainment | Male Income | Female Income |
| Less than High School | - | - |
| High School Diploma | - | - |
| College or Associate's Degree | - | - |
| Bachelor's Degree | - | - |
| Graduate Degree | - | - |
| Total | - | - |
Family Income in Pulaski
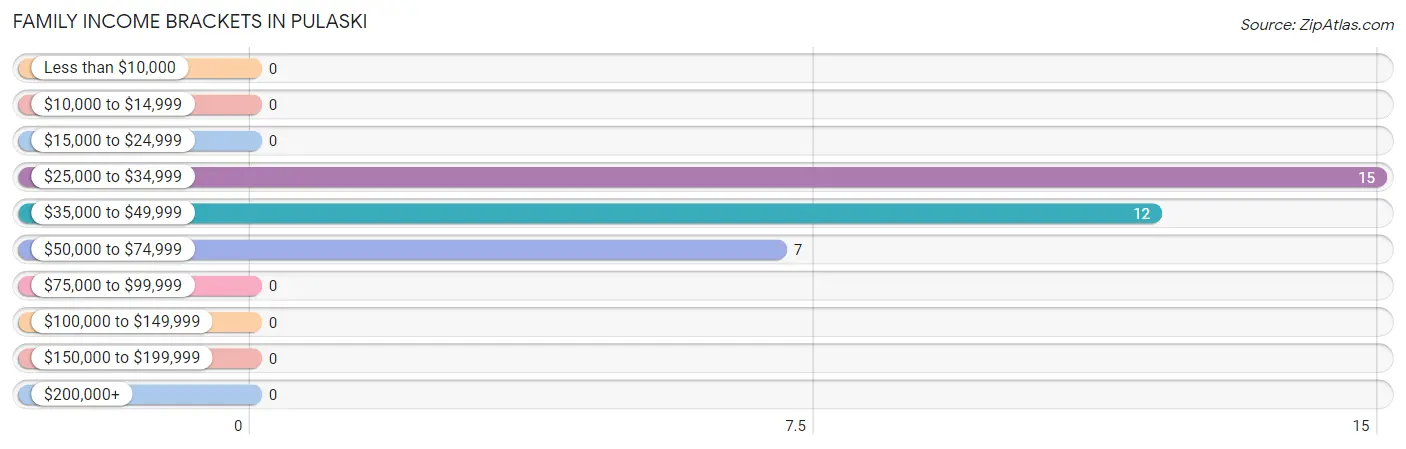
Family Income Brackets in Pulaski
According to the Pulaski family income data, there are 15 families falling into the $25,000 to $34,999 income range, which is the most common income bracket and makes up 44.1% of all families.
| Income Bracket | # Families | % Families |
| Less than $10,000 | 0 | 0.0% |
| $10,000 to $14,999 | 0 | 0.0% |
| $15,000 to $24,999 | 0 | 0.0% |
| $25,000 to $34,999 | 15 | 44.1% |
| $35,000 to $49,999 | 12 | 35.3% |
| $50,000 to $74,999 | 7 | 20.6% |
| $75,000 to $99,999 | 0 | 0.0% |
| $100,000 to $149,999 | 0 | 0.0% |
| $150,000 to $199,999 | 0 | 0.0% |
| $200,000+ | 0 | 0.0% |
Family Income by Famaliy Size in Pulaski
| Income Bracket | # Families | Median Income |
| 2-Person Families | 22 (64.7%) | $0 |
| 3-Person Families | 0 (0.0%) | $0 |
| 4-Person Families | 12 (35.3%) | $0 |
| 5-Person Families | 0 (0.0%) | $0 |
| 6-Person Families | 0 (0.0%) | $0 |
| 7+ Person Families | 0 (0.0%) | $0 |
| Total | 34 (100.0%) | $40,417 |
Family Income by Number of Earners in Pulaski
| Number of Earners | # Families | Median Income |
| No Earners | 7 (20.6%) | $0 |
| 1 Earner | 15 (44.1%) | $0 |
| 2 Earners | 0 (0.0%) | $0 |
| 3+ Earners | 12 (35.3%) | $0 |
| Total | 34 (100.0%) | $40,417 |
Household Income in Pulaski
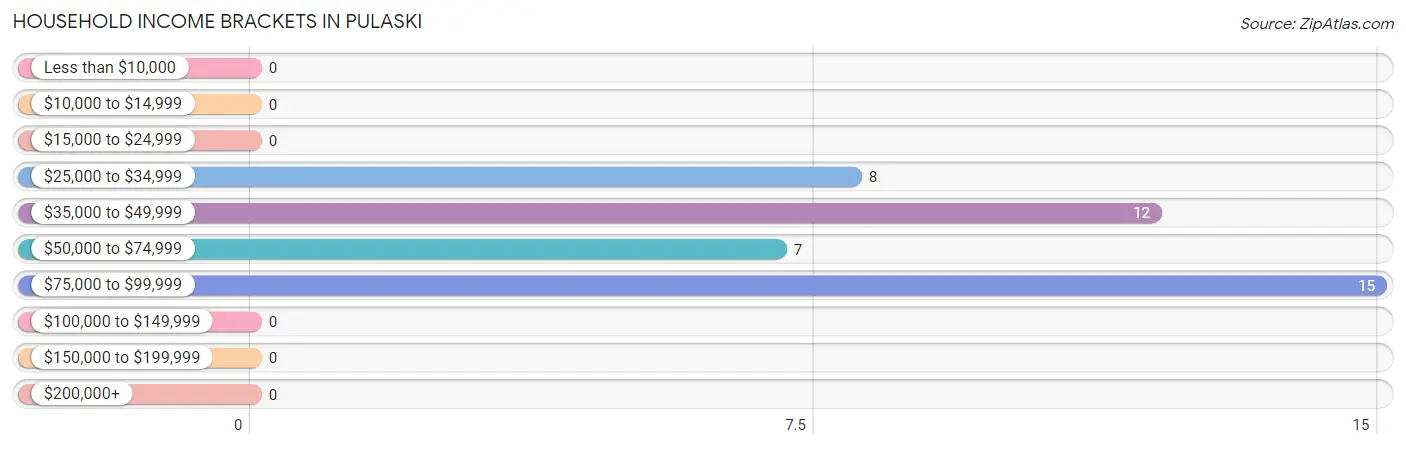
Household Income Brackets in Pulaski
With 15 households falling in the category, the $75,000 to $99,999 income range is the most frequent in Pulaski, accounting for 35.7% of all households.
| Income Bracket | # Households | % Households |
| Less than $10,000 | 0 | 0.0% |
| $10,000 to $14,999 | 0 | 0.0% |
| $15,000 to $24,999 | 0 | 0.0% |
| $25,000 to $34,999 | 8 | 19.0% |
| $35,000 to $49,999 | 12 | 28.6% |
| $50,000 to $74,999 | 7 | 16.7% |
| $75,000 to $99,999 | 15 | 35.7% |
| $100,000 to $149,999 | 0 | 0.0% |
| $150,000 to $199,999 | 0 | 0.0% |
| $200,000+ | 0 | 0.0% |
Household Income by Householder Age in Pulaski
| Income Bracket | # Households | Median Income |
| 15 to 24 Years | 0 (0.0%) | $0 |
| 25 to 44 Years | 27 (64.3%) | $0 |
| 45 to 64 Years | 0 (0.0%) | $0 |
| 65+ Years | 15 (35.7%) | $0 |
| Total | 42 (100.0%) | $55,357 |
Poverty in Pulaski
Income Below Poverty by Sex and Age in Pulaski
| Age Bracket | Male | Female |
| Under 5 Years | 0 (0.0%) | 0 (0.0%) |
| 5 Years | 0 (0.0%) | 0 (0.0%) |
| 6 to 11 Years | 0 (0.0%) | 0 (0.0%) |
| 12 to 14 Years | 0 (0.0%) | 0 (0.0%) |
| 15 Years | 0 (0.0%) | 0 (0.0%) |
| 16 and 17 Years | 0 (0.0%) | 0 (0.0%) |
| 18 to 24 Years | 0 (0.0%) | 0 (0.0%) |
| 25 to 34 Years | 0 (0.0%) | 0 (0.0%) |
| 35 to 44 Years | 0 (0.0%) | 0 (0.0%) |
| 45 to 54 Years | 0 (0.0%) | 0 (0.0%) |
| 55 to 64 Years | 0 (0.0%) | 0 (0.0%) |
| 65 to 74 Years | 0 (0.0%) | 0 (0.0%) |
| 75 Years and over | 0 (0.0%) | 0 (0.0%) |
| Total | 0 (0.0%) | 0 (0.0%) |
Income Above Poverty by Sex and Age in Pulaski
According to the poverty statistics in Pulaski, males aged 5 years and females aged 25 to 34 years are the age groups that are most secure financially, with 100.0% of males and 100.0% of females in these age groups living above the poverty line.
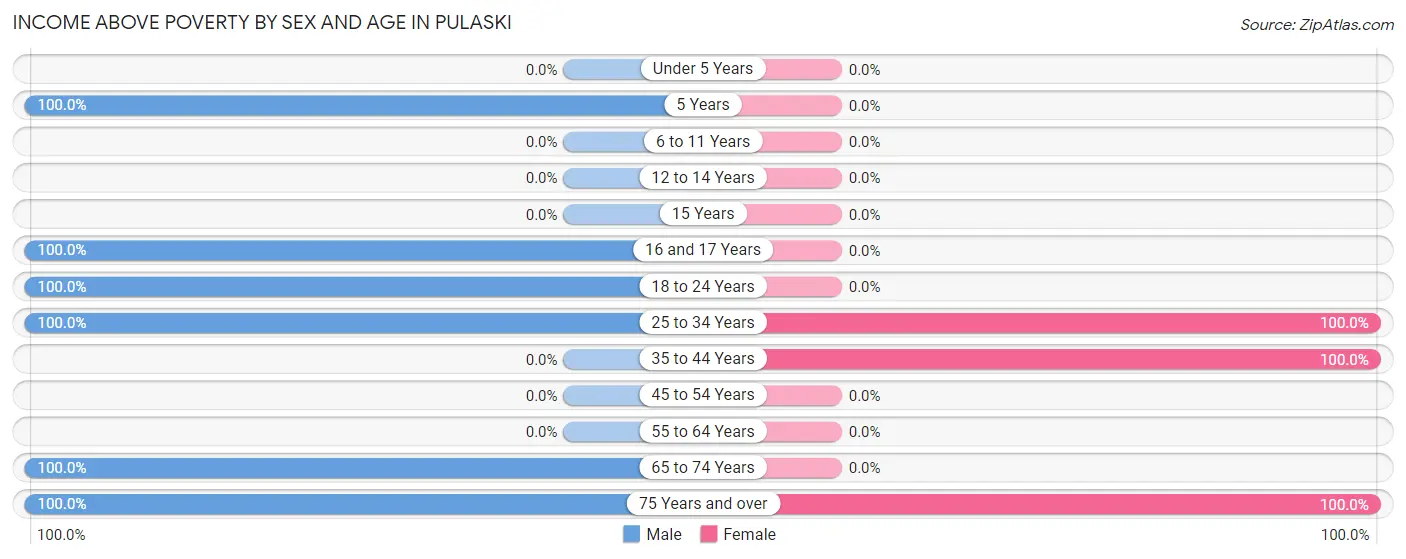
| Age Bracket | Male | Female |
| Under 5 Years | 0 (0.0%) | 0 (0.0%) |
| 5 Years | 15 (100.0%) | 0 (0.0%) |
| 6 to 11 Years | 0 (0.0%) | 0 (0.0%) |
| 12 to 14 Years | 0 (0.0%) | 0 (0.0%) |
| 15 Years | 0 (0.0%) | 0 (0.0%) |
| 16 and 17 Years | 10 (100.0%) | 0 (0.0%) |
| 18 to 24 Years | 23 (100.0%) | 0 (0.0%) |
| 25 to 34 Years | 15 (100.0%) | 16 (100.0%) |
| 35 to 44 Years | 0 (0.0%) | 12 (100.0%) |
| 45 to 54 Years | 0 (0.0%) | 0 (0.0%) |
| 55 to 64 Years | 0 (0.0%) | 0 (0.0%) |
| 65 to 74 Years | 8 (100.0%) | 0 (0.0%) |
| 75 Years and over | 7 (100.0%) | 8 (100.0%) |
| Total | 78 (100.0%) | 36 (100.0%) |
Income Below Poverty Among Married-Couple Families in Pulaski
| Children | Above Poverty | Below Poverty |
| No Children | 7 (100.0%) | 0 (0.0%) |
| 1 or 2 Children | 0 (0.0%) | 0 (0.0%) |
| 3 or 4 Children | 0 (0.0%) | 0 (0.0%) |
| 5 or more Children | 0 (0.0%) | 0 (0.0%) |
| Total | 7 (100.0%) | 0 (0.0%) |
Income Below Poverty Among Single-Parent Households in Pulaski
| Children | Single Father | Single Mother |
| No Children | 0 (0.0%) | 0 (0.0%) |
| 1 or 2 Children | 0 (0.0%) | 0 (0.0%) |
| 3 or 4 Children | 0 (0.0%) | 0 (0.0%) |
| 5 or more Children | 0 (0.0%) | 0 (0.0%) |
| Total | 0 (0.0%) | 0 (0.0%) |
Income Below Poverty Among Married-Couple vs Single-Parent Households in Pulaski
| Children | Married-Couple Families | Single-Parent Households |
| No Children | 0 (0.0%) | 0 (0.0%) |
| 1 or 2 Children | 0 (0.0%) | 0 (0.0%) |
| 3 or 4 Children | 0 (0.0%) | 0 (0.0%) |
| 5 or more Children | 0 (0.0%) | 0 (0.0%) |
| Total | 0 (0.0%) | 0 (0.0%) |
Race in Pulaski
The most populous races in Pulaski are , and White / Caucasian (114 | 100.0%).
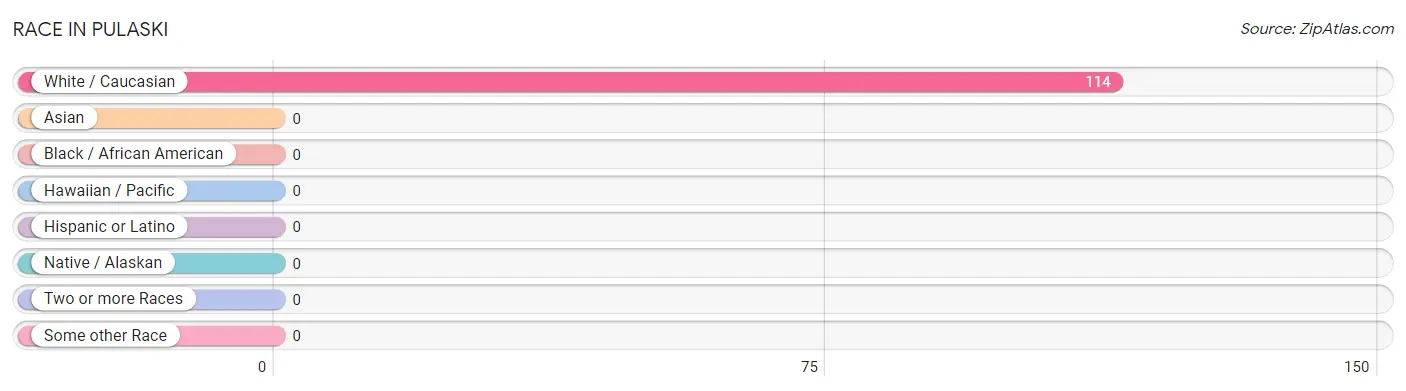
| Race | # Population | % Population |
| Asian | 0 | 0.0% |
| Black / African American | 0 | 0.0% |
| Hawaiian / Pacific | 0 | 0.0% |
| Hispanic or Latino | 0 | 0.0% |
| Native / Alaskan | 0 | 0.0% |
| White / Caucasian | 114 | 100.0% |
| Two or more Races | 0 | 0.0% |
| Some other Race | 0 | 0.0% |
| Total | 114 | 100.0% |
Ancestry in Pulaski
The most populous ancestries reported in Pulaski are English (20 | 17.5%), Scottish (12 | 10.5%), and American (8 | 7.0%), together accounting for 35.1% of all Pulaski residents.
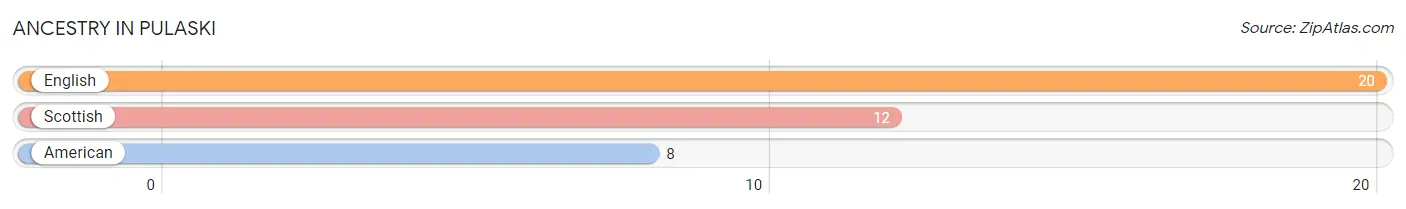
| Ancestry | # Population | % Population |
| American | 8 | 7.0% |
| English | 20 | 17.5% |
| Scottish | 12 | 10.5% | View All 3 Rows |
Immigrants in Pulaski

| Immigration Origin | # Population | % Population | View All 0 Rows |
Sex and Age in Pulaski
Sex and Age in Pulaski
The most populous age groups in Pulaski are 15 to 19 Years (33 | 42.3%) for men and 25 to 29 Years (16 | 44.4%) for women.
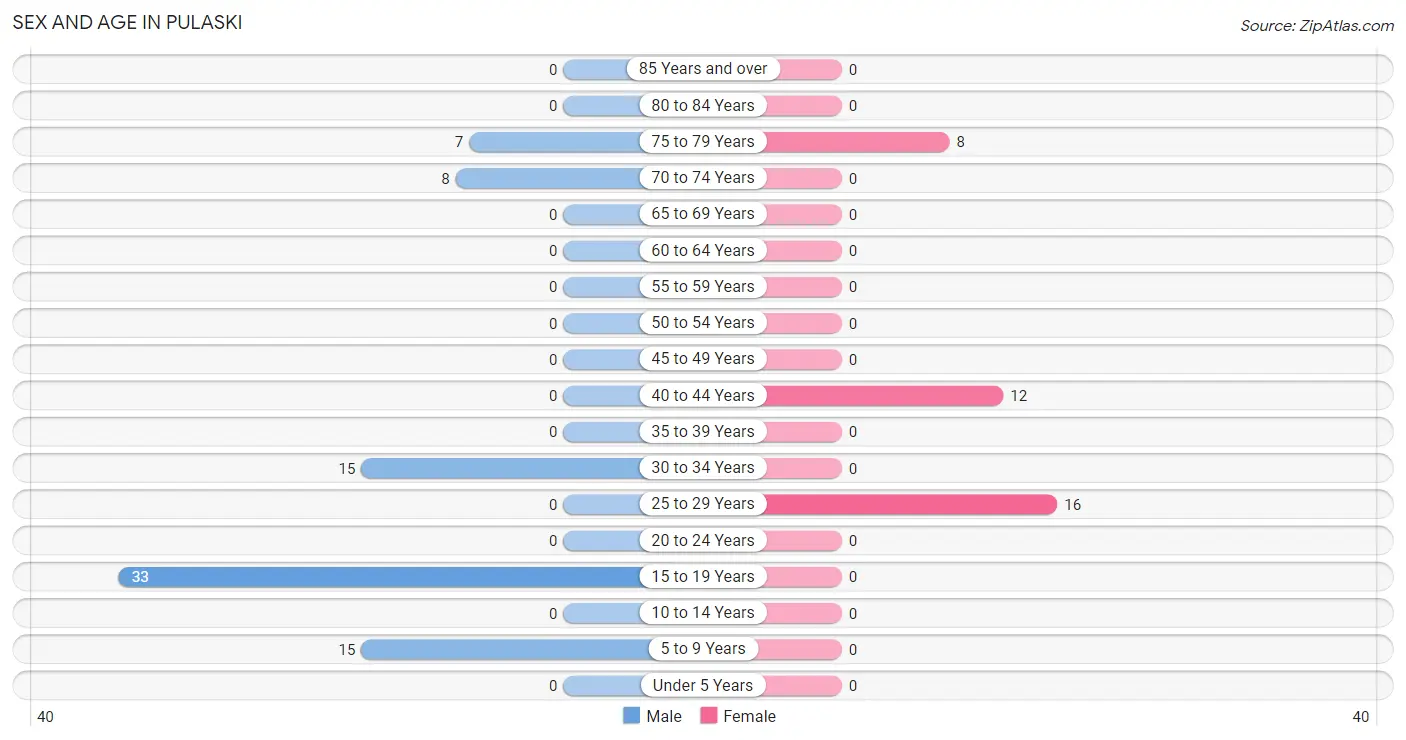
| Age Bracket | Male | Female |
| Under 5 Years | 0 (0.0%) | 0 (0.0%) |
| 5 to 9 Years | 15 (19.2%) | 0 (0.0%) |
| 10 to 14 Years | 0 (0.0%) | 0 (0.0%) |
| 15 to 19 Years | 33 (42.3%) | 0 (0.0%) |
| 20 to 24 Years | 0 (0.0%) | 0 (0.0%) |
| 25 to 29 Years | 0 (0.0%) | 16 (44.4%) |
| 30 to 34 Years | 15 (19.2%) | 0 (0.0%) |
| 35 to 39 Years | 0 (0.0%) | 0 (0.0%) |
| 40 to 44 Years | 0 (0.0%) | 12 (33.3%) |
| 45 to 49 Years | 0 (0.0%) | 0 (0.0%) |
| 50 to 54 Years | 0 (0.0%) | 0 (0.0%) |
| 55 to 59 Years | 0 (0.0%) | 0 (0.0%) |
| 60 to 64 Years | 0 (0.0%) | 0 (0.0%) |
| 65 to 69 Years | 0 (0.0%) | 0 (0.0%) |
| 70 to 74 Years | 8 (10.3%) | 0 (0.0%) |
| 75 to 79 Years | 7 (9.0%) | 8 (22.2%) |
| 80 to 84 Years | 0 (0.0%) | 0 (0.0%) |
| 85 Years and over | 0 (0.0%) | 0 (0.0%) |
| Total | 78 (100.0%) | 36 (100.0%) |
Families and Households in Pulaski
Median Family Size in Pulaski
The median family size in Pulaski is 2.65 persons per family, with single female/mother families (12 | 35.3%) accounting for the largest median family size of 3.75 persons per family. On the other hand, single male/father families (15 | 44.1%) represent the smallest median family size with 2.00 persons per family.
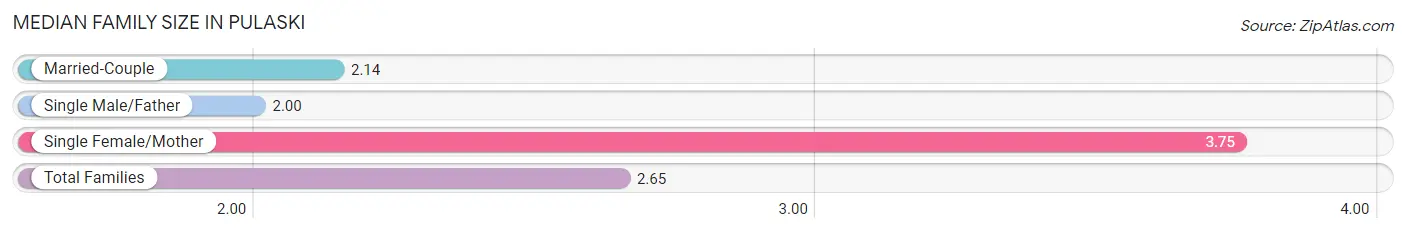
| Family Type | # Families | Family Size |
| Married-Couple | 7 (20.6%) | 2.14 |
| Single Male/Father | 15 (44.1%) | 2.00 |
| Single Female/Mother | 12 (35.3%) | 3.75 |
| Total Families | 34 (100.0%) | 2.65 |
Median Household Size in Pulaski
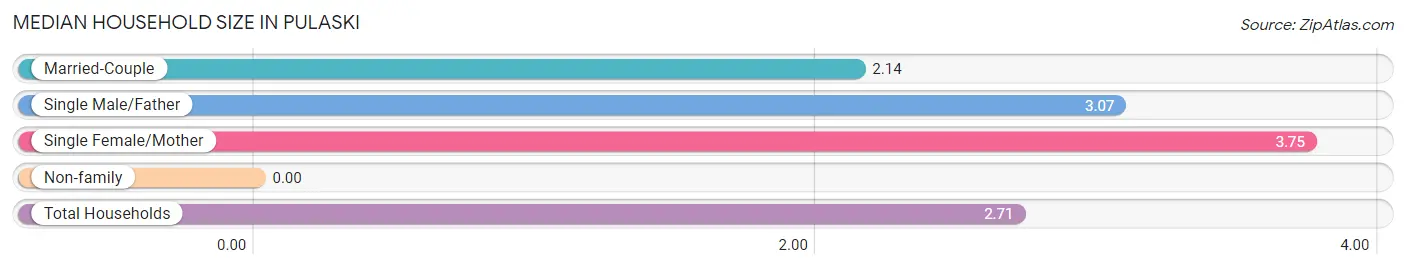
| Household Type | # Households | Household Size |
| Married-Couple | 7 (16.7%) | 2.14 |
| Single Male/Father | 15 (35.7%) | 3.07 |
| Single Female/Mother | 12 (28.6%) | 3.75 |
| Non-family | 8 (19.1%) | - |
| Total Households | 42 (100.0%) | 2.71 |
Household Size by Marriage Status in Pulaski
Out of a total of 42 households in Pulaski, 34 (80.9%) are family households, while 8 (19.1%) are nonfamily households. The most numerous type of family households are 3-person households, comprising 15, and the most common type of nonfamily households are 1-person households, comprising 8.
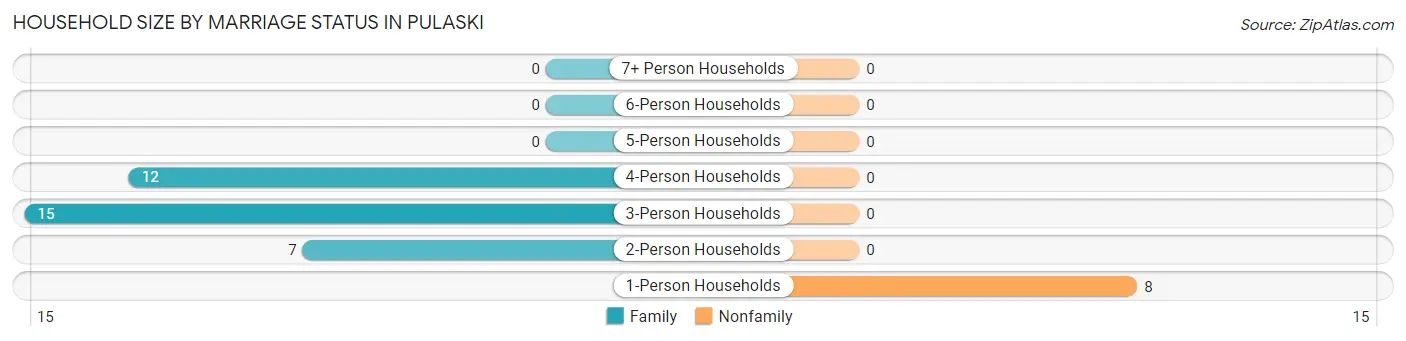
| Household Size | Family Households | Nonfamily Households |
| 1-Person Households | - | 8 (19.1%) |
| 2-Person Households | 7 (16.7%) | 0 (0.0%) |
| 3-Person Households | 15 (35.7%) | 0 (0.0%) |
| 4-Person Households | 12 (28.6%) | 0 (0.0%) |
| 5-Person Households | 0 (0.0%) | 0 (0.0%) |
| 6-Person Households | 0 (0.0%) | 0 (0.0%) |
| 7+ Person Households | 0 (0.0%) | 0 (0.0%) |
| Total | 34 (80.9%) | 8 (19.1%) |
Female Fertility in Pulaski
Fertility by Age in Pulaski
| Age Bracket | Women with Births | Births / 1,000 Women |
| 15 to 19 years | 0 (0.0%) | 0.0 |
| 20 to 34 years | 0 (0.0%) | 0.0 |
| 35 to 50 years | 0 (0.0%) | 0.0 |
| Total | 0 (0.0%) | 0.0 |
Fertility by Age by Marriage Status in Pulaski
| Age Bracket | Married | Unmarried |
| 15 to 19 years | 0 (0.0%) | 0 (0.0%) |
| 20 to 34 years | 0 (0.0%) | 0 (0.0%) |
| 35 to 50 years | 0 (0.0%) | 0 (0.0%) |
| Total | 0 (0.0%) | 0 (0.0%) |
Fertility by Education in Pulaski
| Educational Attainment | Women with Births | Births / 1,000 Women |
| Less than High School | 0 (0.0%) | 0.0 |
| High School Diploma | 0 (0.0%) | 0.0 |
| College or Associate's Degree | 0 (0.0%) | 0.0 |
| Bachelor's Degree | 0 (0.0%) | 0.0 |
| Graduate Degree | 0 (0.0%) | 0.0 |
| Total | 0 (0.0%) | 0.0 |
Fertility by Education by Marriage Status in Pulaski
| Educational Attainment | Married | Unmarried |
| Less than High School | 0 (0.0%) | 0 (0.0%) |
| High School Diploma | 0 (0.0%) | 0 (0.0%) |
| College or Associate's Degree | 0 (0.0%) | 0 (0.0%) |
| Bachelor's Degree | 0 (0.0%) | 0 (0.0%) |
| Graduate Degree | 0 (0.0%) | 0 (0.0%) |
| Total | 0 (0.0%) | 0 (0.0%) |
Employment Characteristics in Pulaski
Employment by Class of Employer in Pulaski
Among the 43 employed individuals in Pulaski, private company employees (27 | 62.8%), and local government employees (16 | 37.2%) make up the most common classes of employment.
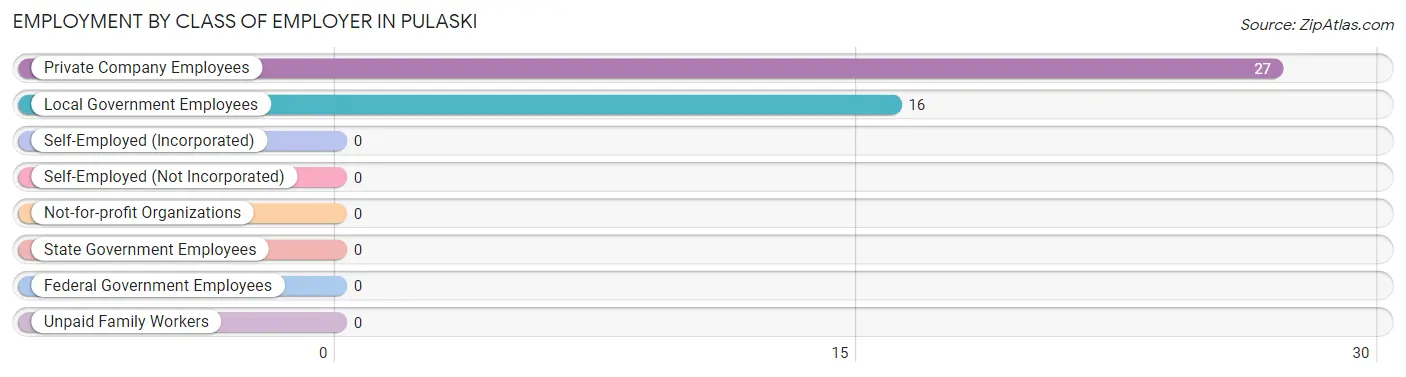
| Employer Class | # Employees | % Employees |
| Private Company Employees | 27 | 62.8% |
| Self-Employed (Incorporated) | 0 | 0.0% |
| Self-Employed (Not Incorporated) | 0 | 0.0% |
| Not-for-profit Organizations | 0 | 0.0% |
| Local Government Employees | 16 | 37.2% |
| State Government Employees | 0 | 0.0% |
| Federal Government Employees | 0 | 0.0% |
| Unpaid Family Workers | 0 | 0.0% |
| Total | 43 | 100.0% |
Employment Status by Age in Pulaski
According to the labor force statistics for Pulaski, out of the total population over 16 years of age (99), 54.5% or 54 individuals are in the labor force, with 20.4% or 11 of them unemployed. The age group with the highest labor force participation rate is 25 to 29 years, with 100.0% or 16 individuals in the labor force. Within the labor force, the 16 to 19 years age range has the highest percentage of unemployed individuals, with 100.0% or 11 of them being unemployed.
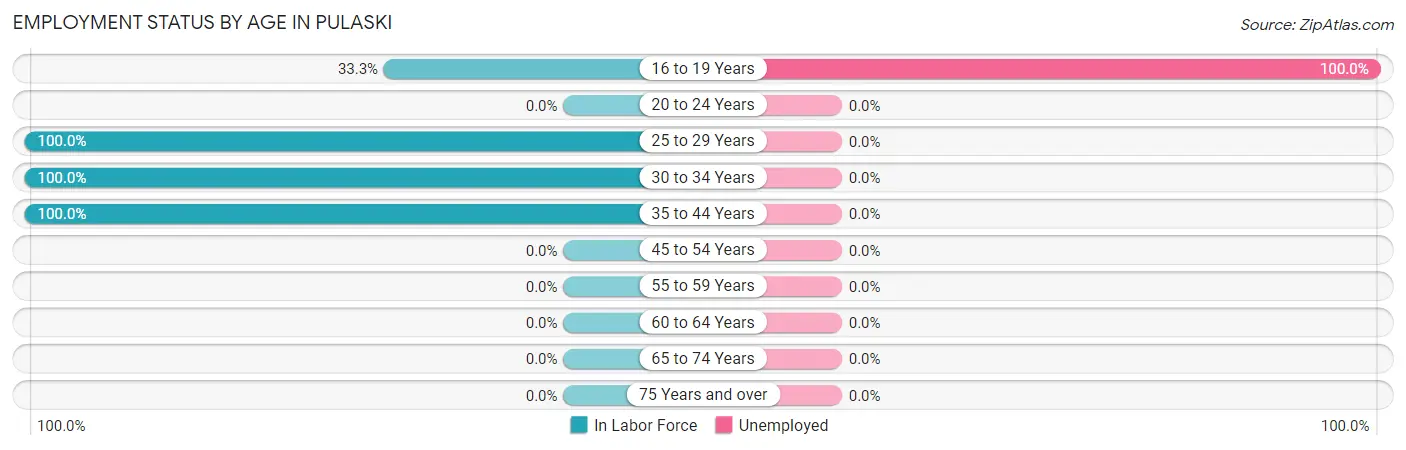
| Age Bracket | In Labor Force | Unemployed |
| 16 to 19 Years | 11 (33.3%) | 11 (100.0%) |
| 20 to 24 Years | 0 (0.0%) | 0 (0.0%) |
| 25 to 29 Years | 16 (100.0%) | 0 (0.0%) |
| 30 to 34 Years | 15 (100.0%) | 0 (0.0%) |
| 35 to 44 Years | 12 (100.0%) | 0 (0.0%) |
| 45 to 54 Years | 0 (0.0%) | 0 (0.0%) |
| 55 to 59 Years | 0 (0.0%) | 0 (0.0%) |
| 60 to 64 Years | 0 (0.0%) | 0 (0.0%) |
| 65 to 74 Years | 0 (0.0%) | 0 (0.0%) |
| 75 Years and over | 0 (0.0%) | 0 (0.0%) |
| Total | 54 (54.5%) | 11 (20.4%) |
Employment Status by Educational Attainment in Pulaski
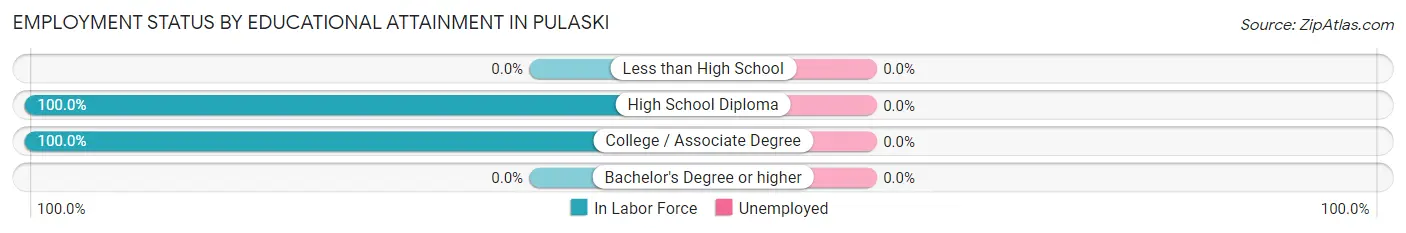
| Educational Attainment | In Labor Force | Unemployed |
| Less than High School | 0 (0.0%) | 0 (0.0%) |
| High School Diploma | 27 (100.0%) | 0 (0.0%) |
| College / Associate Degree | 16 (100.0%) | 0 (0.0%) |
| Bachelor's Degree or higher | 0 (0.0%) | 0 (0.0%) |
| Total | 43 (100.0%) | 0 (0.0%) |
Employment Occupations by Sex in Pulaski
Management, Business, Science and Arts Occupations
The most common Management, Business, Science and Arts occupations in Pulaski are Health Diagnosing & Treating (16 | 37.2%), Health Technologists (16 | 37.2%), and Management (12 | 27.9%).
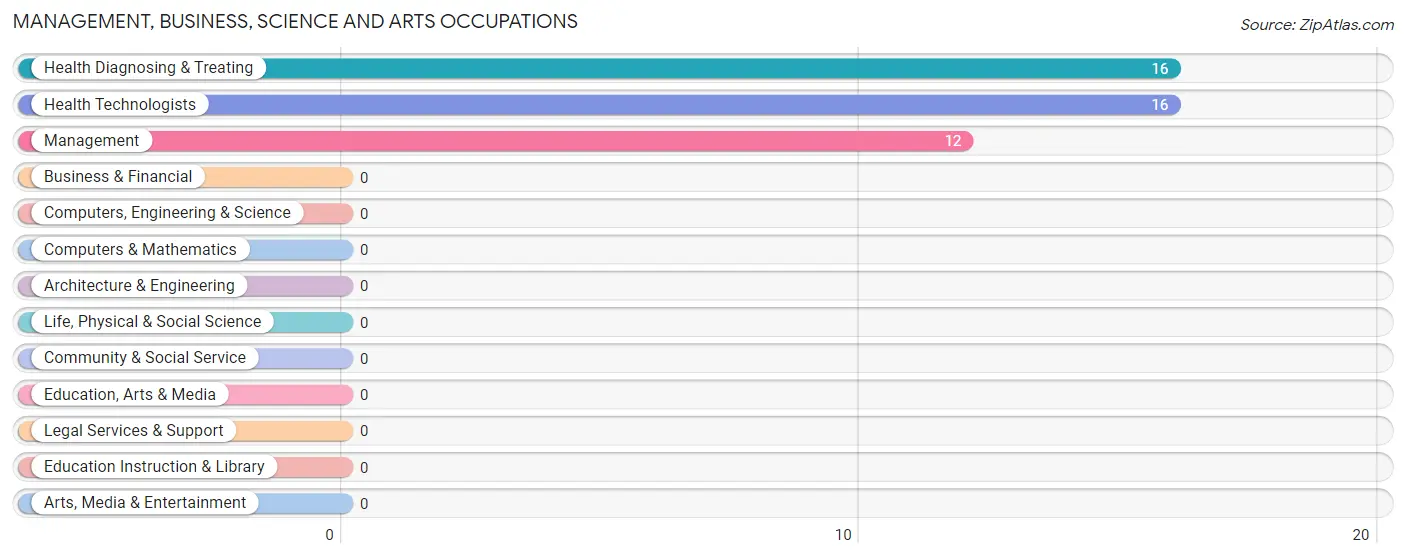
Management, Business, Science and Arts Occupations by Sex
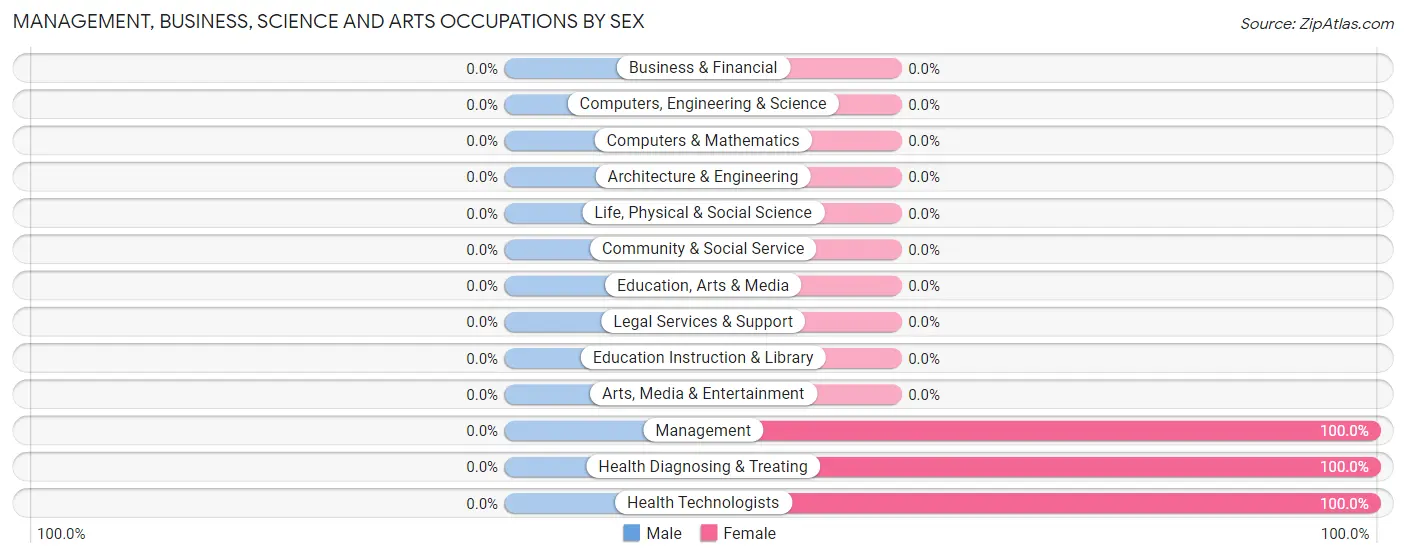
| Occupation | Male | Female |
| Management | 0 (0.0%) | 12 (100.0%) |
| Business & Financial | 0 (0.0%) | 0 (0.0%) |
| Computers, Engineering & Science | 0 (0.0%) | 0 (0.0%) |
| Computers & Mathematics | 0 (0.0%) | 0 (0.0%) |
| Architecture & Engineering | 0 (0.0%) | 0 (0.0%) |
| Life, Physical & Social Science | 0 (0.0%) | 0 (0.0%) |
| Community & Social Service | 0 (0.0%) | 0 (0.0%) |
| Education, Arts & Media | 0 (0.0%) | 0 (0.0%) |
| Legal Services & Support | 0 (0.0%) | 0 (0.0%) |
| Education Instruction & Library | 0 (0.0%) | 0 (0.0%) |
| Arts, Media & Entertainment | 0 (0.0%) | 0 (0.0%) |
| Health Diagnosing & Treating | 0 (0.0%) | 16 (100.0%) |
| Health Technologists | 0 (0.0%) | 16 (100.0%) |
| Total (Category) | 0 (0.0%) | 28 (100.0%) |
| Total (Overall) | 15 (34.9%) | 28 (65.1%) |
Services Occupations
Services Occupations by Sex
| Occupation | Male | Female |
| Healthcare Support | 0 (0.0%) | 0 (0.0%) |
| Security & Protection | 0 (0.0%) | 0 (0.0%) |
| Firefighting & Prevention | 0 (0.0%) | 0 (0.0%) |
| Law Enforcement | 0 (0.0%) | 0 (0.0%) |
| Food Preparation & Serving | 0 (0.0%) | 0 (0.0%) |
| Cleaning & Maintenance | 0 (0.0%) | 0 (0.0%) |
| Personal Care & Service | 0 (0.0%) | 0 (0.0%) |
| Total (Category) | 0 (0.0%) | 0 (0.0%) |
| Total (Overall) | 15 (34.9%) | 28 (65.1%) |
Sales and Office Occupations
Sales and Office Occupations by Sex
| Occupation | Male | Female |
| Sales & Related | 0 (0.0%) | 0 (0.0%) |
| Office & Administration | 0 (0.0%) | 0 (0.0%) |
| Total (Category) | 0 (0.0%) | 0 (0.0%) |
| Total (Overall) | 15 (34.9%) | 28 (65.1%) |
Natural Resources, Construction and Maintenance Occupations
Natural Resources, Construction and Maintenance Occupations by Sex
| Occupation | Male | Female |
| Farming, Fishing & Forestry | 0 (0.0%) | 0 (0.0%) |
| Construction & Extraction | 0 (0.0%) | 0 (0.0%) |
| Installation, Maintenance & Repair | 0 (0.0%) | 0 (0.0%) |
| Total (Category) | 0 (0.0%) | 0 (0.0%) |
| Total (Overall) | 15 (34.9%) | 28 (65.1%) |
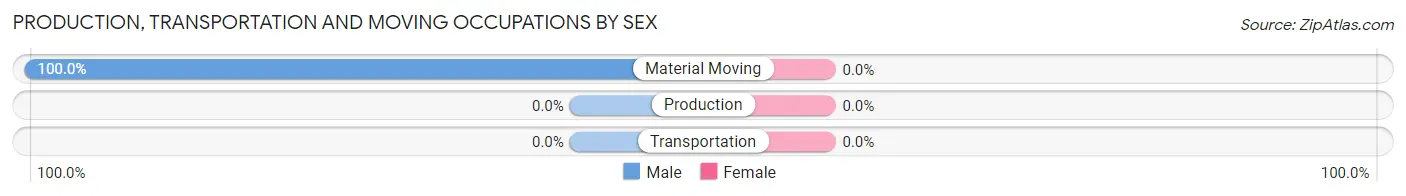
Production, Transportation and Moving Occupations
The most common Production, Transportation and Moving occupations in Pulaski are , and Material Moving (15 | 34.9%).
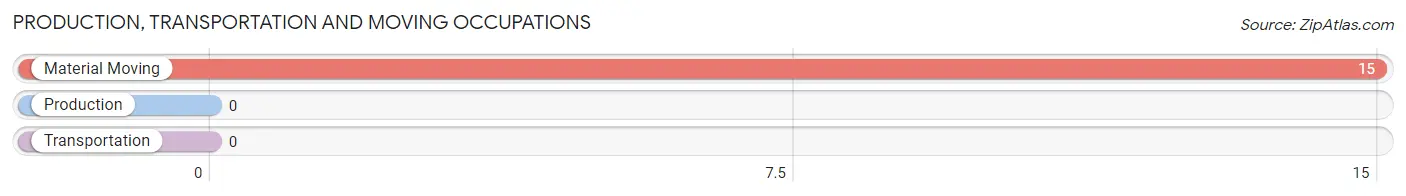
Production, Transportation and Moving Occupations by Sex
| Occupation | Male | Female |
| Production | 0 (0.0%) | 0 (0.0%) |
| Transportation | 0 (0.0%) | 0 (0.0%) |
| Material Moving | 15 (100.0%) | 0 (0.0%) |
| Total (Category) | 15 (100.0%) | 0 (0.0%) |
| Total (Overall) | 15 (34.9%) | 28 (65.1%) |
Employment Industries by Sex in Pulaski
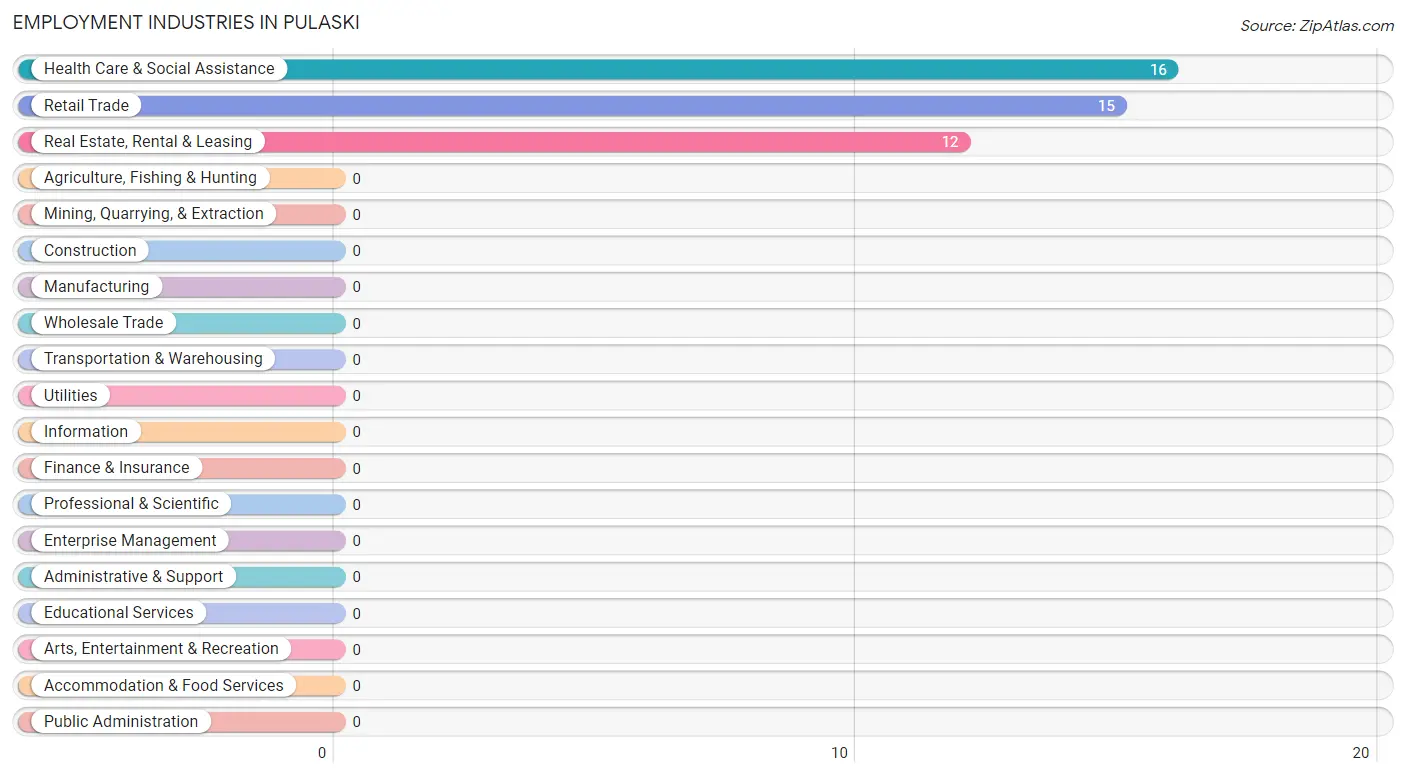
Employment Industries in Pulaski
The major employment industries in Pulaski include Health Care & Social Assistance (16 | 37.2%), Retail Trade (15 | 34.9%), and Real Estate, Rental & Leasing (12 | 27.9%).
Employment Industries by Sex in Pulaski
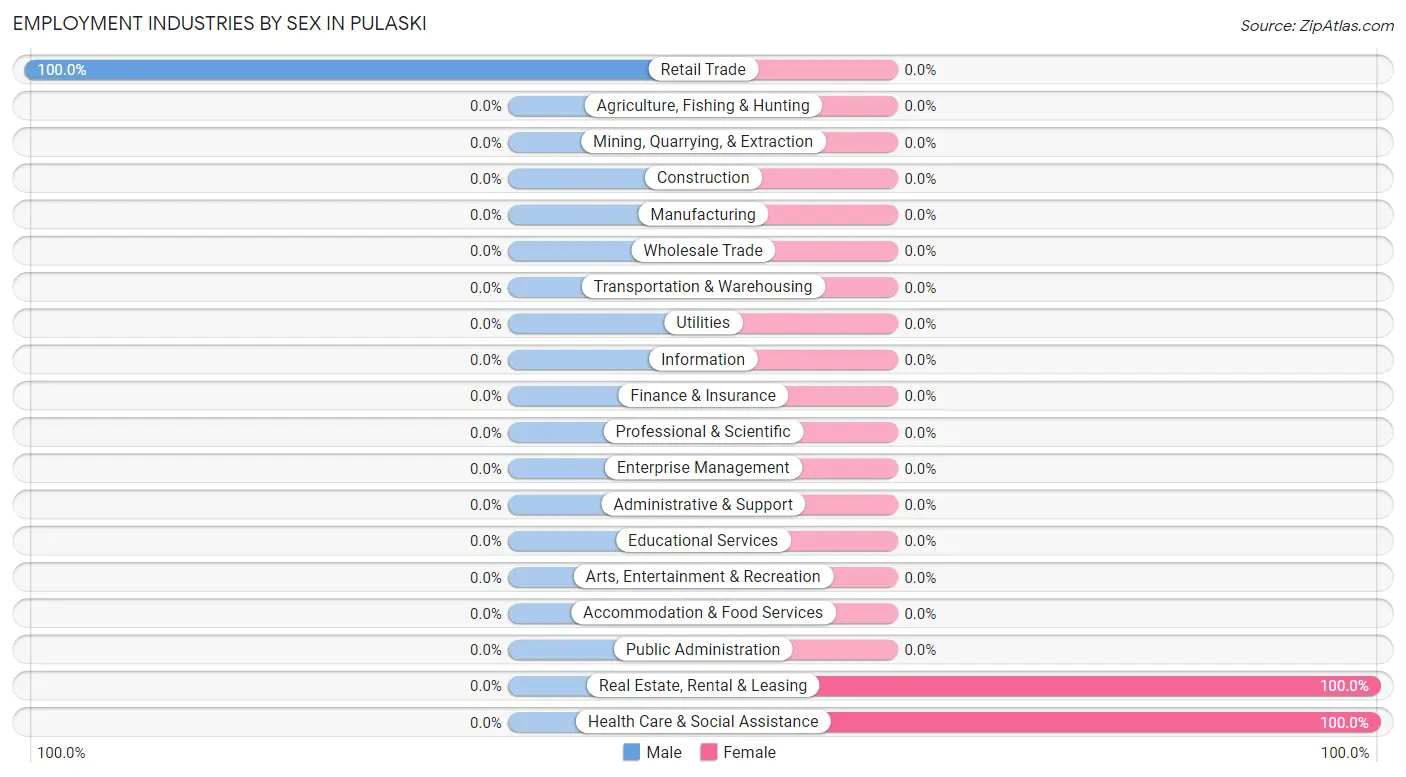
| Industry | Male | Female |
| Agriculture, Fishing & Hunting | 0 (0.0%) | 0 (0.0%) |
| Mining, Quarrying, & Extraction | 0 (0.0%) | 0 (0.0%) |
| Construction | 0 (0.0%) | 0 (0.0%) |
| Manufacturing | 0 (0.0%) | 0 (0.0%) |
| Wholesale Trade | 0 (0.0%) | 0 (0.0%) |
| Retail Trade | 15 (100.0%) | 0 (0.0%) |
| Transportation & Warehousing | 0 (0.0%) | 0 (0.0%) |
| Utilities | 0 (0.0%) | 0 (0.0%) |
| Information | 0 (0.0%) | 0 (0.0%) |
| Finance & Insurance | 0 (0.0%) | 0 (0.0%) |
| Real Estate, Rental & Leasing | 0 (0.0%) | 12 (100.0%) |
| Professional & Scientific | 0 (0.0%) | 0 (0.0%) |
| Enterprise Management | 0 (0.0%) | 0 (0.0%) |
| Administrative & Support | 0 (0.0%) | 0 (0.0%) |
| Educational Services | 0 (0.0%) | 0 (0.0%) |
| Health Care & Social Assistance | 0 (0.0%) | 16 (100.0%) |
| Arts, Entertainment & Recreation | 0 (0.0%) | 0 (0.0%) |
| Accommodation & Food Services | 0 (0.0%) | 0 (0.0%) |
| Public Administration | 0 (0.0%) | 0 (0.0%) |
| Total | 15 (34.9%) | 28 (65.1%) |
Education in Pulaski
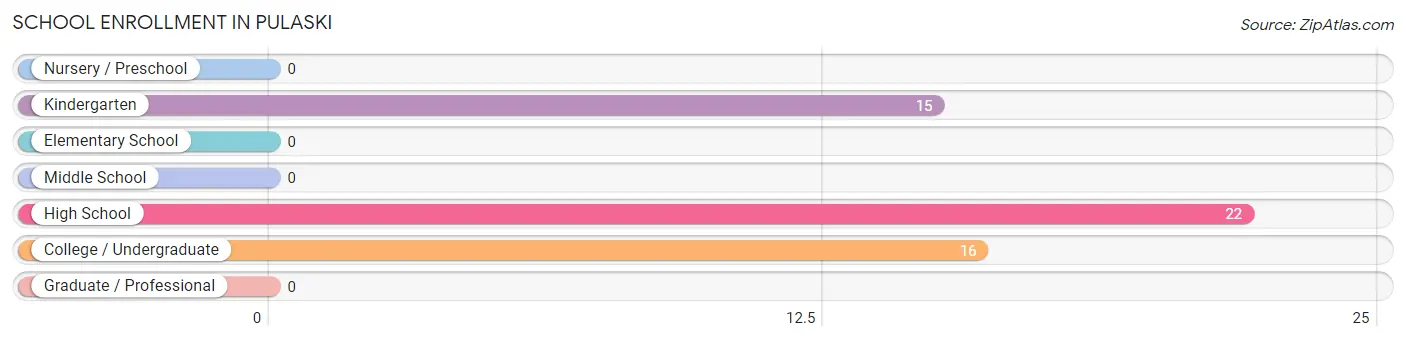
School Enrollment in Pulaski
The most common levels of schooling among the 53 students in Pulaski are high school (22 | 41.5%), college / undergraduate (16 | 30.2%), and kindergarten (15 | 28.3%).
| School Level | # Students | % Students |
| Nursery / Preschool | 0 | 0.0% |
| Kindergarten | 15 | 28.3% |
| Elementary School | 0 | 0.0% |
| Middle School | 0 | 0.0% |
| High School | 22 | 41.5% |
| College / Undergraduate | 16 | 30.2% |
| Graduate / Professional | 0 | 0.0% |
| Total | 53 | 100.0% |
School Enrollment by Age by Funding Source in Pulaski
Out of a total of 53 students who are enrolled in schools in Pulaski, 16 (30.2%) attend a private institution, while the remaining 37 (69.8%) are enrolled in public schools. The age group of 25 to 34 year olds has the highest likelihood of being enrolled in private schools, with 16 (100.0% in the age bracket) enrolled. Conversely, the age group of 5 to 9 year old has the lowest likelihood of being enrolled in a private school, with 15 (100.0% in the age bracket) attending a public institution.
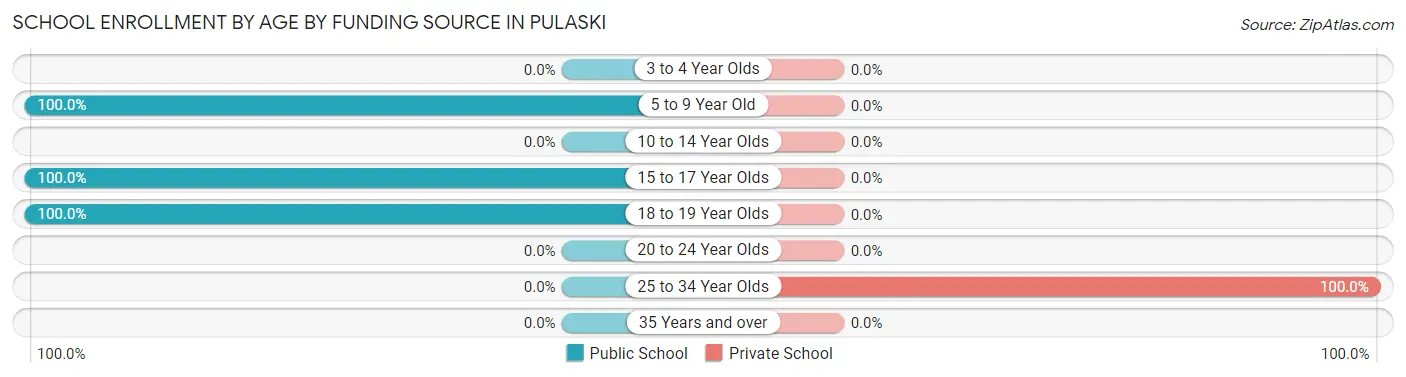
| Age Bracket | Public School | Private School |
| 3 to 4 Year Olds | 0 (0.0%) | 0 (0.0%) |
| 5 to 9 Year Old | 15 (100.0%) | 0 (0.0%) |
| 10 to 14 Year Olds | 0 (0.0%) | 0 (0.0%) |
| 15 to 17 Year Olds | 10 (100.0%) | 0 (0.0%) |
| 18 to 19 Year Olds | 12 (100.0%) | 0 (0.0%) |
| 20 to 24 Year Olds | 0 (0.0%) | 0 (0.0%) |
| 25 to 34 Year Olds | 0 (0.0%) | 16 (100.0%) |
| 35 Years and over | 0 (0.0%) | 0 (0.0%) |
| Total | 37 (69.8%) | 16 (30.2%) |
Educational Attainment by Field of Study in Pulaski
| Field of Study | # Graduates | % Graduates |
| Computers & Mathematics | 0 | 0.0% |
| Bio, Nature & Agricultural | 0 | 0.0% |
| Physical & Health Sciences | 0 | 0.0% |
| Psychology | 0 | 0.0% |
| Social Sciences | 0 | 0.0% |
| Engineering | 0 | 0.0% |
| Multidisciplinary Studies | 0 | 0.0% |
| Science & Technology | 0 | 0.0% |
| Business | 0 | 0.0% |
| Education | 0 | 0.0% |
| Literature & Languages | 0 | 0.0% |
| Liberal Arts & History | 0 | 0.0% |
| Visual & Performing Arts | 0 | 0.0% |
| Communications | 0 | 0.0% |
| Arts & Humanities | 0 | 0.0% |
| Total | 0 | 0.0% |
Transportation & Commute in Pulaski
Vehicle Availability by Sex in Pulaski
The most prevalent vehicle ownership categories in Pulaski are males with 3 vehicles (15, accounting for 100.0%) and females with 3 vehicles (16, making up 53.6%).
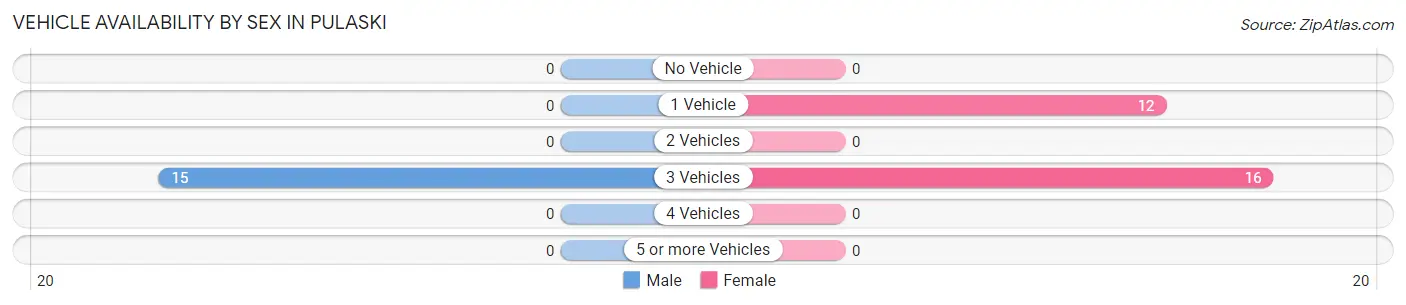
| Vehicles Available | Male | Female |
| No Vehicle | 0 (0.0%) | 0 (0.0%) |
| 1 Vehicle | 0 (0.0%) | 12 (42.9%) |
| 2 Vehicles | 0 (0.0%) | 0 (0.0%) |
| 3 Vehicles | 15 (100.0%) | 16 (57.1%) |
| 4 Vehicles | 0 (0.0%) | 0 (0.0%) |
| 5 or more Vehicles | 0 (0.0%) | 0 (0.0%) |
| Total | 15 (100.0%) | 28 (100.0%) |
Commute Time in Pulaski
The most frequently occuring commute durations in Pulaski are 10 to 14 minutes (28 commuters, 65.1%), 15 to 19 minutes (15 commuters, 34.9%), and less than 5 minutes (0 commuters, 0.0%).
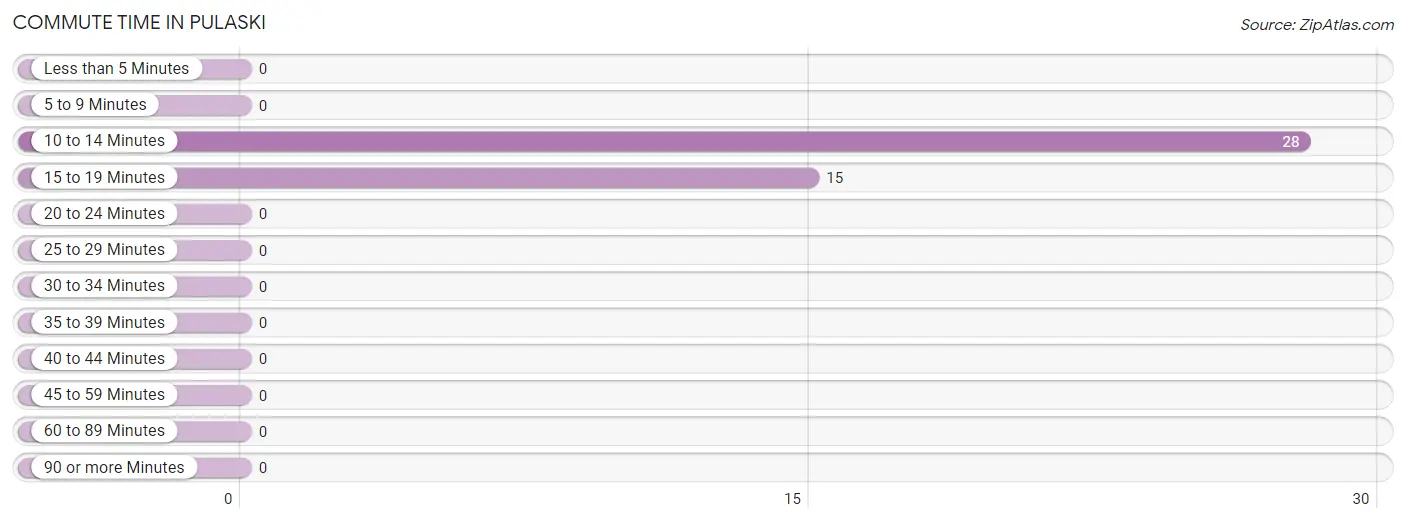
| Commute Time | # Commuters | % Commuters |
| Less than 5 Minutes | 0 | 0.0% |
| 5 to 9 Minutes | 0 | 0.0% |
| 10 to 14 Minutes | 28 | 65.1% |
| 15 to 19 Minutes | 15 | 34.9% |
| 20 to 24 Minutes | 0 | 0.0% |
| 25 to 29 Minutes | 0 | 0.0% |
| 30 to 34 Minutes | 0 | 0.0% |
| 35 to 39 Minutes | 0 | 0.0% |
| 40 to 44 Minutes | 0 | 0.0% |
| 45 to 59 Minutes | 0 | 0.0% |
| 60 to 89 Minutes | 0 | 0.0% |
| 90 or more Minutes | 0 | 0.0% |
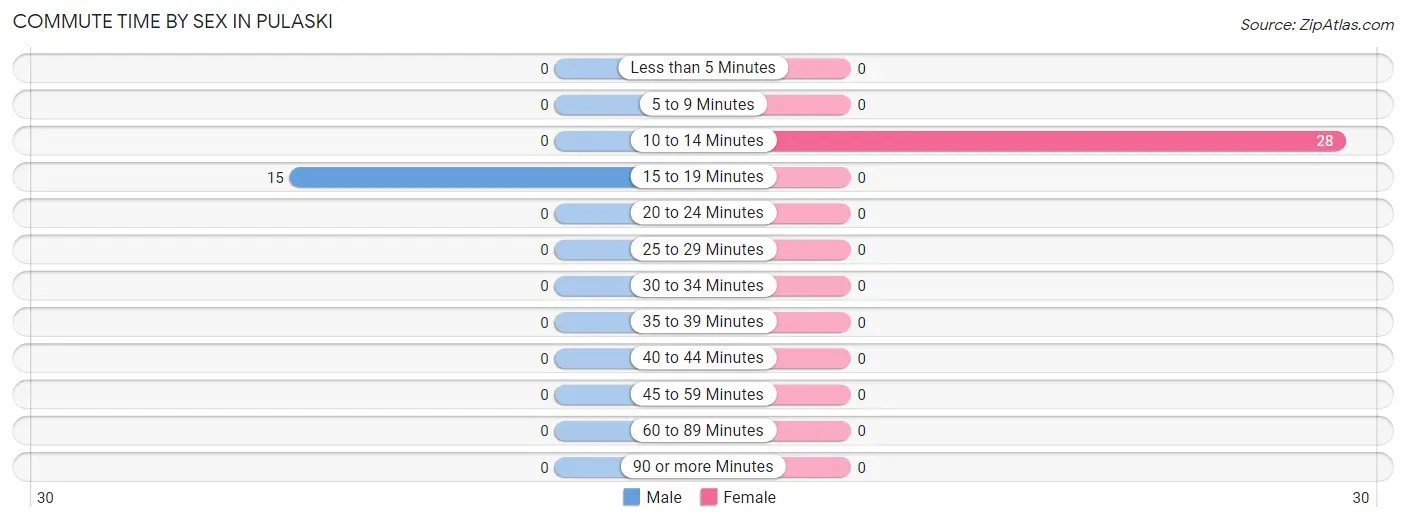
Commute Time by Sex in Pulaski
The most common commute times in Pulaski are 15 to 19 minutes (15 commuters, 100.0%) for males and 10 to 14 minutes (28 commuters, 100.0%) for females.
| Commute Time | Male | Female |
| Less than 5 Minutes | 0 (0.0%) | 0 (0.0%) |
| 5 to 9 Minutes | 0 (0.0%) | 0 (0.0%) |
| 10 to 14 Minutes | 0 (0.0%) | 28 (100.0%) |
| 15 to 19 Minutes | 15 (100.0%) | 0 (0.0%) |
| 20 to 24 Minutes | 0 (0.0%) | 0 (0.0%) |
| 25 to 29 Minutes | 0 (0.0%) | 0 (0.0%) |
| 30 to 34 Minutes | 0 (0.0%) | 0 (0.0%) |
| 35 to 39 Minutes | 0 (0.0%) | 0 (0.0%) |
| 40 to 44 Minutes | 0 (0.0%) | 0 (0.0%) |
| 45 to 59 Minutes | 0 (0.0%) | 0 (0.0%) |
| 60 to 89 Minutes | 0 (0.0%) | 0 (0.0%) |
| 90 or more Minutes | 0 (0.0%) | 0 (0.0%) |
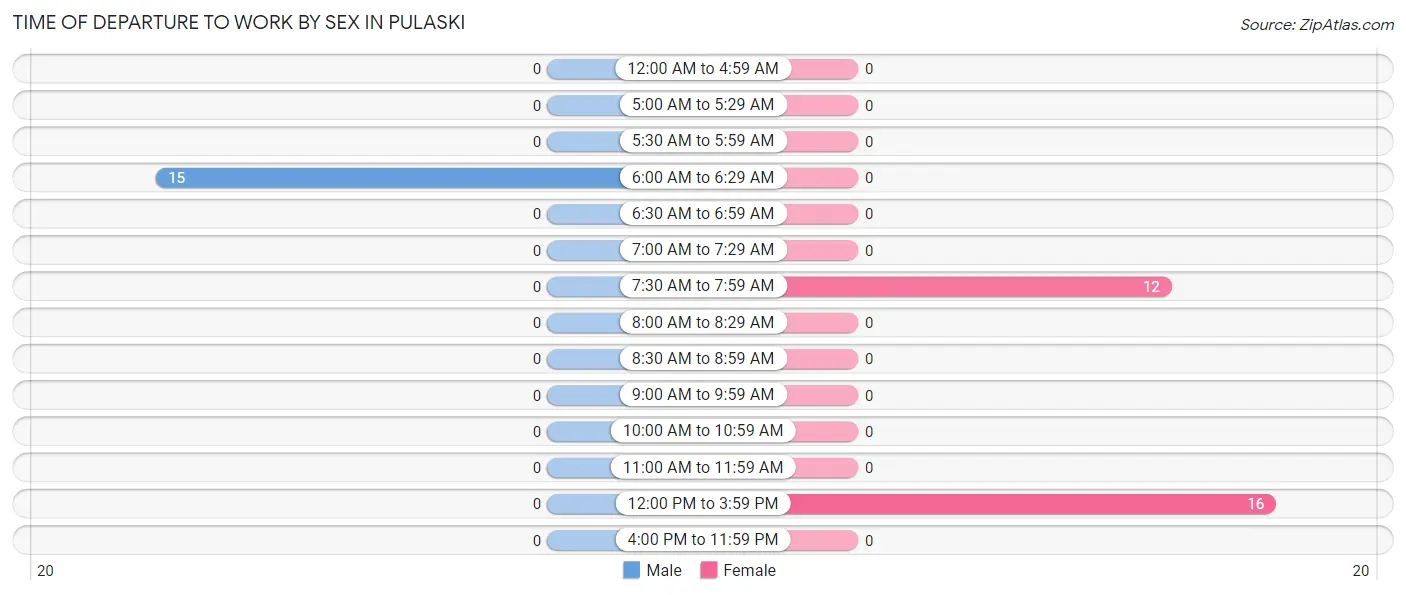
Time of Departure to Work by Sex in Pulaski
The most frequent times of departure to work in Pulaski are 6:00 AM to 6:29 AM (15, 100.0%) for males and 12:00 PM to 3:59 PM (16, 57.1%) for females.
| Time of Departure | Male | Female |
| 12:00 AM to 4:59 AM | 0 (0.0%) | 0 (0.0%) |
| 5:00 AM to 5:29 AM | 0 (0.0%) | 0 (0.0%) |
| 5:30 AM to 5:59 AM | 0 (0.0%) | 0 (0.0%) |
| 6:00 AM to 6:29 AM | 15 (100.0%) | 0 (0.0%) |
| 6:30 AM to 6:59 AM | 0 (0.0%) | 0 (0.0%) |
| 7:00 AM to 7:29 AM | 0 (0.0%) | 0 (0.0%) |
| 7:30 AM to 7:59 AM | 0 (0.0%) | 12 (42.9%) |
| 8:00 AM to 8:29 AM | 0 (0.0%) | 0 (0.0%) |
| 8:30 AM to 8:59 AM | 0 (0.0%) | 0 (0.0%) |
| 9:00 AM to 9:59 AM | 0 (0.0%) | 0 (0.0%) |
| 10:00 AM to 10:59 AM | 0 (0.0%) | 0 (0.0%) |
| 11:00 AM to 11:59 AM | 0 (0.0%) | 0 (0.0%) |
| 12:00 PM to 3:59 PM | 0 (0.0%) | 16 (57.1%) |
| 4:00 PM to 11:59 PM | 0 (0.0%) | 0 (0.0%) |
| Total | 15 (100.0%) | 28 (100.0%) |
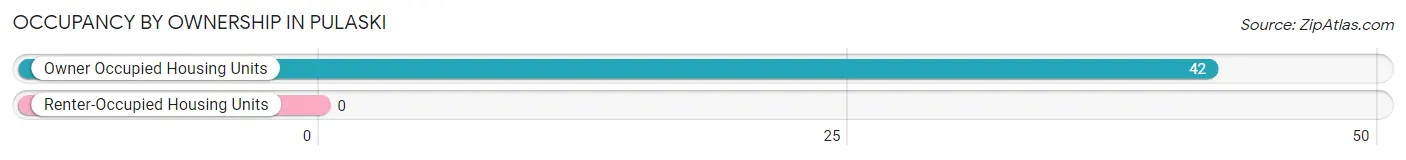
Housing Occupancy in Pulaski
Occupancy by Ownership in Pulaski
Of the total 42 dwellings in Pulaski, owner-occupied units account for 42 (100.0%), while renter-occupied units make up 0 (0.0%).
| Occupancy | # Housing Units | % Housing Units |
| Owner Occupied Housing Units | 42 | 100.0% |
| Renter-Occupied Housing Units | 0 | 0.0% |
| Total Occupied Housing Units | 42 | 100.0% |
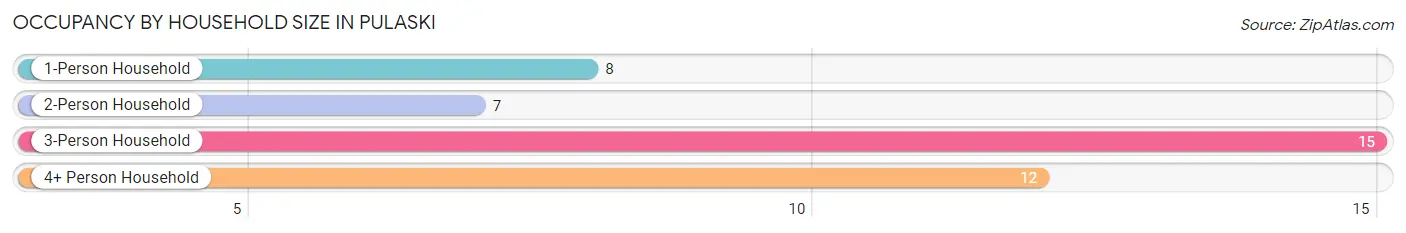
Occupancy by Household Size in Pulaski
| Household Size | # Housing Units | % Housing Units |
| 1-Person Household | 8 | 19.1% |
| 2-Person Household | 7 | 16.7% |
| 3-Person Household | 15 | 35.7% |
| 4+ Person Household | 12 | 28.6% |
| Total Housing Units | 42 | 100.0% |
Occupancy by Ownership by Household Size in Pulaski
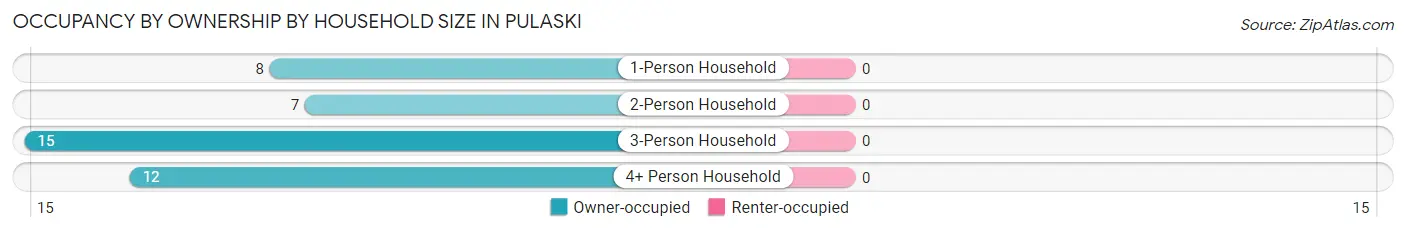
| Household Size | Owner-occupied | Renter-occupied |
| 1-Person Household | 8 (100.0%) | 0 (0.0%) |
| 2-Person Household | 7 (100.0%) | 0 (0.0%) |
| 3-Person Household | 15 (100.0%) | 0 (0.0%) |
| 4+ Person Household | 12 (100.0%) | 0 (0.0%) |
| Total Housing Units | 42 (100.0%) | 0 (0.0%) |
Occupancy by Educational Attainment in Pulaski
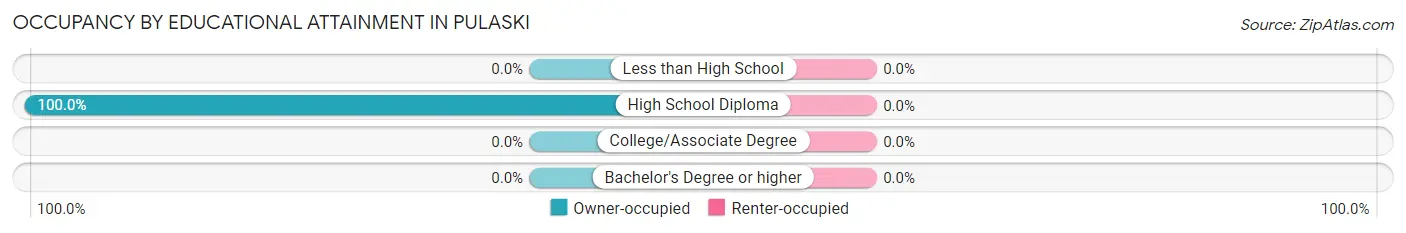
| Household Size | Owner-occupied | Renter-occupied |
| Less than High School | 0 (0.0%) | 0 (0.0%) |
| High School Diploma | 42 (100.0%) | 0 (0.0%) |
| College/Associate Degree | 0 (0.0%) | 0 (0.0%) |
| Bachelor's Degree or higher | 0 (0.0%) | 0 (0.0%) |
Occupancy by Age of Householder in Pulaski
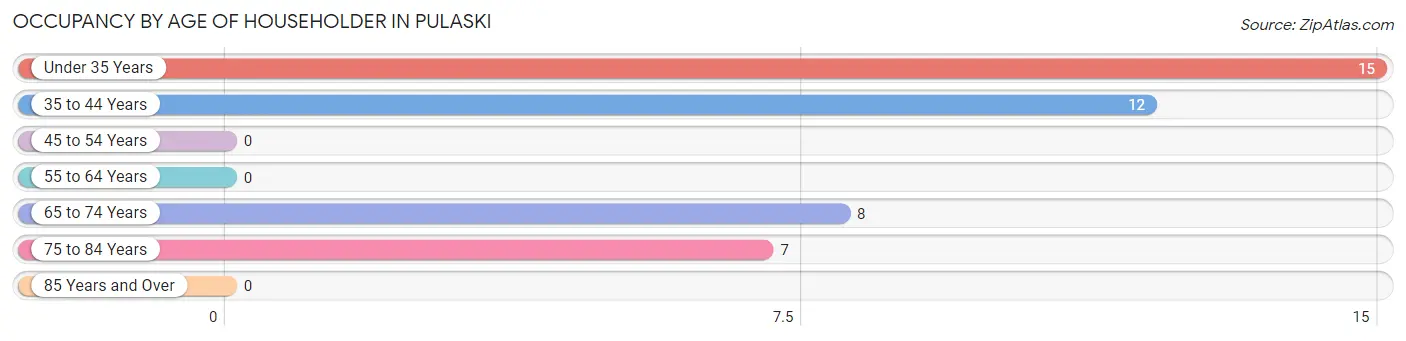
| Age Bracket | # Households | % Households |
| Under 35 Years | 15 | 35.7% |
| 35 to 44 Years | 12 | 28.6% |
| 45 to 54 Years | 0 | 0.0% |
| 55 to 64 Years | 0 | 0.0% |
| 65 to 74 Years | 8 | 19.1% |
| 75 to 84 Years | 7 | 16.7% |
| 85 Years and Over | 0 | 0.0% |
| Total | 42 | 100.0% |
Housing Finances in Pulaski
Median Income by Occupancy in Pulaski
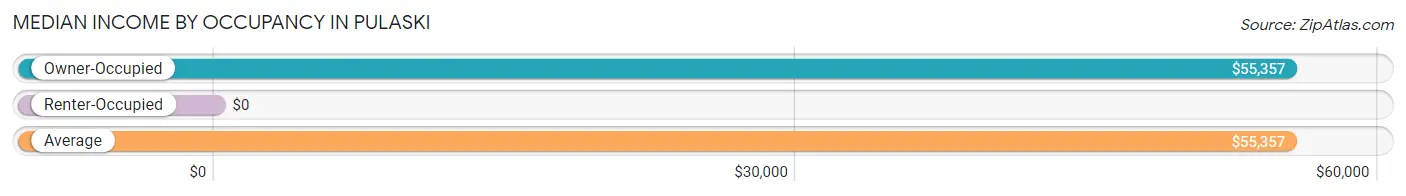
| Occupancy Type | # Households | Median Income |
| Owner-Occupied | 42 (100.0%) | $55,357 |
| Renter-Occupied | 0 (0.0%) | $0 |
| Average | 42 (100.0%) | $55,357 |
Occupancy by Householder Income Bracket in Pulaski
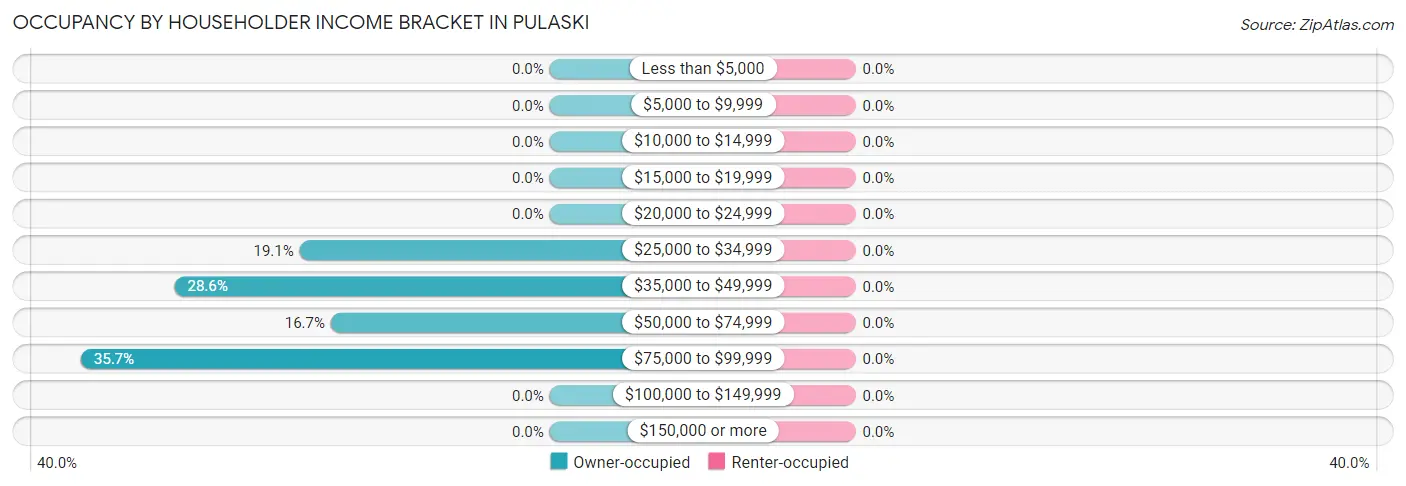
| Income Bracket | Owner-occupied | Renter-occupied |
| Less than $5,000 | 0 (0.0%) | 0 (0.0%) |
| $5,000 to $9,999 | 0 (0.0%) | 0 (0.0%) |
| $10,000 to $14,999 | 0 (0.0%) | 0 (0.0%) |
| $15,000 to $19,999 | 0 (0.0%) | 0 (0.0%) |
| $20,000 to $24,999 | 0 (0.0%) | 0 (0.0%) |
| $25,000 to $34,999 | 8 (19.1%) | 0 (0.0%) |
| $35,000 to $49,999 | 12 (28.6%) | 0 (0.0%) |
| $50,000 to $74,999 | 7 (16.7%) | 0 (0.0%) |
| $75,000 to $99,999 | 15 (35.7%) | 0 (0.0%) |
| $100,000 to $149,999 | 0 (0.0%) | 0 (0.0%) |
| $150,000 or more | 0 (0.0%) | 0 (0.0%) |
| Total | 42 (100.0%) | 0 (0.0%) |
Monthly Housing Cost Tiers in Pulaski
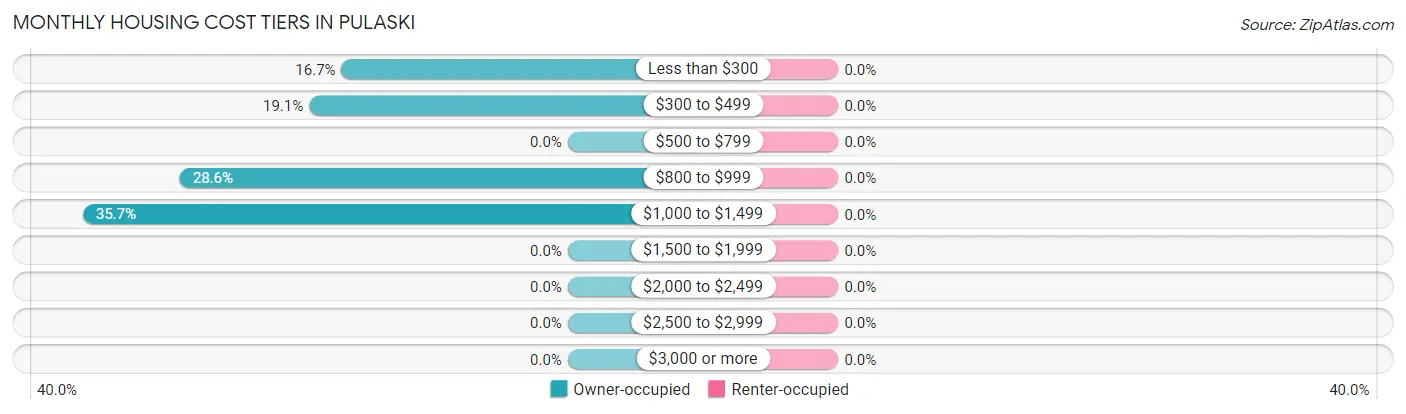
| Monthly Cost | Owner-occupied | Renter-occupied |
| Less than $300 | 7 (16.7%) | 0 (0.0%) |
| $300 to $499 | 8 (19.1%) | 0 (0.0%) |
| $500 to $799 | 0 (0.0%) | 0 (0.0%) |
| $800 to $999 | 12 (28.6%) | 0 (0.0%) |
| $1,000 to $1,499 | 15 (35.7%) | 0 (0.0%) |
| $1,500 to $1,999 | 0 (0.0%) | 0 (0.0%) |
| $2,000 to $2,499 | 0 (0.0%) | 0 (0.0%) |
| $2,500 to $2,999 | 0 (0.0%) | 0 (0.0%) |
| $3,000 or more | 0 (0.0%) | 0 (0.0%) |
| Total | 42 (100.0%) | 0 (0.0%) |
Physical Housing Characteristics in Pulaski
Housing Structures in Pulaski
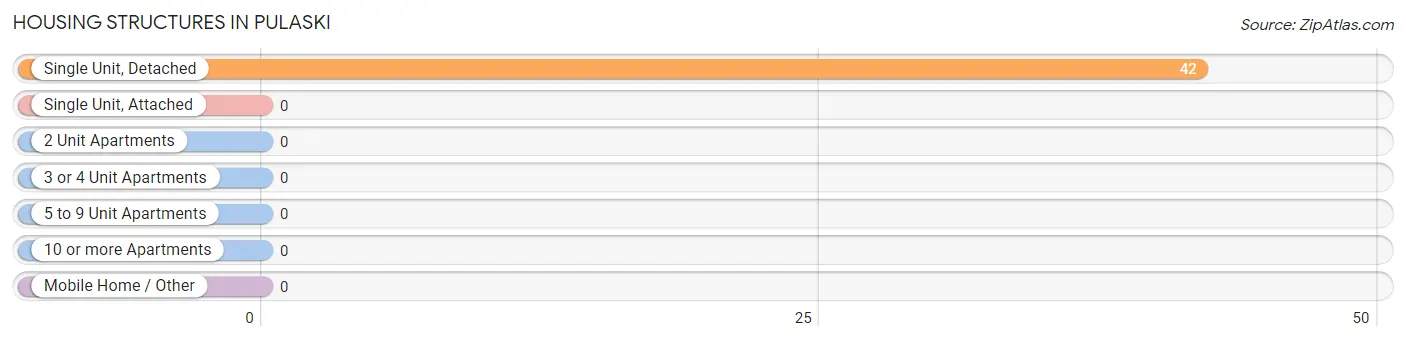
| Structure Type | # Housing Units | % Housing Units |
| Single Unit, Detached | 42 | 100.0% |
| Single Unit, Attached | 0 | 0.0% |
| 2 Unit Apartments | 0 | 0.0% |
| 3 or 4 Unit Apartments | 0 | 0.0% |
| 5 to 9 Unit Apartments | 0 | 0.0% |
| 10 or more Apartments | 0 | 0.0% |
| Mobile Home / Other | 0 | 0.0% |
| Total | 42 | 100.0% |
Housing Structures by Occupancy in Pulaski
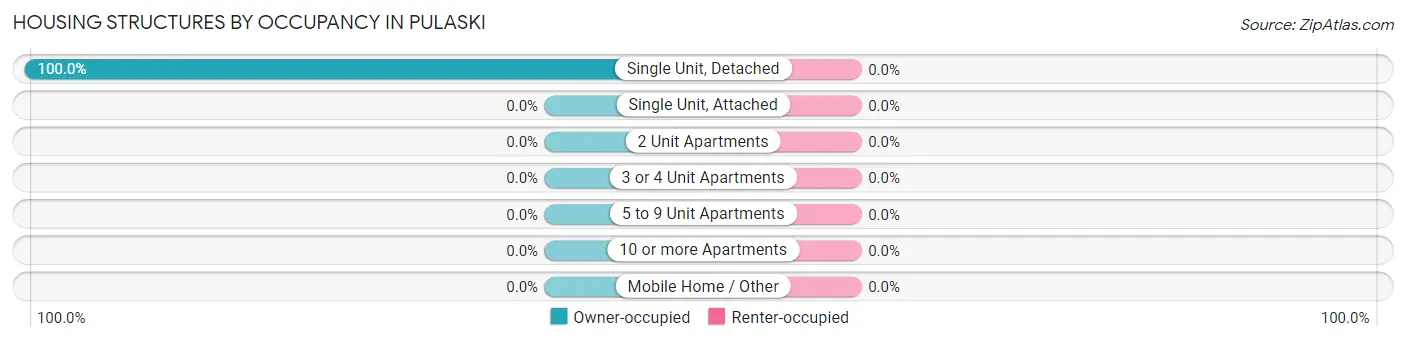
| Structure Type | Owner-occupied | Renter-occupied |
| Single Unit, Detached | 42 (100.0%) | 0 (0.0%) |
| Single Unit, Attached | 0 (0.0%) | 0 (0.0%) |
| 2 Unit Apartments | 0 (0.0%) | 0 (0.0%) |
| 3 or 4 Unit Apartments | 0 (0.0%) | 0 (0.0%) |
| 5 to 9 Unit Apartments | 0 (0.0%) | 0 (0.0%) |
| 10 or more Apartments | 0 (0.0%) | 0 (0.0%) |
| Mobile Home / Other | 0 (0.0%) | 0 (0.0%) |
| Total | 42 (100.0%) | 0 (0.0%) |
Housing Structures by Number of Rooms in Pulaski
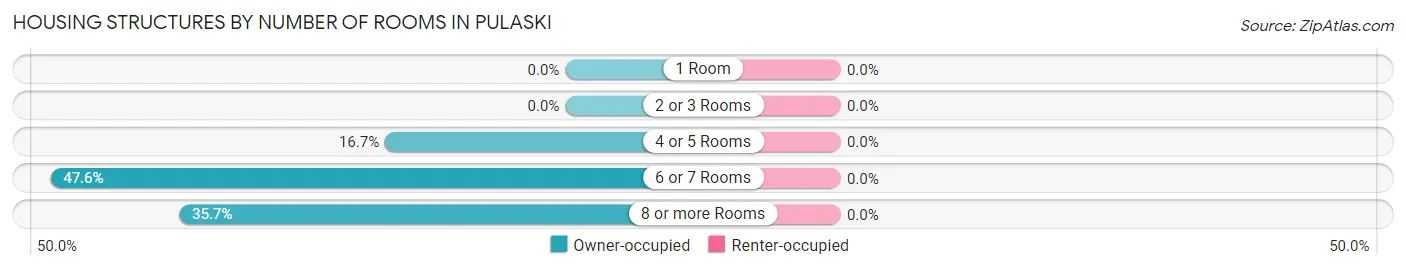
| Number of Rooms | Owner-occupied | Renter-occupied |
| 1 Room | 0 (0.0%) | 0 (0.0%) |
| 2 or 3 Rooms | 0 (0.0%) | 0 (0.0%) |
| 4 or 5 Rooms | 7 (16.7%) | 0 (0.0%) |
| 6 or 7 Rooms | 20 (47.6%) | 0 (0.0%) |
| 8 or more Rooms | 15 (35.7%) | 0 (0.0%) |
| Total | 42 (100.0%) | 0 (0.0%) |
Housing Structure by Heating Type in Pulaski
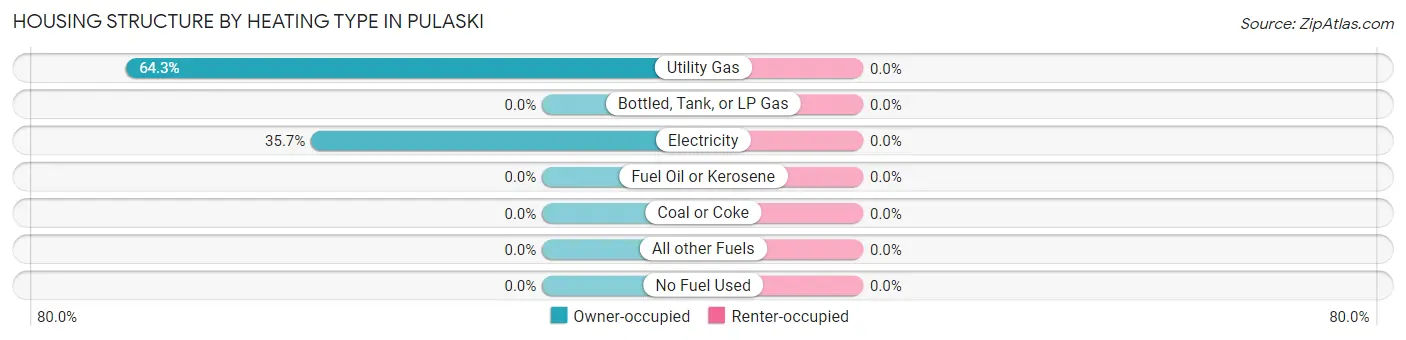
| Heating Type | Owner-occupied | Renter-occupied |
| Utility Gas | 27 (64.3%) | 0 (0.0%) |
| Bottled, Tank, or LP Gas | 0 (0.0%) | 0 (0.0%) |
| Electricity | 15 (35.7%) | 0 (0.0%) |
| Fuel Oil or Kerosene | 0 (0.0%) | 0 (0.0%) |
| Coal or Coke | 0 (0.0%) | 0 (0.0%) |
| All other Fuels | 0 (0.0%) | 0 (0.0%) |
| No Fuel Used | 0 (0.0%) | 0 (0.0%) |
| Total | 42 (100.0%) | 0 (0.0%) |
Household Vehicle Usage in Pulaski
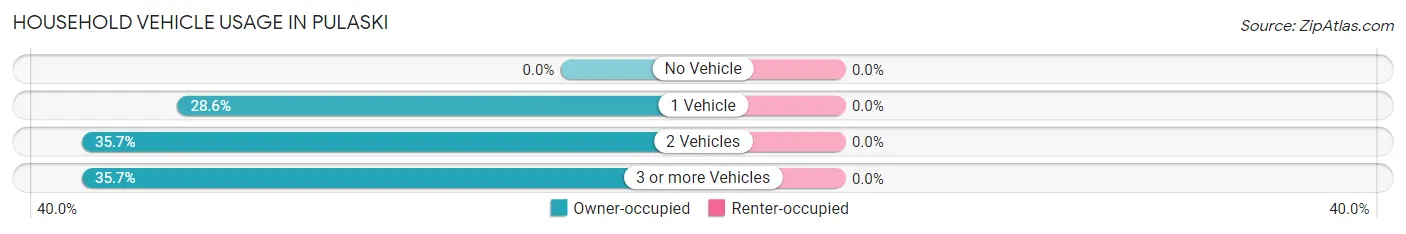
| Vehicles per Household | Owner-occupied | Renter-occupied |
| No Vehicle | 0 (0.0%) | 0 (0.0%) |
| 1 Vehicle | 12 (28.6%) | 0 (0.0%) |
| 2 Vehicles | 15 (35.7%) | 0 (0.0%) |
| 3 or more Vehicles | 15 (35.7%) | 0 (0.0%) |
| Total | 42 (100.0%) | 0 (0.0%) |
Real Estate & Mortgages in Pulaski
Real Estate and Mortgage Overview in Pulaski
| Characteristic | Without Mortgage | With Mortgage |
| Housing Units | 15 | 27 |
| Median Property Value | - | - |
| Median Household Income | - | - |
| Monthly Housing Costs | - | - |
| Real Estate Taxes | - | - |
Property Value by Mortgage Status in Pulaski
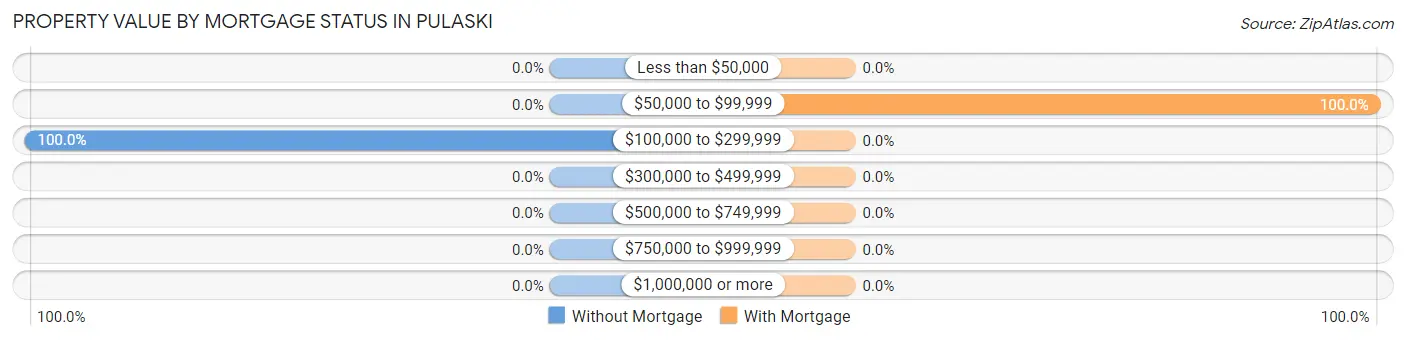
| Property Value | Without Mortgage | With Mortgage |
| Less than $50,000 | 0 (0.0%) | 0 (0.0%) |
| $50,000 to $99,999 | 0 (0.0%) | 27 (100.0%) |
| $100,000 to $299,999 | 15 (100.0%) | 0 (0.0%) |
| $300,000 to $499,999 | 0 (0.0%) | 0 (0.0%) |
| $500,000 to $749,999 | 0 (0.0%) | 0 (0.0%) |
| $750,000 to $999,999 | 0 (0.0%) | 0 (0.0%) |
| $1,000,000 or more | 0 (0.0%) | 0 (0.0%) |
| Total | 15 (100.0%) | 27 (100.0%) |
Household Income by Mortgage Status in Pulaski
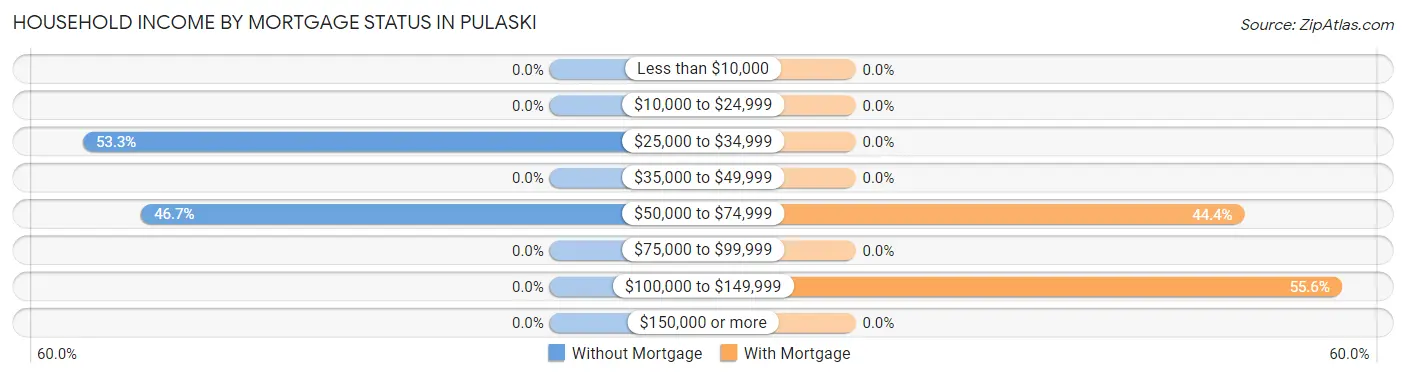
| Household Income | Without Mortgage | With Mortgage |
| Less than $10,000 | 0 (0.0%) | 0 (0.0%) |
| $10,000 to $24,999 | 0 (0.0%) | 0 (0.0%) |
| $25,000 to $34,999 | 8 (53.3%) | 0 (0.0%) |
| $35,000 to $49,999 | 0 (0.0%) | 0 (0.0%) |
| $50,000 to $74,999 | 7 (46.7%) | 12 (44.4%) |
| $75,000 to $99,999 | 0 (0.0%) | 0 (0.0%) |
| $100,000 to $149,999 | 0 (0.0%) | 15 (55.6%) |
| $150,000 or more | 0 (0.0%) | 0 (0.0%) |
| Total | 15 (100.0%) | 27 (100.0%) |
Property Value to Household Income Ratio in Pulaski
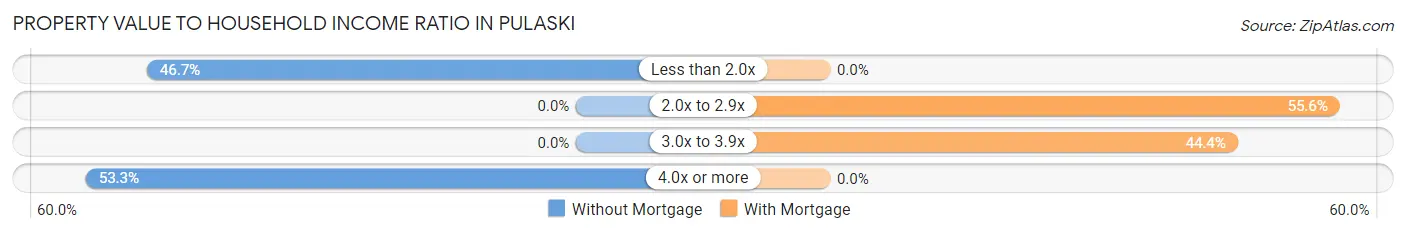
| Value-to-Income Ratio | Without Mortgage | With Mortgage |
| Less than 2.0x | 7 (46.7%) | 0 (0.0%) |
| 2.0x to 2.9x | 0 (0.0%) | 15 (55.6%) |
| 3.0x to 3.9x | 0 (0.0%) | 12 (44.4%) |
| 4.0x or more | 8 (53.3%) | 0 (0.0%) |
| Total | 15 (100.0%) | 27 (100.0%) |
Real Estate Taxes by Mortgage Status in Pulaski
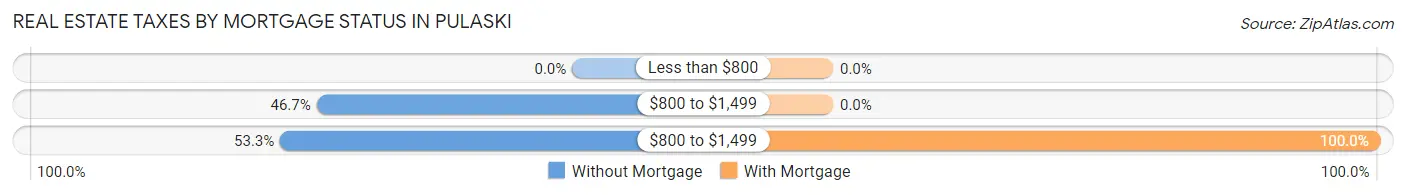
| Property Taxes | Without Mortgage | With Mortgage |
| Less than $800 | 0 (0.0%) | 0 (0.0%) |
| $800 to $1,499 | 7 (46.7%) | 0 (0.0%) |
| $800 to $1,499 | 8 (53.3%) | 27 (100.0%) |
| Total | 15 (100.0%) | 27 (100.0%) |
Health & Disability in Pulaski
Health Insurance Coverage by Age in Pulaski
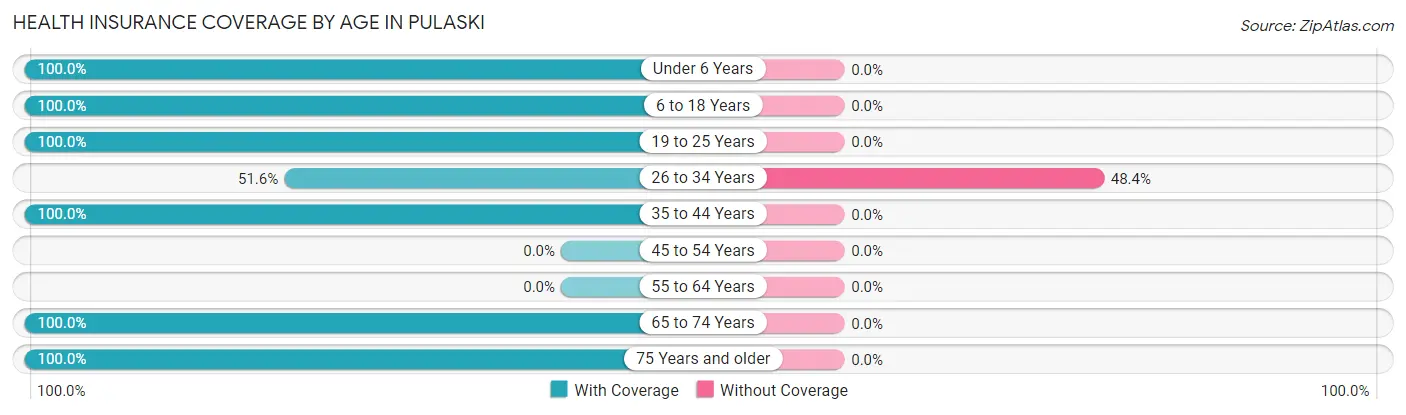
| Age Bracket | With Coverage | Without Coverage |
| Under 6 Years | 15 (100.0%) | 0 (0.0%) |
| 6 to 18 Years | 22 (100.0%) | 0 (0.0%) |
| 19 to 25 Years | 11 (100.0%) | 0 (0.0%) |
| 26 to 34 Years | 16 (51.6%) | 15 (48.4%) |
| 35 to 44 Years | 12 (100.0%) | 0 (0.0%) |
| 45 to 54 Years | 0 (0.0%) | 0 (0.0%) |
| 55 to 64 Years | 0 (0.0%) | 0 (0.0%) |
| 65 to 74 Years | 8 (100.0%) | 0 (0.0%) |
| 75 Years and older | 15 (100.0%) | 0 (0.0%) |
| Total | 99 (86.8%) | 15 (13.2%) |
Health Insurance Coverage by Citizenship Status in Pulaski
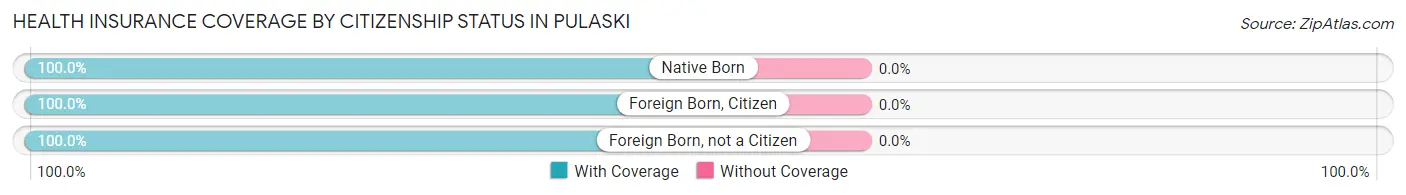
| Citizenship Status | With Coverage | Without Coverage |
| Native Born | 15 (100.0%) | 0 (0.0%) |
| Foreign Born, Citizen | 22 (100.0%) | 0 (0.0%) |
| Foreign Born, not a Citizen | 11 (100.0%) | 0 (0.0%) |
Health Insurance Coverage by Household Income in Pulaski
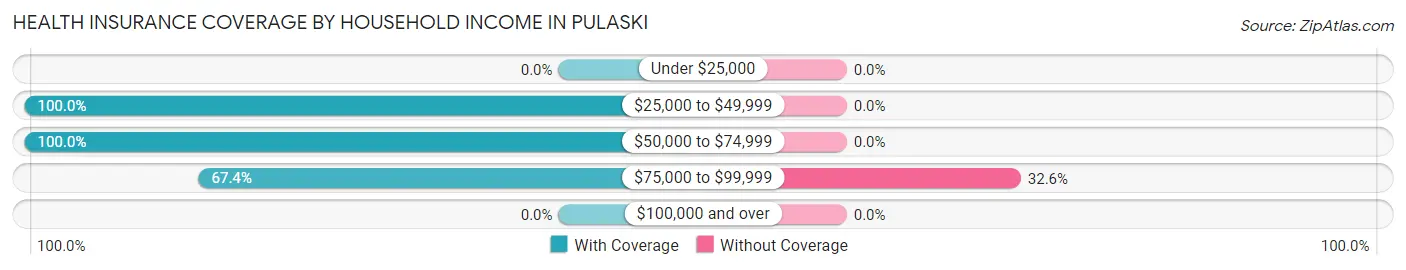
| Household Income | With Coverage | Without Coverage |
| Under $25,000 | 0 (0.0%) | 0 (0.0%) |
| $25,000 to $49,999 | 53 (100.0%) | 0 (0.0%) |
| $50,000 to $74,999 | 15 (100.0%) | 0 (0.0%) |
| $75,000 to $99,999 | 31 (67.4%) | 15 (32.6%) |
| $100,000 and over | 0 (0.0%) | 0 (0.0%) |
Public vs Private Health Insurance Coverage by Age in Pulaski
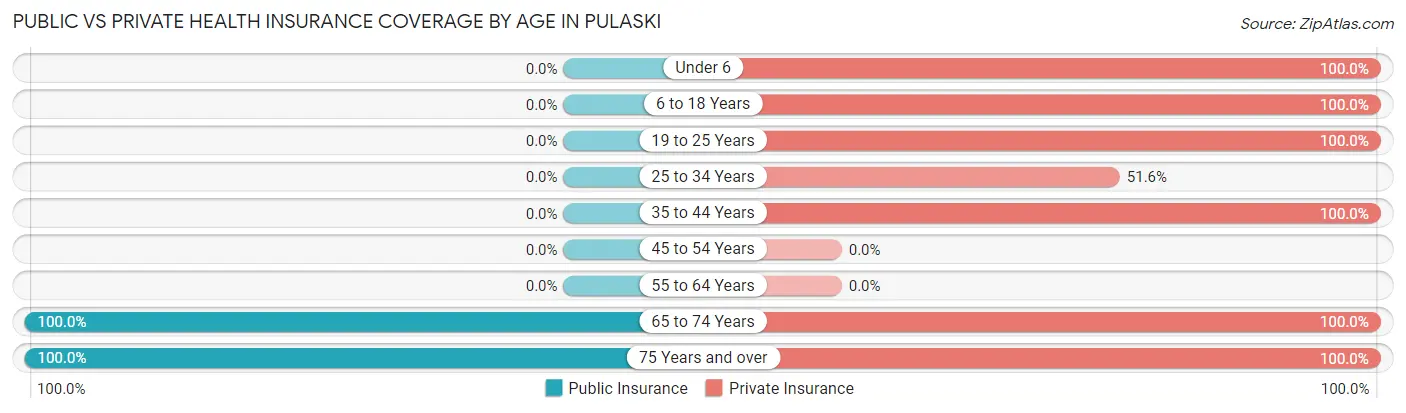
| Age Bracket | Public Insurance | Private Insurance |
| Under 6 | 0 (0.0%) | 15 (100.0%) |
| 6 to 18 Years | 0 (0.0%) | 22 (100.0%) |
| 19 to 25 Years | 0 (0.0%) | 11 (100.0%) |
| 25 to 34 Years | 0 (0.0%) | 16 (51.6%) |
| 35 to 44 Years | 0 (0.0%) | 12 (100.0%) |
| 45 to 54 Years | 0 (0.0%) | 0 (0.0%) |
| 55 to 64 Years | 0 (0.0%) | 0 (0.0%) |
| 65 to 74 Years | 8 (100.0%) | 8 (100.0%) |
| 75 Years and over | 15 (100.0%) | 15 (100.0%) |
| Total | 23 (20.2%) | 99 (86.8%) |
Disability Status by Sex by Age in Pulaski
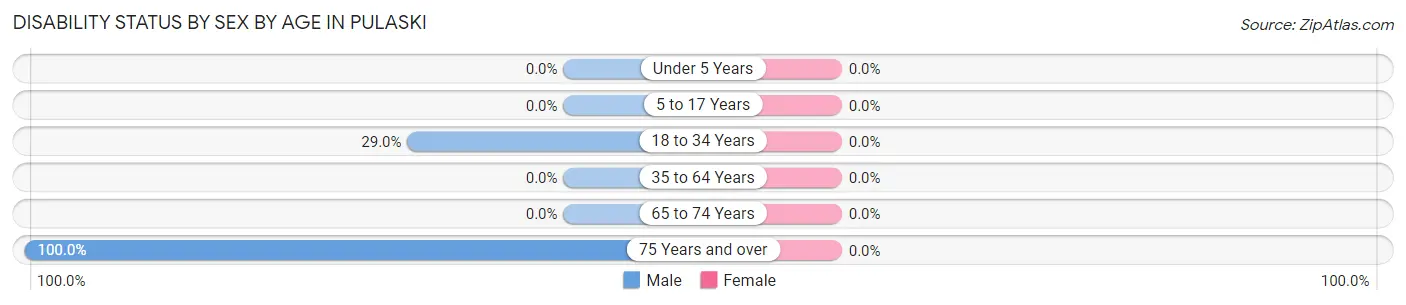
| Age Bracket | Male | Female |
| Under 5 Years | 0 (0.0%) | 0 (0.0%) |
| 5 to 17 Years | 0 (0.0%) | 0 (0.0%) |
| 18 to 34 Years | 11 (28.9%) | 0 (0.0%) |
| 35 to 64 Years | 0 (0.0%) | 0 (0.0%) |
| 65 to 74 Years | 0 (0.0%) | 0 (0.0%) |
| 75 Years and over | 7 (100.0%) | 0 (0.0%) |
Disability Class by Sex by Age in Pulaski
Disability Class: Hearing Difficulty
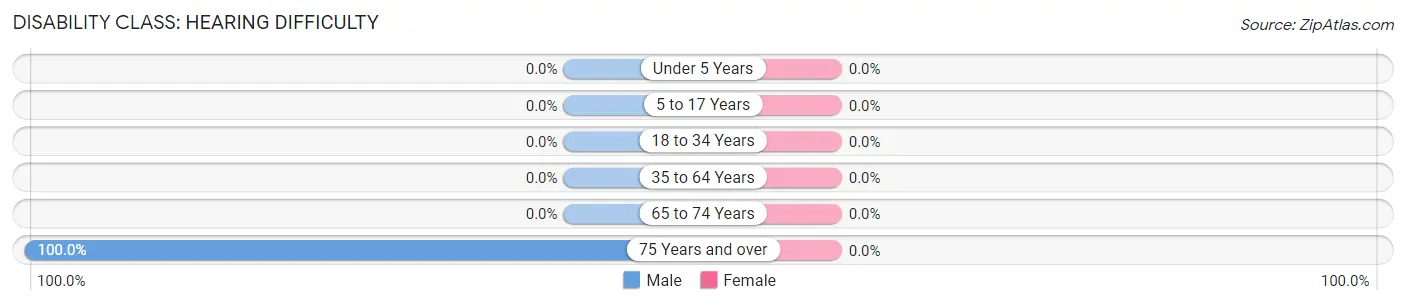
| Age Bracket | Male | Female |
| Under 5 Years | 0 (0.0%) | 0 (0.0%) |
| 5 to 17 Years | 0 (0.0%) | 0 (0.0%) |
| 18 to 34 Years | 0 (0.0%) | 0 (0.0%) |
| 35 to 64 Years | 0 (0.0%) | 0 (0.0%) |
| 65 to 74 Years | 0 (0.0%) | 0 (0.0%) |
| 75 Years and over | 7 (100.0%) | 0 (0.0%) |
Disability Class: Vision Difficulty
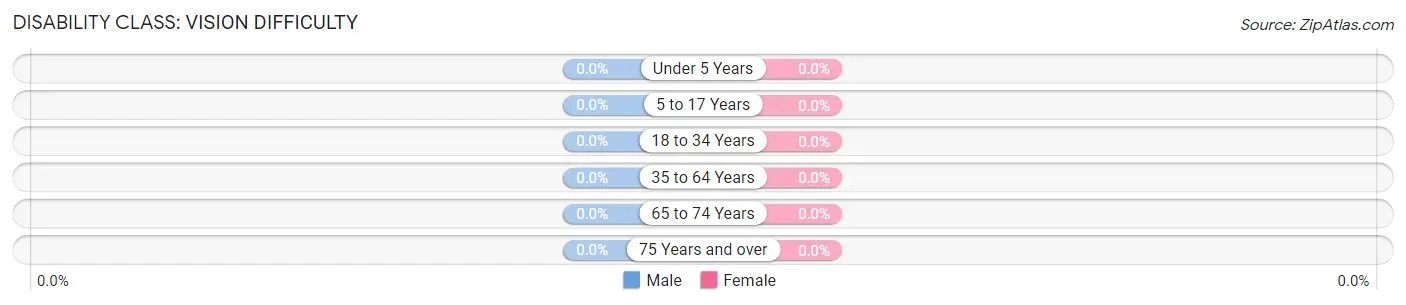
| Age Bracket | Male | Female |
| Under 5 Years | 0 (0.0%) | 0 (0.0%) |
| 5 to 17 Years | 0 (0.0%) | 0 (0.0%) |
| 18 to 34 Years | 0 (0.0%) | 0 (0.0%) |
| 35 to 64 Years | 0 (0.0%) | 0 (0.0%) |
| 65 to 74 Years | 0 (0.0%) | 0 (0.0%) |
| 75 Years and over | 0 (0.0%) | 0 (0.0%) |
Disability Class: Cognitive Difficulty
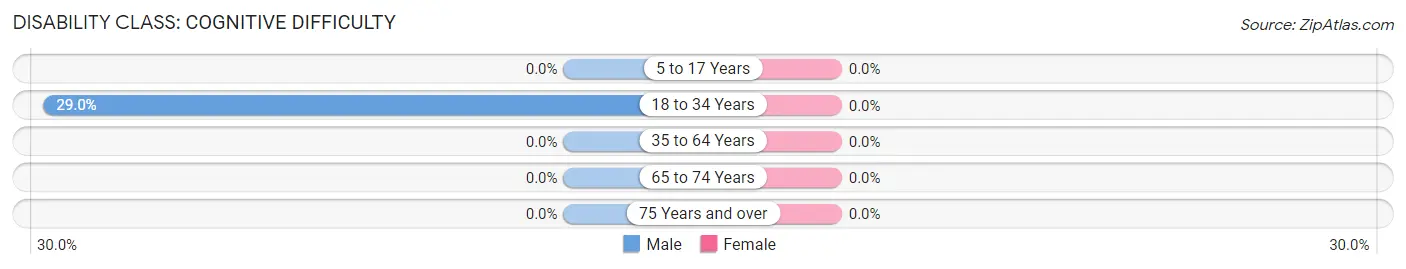
| Age Bracket | Male | Female |
| 5 to 17 Years | 0 (0.0%) | 0 (0.0%) |
| 18 to 34 Years | 11 (28.9%) | 0 (0.0%) |
| 35 to 64 Years | 0 (0.0%) | 0 (0.0%) |
| 65 to 74 Years | 0 (0.0%) | 0 (0.0%) |
| 75 Years and over | 0 (0.0%) | 0 (0.0%) |
Disability Class: Ambulatory Difficulty
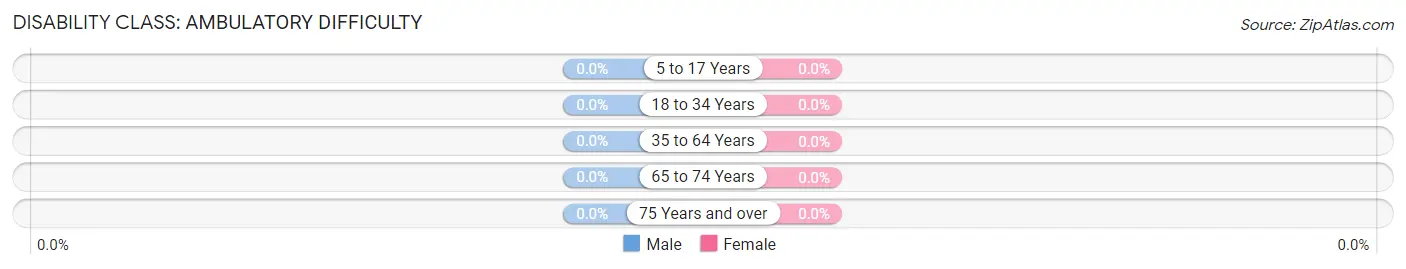
| Age Bracket | Male | Female |
| 5 to 17 Years | 0 (0.0%) | 0 (0.0%) |
| 18 to 34 Years | 0 (0.0%) | 0 (0.0%) |
| 35 to 64 Years | 0 (0.0%) | 0 (0.0%) |
| 65 to 74 Years | 0 (0.0%) | 0 (0.0%) |
| 75 Years and over | 0 (0.0%) | 0 (0.0%) |
Disability Class: Self-Care Difficulty
| Age Bracket | Male | Female |
| 5 to 17 Years | 0 (0.0%) | 0 (0.0%) |
| 18 to 34 Years | 0 (0.0%) | 0 (0.0%) |
| 35 to 64 Years | 0 (0.0%) | 0 (0.0%) |
| 65 to 74 Years | 0 (0.0%) | 0 (0.0%) |
| 75 Years and over | 0 (0.0%) | 0 (0.0%) |
Technology Access in Pulaski
Computing Device Access in Pulaski
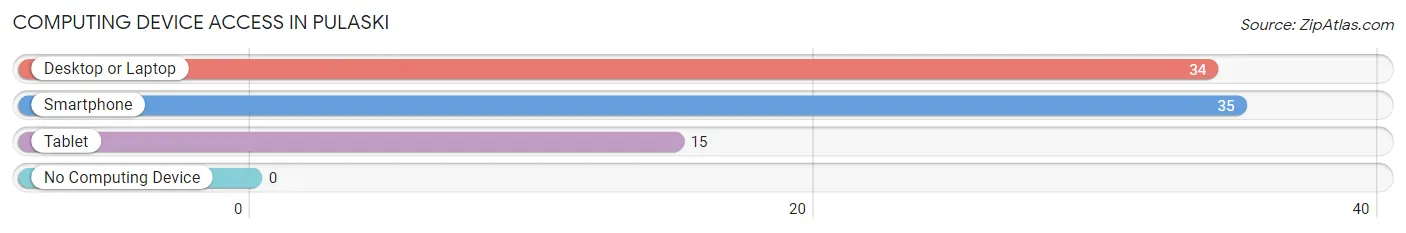
| Device Type | # Households | % Households |
| Desktop or Laptop | 34 | 80.9% |
| Smartphone | 35 | 83.3% |
| Tablet | 15 | 35.7% |
| No Computing Device | 0 | 0.0% |
| Total | 42 | 100.0% |
Internet Access in Pulaski
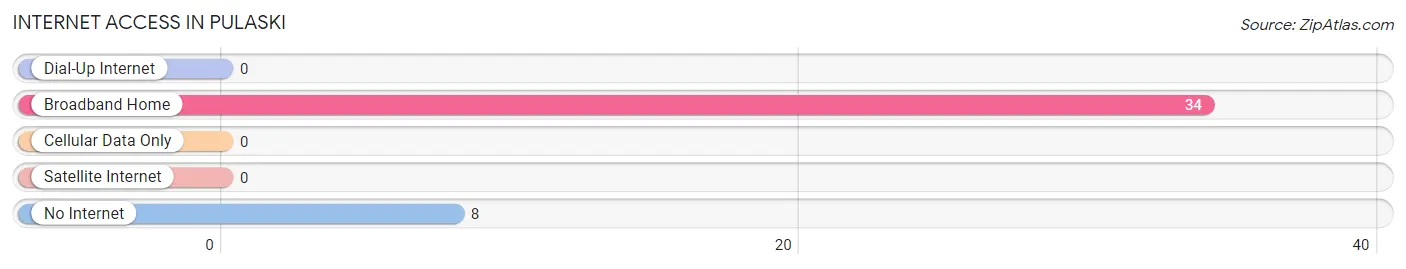
| Internet Type | # Households | % Households |
| Dial-Up Internet | 0 | 0.0% |
| Broadband Home | 34 | 80.9% |
| Cellular Data Only | 0 | 0.0% |
| Satellite Internet | 0 | 0.0% |
| No Internet | 8 | 19.1% |
| Total | 42 | 100.0% |
Pulaski Summary
Pulaski is a small village located in the state of Ohio, in the United States. It is situated in the southeastern part of the state, in Lawrence County. The village has a population of approximately 1,000 people, and is part of the larger metropolitan area of Columbus.
History
Pulaski was founded in 1817 by a group of settlers from Poland. The village was named after the Polish hero, Casimir Pulaski. The settlers were attracted to the area due to its fertile soil and abundant natural resources. The village quickly grew and became a thriving agricultural community.
In the late 19th century, the village began to experience a period of industrialization. The first industry to be established in Pulaski was a sawmill, which was built in 1883. This was followed by a brickyard, a flour mill, and a furniture factory. These industries provided employment for many of the villagers, and helped to further develop the local economy.
Geography
Pulaski is located in the southeastern part of Ohio, in Lawrence County. The village is situated on the banks of the Ohio River, and is surrounded by rolling hills and forests. The climate in Pulaski is humid continental, with hot summers and cold winters.
Economy
The economy of Pulaski is largely based on agriculture. The village is home to several farms, which produce a variety of crops, including corn, soybeans, and wheat. The village also has a number of small businesses, including restaurants, shops, and service providers.
Demographics
As of the 2010 census, the population of Pulaski was 1,000. The racial makeup of the village was 97.2% White, 0.7% African American, 0.2% Native American, 0.2% Asian, and 1.7% from other races. The median household income was $37,500, and the median age was 40.
Conclusion
Pulaski is a small village located in the southeastern part of Ohio. It was founded in 1817 by a group of settlers from Poland, and has since grown into a thriving agricultural community. The village has a population of approximately 1,000 people, and is home to several farms and small businesses. The economy of Pulaski is largely based on agriculture, and the racial makeup of the village is predominantly White.
Common Questions
What is Per Capita Income in Pulaski?
Per Capita income in Pulaski is $20,539.
What is the Median Family Income in Pulaski?
Median Family Income in Pulaski is $40,417.
What is the Median Household income in Pulaski?
Median Household Income in Pulaski is $55,357.
What is Inequality or Gini Index in Pulaski?
Inequality or Gini Index in Pulaski is 0.19.
What is the Total Population of Pulaski?
Total Population of Pulaski is 114.
What is the Total Male Population of Pulaski?
Total Male Population of Pulaski is 78.
What is the Total Female Population of Pulaski?
Total Female Population of Pulaski is 36.
What is the Ratio of Males per 100 Females in Pulaski?
There are 216.67 Males per 100 Females in Pulaski.
What is the Ratio of Females per 100 Males in Pulaski?
There are 46.15 Females per 100 Males in Pulaski.
What is the Median Population Age in Pulaski?
Median Population Age in Pulaski is 26.6 Years.
What is the Average Family Size in Pulaski
Average Family Size in Pulaski is 2.6 People.
What is the Average Household Size in Pulaski
Average Household Size in Pulaski is 2.7 People.
How Large is the Labor Force in Pulaski?
There are 54 People in the Labor Forcein in Pulaski.
What is the Percentage of People in the Labor Force in Pulaski?
54.5% of People are in the Labor Force in Pulaski.
What is the Unemployment Rate in Pulaski?
Unemployment Rate in Pulaski is 20.4%.