Whites Landing, OH Map & Demographics
Whites Landing Map
Whites Landing Overview
$12,789
PER CAPITA INCOME
$36,734
AVG FAMILY INCOME
$31,023
AVG HOUSEHOLD INCOME
39.6%
WAGE / INCOME GAP [ % ]
60.4¢/ $1
WAGE / INCOME GAP [ $ ]
0.50
INEQUALITY / GINI INDEX
384
TOTAL POPULATION
186
MALE POPULATION
198
FEMALE POPULATION
93.94
MALES / 100 FEMALES
106.45
FEMALES / 100 MALES
23.8
MEDIAN AGE
2.9
AVG FAMILY SIZE
2.2
AVG HOUSEHOLD SIZE
192
LABOR FORCE [ PEOPLE ]
52.9%
PERCENT IN LABOR FORCE
36.5%
UNEMPLOYMENT RATE
Income in Whites Landing
Income Overview in Whites Landing
Per Capita Income in Whites Landing is $12,789, while median incomes of families and households are $36,734 and $31,023 respectively.
| Characteristic | Number | Measure |
| Per Capita Income | 384 | $12,789 |
| Median Family Income | 87 | $36,734 |
| Mean Family Income | 87 | $47,980 |
| Median Household Income | 176 | $31,023 |
| Mean Household Income | 176 | $27,847 |
| Income Deficit | 87 | $0 |
| Wage / Income Gap (%) | 384 | 39.57% |
| Wage / Income Gap ($) | 384 | 60.43¢ per $1 |
| Gini / Inequality Index | 384 | 0.50 |
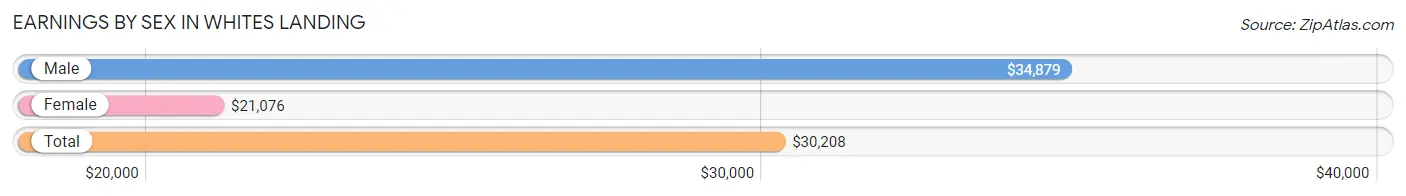
Earnings by Sex in Whites Landing
Average Earnings in Whites Landing are $30,208, $34,879 for men and $21,076 for women, a difference of 39.6%.
| Sex | Number | Average Earnings |
| Male | 59 (38.3%) | $34,879 |
| Female | 95 (61.7%) | $21,076 |
| Total | 154 (100.0%) | $30,208 |
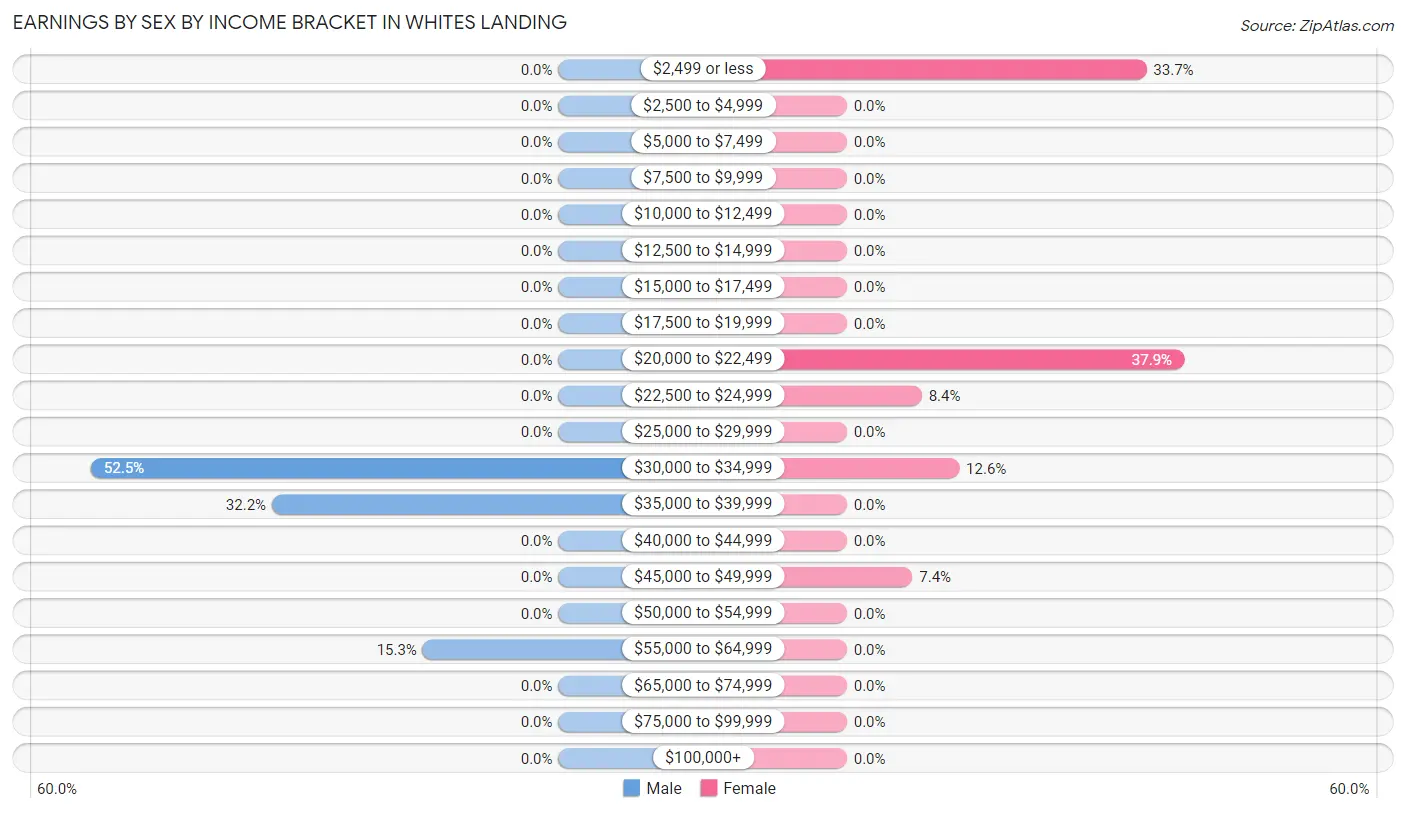
Earnings by Sex by Income Bracket in Whites Landing
The most common earnings brackets in Whites Landing are $30,000 to $34,999 for men (31 | 52.5%) and $20,000 to $22,499 for women (36 | 37.9%).
| Income | Male | Female |
| $2,499 or less | 0 (0.0%) | 32 (33.7%) |
| $2,500 to $4,999 | 0 (0.0%) | 0 (0.0%) |
| $5,000 to $7,499 | 0 (0.0%) | 0 (0.0%) |
| $7,500 to $9,999 | 0 (0.0%) | 0 (0.0%) |
| $10,000 to $12,499 | 0 (0.0%) | 0 (0.0%) |
| $12,500 to $14,999 | 0 (0.0%) | 0 (0.0%) |
| $15,000 to $17,499 | 0 (0.0%) | 0 (0.0%) |
| $17,500 to $19,999 | 0 (0.0%) | 0 (0.0%) |
| $20,000 to $22,499 | 0 (0.0%) | 36 (37.9%) |
| $22,500 to $24,999 | 0 (0.0%) | 8 (8.4%) |
| $25,000 to $29,999 | 0 (0.0%) | 0 (0.0%) |
| $30,000 to $34,999 | 31 (52.5%) | 12 (12.6%) |
| $35,000 to $39,999 | 19 (32.2%) | 0 (0.0%) |
| $40,000 to $44,999 | 0 (0.0%) | 0 (0.0%) |
| $45,000 to $49,999 | 0 (0.0%) | 7 (7.4%) |
| $50,000 to $54,999 | 0 (0.0%) | 0 (0.0%) |
| $55,000 to $64,999 | 9 (15.2%) | 0 (0.0%) |
| $65,000 to $74,999 | 0 (0.0%) | 0 (0.0%) |
| $75,000 to $99,999 | 0 (0.0%) | 0 (0.0%) |
| $100,000+ | 0 (0.0%) | 0 (0.0%) |
| Total | 59 (100.0%) | 95 (100.0%) |
Earnings by Sex by Educational Attainment in Whites Landing
| Educational Attainment | Male Income | Female Income |
| Less than High School | - | - |
| High School Diploma | - | - |
| College or Associate's Degree | - | - |
| Bachelor's Degree | - | - |
| Graduate Degree | - | - |
| Total | $38,750 | $0 |
Family Income in Whites Landing
Family Income Brackets in Whites Landing
According to the Whites Landing family income data, there are 31 families falling into the $35,000 to $49,999 income range, which is the most common income bracket and makes up 35.6% of all families.
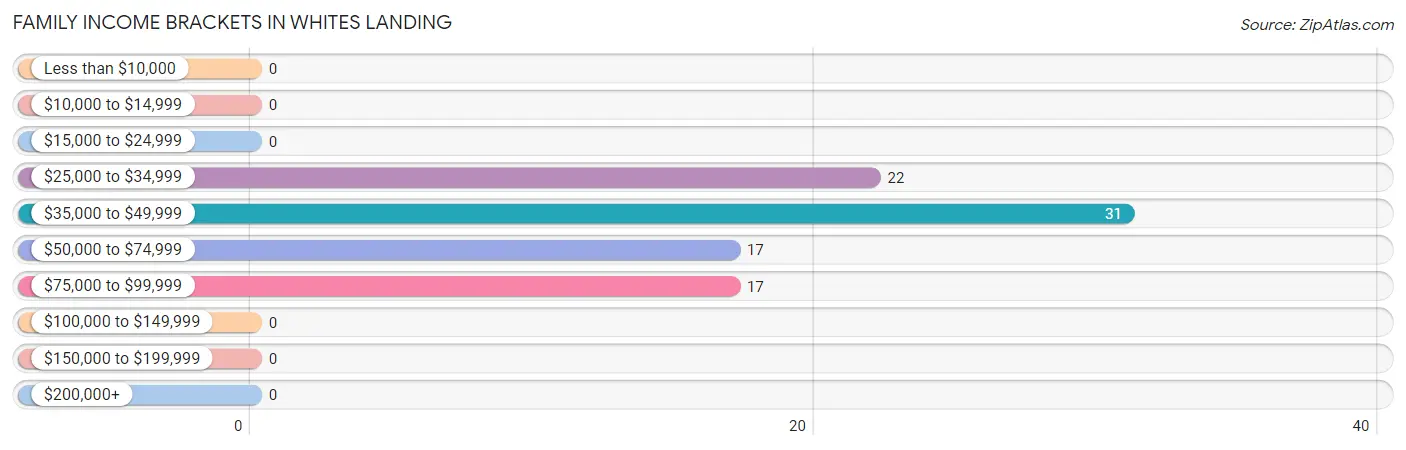
| Income Bracket | # Families | % Families |
| Less than $10,000 | 0 | 0.0% |
| $10,000 to $14,999 | 0 | 0.0% |
| $15,000 to $24,999 | 0 | 0.0% |
| $25,000 to $34,999 | 22 | 25.3% |
| $35,000 to $49,999 | 31 | 35.6% |
| $50,000 to $74,999 | 17 | 19.5% |
| $75,000 to $99,999 | 17 | 19.5% |
| $100,000 to $149,999 | 0 | 0.0% |
| $150,000 to $199,999 | 0 | 0.0% |
| $200,000+ | 0 | 0.0% |
Family Income by Famaliy Size in Whites Landing
2-person families (60 | 69.0%) account for the highest median family income in Whites Landing with $37,419 per family, while 2-person families (60 | 69.0%) have the highest median income of $18,710 per family member.
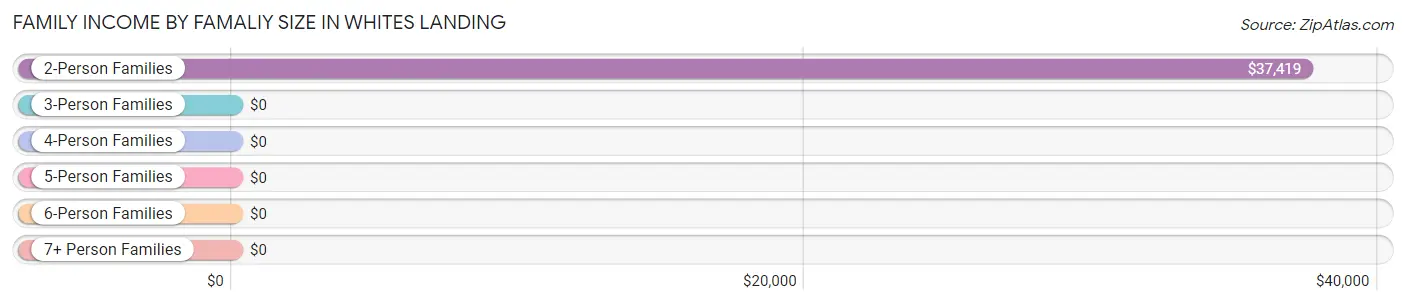
| Income Bracket | # Families | Median Income |
| 2-Person Families | 60 (69.0%) | $37,419 |
| 3-Person Families | 0 (0.0%) | $0 |
| 4-Person Families | 22 (25.3%) | $0 |
| 5-Person Families | 5 (5.8%) | $0 |
| 6-Person Families | 0 (0.0%) | $0 |
| 7+ Person Families | 0 (0.0%) | $0 |
| Total | 87 (100.0%) | $36,734 |
Family Income by Number of Earners in Whites Landing
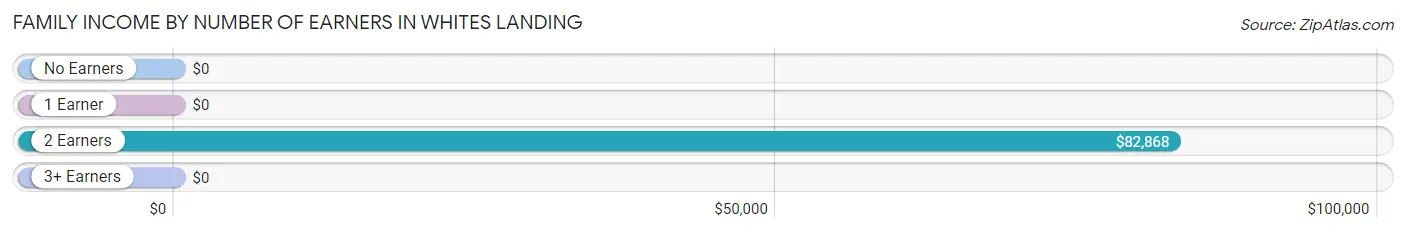
| Number of Earners | # Families | Median Income |
| No Earners | 5 (5.8%) | $0 |
| 1 Earner | 53 (60.9%) | $0 |
| 2 Earners | 29 (33.3%) | $82,868 |
| 3+ Earners | 0 (0.0%) | $0 |
| Total | 87 (100.0%) | $36,734 |
Household Income in Whites Landing
Household Income Brackets in Whites Landing
With 63 households falling in the category, the less than $10,000 income range is the most frequent in Whites Landing, accounting for 35.8% of all households.
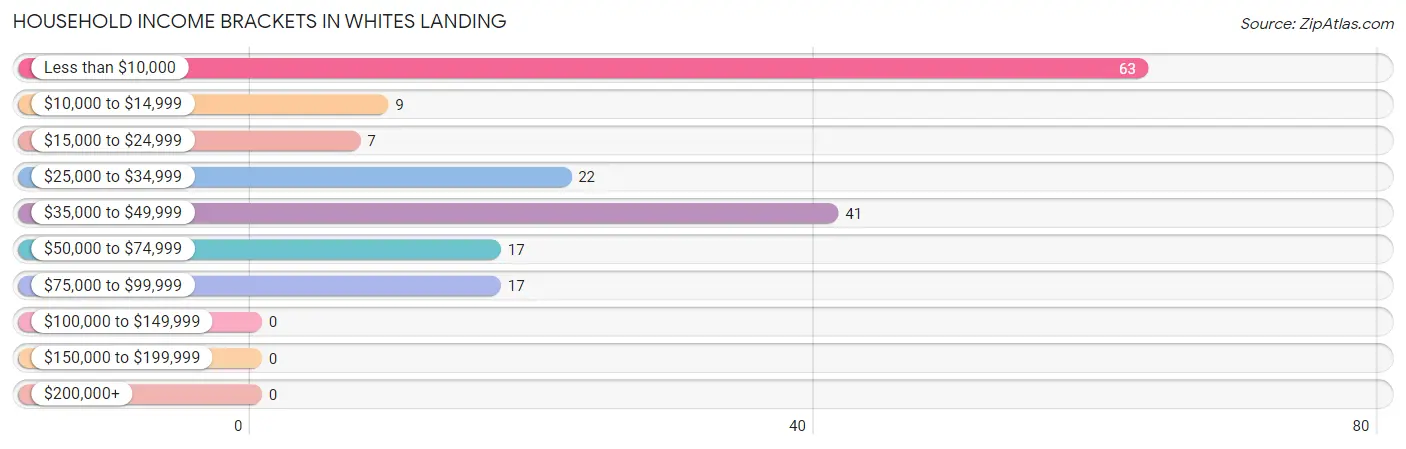
| Income Bracket | # Households | % Households |
| Less than $10,000 | 63 | 35.8% |
| $10,000 to $14,999 | 9 | 5.1% |
| $15,000 to $24,999 | 7 | 4.0% |
| $25,000 to $34,999 | 22 | 12.5% |
| $35,000 to $49,999 | 41 | 23.3% |
| $50,000 to $74,999 | 17 | 9.7% |
| $75,000 to $99,999 | 17 | 9.7% |
| $100,000 to $149,999 | 0 | 0.0% |
| $150,000 to $199,999 | 0 | 0.0% |
| $200,000+ | 0 | 0.0% |
Household Income by Householder Age in Whites Landing
The median household income in Whites Landing is $31,023, with the highest median household income of $2,499 found in the 65+ years age bracket for the primary householder. A total of 43 households (24.4%) fall into this category. Meanwhile, the 15 to 24 years age bracket for the primary householder has the lowest median household income of $0, with 31 households (17.6%) in this group.
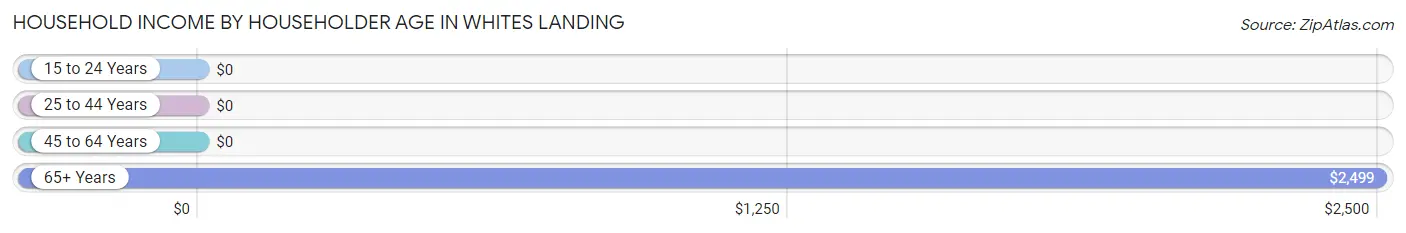
| Income Bracket | # Households | Median Income |
| 15 to 24 Years | 31 (17.6%) | $0 |
| 25 to 44 Years | 0 (0.0%) | $0 |
| 45 to 64 Years | 102 (58.0%) | $0 |
| 65+ Years | 43 (24.4%) | $2,499 |
| Total | 176 (100.0%) | $31,023 |
Poverty in Whites Landing
Income Below Poverty by Sex and Age in Whites Landing
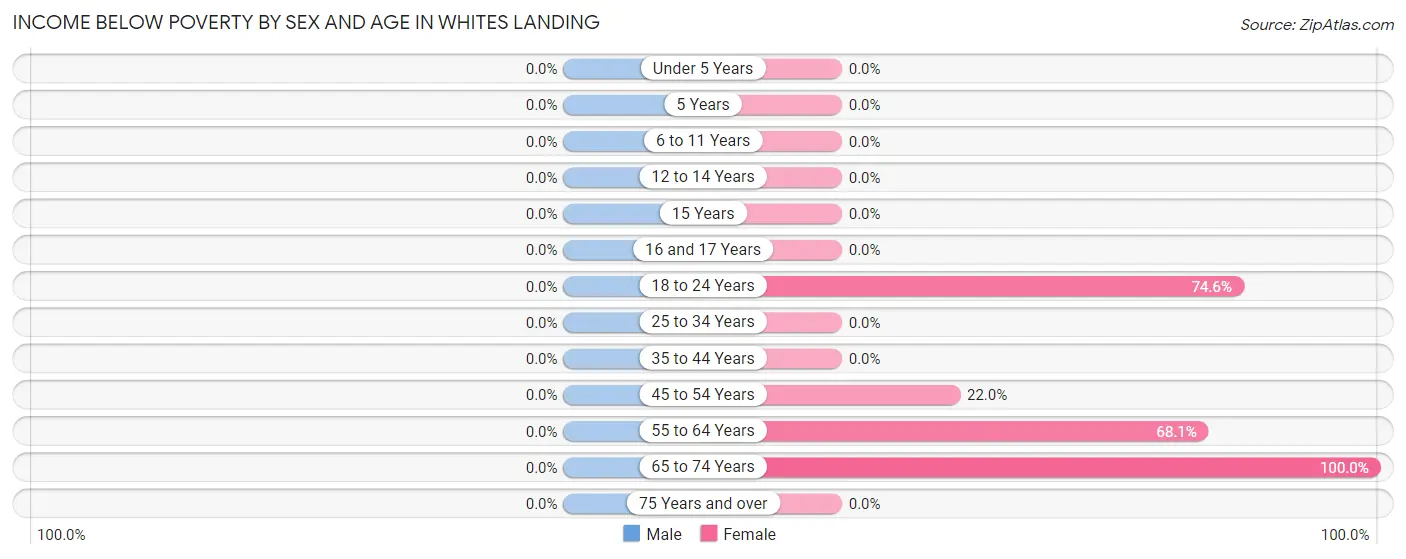
| Age Bracket | Male | Female |
| Under 5 Years | 0 (0.0%) | 0 (0.0%) |
| 5 Years | 0 (0.0%) | 0 (0.0%) |
| 6 to 11 Years | 0 (0.0%) | 0 (0.0%) |
| 12 to 14 Years | 0 (0.0%) | 0 (0.0%) |
| 15 Years | 0 (0.0%) | 0 (0.0%) |
| 16 and 17 Years | 0 (0.0%) | 0 (0.0%) |
| 18 to 24 Years | 0 (0.0%) | 47 (74.6%) |
| 25 to 34 Years | 0 (0.0%) | 0 (0.0%) |
| 35 to 44 Years | 0 (0.0%) | 0 (0.0%) |
| 45 to 54 Years | 0 (0.0%) | 9 (22.0%) |
| 55 to 64 Years | 0 (0.0%) | 32 (68.1%) |
| 65 to 74 Years | 0 (0.0%) | 31 (100.0%) |
| 75 Years and over | 0 (0.0%) | 0 (0.0%) |
| Total | 0 (0.0%) | 119 (60.1%) |
Income Above Poverty by Sex and Age in Whites Landing
According to the poverty statistics in Whites Landing, males aged under 5 years and females aged 6 to 11 years are the age groups that are most secure financially, with 100.0% of males and 100.0% of females in these age groups living above the poverty line.
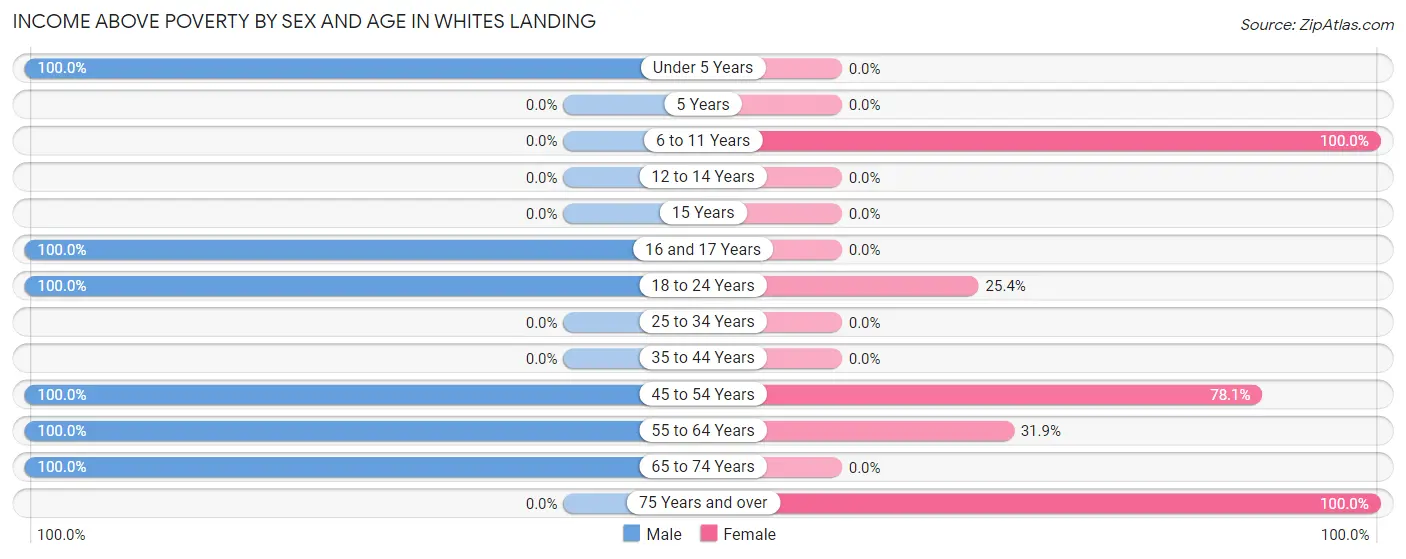
| Age Bracket | Male | Female |
| Under 5 Years | 17 (100.0%) | 0 (0.0%) |
| 5 Years | 0 (0.0%) | 0 (0.0%) |
| 6 to 11 Years | 0 (0.0%) | 4 (100.0%) |
| 12 to 14 Years | 0 (0.0%) | 0 (0.0%) |
| 15 Years | 0 (0.0%) | 0 (0.0%) |
| 16 and 17 Years | 6 (100.0%) | 0 (0.0%) |
| 18 to 24 Years | 108 (100.0%) | 16 (25.4%) |
| 25 to 34 Years | 0 (0.0%) | 0 (0.0%) |
| 35 to 44 Years | 0 (0.0%) | 0 (0.0%) |
| 45 to 54 Years | 22 (100.0%) | 32 (78.0%) |
| 55 to 64 Years | 28 (100.0%) | 15 (31.9%) |
| 65 to 74 Years | 5 (100.0%) | 0 (0.0%) |
| 75 Years and over | 0 (0.0%) | 12 (100.0%) |
| Total | 186 (100.0%) | 79 (39.9%) |
Income Below Poverty Among Married-Couple Families in Whites Landing
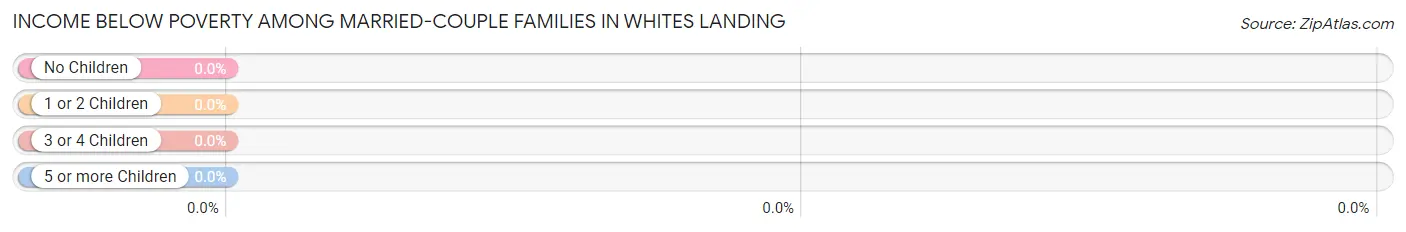
| Children | Above Poverty | Below Poverty |
| No Children | 39 (100.0%) | 0 (0.0%) |
| 1 or 2 Children | 5 (100.0%) | 0 (0.0%) |
| 3 or 4 Children | 0 (0.0%) | 0 (0.0%) |
| 5 or more Children | 0 (0.0%) | 0 (0.0%) |
| Total | 44 (100.0%) | 0 (0.0%) |
Income Below Poverty Among Single-Parent Households in Whites Landing
| Children | Single Father | Single Mother |
| No Children | 0 (0.0%) | 0 (0.0%) |
| 1 or 2 Children | 0 (0.0%) | 0 (0.0%) |
| 3 or 4 Children | 0 (0.0%) | 0 (0.0%) |
| 5 or more Children | 0 (0.0%) | 0 (0.0%) |
| Total | 0 (0.0%) | 0 (0.0%) |
Income Below Poverty Among Married-Couple vs Single-Parent Households in Whites Landing
| Children | Married-Couple Families | Single-Parent Households |
| No Children | 0 (0.0%) | 0 (0.0%) |
| 1 or 2 Children | 0 (0.0%) | 0 (0.0%) |
| 3 or 4 Children | 0 (0.0%) | 0 (0.0%) |
| 5 or more Children | 0 (0.0%) | 0 (0.0%) |
| Total | 0 (0.0%) | 0 (0.0%) |
Race in Whites Landing
The most populous races in Whites Landing are , and White / Caucasian (384 | 100.0%).
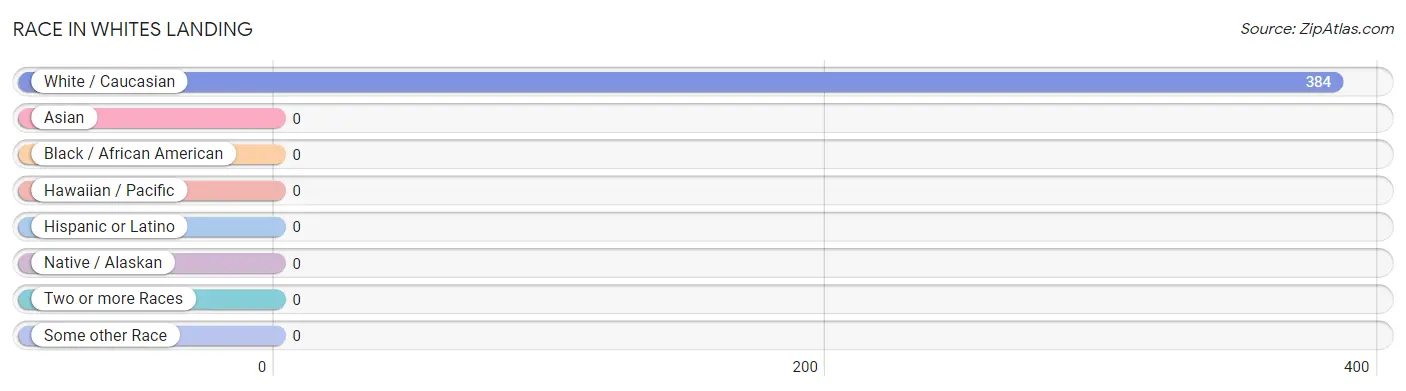
| Race | # Population | % Population |
| Asian | 0 | 0.0% |
| Black / African American | 0 | 0.0% |
| Hawaiian / Pacific | 0 | 0.0% |
| Hispanic or Latino | 0 | 0.0% |
| Native / Alaskan | 0 | 0.0% |
| White / Caucasian | 384 | 100.0% |
| Two or more Races | 0 | 0.0% |
| Some other Race | 0 | 0.0% |
| Total | 384 | 100.0% |
Ancestry in Whites Landing
The most populous ancestries reported in Whites Landing are Irish (200 | 52.1%), German (143 | 37.2%), English (9 | 2.3%), and Scottish (9 | 2.3%), together accounting for 94.0% of all Whites Landing residents.
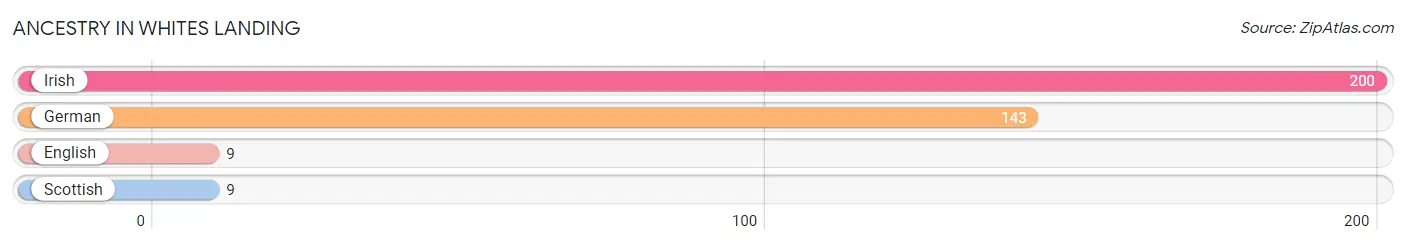
| Ancestry | # Population | % Population |
| English | 9 | 2.3% |
| German | 143 | 37.2% |
| Irish | 200 | 52.1% |
| Scottish | 9 | 2.3% | View All 4 Rows |
Immigrants in Whites Landing

| Immigration Origin | # Population | % Population | View All 0 Rows |
Sex and Age in Whites Landing
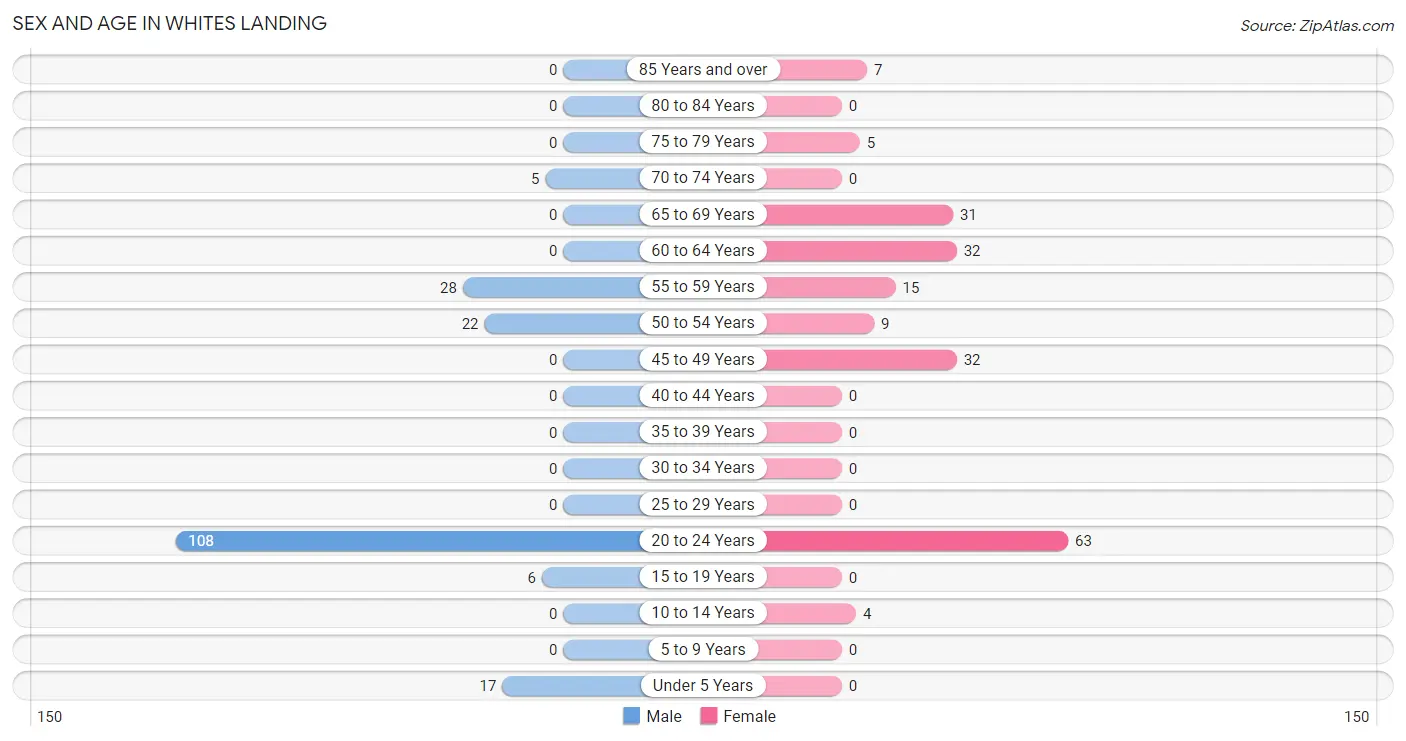
Sex and Age in Whites Landing
The most populous age groups in Whites Landing are 20 to 24 Years (108 | 58.1%) for men and 20 to 24 Years (63 | 31.8%) for women.
| Age Bracket | Male | Female |
| Under 5 Years | 17 (9.1%) | 0 (0.0%) |
| 5 to 9 Years | 0 (0.0%) | 0 (0.0%) |
| 10 to 14 Years | 0 (0.0%) | 4 (2.0%) |
| 15 to 19 Years | 6 (3.2%) | 0 (0.0%) |
| 20 to 24 Years | 108 (58.1%) | 63 (31.8%) |
| 25 to 29 Years | 0 (0.0%) | 0 (0.0%) |
| 30 to 34 Years | 0 (0.0%) | 0 (0.0%) |
| 35 to 39 Years | 0 (0.0%) | 0 (0.0%) |
| 40 to 44 Years | 0 (0.0%) | 0 (0.0%) |
| 45 to 49 Years | 0 (0.0%) | 32 (16.2%) |
| 50 to 54 Years | 22 (11.8%) | 9 (4.5%) |
| 55 to 59 Years | 28 (15.0%) | 15 (7.6%) |
| 60 to 64 Years | 0 (0.0%) | 32 (16.2%) |
| 65 to 69 Years | 0 (0.0%) | 31 (15.7%) |
| 70 to 74 Years | 5 (2.7%) | 0 (0.0%) |
| 75 to 79 Years | 0 (0.0%) | 5 (2.5%) |
| 80 to 84 Years | 0 (0.0%) | 0 (0.0%) |
| 85 Years and over | 0 (0.0%) | 7 (3.5%) |
| Total | 186 (100.0%) | 198 (100.0%) |
Families and Households in Whites Landing
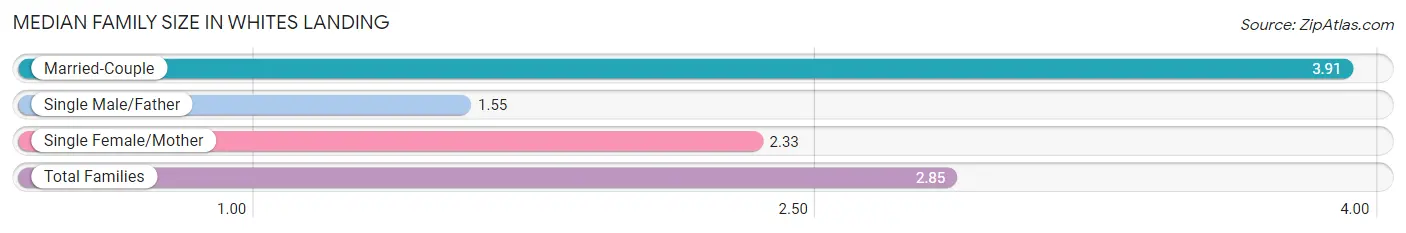
Median Family Size in Whites Landing
The median family size in Whites Landing is 2.85 persons per family, with married-couple families (44 | 50.6%) accounting for the largest median family size of 3.91 persons per family. On the other hand, single male/father families (31 | 35.6%) represent the smallest median family size with 1.55 persons per family.
| Family Type | # Families | Family Size |
| Married-Couple | 44 (50.6%) | 3.91 |
| Single Male/Father | 31 (35.6%) | 1.55 |
| Single Female/Mother | 12 (13.8%) | 2.33 |
| Total Families | 87 (100.0%) | 2.85 |
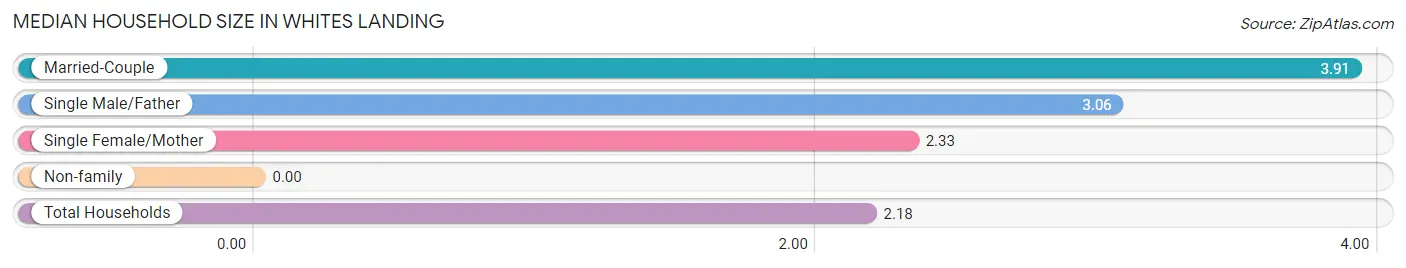
Median Household Size in Whites Landing
| Household Type | # Households | Household Size |
| Married-Couple | 44 (25.0%) | 3.91 |
| Single Male/Father | 31 (17.6%) | 3.06 |
| Single Female/Mother | 12 (6.8%) | 2.33 |
| Non-family | 89 (50.6%) | - |
| Total Households | 176 (100.0%) | 2.18 |
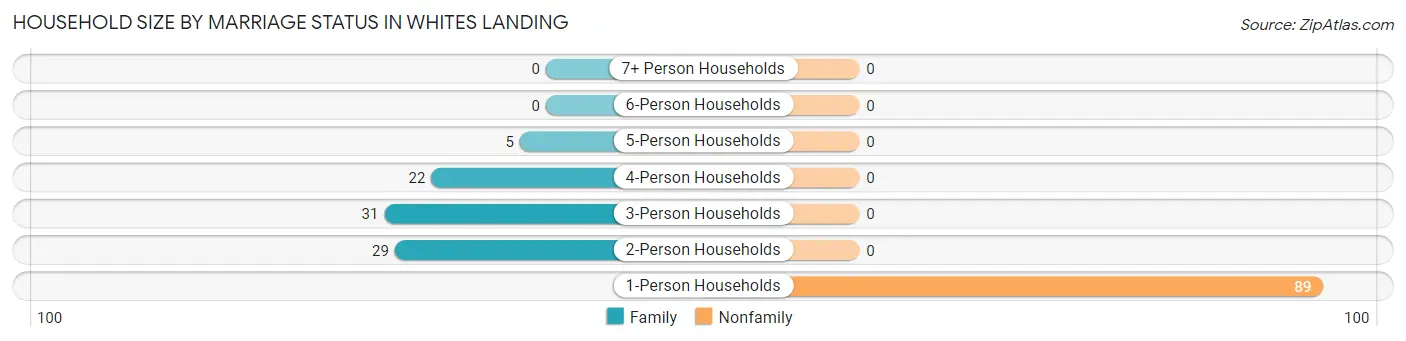
Household Size by Marriage Status in Whites Landing
Out of a total of 176 households in Whites Landing, 87 (49.4%) are family households, while 89 (50.6%) are nonfamily households. The most numerous type of family households are 3-person households, comprising 31, and the most common type of nonfamily households are 1-person households, comprising 89.
| Household Size | Family Households | Nonfamily Households |
| 1-Person Households | - | 89 (50.6%) |
| 2-Person Households | 29 (16.5%) | 0 (0.0%) |
| 3-Person Households | 31 (17.6%) | 0 (0.0%) |
| 4-Person Households | 22 (12.5%) | 0 (0.0%) |
| 5-Person Households | 5 (2.8%) | 0 (0.0%) |
| 6-Person Households | 0 (0.0%) | 0 (0.0%) |
| 7+ Person Households | 0 (0.0%) | 0 (0.0%) |
| Total | 87 (49.4%) | 89 (50.6%) |
Female Fertility in Whites Landing
Fertility by Age in Whites Landing
| Age Bracket | Women with Births | Births / 1,000 Women |
| 15 to 19 years | 0 (0.0%) | 0.0 |
| 20 to 34 years | 0 (0.0%) | 0.0 |
| 35 to 50 years | 0 (0.0%) | 0.0 |
| Total | 0 (0.0%) | 0.0 |
Fertility by Age by Marriage Status in Whites Landing
| Age Bracket | Married | Unmarried |
| 15 to 19 years | 0 (0.0%) | 0 (0.0%) |
| 20 to 34 years | 0 (0.0%) | 0 (0.0%) |
| 35 to 50 years | 0 (0.0%) | 0 (0.0%) |
| Total | 0 (0.0%) | 0 (0.0%) |
Fertility by Education in Whites Landing
| Educational Attainment | Women with Births | Births / 1,000 Women |
| Less than High School | 0 (0.0%) | 0.0 |
| High School Diploma | 0 (0.0%) | 0.0 |
| College or Associate's Degree | 0 (0.0%) | 0.0 |
| Bachelor's Degree | 0 (0.0%) | 0.0 |
| Graduate Degree | 0 (0.0%) | 0.0 |
| Total | 0 (0.0%) | 0.0 |
Fertility by Education by Marriage Status in Whites Landing
| Educational Attainment | Married | Unmarried |
| Less than High School | 0 (0.0%) | 0 (0.0%) |
| High School Diploma | 0 (0.0%) | 0 (0.0%) |
| College or Associate's Degree | 0 (0.0%) | 0 (0.0%) |
| Bachelor's Degree | 0 (0.0%) | 0 (0.0%) |
| Graduate Degree | 0 (0.0%) | 0 (0.0%) |
| Total | 0 (0.0%) | 0 (0.0%) |
Employment Characteristics in Whites Landing
Employment by Class of Employer in Whites Landing
Among the 102 employed individuals in Whites Landing, private company employees (85 | 83.3%), and not-for-profit organizations (17 | 16.7%) make up the most common classes of employment.
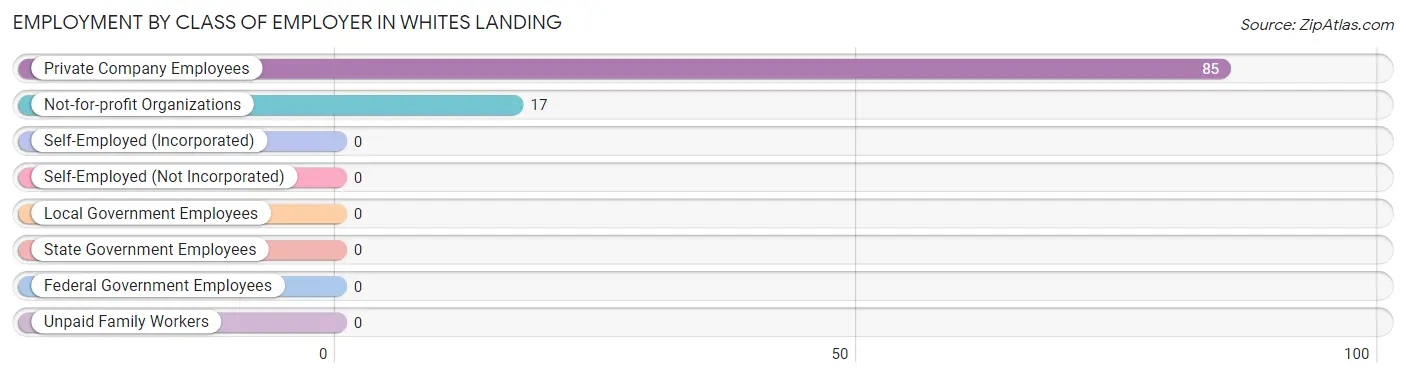
| Employer Class | # Employees | % Employees |
| Private Company Employees | 85 | 83.3% |
| Self-Employed (Incorporated) | 0 | 0.0% |
| Self-Employed (Not Incorporated) | 0 | 0.0% |
| Not-for-profit Organizations | 17 | 16.7% |
| Local Government Employees | 0 | 0.0% |
| State Government Employees | 0 | 0.0% |
| Federal Government Employees | 0 | 0.0% |
| Unpaid Family Workers | 0 | 0.0% |
| Total | 102 | 100.0% |
Employment Status by Age in Whites Landing
According to the labor force statistics for Whites Landing, out of the total population over 16 years of age (363), 52.9% or 192 individuals are in the labor force, with 36.5% or 70 of them unemployed. The age group with the highest labor force participation rate is 55 to 59 years, with 100.0% or 43 individuals in the labor force. Within the labor force, the 20 to 24 years age range has the highest percentage of unemployed individuals, with 59.8% or 70 of them being unemployed.
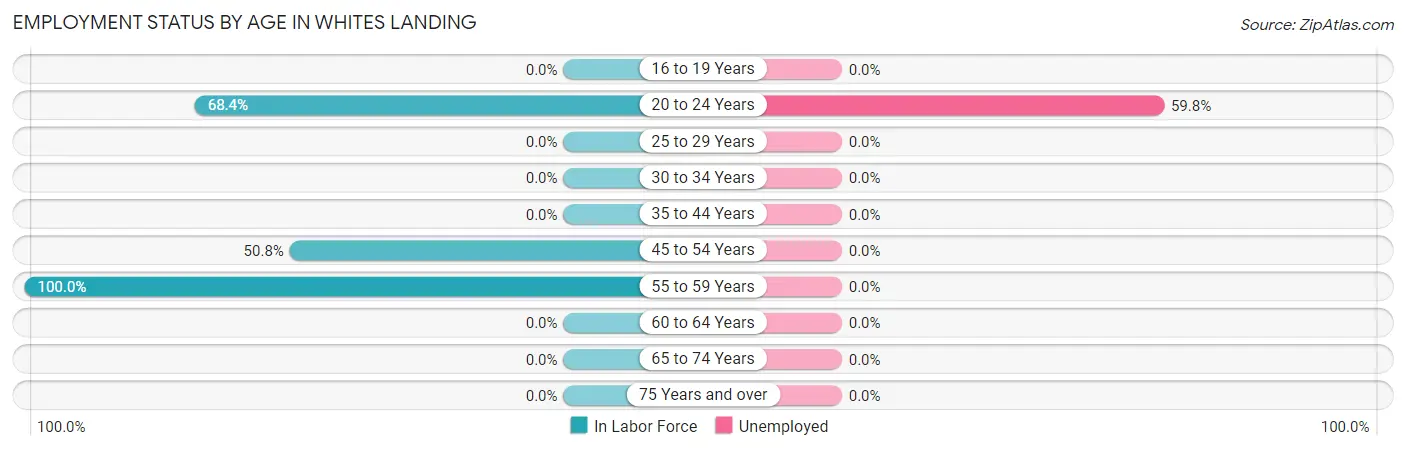
| Age Bracket | In Labor Force | Unemployed |
| 16 to 19 Years | 0 (0.0%) | 0 (0.0%) |
| 20 to 24 Years | 117 (68.4%) | 70 (59.8%) |
| 25 to 29 Years | 0 (0.0%) | 0 (0.0%) |
| 30 to 34 Years | 0 (0.0%) | 0 (0.0%) |
| 35 to 44 Years | 0 (0.0%) | 0 (0.0%) |
| 45 to 54 Years | 32 (50.8%) | 0 (0.0%) |
| 55 to 59 Years | 43 (100.0%) | 0 (0.0%) |
| 60 to 64 Years | 0 (0.0%) | 0 (0.0%) |
| 65 to 74 Years | 0 (0.0%) | 0 (0.0%) |
| 75 Years and over | 0 (0.0%) | 0 (0.0%) |
| Total | 192 (52.9%) | 70 (36.5%) |
Employment Status by Educational Attainment in Whites Landing
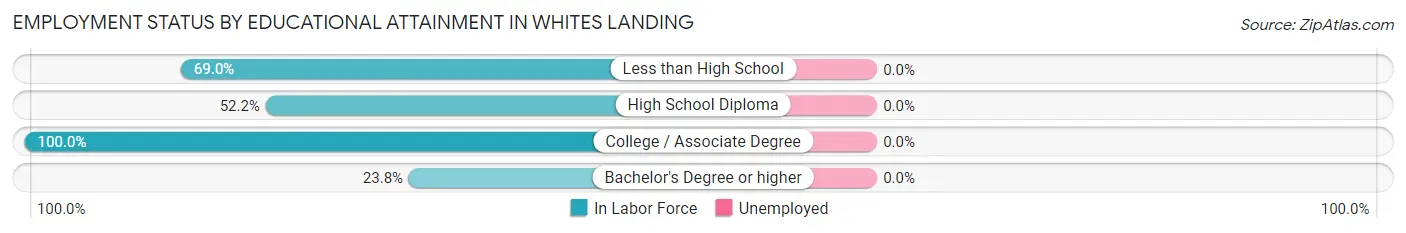
| Educational Attainment | In Labor Force | Unemployed |
| Less than High School | 20 (69.0%) | 0 (0.0%) |
| High School Diploma | 24 (52.2%) | 0 (0.0%) |
| College / Associate Degree | 21 (100.0%) | 0 (0.0%) |
| Bachelor's Degree or higher | 10 (23.8%) | 0 (0.0%) |
| Total | 75 (54.3%) | 0 (0.0%) |
Employment Occupations by Sex in Whites Landing
Management, Business, Science and Arts Occupations
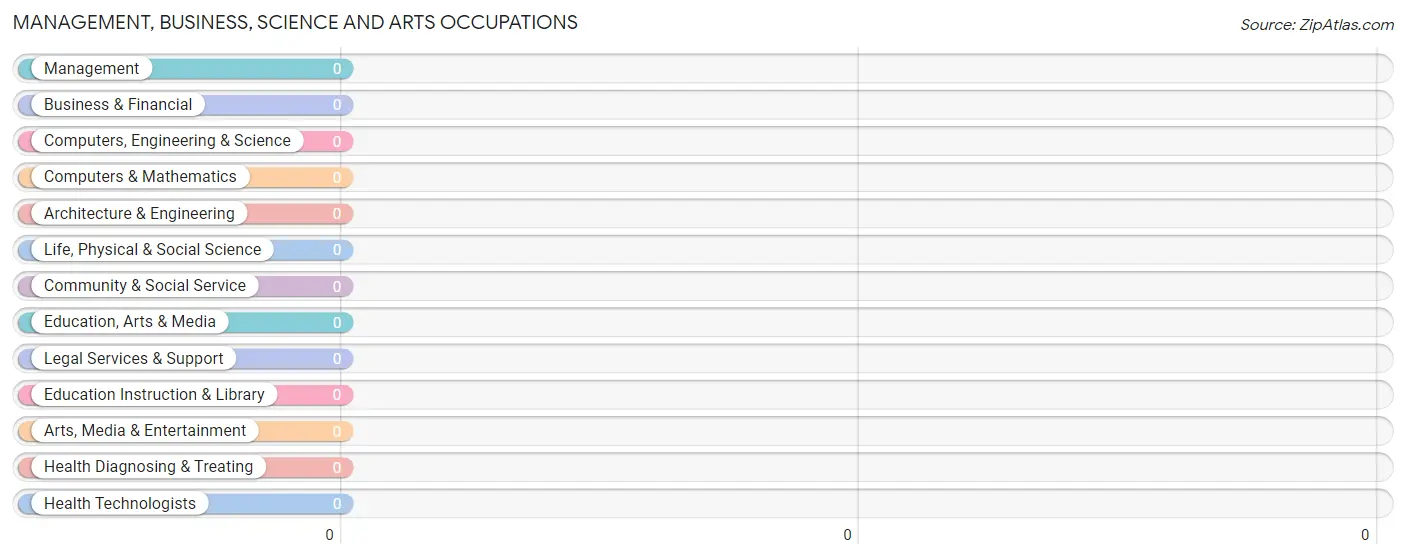
Management, Business, Science and Arts Occupations by Sex
| Occupation | Male | Female |
| Management | 0 (0.0%) | 0 (0.0%) |
| Business & Financial | 0 (0.0%) | 0 (0.0%) |
| Computers, Engineering & Science | 0 (0.0%) | 0 (0.0%) |
| Computers & Mathematics | 0 (0.0%) | 0 (0.0%) |
| Architecture & Engineering | 0 (0.0%) | 0 (0.0%) |
| Life, Physical & Social Science | 0 (0.0%) | 0 (0.0%) |
| Community & Social Service | 0 (0.0%) | 0 (0.0%) |
| Education, Arts & Media | 0 (0.0%) | 0 (0.0%) |
| Legal Services & Support | 0 (0.0%) | 0 (0.0%) |
| Education Instruction & Library | 0 (0.0%) | 0 (0.0%) |
| Arts, Media & Entertainment | 0 (0.0%) | 0 (0.0%) |
| Health Diagnosing & Treating | 0 (0.0%) | 0 (0.0%) |
| Health Technologists | 0 (0.0%) | 0 (0.0%) |
| Total (Category) | 0 (0.0%) | 0 (0.0%) |
| Total (Overall) | 59 (48.4%) | 63 (51.6%) |
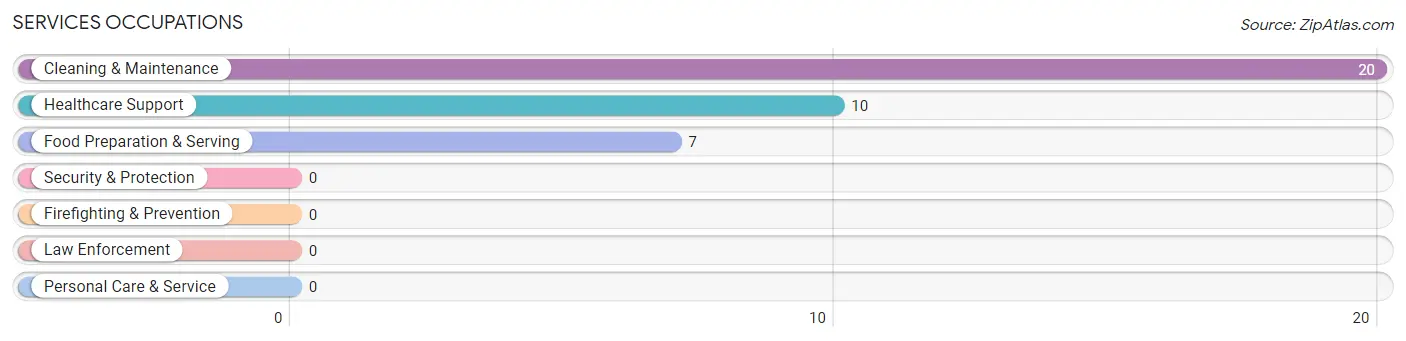
Services Occupations
The most common Services occupations in Whites Landing are Cleaning & Maintenance (20 | 16.4%), Healthcare Support (10 | 8.2%), and Food Preparation & Serving (7 | 5.7%).
Services Occupations by Sex
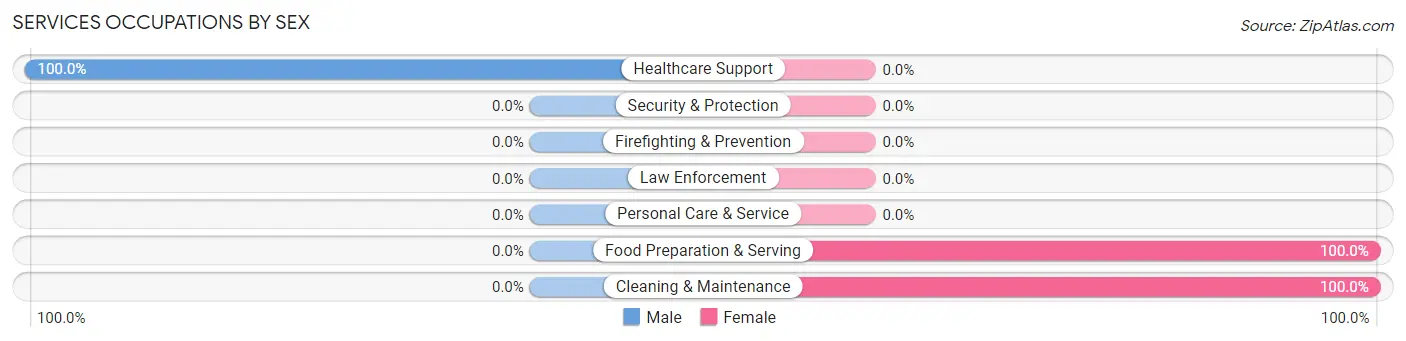
| Occupation | Male | Female |
| Healthcare Support | 10 (100.0%) | 0 (0.0%) |
| Security & Protection | 0 (0.0%) | 0 (0.0%) |
| Firefighting & Prevention | 0 (0.0%) | 0 (0.0%) |
| Law Enforcement | 0 (0.0%) | 0 (0.0%) |
| Food Preparation & Serving | 0 (0.0%) | 7 (100.0%) |
| Cleaning & Maintenance | 0 (0.0%) | 20 (100.0%) |
| Personal Care & Service | 0 (0.0%) | 0 (0.0%) |
| Total (Category) | 10 (27.0%) | 27 (73.0%) |
| Total (Overall) | 59 (48.4%) | 63 (51.6%) |
Sales and Office Occupations
The most common Sales and Office occupations in Whites Landing are , and Office & Administration (24 | 19.7%).
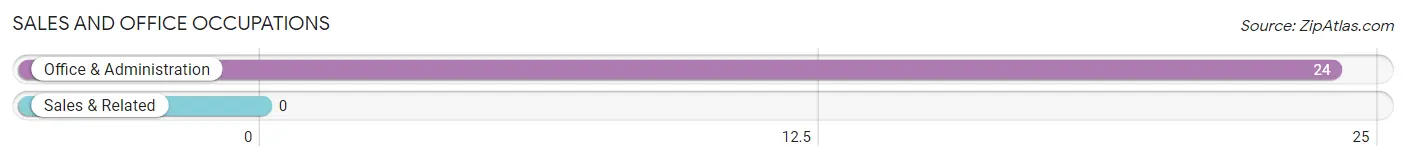
Sales and Office Occupations by Sex
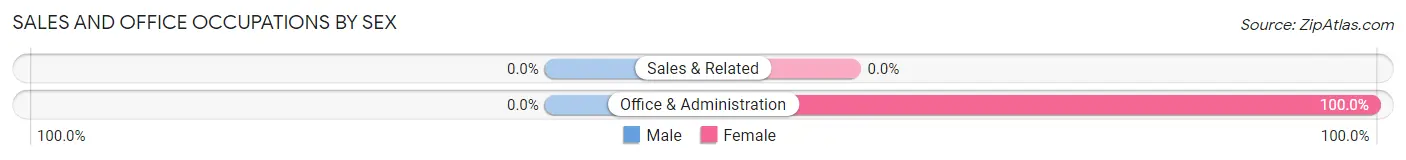
| Occupation | Male | Female |
| Sales & Related | 0 (0.0%) | 0 (0.0%) |
| Office & Administration | 0 (0.0%) | 24 (100.0%) |
| Total (Category) | 0 (0.0%) | 24 (100.0%) |
| Total (Overall) | 59 (48.4%) | 63 (51.6%) |
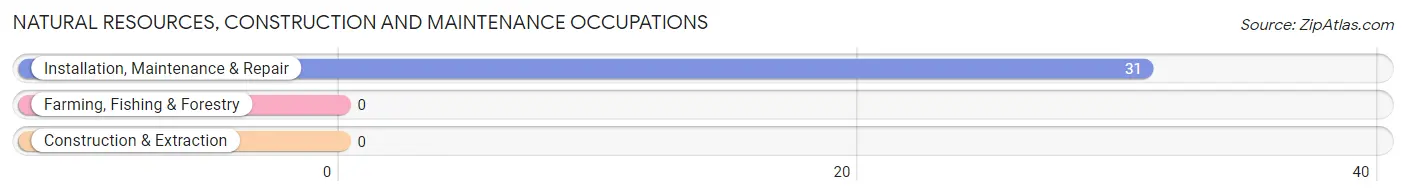
Natural Resources, Construction and Maintenance Occupations
The most common Natural Resources, Construction and Maintenance occupations in Whites Landing are , and Installation, Maintenance & Repair (31 | 25.4%).
Natural Resources, Construction and Maintenance Occupations by Sex
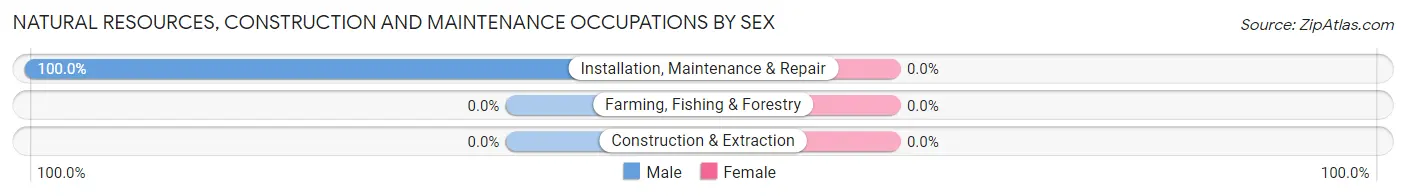
| Occupation | Male | Female |
| Farming, Fishing & Forestry | 0 (0.0%) | 0 (0.0%) |
| Construction & Extraction | 0 (0.0%) | 0 (0.0%) |
| Installation, Maintenance & Repair | 31 (100.0%) | 0 (0.0%) |
| Total (Category) | 31 (100.0%) | 0 (0.0%) |
| Total (Overall) | 59 (48.4%) | 63 (51.6%) |
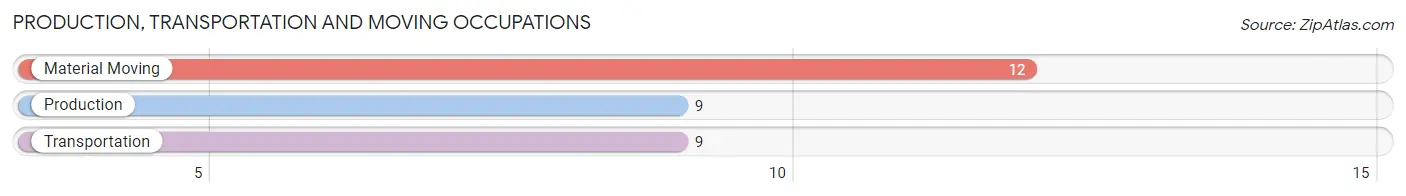
Production, Transportation and Moving Occupations
The most common Production, Transportation and Moving occupations in Whites Landing are Material Moving (12 | 9.8%), Production (9 | 7.4%), and Transportation (9 | 7.4%).
Production, Transportation and Moving Occupations by Sex
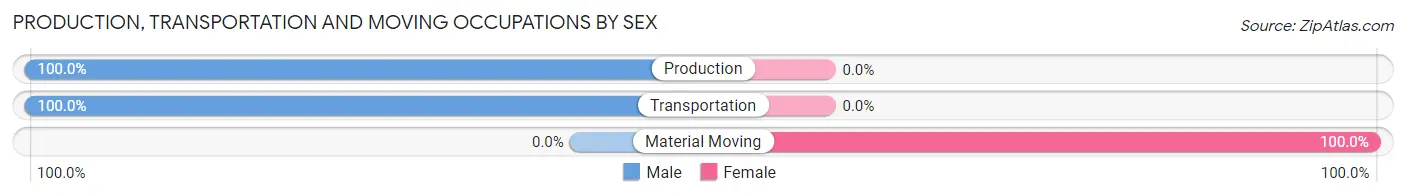
| Occupation | Male | Female |
| Production | 9 (100.0%) | 0 (0.0%) |
| Transportation | 9 (100.0%) | 0 (0.0%) |
| Material Moving | 0 (0.0%) | 12 (100.0%) |
| Total (Category) | 18 (60.0%) | 12 (40.0%) |
| Total (Overall) | 59 (48.4%) | 63 (51.6%) |
Employment Industries by Sex in Whites Landing
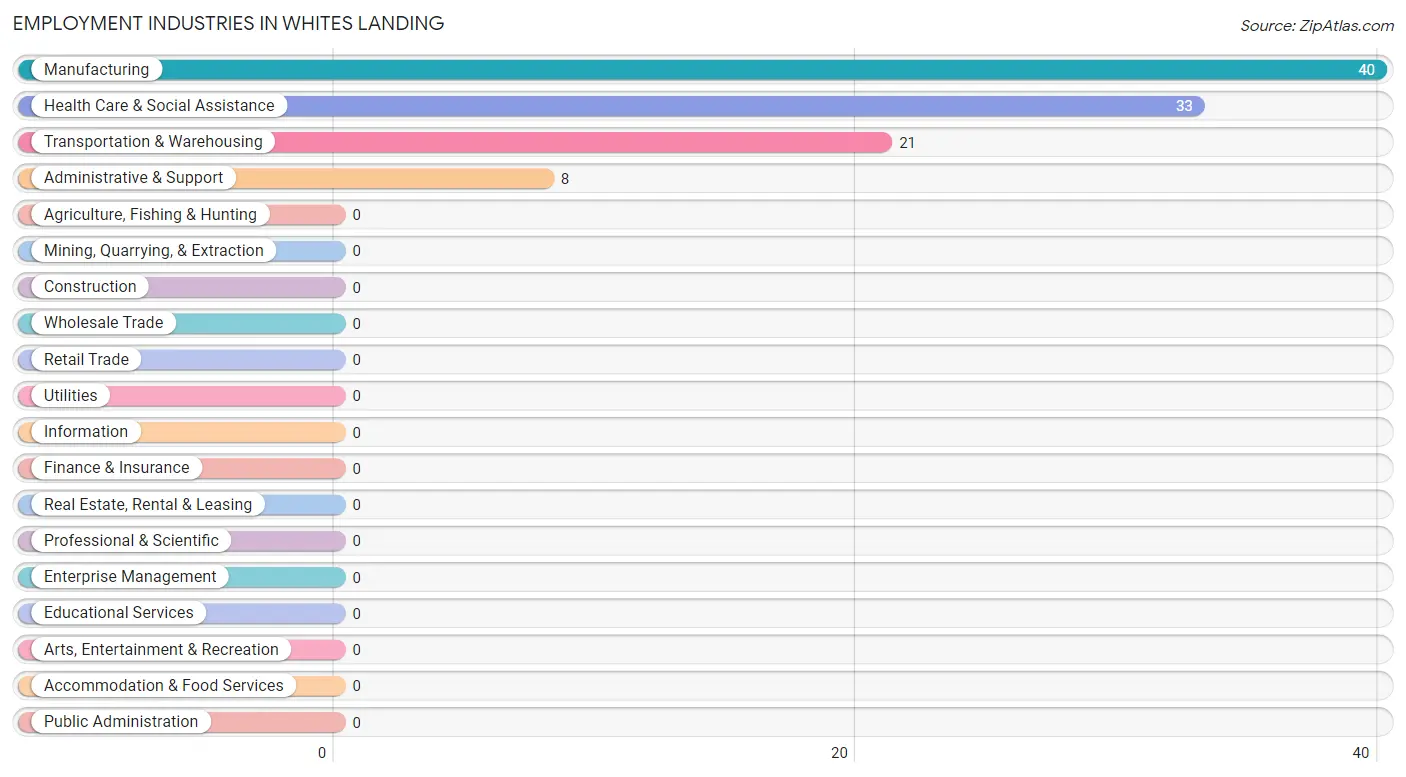
Employment Industries in Whites Landing
The major employment industries in Whites Landing include Manufacturing (40 | 32.8%), Health Care & Social Assistance (33 | 27.1%), Transportation & Warehousing (21 | 17.2%), and Administrative & Support (8 | 6.6%).
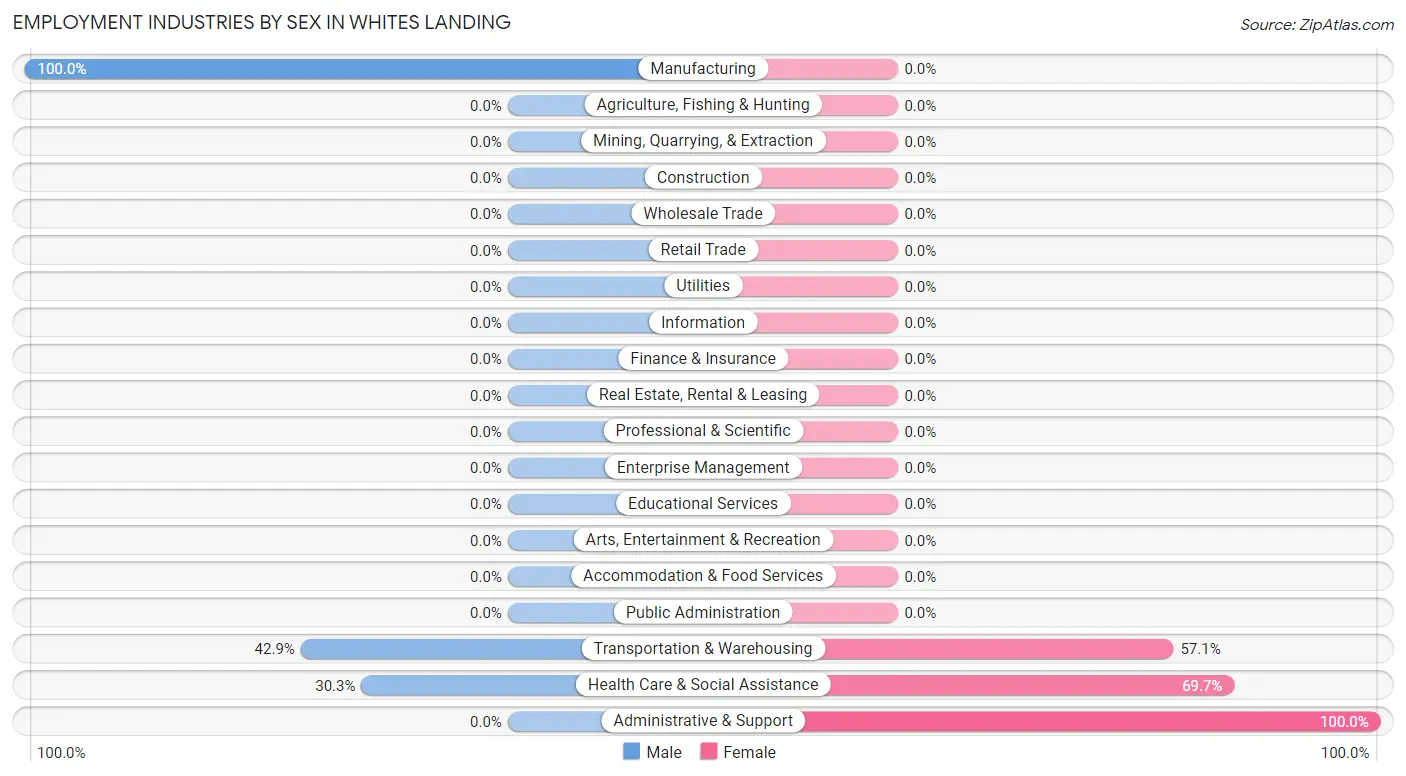
Employment Industries by Sex in Whites Landing
The Whites Landing industries that see more men than women are Manufacturing (100.0%), Transportation & Warehousing (42.9%), and Health Care & Social Assistance (30.3%), whereas the industries that tend to have a higher number of women are Administrative & Support (100.0%), Health Care & Social Assistance (69.7%), and Transportation & Warehousing (57.1%).
| Industry | Male | Female |
| Agriculture, Fishing & Hunting | 0 (0.0%) | 0 (0.0%) |
| Mining, Quarrying, & Extraction | 0 (0.0%) | 0 (0.0%) |
| Construction | 0 (0.0%) | 0 (0.0%) |
| Manufacturing | 40 (100.0%) | 0 (0.0%) |
| Wholesale Trade | 0 (0.0%) | 0 (0.0%) |
| Retail Trade | 0 (0.0%) | 0 (0.0%) |
| Transportation & Warehousing | 9 (42.9%) | 12 (57.1%) |
| Utilities | 0 (0.0%) | 0 (0.0%) |
| Information | 0 (0.0%) | 0 (0.0%) |
| Finance & Insurance | 0 (0.0%) | 0 (0.0%) |
| Real Estate, Rental & Leasing | 0 (0.0%) | 0 (0.0%) |
| Professional & Scientific | 0 (0.0%) | 0 (0.0%) |
| Enterprise Management | 0 (0.0%) | 0 (0.0%) |
| Administrative & Support | 0 (0.0%) | 8 (100.0%) |
| Educational Services | 0 (0.0%) | 0 (0.0%) |
| Health Care & Social Assistance | 10 (30.3%) | 23 (69.7%) |
| Arts, Entertainment & Recreation | 0 (0.0%) | 0 (0.0%) |
| Accommodation & Food Services | 0 (0.0%) | 0 (0.0%) |
| Public Administration | 0 (0.0%) | 0 (0.0%) |
| Total | 59 (48.4%) | 63 (51.6%) |
Education in Whites Landing
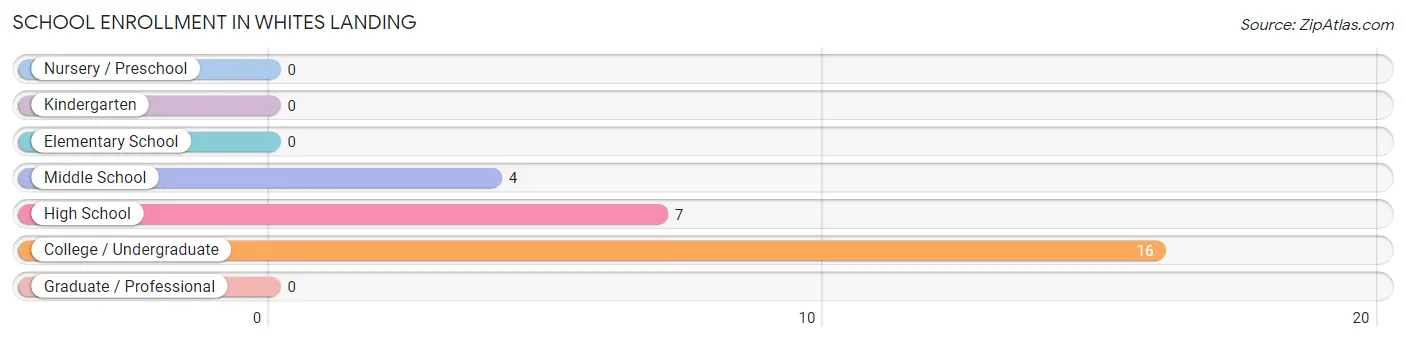
School Enrollment in Whites Landing
The most common levels of schooling among the 27 students in Whites Landing are college / undergraduate (16 | 59.3%), high school (7 | 25.9%), and middle school (4 | 14.8%).
| School Level | # Students | % Students |
| Nursery / Preschool | 0 | 0.0% |
| Kindergarten | 0 | 0.0% |
| Elementary School | 0 | 0.0% |
| Middle School | 4 | 14.8% |
| High School | 7 | 25.9% |
| College / Undergraduate | 16 | 59.3% |
| Graduate / Professional | 0 | 0.0% |
| Total | 27 | 100.0% |
School Enrollment by Age by Funding Source in Whites Landing
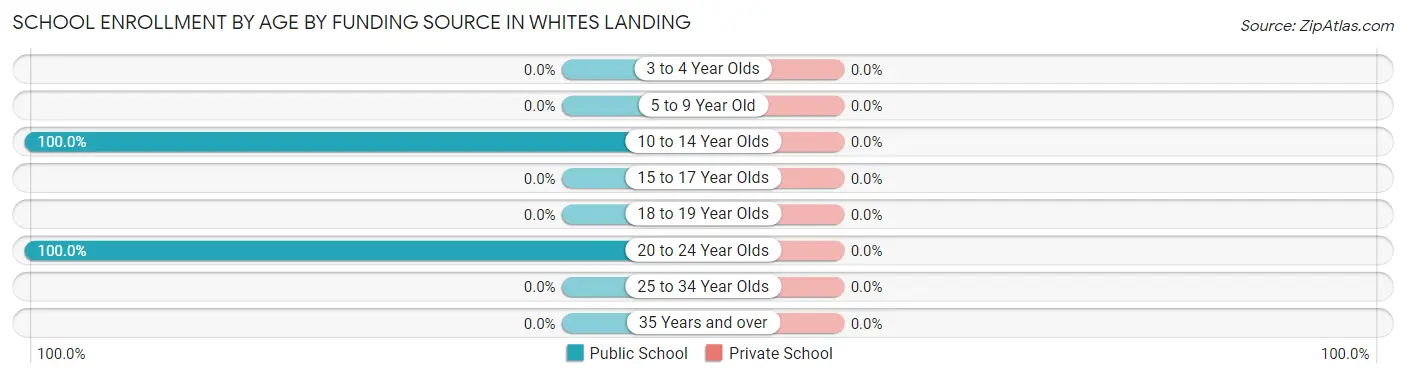
| Age Bracket | Public School | Private School |
| 3 to 4 Year Olds | 0 (0.0%) | 0 (0.0%) |
| 5 to 9 Year Old | 0 (0.0%) | 0 (0.0%) |
| 10 to 14 Year Olds | 4 (100.0%) | 0 (0.0%) |
| 15 to 17 Year Olds | 0 (0.0%) | 0 (0.0%) |
| 18 to 19 Year Olds | 0 (0.0%) | 0 (0.0%) |
| 20 to 24 Year Olds | 23 (100.0%) | 0 (0.0%) |
| 25 to 34 Year Olds | 0 (0.0%) | 0 (0.0%) |
| 35 Years and over | 0 (0.0%) | 0 (0.0%) |
| Total | 27 (100.0%) | 0 (0.0%) |
Educational Attainment by Field of Study in Whites Landing
Arts & humanities (32 | 76.2%), and education (10 | 23.8%) are the most common fields of study among 42 individuals in Whites Landing who have obtained a bachelor's degree or higher.
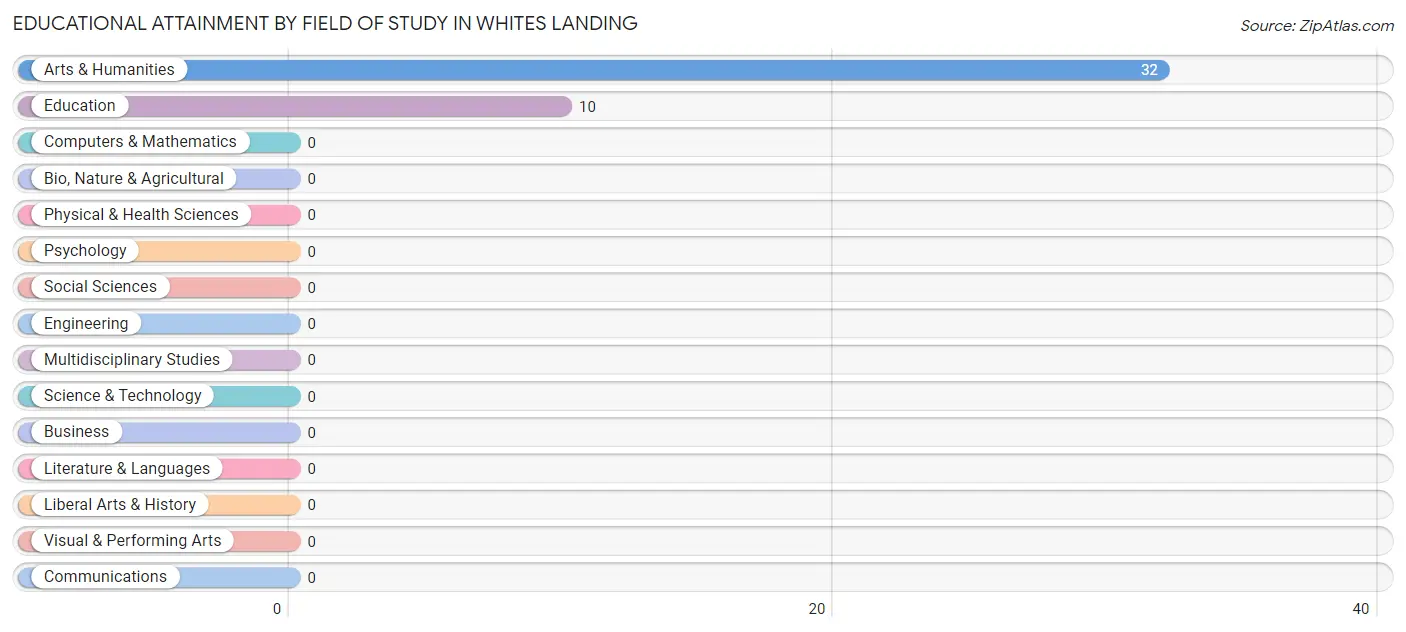
| Field of Study | # Graduates | % Graduates |
| Computers & Mathematics | 0 | 0.0% |
| Bio, Nature & Agricultural | 0 | 0.0% |
| Physical & Health Sciences | 0 | 0.0% |
| Psychology | 0 | 0.0% |
| Social Sciences | 0 | 0.0% |
| Engineering | 0 | 0.0% |
| Multidisciplinary Studies | 0 | 0.0% |
| Science & Technology | 0 | 0.0% |
| Business | 0 | 0.0% |
| Education | 10 | 23.8% |
| Literature & Languages | 0 | 0.0% |
| Liberal Arts & History | 0 | 0.0% |
| Visual & Performing Arts | 0 | 0.0% |
| Communications | 0 | 0.0% |
| Arts & Humanities | 32 | 76.2% |
| Total | 42 | 100.0% |
Transportation & Commute in Whites Landing
Vehicle Availability by Sex in Whites Landing
The most prevalent vehicle ownership categories in Whites Landing are males with 2 vehicles (40, accounting for 67.8%) and females with 2 vehicles (35, making up 93.0%).
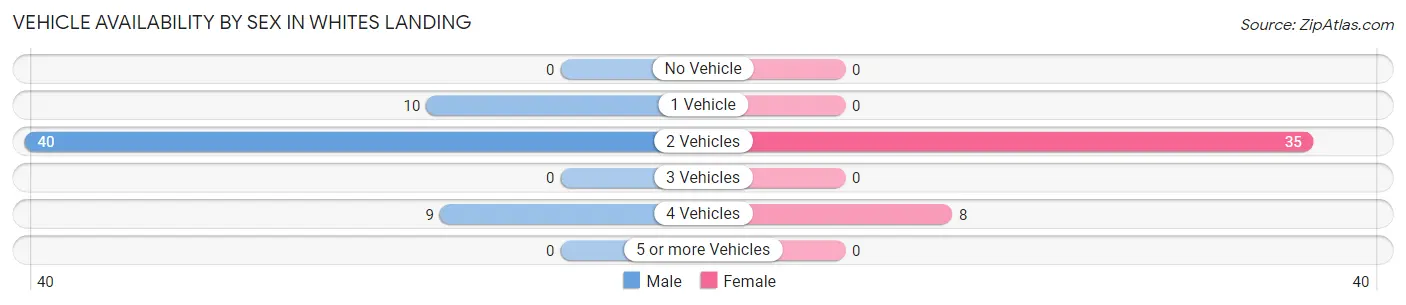
| Vehicles Available | Male | Female |
| No Vehicle | 0 (0.0%) | 0 (0.0%) |
| 1 Vehicle | 10 (17.0%) | 0 (0.0%) |
| 2 Vehicles | 40 (67.8%) | 35 (81.4%) |
| 3 Vehicles | 0 (0.0%) | 0 (0.0%) |
| 4 Vehicles | 9 (15.2%) | 8 (18.6%) |
| 5 or more Vehicles | 0 (0.0%) | 0 (0.0%) |
| Total | 59 (100.0%) | 43 (100.0%) |
Commute Time in Whites Landing
The most frequently occuring commute durations in Whites Landing are 30 to 34 minutes (31 commuters, 30.4%), 45 to 59 minutes (28 commuters, 27.5%), and 5 to 9 minutes (10 commuters, 9.8%).
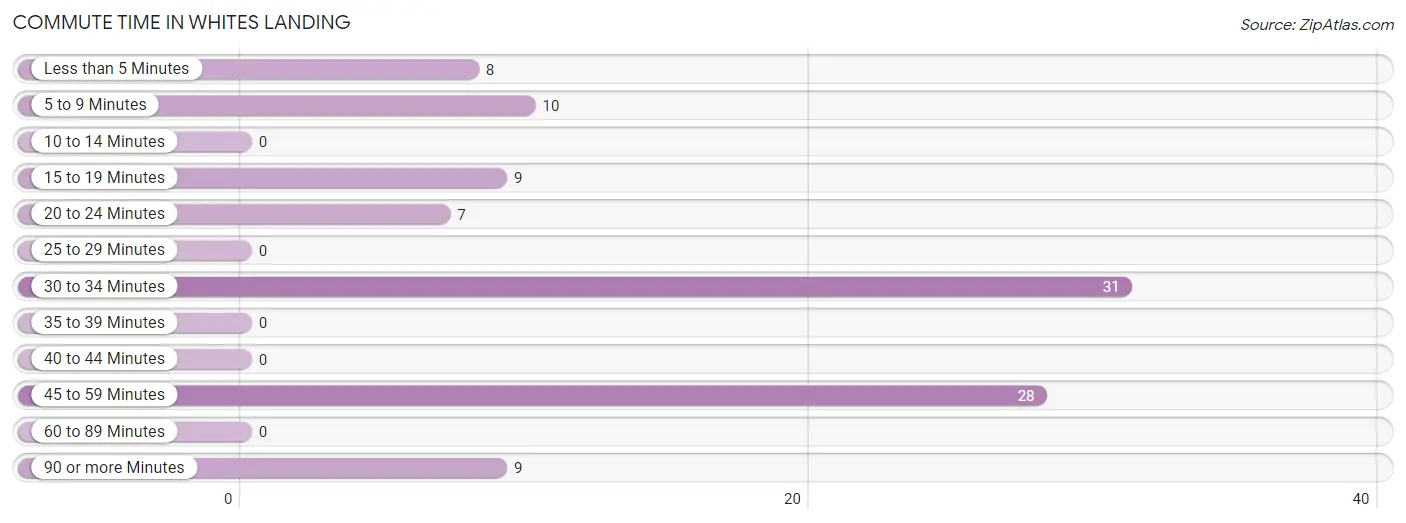
| Commute Time | # Commuters | % Commuters |
| Less than 5 Minutes | 8 | 7.8% |
| 5 to 9 Minutes | 10 | 9.8% |
| 10 to 14 Minutes | 0 | 0.0% |
| 15 to 19 Minutes | 9 | 8.8% |
| 20 to 24 Minutes | 7 | 6.9% |
| 25 to 29 Minutes | 0 | 0.0% |
| 30 to 34 Minutes | 31 | 30.4% |
| 35 to 39 Minutes | 0 | 0.0% |
| 40 to 44 Minutes | 0 | 0.0% |
| 45 to 59 Minutes | 28 | 27.5% |
| 60 to 89 Minutes | 0 | 0.0% |
| 90 or more Minutes | 9 | 8.8% |
Commute Time by Sex in Whites Landing
The most common commute times in Whites Landing are 30 to 34 minutes (31 commuters, 52.5%) for males and 45 to 59 minutes (28 commuters, 65.1%) for females.
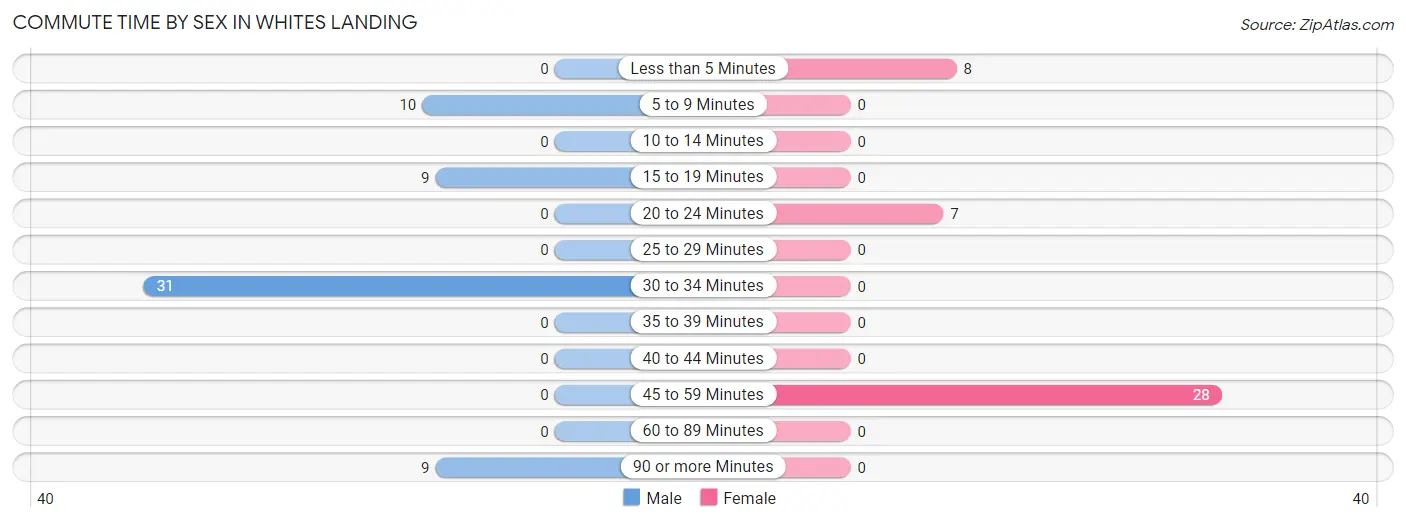
| Commute Time | Male | Female |
| Less than 5 Minutes | 0 (0.0%) | 8 (18.6%) |
| 5 to 9 Minutes | 10 (17.0%) | 0 (0.0%) |
| 10 to 14 Minutes | 0 (0.0%) | 0 (0.0%) |
| 15 to 19 Minutes | 9 (15.2%) | 0 (0.0%) |
| 20 to 24 Minutes | 0 (0.0%) | 7 (16.3%) |
| 25 to 29 Minutes | 0 (0.0%) | 0 (0.0%) |
| 30 to 34 Minutes | 31 (52.5%) | 0 (0.0%) |
| 35 to 39 Minutes | 0 (0.0%) | 0 (0.0%) |
| 40 to 44 Minutes | 0 (0.0%) | 0 (0.0%) |
| 45 to 59 Minutes | 0 (0.0%) | 28 (65.1%) |
| 60 to 89 Minutes | 0 (0.0%) | 0 (0.0%) |
| 90 or more Minutes | 9 (15.2%) | 0 (0.0%) |
Time of Departure to Work by Sex in Whites Landing
The most frequent times of departure to work in Whites Landing are 6:00 AM to 6:29 AM (31, 52.5%) for males and 6:30 AM to 6:59 AM (16, 37.2%) for females.
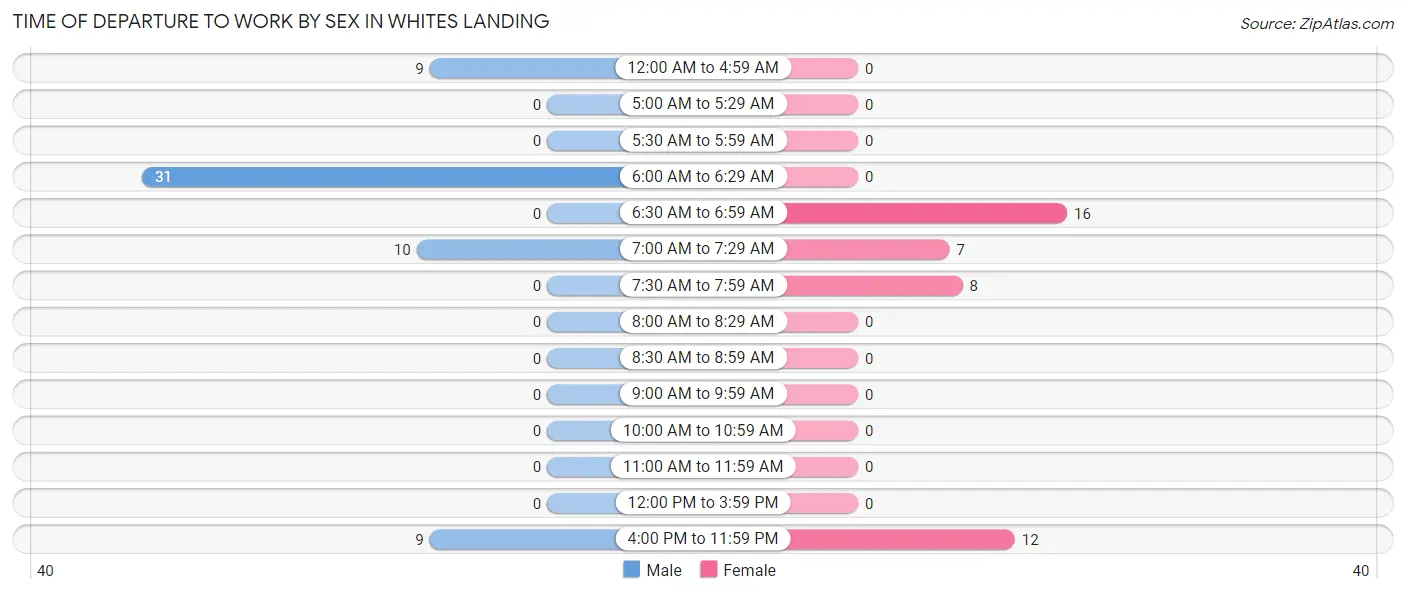
| Time of Departure | Male | Female |
| 12:00 AM to 4:59 AM | 9 (15.2%) | 0 (0.0%) |
| 5:00 AM to 5:29 AM | 0 (0.0%) | 0 (0.0%) |
| 5:30 AM to 5:59 AM | 0 (0.0%) | 0 (0.0%) |
| 6:00 AM to 6:29 AM | 31 (52.5%) | 0 (0.0%) |
| 6:30 AM to 6:59 AM | 0 (0.0%) | 16 (37.2%) |
| 7:00 AM to 7:29 AM | 10 (17.0%) | 7 (16.3%) |
| 7:30 AM to 7:59 AM | 0 (0.0%) | 8 (18.6%) |
| 8:00 AM to 8:29 AM | 0 (0.0%) | 0 (0.0%) |
| 8:30 AM to 8:59 AM | 0 (0.0%) | 0 (0.0%) |
| 9:00 AM to 9:59 AM | 0 (0.0%) | 0 (0.0%) |
| 10:00 AM to 10:59 AM | 0 (0.0%) | 0 (0.0%) |
| 11:00 AM to 11:59 AM | 0 (0.0%) | 0 (0.0%) |
| 12:00 PM to 3:59 PM | 0 (0.0%) | 0 (0.0%) |
| 4:00 PM to 11:59 PM | 9 (15.2%) | 12 (27.9%) |
| Total | 59 (100.0%) | 43 (100.0%) |
Housing Occupancy in Whites Landing
Occupancy by Ownership in Whites Landing
Of the total 176 dwellings in Whites Landing, owner-occupied units account for 75 (42.6%), while renter-occupied units make up 101 (57.4%).
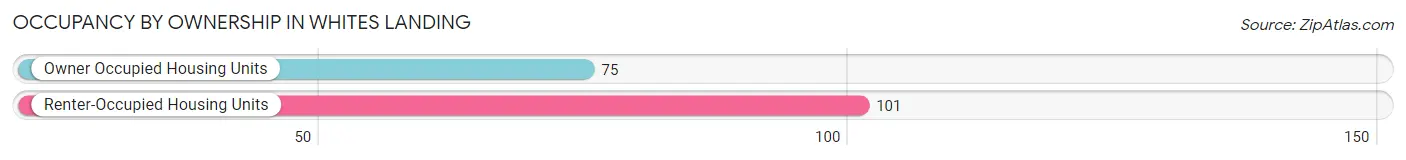
| Occupancy | # Housing Units | % Housing Units |
| Owner Occupied Housing Units | 75 | 42.6% |
| Renter-Occupied Housing Units | 101 | 57.4% |
| Total Occupied Housing Units | 176 | 100.0% |
Occupancy by Household Size in Whites Landing
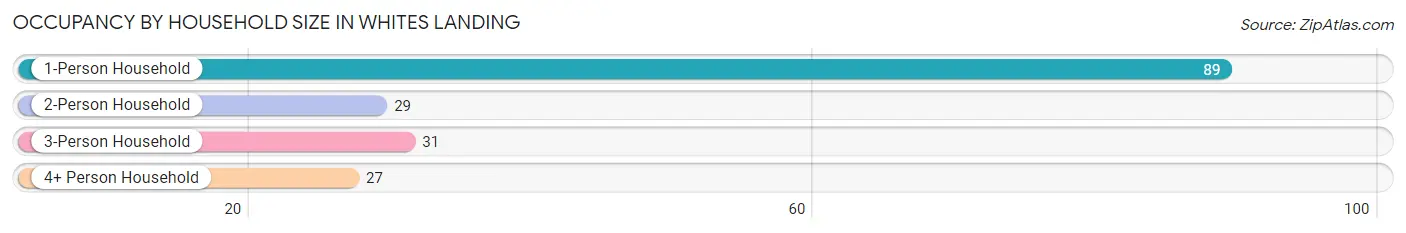
| Household Size | # Housing Units | % Housing Units |
| 1-Person Household | 89 | 50.6% |
| 2-Person Household | 29 | 16.5% |
| 3-Person Household | 31 | 17.6% |
| 4+ Person Household | 27 | 15.3% |
| Total Housing Units | 176 | 100.0% |
Occupancy by Ownership by Household Size in Whites Landing
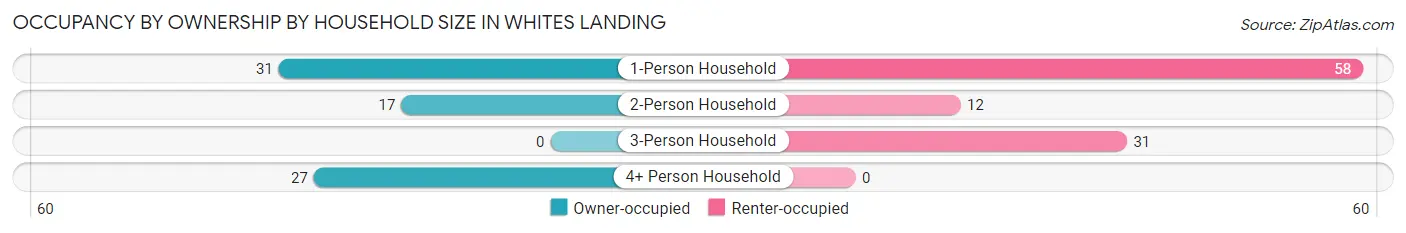
| Household Size | Owner-occupied | Renter-occupied |
| 1-Person Household | 31 (34.8%) | 58 (65.2%) |
| 2-Person Household | 17 (58.6%) | 12 (41.4%) |
| 3-Person Household | 0 (0.0%) | 31 (100.0%) |
| 4+ Person Household | 27 (100.0%) | 0 (0.0%) |
| Total Housing Units | 75 (42.6%) | 101 (57.4%) |
Occupancy by Educational Attainment in Whites Landing
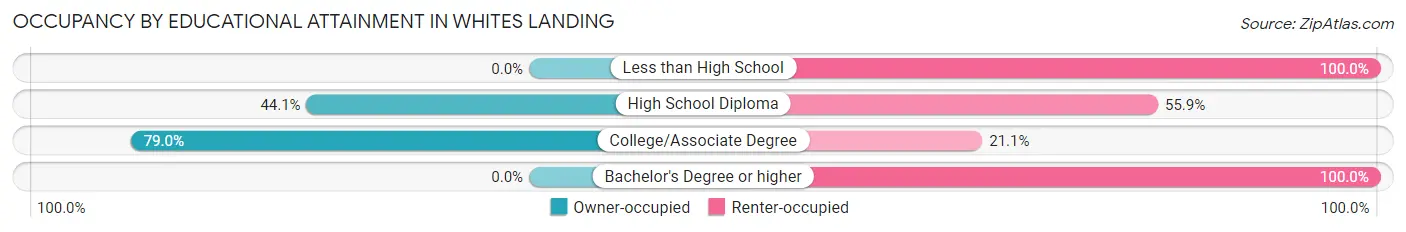
| Household Size | Owner-occupied | Renter-occupied |
| Less than High School | 0 (0.0%) | 9 (100.0%) |
| High School Diploma | 30 (44.1%) | 38 (55.9%) |
| College/Associate Degree | 45 (78.9%) | 12 (21.0%) |
| Bachelor's Degree or higher | 0 (0.0%) | 42 (100.0%) |
Occupancy by Age of Householder in Whites Landing
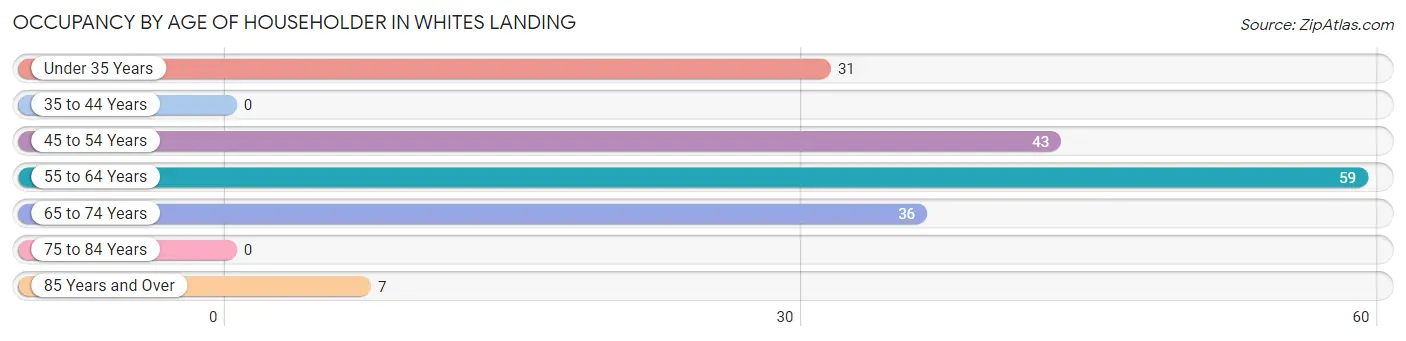
| Age Bracket | # Households | % Households |
| Under 35 Years | 31 | 17.6% |
| 35 to 44 Years | 0 | 0.0% |
| 45 to 54 Years | 43 | 24.4% |
| 55 to 64 Years | 59 | 33.5% |
| 65 to 74 Years | 36 | 20.4% |
| 75 to 84 Years | 0 | 0.0% |
| 85 Years and Over | 7 | 4.0% |
| Total | 176 | 100.0% |
Housing Finances in Whites Landing
Median Income by Occupancy in Whites Landing
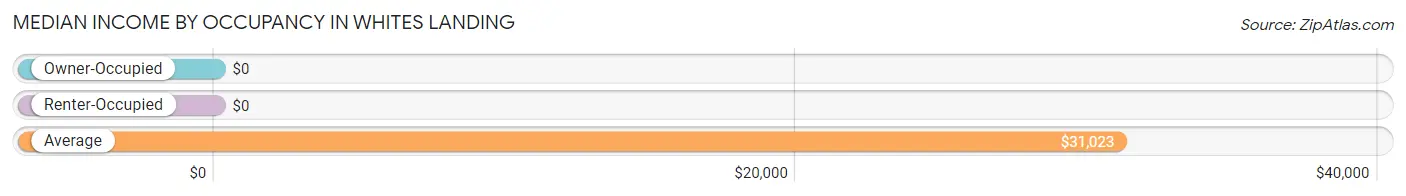
| Occupancy Type | # Households | Median Income |
| Owner-Occupied | 75 (42.6%) | $0 |
| Renter-Occupied | 101 (57.4%) | $0 |
| Average | 176 (100.0%) | $31,023 |
Occupancy by Householder Income Bracket in Whites Landing
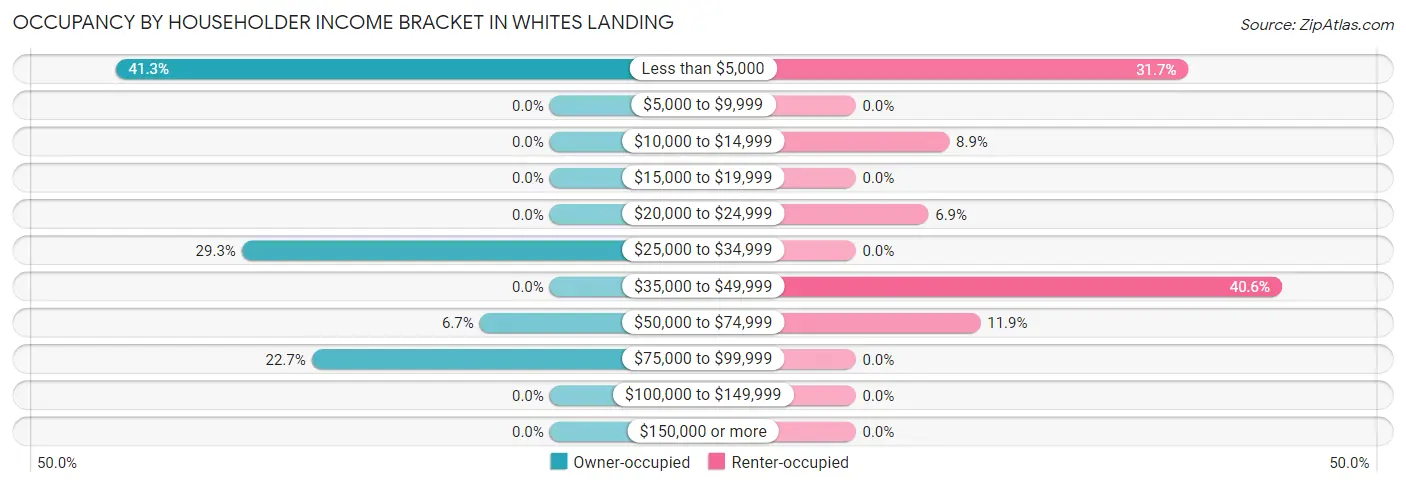
| Income Bracket | Owner-occupied | Renter-occupied |
| Less than $5,000 | 31 (41.3%) | 32 (31.7%) |
| $5,000 to $9,999 | 0 (0.0%) | 0 (0.0%) |
| $10,000 to $14,999 | 0 (0.0%) | 9 (8.9%) |
| $15,000 to $19,999 | 0 (0.0%) | 0 (0.0%) |
| $20,000 to $24,999 | 0 (0.0%) | 7 (6.9%) |
| $25,000 to $34,999 | 22 (29.3%) | 0 (0.0%) |
| $35,000 to $49,999 | 0 (0.0%) | 41 (40.6%) |
| $50,000 to $74,999 | 5 (6.7%) | 12 (11.9%) |
| $75,000 to $99,999 | 17 (22.7%) | 0 (0.0%) |
| $100,000 to $149,999 | 0 (0.0%) | 0 (0.0%) |
| $150,000 or more | 0 (0.0%) | 0 (0.0%) |
| Total | 75 (100.0%) | 101 (100.0%) |
Monthly Housing Cost Tiers in Whites Landing
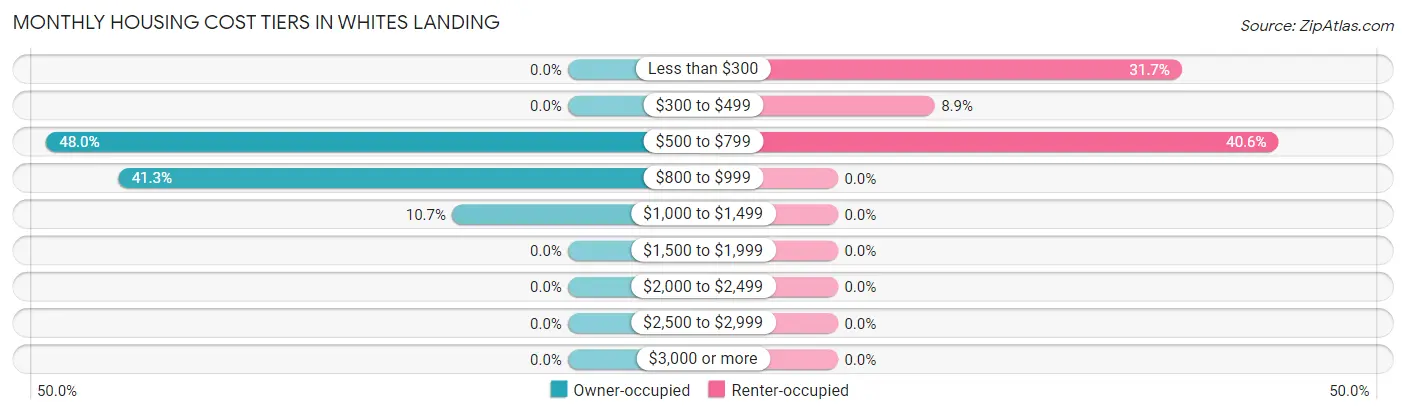
| Monthly Cost | Owner-occupied | Renter-occupied |
| Less than $300 | 0 (0.0%) | 32 (31.7%) |
| $300 to $499 | 0 (0.0%) | 9 (8.9%) |
| $500 to $799 | 36 (48.0%) | 41 (40.6%) |
| $800 to $999 | 31 (41.3%) | 0 (0.0%) |
| $1,000 to $1,499 | 8 (10.7%) | 0 (0.0%) |
| $1,500 to $1,999 | 0 (0.0%) | 0 (0.0%) |
| $2,000 to $2,499 | 0 (0.0%) | 0 (0.0%) |
| $2,500 to $2,999 | 0 (0.0%) | 0 (0.0%) |
| $3,000 or more | 0 (0.0%) | 0 (0.0%) |
| Total | 75 (100.0%) | 101 (100.0%) |
Physical Housing Characteristics in Whites Landing
Housing Structures in Whites Landing
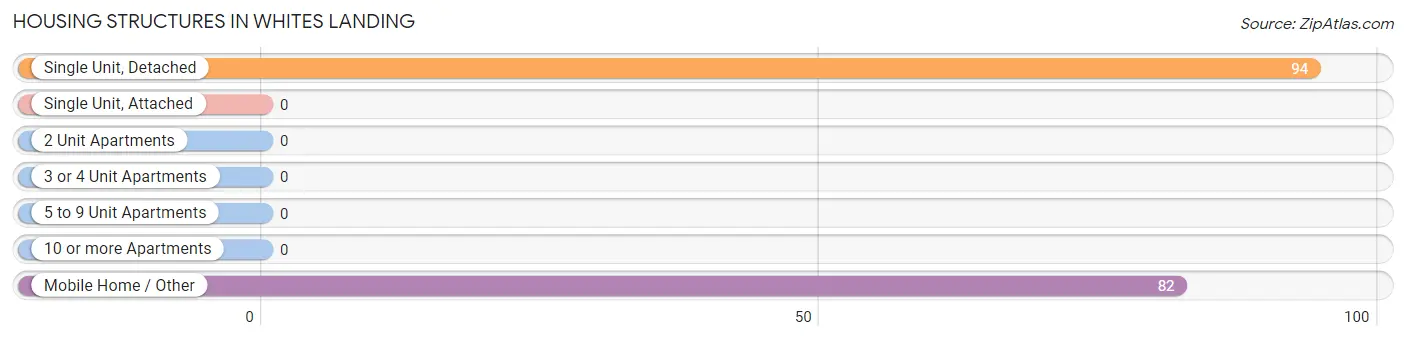
| Structure Type | # Housing Units | % Housing Units |
| Single Unit, Detached | 94 | 53.4% |
| Single Unit, Attached | 0 | 0.0% |
| 2 Unit Apartments | 0 | 0.0% |
| 3 or 4 Unit Apartments | 0 | 0.0% |
| 5 to 9 Unit Apartments | 0 | 0.0% |
| 10 or more Apartments | 0 | 0.0% |
| Mobile Home / Other | 82 | 46.6% |
| Total | 176 | 100.0% |
Housing Structures by Occupancy in Whites Landing
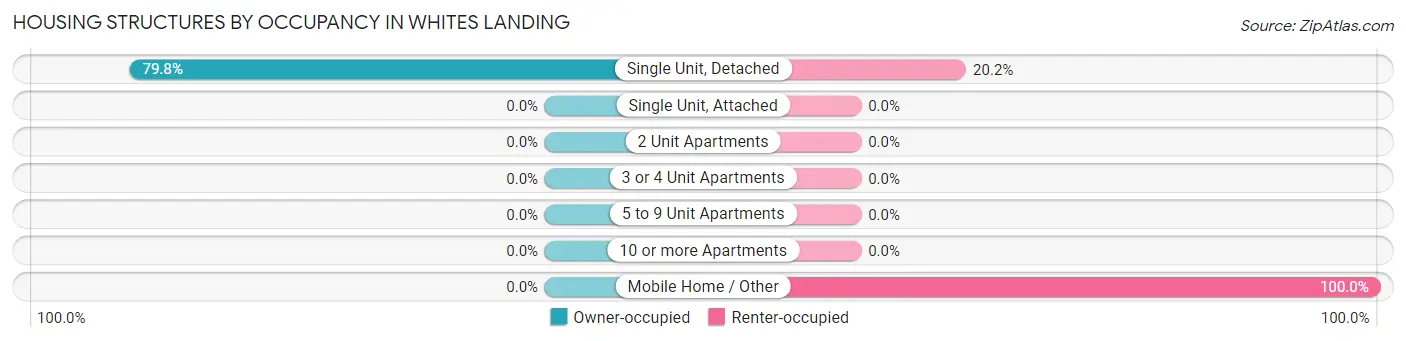
| Structure Type | Owner-occupied | Renter-occupied |
| Single Unit, Detached | 75 (79.8%) | 19 (20.2%) |
| Single Unit, Attached | 0 (0.0%) | 0 (0.0%) |
| 2 Unit Apartments | 0 (0.0%) | 0 (0.0%) |
| 3 or 4 Unit Apartments | 0 (0.0%) | 0 (0.0%) |
| 5 to 9 Unit Apartments | 0 (0.0%) | 0 (0.0%) |
| 10 or more Apartments | 0 (0.0%) | 0 (0.0%) |
| Mobile Home / Other | 0 (0.0%) | 82 (100.0%) |
| Total | 75 (42.6%) | 101 (57.4%) |
Housing Structures by Number of Rooms in Whites Landing
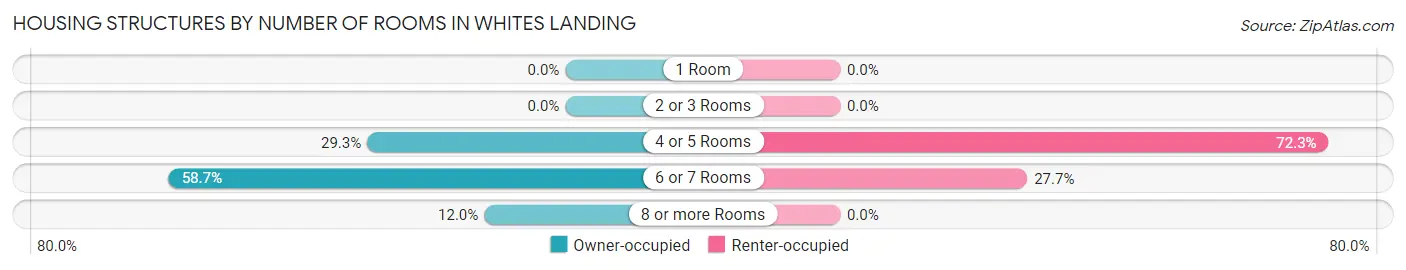
| Number of Rooms | Owner-occupied | Renter-occupied |
| 1 Room | 0 (0.0%) | 0 (0.0%) |
| 2 or 3 Rooms | 0 (0.0%) | 0 (0.0%) |
| 4 or 5 Rooms | 22 (29.3%) | 73 (72.3%) |
| 6 or 7 Rooms | 44 (58.7%) | 28 (27.7%) |
| 8 or more Rooms | 9 (12.0%) | 0 (0.0%) |
| Total | 75 (100.0%) | 101 (100.0%) |
Housing Structure by Heating Type in Whites Landing
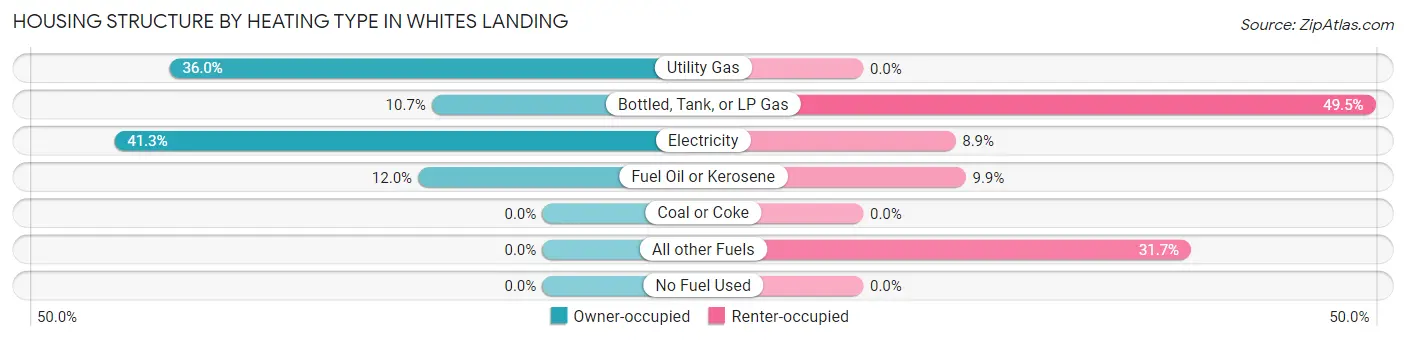
| Heating Type | Owner-occupied | Renter-occupied |
| Utility Gas | 27 (36.0%) | 0 (0.0%) |
| Bottled, Tank, or LP Gas | 8 (10.7%) | 50 (49.5%) |
| Electricity | 31 (41.3%) | 9 (8.9%) |
| Fuel Oil or Kerosene | 9 (12.0%) | 10 (9.9%) |
| Coal or Coke | 0 (0.0%) | 0 (0.0%) |
| All other Fuels | 0 (0.0%) | 32 (31.7%) |
| No Fuel Used | 0 (0.0%) | 0 (0.0%) |
| Total | 75 (100.0%) | 101 (100.0%) |
Household Vehicle Usage in Whites Landing
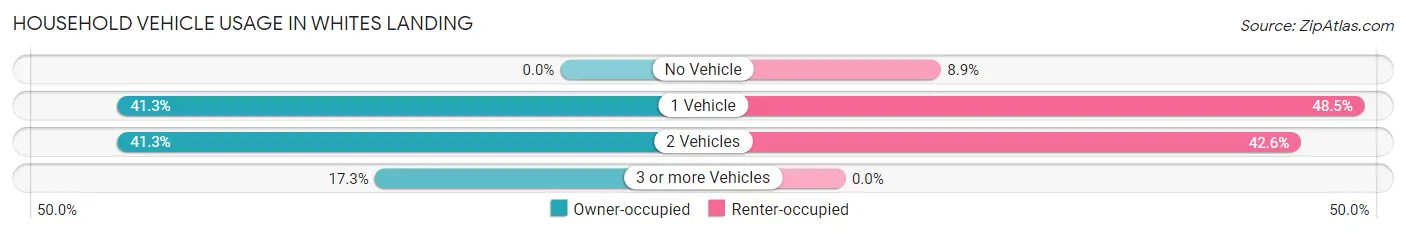
| Vehicles per Household | Owner-occupied | Renter-occupied |
| No Vehicle | 0 (0.0%) | 9 (8.9%) |
| 1 Vehicle | 31 (41.3%) | 49 (48.5%) |
| 2 Vehicles | 31 (41.3%) | 43 (42.6%) |
| 3 or more Vehicles | 13 (17.3%) | 0 (0.0%) |
| Total | 75 (100.0%) | 101 (100.0%) |
Real Estate & Mortgages in Whites Landing
Real Estate and Mortgage Overview in Whites Landing
| Characteristic | Without Mortgage | With Mortgage |
| Housing Units | 5 | 70 |
| Median Property Value | - | - |
| Median Household Income | - | - |
| Monthly Housing Costs | - | - |
| Real Estate Taxes | - | - |
Property Value by Mortgage Status in Whites Landing
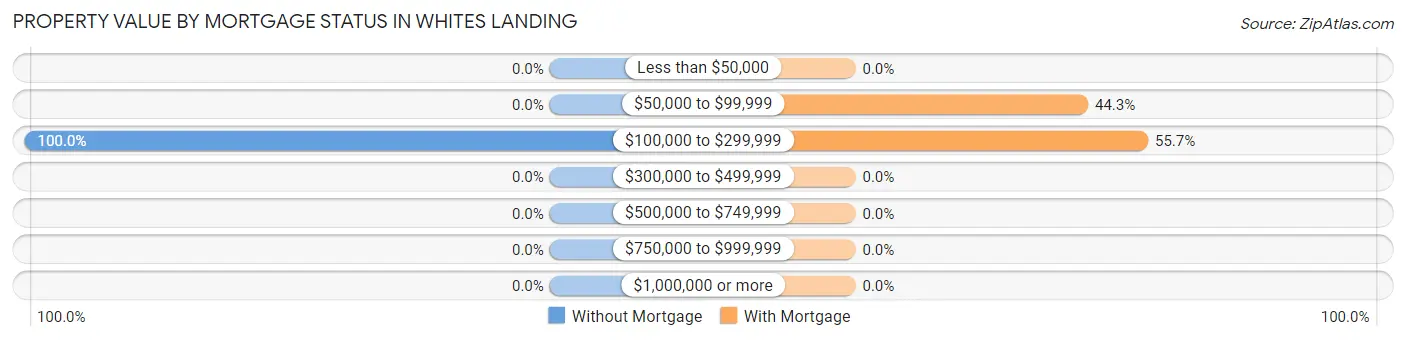
| Property Value | Without Mortgage | With Mortgage |
| Less than $50,000 | 0 (0.0%) | 0 (0.0%) |
| $50,000 to $99,999 | 0 (0.0%) | 31 (44.3%) |
| $100,000 to $299,999 | 5 (100.0%) | 39 (55.7%) |
| $300,000 to $499,999 | 0 (0.0%) | 0 (0.0%) |
| $500,000 to $749,999 | 0 (0.0%) | 0 (0.0%) |
| $750,000 to $999,999 | 0 (0.0%) | 0 (0.0%) |
| $1,000,000 or more | 0 (0.0%) | 0 (0.0%) |
| Total | 5 (100.0%) | 70 (100.0%) |
Household Income by Mortgage Status in Whites Landing
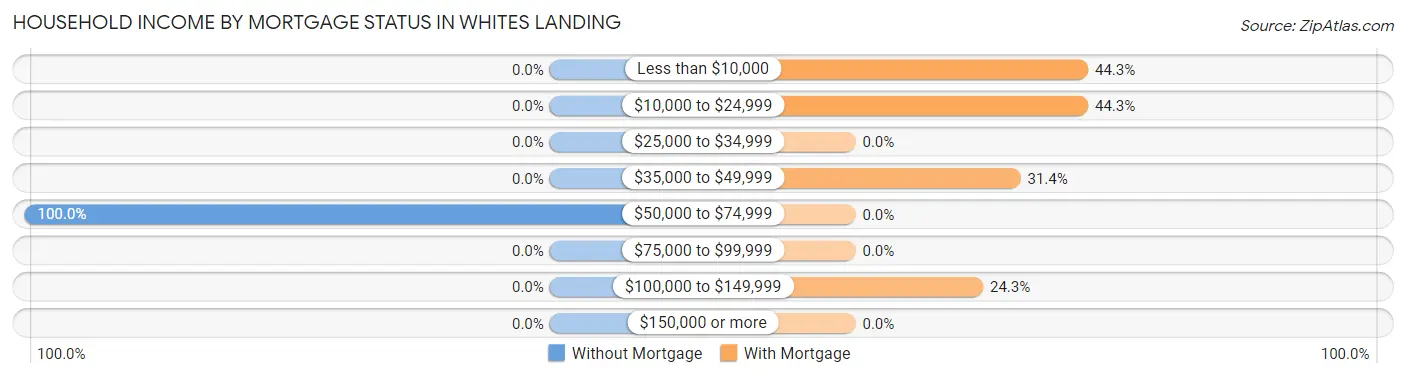
| Household Income | Without Mortgage | With Mortgage |
| Less than $10,000 | 0 (0.0%) | 31 (44.3%) |
| $10,000 to $24,999 | 0 (0.0%) | 31 (44.3%) |
| $25,000 to $34,999 | 0 (0.0%) | 0 (0.0%) |
| $35,000 to $49,999 | 0 (0.0%) | 22 (31.4%) |
| $50,000 to $74,999 | 5 (100.0%) | 0 (0.0%) |
| $75,000 to $99,999 | 0 (0.0%) | 0 (0.0%) |
| $100,000 to $149,999 | 0 (0.0%) | 17 (24.3%) |
| $150,000 or more | 0 (0.0%) | 0 (0.0%) |
| Total | 5 (100.0%) | 70 (100.0%) |
Property Value to Household Income Ratio in Whites Landing
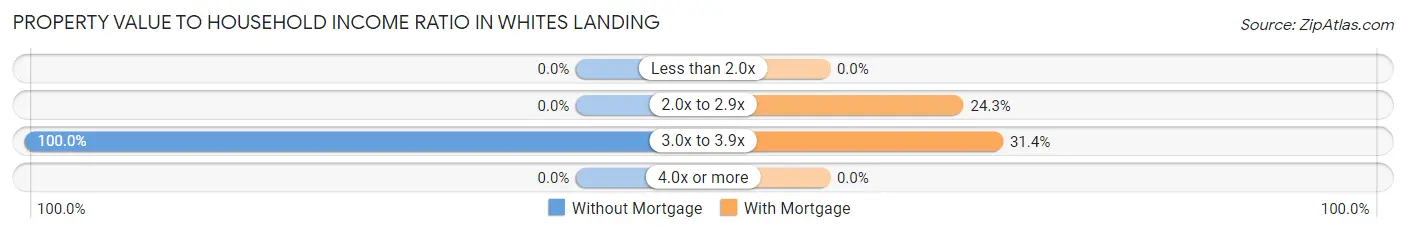
| Value-to-Income Ratio | Without Mortgage | With Mortgage |
| Less than 2.0x | 0 (0.0%) | 0 (0.0%) |
| 2.0x to 2.9x | 0 (0.0%) | 17 (24.3%) |
| 3.0x to 3.9x | 5 (100.0%) | 22 (31.4%) |
| 4.0x or more | 0 (0.0%) | 0 (0.0%) |
| Total | 5 (100.0%) | 70 (100.0%) |
Real Estate Taxes by Mortgage Status in Whites Landing
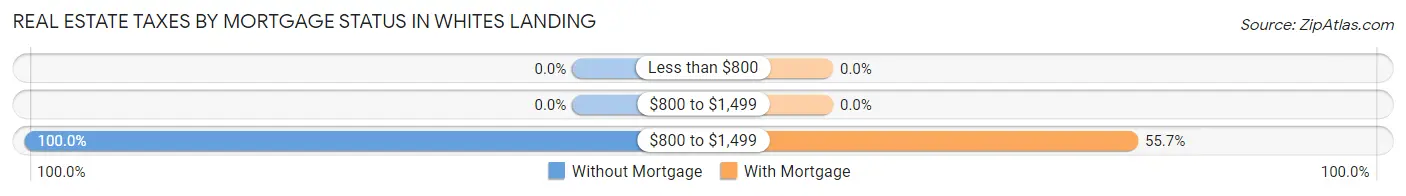
| Property Taxes | Without Mortgage | With Mortgage |
| Less than $800 | 0 (0.0%) | 0 (0.0%) |
| $800 to $1,499 | 0 (0.0%) | 0 (0.0%) |
| $800 to $1,499 | 5 (100.0%) | 39 (55.7%) |
| Total | 5 (100.0%) | 70 (100.0%) |
Health & Disability in Whites Landing
Health Insurance Coverage by Age in Whites Landing
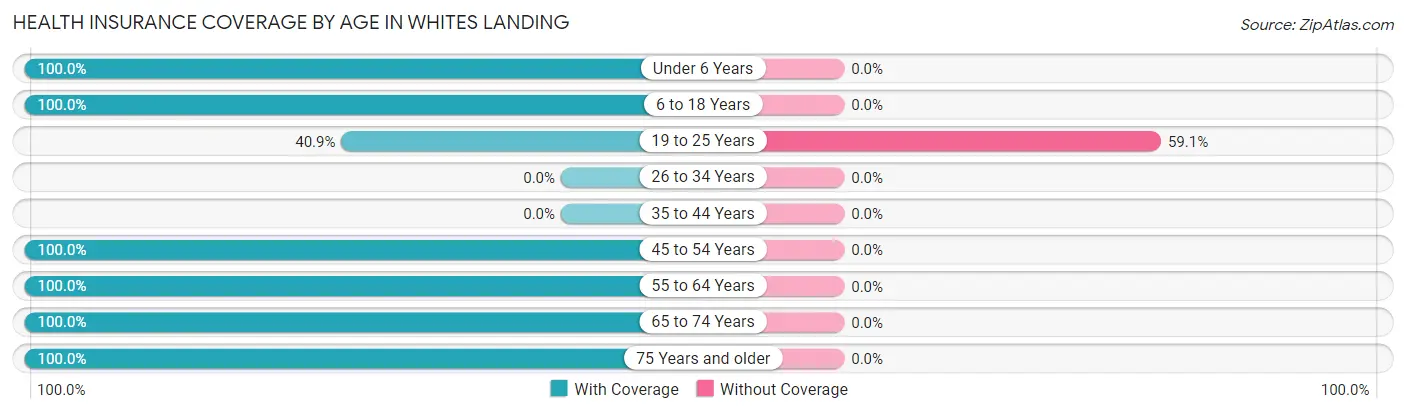
| Age Bracket | With Coverage | Without Coverage |
| Under 6 Years | 17 (100.0%) | 0 (0.0%) |
| 6 to 18 Years | 10 (100.0%) | 0 (0.0%) |
| 19 to 25 Years | 70 (40.9%) | 101 (59.1%) |
| 26 to 34 Years | 0 (0.0%) | 0 (0.0%) |
| 35 to 44 Years | 0 (0.0%) | 0 (0.0%) |
| 45 to 54 Years | 63 (100.0%) | 0 (0.0%) |
| 55 to 64 Years | 75 (100.0%) | 0 (0.0%) |
| 65 to 74 Years | 36 (100.0%) | 0 (0.0%) |
| 75 Years and older | 12 (100.0%) | 0 (0.0%) |
| Total | 283 (73.7%) | 101 (26.3%) |
Health Insurance Coverage by Citizenship Status in Whites Landing
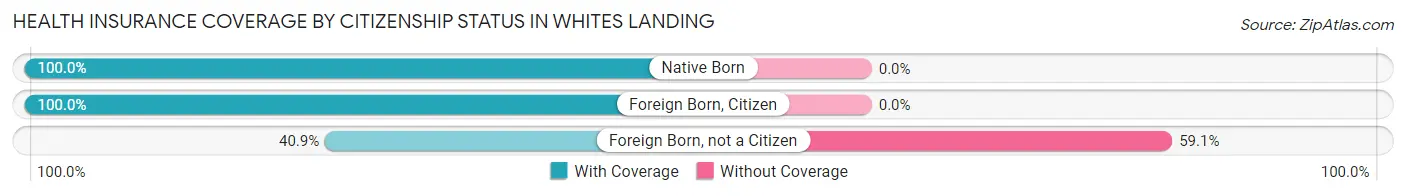
| Citizenship Status | With Coverage | Without Coverage |
| Native Born | 17 (100.0%) | 0 (0.0%) |
| Foreign Born, Citizen | 10 (100.0%) | 0 (0.0%) |
| Foreign Born, not a Citizen | 70 (40.9%) | 101 (59.1%) |
Health Insurance Coverage by Household Income in Whites Landing
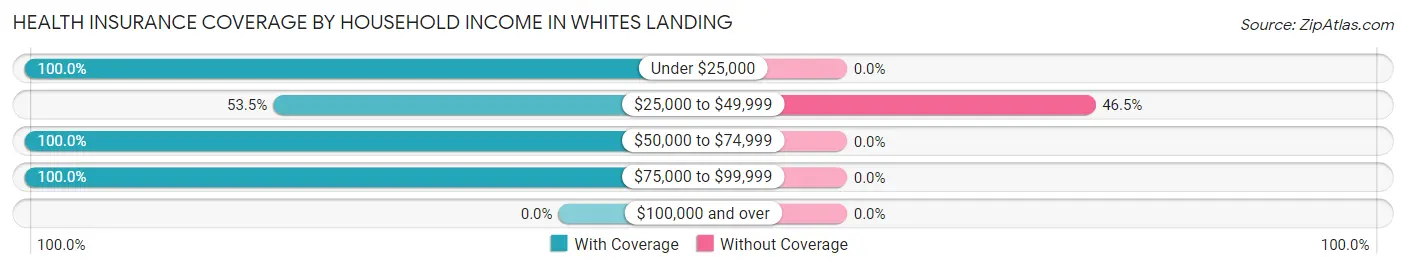
| Household Income | With Coverage | Without Coverage |
| Under $25,000 | 79 (100.0%) | 0 (0.0%) |
| $25,000 to $49,999 | 116 (53.5%) | 101 (46.5%) |
| $50,000 to $74,999 | 55 (100.0%) | 0 (0.0%) |
| $75,000 to $99,999 | 33 (100.0%) | 0 (0.0%) |
| $100,000 and over | 0 (0.0%) | 0 (0.0%) |
Public vs Private Health Insurance Coverage by Age in Whites Landing

| Age Bracket | Public Insurance | Private Insurance |
| Under 6 | 17 (100.0%) | 0 (0.0%) |
| 6 to 18 Years | 0 (0.0%) | 10 (100.0%) |
| 19 to 25 Years | 63 (36.8%) | 7 (4.1%) |
| 25 to 34 Years | 0 (0.0%) | 0 (0.0%) |
| 35 to 44 Years | 0 (0.0%) | 0 (0.0%) |
| 45 to 54 Years | 63 (100.0%) | 0 (0.0%) |
| 55 to 64 Years | 32 (42.7%) | 43 (57.3%) |
| 65 to 74 Years | 36 (100.0%) | 5 (13.9%) |
| 75 Years and over | 12 (100.0%) | 12 (100.0%) |
| Total | 223 (58.1%) | 77 (20.1%) |
Disability Status by Sex by Age in Whites Landing
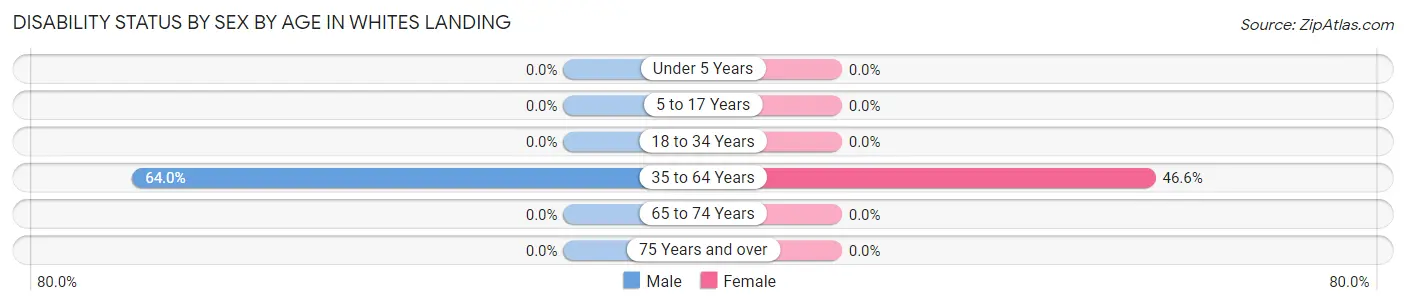
| Age Bracket | Male | Female |
| Under 5 Years | 0 (0.0%) | 0 (0.0%) |
| 5 to 17 Years | 0 (0.0%) | 0 (0.0%) |
| 18 to 34 Years | 0 (0.0%) | 0 (0.0%) |
| 35 to 64 Years | 32 (64.0%) | 41 (46.6%) |
| 65 to 74 Years | 0 (0.0%) | 0 (0.0%) |
| 75 Years and over | 0 (0.0%) | 0 (0.0%) |
Disability Class by Sex by Age in Whites Landing
Disability Class: Hearing Difficulty
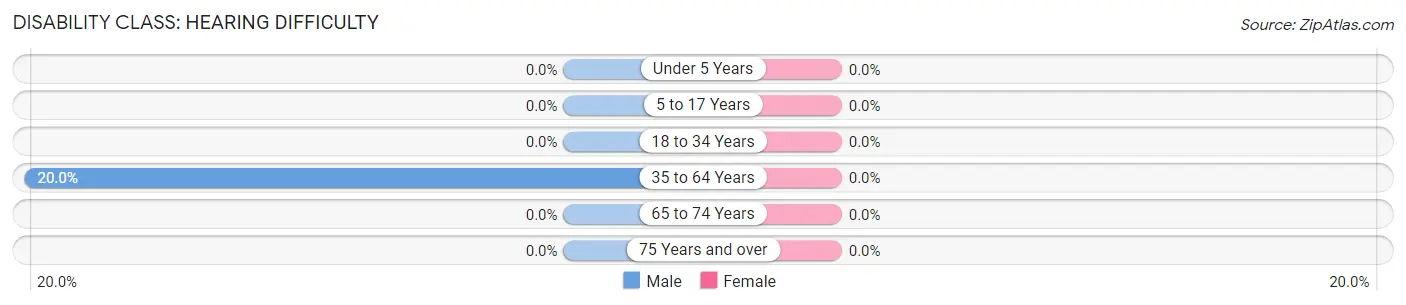
| Age Bracket | Male | Female |
| Under 5 Years | 0 (0.0%) | 0 (0.0%) |
| 5 to 17 Years | 0 (0.0%) | 0 (0.0%) |
| 18 to 34 Years | 0 (0.0%) | 0 (0.0%) |
| 35 to 64 Years | 10 (20.0%) | 0 (0.0%) |
| 65 to 74 Years | 0 (0.0%) | 0 (0.0%) |
| 75 Years and over | 0 (0.0%) | 0 (0.0%) |
Disability Class: Vision Difficulty
| Age Bracket | Male | Female |
| Under 5 Years | 0 (0.0%) | 0 (0.0%) |
| 5 to 17 Years | 0 (0.0%) | 0 (0.0%) |
| 18 to 34 Years | 0 (0.0%) | 0 (0.0%) |
| 35 to 64 Years | 0 (0.0%) | 0 (0.0%) |
| 65 to 74 Years | 0 (0.0%) | 0 (0.0%) |
| 75 Years and over | 0 (0.0%) | 0 (0.0%) |
Disability Class: Cognitive Difficulty
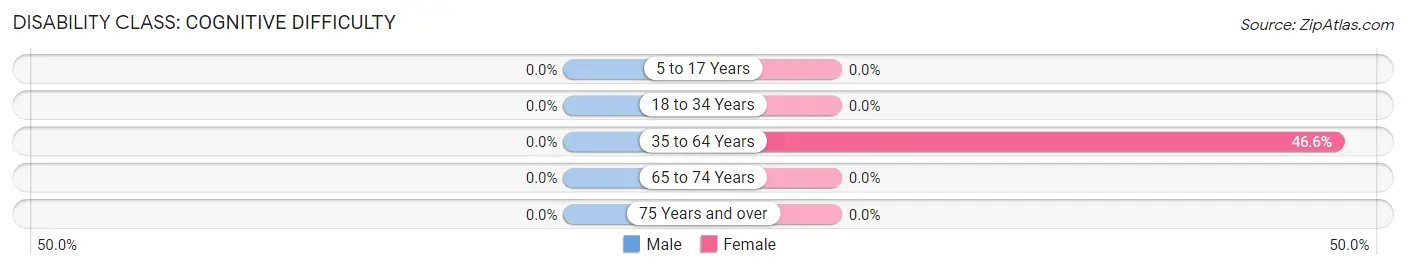
| Age Bracket | Male | Female |
| 5 to 17 Years | 0 (0.0%) | 0 (0.0%) |
| 18 to 34 Years | 0 (0.0%) | 0 (0.0%) |
| 35 to 64 Years | 0 (0.0%) | 41 (46.6%) |
| 65 to 74 Years | 0 (0.0%) | 0 (0.0%) |
| 75 Years and over | 0 (0.0%) | 0 (0.0%) |
Disability Class: Ambulatory Difficulty
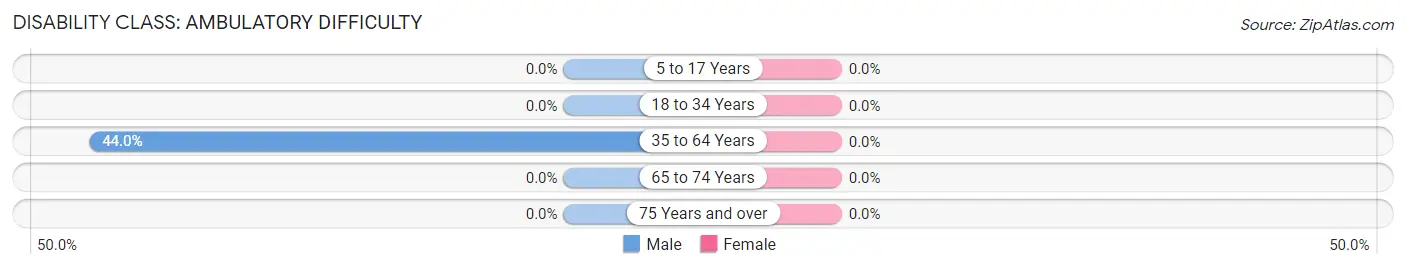
| Age Bracket | Male | Female |
| 5 to 17 Years | 0 (0.0%) | 0 (0.0%) |
| 18 to 34 Years | 0 (0.0%) | 0 (0.0%) |
| 35 to 64 Years | 22 (44.0%) | 0 (0.0%) |
| 65 to 74 Years | 0 (0.0%) | 0 (0.0%) |
| 75 Years and over | 0 (0.0%) | 0 (0.0%) |
Disability Class: Self-Care Difficulty
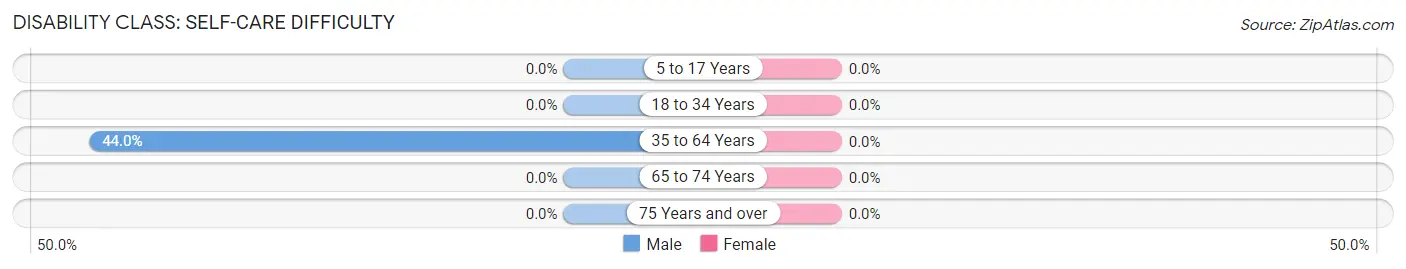
| Age Bracket | Male | Female |
| 5 to 17 Years | 0 (0.0%) | 0 (0.0%) |
| 18 to 34 Years | 0 (0.0%) | 0 (0.0%) |
| 35 to 64 Years | 22 (44.0%) | 0 (0.0%) |
| 65 to 74 Years | 0 (0.0%) | 0 (0.0%) |
| 75 Years and over | 0 (0.0%) | 0 (0.0%) |
Technology Access in Whites Landing
Computing Device Access in Whites Landing
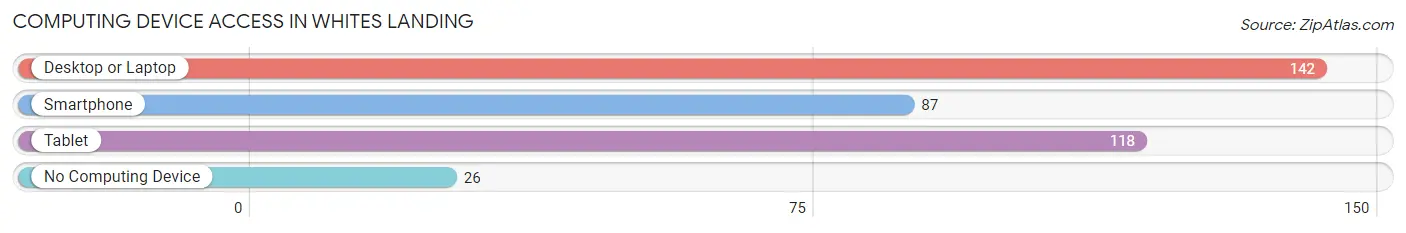
| Device Type | # Households | % Households |
| Desktop or Laptop | 142 | 80.7% |
| Smartphone | 87 | 49.4% |
| Tablet | 118 | 67.0% |
| No Computing Device | 26 | 14.8% |
| Total | 176 | 100.0% |
Internet Access in Whites Landing
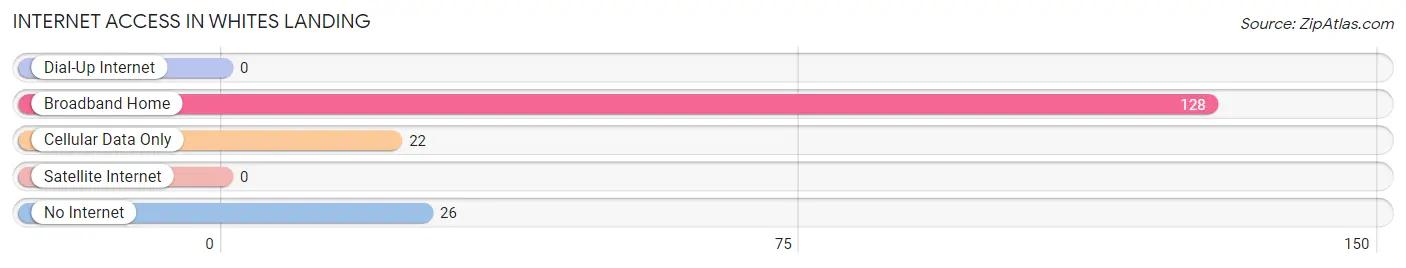
| Internet Type | # Households | % Households |
| Dial-Up Internet | 0 | 0.0% |
| Broadband Home | 128 | 72.7% |
| Cellular Data Only | 22 | 12.5% |
| Satellite Internet | 0 | 0.0% |
| No Internet | 26 | 14.8% |
| Total | 176 | 100.0% |
Whites Landing Summary
Whites Landing is an unincorporated community located in the southeastern corner of Ohio, in the United States. It is situated in the southeastern corner of Scioto County, along the Ohio River. The community is located on the west bank of the river, just south of the city of Portsmouth.
History
Whites Landing was first settled in the early 1800s by a man named William White. White was a veteran of the War of 1812 and had served in the Ohio Militia. He was granted a land patent for the area in 1817 and established a ferry service across the Ohio River. The ferry service was a major transportation link between the Ohio and Kentucky sides of the river.
The community was named after William White and was officially established in 1820. In the early years, the community was a small farming and fishing village. It was also a popular stop for steamboats traveling up and down the Ohio River.
In the late 1800s, the community began to grow and develop. A post office was established in 1883 and a school was built in 1885. The community also had a general store, a blacksmith shop, and a few other businesses.
Geography
Whites Landing is located in the southeastern corner of Scioto County, along the Ohio River. The community is situated on the west bank of the river, just south of the city of Portsmouth. The community is located at an elevation of 545 feet above sea level.
The climate in Whites Landing is humid continental, with hot summers and cold winters. The average annual temperature is around 50 degrees Fahrenheit. The average annual precipitation is around 40 inches.
Economy
The economy of Whites Landing is largely based on agriculture and tourism. The community is home to several farms, which produce a variety of crops, including corn, soybeans, and wheat. The community also has several small businesses, including a general store, a restaurant, and a few other shops.
Tourism is also an important part of the local economy. The community is located near several popular attractions, including Shawnee State Park, the Ohio River, and the Portsmouth Historic District. The community also hosts several annual events, such as the Whites Landing Festival and the Whites Landing Car Show.
Demographics
As of the 2010 census, the population of Whites Landing was 1,072. The racial makeup of the community was 97.3% White, 0.9% African American, 0.2% Native American, 0.2% Asian, and 1.4% from other races. The median household income was $37,917, and the median family income was $45,625.
The population of Whites Landing is largely rural and is spread out over a large area. The community is served by the Scioto County School District, which includes several elementary, middle, and high schools. The community also has a public library and a few churches.
Common Questions
What is Per Capita Income in Whites Landing?
Per Capita income in Whites Landing is $12,789.
What is the Median Family Income in Whites Landing?
Median Family Income in Whites Landing is $36,734.
What is the Median Household income in Whites Landing?
Median Household Income in Whites Landing is $31,023.
What is Income or Wage Gap in Whites Landing?
Income or Wage Gap in Whites Landing is 39.6%.
Women in Whites Landing earn 60.4 cents for every dollar earned by a man.
What is Inequality or Gini Index in Whites Landing?
Inequality or Gini Index in Whites Landing is 0.50.
What is the Total Population of Whites Landing?
Total Population of Whites Landing is 384.
What is the Total Male Population of Whites Landing?
Total Male Population of Whites Landing is 186.
What is the Total Female Population of Whites Landing?
Total Female Population of Whites Landing is 198.
What is the Ratio of Males per 100 Females in Whites Landing?
There are 93.94 Males per 100 Females in Whites Landing.
What is the Ratio of Females per 100 Males in Whites Landing?
There are 106.45 Females per 100 Males in Whites Landing.
What is the Median Population Age in Whites Landing?
Median Population Age in Whites Landing is 23.8 Years.
What is the Average Family Size in Whites Landing
Average Family Size in Whites Landing is 2.9 People.
What is the Average Household Size in Whites Landing
Average Household Size in Whites Landing is 2.2 People.
How Large is the Labor Force in Whites Landing?
There are 192 People in the Labor Forcein in Whites Landing.
What is the Percentage of People in the Labor Force in Whites Landing?
52.9% of People are in the Labor Force in Whites Landing.
What is the Unemployment Rate in Whites Landing?
Unemployment Rate in Whites Landing is 36.5%.