Brady Lake, OH Map & Demographics
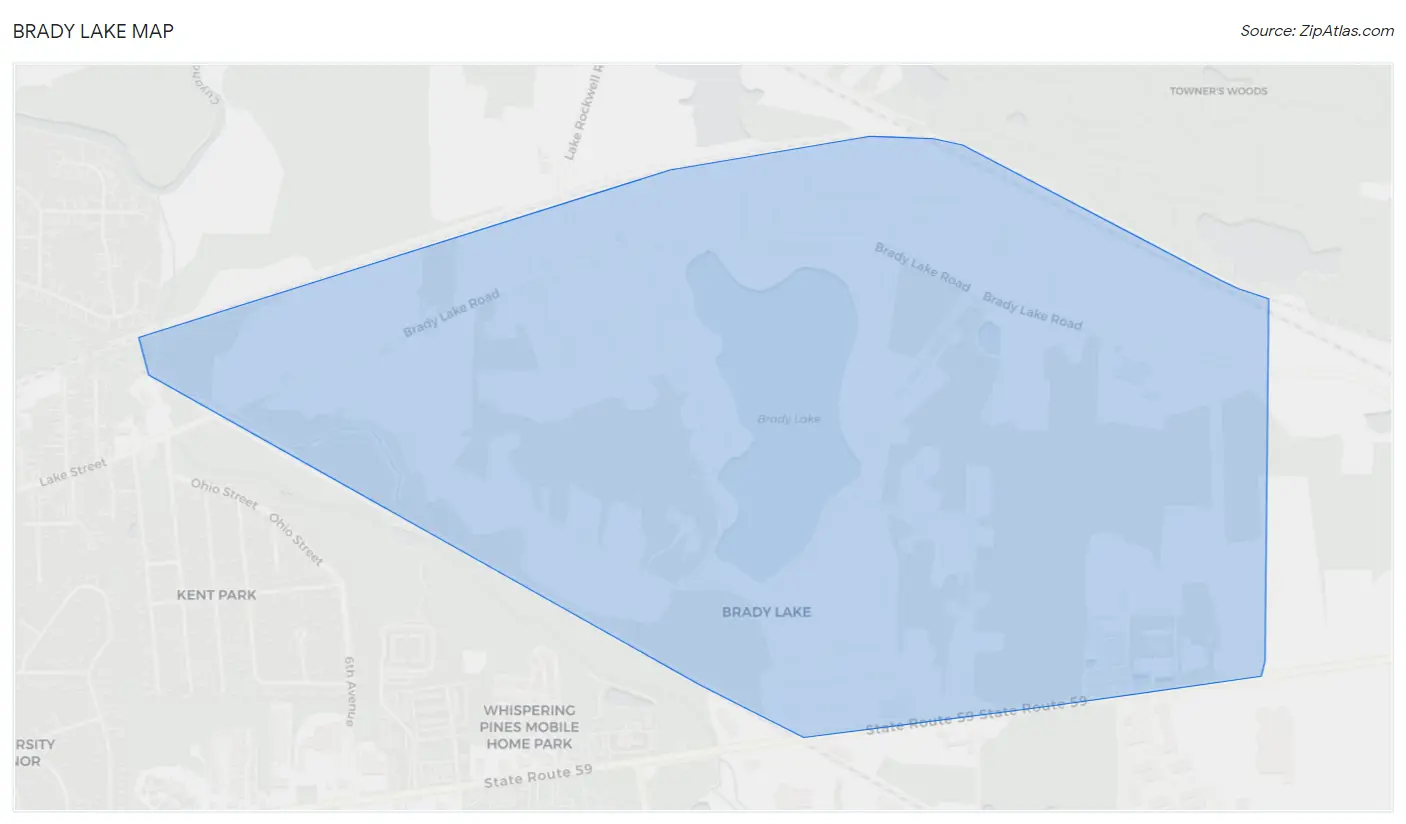
Brady Lake Map
Brady Lake Overview
$31,060
PER CAPITA INCOME
$76,375
AVG FAMILY INCOME
$44,464
AVG HOUSEHOLD INCOME
29.3%
WAGE / INCOME GAP [ % ]
70.7¢/ $1
WAGE / INCOME GAP [ $ ]
0.40
INEQUALITY / GINI INDEX
868
TOTAL POPULATION
450
MALE POPULATION
418
FEMALE POPULATION
107.66
MALES / 100 FEMALES
92.89
FEMALES / 100 MALES
48.5
MEDIAN AGE
2.9
AVG FAMILY SIZE
1.9
AVG HOUSEHOLD SIZE
510
LABOR FORCE [ PEOPLE ]
67.8%
PERCENT IN LABOR FORCE
24.3%
UNEMPLOYMENT RATE
Brady Lake Area Codes
Income in Brady Lake
Income Overview in Brady Lake
Per Capita Income in Brady Lake is $31,060, while median incomes of families and households are $76,375 and $44,464 respectively.
| Characteristic | Number | Measure |
| Per Capita Income | 868 | $31,060 |
| Median Family Income | 169 | $76,375 |
| Mean Family Income | 169 | $77,546 |
| Median Household Income | 464 | $44,464 |
| Mean Household Income | 464 | $56,795 |
| Income Deficit | 169 | $0 |
| Wage / Income Gap (%) | 868 | 29.29% |
| Wage / Income Gap ($) | 868 | 70.71¢ per $1 |
| Gini / Inequality Index | 868 | 0.40 |
Earnings by Sex in Brady Lake
Average Earnings in Brady Lake are $40,096, $43,150 for men and $30,511 for women, a difference of 29.3%.
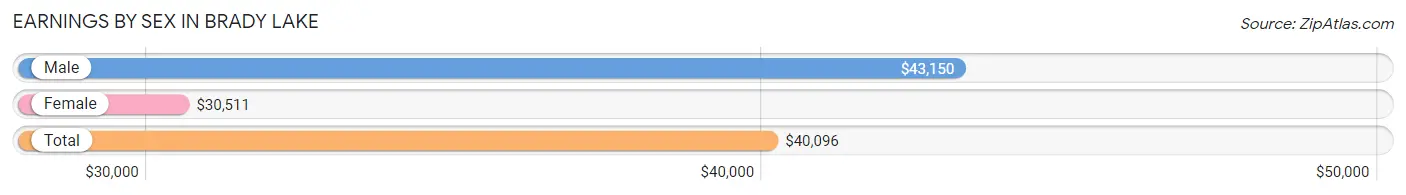
| Sex | Number | Average Earnings |
| Male | 177 (44.7%) | $43,150 |
| Female | 219 (55.3%) | $30,511 |
| Total | 396 (100.0%) | $40,096 |
Earnings by Sex by Income Bracket in Brady Lake
The most common earnings brackets in Brady Lake are $40,000 to $44,999 for men (40 | 22.6%) and $40,000 to $44,999 for women (27 | 12.3%).
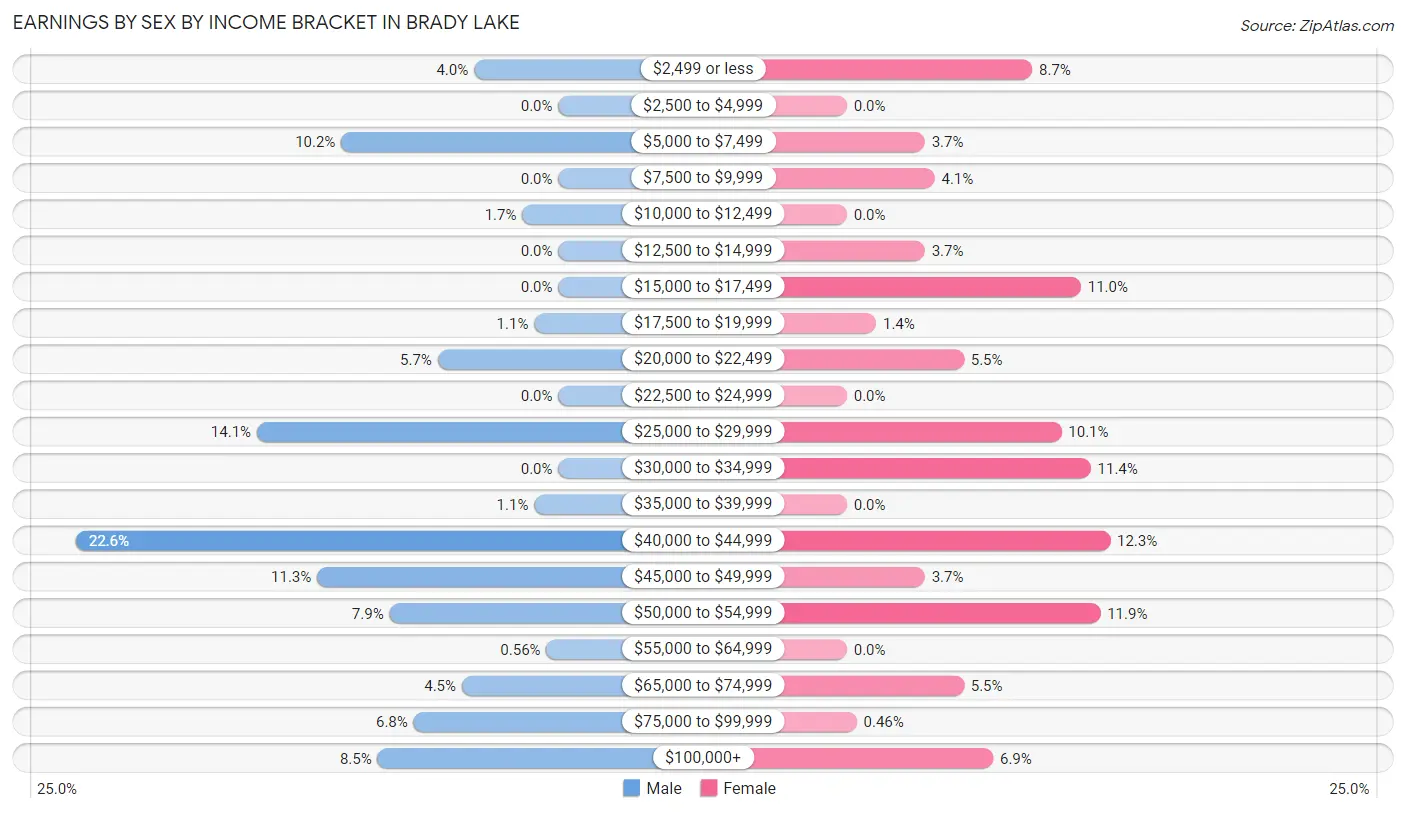
| Income | Male | Female |
| $2,499 or less | 7 (4.0%) | 19 (8.7%) |
| $2,500 to $4,999 | 0 (0.0%) | 0 (0.0%) |
| $5,000 to $7,499 | 18 (10.2%) | 8 (3.6%) |
| $7,500 to $9,999 | 0 (0.0%) | 9 (4.1%) |
| $10,000 to $12,499 | 3 (1.7%) | 0 (0.0%) |
| $12,500 to $14,999 | 0 (0.0%) | 8 (3.6%) |
| $15,000 to $17,499 | 0 (0.0%) | 24 (11.0%) |
| $17,500 to $19,999 | 2 (1.1%) | 3 (1.4%) |
| $20,000 to $22,499 | 10 (5.7%) | 12 (5.5%) |
| $22,500 to $24,999 | 0 (0.0%) | 0 (0.0%) |
| $25,000 to $29,999 | 25 (14.1%) | 22 (10.1%) |
| $30,000 to $34,999 | 0 (0.0%) | 25 (11.4%) |
| $35,000 to $39,999 | 2 (1.1%) | 0 (0.0%) |
| $40,000 to $44,999 | 40 (22.6%) | 27 (12.3%) |
| $45,000 to $49,999 | 20 (11.3%) | 8 (3.6%) |
| $50,000 to $54,999 | 14 (7.9%) | 26 (11.9%) |
| $55,000 to $64,999 | 1 (0.6%) | 0 (0.0%) |
| $65,000 to $74,999 | 8 (4.5%) | 12 (5.5%) |
| $75,000 to $99,999 | 12 (6.8%) | 1 (0.5%) |
| $100,000+ | 15 (8.5%) | 15 (6.9%) |
| Total | 177 (100.0%) | 219 (100.0%) |
Earnings by Sex by Educational Attainment in Brady Lake
Average earnings in Brady Lake are $44,050 for men and $30,795 for women, a difference of 30.1%. Men with an educational attainment of college or associate's degree enjoy the highest average annual earnings of $53,125, while those with bachelor's degree education earn the least with $29,600. Women with an educational attainment of bachelor's degree earn the most with the average annual earnings of $73,438, while those with college or associate's degree education have the smallest earnings of $27,656.
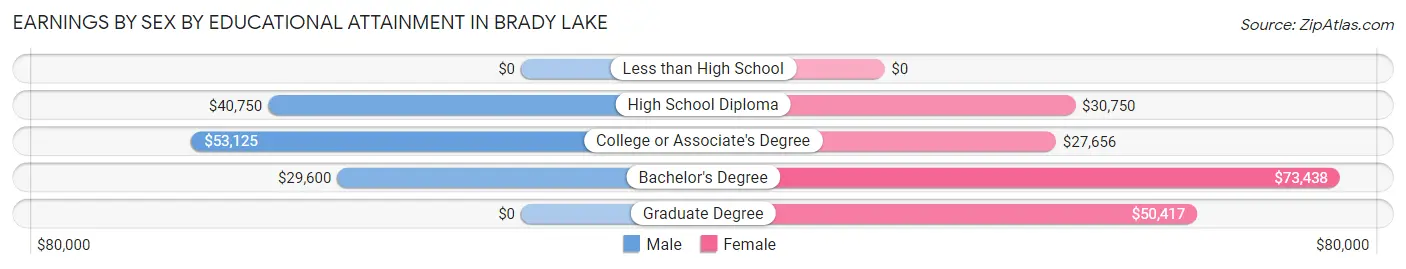
| Educational Attainment | Male Income | Female Income |
| Less than High School | - | - |
| High School Diploma | $40,750 | $30,750 |
| College or Associate's Degree | $53,125 | $27,656 |
| Bachelor's Degree | $29,600 | $73,438 |
| Graduate Degree | - | - |
| Total | $44,050 | $30,795 |
Family Income in Brady Lake
Family Income Brackets in Brady Lake
According to the Brady Lake family income data, there are 56 families falling into the $75,000 to $99,999 income range, which is the most common income bracket and makes up 33.1% of all families.
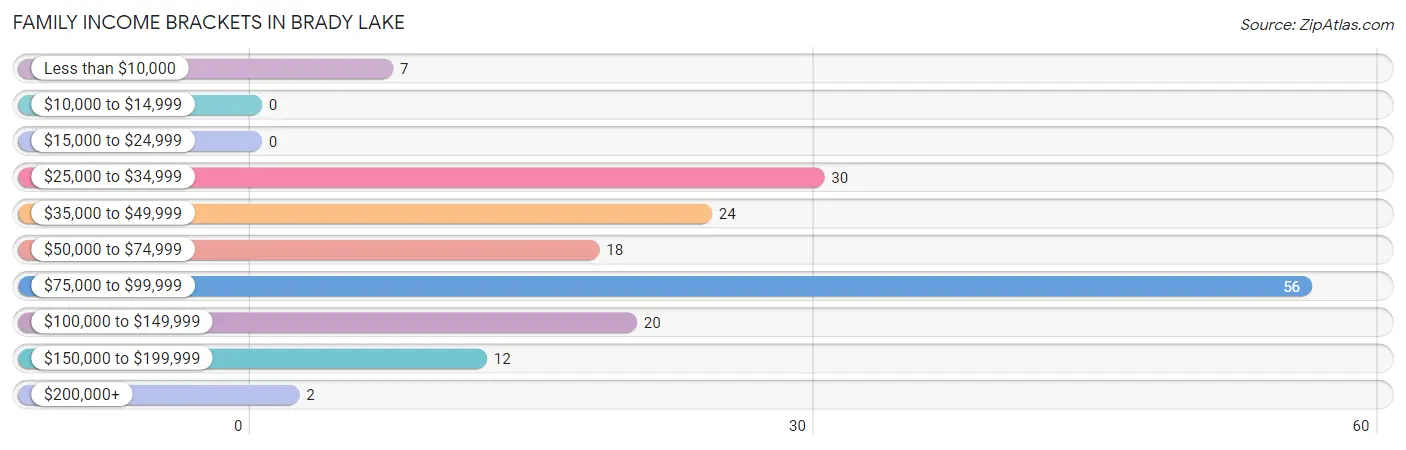
| Income Bracket | # Families | % Families |
| Less than $10,000 | 7 | 4.1% |
| $10,000 to $14,999 | 0 | 0.0% |
| $15,000 to $24,999 | 0 | 0.0% |
| $25,000 to $34,999 | 30 | 17.8% |
| $35,000 to $49,999 | 24 | 14.2% |
| $50,000 to $74,999 | 18 | 10.7% |
| $75,000 to $99,999 | 56 | 33.1% |
| $100,000 to $149,999 | 20 | 11.8% |
| $150,000 to $199,999 | 12 | 7.1% |
| $200,000+ | 2 | 1.2% |
Family Income by Famaliy Size in Brady Lake
3-person families (54 | 32.0%) account for the highest median family income in Brady Lake with $92,000 per family, while 2-person families (81 | 47.9%) have the highest median income of $34,688 per family member.
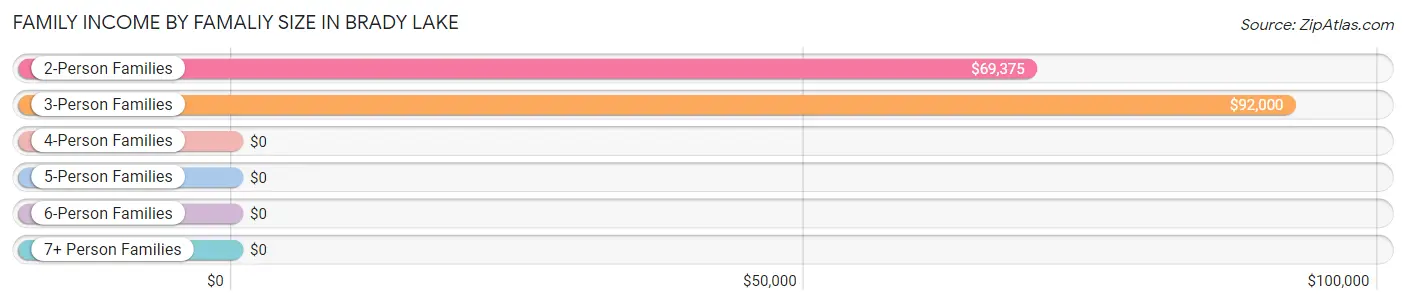
| Income Bracket | # Families | Median Income |
| 2-Person Families | 81 (47.9%) | $69,375 |
| 3-Person Families | 54 (32.0%) | $92,000 |
| 4-Person Families | 34 (20.1%) | $0 |
| 5-Person Families | 0 (0.0%) | $0 |
| 6-Person Families | 0 (0.0%) | $0 |
| 7+ Person Families | 0 (0.0%) | $0 |
| Total | 169 (100.0%) | $76,375 |
Family Income by Number of Earners in Brady Lake
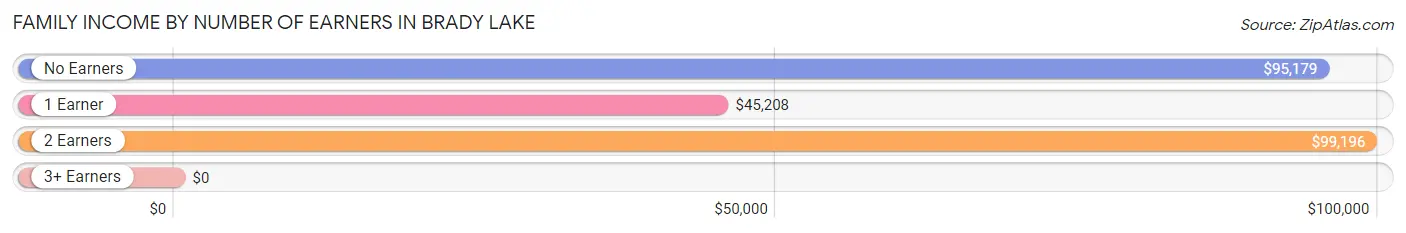
| Number of Earners | # Families | Median Income |
| No Earners | 13 (7.7%) | $95,179 |
| 1 Earner | 92 (54.4%) | $45,208 |
| 2 Earners | 55 (32.5%) | $99,196 |
| 3+ Earners | 9 (5.3%) | $0 |
| Total | 169 (100.0%) | $76,375 |
Household Income in Brady Lake
Household Income Brackets in Brady Lake
With 128 households falling in the category, the $25,000 to $34,999 income range is the most frequent in Brady Lake, accounting for 27.6% of all households. In contrast, only 7 households (1.5%) fall into the less than $10,000 income bracket, making it the least populous group.
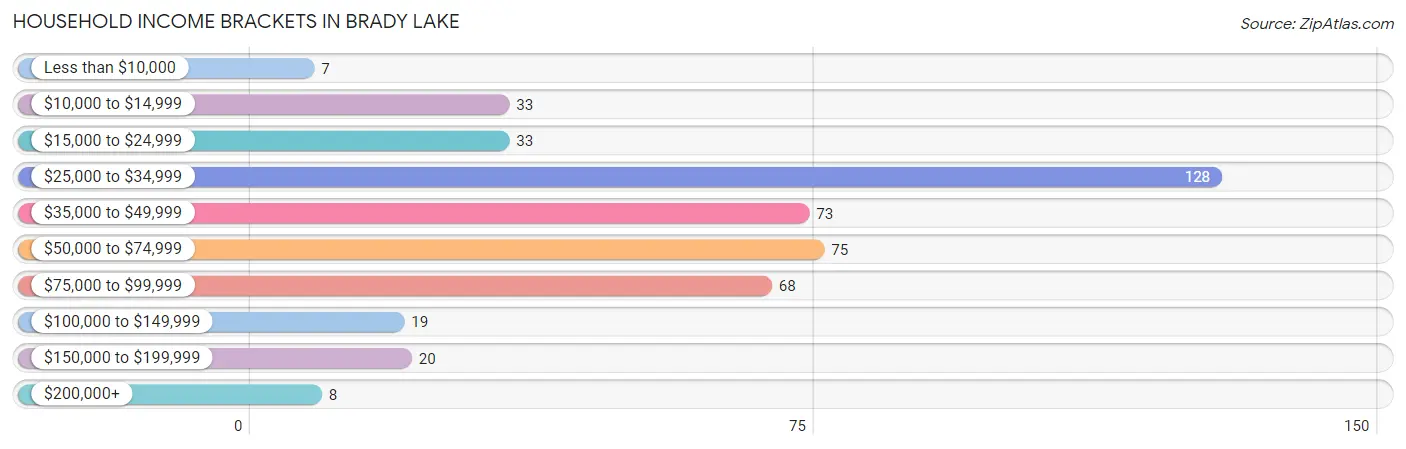
| Income Bracket | # Households | % Households |
| Less than $10,000 | 7 | 1.5% |
| $10,000 to $14,999 | 33 | 7.1% |
| $15,000 to $24,999 | 33 | 7.1% |
| $25,000 to $34,999 | 128 | 27.6% |
| $35,000 to $49,999 | 73 | 15.7% |
| $50,000 to $74,999 | 75 | 16.2% |
| $75,000 to $99,999 | 68 | 14.7% |
| $100,000 to $149,999 | 19 | 4.1% |
| $150,000 to $199,999 | 20 | 4.3% |
| $200,000+ | 8 | 1.7% |
Household Income by Householder Age in Brady Lake
The median household income in Brady Lake is $44,464, with the highest median household income of $57,950 found in the 65+ years age bracket for the primary householder. A total of 145 households (31.2%) fall into this category. Meanwhile, the 15 to 24 years age bracket for the primary householder has the lowest median household income of $0, with 28 households (6.0%) in this group.
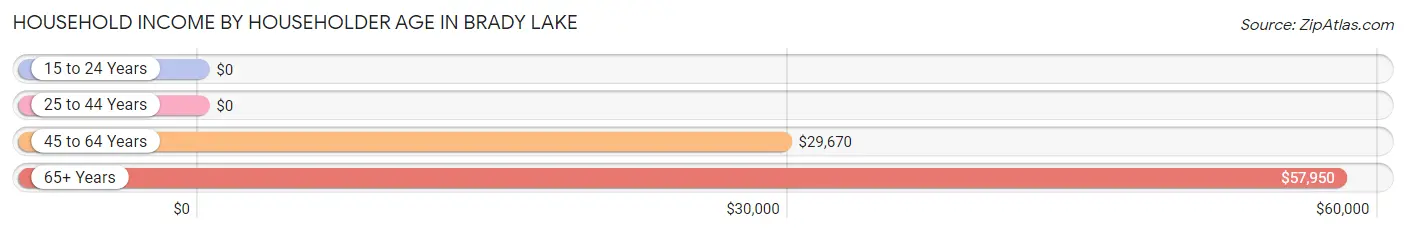
| Income Bracket | # Households | Median Income |
| 15 to 24 Years | 28 (6.0%) | $0 |
| 25 to 44 Years | 86 (18.5%) | $0 |
| 45 to 64 Years | 205 (44.2%) | $29,670 |
| 65+ Years | 145 (31.2%) | $57,950 |
| Total | 464 (100.0%) | $44,464 |
Poverty in Brady Lake
Income Below Poverty by Sex and Age in Brady Lake
With 13.3% poverty level for males and 15.5% for females among the residents of Brady Lake, under 5 year old males and 18 to 24 year old females are the most vulnerable to poverty, with 6 males (100.0%) and 13 females (52.0%) in their respective age groups living below the poverty level.
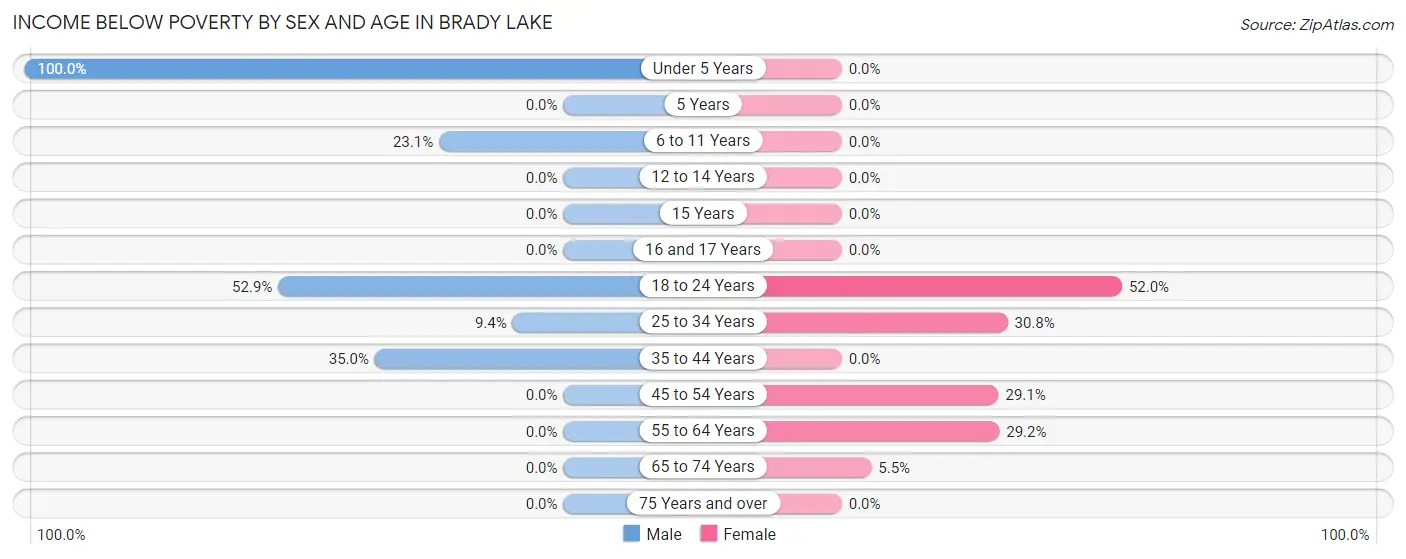
| Age Bracket | Male | Female |
| Under 5 Years | 6 (100.0%) | 0 (0.0%) |
| 5 Years | 0 (0.0%) | 0 (0.0%) |
| 6 to 11 Years | 6 (23.1%) | 0 (0.0%) |
| 12 to 14 Years | 0 (0.0%) | 0 (0.0%) |
| 15 Years | 0 (0.0%) | 0 (0.0%) |
| 16 and 17 Years | 0 (0.0%) | 0 (0.0%) |
| 18 to 24 Years | 36 (52.9%) | 13 (52.0%) |
| 25 to 34 Years | 5 (9.4%) | 12 (30.8%) |
| 35 to 44 Years | 7 (35.0%) | 0 (0.0%) |
| 45 to 54 Years | 0 (0.0%) | 16 (29.1%) |
| 55 to 64 Years | 0 (0.0%) | 19 (29.2%) |
| 65 to 74 Years | 0 (0.0%) | 5 (5.5%) |
| 75 Years and over | 0 (0.0%) | 0 (0.0%) |
| Total | 60 (13.3%) | 65 (15.5%) |
Income Above Poverty by Sex and Age in Brady Lake
According to the poverty statistics in Brady Lake, males aged 12 to 14 years and females aged under 5 years are the age groups that are most secure financially, with 100.0% of males and 100.0% of females in these age groups living above the poverty line.
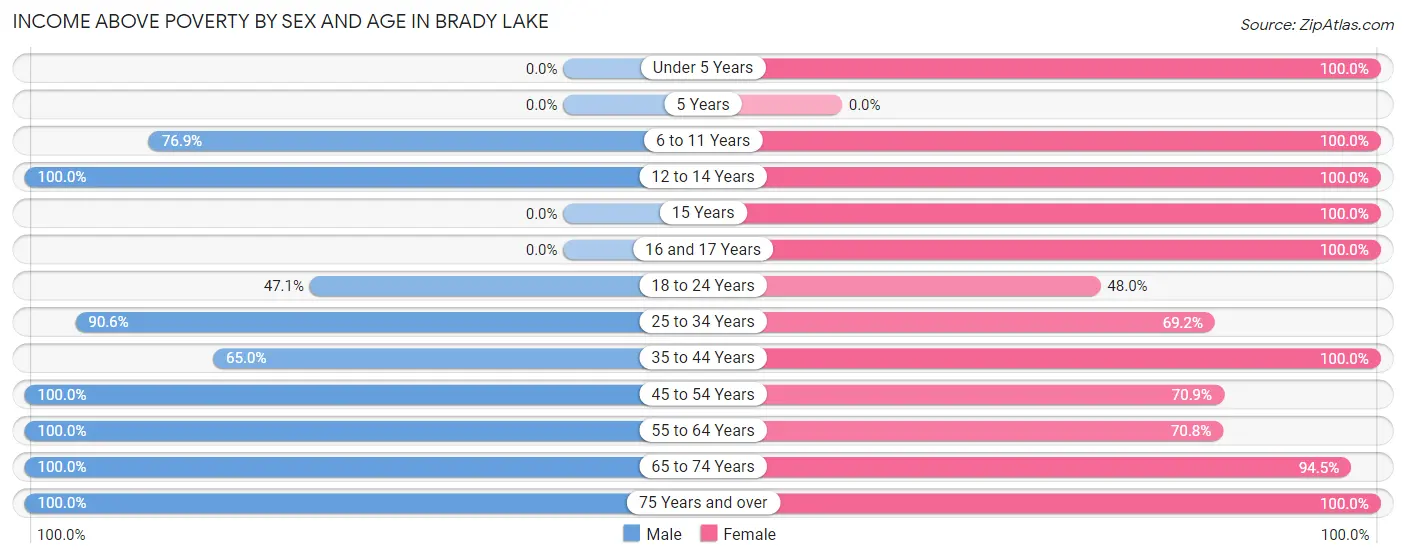
| Age Bracket | Male | Female |
| Under 5 Years | 0 (0.0%) | 26 (100.0%) |
| 5 Years | 0 (0.0%) | 0 (0.0%) |
| 6 to 11 Years | 20 (76.9%) | 12 (100.0%) |
| 12 to 14 Years | 21 (100.0%) | 1 (100.0%) |
| 15 Years | 0 (0.0%) | 24 (100.0%) |
| 16 and 17 Years | 0 (0.0%) | 30 (100.0%) |
| 18 to 24 Years | 32 (47.1%) | 12 (48.0%) |
| 25 to 34 Years | 48 (90.6%) | 27 (69.2%) |
| 35 to 44 Years | 13 (65.0%) | 28 (100.0%) |
| 45 to 54 Years | 112 (100.0%) | 39 (70.9%) |
| 55 to 64 Years | 50 (100.0%) | 46 (70.8%) |
| 65 to 74 Years | 88 (100.0%) | 86 (94.5%) |
| 75 Years and over | 6 (100.0%) | 22 (100.0%) |
| Total | 390 (86.7%) | 353 (84.5%) |
Income Below Poverty Among Married-Couple Families in Brady Lake
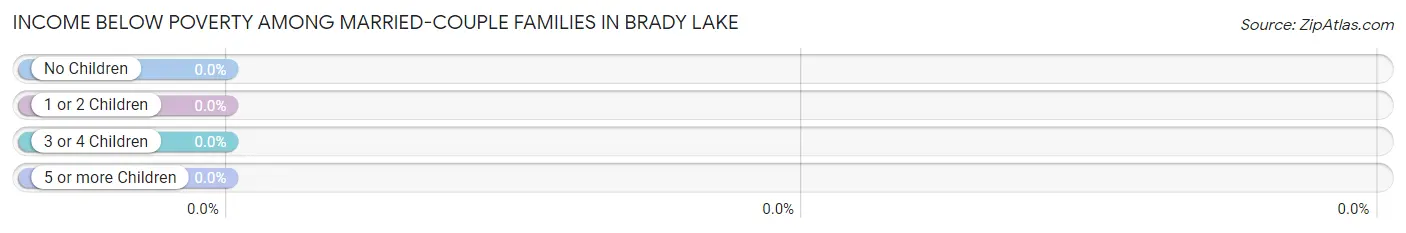
| Children | Above Poverty | Below Poverty |
| No Children | 69 (100.0%) | 0 (0.0%) |
| 1 or 2 Children | 33 (100.0%) | 0 (0.0%) |
| 3 or 4 Children | 0 (0.0%) | 0 (0.0%) |
| 5 or more Children | 0 (0.0%) | 0 (0.0%) |
| Total | 102 (100.0%) | 0 (0.0%) |
Income Below Poverty Among Single-Parent Households in Brady Lake
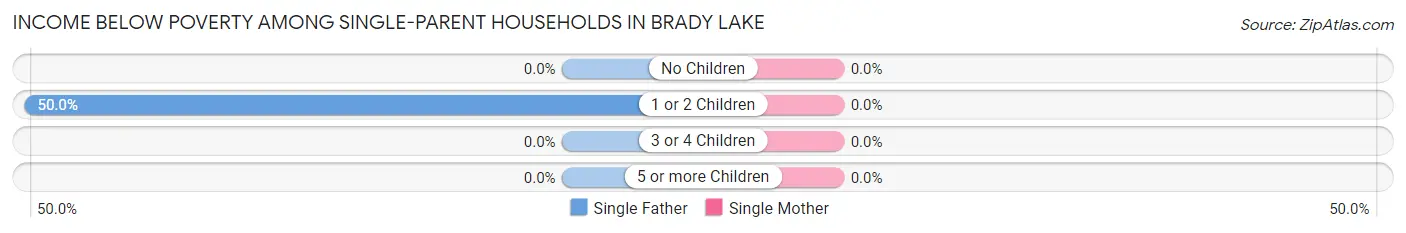
| Children | Single Father | Single Mother |
| No Children | 0 (0.0%) | 0 (0.0%) |
| 1 or 2 Children | 7 (50.0%) | 0 (0.0%) |
| 3 or 4 Children | 0 (0.0%) | 0 (0.0%) |
| 5 or more Children | 0 (0.0%) | 0 (0.0%) |
| Total | 7 (50.0%) | 0 (0.0%) |
Income Below Poverty Among Married-Couple vs Single-Parent Households in Brady Lake
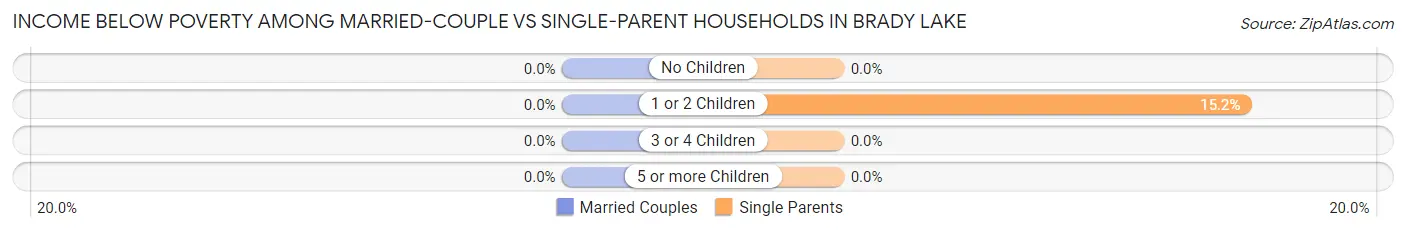
| Children | Married-Couple Families | Single-Parent Households |
| No Children | 0 (0.0%) | 0 (0.0%) |
| 1 or 2 Children | 0 (0.0%) | 7 (15.2%) |
| 3 or 4 Children | 0 (0.0%) | 0 (0.0%) |
| 5 or more Children | 0 (0.0%) | 0 (0.0%) |
| Total | 0 (0.0%) | 7 (10.4%) |
Race in Brady Lake
The most populous races in Brady Lake are White / Caucasian (844 | 97.2%), Black / African American (18 | 2.1%), and Two or more Races (6 | 0.7%).
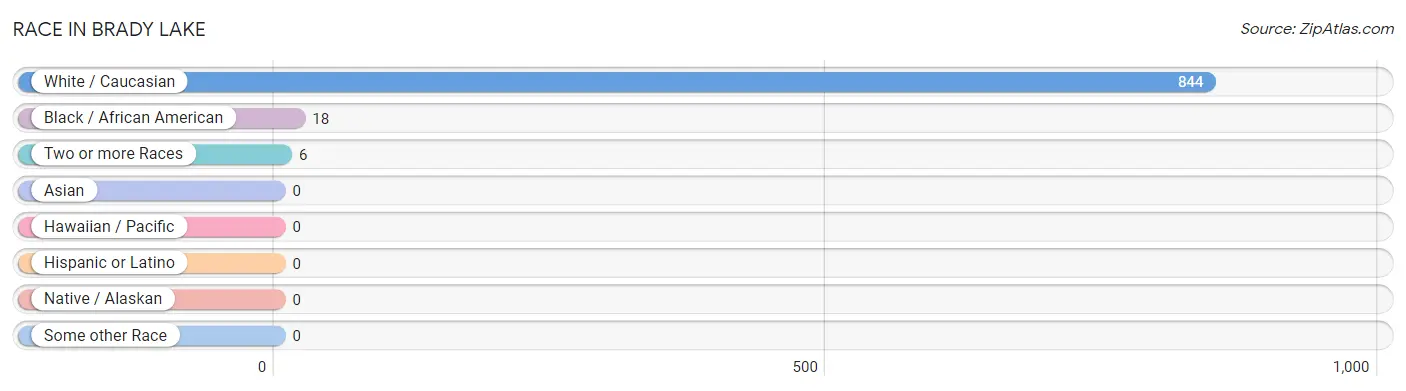
| Race | # Population | % Population |
| Asian | 0 | 0.0% |
| Black / African American | 18 | 2.1% |
| Hawaiian / Pacific | 0 | 0.0% |
| Hispanic or Latino | 0 | 0.0% |
| Native / Alaskan | 0 | 0.0% |
| White / Caucasian | 844 | 97.2% |
| Two or more Races | 6 | 0.7% |
| Some other Race | 0 | 0.0% |
| Total | 868 | 100.0% |
Ancestry in Brady Lake
The most populous ancestries reported in Brady Lake are Irish (176 | 20.3%), English (170 | 19.6%), Italian (121 | 13.9%), German (116 | 13.4%), and American (63 | 7.3%), together accounting for 74.4% of all Brady Lake residents.
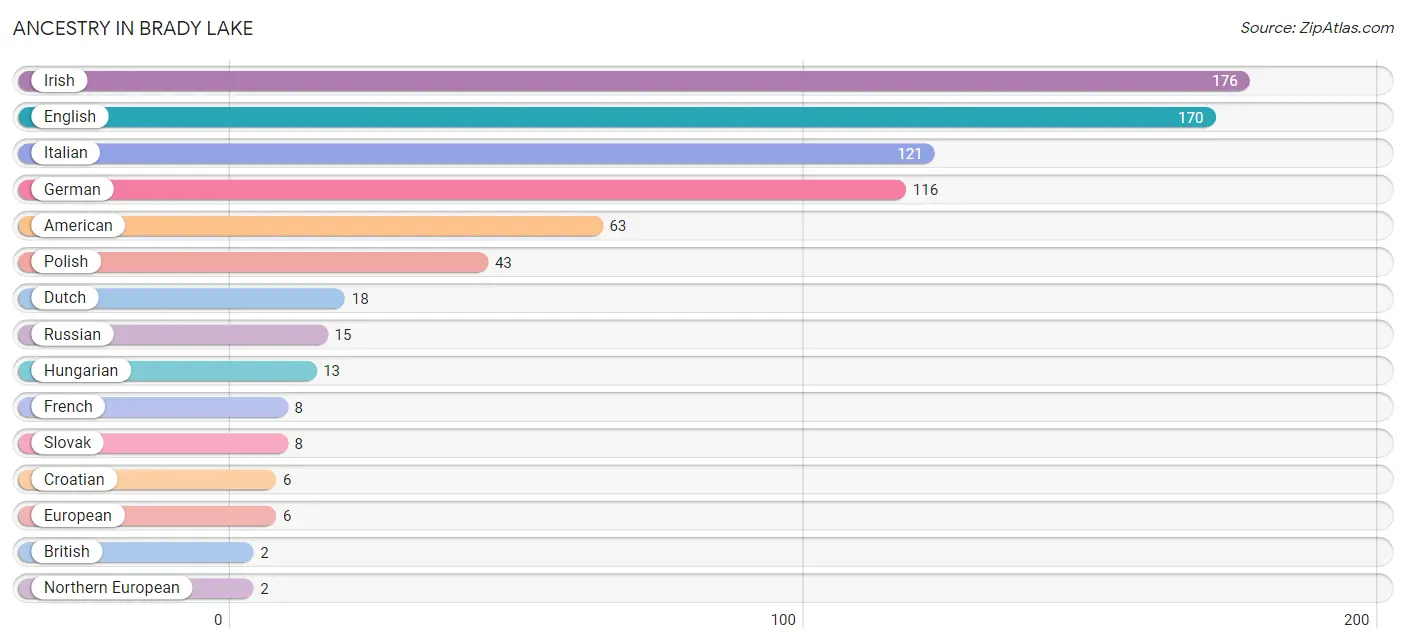
| Ancestry | # Population | % Population |
| American | 63 | 7.3% |
| Belgian | 1 | 0.1% |
| British | 2 | 0.2% |
| Croatian | 6 | 0.7% |
| Dutch | 18 | 2.1% |
| English | 170 | 19.6% |
| European | 6 | 0.7% |
| French | 8 | 0.9% |
| German | 116 | 13.4% |
| Hungarian | 13 | 1.5% |
| Irish | 176 | 20.3% |
| Italian | 121 | 13.9% |
| Northern European | 2 | 0.2% |
| Polish | 43 | 5.0% |
| Russian | 15 | 1.7% |
| Scotch-Irish | 1 | 0.1% |
| Slovak | 8 | 0.9% |
| Swedish | 2 | 0.2% | View All 18 Rows |
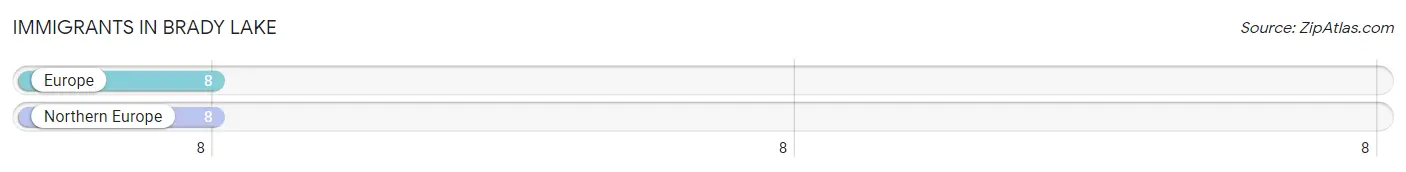
Immigrants in Brady Lake
The most numerous immigrant groups reported in Brady Lake came from Europe (8 | 0.9%), and Northern Europe (8 | 0.9%), together accounting for 1.8% of all Brady Lake residents.
| Immigration Origin | # Population | % Population |
| Europe | 8 | 0.9% |
| Northern Europe | 8 | 0.9% | View All 2 Rows |
Sex and Age in Brady Lake
Sex and Age in Brady Lake
The most populous age groups in Brady Lake are 45 to 49 Years (79 | 17.6%) for men and 15 to 19 Years (79 | 18.9%) for women.
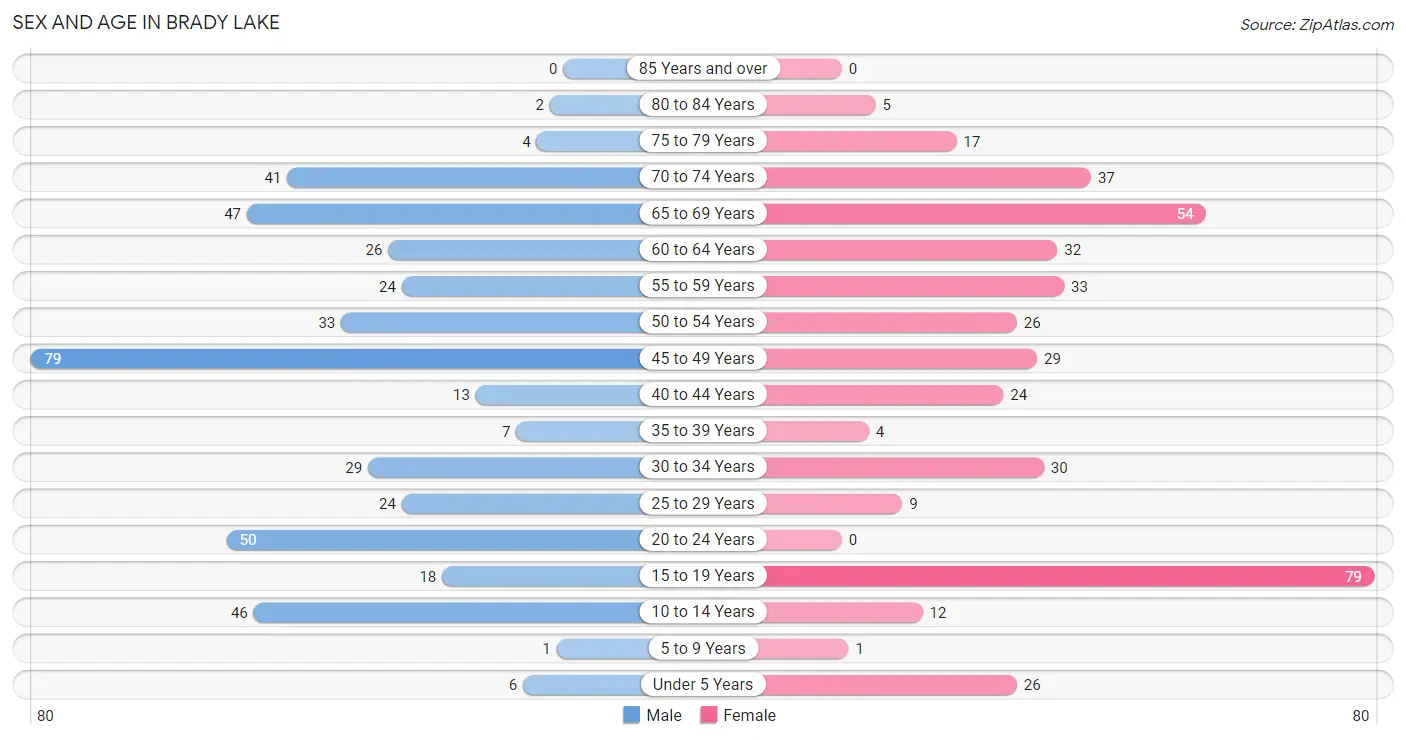
| Age Bracket | Male | Female |
| Under 5 Years | 6 (1.3%) | 26 (6.2%) |
| 5 to 9 Years | 1 (0.2%) | 1 (0.2%) |
| 10 to 14 Years | 46 (10.2%) | 12 (2.9%) |
| 15 to 19 Years | 18 (4.0%) | 79 (18.9%) |
| 20 to 24 Years | 50 (11.1%) | 0 (0.0%) |
| 25 to 29 Years | 24 (5.3%) | 9 (2.1%) |
| 30 to 34 Years | 29 (6.4%) | 30 (7.2%) |
| 35 to 39 Years | 7 (1.6%) | 4 (1.0%) |
| 40 to 44 Years | 13 (2.9%) | 24 (5.7%) |
| 45 to 49 Years | 79 (17.6%) | 29 (6.9%) |
| 50 to 54 Years | 33 (7.3%) | 26 (6.2%) |
| 55 to 59 Years | 24 (5.3%) | 33 (7.9%) |
| 60 to 64 Years | 26 (5.8%) | 32 (7.7%) |
| 65 to 69 Years | 47 (10.4%) | 54 (12.9%) |
| 70 to 74 Years | 41 (9.1%) | 37 (8.8%) |
| 75 to 79 Years | 4 (0.9%) | 17 (4.1%) |
| 80 to 84 Years | 2 (0.4%) | 5 (1.2%) |
| 85 Years and over | 0 (0.0%) | 0 (0.0%) |
| Total | 450 (100.0%) | 418 (100.0%) |
Families and Households in Brady Lake
Median Family Size in Brady Lake
The median family size in Brady Lake is 2.93 persons per family, with single female/mother families (53 | 31.4%) accounting for the largest median family size of 3.32 persons per family. On the other hand, single male/father families (14 | 8.3%) represent the smallest median family size with 2.21 persons per family.
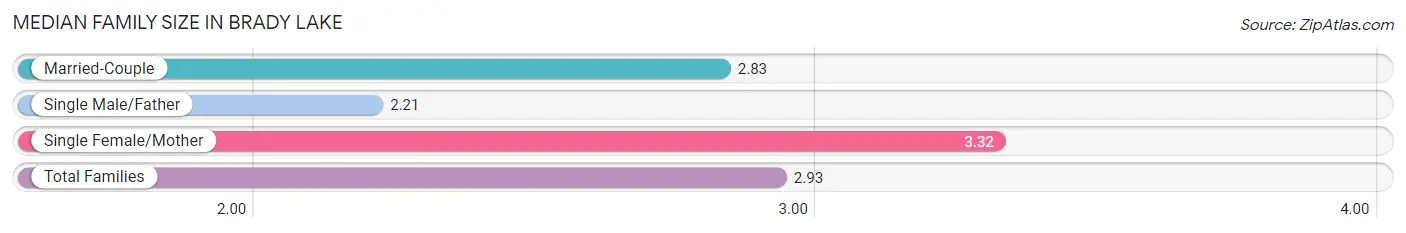
| Family Type | # Families | Family Size |
| Married-Couple | 102 (60.4%) | 2.83 |
| Single Male/Father | 14 (8.3%) | 2.21 |
| Single Female/Mother | 53 (31.4%) | 3.32 |
| Total Families | 169 (100.0%) | 2.93 |
Median Household Size in Brady Lake
The median household size in Brady Lake is 1.87 persons per household, with single female/mother households (53 | 11.4%) accounting for the largest median household size of 3.58 persons per household. non-family households (295 | 63.6%) represent the smallest median household size with 1.17 persons per household.
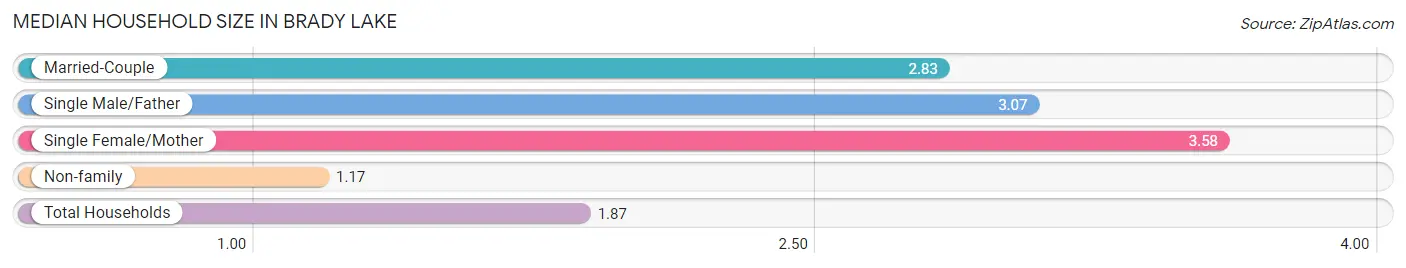
| Household Type | # Households | Household Size |
| Married-Couple | 102 (22.0%) | 2.83 |
| Single Male/Father | 14 (3.0%) | 3.07 |
| Single Female/Mother | 53 (11.4%) | 3.58 |
| Non-family | 295 (63.6%) | 1.17 |
| Total Households | 464 (100.0%) | 1.87 |
Household Size by Marriage Status in Brady Lake
Out of a total of 464 households in Brady Lake, 169 (36.4%) are family households, while 295 (63.6%) are nonfamily households. The most numerous type of family households are 3-person households, comprising 65, and the most common type of nonfamily households are 1-person households, comprising 250.
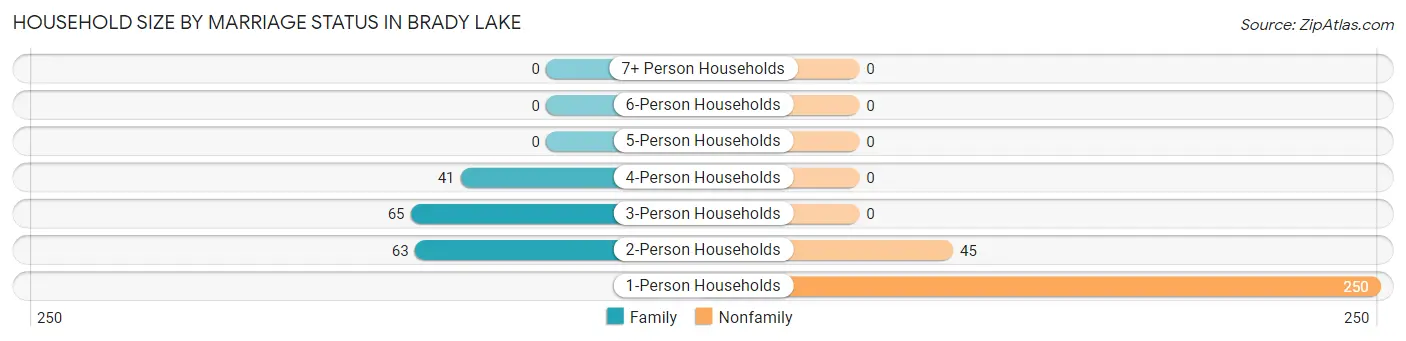
| Household Size | Family Households | Nonfamily Households |
| 1-Person Households | - | 250 (53.9%) |
| 2-Person Households | 63 (13.6%) | 45 (9.7%) |
| 3-Person Households | 65 (14.0%) | 0 (0.0%) |
| 4-Person Households | 41 (8.8%) | 0 (0.0%) |
| 5-Person Households | 0 (0.0%) | 0 (0.0%) |
| 6-Person Households | 0 (0.0%) | 0 (0.0%) |
| 7+ Person Households | 0 (0.0%) | 0 (0.0%) |
| Total | 169 (36.4%) | 295 (63.6%) |
Female Fertility in Brady Lake
Fertility by Age in Brady Lake
Average fertility rate in Brady Lake is 59.0 births per 1,000 women. Women in the age bracket of 20 to 34 years have the highest fertility rate with 282.0 births per 1,000 women. Women in the age bracket of 20 to 34 years acount for 100.0% of all women with births.
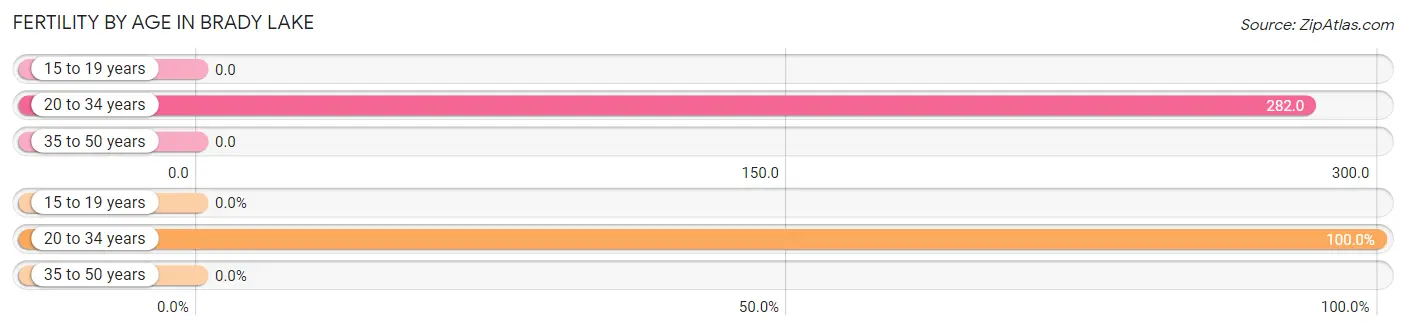
| Age Bracket | Women with Births | Births / 1,000 Women |
| 15 to 19 years | 0 (0.0%) | 0.0 |
| 20 to 34 years | 11 (100.0%) | 282.0 |
| 35 to 50 years | 0 (0.0%) | 0.0 |
| Total | 11 (100.0%) | 59.0 |
Fertility by Age by Marriage Status in Brady Lake
45.5% of women with births (11) in Brady Lake are married. The highest percentage of unmarried women with births falls into 20 to 34 years age bracket with 54.5% of them unmarried at the time of birth, while the lowest percentage of unmarried women with births belong to 20 to 34 years age bracket with 54.5% of them unmarried.
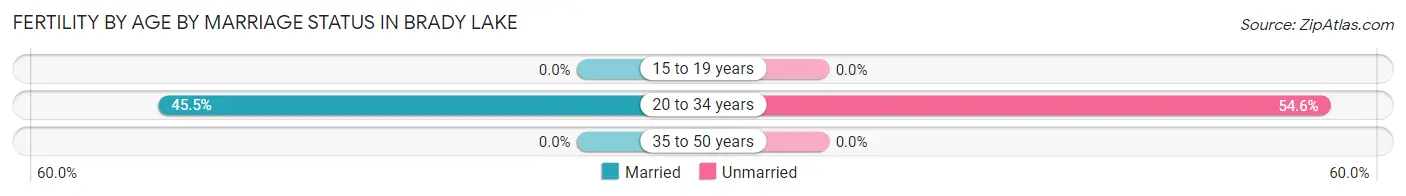
| Age Bracket | Married | Unmarried |
| 15 to 19 years | 0 (0.0%) | 0 (0.0%) |
| 20 to 34 years | 5 (45.5%) | 6 (54.5%) |
| 35 to 50 years | 0 (0.0%) | 0 (0.0%) |
| Total | 5 (45.5%) | 6 (54.5%) |
Fertility by Education in Brady Lake
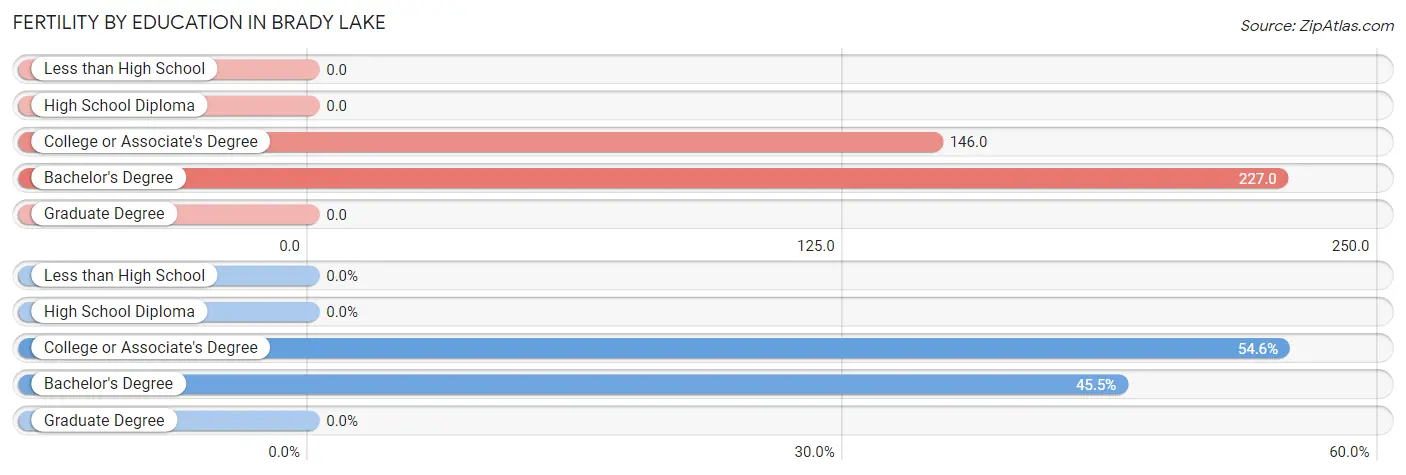
| Educational Attainment | Women with Births | Births / 1,000 Women |
| Less than High School | 0 (0.0%) | 0.0 |
| High School Diploma | 0 (0.0%) | 0.0 |
| College or Associate's Degree | 6 (54.5%) | 146.0 |
| Bachelor's Degree | 5 (45.5%) | 227.0 |
| Graduate Degree | 0 (0.0%) | 0.0 |
| Total | 11 (100.0%) | 59.0 |
Fertility by Education by Marriage Status in Brady Lake
54.5% of women with births in Brady Lake are unmarried. Women with the educational attainment of bachelor's degree are most likely to be married with 100.0% of them married at childbirth, while women with the educational attainment of college or associate's degree are least likely to be married with 100.0% of them unmarried at childbirth.
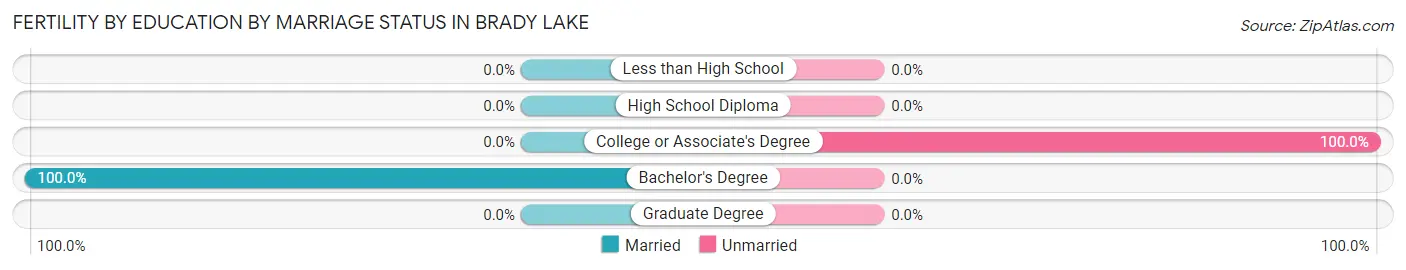
| Educational Attainment | Married | Unmarried |
| Less than High School | 0 (0.0%) | 0 (0.0%) |
| High School Diploma | 0 (0.0%) | 0 (0.0%) |
| College or Associate's Degree | 0 (0.0%) | 6 (100.0%) |
| Bachelor's Degree | 5 (100.0%) | 0 (0.0%) |
| Graduate Degree | 0 (0.0%) | 0 (0.0%) |
| Total | 5 (45.5%) | 6 (54.5%) |
Employment Characteristics in Brady Lake
Employment by Class of Employer in Brady Lake
Among the 386 employed individuals in Brady Lake, private company employees (267 | 69.2%), not-for-profit organizations (50 | 13.0%), and state government employees (28 | 7.2%) make up the most common classes of employment.
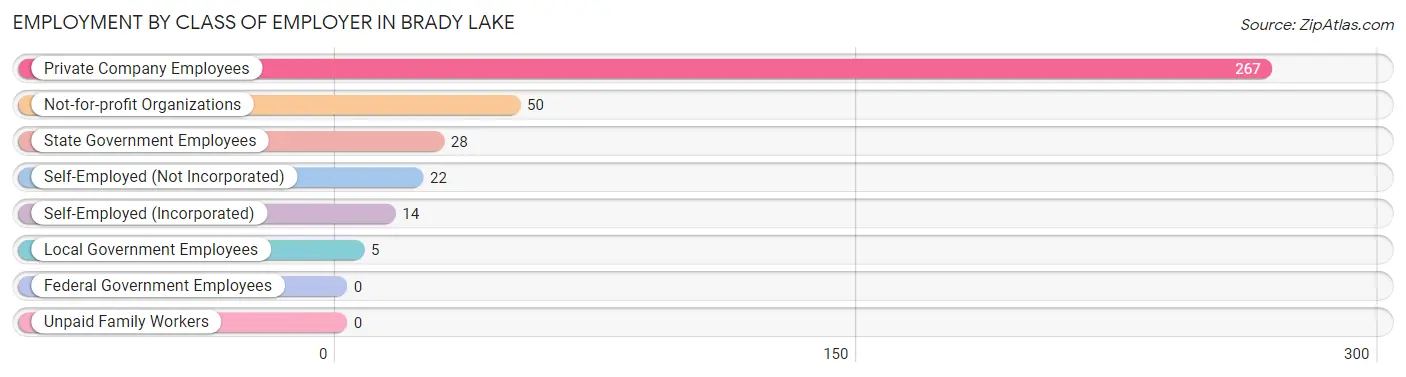
| Employer Class | # Employees | % Employees |
| Private Company Employees | 267 | 69.2% |
| Self-Employed (Incorporated) | 14 | 3.6% |
| Self-Employed (Not Incorporated) | 22 | 5.7% |
| Not-for-profit Organizations | 50 | 13.0% |
| Local Government Employees | 5 | 1.3% |
| State Government Employees | 28 | 7.2% |
| Federal Government Employees | 0 | 0.0% |
| Unpaid Family Workers | 0 | 0.0% |
| Total | 386 | 100.0% |
Employment Status by Age in Brady Lake
According to the labor force statistics for Brady Lake, out of the total population over 16 years of age (752), 67.8% or 510 individuals are in the labor force, with 24.3% or 124 of them unemployed. The age group with the highest labor force participation rate is 35 to 44 years, with 100.0% or 48 individuals in the labor force. Within the labor force, the 45 to 54 years age range has the highest percentage of unemployed individuals, with 52.3% or 79 of them being unemployed.
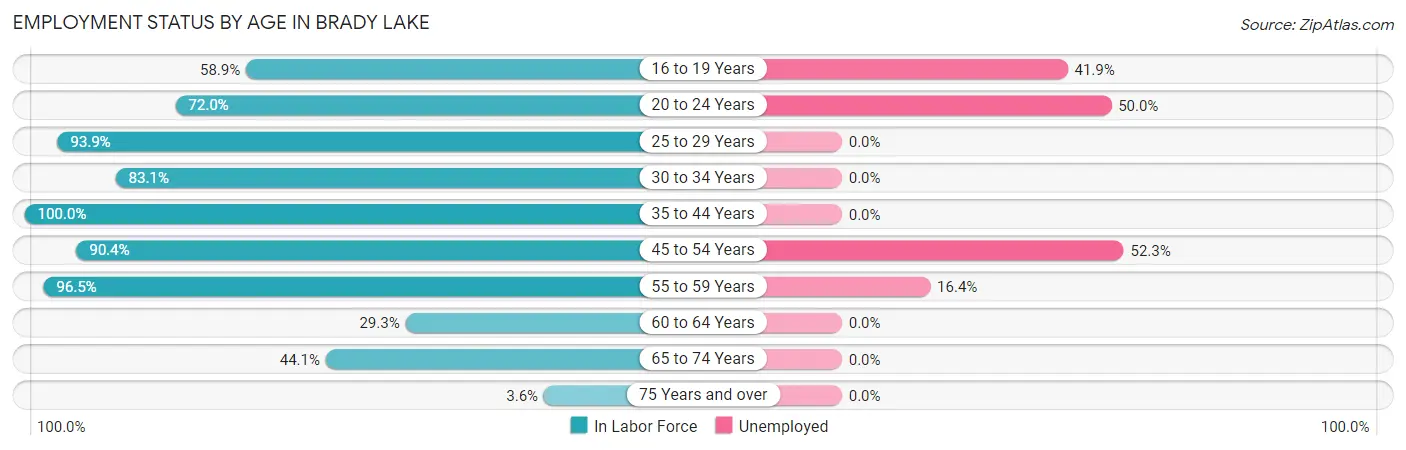
| Age Bracket | In Labor Force | Unemployed |
| 16 to 19 Years | 43 (58.9%) | 18 (41.9%) |
| 20 to 24 Years | 36 (72.0%) | 18 (50.0%) |
| 25 to 29 Years | 31 (93.9%) | 0 (0.0%) |
| 30 to 34 Years | 49 (83.1%) | 0 (0.0%) |
| 35 to 44 Years | 48 (100.0%) | 0 (0.0%) |
| 45 to 54 Years | 151 (90.4%) | 79 (52.3%) |
| 55 to 59 Years | 55 (96.5%) | 9 (16.4%) |
| 60 to 64 Years | 17 (29.3%) | 0 (0.0%) |
| 65 to 74 Years | 79 (44.1%) | 0 (0.0%) |
| 75 Years and over | 1 (3.6%) | 0 (0.0%) |
| Total | 510 (67.8%) | 124 (24.3%) |
Employment Status by Educational Attainment in Brady Lake
According to labor force statistics for Brady Lake, 83.2% of individuals (351) out of the total population between 25 and 64 years of age (422) are in the labor force, with 25.1% or 88 of them being unemployed. The group with the highest labor force participation rate are those with the educational attainment of bachelor's degree or higher, with 98.4% or 126 individuals in the labor force. Within the labor force, individuals with less than high school education have the highest percentage of unemployment, with 84.9% or 79 of them being unemployed.
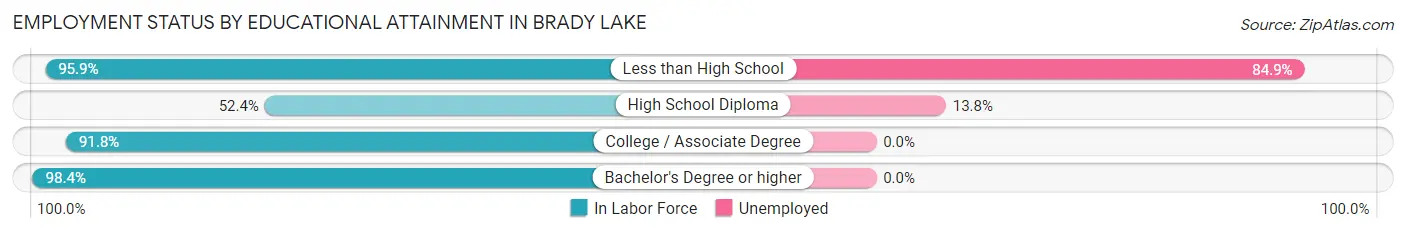
| Educational Attainment | In Labor Force | Unemployed |
| Less than High School | 93 (95.9%) | 82 (84.9%) |
| High School Diploma | 65 (52.4%) | 17 (13.8%) |
| College / Associate Degree | 67 (91.8%) | 0 (0.0%) |
| Bachelor's Degree or higher | 126 (98.4%) | 0 (0.0%) |
| Total | 351 (83.2%) | 106 (25.1%) |
Employment Occupations by Sex in Brady Lake
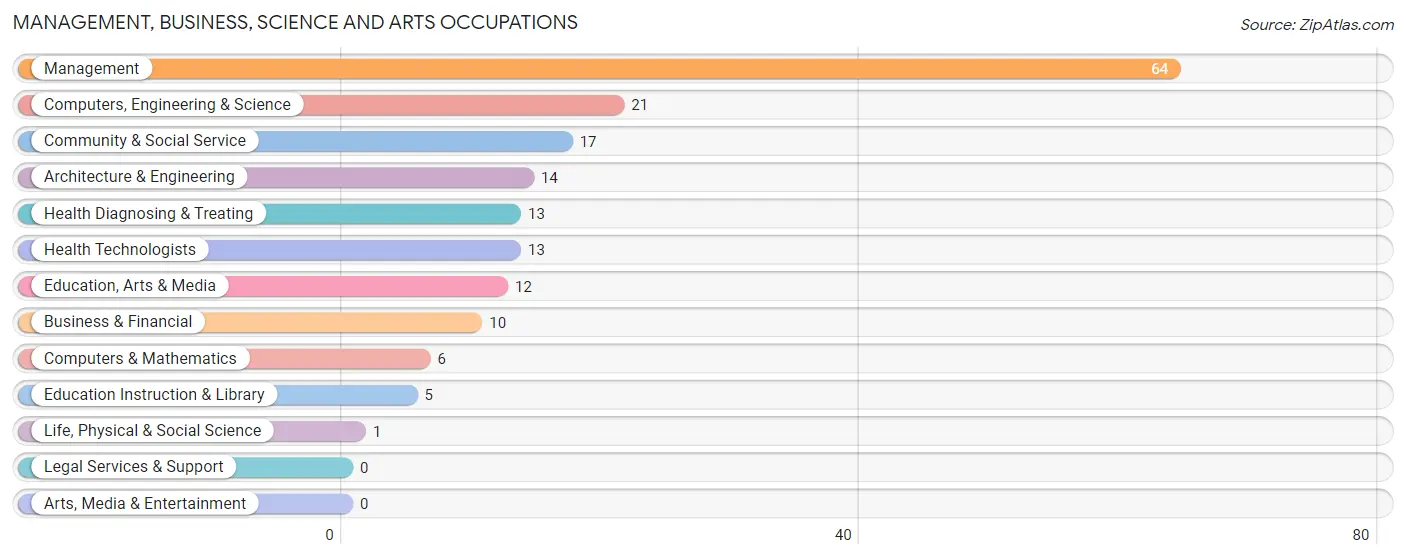
Management, Business, Science and Arts Occupations
The most common Management, Business, Science and Arts occupations in Brady Lake are Management (64 | 16.6%), Computers, Engineering & Science (21 | 5.4%), Community & Social Service (17 | 4.4%), Architecture & Engineering (14 | 3.6%), and Health Diagnosing & Treating (13 | 3.4%).
Management, Business, Science and Arts Occupations by Sex
Within the Management, Business, Science and Arts occupations in Brady Lake, the most male-oriented occupations are Computers & Mathematics (100.0%), Architecture & Engineering (100.0%), and Computers, Engineering & Science (95.2%), while the most female-oriented occupations are Business & Financial (100.0%), Life, Physical & Social Science (100.0%), and Education, Arts & Media (100.0%).
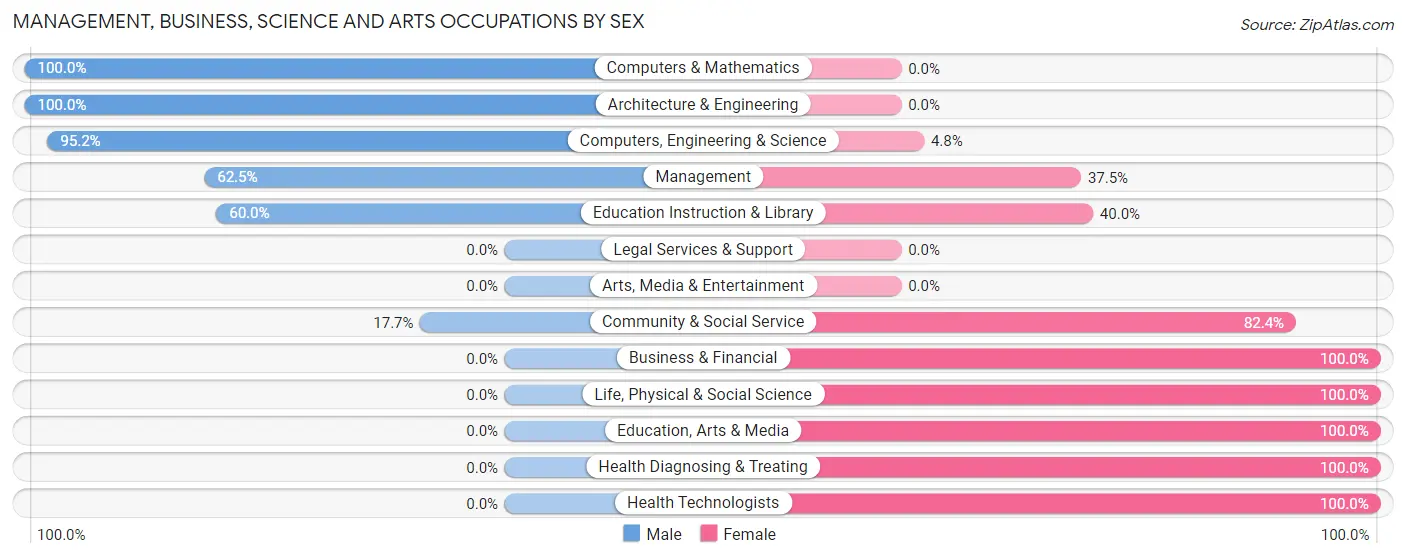
| Occupation | Male | Female |
| Management | 40 (62.5%) | 24 (37.5%) |
| Business & Financial | 0 (0.0%) | 10 (100.0%) |
| Computers, Engineering & Science | 20 (95.2%) | 1 (4.8%) |
| Computers & Mathematics | 6 (100.0%) | 0 (0.0%) |
| Architecture & Engineering | 14 (100.0%) | 0 (0.0%) |
| Life, Physical & Social Science | 0 (0.0%) | 1 (100.0%) |
| Community & Social Service | 3 (17.6%) | 14 (82.4%) |
| Education, Arts & Media | 0 (0.0%) | 12 (100.0%) |
| Legal Services & Support | 0 (0.0%) | 0 (0.0%) |
| Education Instruction & Library | 3 (60.0%) | 2 (40.0%) |
| Arts, Media & Entertainment | 0 (0.0%) | 0 (0.0%) |
| Health Diagnosing & Treating | 0 (0.0%) | 13 (100.0%) |
| Health Technologists | 0 (0.0%) | 13 (100.0%) |
| Total (Category) | 63 (50.4%) | 62 (49.6%) |
| Total (Overall) | 169 (43.8%) | 217 (56.2%) |
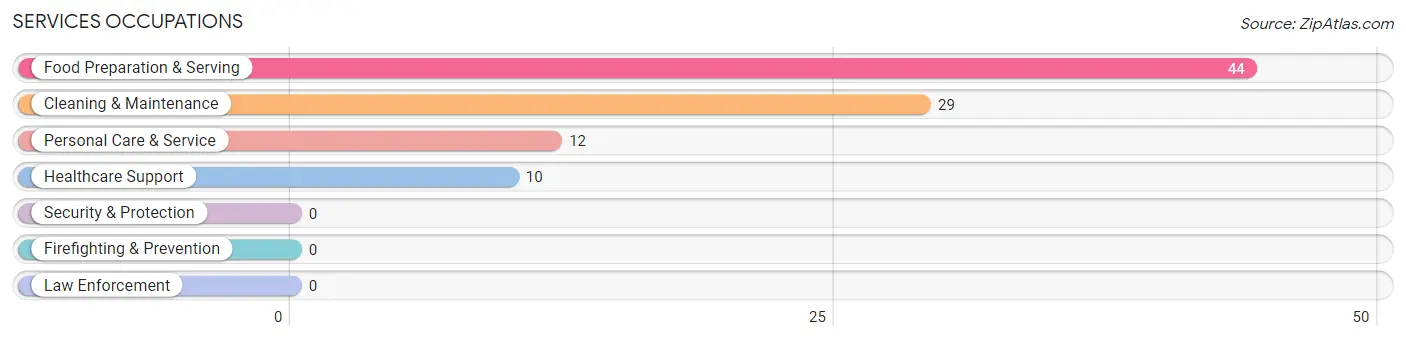
Services Occupations
The most common Services occupations in Brady Lake are Food Preparation & Serving (44 | 11.4%), Cleaning & Maintenance (29 | 7.5%), Personal Care & Service (12 | 3.1%), and Healthcare Support (10 | 2.6%).
Services Occupations by Sex
Within the Services occupations in Brady Lake, the most male-oriented occupations are Cleaning & Maintenance (31.0%), and Food Preparation & Serving (18.2%), while the most female-oriented occupations are Healthcare Support (100.0%), Personal Care & Service (100.0%), and Food Preparation & Serving (81.8%).
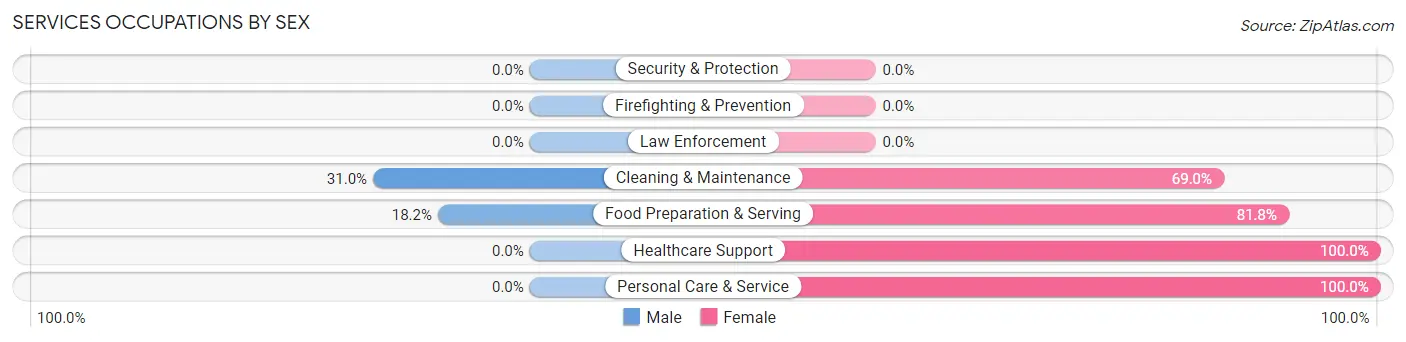
| Occupation | Male | Female |
| Healthcare Support | 0 (0.0%) | 10 (100.0%) |
| Security & Protection | 0 (0.0%) | 0 (0.0%) |
| Firefighting & Prevention | 0 (0.0%) | 0 (0.0%) |
| Law Enforcement | 0 (0.0%) | 0 (0.0%) |
| Food Preparation & Serving | 8 (18.2%) | 36 (81.8%) |
| Cleaning & Maintenance | 9 (31.0%) | 20 (69.0%) |
| Personal Care & Service | 0 (0.0%) | 12 (100.0%) |
| Total (Category) | 17 (17.9%) | 78 (82.1%) |
| Total (Overall) | 169 (43.8%) | 217 (56.2%) |
Sales and Office Occupations
The most common Sales and Office occupations in Brady Lake are Office & Administration (55 | 14.2%), and Sales & Related (22 | 5.7%).
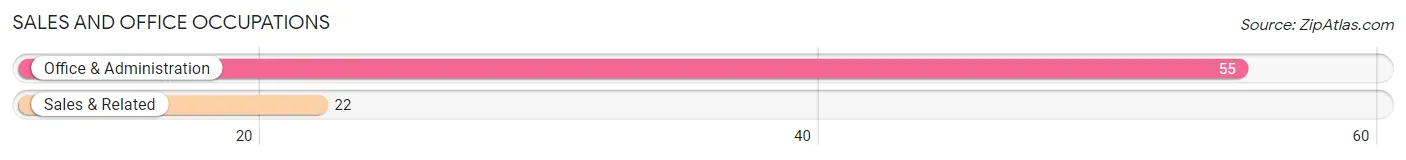
Sales and Office Occupations by Sex
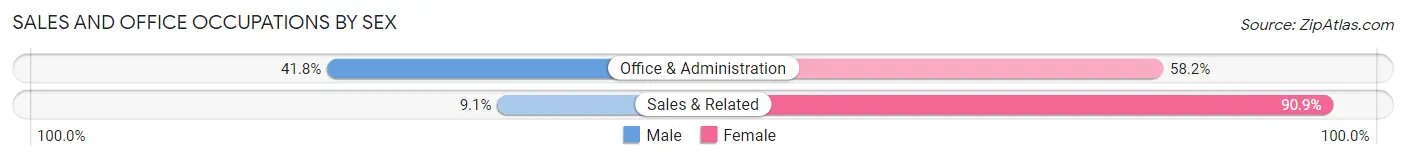
| Occupation | Male | Female |
| Sales & Related | 2 (9.1%) | 20 (90.9%) |
| Office & Administration | 23 (41.8%) | 32 (58.2%) |
| Total (Category) | 25 (32.5%) | 52 (67.5%) |
| Total (Overall) | 169 (43.8%) | 217 (56.2%) |
Natural Resources, Construction and Maintenance Occupations
The most common Natural Resources, Construction and Maintenance occupations in Brady Lake are Installation, Maintenance & Repair (19 | 4.9%), and Construction & Extraction (14 | 3.6%).
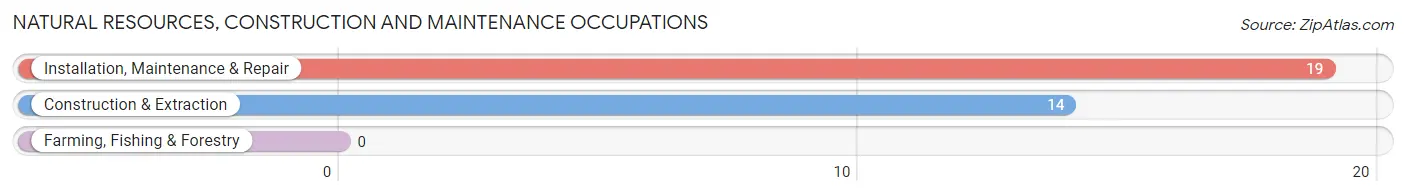
Natural Resources, Construction and Maintenance Occupations by Sex
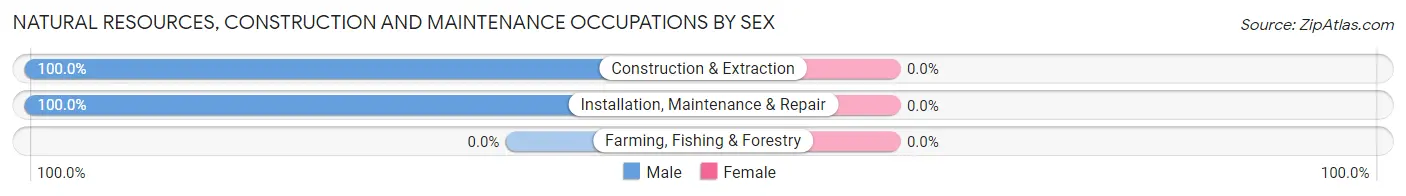
| Occupation | Male | Female |
| Farming, Fishing & Forestry | 0 (0.0%) | 0 (0.0%) |
| Construction & Extraction | 14 (100.0%) | 0 (0.0%) |
| Installation, Maintenance & Repair | 19 (100.0%) | 0 (0.0%) |
| Total (Category) | 33 (100.0%) | 0 (0.0%) |
| Total (Overall) | 169 (43.8%) | 217 (56.2%) |
Production, Transportation and Moving Occupations
The most common Production, Transportation and Moving occupations in Brady Lake are Production (38 | 9.8%), and Material Moving (18 | 4.7%).
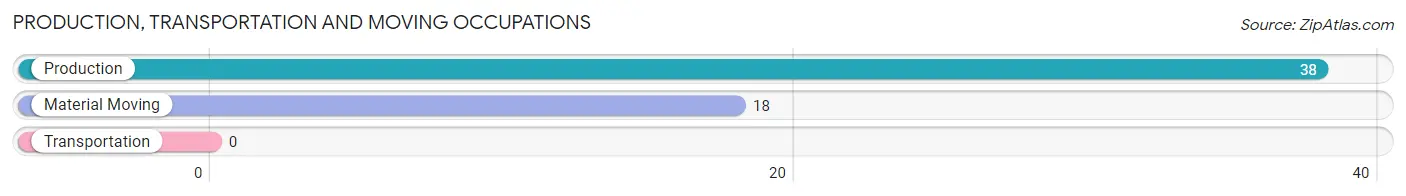
Production, Transportation and Moving Occupations by Sex
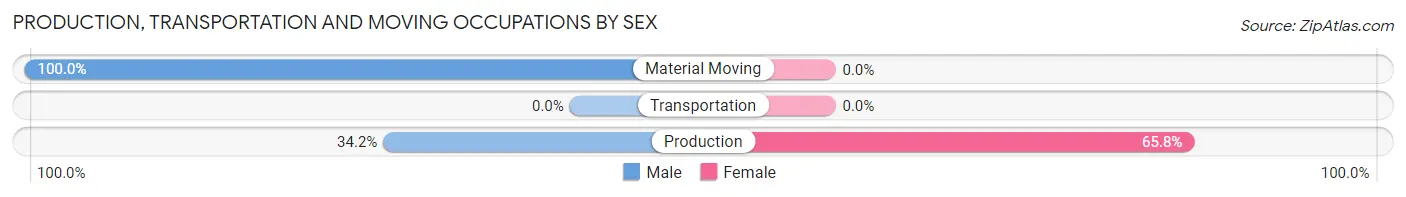
| Occupation | Male | Female |
| Production | 13 (34.2%) | 25 (65.8%) |
| Transportation | 0 (0.0%) | 0 (0.0%) |
| Material Moving | 18 (100.0%) | 0 (0.0%) |
| Total (Category) | 31 (55.4%) | 25 (44.6%) |
| Total (Overall) | 169 (43.8%) | 217 (56.2%) |
Employment Industries by Sex in Brady Lake
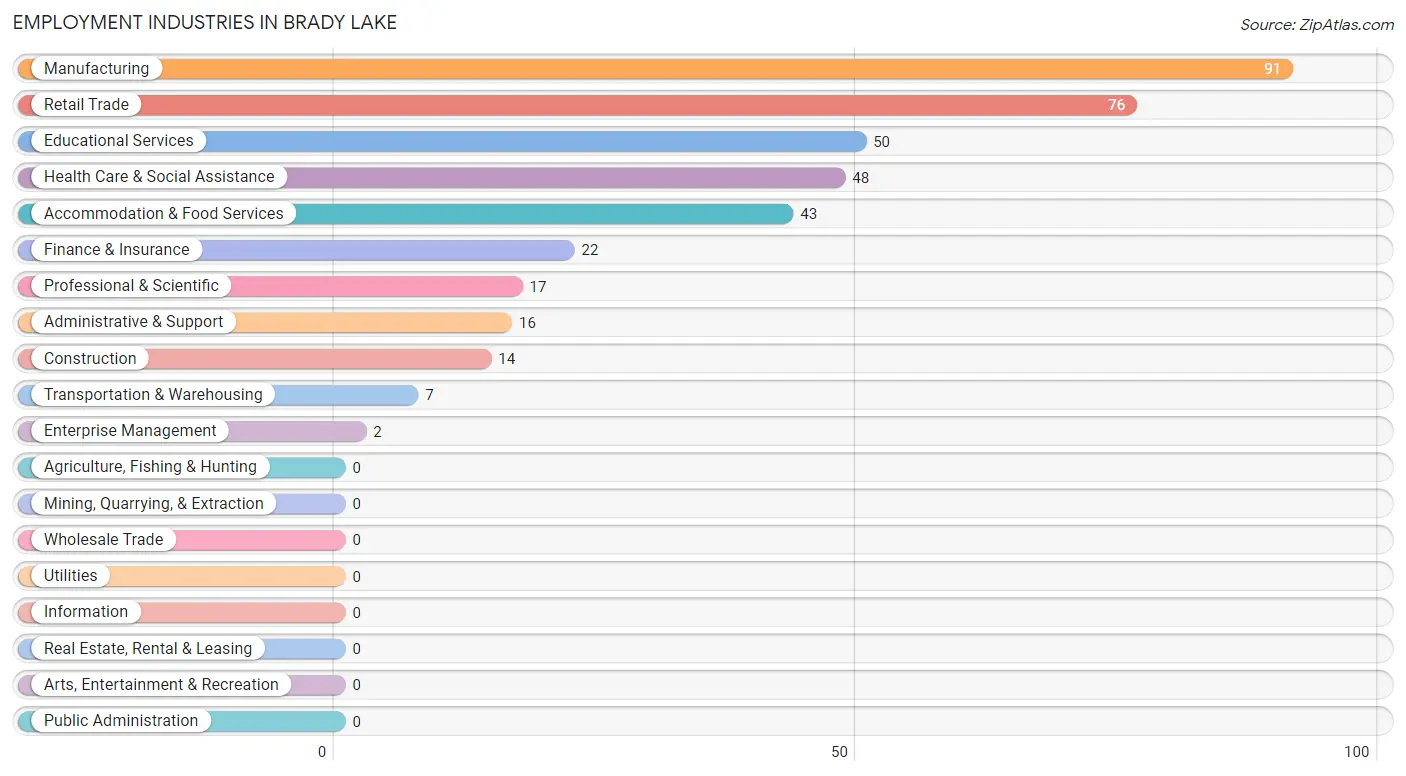
Employment Industries in Brady Lake
The major employment industries in Brady Lake include Manufacturing (91 | 23.6%), Retail Trade (76 | 19.7%), Educational Services (50 | 13.0%), Health Care & Social Assistance (48 | 12.4%), and Accommodation & Food Services (43 | 11.1%).
Employment Industries by Sex in Brady Lake
The Brady Lake industries that see more men than women are Construction (100.0%), Transportation & Warehousing (100.0%), and Retail Trade (61.8%), whereas the industries that tend to have a higher number of women are Enterprise Management (100.0%), Health Care & Social Assistance (100.0%), and Finance & Insurance (95.5%).
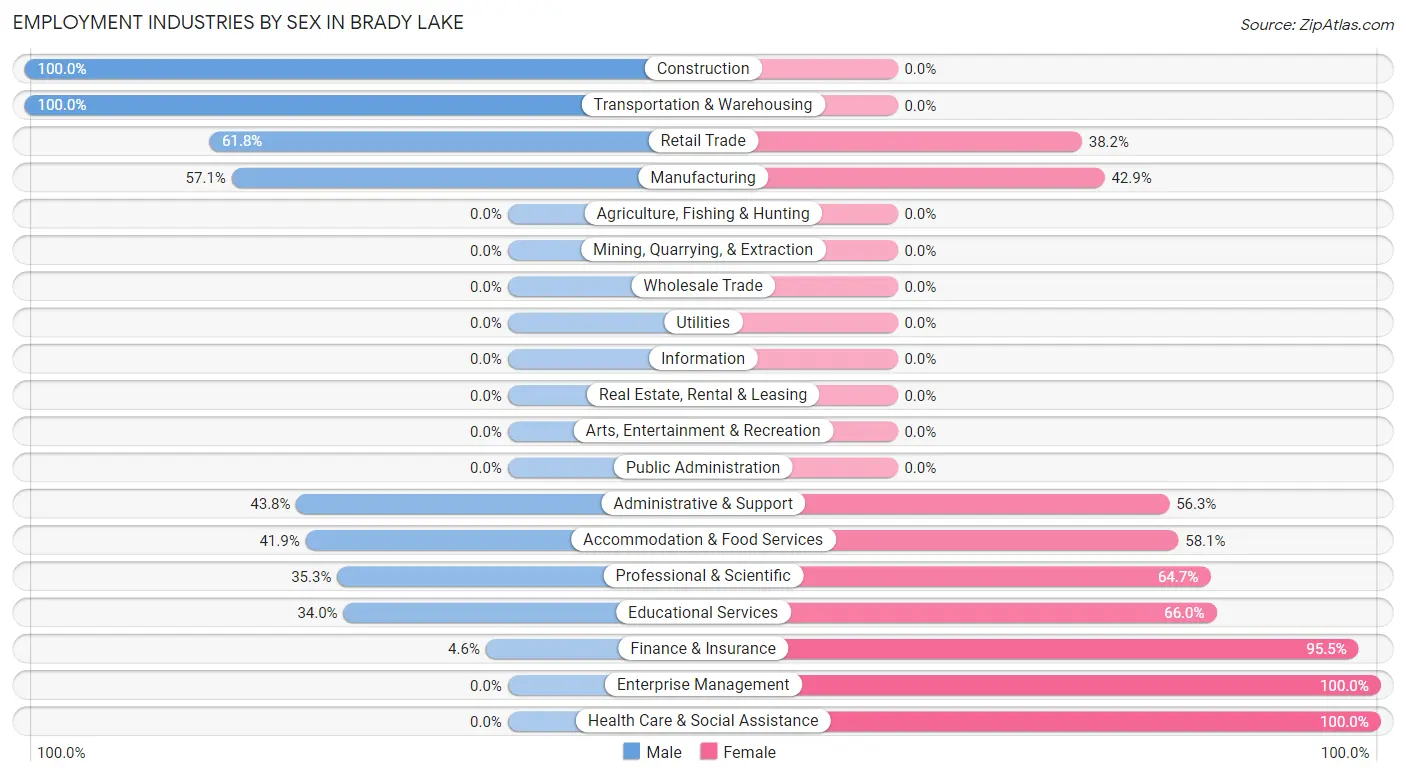
| Industry | Male | Female |
| Agriculture, Fishing & Hunting | 0 (0.0%) | 0 (0.0%) |
| Mining, Quarrying, & Extraction | 0 (0.0%) | 0 (0.0%) |
| Construction | 14 (100.0%) | 0 (0.0%) |
| Manufacturing | 52 (57.1%) | 39 (42.9%) |
| Wholesale Trade | 0 (0.0%) | 0 (0.0%) |
| Retail Trade | 47 (61.8%) | 29 (38.2%) |
| Transportation & Warehousing | 7 (100.0%) | 0 (0.0%) |
| Utilities | 0 (0.0%) | 0 (0.0%) |
| Information | 0 (0.0%) | 0 (0.0%) |
| Finance & Insurance | 1 (4.5%) | 21 (95.5%) |
| Real Estate, Rental & Leasing | 0 (0.0%) | 0 (0.0%) |
| Professional & Scientific | 6 (35.3%) | 11 (64.7%) |
| Enterprise Management | 0 (0.0%) | 2 (100.0%) |
| Administrative & Support | 7 (43.8%) | 9 (56.2%) |
| Educational Services | 17 (34.0%) | 33 (66.0%) |
| Health Care & Social Assistance | 0 (0.0%) | 48 (100.0%) |
| Arts, Entertainment & Recreation | 0 (0.0%) | 0 (0.0%) |
| Accommodation & Food Services | 18 (41.9%) | 25 (58.1%) |
| Public Administration | 0 (0.0%) | 0 (0.0%) |
| Total | 169 (43.8%) | 217 (56.2%) |
Education in Brady Lake
School Enrollment in Brady Lake
The most common levels of schooling among the 165 students in Brady Lake are middle school (57 | 34.5%), high school (54 | 32.7%), and college / undergraduate (46 | 27.9%).
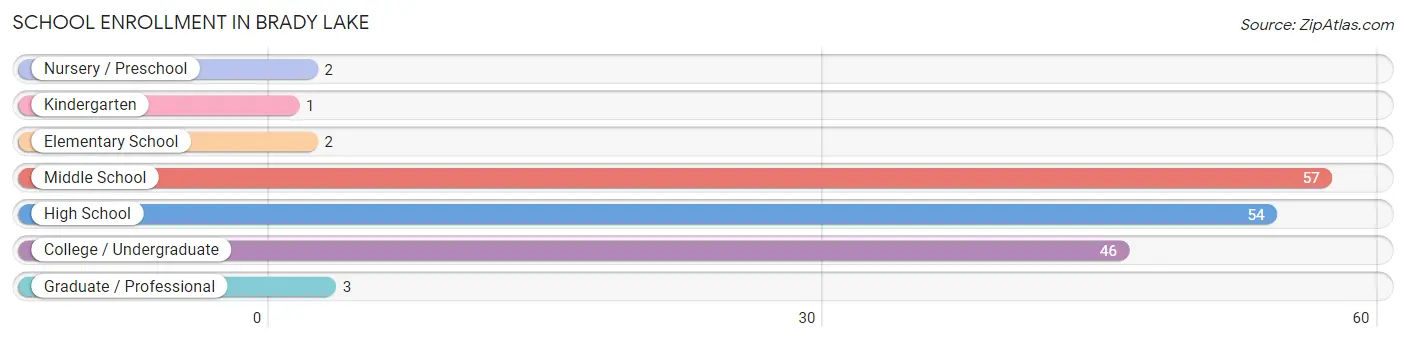
| School Level | # Students | % Students |
| Nursery / Preschool | 2 | 1.2% |
| Kindergarten | 1 | 0.6% |
| Elementary School | 2 | 1.2% |
| Middle School | 57 | 34.5% |
| High School | 54 | 32.7% |
| College / Undergraduate | 46 | 27.9% |
| Graduate / Professional | 3 | 1.8% |
| Total | 165 | 100.0% |
School Enrollment by Age by Funding Source in Brady Lake
Out of a total of 165 students who are enrolled in schools in Brady Lake, 2 (1.2%) attend a private institution, while the remaining 163 (98.8%) are enrolled in public schools. The age group of 3 to 4 year olds has the highest likelihood of being enrolled in private schools, with 2 (100.0% in the age bracket) enrolled. Conversely, the age group of 5 to 9 year old has the lowest likelihood of being enrolled in a private school, with 2 (100.0% in the age bracket) attending a public institution.
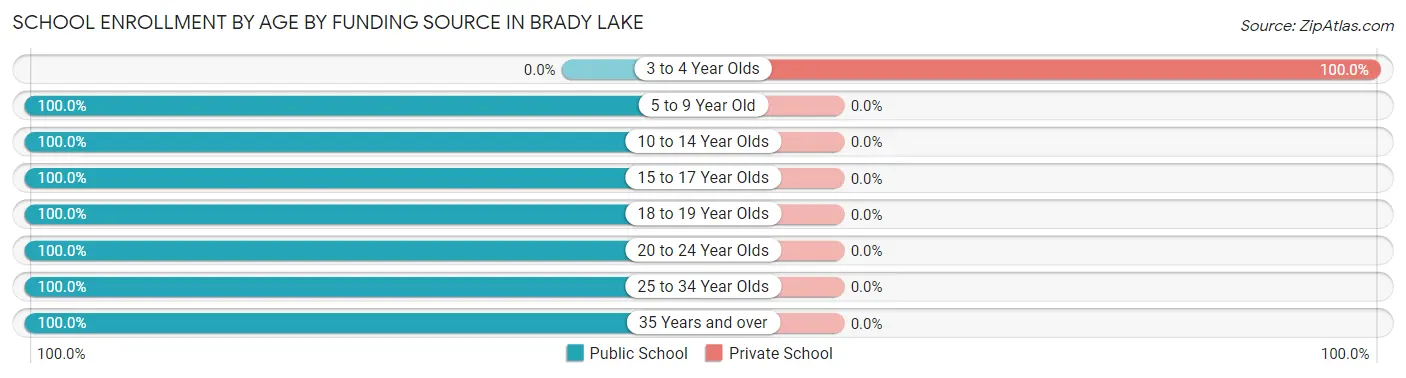
| Age Bracket | Public School | Private School |
| 3 to 4 Year Olds | 0 (0.0%) | 2 (100.0%) |
| 5 to 9 Year Old | 2 (100.0%) | 0 (0.0%) |
| 10 to 14 Year Olds | 58 (100.0%) | 0 (0.0%) |
| 15 to 17 Year Olds | 54 (100.0%) | 0 (0.0%) |
| 18 to 19 Year Olds | 31 (100.0%) | 0 (0.0%) |
| 20 to 24 Year Olds | 14 (100.0%) | 0 (0.0%) |
| 25 to 34 Year Olds | 3 (100.0%) | 0 (0.0%) |
| 35 Years and over | 1 (100.0%) | 0 (0.0%) |
| Total | 163 (98.8%) | 2 (1.2%) |
Educational Attainment by Field of Study in Brady Lake
Business (52 | 19.6%), arts & humanities (43 | 16.2%), science & technology (41 | 15.4%), education (36 | 13.5%), and psychology (35 | 13.2%) are the most common fields of study among 266 individuals in Brady Lake who have obtained a bachelor's degree or higher.
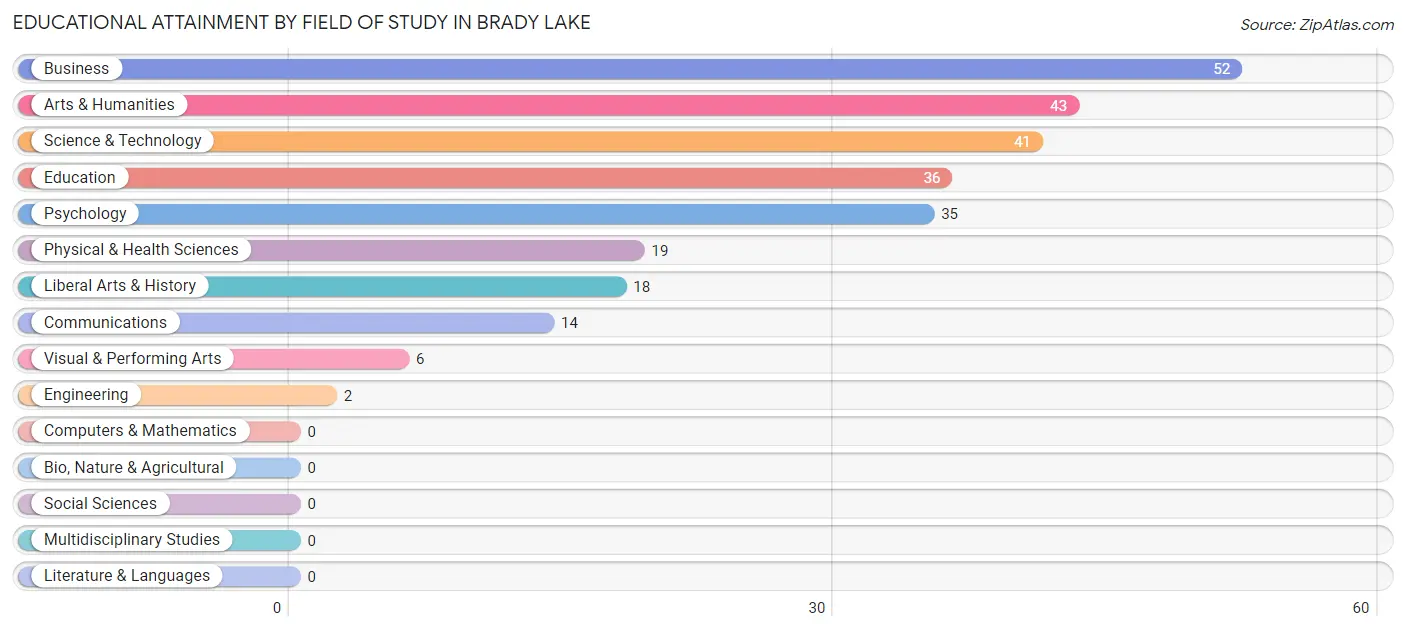
| Field of Study | # Graduates | % Graduates |
| Computers & Mathematics | 0 | 0.0% |
| Bio, Nature & Agricultural | 0 | 0.0% |
| Physical & Health Sciences | 19 | 7.1% |
| Psychology | 35 | 13.2% |
| Social Sciences | 0 | 0.0% |
| Engineering | 2 | 0.7% |
| Multidisciplinary Studies | 0 | 0.0% |
| Science & Technology | 41 | 15.4% |
| Business | 52 | 19.6% |
| Education | 36 | 13.5% |
| Literature & Languages | 0 | 0.0% |
| Liberal Arts & History | 18 | 6.8% |
| Visual & Performing Arts | 6 | 2.3% |
| Communications | 14 | 5.3% |
| Arts & Humanities | 43 | 16.2% |
| Total | 266 | 100.0% |
Transportation & Commute in Brady Lake
Vehicle Availability by Sex in Brady Lake
The most prevalent vehicle ownership categories in Brady Lake are males with 1 vehicle (63, accounting for 37.3%) and females with 1 vehicle (85, making up 29.0%).
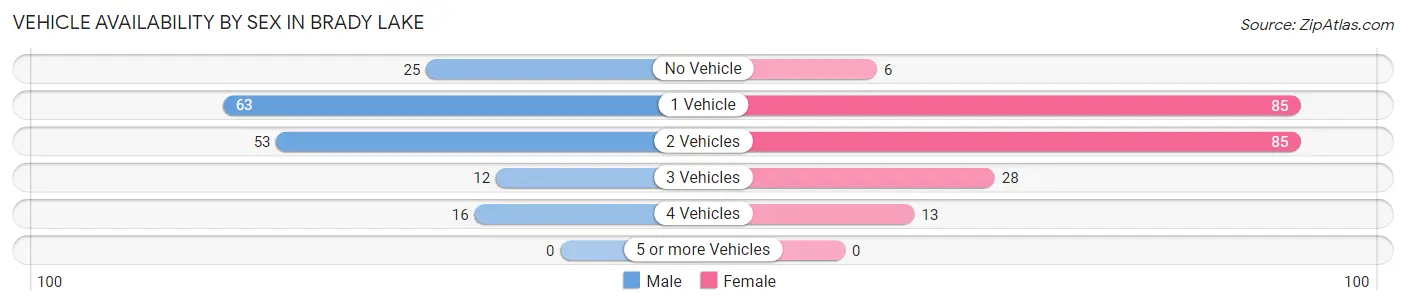
| Vehicles Available | Male | Female |
| No Vehicle | 25 (14.8%) | 6 (2.8%) |
| 1 Vehicle | 63 (37.3%) | 85 (39.2%) |
| 2 Vehicles | 53 (31.4%) | 85 (39.2%) |
| 3 Vehicles | 12 (7.1%) | 28 (12.9%) |
| 4 Vehicles | 16 (9.5%) | 13 (6.0%) |
| 5 or more Vehicles | 0 (0.0%) | 0 (0.0%) |
| Total | 169 (100.0%) | 217 (100.0%) |
Commute Time in Brady Lake
The most frequently occuring commute durations in Brady Lake are 45 to 59 minutes (56 commuters, 15.4%), 20 to 24 minutes (54 commuters, 14.9%), and 5 to 9 minutes (51 commuters, 14.1%).
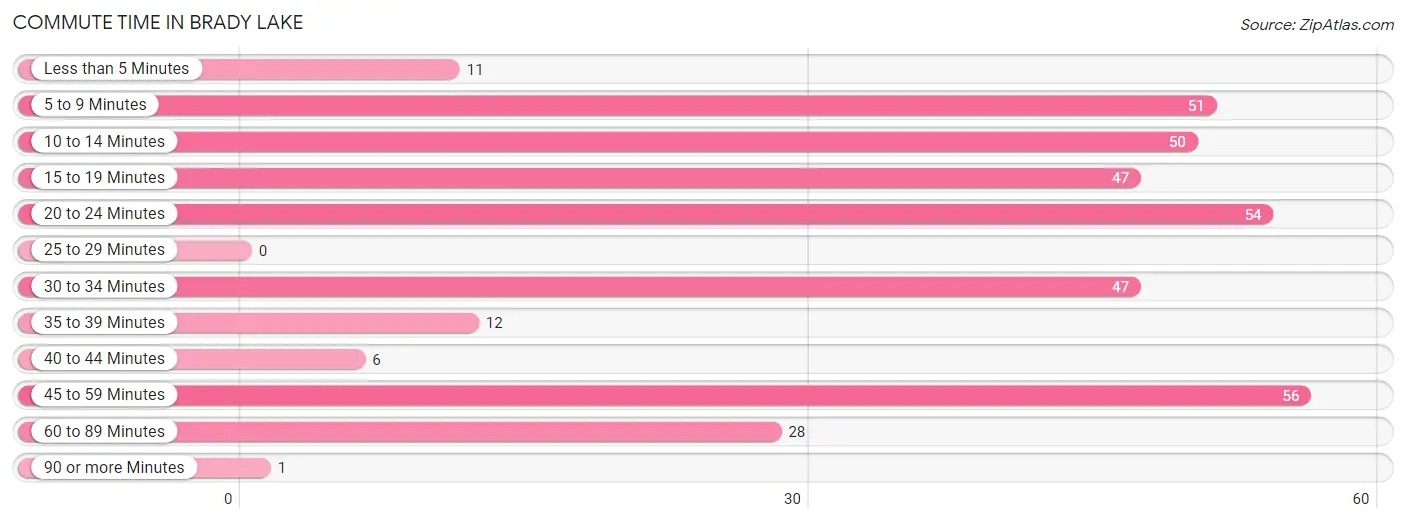
| Commute Time | # Commuters | % Commuters |
| Less than 5 Minutes | 11 | 3.0% |
| 5 to 9 Minutes | 51 | 14.1% |
| 10 to 14 Minutes | 50 | 13.8% |
| 15 to 19 Minutes | 47 | 13.0% |
| 20 to 24 Minutes | 54 | 14.9% |
| 25 to 29 Minutes | 0 | 0.0% |
| 30 to 34 Minutes | 47 | 13.0% |
| 35 to 39 Minutes | 12 | 3.3% |
| 40 to 44 Minutes | 6 | 1.7% |
| 45 to 59 Minutes | 56 | 15.4% |
| 60 to 89 Minutes | 28 | 7.7% |
| 90 or more Minutes | 1 | 0.3% |
Commute Time by Sex in Brady Lake
The most common commute times in Brady Lake are 5 to 9 minutes (41 commuters, 24.3%) for males and 10 to 14 minutes (44 commuters, 22.7%) for females.
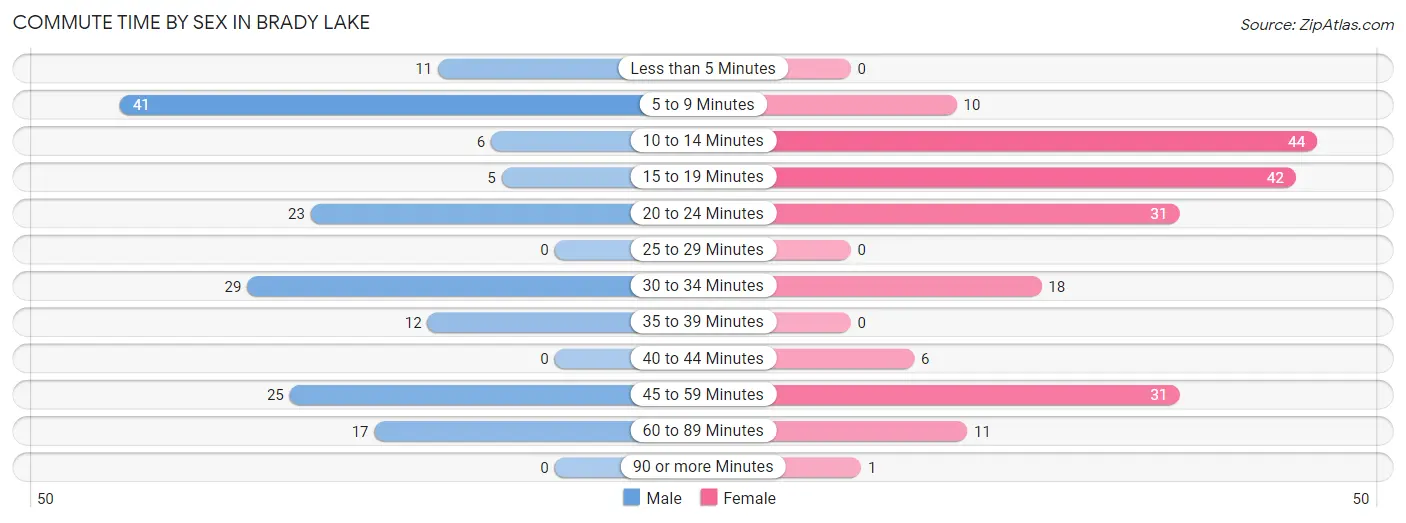
| Commute Time | Male | Female |
| Less than 5 Minutes | 11 (6.5%) | 0 (0.0%) |
| 5 to 9 Minutes | 41 (24.3%) | 10 (5.1%) |
| 10 to 14 Minutes | 6 (3.5%) | 44 (22.7%) |
| 15 to 19 Minutes | 5 (3.0%) | 42 (21.6%) |
| 20 to 24 Minutes | 23 (13.6%) | 31 (16.0%) |
| 25 to 29 Minutes | 0 (0.0%) | 0 (0.0%) |
| 30 to 34 Minutes | 29 (17.2%) | 18 (9.3%) |
| 35 to 39 Minutes | 12 (7.1%) | 0 (0.0%) |
| 40 to 44 Minutes | 0 (0.0%) | 6 (3.1%) |
| 45 to 59 Minutes | 25 (14.8%) | 31 (16.0%) |
| 60 to 89 Minutes | 17 (10.1%) | 11 (5.7%) |
| 90 or more Minutes | 0 (0.0%) | 1 (0.5%) |
Time of Departure to Work by Sex in Brady Lake
The most frequent times of departure to work in Brady Lake are 5:30 AM to 5:59 AM (48, 28.4%) for males and 7:00 AM to 7:29 AM (56, 28.9%) for females.
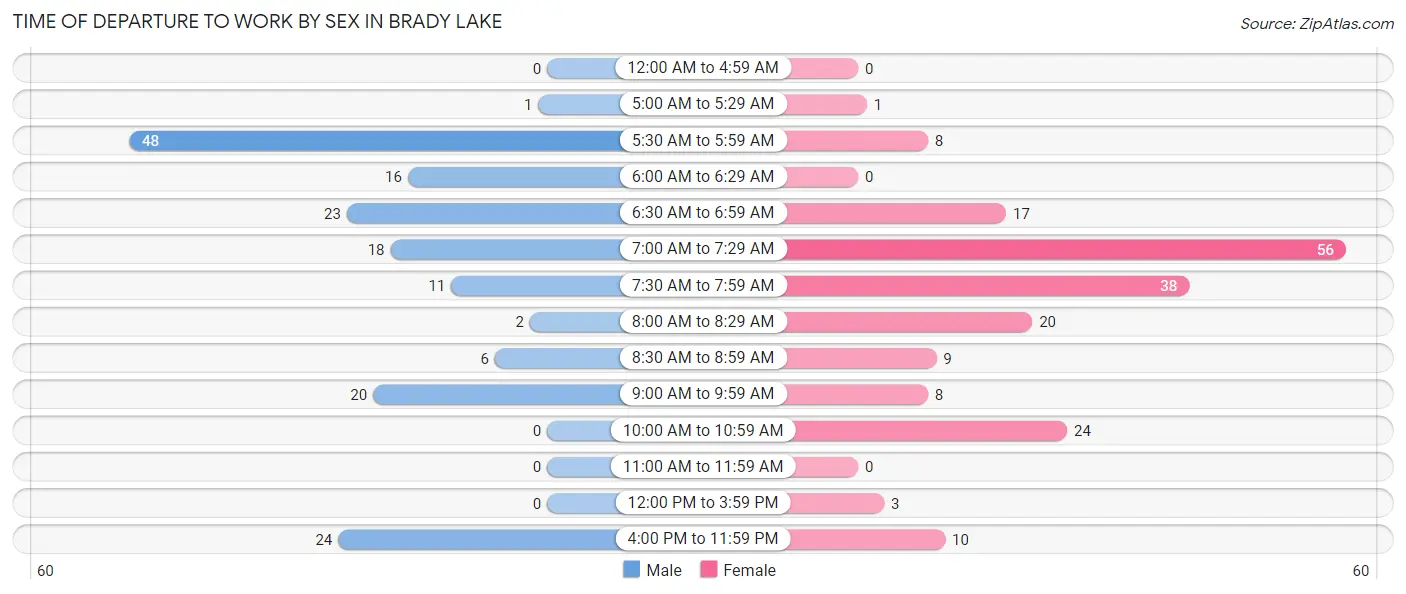
| Time of Departure | Male | Female |
| 12:00 AM to 4:59 AM | 0 (0.0%) | 0 (0.0%) |
| 5:00 AM to 5:29 AM | 1 (0.6%) | 1 (0.5%) |
| 5:30 AM to 5:59 AM | 48 (28.4%) | 8 (4.1%) |
| 6:00 AM to 6:29 AM | 16 (9.5%) | 0 (0.0%) |
| 6:30 AM to 6:59 AM | 23 (13.6%) | 17 (8.8%) |
| 7:00 AM to 7:29 AM | 18 (10.6%) | 56 (28.9%) |
| 7:30 AM to 7:59 AM | 11 (6.5%) | 38 (19.6%) |
| 8:00 AM to 8:29 AM | 2 (1.2%) | 20 (10.3%) |
| 8:30 AM to 8:59 AM | 6 (3.5%) | 9 (4.6%) |
| 9:00 AM to 9:59 AM | 20 (11.8%) | 8 (4.1%) |
| 10:00 AM to 10:59 AM | 0 (0.0%) | 24 (12.4%) |
| 11:00 AM to 11:59 AM | 0 (0.0%) | 0 (0.0%) |
| 12:00 PM to 3:59 PM | 0 (0.0%) | 3 (1.5%) |
| 4:00 PM to 11:59 PM | 24 (14.2%) | 10 (5.1%) |
| Total | 169 (100.0%) | 194 (100.0%) |
Housing Occupancy in Brady Lake
Occupancy by Ownership in Brady Lake
Of the total 464 dwellings in Brady Lake, owner-occupied units account for 378 (81.5%), while renter-occupied units make up 86 (18.5%).
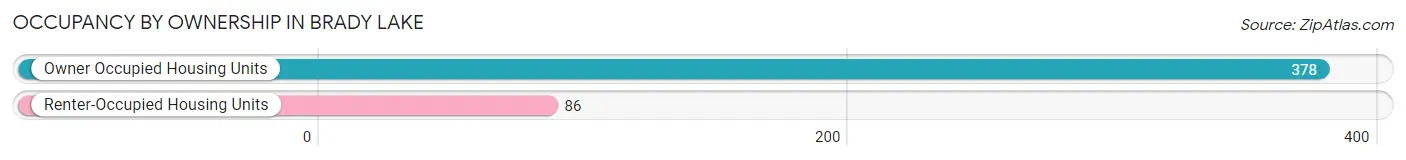
| Occupancy | # Housing Units | % Housing Units |
| Owner Occupied Housing Units | 378 | 81.5% |
| Renter-Occupied Housing Units | 86 | 18.5% |
| Total Occupied Housing Units | 464 | 100.0% |
Occupancy by Household Size in Brady Lake
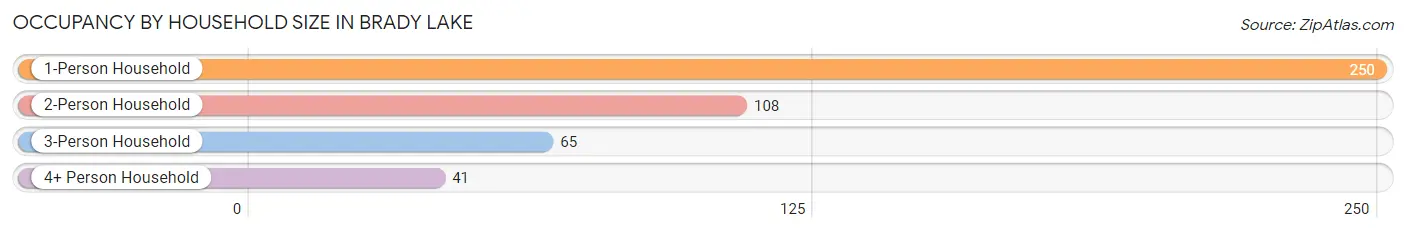
| Household Size | # Housing Units | % Housing Units |
| 1-Person Household | 250 | 53.9% |
| 2-Person Household | 108 | 23.3% |
| 3-Person Household | 65 | 14.0% |
| 4+ Person Household | 41 | 8.8% |
| Total Housing Units | 464 | 100.0% |
Occupancy by Ownership by Household Size in Brady Lake
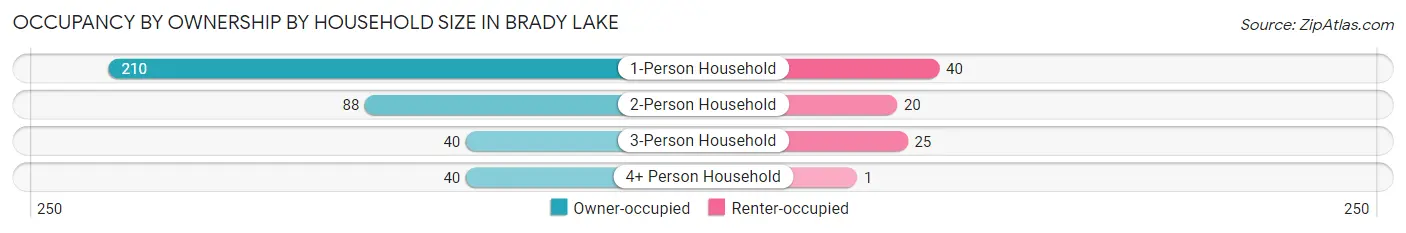
| Household Size | Owner-occupied | Renter-occupied |
| 1-Person Household | 210 (84.0%) | 40 (16.0%) |
| 2-Person Household | 88 (81.5%) | 20 (18.5%) |
| 3-Person Household | 40 (61.5%) | 25 (38.5%) |
| 4+ Person Household | 40 (97.6%) | 1 (2.4%) |
| Total Housing Units | 378 (81.5%) | 86 (18.5%) |
Occupancy by Educational Attainment in Brady Lake
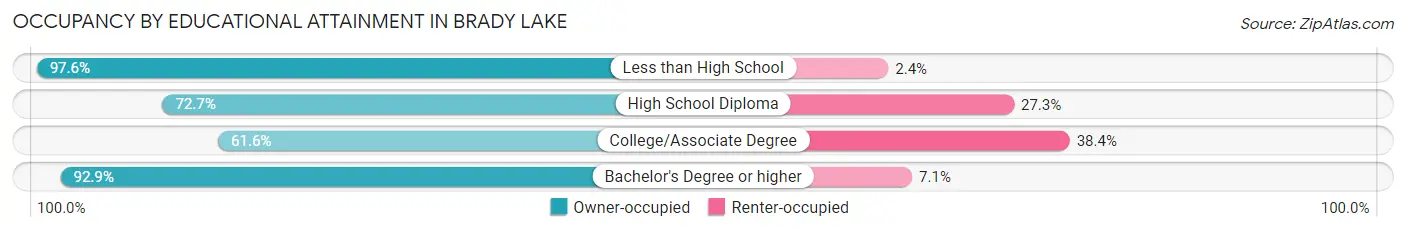
| Household Size | Owner-occupied | Renter-occupied |
| Less than High School | 81 (97.6%) | 2 (2.4%) |
| High School Diploma | 93 (72.7%) | 35 (27.3%) |
| College/Associate Degree | 61 (61.6%) | 38 (38.4%) |
| Bachelor's Degree or higher | 143 (92.9%) | 11 (7.1%) |
Occupancy by Age of Householder in Brady Lake
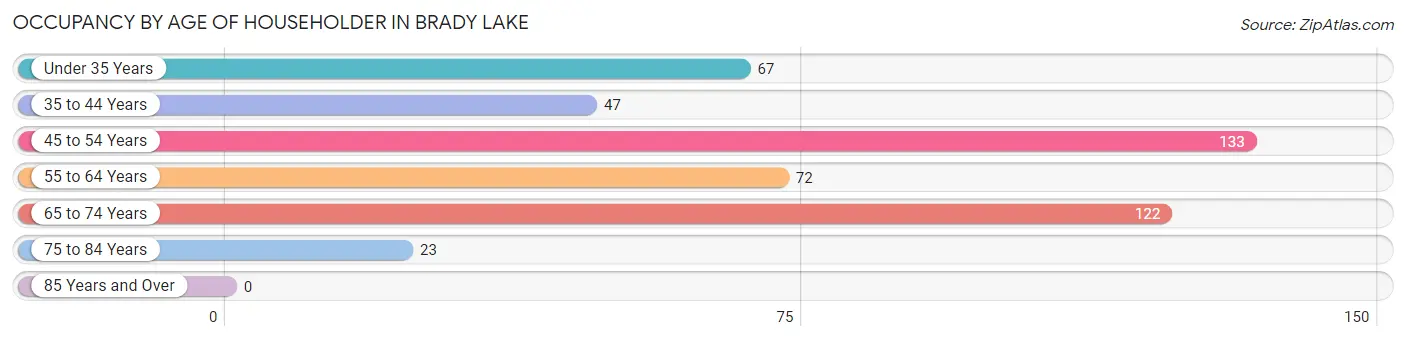
| Age Bracket | # Households | % Households |
| Under 35 Years | 67 | 14.4% |
| 35 to 44 Years | 47 | 10.1% |
| 45 to 54 Years | 133 | 28.7% |
| 55 to 64 Years | 72 | 15.5% |
| 65 to 74 Years | 122 | 26.3% |
| 75 to 84 Years | 23 | 5.0% |
| 85 Years and Over | 0 | 0.0% |
| Total | 464 | 100.0% |
Housing Finances in Brady Lake
Median Income by Occupancy in Brady Lake
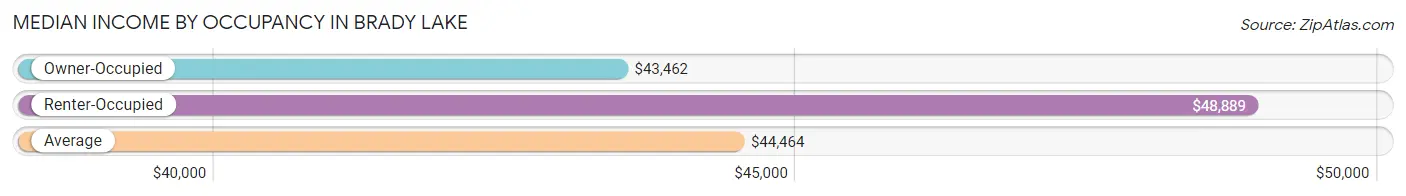
| Occupancy Type | # Households | Median Income |
| Owner-Occupied | 378 (81.5%) | $43,462 |
| Renter-Occupied | 86 (18.5%) | $48,889 |
| Average | 464 (100.0%) | $44,464 |
Occupancy by Householder Income Bracket in Brady Lake
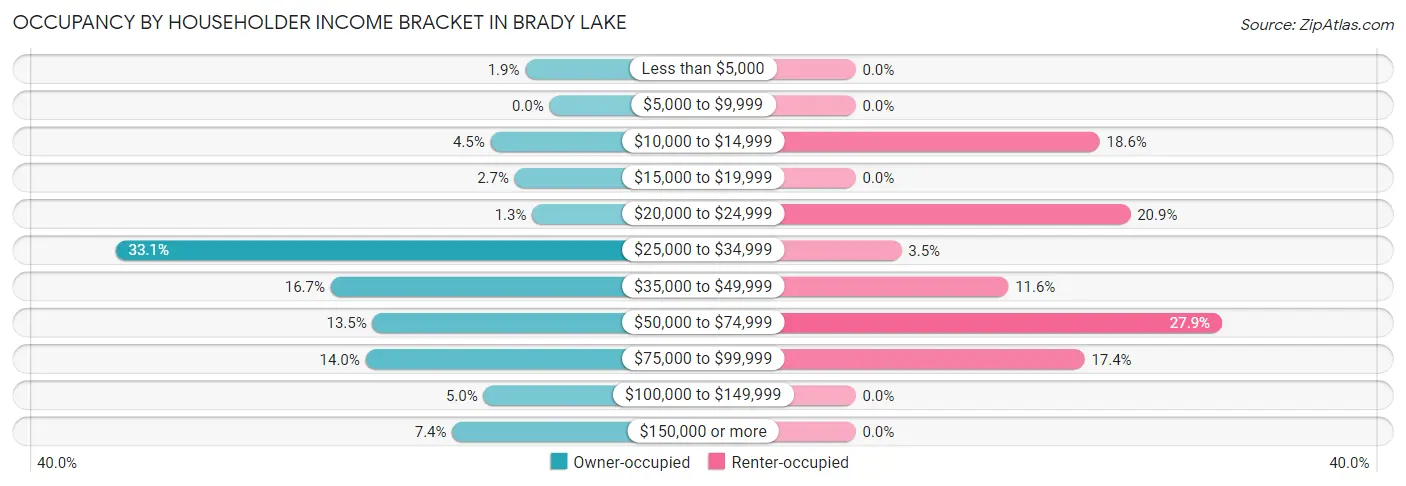
| Income Bracket | Owner-occupied | Renter-occupied |
| Less than $5,000 | 7 (1.8%) | 0 (0.0%) |
| $5,000 to $9,999 | 0 (0.0%) | 0 (0.0%) |
| $10,000 to $14,999 | 17 (4.5%) | 16 (18.6%) |
| $15,000 to $19,999 | 10 (2.6%) | 0 (0.0%) |
| $20,000 to $24,999 | 5 (1.3%) | 18 (20.9%) |
| $25,000 to $34,999 | 125 (33.1%) | 3 (3.5%) |
| $35,000 to $49,999 | 63 (16.7%) | 10 (11.6%) |
| $50,000 to $74,999 | 51 (13.5%) | 24 (27.9%) |
| $75,000 to $99,999 | 53 (14.0%) | 15 (17.4%) |
| $100,000 to $149,999 | 19 (5.0%) | 0 (0.0%) |
| $150,000 or more | 28 (7.4%) | 0 (0.0%) |
| Total | 378 (100.0%) | 86 (100.0%) |
Monthly Housing Cost Tiers in Brady Lake
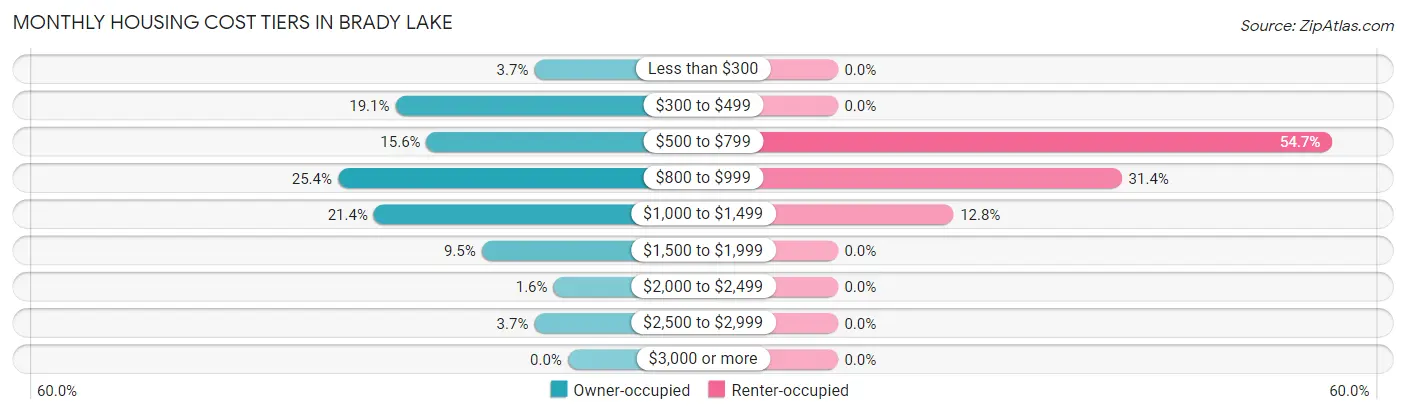
| Monthly Cost | Owner-occupied | Renter-occupied |
| Less than $300 | 14 (3.7%) | 0 (0.0%) |
| $300 to $499 | 72 (19.1%) | 0 (0.0%) |
| $500 to $799 | 59 (15.6%) | 47 (54.6%) |
| $800 to $999 | 96 (25.4%) | 27 (31.4%) |
| $1,000 to $1,499 | 81 (21.4%) | 11 (12.8%) |
| $1,500 to $1,999 | 36 (9.5%) | 0 (0.0%) |
| $2,000 to $2,499 | 6 (1.6%) | 0 (0.0%) |
| $2,500 to $2,999 | 14 (3.7%) | 0 (0.0%) |
| $3,000 or more | 0 (0.0%) | 0 (0.0%) |
| Total | 378 (100.0%) | 86 (100.0%) |
Physical Housing Characteristics in Brady Lake
Housing Structures in Brady Lake
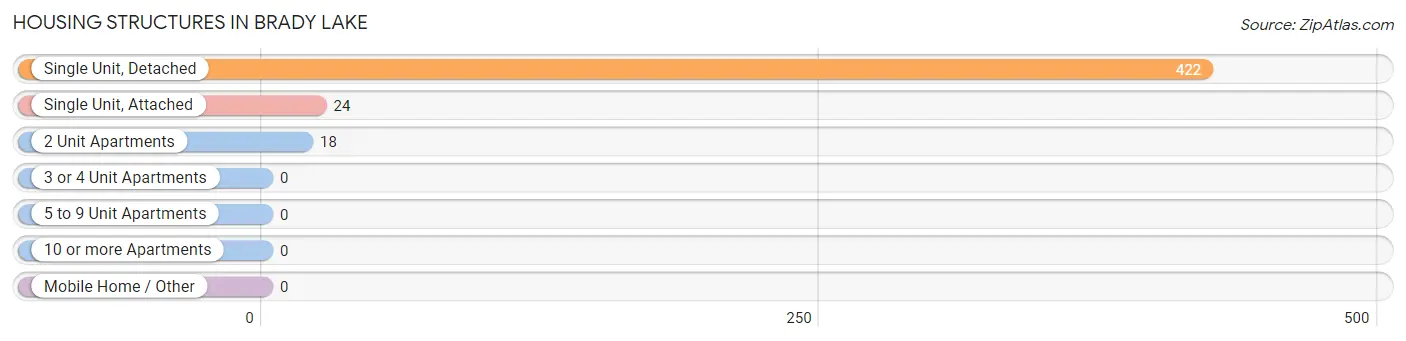
| Structure Type | # Housing Units | % Housing Units |
| Single Unit, Detached | 422 | 90.9% |
| Single Unit, Attached | 24 | 5.2% |
| 2 Unit Apartments | 18 | 3.9% |
| 3 or 4 Unit Apartments | 0 | 0.0% |
| 5 to 9 Unit Apartments | 0 | 0.0% |
| 10 or more Apartments | 0 | 0.0% |
| Mobile Home / Other | 0 | 0.0% |
| Total | 464 | 100.0% |
Housing Structures by Occupancy in Brady Lake
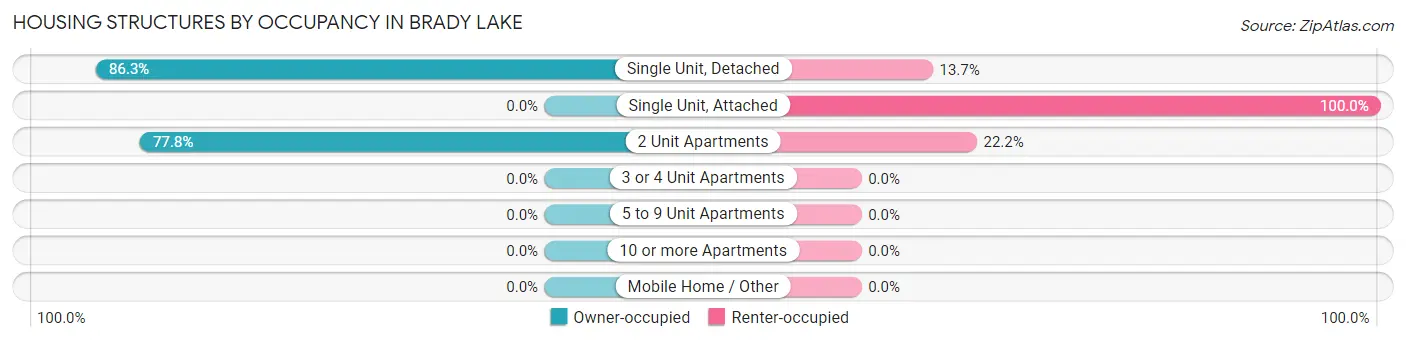
| Structure Type | Owner-occupied | Renter-occupied |
| Single Unit, Detached | 364 (86.3%) | 58 (13.7%) |
| Single Unit, Attached | 0 (0.0%) | 24 (100.0%) |
| 2 Unit Apartments | 14 (77.8%) | 4 (22.2%) |
| 3 or 4 Unit Apartments | 0 (0.0%) | 0 (0.0%) |
| 5 to 9 Unit Apartments | 0 (0.0%) | 0 (0.0%) |
| 10 or more Apartments | 0 (0.0%) | 0 (0.0%) |
| Mobile Home / Other | 0 (0.0%) | 0 (0.0%) |
| Total | 378 (81.5%) | 86 (18.5%) |
Housing Structures by Number of Rooms in Brady Lake
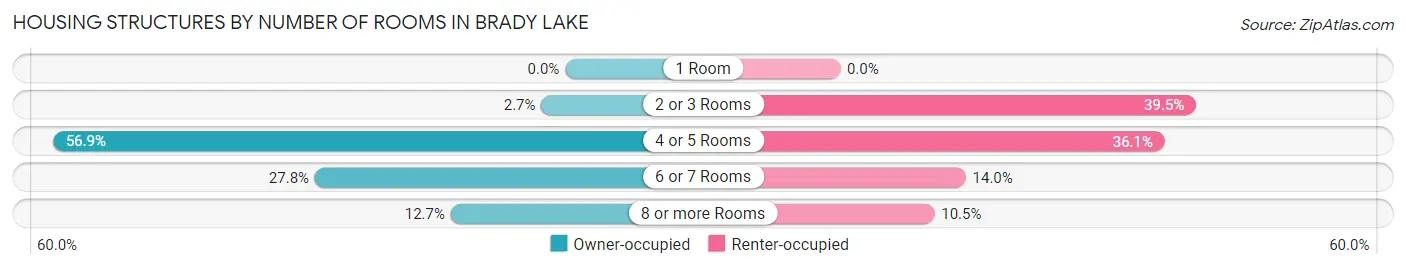
| Number of Rooms | Owner-occupied | Renter-occupied |
| 1 Room | 0 (0.0%) | 0 (0.0%) |
| 2 or 3 Rooms | 10 (2.6%) | 34 (39.5%) |
| 4 or 5 Rooms | 215 (56.9%) | 31 (36.0%) |
| 6 or 7 Rooms | 105 (27.8%) | 12 (14.0%) |
| 8 or more Rooms | 48 (12.7%) | 9 (10.5%) |
| Total | 378 (100.0%) | 86 (100.0%) |
Housing Structure by Heating Type in Brady Lake
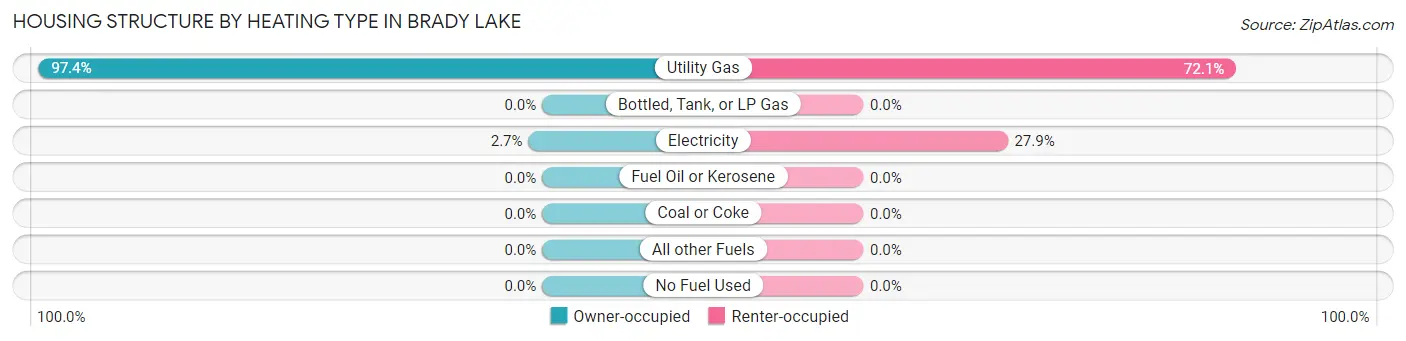
| Heating Type | Owner-occupied | Renter-occupied |
| Utility Gas | 368 (97.4%) | 62 (72.1%) |
| Bottled, Tank, or LP Gas | 0 (0.0%) | 0 (0.0%) |
| Electricity | 10 (2.6%) | 24 (27.9%) |
| Fuel Oil or Kerosene | 0 (0.0%) | 0 (0.0%) |
| Coal or Coke | 0 (0.0%) | 0 (0.0%) |
| All other Fuels | 0 (0.0%) | 0 (0.0%) |
| No Fuel Used | 0 (0.0%) | 0 (0.0%) |
| Total | 378 (100.0%) | 86 (100.0%) |
Household Vehicle Usage in Brady Lake
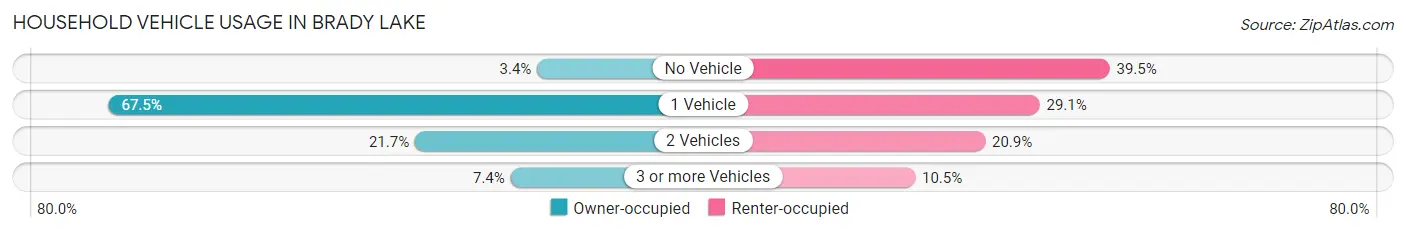
| Vehicles per Household | Owner-occupied | Renter-occupied |
| No Vehicle | 13 (3.4%) | 34 (39.5%) |
| 1 Vehicle | 255 (67.5%) | 25 (29.1%) |
| 2 Vehicles | 82 (21.7%) | 18 (20.9%) |
| 3 or more Vehicles | 28 (7.4%) | 9 (10.5%) |
| Total | 378 (100.0%) | 86 (100.0%) |
Real Estate & Mortgages in Brady Lake
Real Estate and Mortgage Overview in Brady Lake
| Characteristic | Without Mortgage | With Mortgage |
| Housing Units | 202 | 176 |
| Median Property Value | $222,900 | $137,500 |
| Median Household Income | - | - |
| Monthly Housing Costs | $567 | $0 |
| Real Estate Taxes | - | - |
Property Value by Mortgage Status in Brady Lake
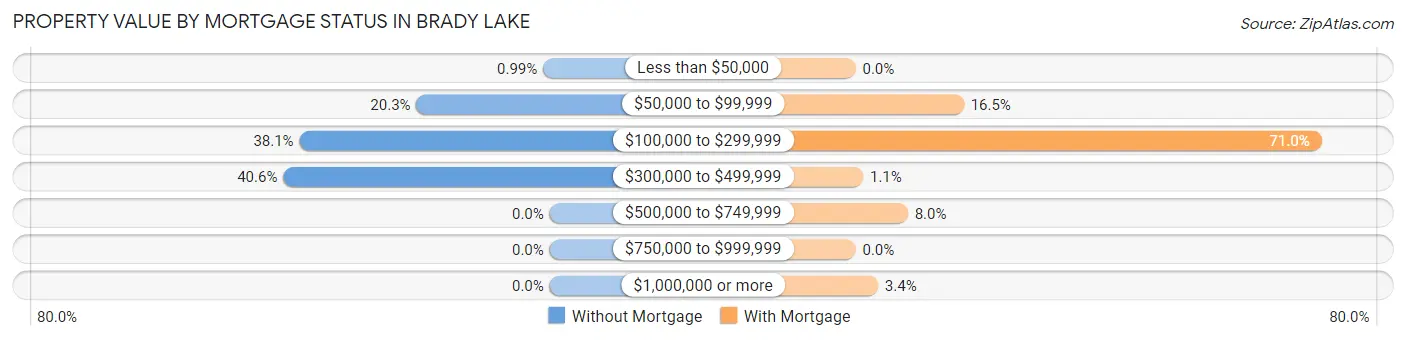
| Property Value | Without Mortgage | With Mortgage |
| Less than $50,000 | 2 (1.0%) | 0 (0.0%) |
| $50,000 to $99,999 | 41 (20.3%) | 29 (16.5%) |
| $100,000 to $299,999 | 77 (38.1%) | 125 (71.0%) |
| $300,000 to $499,999 | 82 (40.6%) | 2 (1.1%) |
| $500,000 to $749,999 | 0 (0.0%) | 14 (8.0%) |
| $750,000 to $999,999 | 0 (0.0%) | 0 (0.0%) |
| $1,000,000 or more | 0 (0.0%) | 6 (3.4%) |
| Total | 202 (100.0%) | 176 (100.0%) |
Household Income by Mortgage Status in Brady Lake
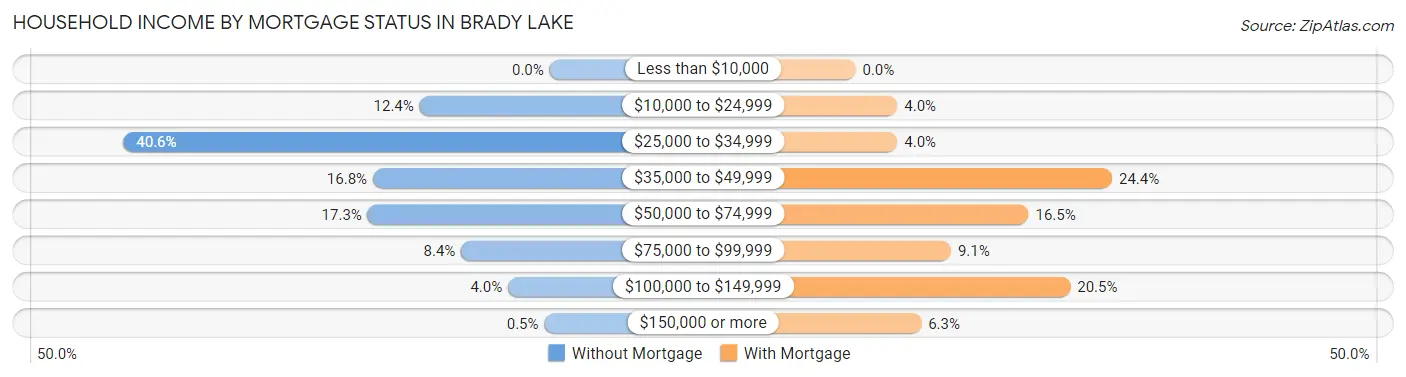
| Household Income | Without Mortgage | With Mortgage |
| Less than $10,000 | 0 (0.0%) | 0 (0.0%) |
| $10,000 to $24,999 | 25 (12.4%) | 7 (4.0%) |
| $25,000 to $34,999 | 82 (40.6%) | 7 (4.0%) |
| $35,000 to $49,999 | 34 (16.8%) | 43 (24.4%) |
| $50,000 to $74,999 | 35 (17.3%) | 29 (16.5%) |
| $75,000 to $99,999 | 17 (8.4%) | 16 (9.1%) |
| $100,000 to $149,999 | 8 (4.0%) | 36 (20.4%) |
| $150,000 or more | 1 (0.5%) | 11 (6.2%) |
| Total | 202 (100.0%) | 176 (100.0%) |
Property Value to Household Income Ratio in Brady Lake
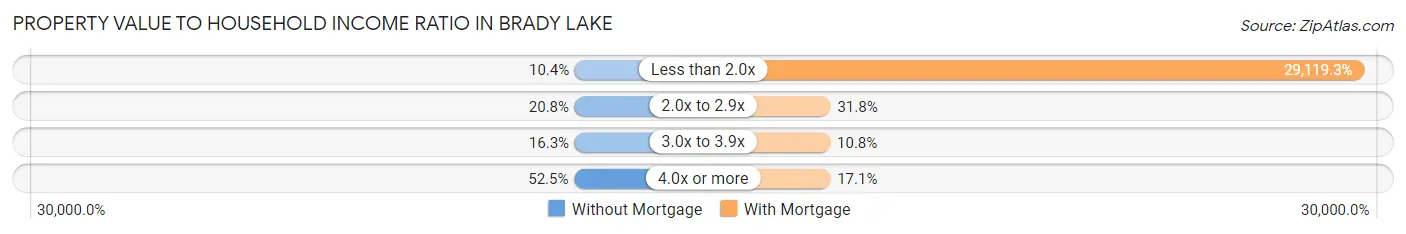
| Value-to-Income Ratio | Without Mortgage | With Mortgage |
| Less than 2.0x | 21 (10.4%) | 51,250 (29,119.3%) |
| 2.0x to 2.9x | 42 (20.8%) | 56 (31.8%) |
| 3.0x to 3.9x | 33 (16.3%) | 19 (10.8%) |
| 4.0x or more | 106 (52.5%) | 30 (17.1%) |
| Total | 202 (100.0%) | 176 (100.0%) |
Real Estate Taxes by Mortgage Status in Brady Lake
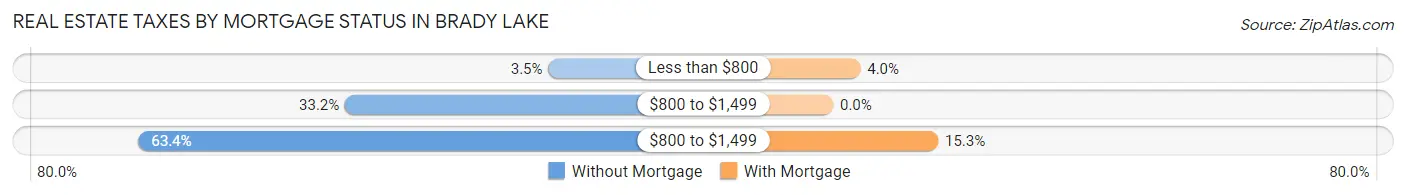
| Property Taxes | Without Mortgage | With Mortgage |
| Less than $800 | 7 (3.5%) | 7 (4.0%) |
| $800 to $1,499 | 67 (33.2%) | 0 (0.0%) |
| $800 to $1,499 | 128 (63.4%) | 27 (15.3%) |
| Total | 202 (100.0%) | 176 (100.0%) |
Health & Disability in Brady Lake
Health Insurance Coverage by Age in Brady Lake
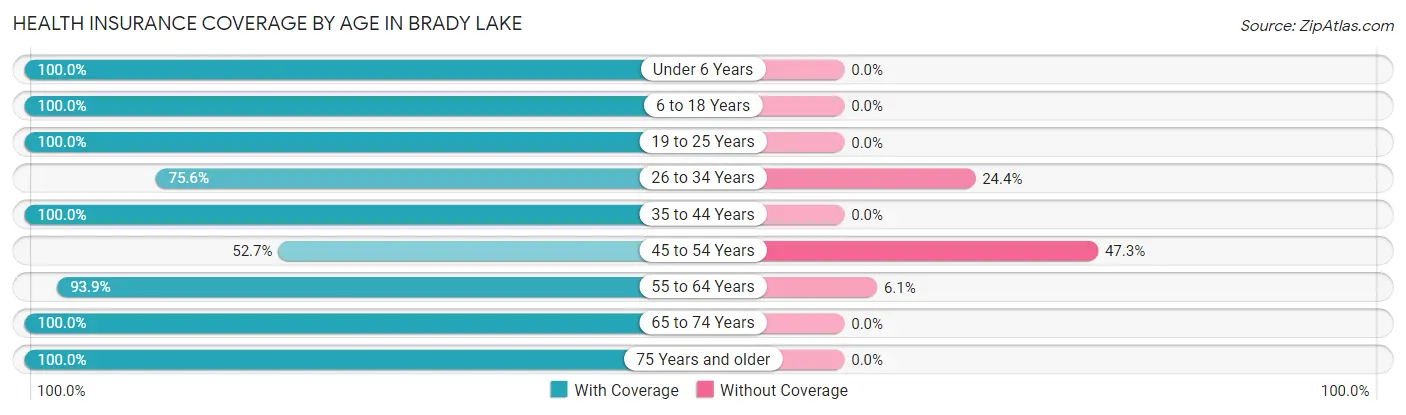
| Age Bracket | With Coverage | Without Coverage |
| Under 6 Years | 32 (100.0%) | 0 (0.0%) |
| 6 to 18 Years | 155 (100.0%) | 0 (0.0%) |
| 19 to 25 Years | 58 (100.0%) | 0 (0.0%) |
| 26 to 34 Years | 65 (75.6%) | 21 (24.4%) |
| 35 to 44 Years | 48 (100.0%) | 0 (0.0%) |
| 45 to 54 Years | 88 (52.7%) | 79 (47.3%) |
| 55 to 64 Years | 108 (93.9%) | 7 (6.1%) |
| 65 to 74 Years | 179 (100.0%) | 0 (0.0%) |
| 75 Years and older | 28 (100.0%) | 0 (0.0%) |
| Total | 761 (87.7%) | 107 (12.3%) |
Health Insurance Coverage by Citizenship Status in Brady Lake
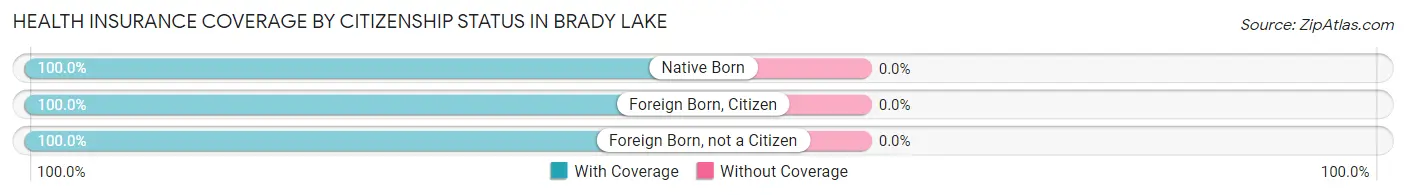
| Citizenship Status | With Coverage | Without Coverage |
| Native Born | 32 (100.0%) | 0 (0.0%) |
| Foreign Born, Citizen | 155 (100.0%) | 0 (0.0%) |
| Foreign Born, not a Citizen | 58 (100.0%) | 0 (0.0%) |
Health Insurance Coverage by Household Income in Brady Lake
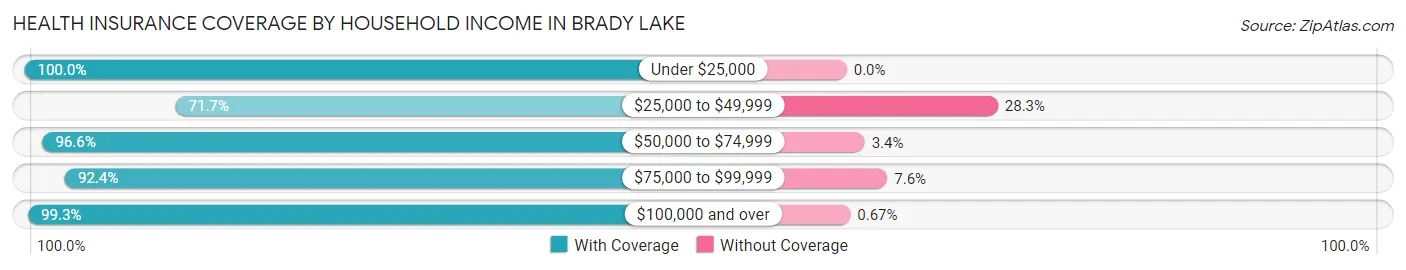
| Household Income | With Coverage | Without Coverage |
| Under $25,000 | 122 (100.0%) | 0 (0.0%) |
| $25,000 to $49,999 | 228 (71.7%) | 90 (28.3%) |
| $50,000 to $74,999 | 115 (96.6%) | 4 (3.4%) |
| $75,000 to $99,999 | 146 (92.4%) | 12 (7.6%) |
| $100,000 and over | 148 (99.3%) | 1 (0.7%) |
Public vs Private Health Insurance Coverage by Age in Brady Lake
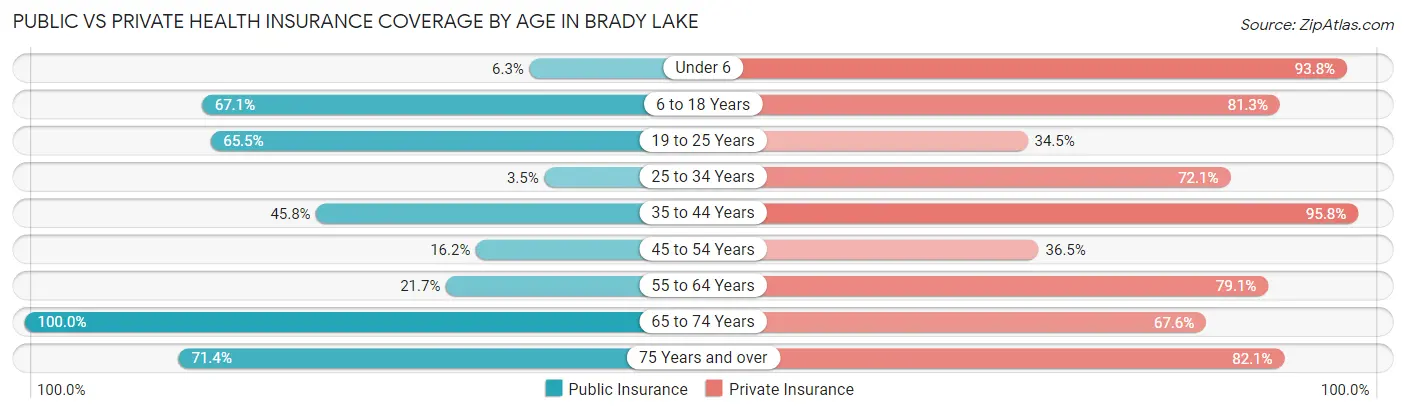
| Age Bracket | Public Insurance | Private Insurance |
| Under 6 | 2 (6.2%) | 30 (93.8%) |
| 6 to 18 Years | 104 (67.1%) | 126 (81.3%) |
| 19 to 25 Years | 38 (65.5%) | 20 (34.5%) |
| 25 to 34 Years | 3 (3.5%) | 62 (72.1%) |
| 35 to 44 Years | 22 (45.8%) | 46 (95.8%) |
| 45 to 54 Years | 27 (16.2%) | 61 (36.5%) |
| 55 to 64 Years | 25 (21.7%) | 91 (79.1%) |
| 65 to 74 Years | 179 (100.0%) | 121 (67.6%) |
| 75 Years and over | 20 (71.4%) | 23 (82.1%) |
| Total | 420 (48.4%) | 580 (66.8%) |
Disability Status by Sex by Age in Brady Lake
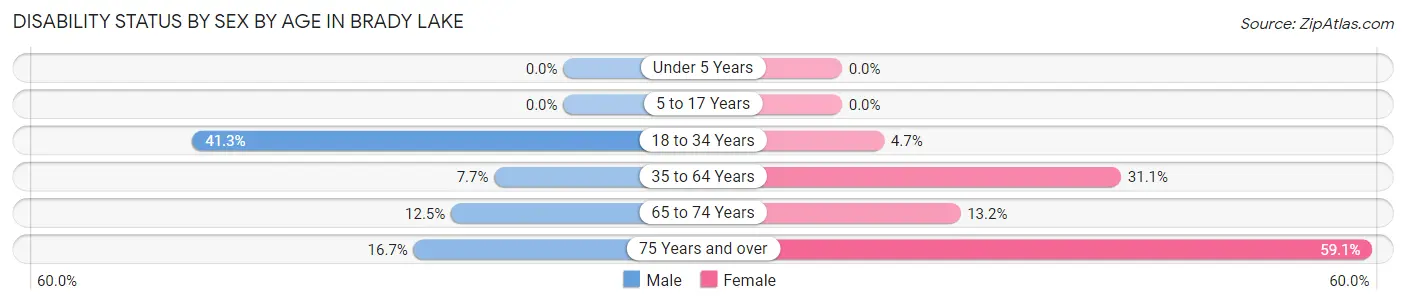
| Age Bracket | Male | Female |
| Under 5 Years | 0 (0.0%) | 0 (0.0%) |
| 5 to 17 Years | 0 (0.0%) | 0 (0.0%) |
| 18 to 34 Years | 50 (41.3%) | 3 (4.7%) |
| 35 to 64 Years | 14 (7.7%) | 46 (31.1%) |
| 65 to 74 Years | 11 (12.5%) | 12 (13.2%) |
| 75 Years and over | 1 (16.7%) | 13 (59.1%) |
Disability Class by Sex by Age in Brady Lake
Disability Class: Hearing Difficulty
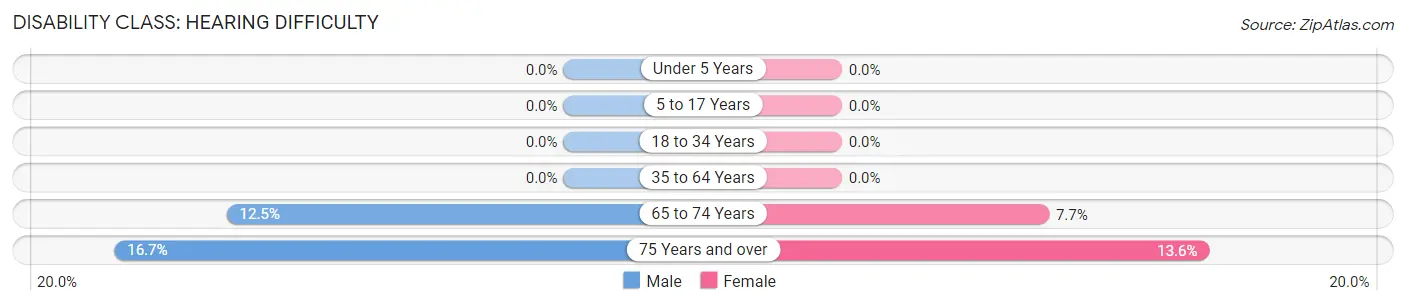
| Age Bracket | Male | Female |
| Under 5 Years | 0 (0.0%) | 0 (0.0%) |
| 5 to 17 Years | 0 (0.0%) | 0 (0.0%) |
| 18 to 34 Years | 0 (0.0%) | 0 (0.0%) |
| 35 to 64 Years | 0 (0.0%) | 0 (0.0%) |
| 65 to 74 Years | 11 (12.5%) | 7 (7.7%) |
| 75 Years and over | 1 (16.7%) | 3 (13.6%) |
Disability Class: Vision Difficulty
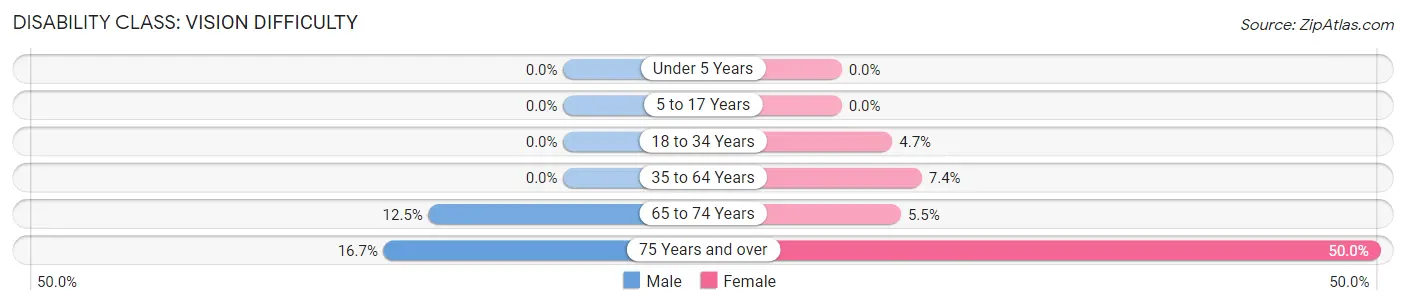
| Age Bracket | Male | Female |
| Under 5 Years | 0 (0.0%) | 0 (0.0%) |
| 5 to 17 Years | 0 (0.0%) | 0 (0.0%) |
| 18 to 34 Years | 0 (0.0%) | 3 (4.7%) |
| 35 to 64 Years | 0 (0.0%) | 11 (7.4%) |
| 65 to 74 Years | 11 (12.5%) | 5 (5.5%) |
| 75 Years and over | 1 (16.7%) | 11 (50.0%) |
Disability Class: Cognitive Difficulty
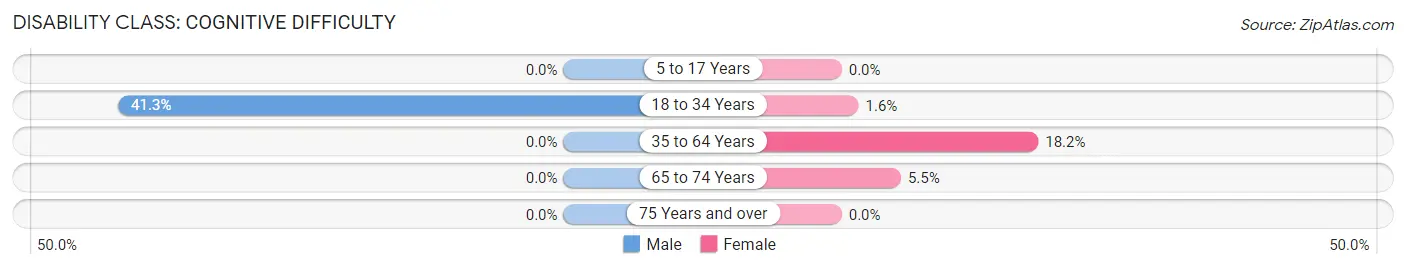
| Age Bracket | Male | Female |
| 5 to 17 Years | 0 (0.0%) | 0 (0.0%) |
| 18 to 34 Years | 50 (41.3%) | 1 (1.6%) |
| 35 to 64 Years | 0 (0.0%) | 27 (18.2%) |
| 65 to 74 Years | 0 (0.0%) | 5 (5.5%) |
| 75 Years and over | 0 (0.0%) | 0 (0.0%) |
Disability Class: Ambulatory Difficulty
| Age Bracket | Male | Female |
| 5 to 17 Years | 0 (0.0%) | 0 (0.0%) |
| 18 to 34 Years | 36 (29.7%) | 3 (4.7%) |
| 35 to 64 Years | 14 (7.7%) | 21 (14.2%) |
| 65 to 74 Years | 11 (12.5%) | 8 (8.8%) |
| 75 Years and over | 0 (0.0%) | 5 (22.7%) |
Disability Class: Self-Care Difficulty
| Age Bracket | Male | Female |
| 5 to 17 Years | 0 (0.0%) | 0 (0.0%) |
| 18 to 34 Years | 18 (14.9%) | 1 (1.6%) |
| 35 to 64 Years | 0 (0.0%) | 11 (7.4%) |
| 65 to 74 Years | 0 (0.0%) | 0 (0.0%) |
| 75 Years and over | 0 (0.0%) | 3 (13.6%) |
Technology Access in Brady Lake
Computing Device Access in Brady Lake
| Device Type | # Households | % Households |
| Desktop or Laptop | 368 | 79.3% |
| Smartphone | 426 | 91.8% |
| Tablet | 328 | 70.7% |
| No Computing Device | 14 | 3.0% |
| Total | 464 | 100.0% |
Internet Access in Brady Lake
| Internet Type | # Households | % Households |
| Dial-Up Internet | 0 | 0.0% |
| Broadband Home | 347 | 74.8% |
| Cellular Data Only | 60 | 12.9% |
| Satellite Internet | 24 | 5.2% |
| No Internet | 45 | 9.7% |
| Total | 464 | 100.0% |
Brady Lake Summary
Brady Lake is a village located in Portage County, Ohio, United States. The population was 1,092 at the 2010 census. It is part of the Akron Metropolitan Statistical Area.
History
The area that is now Brady Lake was first settled in 1810 by a group of settlers from Connecticut. The village was originally known as Brady's Lake, named after the lake that was located in the area. The lake was named after the Brady family, who were among the first settlers in the area.
In 1818, the village was officially incorporated as Brady Lake. The village was named after the lake, which was named after the Brady family.
The village grew slowly over the years, and by the early 1900s, it had become a popular summer resort destination. The village was home to several resorts, including the Brady Lake Hotel, which was built in 1891.
In the 1950s, the village began to decline as a resort destination, and many of the resorts closed. The village has since become a quiet residential community.
Geography
Brady Lake is located at 41 10 25 North 81 20 45 West 41 173611 81 345833
According to the United States Census Bureau, the village has a total area of 0.7 square miles (1.8 km2), all of it land.
Demographics
As of the census of 2000, there were 1,092 people, 441 households, and 315 families residing in the village. The population density was 1,541.2 people per square mile (595.2/km2). There were 463 housing units at an average density of 645.2 per square mile (249.7/km2). The racial makeup of the village was 97.7% White, 0.2% African American, 0.2% Native American, 0.2% Asian, 0.2% from other races, and 1.7% from two or more races. Hispanic or Latino of any race were 0.7% of the population.
There were 441 households, out of which 33.2% had children under the age of 18 living with them, 54.2% were married couples living together, 11.3% had a female householder with no husband present, and 30.2% were non-families. 25.2% of all households were made up of individuals, and 9.3% had someone living alone who was 65 years of age or older. The average household size was 2.48 and the average family size was 2.97.
In the village, the population was spread out, with 25.2% under the age of 18, 7.2% from 18 to 24, 30.2% from 25 to 44, 24.2% from 45 to 64, and 13.2% who were 65 years of age or older. The median age was 38 years. For every 100 females, there were 97.2 males. For every 100 females age 18 and over, there were 94.2 males.
The median income for a household in the village was $41,250, and the median income for a family was $48,750. Males had a median income of $35,000 versus $25,000 for females. The per capita income for the village was $19,945. About 4.2% of families and 5.2% of the population were below the poverty line, including 6.2% of those under age 18 and 4.2% of those age 65 or over.
Economy
The economy of Brady Lake is largely based on agriculture and tourism. The village is home to several farms, which produce a variety of crops, including corn, soybeans, and wheat. The village is also home to several small businesses, including restaurants, shops, and other services.
The village is also a popular tourist destination, as it is located near several popular attractions, including the Cuyahoga Valley National Park, the Akron Zoo, and the Pro Football Hall of Fame. The village is also home to several parks and recreational areas, including Brady Lake Park, which offers swimming, fishing, and boating.
Conclusion
Brady Lake is a small village located in Portage County, Ohio. The village has a population of 1,092 and is part of the Akron Metropolitan Statistical Area. The village was first settled in 1810 and was officially incorporated in 1818. The economy of Brady Lake is largely based on agriculture and tourism, and the village is home to several farms, businesses, and recreational areas.
Common Questions
What is Per Capita Income in Brady Lake?
Per Capita income in Brady Lake is $31,060.
What is the Median Family Income in Brady Lake?
Median Family Income in Brady Lake is $76,375.
What is the Median Household income in Brady Lake?
Median Household Income in Brady Lake is $44,464.
What is Income or Wage Gap in Brady Lake?
Income or Wage Gap in Brady Lake is 29.3%.
Women in Brady Lake earn 70.7 cents for every dollar earned by a man.
What is Inequality or Gini Index in Brady Lake?
Inequality or Gini Index in Brady Lake is 0.40.
What is the Total Population of Brady Lake?
Total Population of Brady Lake is 868.
What is the Total Male Population of Brady Lake?
Total Male Population of Brady Lake is 450.
What is the Total Female Population of Brady Lake?
Total Female Population of Brady Lake is 418.
What is the Ratio of Males per 100 Females in Brady Lake?
There are 107.66 Males per 100 Females in Brady Lake.
What is the Ratio of Females per 100 Males in Brady Lake?
There are 92.89 Females per 100 Males in Brady Lake.
What is the Median Population Age in Brady Lake?
Median Population Age in Brady Lake is 48.5 Years.
What is the Average Family Size in Brady Lake
Average Family Size in Brady Lake is 2.9 People.
What is the Average Household Size in Brady Lake
Average Household Size in Brady Lake is 1.9 People.
How Large is the Labor Force in Brady Lake?
There are 510 People in the Labor Forcein in Brady Lake.
What is the Percentage of People in the Labor Force in Brady Lake?
67.8% of People are in the Labor Force in Brady Lake.
What is the Unemployment Rate in Brady Lake?
Unemployment Rate in Brady Lake is 24.3%.