Fairview, OH Map & Demographics
Fairview Map
Fairview Overview
$20,018
PER CAPITA INCOME
$26,364
AVG HOUSEHOLD INCOME
0.41
INEQUALITY / GINI INDEX
44
TOTAL POPULATION
24
MALE POPULATION
20
FEMALE POPULATION
120.00
MALES / 100 FEMALES
83.33
FEMALES / 100 MALES
62.2
MEDIAN AGE
2.2
AVG FAMILY SIZE
1.7
AVG HOUSEHOLD SIZE
13
LABOR FORCE [ PEOPLE ]
32.5%
PERCENT IN LABOR FORCE
30.8%
UNEMPLOYMENT RATE
Fairview Zip Codes
Fairview Area Codes
Income in Fairview
Income Overview in Fairview
| Characteristic | Number | Measure |
| Per Capita Income | 44 | $20,018 |
| Median Family Income | 11 | $0 |
| Mean Family Income | 11 | $39,727 |
| Median Household Income | 26 | $26,364 |
| Mean Household Income | 26 | $34,681 |
| Income Deficit | 11 | $0 |
| Wage / Income Gap (%) | 44 | 0.00% |
| Wage / Income Gap ($) | 44 | 100.00¢ per $1 |
| Gini / Inequality Index | 44 | 0.41 |
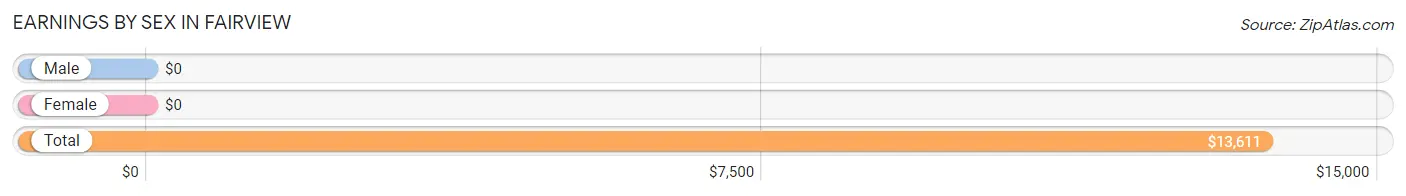
Earnings by Sex in Fairview
| Sex | Number | Average Earnings |
| Male | 11 (45.8%) | $0 |
| Female | 13 (54.2%) | $0 |
| Total | 24 (100.0%) | $13,611 |
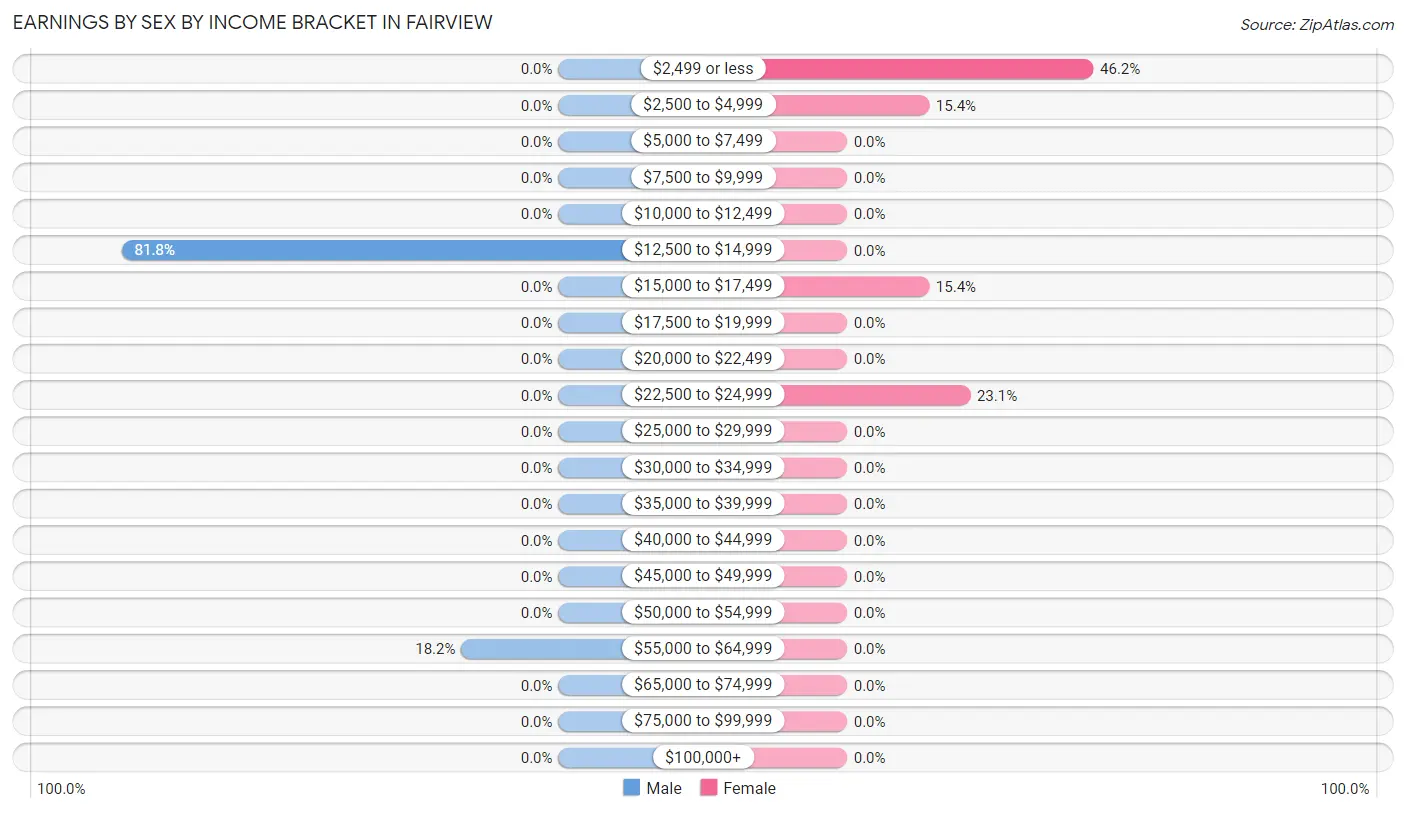
Earnings by Sex by Income Bracket in Fairview
The most common earnings brackets in Fairview are $12,500 to $14,999 for men (9 | 81.8%) and $2,499 or less for women (6 | 46.2%).
| Income | Male | Female |
| $2,499 or less | 0 (0.0%) | 6 (46.2%) |
| $2,500 to $4,999 | 0 (0.0%) | 2 (15.4%) |
| $5,000 to $7,499 | 0 (0.0%) | 0 (0.0%) |
| $7,500 to $9,999 | 0 (0.0%) | 0 (0.0%) |
| $10,000 to $12,499 | 0 (0.0%) | 0 (0.0%) |
| $12,500 to $14,999 | 9 (81.8%) | 0 (0.0%) |
| $15,000 to $17,499 | 0 (0.0%) | 2 (15.4%) |
| $17,500 to $19,999 | 0 (0.0%) | 0 (0.0%) |
| $20,000 to $22,499 | 0 (0.0%) | 0 (0.0%) |
| $22,500 to $24,999 | 0 (0.0%) | 3 (23.1%) |
| $25,000 to $29,999 | 0 (0.0%) | 0 (0.0%) |
| $30,000 to $34,999 | 0 (0.0%) | 0 (0.0%) |
| $35,000 to $39,999 | 0 (0.0%) | 0 (0.0%) |
| $40,000 to $44,999 | 0 (0.0%) | 0 (0.0%) |
| $45,000 to $49,999 | 0 (0.0%) | 0 (0.0%) |
| $50,000 to $54,999 | 0 (0.0%) | 0 (0.0%) |
| $55,000 to $64,999 | 2 (18.2%) | 0 (0.0%) |
| $65,000 to $74,999 | 0 (0.0%) | 0 (0.0%) |
| $75,000 to $99,999 | 0 (0.0%) | 0 (0.0%) |
| $100,000+ | 0 (0.0%) | 0 (0.0%) |
| Total | 11 (100.0%) | 13 (100.0%) |
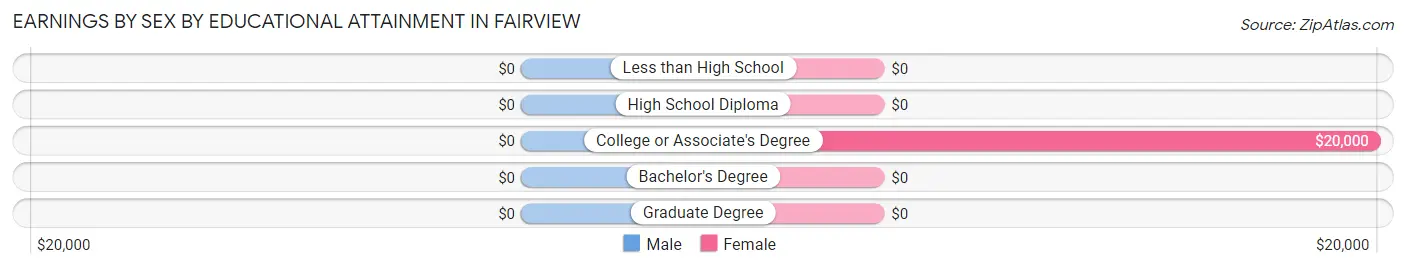
Earnings by Sex by Educational Attainment in Fairview
| Educational Attainment | Male Income | Female Income |
| Less than High School | - | - |
| High School Diploma | - | - |
| College or Associate's Degree | - | - |
| Bachelor's Degree | - | - |
| Graduate Degree | - | - |
| Total | - | - |
Family Income in Fairview
Family Income Brackets in Fairview
According to the Fairview family income data, there are 4 families falling into the $50,000 to $74,999 income range, which is the most common income bracket and makes up 36.4% of all families.
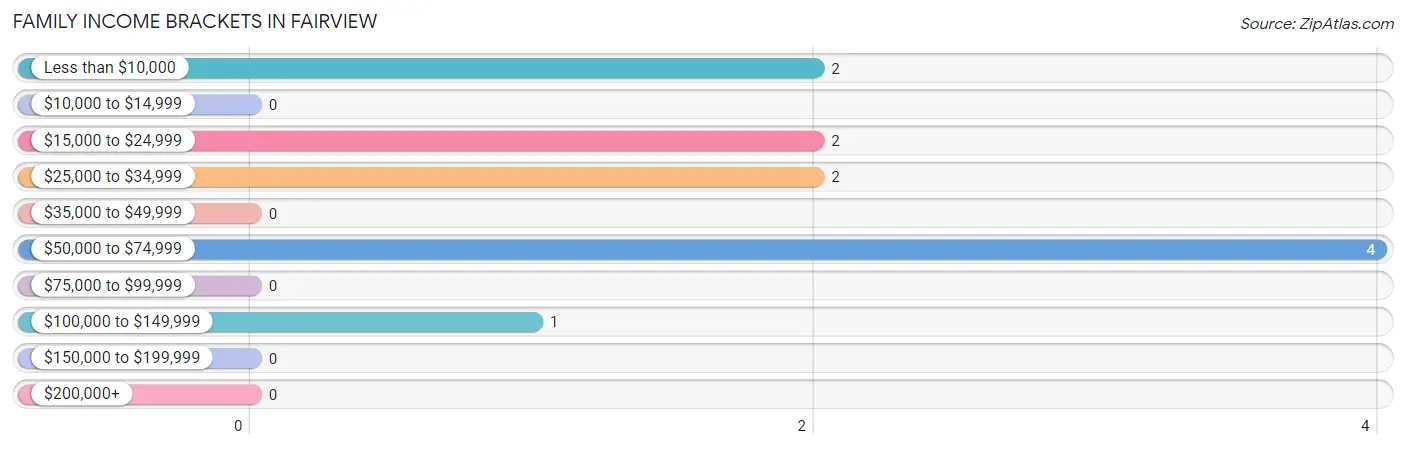
| Income Bracket | # Families | % Families |
| Less than $10,000 | 2 | 18.2% |
| $10,000 to $14,999 | 0 | 0.0% |
| $15,000 to $24,999 | 2 | 18.2% |
| $25,000 to $34,999 | 2 | 18.2% |
| $35,000 to $49,999 | 0 | 0.0% |
| $50,000 to $74,999 | 4 | 36.4% |
| $75,000 to $99,999 | 0 | 0.0% |
| $100,000 to $149,999 | 1 | 9.1% |
| $150,000 to $199,999 | 0 | 0.0% |
| $200,000+ | 0 | 0.0% |
Family Income by Famaliy Size in Fairview
| Income Bracket | # Families | Median Income |
| 2-Person Families | 8 (72.7%) | $0 |
| 3-Person Families | 2 (18.2%) | $0 |
| 4-Person Families | 0 (0.0%) | $0 |
| 5-Person Families | 1 (9.1%) | $0 |
| 6-Person Families | 0 (0.0%) | $0 |
| 7+ Person Families | 0 (0.0%) | $0 |
| Total | 11 (100.0%) | $0 |
Family Income by Number of Earners in Fairview
| Number of Earners | # Families | Median Income |
| No Earners | 3 (27.3%) | $0 |
| 1 Earner | 5 (45.5%) | $0 |
| 2 Earners | 2 (18.2%) | $0 |
| 3+ Earners | 1 (9.1%) | $0 |
| Total | 11 (100.0%) | $0 |
Household Income in Fairview
Household Income Brackets in Fairview
With 11 households falling in the category, the $25,000 to $34,999 income range is the most frequent in Fairview, accounting for 42.3% of all households.
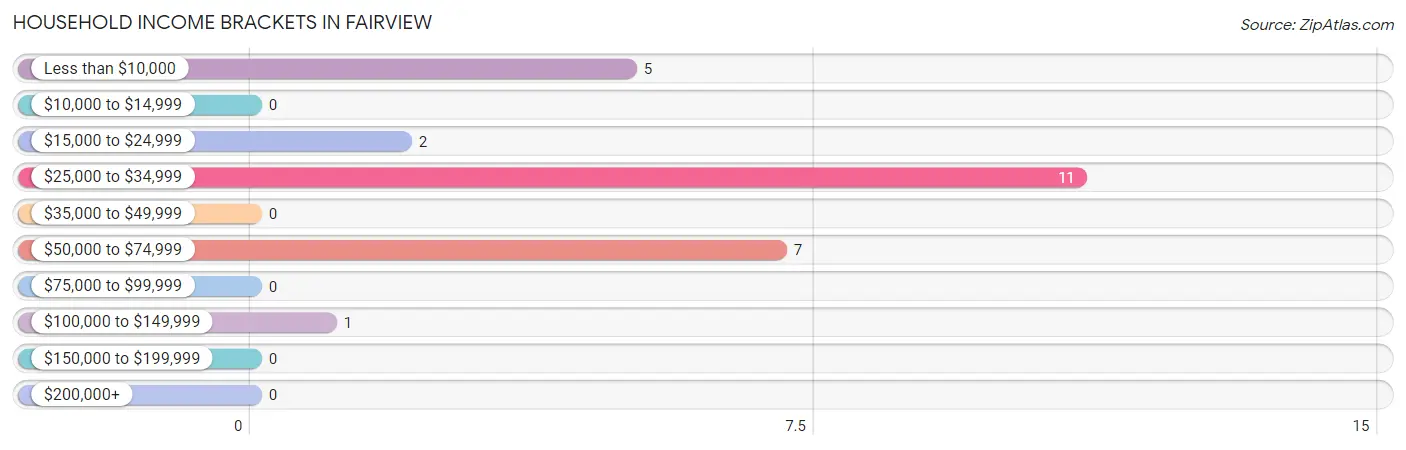
| Income Bracket | # Households | % Households |
| Less than $10,000 | 5 | 19.2% |
| $10,000 to $14,999 | 0 | 0.0% |
| $15,000 to $24,999 | 2 | 7.7% |
| $25,000 to $34,999 | 11 | 42.3% |
| $35,000 to $49,999 | 0 | 0.0% |
| $50,000 to $74,999 | 7 | 26.9% |
| $75,000 to $99,999 | 0 | 0.0% |
| $100,000 to $149,999 | 1 | 3.8% |
| $150,000 to $199,999 | 0 | 0.0% |
| $200,000+ | 0 | 0.0% |
Household Income by Householder Age in Fairview
The median household income in Fairview is $26,364, with the highest median household income of $25,909 found in the 45 to 64 years age bracket for the primary householder. A total of 16 households (61.5%) fall into this category. Meanwhile, the 15 to 24 years age bracket for the primary householder has the lowest median household income of $0, with 3 households (11.5%) in this group.
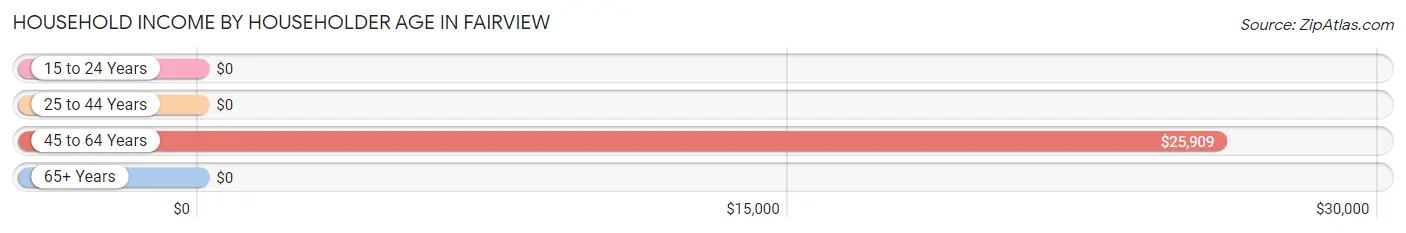
| Income Bracket | # Households | Median Income |
| 15 to 24 Years | 3 (11.5%) | $0 |
| 25 to 44 Years | 3 (11.5%) | $0 |
| 45 to 64 Years | 16 (61.5%) | $25,909 |
| 65+ Years | 4 (15.4%) | $0 |
| Total | 26 (100.0%) | $26,364 |
Poverty in Fairview
Income Below Poverty by Sex and Age in Fairview
With 22.7% poverty level for males and 45.0% for females among the residents of Fairview, 75 year old and over males and 16 and 17 year old females are the most vulnerable to poverty, with 3 males (100.0%) and 3 females (100.0%) in their respective age groups living below the poverty level.
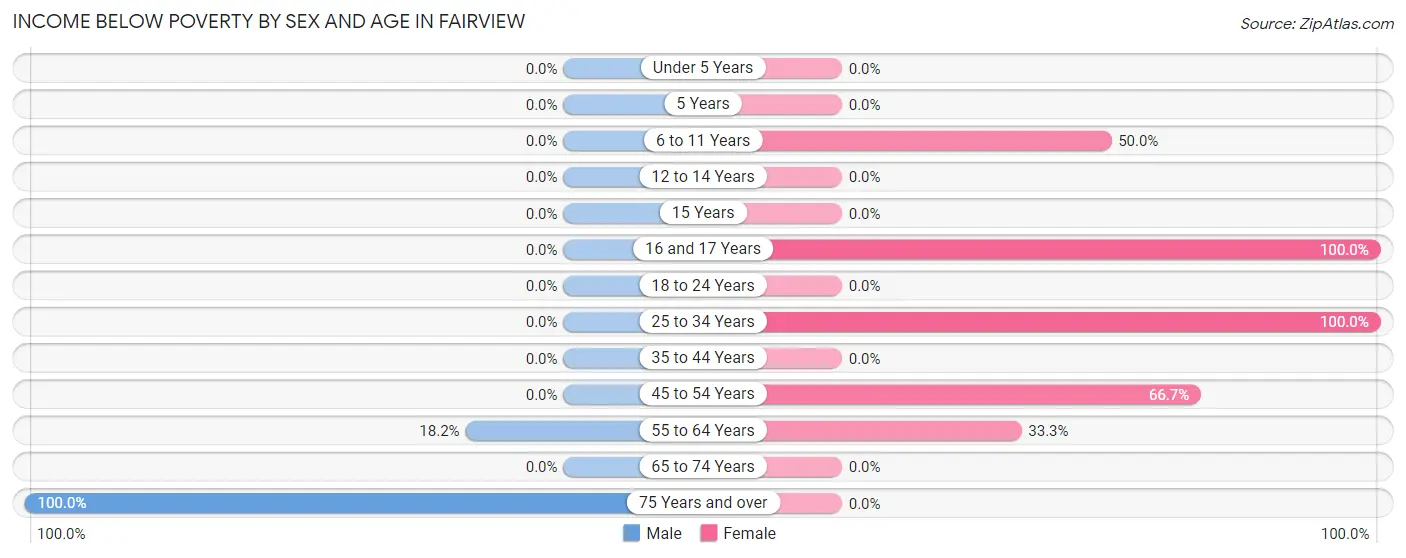
| Age Bracket | Male | Female |
| Under 5 Years | 0 (0.0%) | 0 (0.0%) |
| 5 Years | 0 (0.0%) | 0 (0.0%) |
| 6 to 11 Years | 0 (0.0%) | 1 (50.0%) |
| 12 to 14 Years | 0 (0.0%) | 0 (0.0%) |
| 15 Years | 0 (0.0%) | 0 (0.0%) |
| 16 and 17 Years | 0 (0.0%) | 3 (100.0%) |
| 18 to 24 Years | 0 (0.0%) | 0 (0.0%) |
| 25 to 34 Years | 0 (0.0%) | 2 (100.0%) |
| 35 to 44 Years | 0 (0.0%) | 0 (0.0%) |
| 45 to 54 Years | 0 (0.0%) | 2 (66.7%) |
| 55 to 64 Years | 2 (18.2%) | 1 (33.3%) |
| 65 to 74 Years | 0 (0.0%) | 0 (0.0%) |
| 75 Years and over | 3 (100.0%) | 0 (0.0%) |
| Total | 5 (22.7%) | 9 (45.0%) |
Income Above Poverty by Sex and Age in Fairview
According to the poverty statistics in Fairview, males aged 16 and 17 years and females aged 35 to 44 years are the age groups that are most secure financially, with 100.0% of males and 100.0% of females in these age groups living above the poverty line.
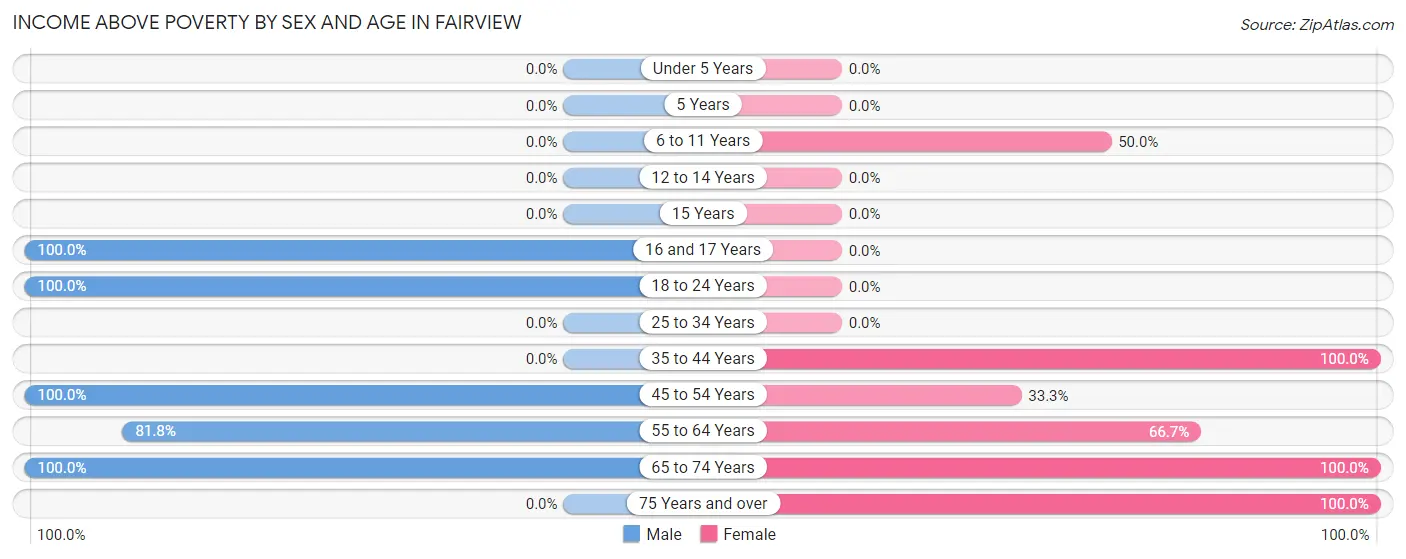
| Age Bracket | Male | Female |
| Under 5 Years | 0 (0.0%) | 0 (0.0%) |
| 5 Years | 0 (0.0%) | 0 (0.0%) |
| 6 to 11 Years | 0 (0.0%) | 1 (50.0%) |
| 12 to 14 Years | 0 (0.0%) | 0 (0.0%) |
| 15 Years | 0 (0.0%) | 0 (0.0%) |
| 16 and 17 Years | 1 (100.0%) | 0 (0.0%) |
| 18 to 24 Years | 1 (100.0%) | 0 (0.0%) |
| 25 to 34 Years | 0 (0.0%) | 0 (0.0%) |
| 35 to 44 Years | 0 (0.0%) | 3 (100.0%) |
| 45 to 54 Years | 1 (100.0%) | 1 (33.3%) |
| 55 to 64 Years | 9 (81.8%) | 2 (66.7%) |
| 65 to 74 Years | 5 (100.0%) | 1 (100.0%) |
| 75 Years and over | 0 (0.0%) | 3 (100.0%) |
| Total | 17 (77.3%) | 11 (55.0%) |
Income Below Poverty Among Married-Couple Families in Fairview
The poverty statistics for married-couple families in Fairview show that 22.2% or 2 of the total 9 families live below the poverty line. Families with no children have the highest poverty rate of 25.0%, comprising of 2 families. On the other hand, families with 1 or 2 children have the lowest poverty rate of 0.0%, which includes 0 families.
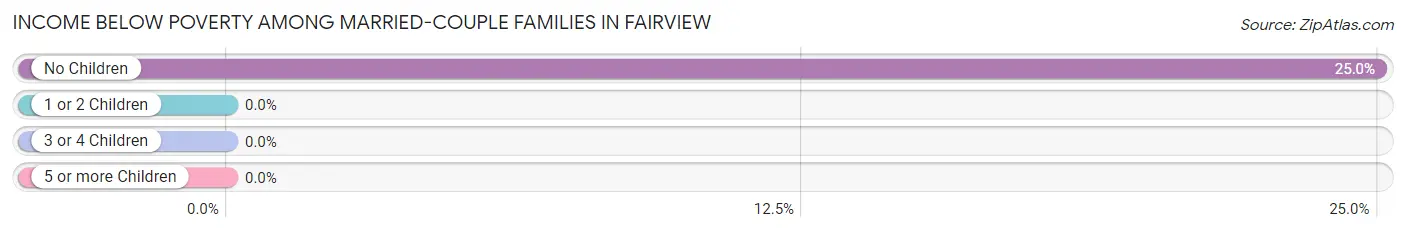
| Children | Above Poverty | Below Poverty |
| No Children | 6 (75.0%) | 2 (25.0%) |
| 1 or 2 Children | 1 (100.0%) | 0 (0.0%) |
| 3 or 4 Children | 0 (0.0%) | 0 (0.0%) |
| 5 or more Children | 0 (0.0%) | 0 (0.0%) |
| Total | 7 (77.8%) | 2 (22.2%) |
Income Below Poverty Among Single-Parent Households in Fairview
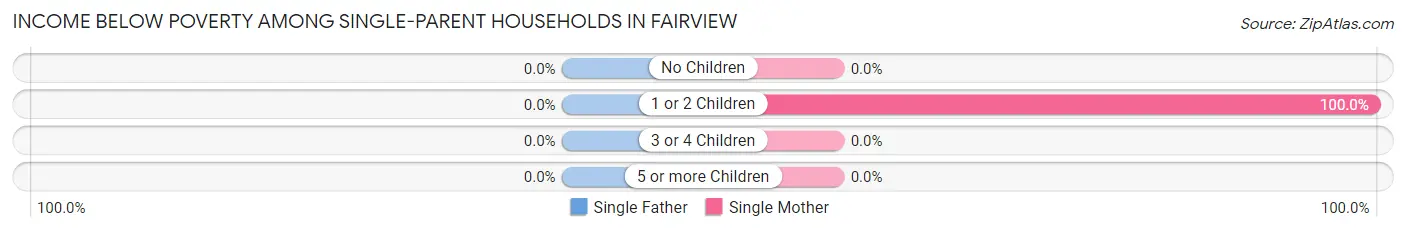
| Children | Single Father | Single Mother |
| No Children | 0 (0.0%) | 0 (0.0%) |
| 1 or 2 Children | 0 (0.0%) | 2 (100.0%) |
| 3 or 4 Children | 0 (0.0%) | 0 (0.0%) |
| 5 or more Children | 0 (0.0%) | 0 (0.0%) |
| Total | 0 (0.0%) | 2 (100.0%) |
Income Below Poverty Among Married-Couple vs Single-Parent Households in Fairview
The poverty data for Fairview shows that 2 of the married-couple family households (22.2%) and 2 of the single-parent households (100.0%) are living below the poverty level. Within the married-couple family households, those with no children have the highest poverty rate, with 2 households (25.0%) falling below the poverty line. Among the single-parent households, those with 1 or 2 children have the highest poverty rate, with 2 household (100.0%) living below poverty.
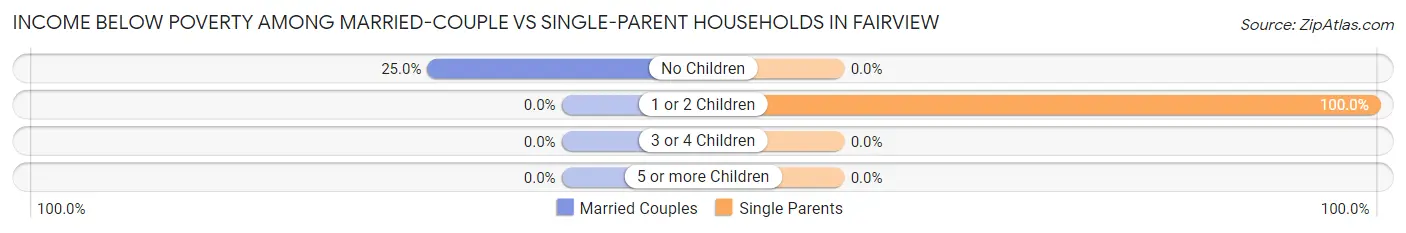
| Children | Married-Couple Families | Single-Parent Households |
| No Children | 2 (25.0%) | 0 (0.0%) |
| 1 or 2 Children | 0 (0.0%) | 2 (100.0%) |
| 3 or 4 Children | 0 (0.0%) | 0 (0.0%) |
| 5 or more Children | 0 (0.0%) | 0 (0.0%) |
| Total | 2 (22.2%) | 2 (100.0%) |
Race in Fairview
The most populous races in Fairview are , and White / Caucasian (44 | 100.0%).
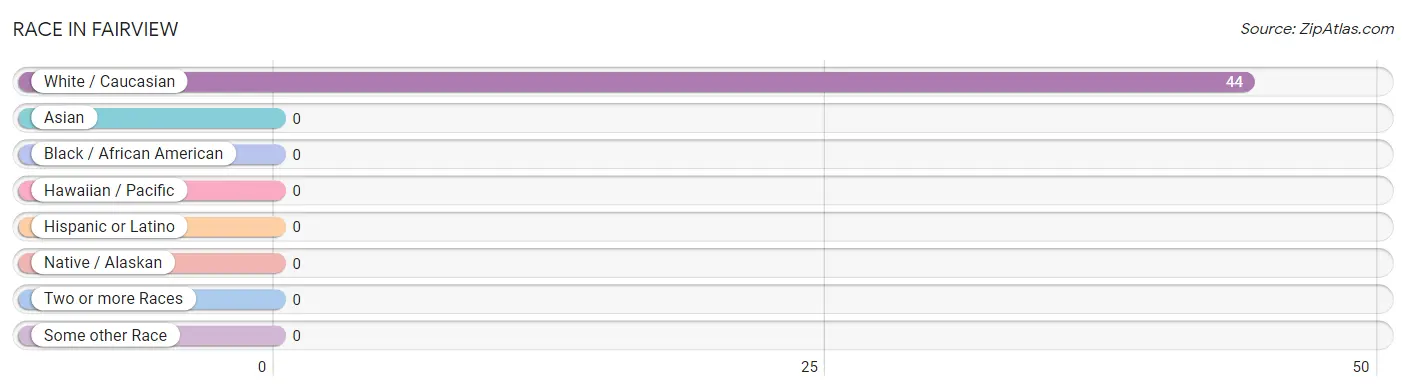
| Race | # Population | % Population |
| Asian | 0 | 0.0% |
| Black / African American | 0 | 0.0% |
| Hawaiian / Pacific | 0 | 0.0% |
| Hispanic or Latino | 0 | 0.0% |
| Native / Alaskan | 0 | 0.0% |
| White / Caucasian | 44 | 100.0% |
| Two or more Races | 0 | 0.0% |
| Some other Race | 0 | 0.0% |
| Total | 44 | 100.0% |
Ancestry in Fairview
The most populous ancestries reported in Fairview are Dutch (9 | 20.4%), Scotch-Irish (9 | 20.4%), German (8 | 18.2%), Arab (3 | 6.8%), and French (3 | 6.8%), together accounting for 72.7% of all Fairview residents.
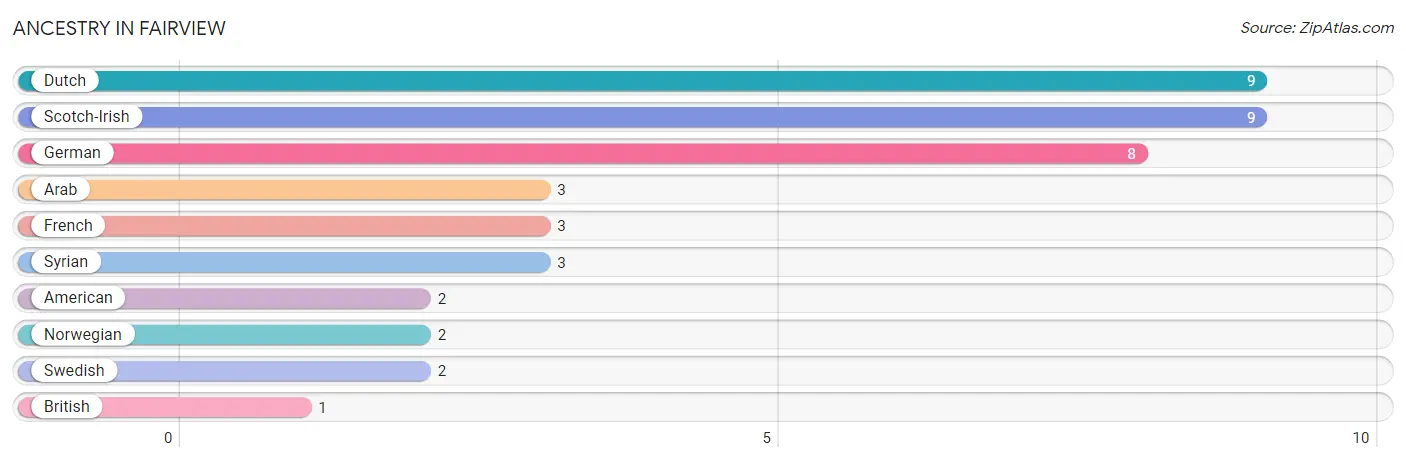
| Ancestry | # Population | % Population |
| American | 2 | 4.5% |
| Arab | 3 | 6.8% |
| British | 1 | 2.3% |
| Dutch | 9 | 20.4% |
| French | 3 | 6.8% |
| German | 8 | 18.2% |
| Norwegian | 2 | 4.5% |
| Scotch-Irish | 9 | 20.4% |
| Swedish | 2 | 4.5% |
| Syrian | 3 | 6.8% | View All 10 Rows |
Immigrants in Fairview

| Immigration Origin | # Population | % Population | View All 0 Rows |
Sex and Age in Fairview
Sex and Age in Fairview
The most populous age groups in Fairview are 60 to 64 Years (9 | 37.5%) for men and 15 to 19 Years (3 | 15.0%) for women.
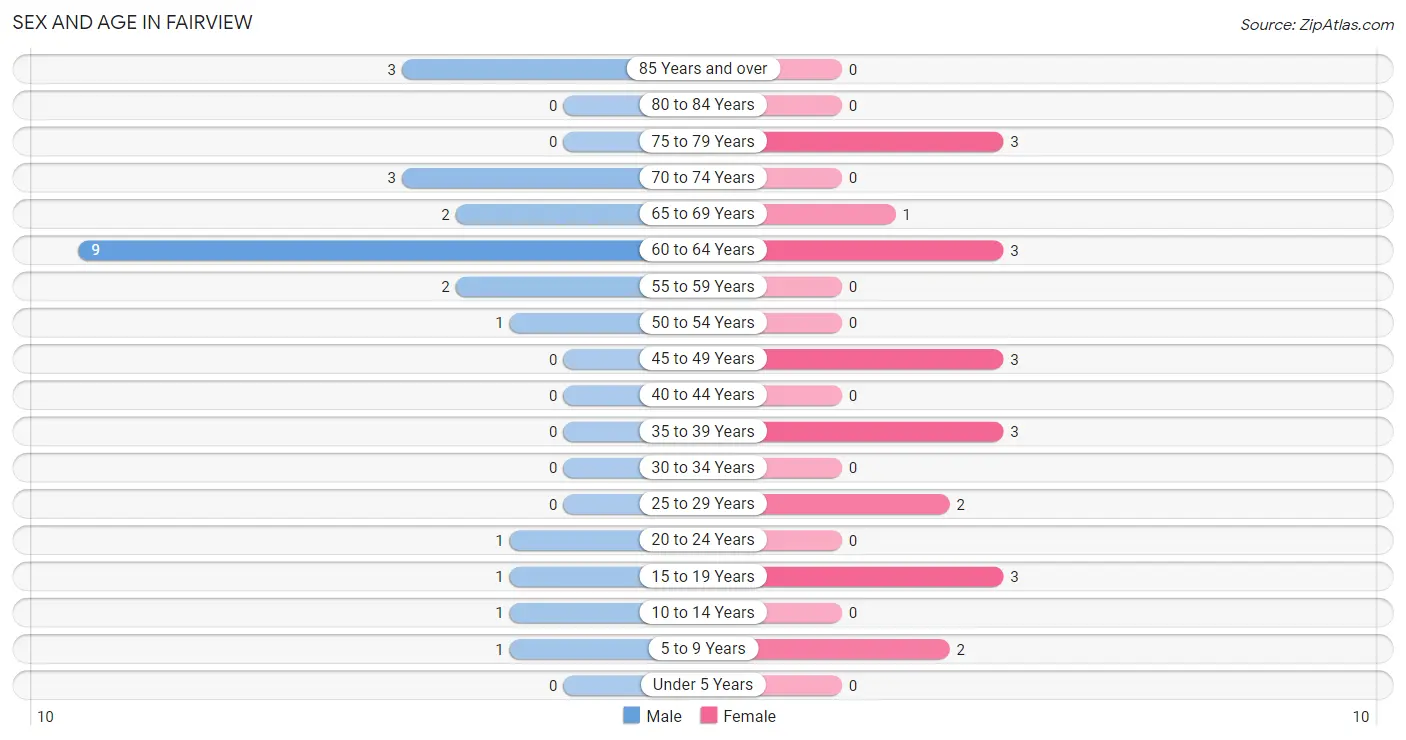
| Age Bracket | Male | Female |
| Under 5 Years | 0 (0.0%) | 0 (0.0%) |
| 5 to 9 Years | 1 (4.2%) | 2 (10.0%) |
| 10 to 14 Years | 1 (4.2%) | 0 (0.0%) |
| 15 to 19 Years | 1 (4.2%) | 3 (15.0%) |
| 20 to 24 Years | 1 (4.2%) | 0 (0.0%) |
| 25 to 29 Years | 0 (0.0%) | 2 (10.0%) |
| 30 to 34 Years | 0 (0.0%) | 0 (0.0%) |
| 35 to 39 Years | 0 (0.0%) | 3 (15.0%) |
| 40 to 44 Years | 0 (0.0%) | 0 (0.0%) |
| 45 to 49 Years | 0 (0.0%) | 3 (15.0%) |
| 50 to 54 Years | 1 (4.2%) | 0 (0.0%) |
| 55 to 59 Years | 2 (8.3%) | 0 (0.0%) |
| 60 to 64 Years | 9 (37.5%) | 3 (15.0%) |
| 65 to 69 Years | 2 (8.3%) | 1 (5.0%) |
| 70 to 74 Years | 3 (12.5%) | 0 (0.0%) |
| 75 to 79 Years | 0 (0.0%) | 3 (15.0%) |
| 80 to 84 Years | 0 (0.0%) | 0 (0.0%) |
| 85 Years and over | 3 (12.5%) | 0 (0.0%) |
| Total | 24 (100.0%) | 20 (100.0%) |
Families and Households in Fairview
Median Family Size in Fairview
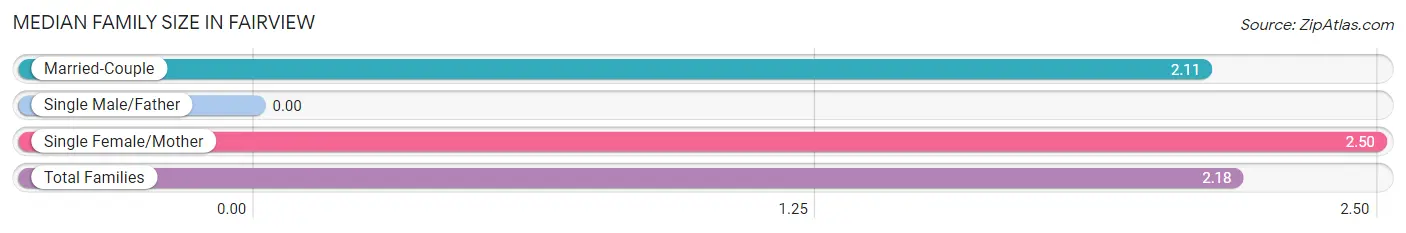
| Family Type | # Families | Family Size |
| Married-Couple | 9 (81.8%) | 2.11 |
| Single Male/Father | 0 (0.0%) | - |
| Single Female/Mother | 2 (18.2%) | 2.50 |
| Total Families | 11 (100.0%) | 2.18 |
Median Household Size in Fairview
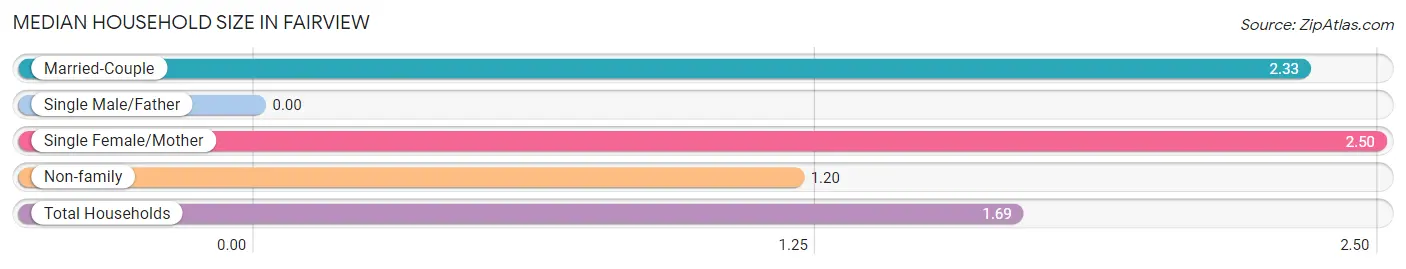
| Household Type | # Households | Household Size |
| Married-Couple | 9 (34.6%) | 2.33 |
| Single Male/Father | 0 (0.0%) | - |
| Single Female/Mother | 2 (7.7%) | 2.50 |
| Non-family | 15 (57.7%) | 1.20 |
| Total Households | 26 (100.0%) | 1.69 |
Household Size by Marriage Status in Fairview
Out of a total of 26 households in Fairview, 11 (42.3%) are family households, while 15 (57.7%) are nonfamily households. The most numerous type of family households are 2-person households, comprising 8, and the most common type of nonfamily households are 1-person households, comprising 12.
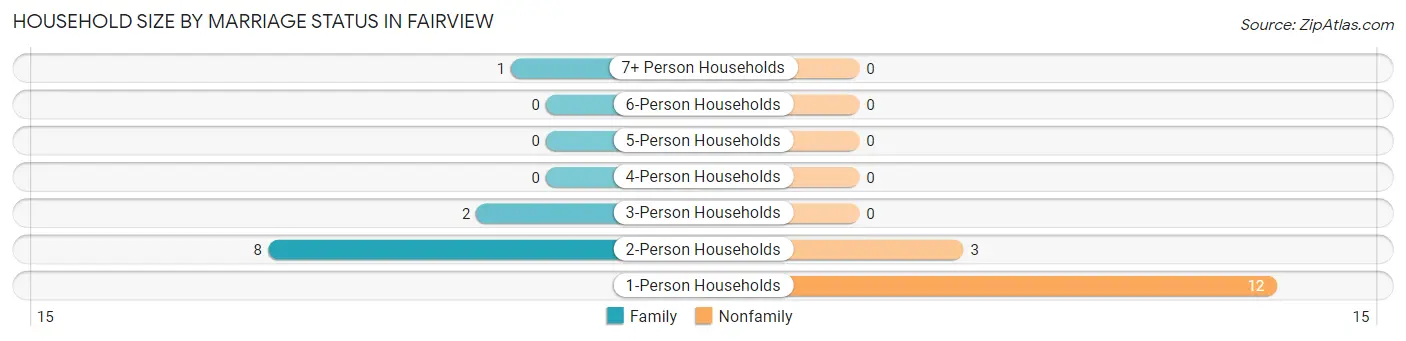
| Household Size | Family Households | Nonfamily Households |
| 1-Person Households | - | 12 (46.2%) |
| 2-Person Households | 8 (30.8%) | 3 (11.5%) |
| 3-Person Households | 2 (7.7%) | 0 (0.0%) |
| 4-Person Households | 0 (0.0%) | 0 (0.0%) |
| 5-Person Households | 0 (0.0%) | 0 (0.0%) |
| 6-Person Households | 0 (0.0%) | 0 (0.0%) |
| 7+ Person Households | 1 (3.8%) | 0 (0.0%) |
| Total | 11 (42.3%) | 15 (57.7%) |
Female Fertility in Fairview
Fertility by Age in Fairview
| Age Bracket | Women with Births | Births / 1,000 Women |
| 15 to 19 years | 0 (0.0%) | 0.0 |
| 20 to 34 years | 0 (0.0%) | 0.0 |
| 35 to 50 years | 0 (0.0%) | 0.0 |
| Total | 0 (0.0%) | 0.0 |
Fertility by Age by Marriage Status in Fairview
| Age Bracket | Married | Unmarried |
| 15 to 19 years | 0 (0.0%) | 0 (0.0%) |
| 20 to 34 years | 0 (0.0%) | 0 (0.0%) |
| 35 to 50 years | 0 (0.0%) | 0 (0.0%) |
| Total | 0 (0.0%) | 0 (0.0%) |
Fertility by Education in Fairview
| Educational Attainment | Women with Births | Births / 1,000 Women |
| Less than High School | 0 (0.0%) | 0.0 |
| High School Diploma | 0 (0.0%) | 0.0 |
| College or Associate's Degree | 0 (0.0%) | 0.0 |
| Bachelor's Degree | 0 (0.0%) | 0.0 |
| Graduate Degree | 0 (0.0%) | 0.0 |
| Total | 0 (0.0%) | 0.0 |
Fertility by Education by Marriage Status in Fairview
| Educational Attainment | Married | Unmarried |
| Less than High School | 0 (0.0%) | 0 (0.0%) |
| High School Diploma | 0 (0.0%) | 0 (0.0%) |
| College or Associate's Degree | 0 (0.0%) | 0 (0.0%) |
| Bachelor's Degree | 0 (0.0%) | 0 (0.0%) |
| Graduate Degree | 0 (0.0%) | 0 (0.0%) |
| Total | 0 (0.0%) | 0 (0.0%) |
Employment Characteristics in Fairview
Employment by Class of Employer in Fairview
Among the 9 employed individuals in Fairview, private company employees (4 | 44.4%), state government employees (3 | 33.3%), and not-for-profit organizations (2 | 22.2%) make up the most common classes of employment.
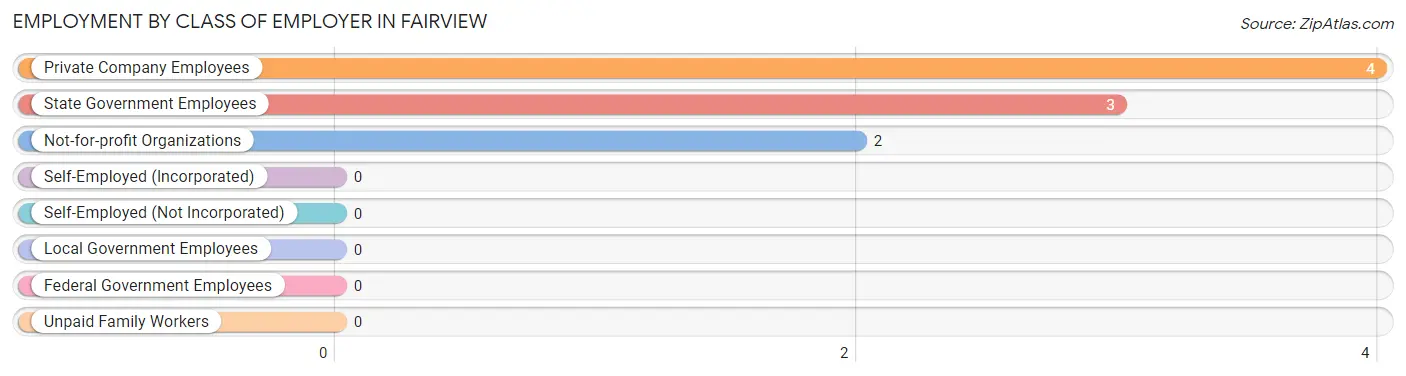
| Employer Class | # Employees | % Employees |
| Private Company Employees | 4 | 44.4% |
| Self-Employed (Incorporated) | 0 | 0.0% |
| Self-Employed (Not Incorporated) | 0 | 0.0% |
| Not-for-profit Organizations | 2 | 22.2% |
| Local Government Employees | 0 | 0.0% |
| State Government Employees | 3 | 33.3% |
| Federal Government Employees | 0 | 0.0% |
| Unpaid Family Workers | 0 | 0.0% |
| Total | 9 | 100.0% |
Employment Status by Age in Fairview
According to the labor force statistics for Fairview, out of the total population over 16 years of age (40), 32.5% or 13 individuals are in the labor force, with 30.8% or 4 of them unemployed. The age group with the highest labor force participation rate is 20 to 24 years, with 100.0% or 1 individuals in the labor force. Within the labor force, the 16 to 19 years age range has the highest percentage of unemployed individuals, with 100.0% or 3 of them being unemployed.
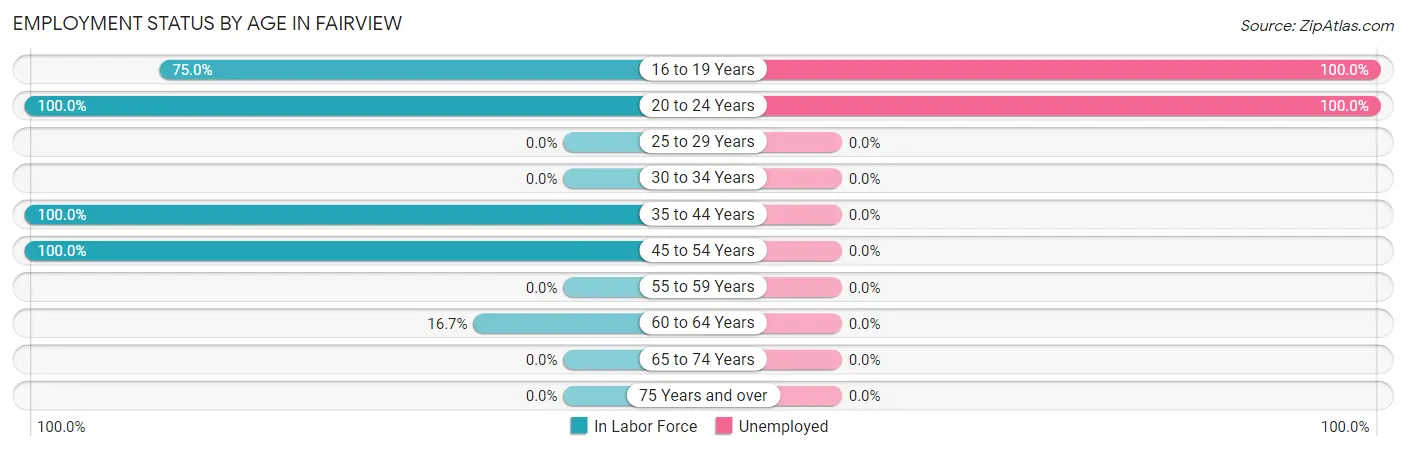
| Age Bracket | In Labor Force | Unemployed |
| 16 to 19 Years | 3 (75.0%) | 3 (100.0%) |
| 20 to 24 Years | 1 (100.0%) | 1 (100.0%) |
| 25 to 29 Years | 0 (0.0%) | 0 (0.0%) |
| 30 to 34 Years | 0 (0.0%) | 0 (0.0%) |
| 35 to 44 Years | 3 (100.0%) | 0 (0.0%) |
| 45 to 54 Years | 4 (100.0%) | 0 (0.0%) |
| 55 to 59 Years | 0 (0.0%) | 0 (0.0%) |
| 60 to 64 Years | 2 (16.7%) | 0 (0.0%) |
| 65 to 74 Years | 0 (0.0%) | 0 (0.0%) |
| 75 Years and over | 0 (0.0%) | 0 (0.0%) |
| Total | 13 (32.5%) | 4 (30.8%) |
Employment Status by Educational Attainment in Fairview
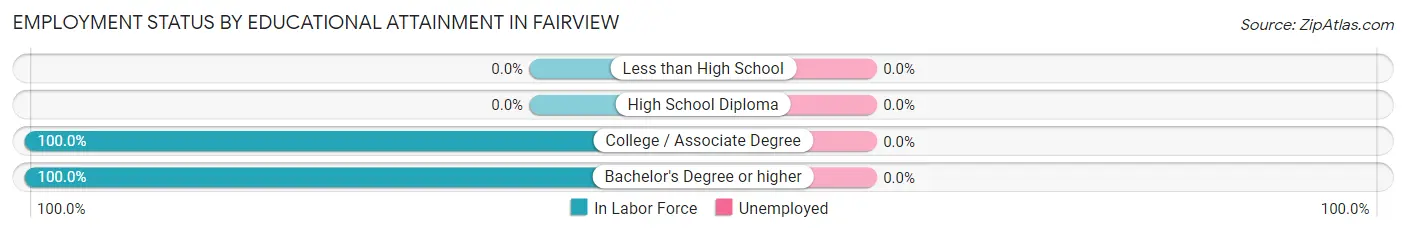
| Educational Attainment | In Labor Force | Unemployed |
| Less than High School | 0 (0.0%) | 0 (0.0%) |
| High School Diploma | 0 (0.0%) | 0 (0.0%) |
| College / Associate Degree | 7 (100.0%) | 0 (0.0%) |
| Bachelor's Degree or higher | 2 (100.0%) | 0 (0.0%) |
| Total | 9 (39.1%) | 0 (0.0%) |
Employment Occupations by Sex in Fairview
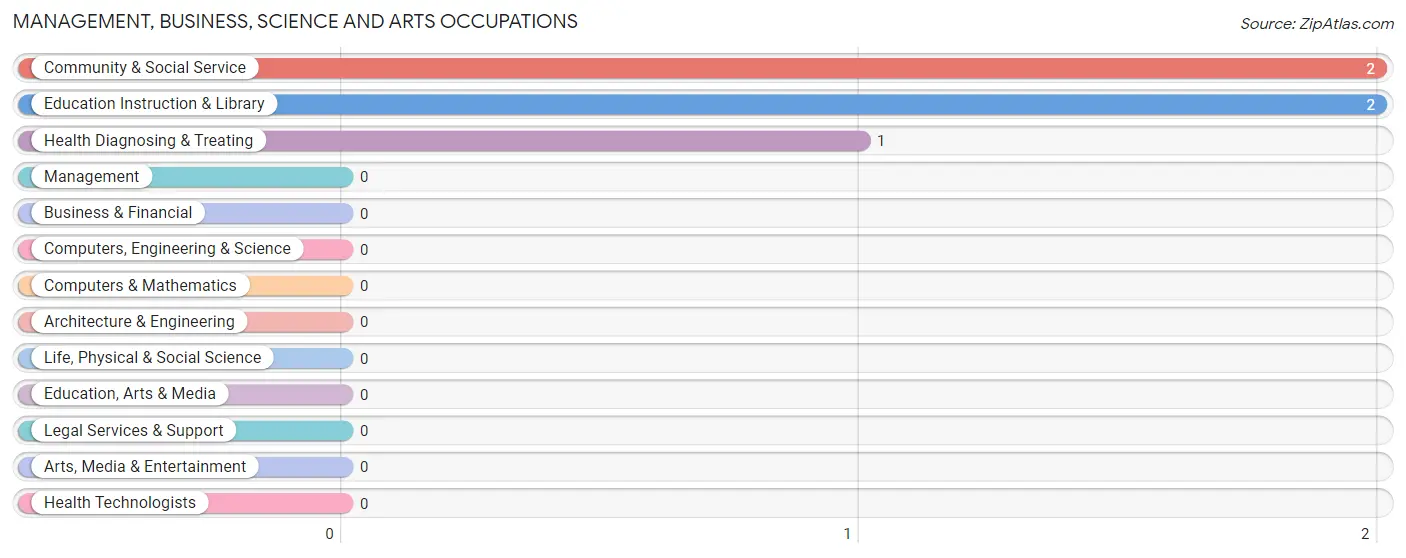
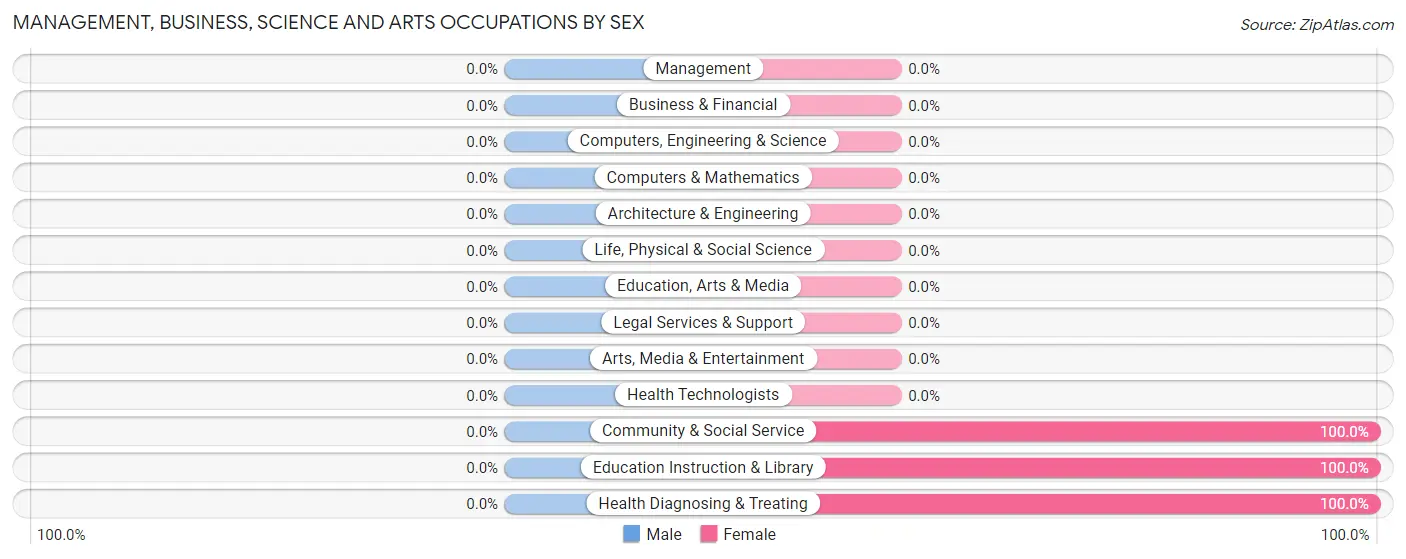
Management, Business, Science and Arts Occupations
The most common Management, Business, Science and Arts occupations in Fairview are Community & Social Service (2 | 22.2%), Education Instruction & Library (2 | 22.2%), and Health Diagnosing & Treating (1 | 11.1%).
Management, Business, Science and Arts Occupations by Sex
| Occupation | Male | Female |
| Management | 0 (0.0%) | 0 (0.0%) |
| Business & Financial | 0 (0.0%) | 0 (0.0%) |
| Computers, Engineering & Science | 0 (0.0%) | 0 (0.0%) |
| Computers & Mathematics | 0 (0.0%) | 0 (0.0%) |
| Architecture & Engineering | 0 (0.0%) | 0 (0.0%) |
| Life, Physical & Social Science | 0 (0.0%) | 0 (0.0%) |
| Community & Social Service | 0 (0.0%) | 2 (100.0%) |
| Education, Arts & Media | 0 (0.0%) | 0 (0.0%) |
| Legal Services & Support | 0 (0.0%) | 0 (0.0%) |
| Education Instruction & Library | 0 (0.0%) | 2 (100.0%) |
| Arts, Media & Entertainment | 0 (0.0%) | 0 (0.0%) |
| Health Diagnosing & Treating | 0 (0.0%) | 1 (100.0%) |
| Health Technologists | 0 (0.0%) | 0 (0.0%) |
| Total (Category) | 0 (0.0%) | 3 (100.0%) |
| Total (Overall) | 1 (11.1%) | 8 (88.9%) |
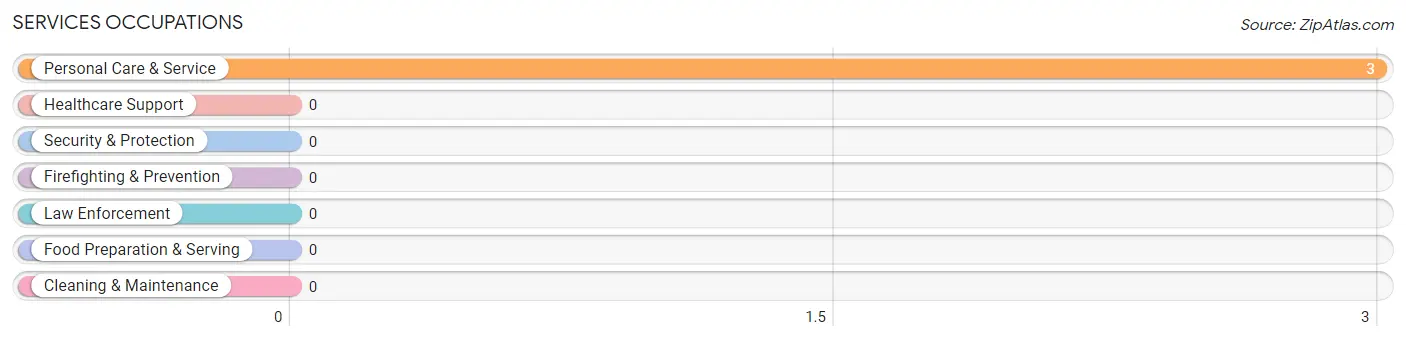
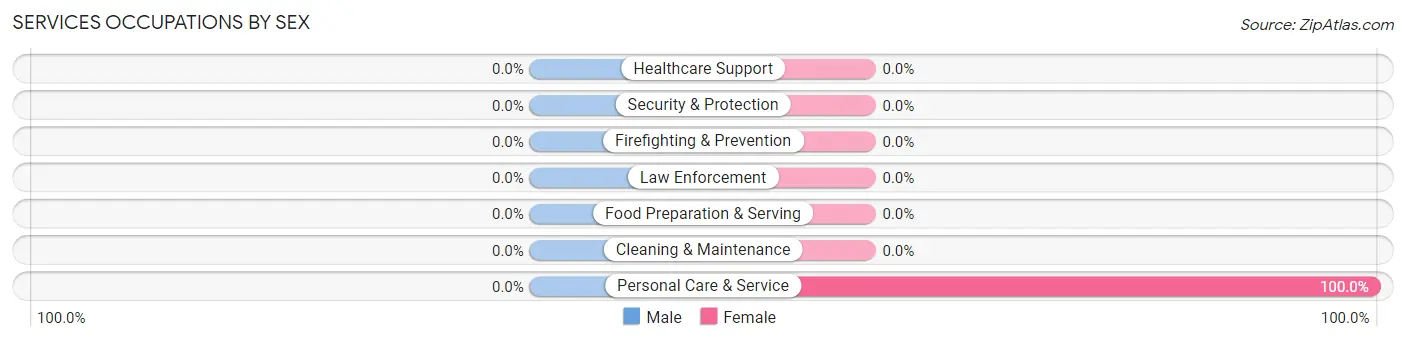
Services Occupations
The most common Services occupations in Fairview are , and Personal Care & Service (3 | 33.3%).
Services Occupations by Sex
| Occupation | Male | Female |
| Healthcare Support | 0 (0.0%) | 0 (0.0%) |
| Security & Protection | 0 (0.0%) | 0 (0.0%) |
| Firefighting & Prevention | 0 (0.0%) | 0 (0.0%) |
| Law Enforcement | 0 (0.0%) | 0 (0.0%) |
| Food Preparation & Serving | 0 (0.0%) | 0 (0.0%) |
| Cleaning & Maintenance | 0 (0.0%) | 0 (0.0%) |
| Personal Care & Service | 0 (0.0%) | 3 (100.0%) |
| Total (Category) | 0 (0.0%) | 3 (100.0%) |
| Total (Overall) | 1 (11.1%) | 8 (88.9%) |
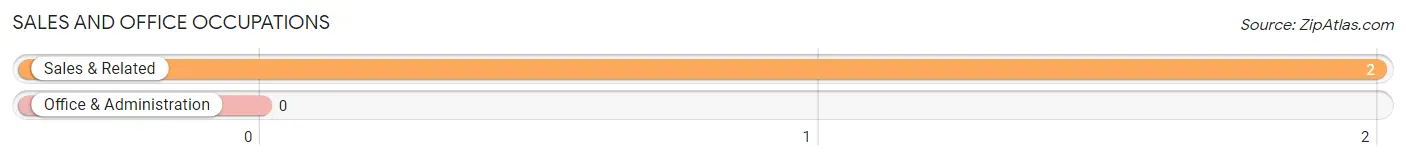
Sales and Office Occupations
The most common Sales and Office occupations in Fairview are , and Sales & Related (2 | 22.2%).
Sales and Office Occupations by Sex

| Occupation | Male | Female |
| Sales & Related | 0 (0.0%) | 2 (100.0%) |
| Office & Administration | 0 (0.0%) | 0 (0.0%) |
| Total (Category) | 0 (0.0%) | 2 (100.0%) |
| Total (Overall) | 1 (11.1%) | 8 (88.9%) |
Natural Resources, Construction and Maintenance Occupations
Natural Resources, Construction and Maintenance Occupations by Sex
| Occupation | Male | Female |
| Farming, Fishing & Forestry | 0 (0.0%) | 0 (0.0%) |
| Construction & Extraction | 0 (0.0%) | 0 (0.0%) |
| Installation, Maintenance & Repair | 0 (0.0%) | 0 (0.0%) |
| Total (Category) | 0 (0.0%) | 0 (0.0%) |
| Total (Overall) | 1 (11.1%) | 8 (88.9%) |
Production, Transportation and Moving Occupations
The most common Production, Transportation and Moving occupations in Fairview are , and Transportation (1 | 11.1%).
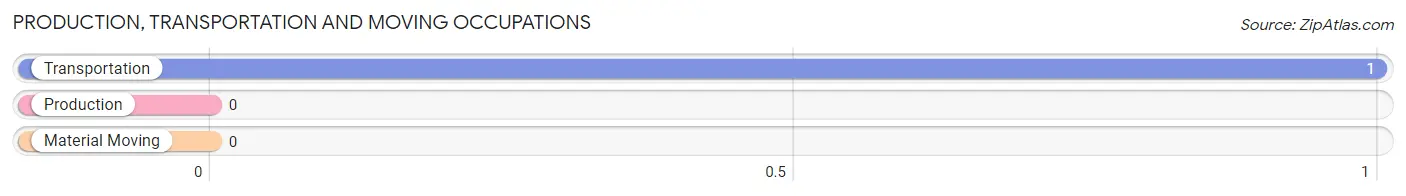
Production, Transportation and Moving Occupations by Sex
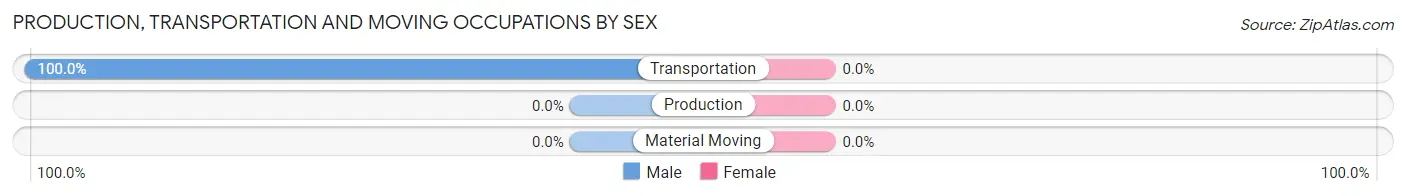
| Occupation | Male | Female |
| Production | 0 (0.0%) | 0 (0.0%) |
| Transportation | 1 (100.0%) | 0 (0.0%) |
| Material Moving | 0 (0.0%) | 0 (0.0%) |
| Total (Category) | 1 (100.0%) | 0 (0.0%) |
| Total (Overall) | 1 (11.1%) | 8 (88.9%) |
Employment Industries by Sex in Fairview
Employment Industries in Fairview
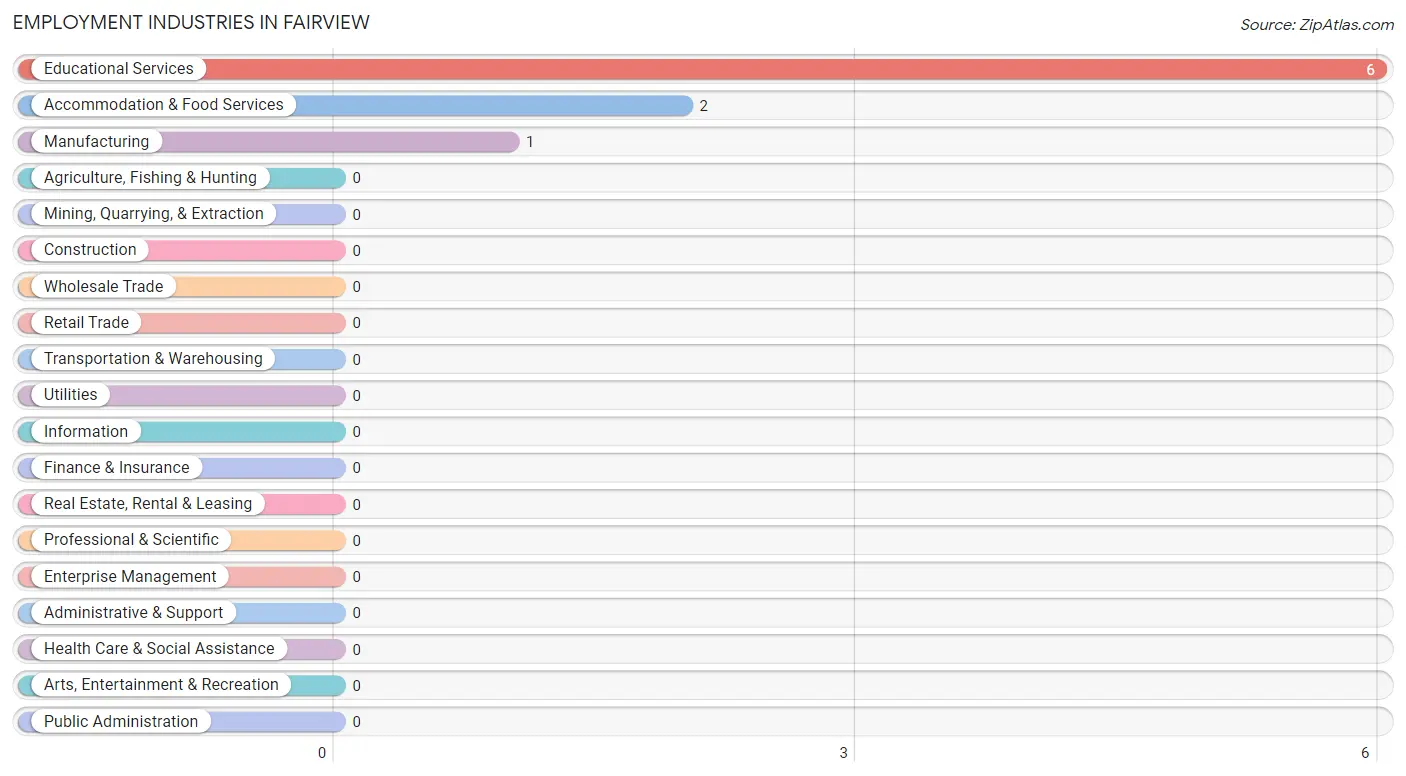
The major employment industries in Fairview include Educational Services (6 | 66.7%), Accommodation & Food Services (2 | 22.2%), and Manufacturing (1 | 11.1%).
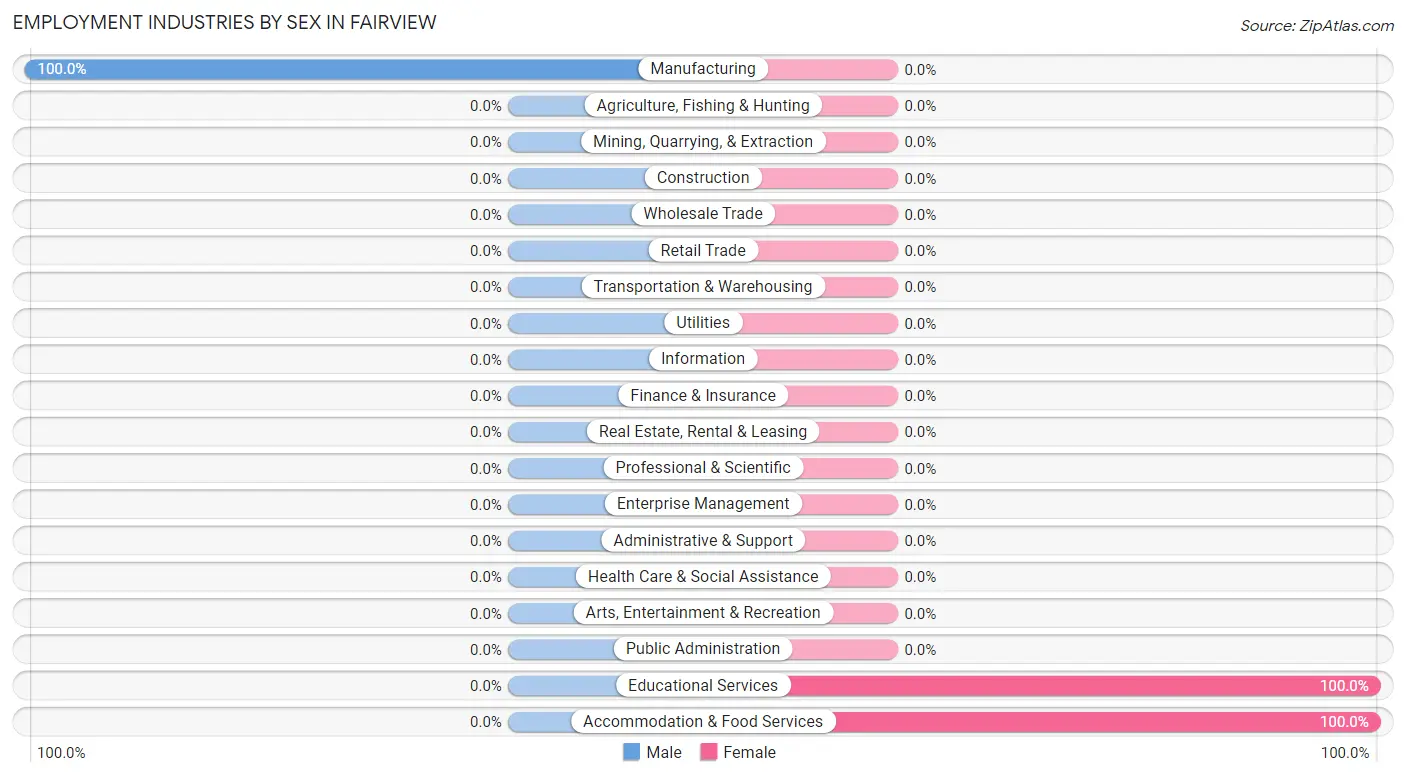
Employment Industries by Sex in Fairview
| Industry | Male | Female |
| Agriculture, Fishing & Hunting | 0 (0.0%) | 0 (0.0%) |
| Mining, Quarrying, & Extraction | 0 (0.0%) | 0 (0.0%) |
| Construction | 0 (0.0%) | 0 (0.0%) |
| Manufacturing | 1 (100.0%) | 0 (0.0%) |
| Wholesale Trade | 0 (0.0%) | 0 (0.0%) |
| Retail Trade | 0 (0.0%) | 0 (0.0%) |
| Transportation & Warehousing | 0 (0.0%) | 0 (0.0%) |
| Utilities | 0 (0.0%) | 0 (0.0%) |
| Information | 0 (0.0%) | 0 (0.0%) |
| Finance & Insurance | 0 (0.0%) | 0 (0.0%) |
| Real Estate, Rental & Leasing | 0 (0.0%) | 0 (0.0%) |
| Professional & Scientific | 0 (0.0%) | 0 (0.0%) |
| Enterprise Management | 0 (0.0%) | 0 (0.0%) |
| Administrative & Support | 0 (0.0%) | 0 (0.0%) |
| Educational Services | 0 (0.0%) | 6 (100.0%) |
| Health Care & Social Assistance | 0 (0.0%) | 0 (0.0%) |
| Arts, Entertainment & Recreation | 0 (0.0%) | 0 (0.0%) |
| Accommodation & Food Services | 0 (0.0%) | 2 (100.0%) |
| Public Administration | 0 (0.0%) | 0 (0.0%) |
| Total | 1 (11.1%) | 8 (88.9%) |
Education in Fairview
School Enrollment in Fairview
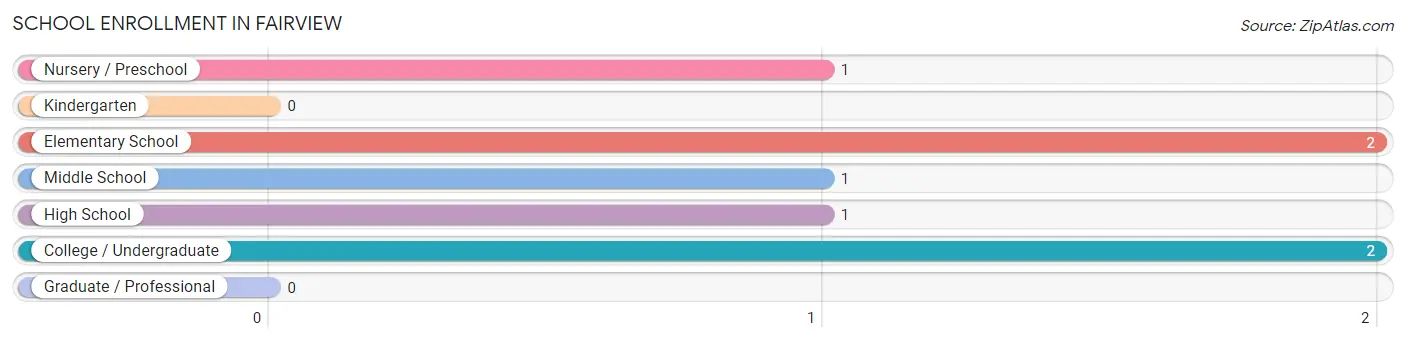
The most common levels of schooling among the 7 students in Fairview are elementary school (2 | 28.6%), college / undergraduate (2 | 28.6%), and nursery / preschool (1 | 14.3%).
| School Level | # Students | % Students |
| Nursery / Preschool | 1 | 14.3% |
| Kindergarten | 0 | 0.0% |
| Elementary School | 2 | 28.6% |
| Middle School | 1 | 14.3% |
| High School | 1 | 14.3% |
| College / Undergraduate | 2 | 28.6% |
| Graduate / Professional | 0 | 0.0% |
| Total | 7 | 100.0% |
School Enrollment by Age by Funding Source in Fairview
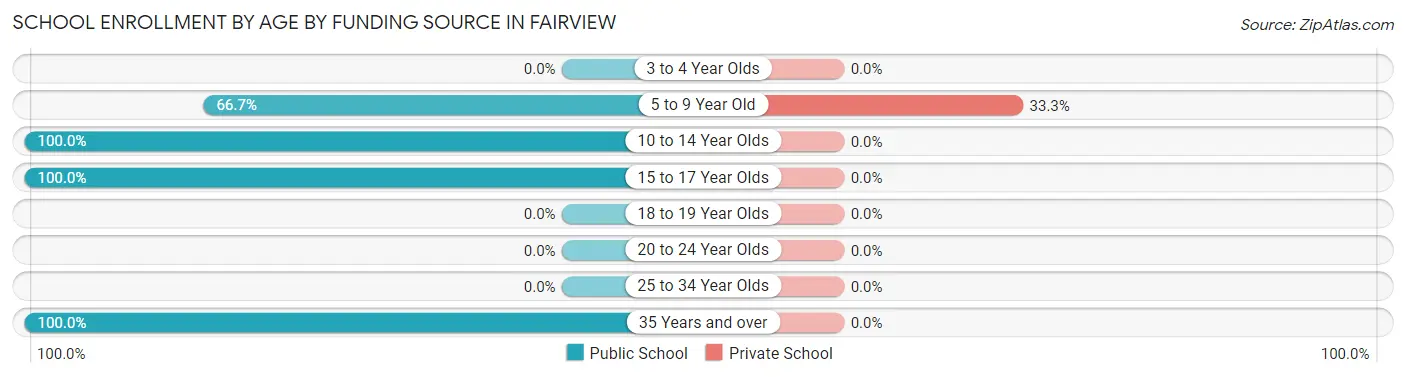
Out of a total of 7 students who are enrolled in schools in Fairview, 1 (14.3%) attend a private institution, while the remaining 6 (85.7%) are enrolled in public schools. The age group of 5 to 9 year old has the highest likelihood of being enrolled in private schools, with 1 (33.3% in the age bracket) enrolled. Conversely, the age group of 10 to 14 year olds has the lowest likelihood of being enrolled in a private school, with 1 (100.0% in the age bracket) attending a public institution.
| Age Bracket | Public School | Private School |
| 3 to 4 Year Olds | 0 (0.0%) | 0 (0.0%) |
| 5 to 9 Year Old | 2 (66.7%) | 1 (33.3%) |
| 10 to 14 Year Olds | 1 (100.0%) | 0 (0.0%) |
| 15 to 17 Year Olds | 1 (100.0%) | 0 (0.0%) |
| 18 to 19 Year Olds | 0 (0.0%) | 0 (0.0%) |
| 20 to 24 Year Olds | 0 (0.0%) | 0 (0.0%) |
| 25 to 34 Year Olds | 0 (0.0%) | 0 (0.0%) |
| 35 Years and over | 2 (100.0%) | 0 (0.0%) |
| Total | 6 (85.7%) | 1 (14.3%) |
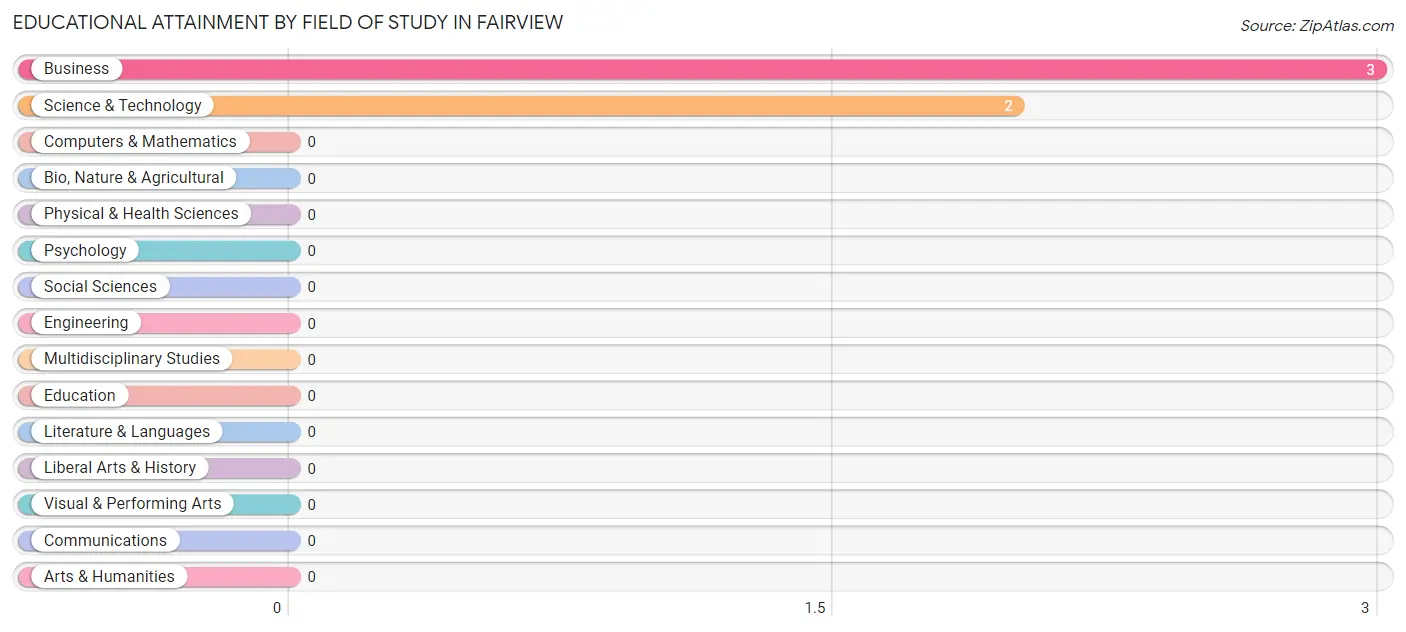
Educational Attainment by Field of Study in Fairview
Business (3 | 60.0%), and science & technology (2 | 40.0%) are the most common fields of study among 5 individuals in Fairview who have obtained a bachelor's degree or higher.
| Field of Study | # Graduates | % Graduates |
| Computers & Mathematics | 0 | 0.0% |
| Bio, Nature & Agricultural | 0 | 0.0% |
| Physical & Health Sciences | 0 | 0.0% |
| Psychology | 0 | 0.0% |
| Social Sciences | 0 | 0.0% |
| Engineering | 0 | 0.0% |
| Multidisciplinary Studies | 0 | 0.0% |
| Science & Technology | 2 | 40.0% |
| Business | 3 | 60.0% |
| Education | 0 | 0.0% |
| Literature & Languages | 0 | 0.0% |
| Liberal Arts & History | 0 | 0.0% |
| Visual & Performing Arts | 0 | 0.0% |
| Communications | 0 | 0.0% |
| Arts & Humanities | 0 | 0.0% |
| Total | 5 | 100.0% |
Transportation & Commute in Fairview
Vehicle Availability by Sex in Fairview
The most prevalent vehicle ownership categories in Fairview are males with 5 or more vehicles (1, accounting for 100.0%) and females with 5 or more vehicles (1, making up 12.5%).
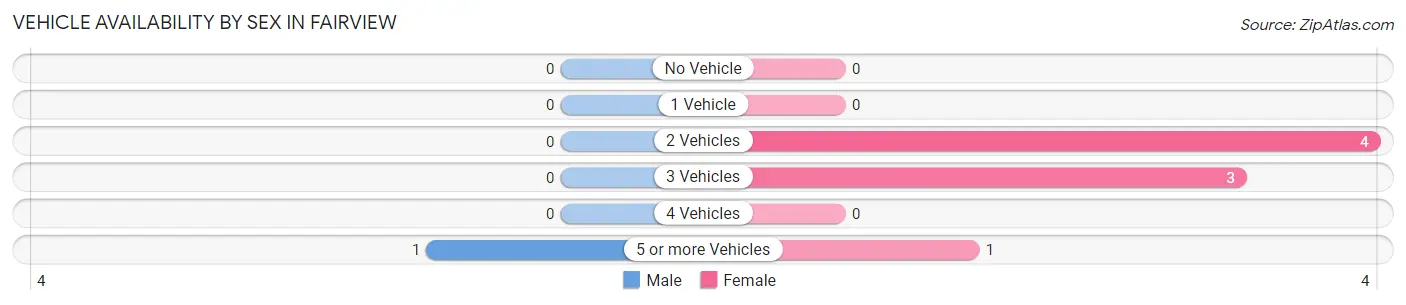
| Vehicles Available | Male | Female |
| No Vehicle | 0 (0.0%) | 0 (0.0%) |
| 1 Vehicle | 0 (0.0%) | 0 (0.0%) |
| 2 Vehicles | 0 (0.0%) | 4 (50.0%) |
| 3 Vehicles | 0 (0.0%) | 3 (37.5%) |
| 4 Vehicles | 0 (0.0%) | 0 (0.0%) |
| 5 or more Vehicles | 1 (100.0%) | 1 (12.5%) |
| Total | 1 (100.0%) | 8 (100.0%) |
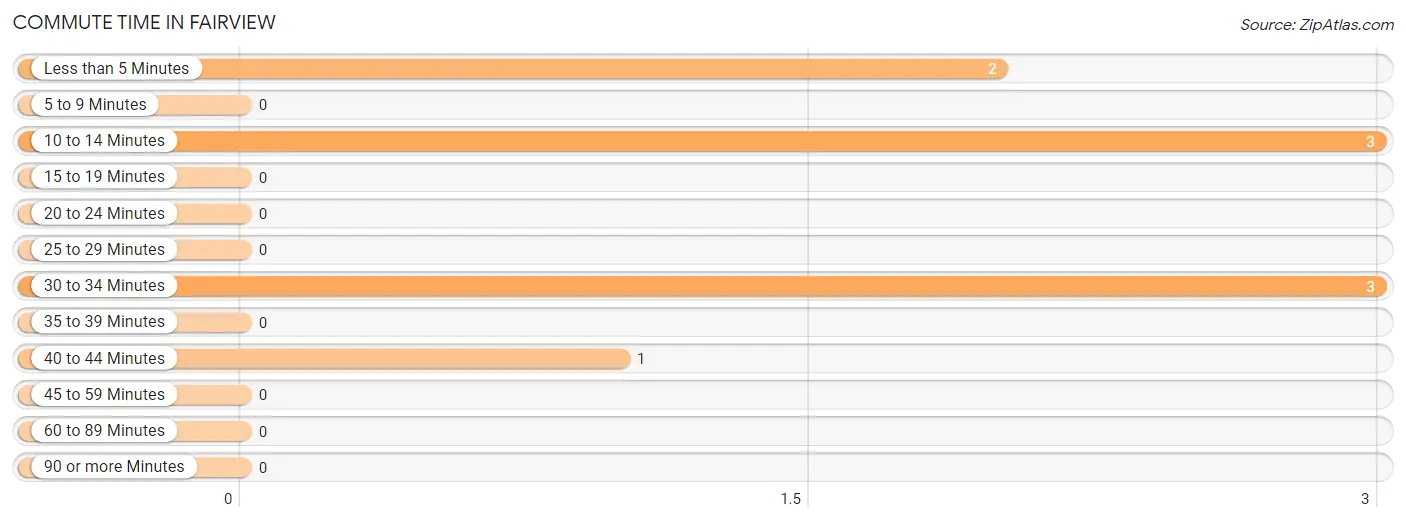
Commute Time in Fairview
The most frequently occuring commute durations in Fairview are 10 to 14 minutes (3 commuters, 33.3%), 30 to 34 minutes (3 commuters, 33.3%), and less than 5 minutes (2 commuters, 22.2%).
| Commute Time | # Commuters | % Commuters |
| Less than 5 Minutes | 2 | 22.2% |
| 5 to 9 Minutes | 0 | 0.0% |
| 10 to 14 Minutes | 3 | 33.3% |
| 15 to 19 Minutes | 0 | 0.0% |
| 20 to 24 Minutes | 0 | 0.0% |
| 25 to 29 Minutes | 0 | 0.0% |
| 30 to 34 Minutes | 3 | 33.3% |
| 35 to 39 Minutes | 0 | 0.0% |
| 40 to 44 Minutes | 1 | 11.1% |
| 45 to 59 Minutes | 0 | 0.0% |
| 60 to 89 Minutes | 0 | 0.0% |
| 90 or more Minutes | 0 | 0.0% |
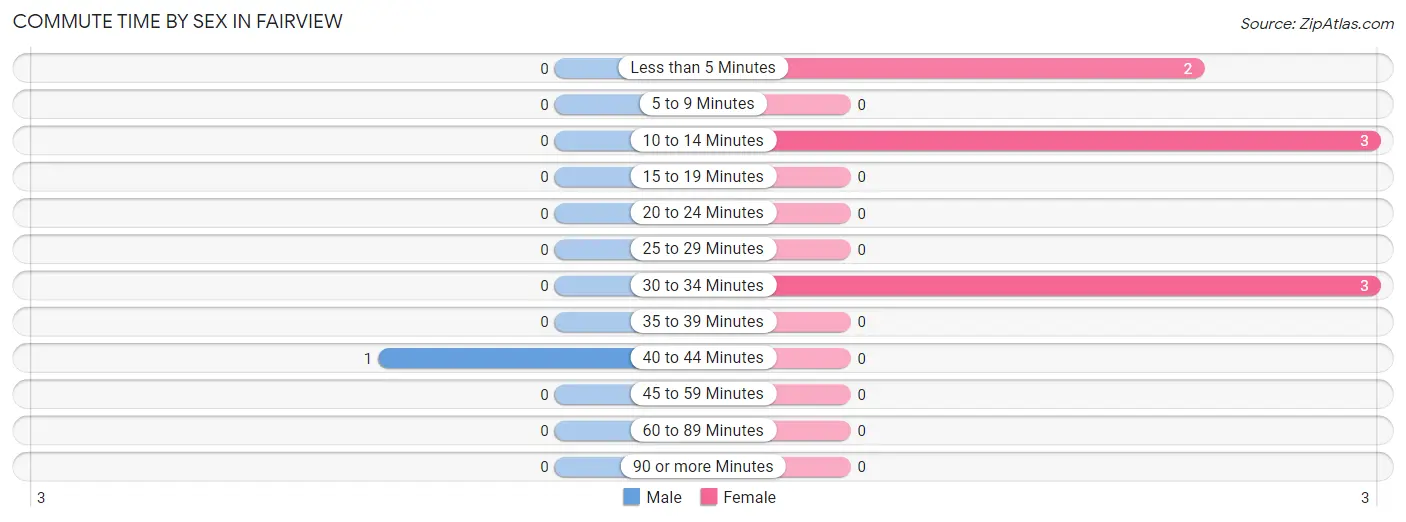
Commute Time by Sex in Fairview
The most common commute times in Fairview are 40 to 44 minutes (1 commuters, 100.0%) for males and 10 to 14 minutes (3 commuters, 37.5%) for females.
| Commute Time | Male | Female |
| Less than 5 Minutes | 0 (0.0%) | 2 (25.0%) |
| 5 to 9 Minutes | 0 (0.0%) | 0 (0.0%) |
| 10 to 14 Minutes | 0 (0.0%) | 3 (37.5%) |
| 15 to 19 Minutes | 0 (0.0%) | 0 (0.0%) |
| 20 to 24 Minutes | 0 (0.0%) | 0 (0.0%) |
| 25 to 29 Minutes | 0 (0.0%) | 0 (0.0%) |
| 30 to 34 Minutes | 0 (0.0%) | 3 (37.5%) |
| 35 to 39 Minutes | 0 (0.0%) | 0 (0.0%) |
| 40 to 44 Minutes | 1 (100.0%) | 0 (0.0%) |
| 45 to 59 Minutes | 0 (0.0%) | 0 (0.0%) |
| 60 to 89 Minutes | 0 (0.0%) | 0 (0.0%) |
| 90 or more Minutes | 0 (0.0%) | 0 (0.0%) |
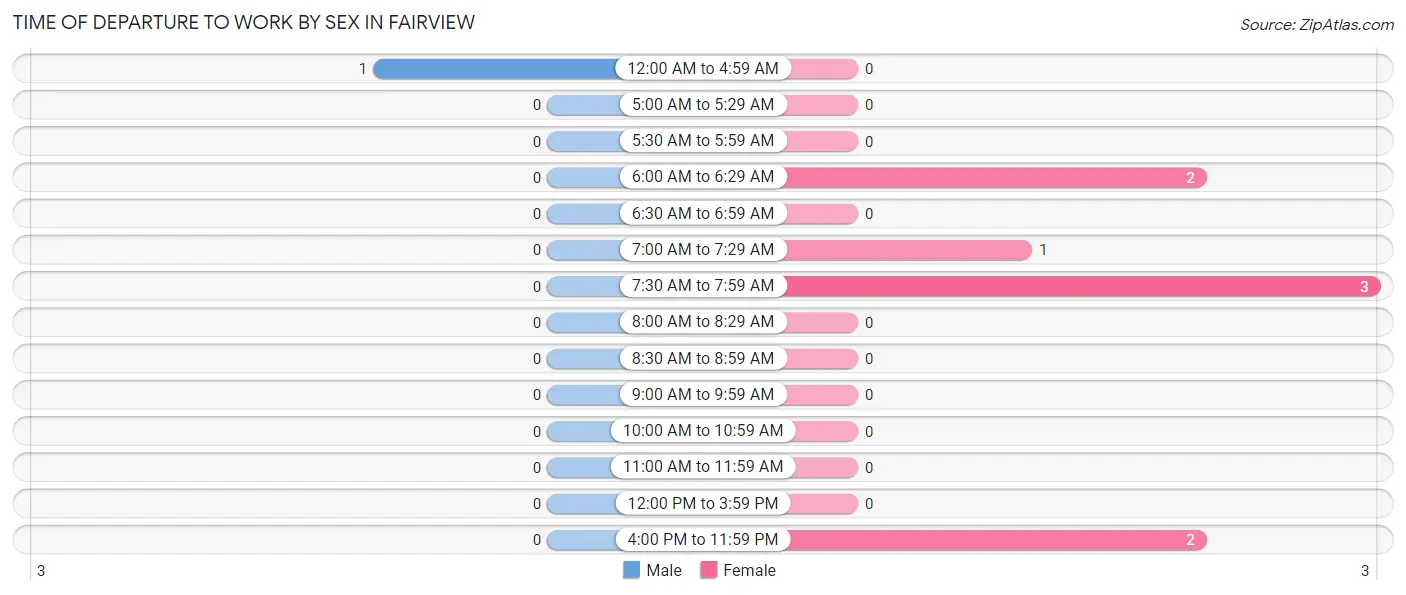
Time of Departure to Work by Sex in Fairview
The most frequent times of departure to work in Fairview are 12:00 AM to 4:59 AM (1, 100.0%) for males and 7:30 AM to 7:59 AM (3, 37.5%) for females.
| Time of Departure | Male | Female |
| 12:00 AM to 4:59 AM | 1 (100.0%) | 0 (0.0%) |
| 5:00 AM to 5:29 AM | 0 (0.0%) | 0 (0.0%) |
| 5:30 AM to 5:59 AM | 0 (0.0%) | 0 (0.0%) |
| 6:00 AM to 6:29 AM | 0 (0.0%) | 2 (25.0%) |
| 6:30 AM to 6:59 AM | 0 (0.0%) | 0 (0.0%) |
| 7:00 AM to 7:29 AM | 0 (0.0%) | 1 (12.5%) |
| 7:30 AM to 7:59 AM | 0 (0.0%) | 3 (37.5%) |
| 8:00 AM to 8:29 AM | 0 (0.0%) | 0 (0.0%) |
| 8:30 AM to 8:59 AM | 0 (0.0%) | 0 (0.0%) |
| 9:00 AM to 9:59 AM | 0 (0.0%) | 0 (0.0%) |
| 10:00 AM to 10:59 AM | 0 (0.0%) | 0 (0.0%) |
| 11:00 AM to 11:59 AM | 0 (0.0%) | 0 (0.0%) |
| 12:00 PM to 3:59 PM | 0 (0.0%) | 0 (0.0%) |
| 4:00 PM to 11:59 PM | 0 (0.0%) | 2 (25.0%) |
| Total | 1 (100.0%) | 8 (100.0%) |
Housing Occupancy in Fairview
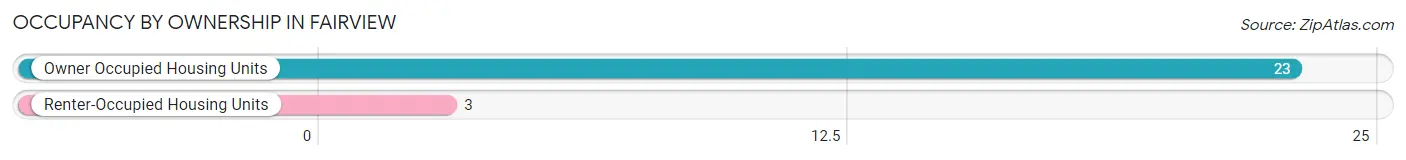
Occupancy by Ownership in Fairview
Of the total 26 dwellings in Fairview, owner-occupied units account for 23 (88.5%), while renter-occupied units make up 3 (11.5%).
| Occupancy | # Housing Units | % Housing Units |
| Owner Occupied Housing Units | 23 | 88.5% |
| Renter-Occupied Housing Units | 3 | 11.5% |
| Total Occupied Housing Units | 26 | 100.0% |
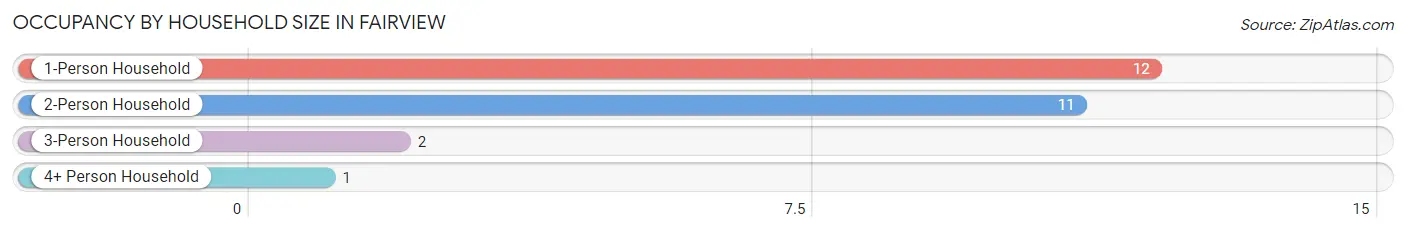
Occupancy by Household Size in Fairview
| Household Size | # Housing Units | % Housing Units |
| 1-Person Household | 12 | 46.2% |
| 2-Person Household | 11 | 42.3% |
| 3-Person Household | 2 | 7.7% |
| 4+ Person Household | 1 | 3.8% |
| Total Housing Units | 26 | 100.0% |
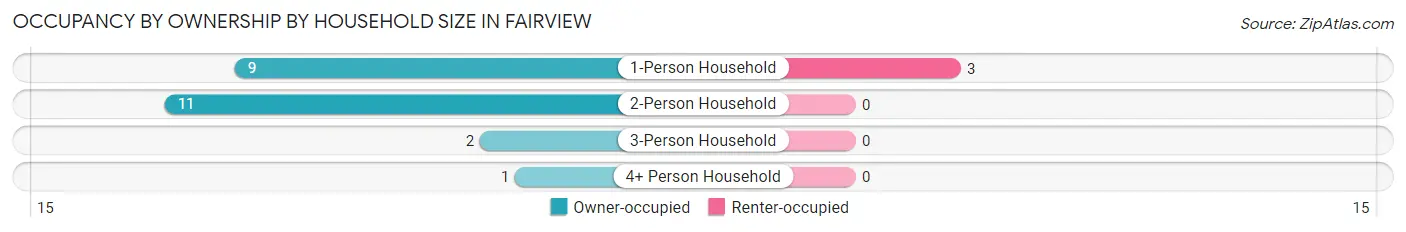
Occupancy by Ownership by Household Size in Fairview
| Household Size | Owner-occupied | Renter-occupied |
| 1-Person Household | 9 (75.0%) | 3 (25.0%) |
| 2-Person Household | 11 (100.0%) | 0 (0.0%) |
| 3-Person Household | 2 (100.0%) | 0 (0.0%) |
| 4+ Person Household | 1 (100.0%) | 0 (0.0%) |
| Total Housing Units | 23 (88.5%) | 3 (11.5%) |
Occupancy by Educational Attainment in Fairview
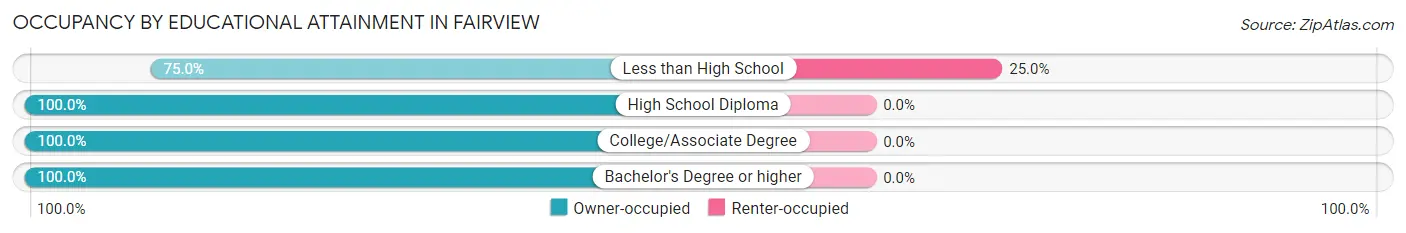
| Household Size | Owner-occupied | Renter-occupied |
| Less than High School | 9 (75.0%) | 3 (25.0%) |
| High School Diploma | 5 (100.0%) | 0 (0.0%) |
| College/Associate Degree | 7 (100.0%) | 0 (0.0%) |
| Bachelor's Degree or higher | 2 (100.0%) | 0 (0.0%) |
Occupancy by Age of Householder in Fairview
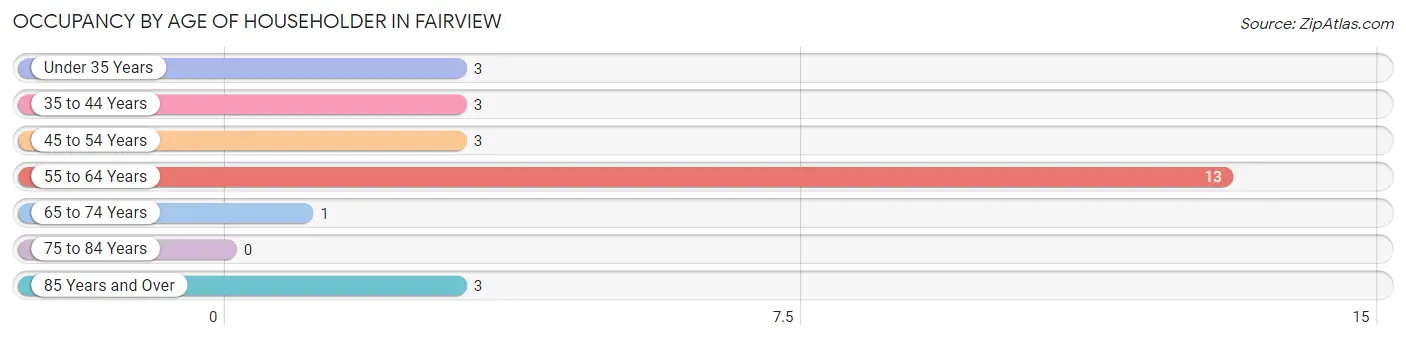
| Age Bracket | # Households | % Households |
| Under 35 Years | 3 | 11.5% |
| 35 to 44 Years | 3 | 11.5% |
| 45 to 54 Years | 3 | 11.5% |
| 55 to 64 Years | 13 | 50.0% |
| 65 to 74 Years | 1 | 3.8% |
| 75 to 84 Years | 0 | 0.0% |
| 85 Years and Over | 3 | 11.5% |
| Total | 26 | 100.0% |
Housing Finances in Fairview
Median Income by Occupancy in Fairview
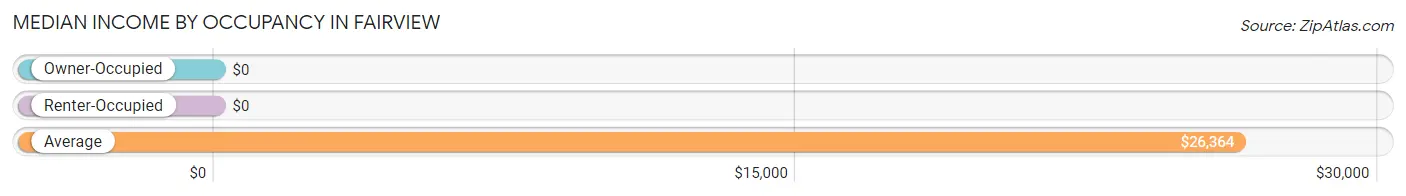
| Occupancy Type | # Households | Median Income |
| Owner-Occupied | 23 (88.5%) | $0 |
| Renter-Occupied | 3 (11.5%) | $0 |
| Average | 26 (100.0%) | $26,364 |
Occupancy by Householder Income Bracket in Fairview
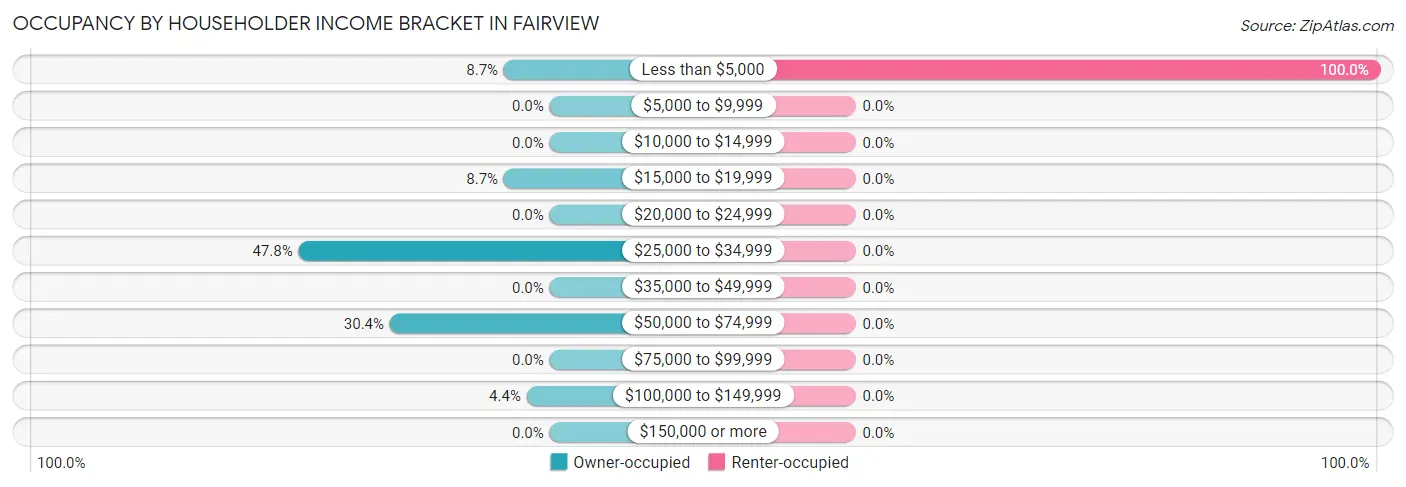
| Income Bracket | Owner-occupied | Renter-occupied |
| Less than $5,000 | 2 (8.7%) | 3 (100.0%) |
| $5,000 to $9,999 | 0 (0.0%) | 0 (0.0%) |
| $10,000 to $14,999 | 0 (0.0%) | 0 (0.0%) |
| $15,000 to $19,999 | 2 (8.7%) | 0 (0.0%) |
| $20,000 to $24,999 | 0 (0.0%) | 0 (0.0%) |
| $25,000 to $34,999 | 11 (47.8%) | 0 (0.0%) |
| $35,000 to $49,999 | 0 (0.0%) | 0 (0.0%) |
| $50,000 to $74,999 | 7 (30.4%) | 0 (0.0%) |
| $75,000 to $99,999 | 0 (0.0%) | 0 (0.0%) |
| $100,000 to $149,999 | 1 (4.3%) | 0 (0.0%) |
| $150,000 or more | 0 (0.0%) | 0 (0.0%) |
| Total | 23 (100.0%) | 3 (100.0%) |
Monthly Housing Cost Tiers in Fairview
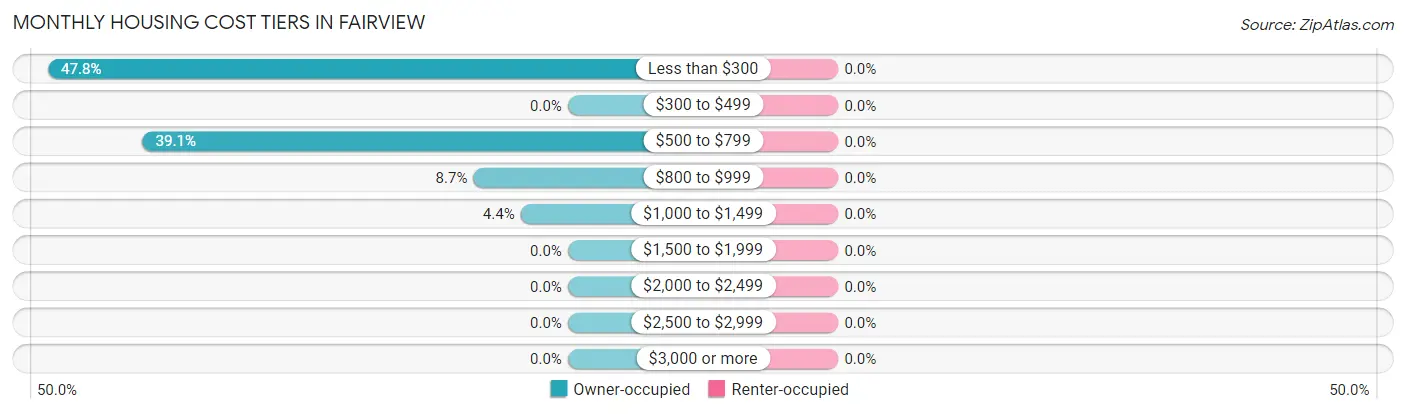
| Monthly Cost | Owner-occupied | Renter-occupied |
| Less than $300 | 11 (47.8%) | 0 (0.0%) |
| $300 to $499 | 0 (0.0%) | 0 (0.0%) |
| $500 to $799 | 9 (39.1%) | 0 (0.0%) |
| $800 to $999 | 2 (8.7%) | 0 (0.0%) |
| $1,000 to $1,499 | 1 (4.3%) | 0 (0.0%) |
| $1,500 to $1,999 | 0 (0.0%) | 0 (0.0%) |
| $2,000 to $2,499 | 0 (0.0%) | 0 (0.0%) |
| $2,500 to $2,999 | 0 (0.0%) | 0 (0.0%) |
| $3,000 or more | 0 (0.0%) | 0 (0.0%) |
| Total | 23 (100.0%) | 3 (100.0%) |
Physical Housing Characteristics in Fairview
Housing Structures in Fairview
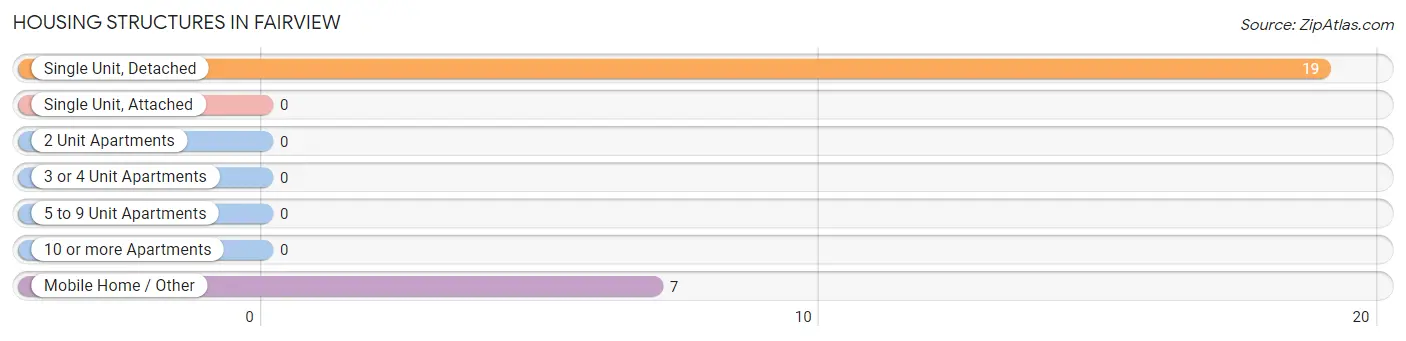
| Structure Type | # Housing Units | % Housing Units |
| Single Unit, Detached | 19 | 73.1% |
| Single Unit, Attached | 0 | 0.0% |
| 2 Unit Apartments | 0 | 0.0% |
| 3 or 4 Unit Apartments | 0 | 0.0% |
| 5 to 9 Unit Apartments | 0 | 0.0% |
| 10 or more Apartments | 0 | 0.0% |
| Mobile Home / Other | 7 | 26.9% |
| Total | 26 | 100.0% |
Housing Structures by Occupancy in Fairview
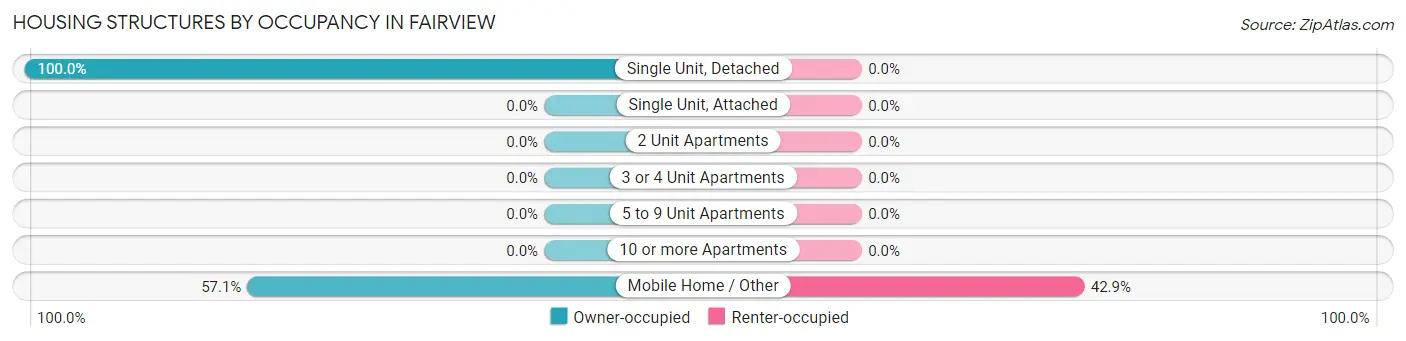
| Structure Type | Owner-occupied | Renter-occupied |
| Single Unit, Detached | 19 (100.0%) | 0 (0.0%) |
| Single Unit, Attached | 0 (0.0%) | 0 (0.0%) |
| 2 Unit Apartments | 0 (0.0%) | 0 (0.0%) |
| 3 or 4 Unit Apartments | 0 (0.0%) | 0 (0.0%) |
| 5 to 9 Unit Apartments | 0 (0.0%) | 0 (0.0%) |
| 10 or more Apartments | 0 (0.0%) | 0 (0.0%) |
| Mobile Home / Other | 4 (57.1%) | 3 (42.9%) |
| Total | 23 (88.5%) | 3 (11.5%) |
Housing Structures by Number of Rooms in Fairview
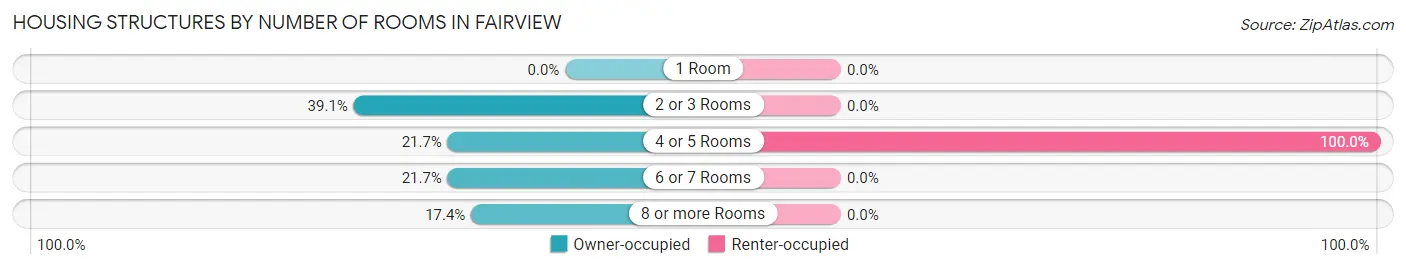
| Number of Rooms | Owner-occupied | Renter-occupied |
| 1 Room | 0 (0.0%) | 0 (0.0%) |
| 2 or 3 Rooms | 9 (39.1%) | 0 (0.0%) |
| 4 or 5 Rooms | 5 (21.7%) | 3 (100.0%) |
| 6 or 7 Rooms | 5 (21.7%) | 0 (0.0%) |
| 8 or more Rooms | 4 (17.4%) | 0 (0.0%) |
| Total | 23 (100.0%) | 3 (100.0%) |
Housing Structure by Heating Type in Fairview
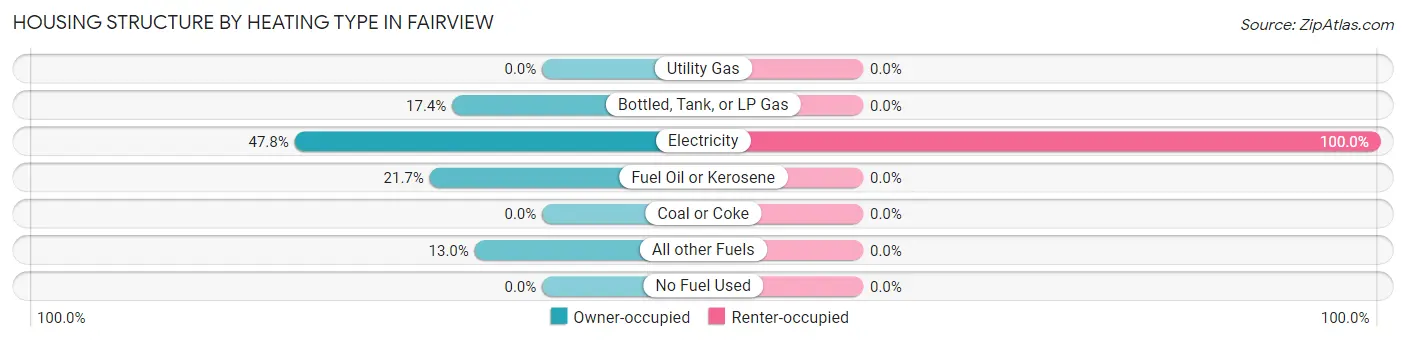
| Heating Type | Owner-occupied | Renter-occupied |
| Utility Gas | 0 (0.0%) | 0 (0.0%) |
| Bottled, Tank, or LP Gas | 4 (17.4%) | 0 (0.0%) |
| Electricity | 11 (47.8%) | 3 (100.0%) |
| Fuel Oil or Kerosene | 5 (21.7%) | 0 (0.0%) |
| Coal or Coke | 0 (0.0%) | 0 (0.0%) |
| All other Fuels | 3 (13.0%) | 0 (0.0%) |
| No Fuel Used | 0 (0.0%) | 0 (0.0%) |
| Total | 23 (100.0%) | 3 (100.0%) |
Household Vehicle Usage in Fairview
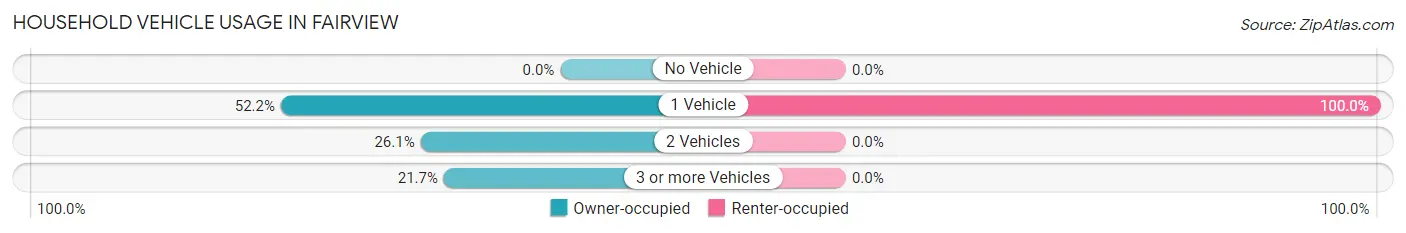
| Vehicles per Household | Owner-occupied | Renter-occupied |
| No Vehicle | 0 (0.0%) | 0 (0.0%) |
| 1 Vehicle | 12 (52.2%) | 3 (100.0%) |
| 2 Vehicles | 6 (26.1%) | 0 (0.0%) |
| 3 or more Vehicles | 5 (21.7%) | 0 (0.0%) |
| Total | 23 (100.0%) | 3 (100.0%) |
Real Estate & Mortgages in Fairview
Real Estate and Mortgage Overview in Fairview
| Characteristic | Without Mortgage | With Mortgage |
| Housing Units | 17 | 6 |
| Median Property Value | $93,900 | $0 |
| Median Household Income | - | - |
| Monthly Housing Costs | - | - |
| Real Estate Taxes | - | - |
Property Value by Mortgage Status in Fairview
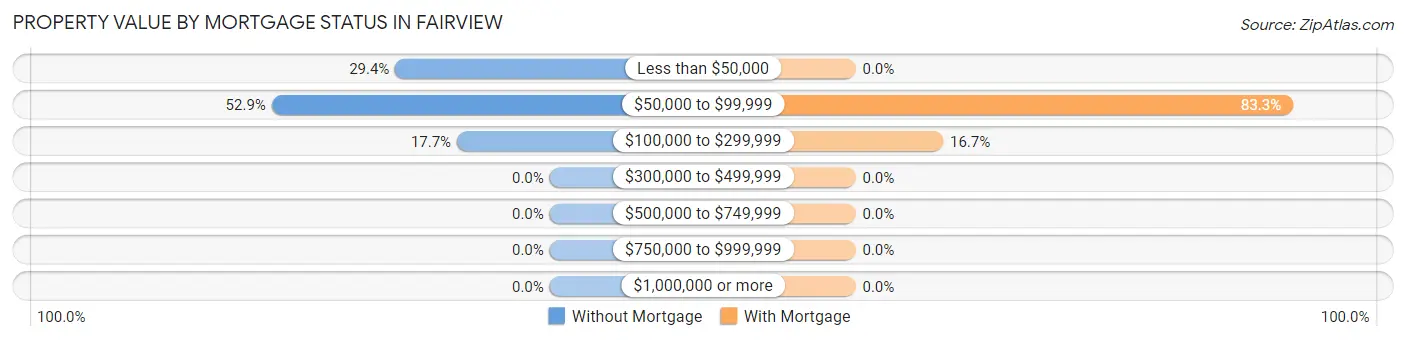
| Property Value | Without Mortgage | With Mortgage |
| Less than $50,000 | 5 (29.4%) | 0 (0.0%) |
| $50,000 to $99,999 | 9 (52.9%) | 5 (83.3%) |
| $100,000 to $299,999 | 3 (17.6%) | 1 (16.7%) |
| $300,000 to $499,999 | 0 (0.0%) | 0 (0.0%) |
| $500,000 to $749,999 | 0 (0.0%) | 0 (0.0%) |
| $750,000 to $999,999 | 0 (0.0%) | 0 (0.0%) |
| $1,000,000 or more | 0 (0.0%) | 0 (0.0%) |
| Total | 17 (100.0%) | 6 (100.0%) |
Household Income by Mortgage Status in Fairview
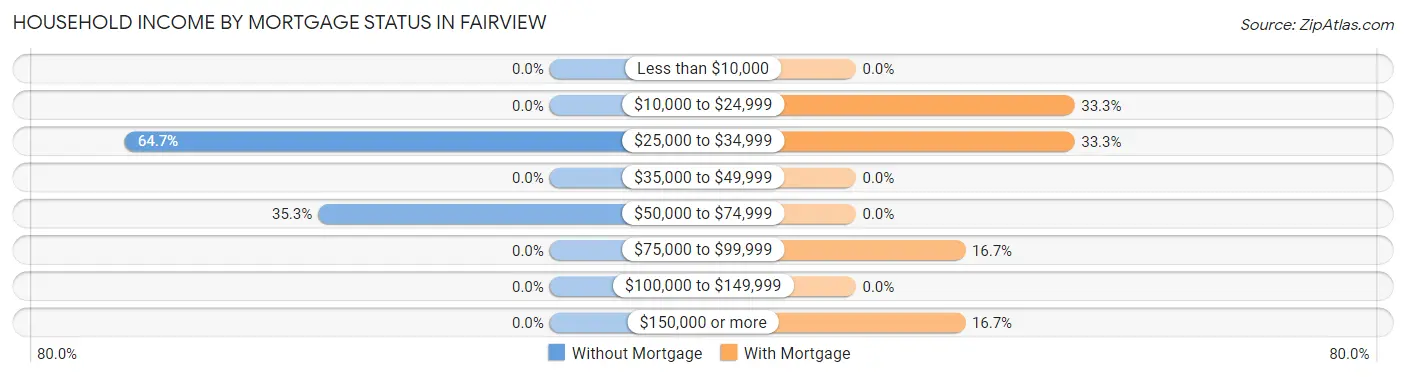
| Household Income | Without Mortgage | With Mortgage |
| Less than $10,000 | 0 (0.0%) | 0 (0.0%) |
| $10,000 to $24,999 | 0 (0.0%) | 2 (33.3%) |
| $25,000 to $34,999 | 11 (64.7%) | 2 (33.3%) |
| $35,000 to $49,999 | 0 (0.0%) | 0 (0.0%) |
| $50,000 to $74,999 | 6 (35.3%) | 0 (0.0%) |
| $75,000 to $99,999 | 0 (0.0%) | 1 (16.7%) |
| $100,000 to $149,999 | 0 (0.0%) | 0 (0.0%) |
| $150,000 or more | 0 (0.0%) | 1 (16.7%) |
| Total | 17 (100.0%) | 6 (100.0%) |
Property Value to Household Income Ratio in Fairview
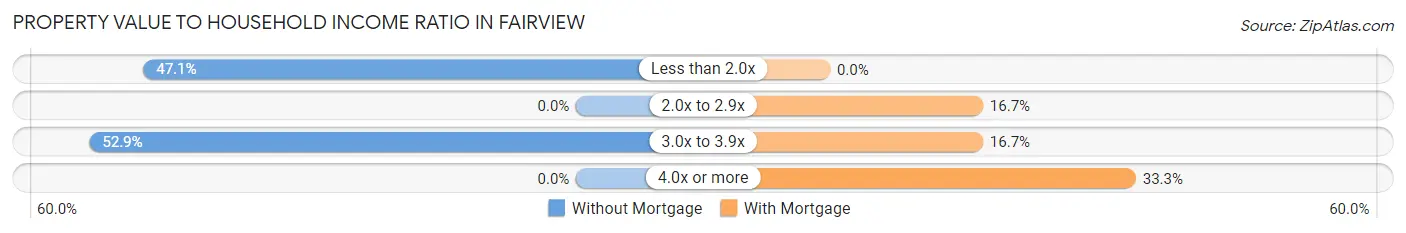
| Value-to-Income Ratio | Without Mortgage | With Mortgage |
| Less than 2.0x | 8 (47.1%) | 0 (0.0%) |
| 2.0x to 2.9x | 0 (0.0%) | 1 (16.7%) |
| 3.0x to 3.9x | 9 (52.9%) | 1 (16.7%) |
| 4.0x or more | 0 (0.0%) | 2 (33.3%) |
| Total | 17 (100.0%) | 6 (100.0%) |
Real Estate Taxes by Mortgage Status in Fairview
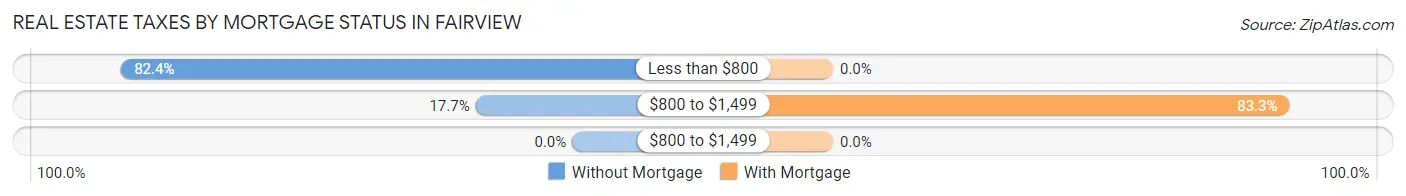
| Property Taxes | Without Mortgage | With Mortgage |
| Less than $800 | 14 (82.4%) | 0 (0.0%) |
| $800 to $1,499 | 3 (17.6%) | 5 (83.3%) |
| $800 to $1,499 | 0 (0.0%) | 0 (0.0%) |
| Total | 17 (100.0%) | 6 (100.0%) |
Health & Disability in Fairview
Health Insurance Coverage by Age in Fairview
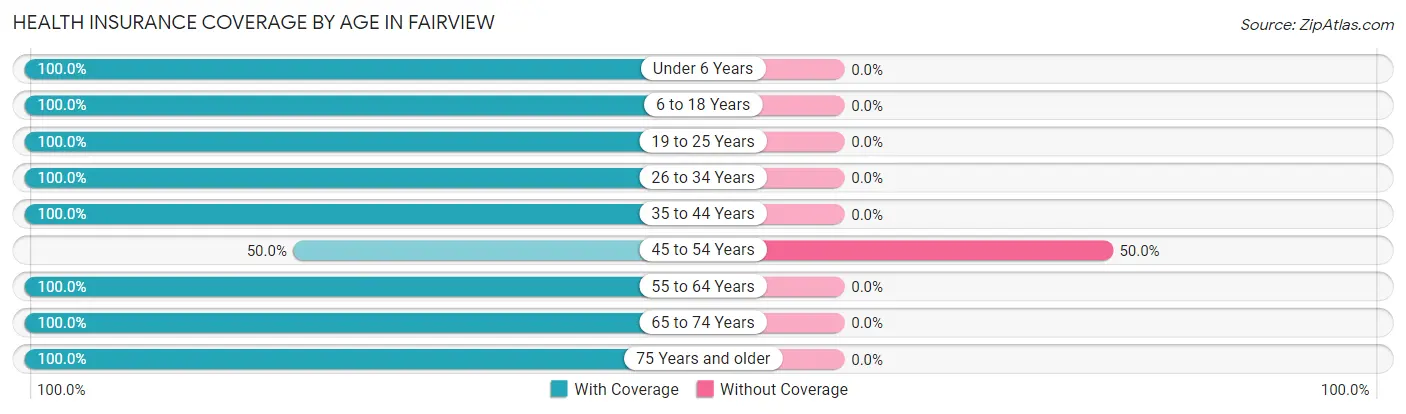
| Age Bracket | With Coverage | Without Coverage |
| Under 6 Years | 1 (100.0%) | 0 (0.0%) |
| 6 to 18 Years | 7 (100.0%) | 0 (0.0%) |
| 19 to 25 Years | 1 (100.0%) | 0 (0.0%) |
| 26 to 34 Years | 2 (100.0%) | 0 (0.0%) |
| 35 to 44 Years | 3 (100.0%) | 0 (0.0%) |
| 45 to 54 Years | 2 (50.0%) | 2 (50.0%) |
| 55 to 64 Years | 14 (100.0%) | 0 (0.0%) |
| 65 to 74 Years | 6 (100.0%) | 0 (0.0%) |
| 75 Years and older | 6 (100.0%) | 0 (0.0%) |
| Total | 42 (95.5%) | 2 (4.5%) |
Health Insurance Coverage by Citizenship Status in Fairview
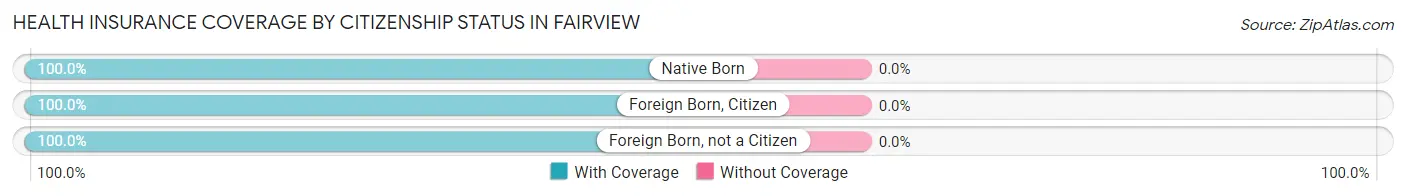
| Citizenship Status | With Coverage | Without Coverage |
| Native Born | 1 (100.0%) | 0 (0.0%) |
| Foreign Born, Citizen | 7 (100.0%) | 0 (0.0%) |
| Foreign Born, not a Citizen | 1 (100.0%) | 0 (0.0%) |
Health Insurance Coverage by Household Income in Fairview
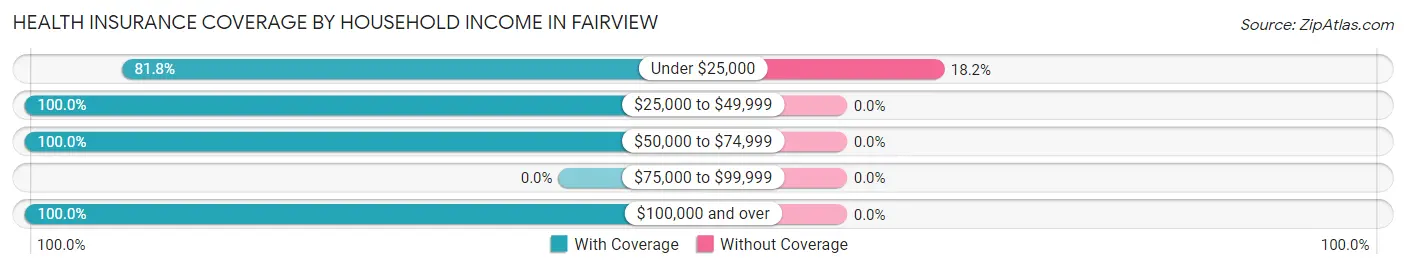
| Household Income | With Coverage | Without Coverage |
| Under $25,000 | 9 (81.8%) | 2 (18.2%) |
| $25,000 to $49,999 | 12 (100.0%) | 0 (0.0%) |
| $50,000 to $74,999 | 14 (100.0%) | 0 (0.0%) |
| $75,000 to $99,999 | 0 (0.0%) | 0 (0.0%) |
| $100,000 and over | 7 (100.0%) | 0 (0.0%) |
Public vs Private Health Insurance Coverage by Age in Fairview
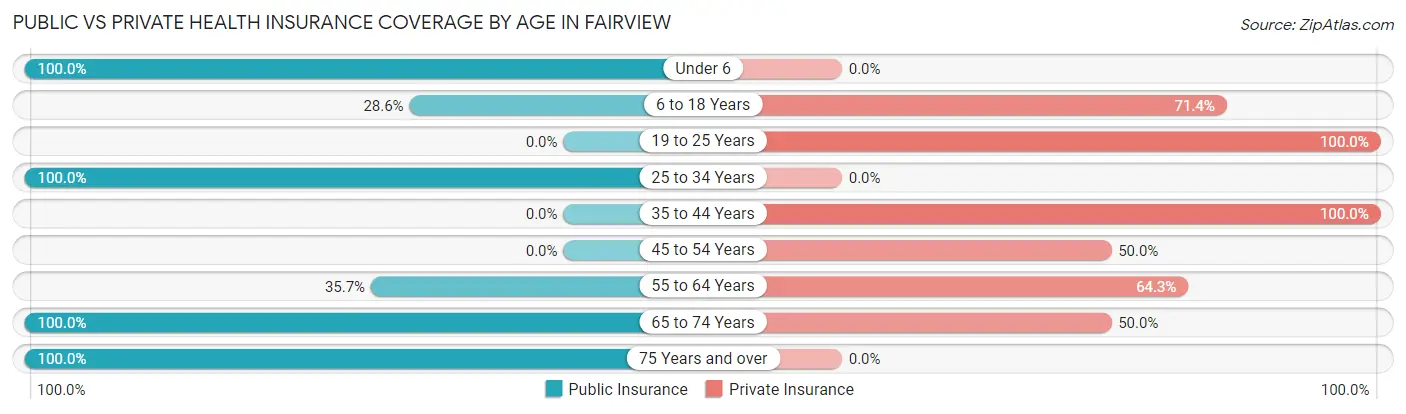
| Age Bracket | Public Insurance | Private Insurance |
| Under 6 | 1 (100.0%) | 0 (0.0%) |
| 6 to 18 Years | 2 (28.6%) | 5 (71.4%) |
| 19 to 25 Years | 0 (0.0%) | 1 (100.0%) |
| 25 to 34 Years | 2 (100.0%) | 0 (0.0%) |
| 35 to 44 Years | 0 (0.0%) | 3 (100.0%) |
| 45 to 54 Years | 0 (0.0%) | 2 (50.0%) |
| 55 to 64 Years | 5 (35.7%) | 9 (64.3%) |
| 65 to 74 Years | 6 (100.0%) | 3 (50.0%) |
| 75 Years and over | 6 (100.0%) | 0 (0.0%) |
| Total | 22 (50.0%) | 23 (52.3%) |
Disability Status by Sex by Age in Fairview
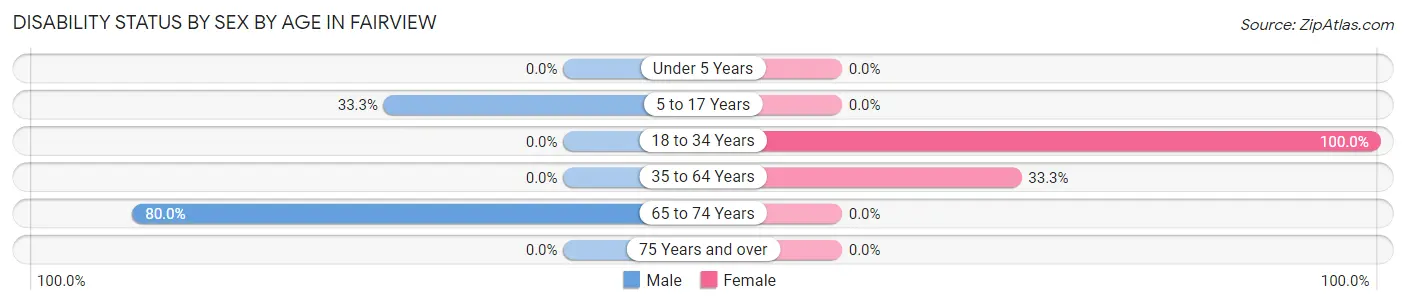
| Age Bracket | Male | Female |
| Under 5 Years | 0 (0.0%) | 0 (0.0%) |
| 5 to 17 Years | 1 (33.3%) | 0 (0.0%) |
| 18 to 34 Years | 0 (0.0%) | 2 (100.0%) |
| 35 to 64 Years | 0 (0.0%) | 3 (33.3%) |
| 65 to 74 Years | 4 (80.0%) | 0 (0.0%) |
| 75 Years and over | 0 (0.0%) | 0 (0.0%) |
Disability Class by Sex by Age in Fairview
Disability Class: Hearing Difficulty
| Age Bracket | Male | Female |
| Under 5 Years | 0 (0.0%) | 0 (0.0%) |
| 5 to 17 Years | 0 (0.0%) | 0 (0.0%) |
| 18 to 34 Years | 0 (0.0%) | 0 (0.0%) |
| 35 to 64 Years | 0 (0.0%) | 0 (0.0%) |
| 65 to 74 Years | 0 (0.0%) | 0 (0.0%) |
| 75 Years and over | 0 (0.0%) | 0 (0.0%) |
Disability Class: Vision Difficulty
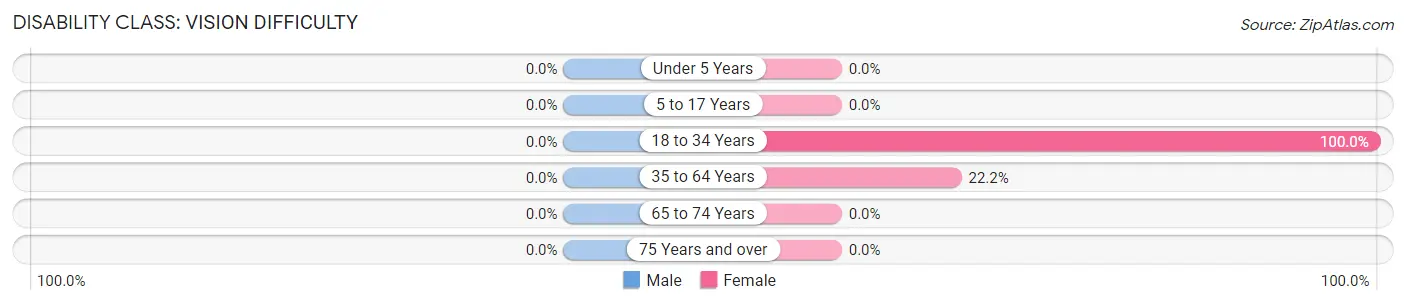
| Age Bracket | Male | Female |
| Under 5 Years | 0 (0.0%) | 0 (0.0%) |
| 5 to 17 Years | 0 (0.0%) | 0 (0.0%) |
| 18 to 34 Years | 0 (0.0%) | 2 (100.0%) |
| 35 to 64 Years | 0 (0.0%) | 2 (22.2%) |
| 65 to 74 Years | 0 (0.0%) | 0 (0.0%) |
| 75 Years and over | 0 (0.0%) | 0 (0.0%) |
Disability Class: Cognitive Difficulty
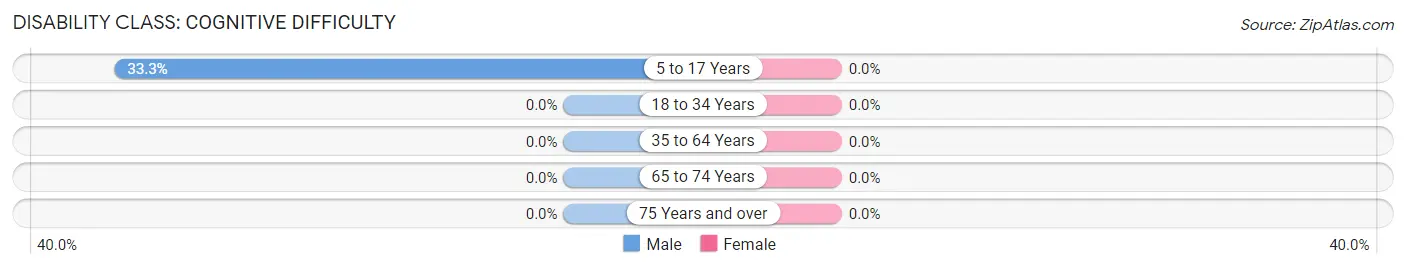
| Age Bracket | Male | Female |
| 5 to 17 Years | 1 (33.3%) | 0 (0.0%) |
| 18 to 34 Years | 0 (0.0%) | 0 (0.0%) |
| 35 to 64 Years | 0 (0.0%) | 0 (0.0%) |
| 65 to 74 Years | 0 (0.0%) | 0 (0.0%) |
| 75 Years and over | 0 (0.0%) | 0 (0.0%) |
Disability Class: Ambulatory Difficulty
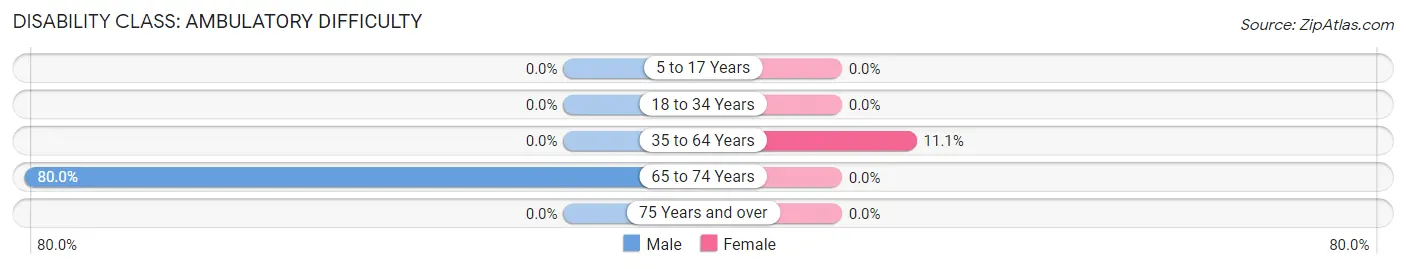
| Age Bracket | Male | Female |
| 5 to 17 Years | 0 (0.0%) | 0 (0.0%) |
| 18 to 34 Years | 0 (0.0%) | 0 (0.0%) |
| 35 to 64 Years | 0 (0.0%) | 1 (11.1%) |
| 65 to 74 Years | 4 (80.0%) | 0 (0.0%) |
| 75 Years and over | 0 (0.0%) | 0 (0.0%) |
Disability Class: Self-Care Difficulty
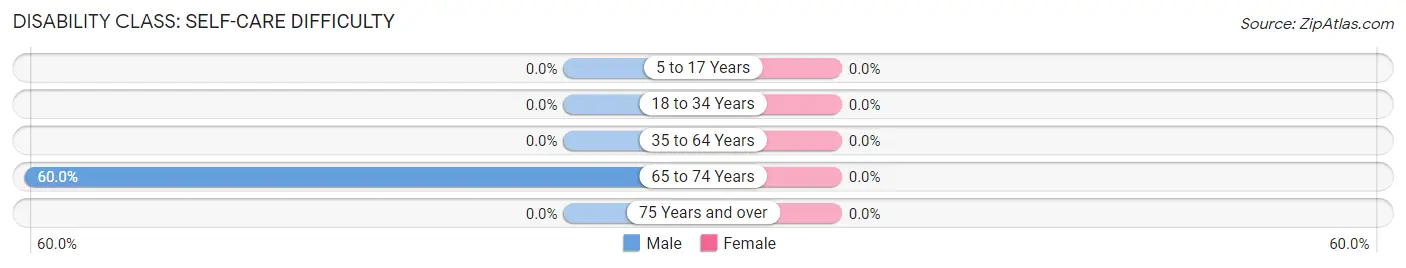
| Age Bracket | Male | Female |
| 5 to 17 Years | 0 (0.0%) | 0 (0.0%) |
| 18 to 34 Years | 0 (0.0%) | 0 (0.0%) |
| 35 to 64 Years | 0 (0.0%) | 0 (0.0%) |
| 65 to 74 Years | 3 (60.0%) | 0 (0.0%) |
| 75 Years and over | 0 (0.0%) | 0 (0.0%) |
Technology Access in Fairview
Computing Device Access in Fairview
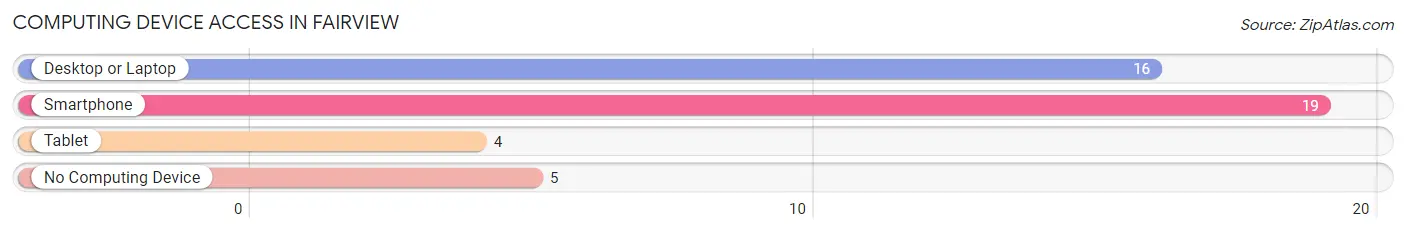
| Device Type | # Households | % Households |
| Desktop or Laptop | 16 | 61.5% |
| Smartphone | 19 | 73.1% |
| Tablet | 4 | 15.4% |
| No Computing Device | 5 | 19.2% |
| Total | 26 | 100.0% |
Internet Access in Fairview
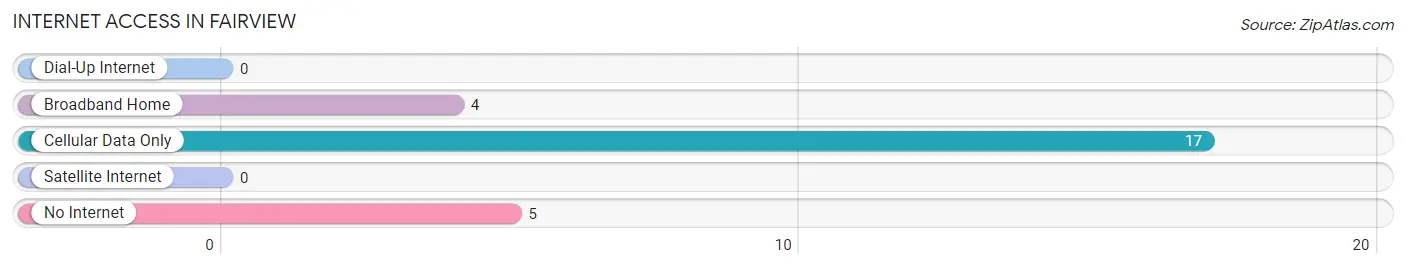
| Internet Type | # Households | % Households |
| Dial-Up Internet | 0 | 0.0% |
| Broadband Home | 4 | 15.4% |
| Cellular Data Only | 17 | 65.4% |
| Satellite Internet | 0 | 0.0% |
| No Internet | 5 | 19.2% |
| Total | 26 | 100.0% |
Fairview Summary
History
The small village of Fairview, Ohio is located in the northwest corner of the state, in the county of Hancock. It was founded in 1837 by a group of settlers from Pennsylvania, who were looking for a place to settle and start a new life. The village was named after the nearby Fairview Creek, which was named by the settlers for its beautiful views of the surrounding countryside.
The first settlers in Fairview were mostly farmers, and the village quickly grew to become a thriving agricultural community. The village was home to a variety of businesses, including a general store, a blacksmith, a sawmill, and a gristmill. The village also had a post office, a school, and a church.
In the late 1800s, the village began to experience a period of growth and prosperity. The railroad came to Fairview in 1881, and the village soon became a hub for the surrounding area. The railroad brought new businesses and industries to the village, and the population began to grow.
By the early 1900s, Fairview had become a thriving community. The village had a variety of businesses, including a bank, a hotel, a movie theater, and a variety of stores. The village also had a variety of churches, including the Methodist, Presbyterian, and Lutheran churches.
In the mid-1900s, the village began to experience a period of decline. The railroad stopped running through the village in the 1950s, and many of the businesses and industries that had been supported by the railroad began to close. The population of the village began to decline, and by the 1970s, the village had become a small, quiet community.
Geography
Fairview is located in the northwest corner of Ohio, in the county of Hancock. The village is situated on the banks of the Blanchard River, and is surrounded by rolling hills and farmland. The village is located approximately 25 miles from the city of Findlay, and is about an hour’s drive from Toledo and Columbus.
The village of Fairview covers an area of approximately 1.2 square miles, and has a population of around 1,000 people. The village is located at an elevation of 845 feet above sea level. The climate in Fairview is generally mild, with temperatures ranging from the low 30s in the winter to the mid-80s in the summer.
Economy
The economy of Fairview is largely based on agriculture. The village is home to a variety of farms, which produce a variety of crops, including corn, soybeans, wheat, and hay. The village also has a number of small businesses, including a general store, a hardware store, and a few restaurants.
The village is also home to a number of manufacturing businesses, including a furniture factory, a plastics factory, and a metal fabrication plant. The village is also home to a number of service businesses, including a bank, a post office, and a variety of other businesses.
Demographics
As of the 2010 census, the population of Fairview was 1,039 people. The population is predominantly white, with 95.3% of the population being white, and 4.7% being of other races. The median age of the population is 43.7 years, and the median household income is $45,945.
The village of Fairview is served by the Hancock County School District, which includes two elementary schools, one middle school, and one high school. The village is also home to a number of churches, including the Methodist, Presbyterian, and Lutheran churches.
Conclusion
The small village of Fairview, Ohio is a quiet, rural community located in the northwest corner of the state. The village was founded in 1837 by a group of settlers from Pennsylvania, and has since grown to become a thriving agricultural community. The village is home to a variety of businesses, including a general store, a hardware store, and a few restaurants. The village is also home to a number of manufacturing businesses, and is served by the Hancock County School District. The population of Fairview is predominantly white, with a median age of 43.7 years and a median household income of $45,945.
Common Questions
What is Per Capita Income in Fairview?
Per Capita income in Fairview is $20,018.
What is the Median Household income in Fairview?
Median Household Income in Fairview is $26,364.
What is Inequality or Gini Index in Fairview?
Inequality or Gini Index in Fairview is 0.41.
What is the Total Population of Fairview?
Total Population of Fairview is 44.
What is the Total Male Population of Fairview?
Total Male Population of Fairview is 24.
What is the Total Female Population of Fairview?
Total Female Population of Fairview is 20.
What is the Ratio of Males per 100 Females in Fairview?
There are 120.00 Males per 100 Females in Fairview.
What is the Ratio of Females per 100 Males in Fairview?
There are 83.33 Females per 100 Males in Fairview.
What is the Median Population Age in Fairview?
Median Population Age in Fairview is 62.2 Years.
What is the Average Family Size in Fairview
Average Family Size in Fairview is 2.2 People.
What is the Average Household Size in Fairview
Average Household Size in Fairview is 1.7 People.
How Large is the Labor Force in Fairview?
There are 13 People in the Labor Forcein in Fairview.
What is the Percentage of People in the Labor Force in Fairview?
32.5% of People are in the Labor Force in Fairview.
What is the Unemployment Rate in Fairview?
Unemployment Rate in Fairview is 30.8%.