Hadley, NY Map & Demographics
Hadley Map
Hadley Overview
$32,921
PER CAPITA INCOME
$86,364
AVG FAMILY INCOME
$57,880
AVG HOUSEHOLD INCOME
36.7%
WAGE / INCOME GAP [ % ]
63.3¢/ $1
WAGE / INCOME GAP [ $ ]
0.39
INEQUALITY / GINI INDEX
1,072
TOTAL POPULATION
537
MALE POPULATION
535
FEMALE POPULATION
100.37
MALES / 100 FEMALES
99.63
FEMALES / 100 MALES
49.3
MEDIAN AGE
3.0
AVG FAMILY SIZE
2.5
AVG HOUSEHOLD SIZE
536
LABOR FORCE [ PEOPLE ]
57.6%
PERCENT IN LABOR FORCE
6.0%
UNEMPLOYMENT RATE
Hadley Zip Codes
Hadley Area Codes
Income in Hadley
Income Overview in Hadley
Per Capita Income in Hadley is $32,921, while median incomes of families and households are $86,364 and $57,880 respectively.
| Characteristic | Number | Measure |
| Per Capita Income | 1,072 | $32,921 |
| Median Family Income | 306 | $86,364 |
| Mean Family Income | 306 | $94,250 |
| Median Household Income | 429 | $57,880 |
| Mean Household Income | 429 | $77,516 |
| Income Deficit | 306 | $0 |
| Wage / Income Gap (%) | 1,072 | 36.73% |
| Wage / Income Gap ($) | 1,072 | 63.27¢ per $1 |
| Gini / Inequality Index | 1,072 | 0.39 |
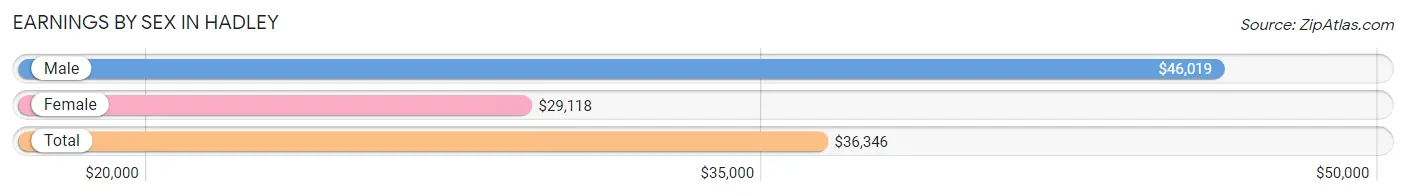
Earnings by Sex in Hadley
Average Earnings in Hadley are $36,346, $46,019 for men and $29,118 for women, a difference of 36.7%.
| Sex | Number | Average Earnings |
| Male | 290 (50.9%) | $46,019 |
| Female | 280 (49.1%) | $29,118 |
| Total | 570 (100.0%) | $36,346 |
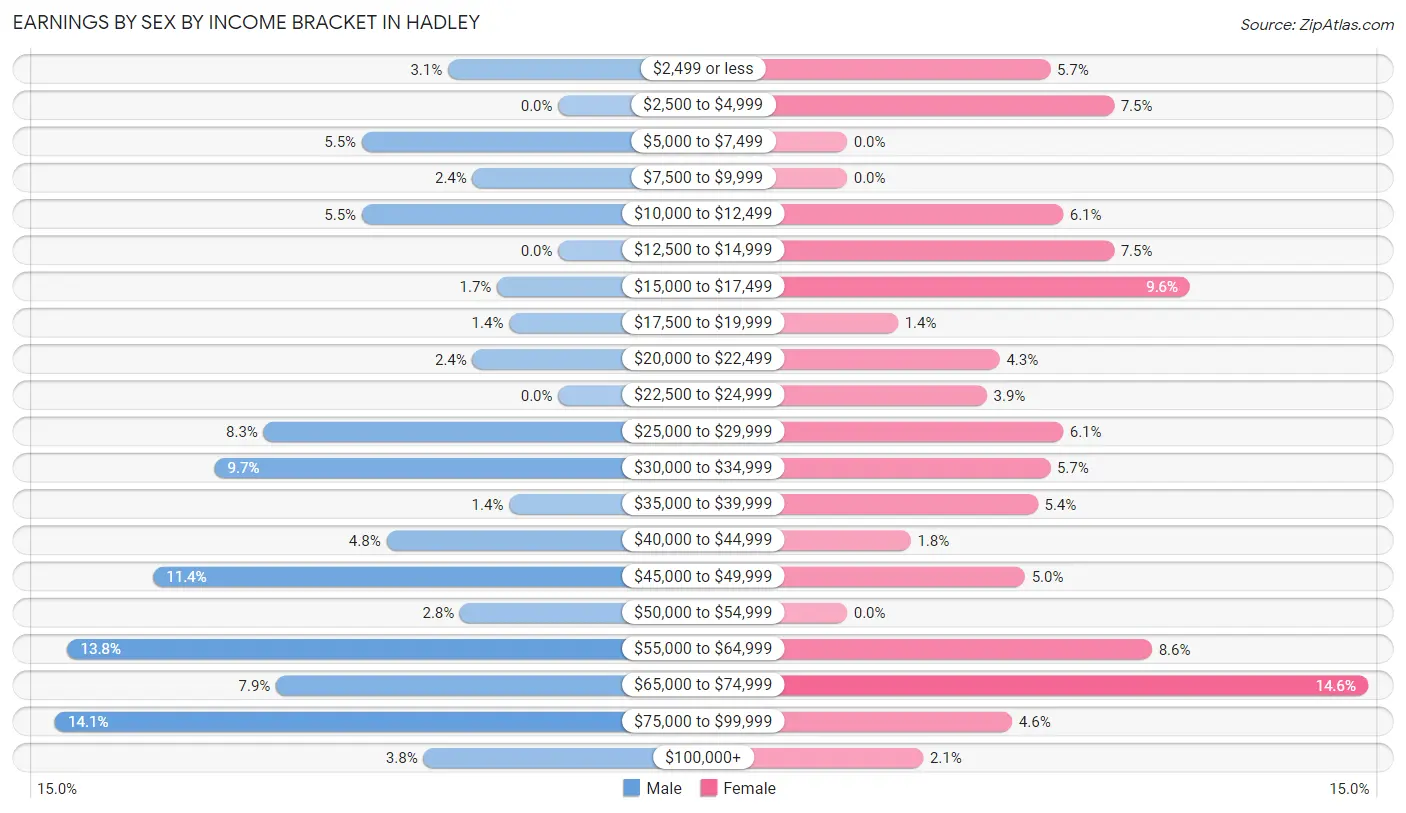
Earnings by Sex by Income Bracket in Hadley
The most common earnings brackets in Hadley are $75,000 to $99,999 for men (41 | 14.1%) and $65,000 to $74,999 for women (41 | 14.6%).
| Income | Male | Female |
| $2,499 or less | 9 (3.1%) | 16 (5.7%) |
| $2,500 to $4,999 | 0 (0.0%) | 21 (7.5%) |
| $5,000 to $7,499 | 16 (5.5%) | 0 (0.0%) |
| $7,500 to $9,999 | 7 (2.4%) | 0 (0.0%) |
| $10,000 to $12,499 | 16 (5.5%) | 17 (6.1%) |
| $12,500 to $14,999 | 0 (0.0%) | 21 (7.5%) |
| $15,000 to $17,499 | 5 (1.7%) | 27 (9.6%) |
| $17,500 to $19,999 | 4 (1.4%) | 4 (1.4%) |
| $20,000 to $22,499 | 7 (2.4%) | 12 (4.3%) |
| $22,500 to $24,999 | 0 (0.0%) | 11 (3.9%) |
| $25,000 to $29,999 | 24 (8.3%) | 17 (6.1%) |
| $30,000 to $34,999 | 28 (9.7%) | 16 (5.7%) |
| $35,000 to $39,999 | 4 (1.4%) | 15 (5.4%) |
| $40,000 to $44,999 | 14 (4.8%) | 5 (1.8%) |
| $45,000 to $49,999 | 33 (11.4%) | 14 (5.0%) |
| $50,000 to $54,999 | 8 (2.8%) | 0 (0.0%) |
| $55,000 to $64,999 | 40 (13.8%) | 24 (8.6%) |
| $65,000 to $74,999 | 23 (7.9%) | 41 (14.6%) |
| $75,000 to $99,999 | 41 (14.1%) | 13 (4.6%) |
| $100,000+ | 11 (3.8%) | 6 (2.1%) |
| Total | 290 (100.0%) | 280 (100.0%) |
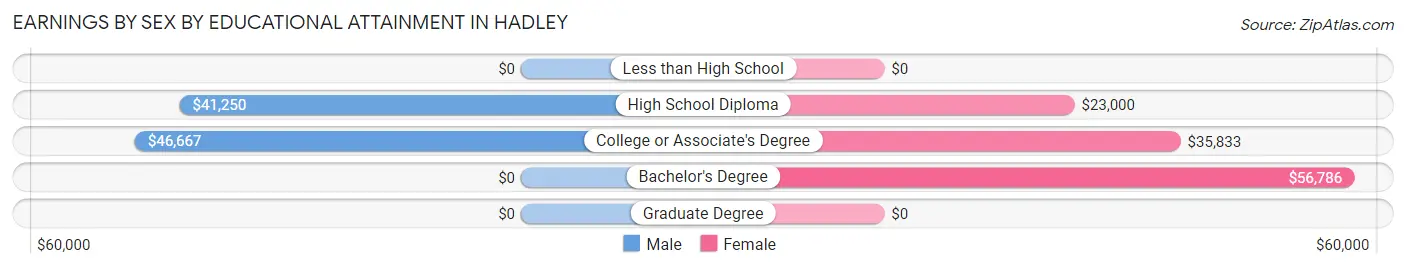
Earnings by Sex by Educational Attainment in Hadley
Average earnings in Hadley are $47,917 for men and $34,375 for women, a difference of 28.3%. Men with an educational attainment of college or associate's degree enjoy the highest average annual earnings of $46,667, while those with high school diploma education earn the least with $41,250. Women with an educational attainment of bachelor's degree earn the most with the average annual earnings of $56,786, while those with high school diploma education have the smallest earnings of $23,000.
| Educational Attainment | Male Income | Female Income |
| Less than High School | - | - |
| High School Diploma | $41,250 | $23,000 |
| College or Associate's Degree | $46,667 | $35,833 |
| Bachelor's Degree | - | - |
| Graduate Degree | - | - |
| Total | $47,917 | $34,375 |
Family Income in Hadley
Family Income Brackets in Hadley
According to the Hadley family income data, there are 80 families falling into the $100,000 to $149,999 income range, which is the most common income bracket and makes up 26.1% of all families.
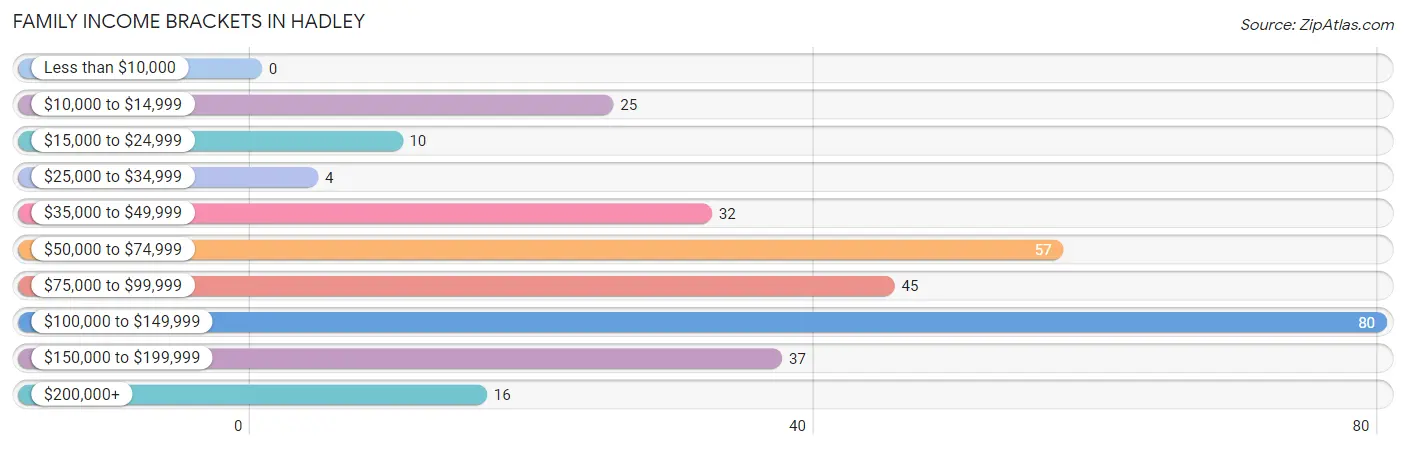
| Income Bracket | # Families | % Families |
| Less than $10,000 | 0 | 0.0% |
| $10,000 to $14,999 | 25 | 8.2% |
| $15,000 to $24,999 | 10 | 3.3% |
| $25,000 to $34,999 | 4 | 1.3% |
| $35,000 to $49,999 | 32 | 10.5% |
| $50,000 to $74,999 | 57 | 18.6% |
| $75,000 to $99,999 | 45 | 14.7% |
| $100,000 to $149,999 | 80 | 26.1% |
| $150,000 to $199,999 | 37 | 12.1% |
| $200,000+ | 16 | 5.2% |
Family Income by Famaliy Size in Hadley
5-person families (23 | 7.5%) account for the highest median family income in Hadley with $148,875 per family, while 3-person families (43 | 14.1%) have the highest median income of $46,042 per family member.
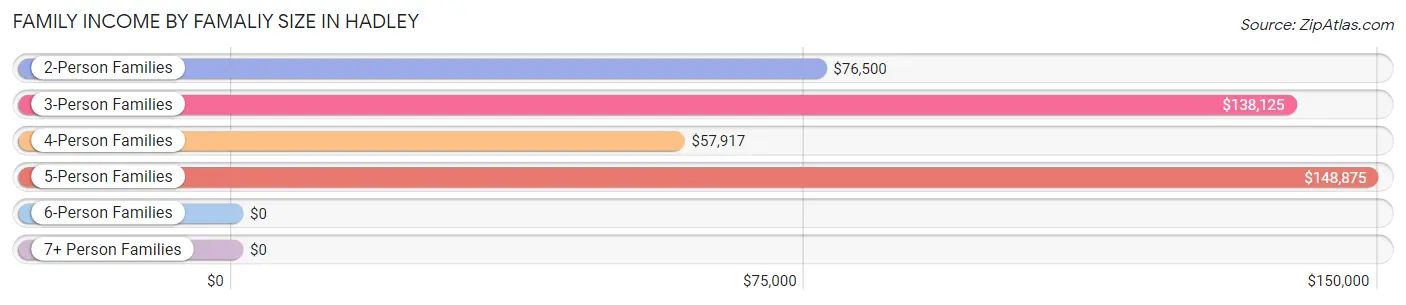
| Income Bracket | # Families | Median Income |
| 2-Person Families | 172 (56.2%) | $76,500 |
| 3-Person Families | 43 (14.1%) | $138,125 |
| 4-Person Families | 56 (18.3%) | $57,917 |
| 5-Person Families | 23 (7.5%) | $148,875 |
| 6-Person Families | 12 (3.9%) | $0 |
| 7+ Person Families | 0 (0.0%) | $0 |
| Total | 306 (100.0%) | $86,364 |
Family Income by Number of Earners in Hadley
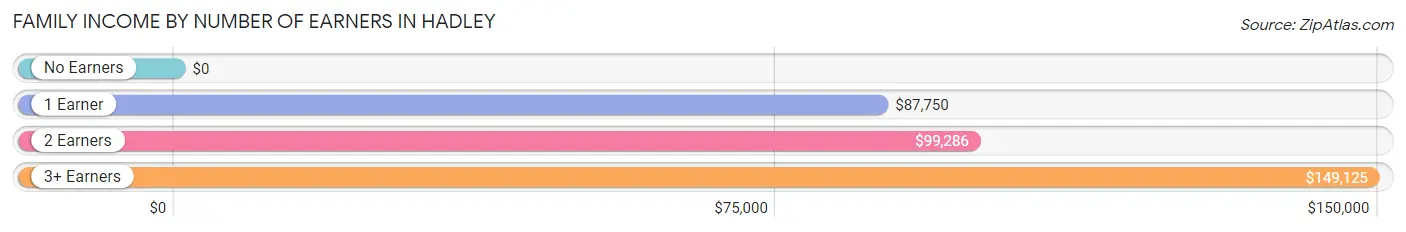
| Number of Earners | # Families | Median Income |
| No Earners | 74 (24.2%) | $0 |
| 1 Earner | 63 (20.6%) | $87,750 |
| 2 Earners | 114 (37.2%) | $99,286 |
| 3+ Earners | 55 (18.0%) | $149,125 |
| Total | 306 (100.0%) | $86,364 |
Household Income in Hadley
Household Income Brackets in Hadley
With 80 households falling in the category, the $100,000 to $149,999 income range is the most frequent in Hadley, accounting for 18.6% of all households.
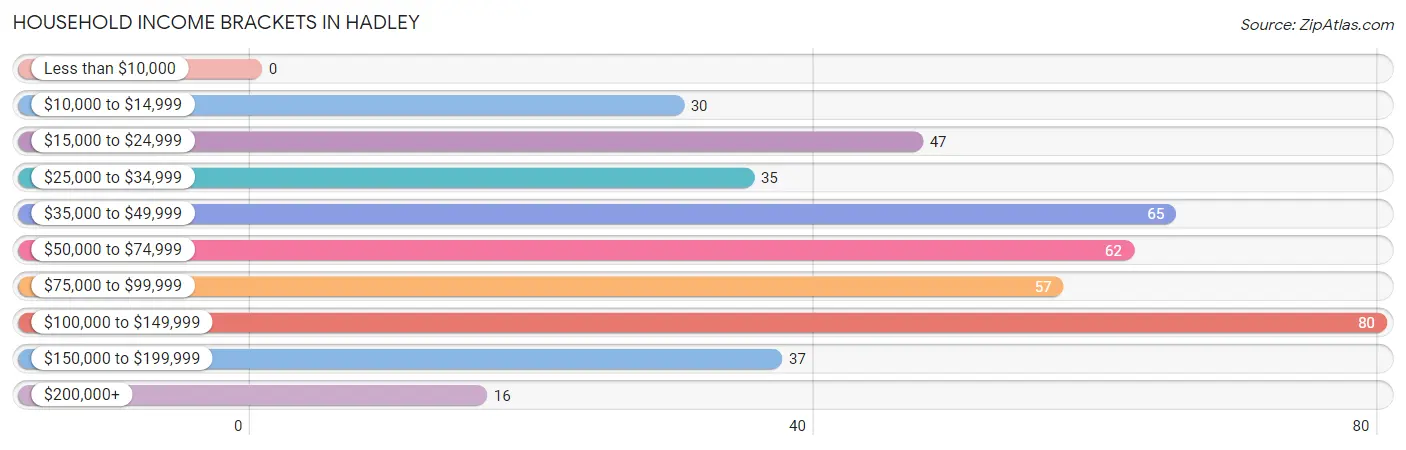
| Income Bracket | # Households | % Households |
| Less than $10,000 | 0 | 0.0% |
| $10,000 to $14,999 | 30 | 7.0% |
| $15,000 to $24,999 | 47 | 11.0% |
| $25,000 to $34,999 | 35 | 8.2% |
| $35,000 to $49,999 | 65 | 15.2% |
| $50,000 to $74,999 | 62 | 14.5% |
| $75,000 to $99,999 | 57 | 13.3% |
| $100,000 to $149,999 | 80 | 18.6% |
| $150,000 to $199,999 | 37 | 8.6% |
| $200,000+ | 16 | 3.7% |
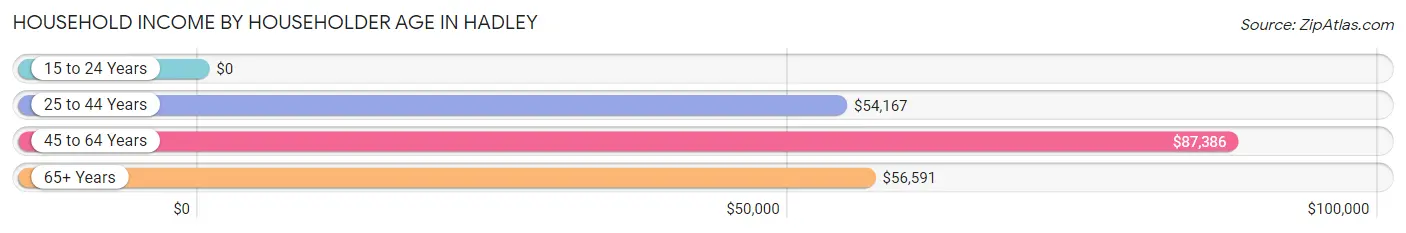
Household Income by Householder Age in Hadley
The median household income in Hadley is $57,880, with the highest median household income of $87,386 found in the 45 to 64 years age bracket for the primary householder. A total of 145 households (33.8%) fall into this category.
| Income Bracket | # Households | Median Income |
| 15 to 24 Years | 0 (0.0%) | $0 |
| 25 to 44 Years | 114 (26.6%) | $54,167 |
| 45 to 64 Years | 145 (33.8%) | $87,386 |
| 65+ Years | 170 (39.6%) | $56,591 |
| Total | 429 (100.0%) | $57,880 |
Poverty in Hadley
Income Below Poverty by Sex and Age in Hadley
With 6.7% poverty level for males and 6.5% for females among the residents of Hadley, 65 to 74 year old males and 65 to 74 year old females are the most vulnerable to poverty, with 18 males (27.3%) and 30 females (28.6%) in their respective age groups living below the poverty level.
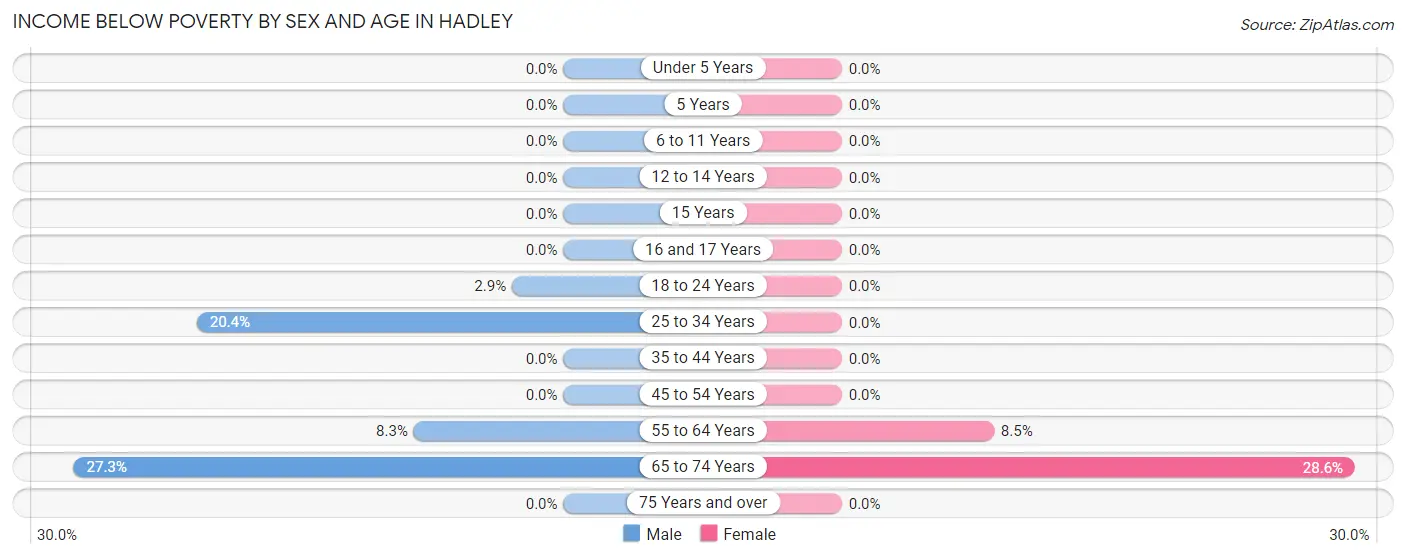
| Age Bracket | Male | Female |
| Under 5 Years | 0 (0.0%) | 0 (0.0%) |
| 5 Years | 0 (0.0%) | 0 (0.0%) |
| 6 to 11 Years | 0 (0.0%) | 0 (0.0%) |
| 12 to 14 Years | 0 (0.0%) | 0 (0.0%) |
| 15 Years | 0 (0.0%) | 0 (0.0%) |
| 16 and 17 Years | 0 (0.0%) | 0 (0.0%) |
| 18 to 24 Years | 1 (2.9%) | 0 (0.0%) |
| 25 to 34 Years | 10 (20.4%) | 0 (0.0%) |
| 35 to 44 Years | 0 (0.0%) | 0 (0.0%) |
| 45 to 54 Years | 0 (0.0%) | 0 (0.0%) |
| 55 to 64 Years | 7 (8.3%) | 5 (8.5%) |
| 65 to 74 Years | 18 (27.3%) | 30 (28.6%) |
| 75 Years and over | 0 (0.0%) | 0 (0.0%) |
| Total | 36 (6.7%) | 35 (6.5%) |
Income Above Poverty by Sex and Age in Hadley
According to the poverty statistics in Hadley, males aged under 5 years and females aged under 5 years are the age groups that are most secure financially, with 100.0% of males and 100.0% of females in these age groups living above the poverty line.
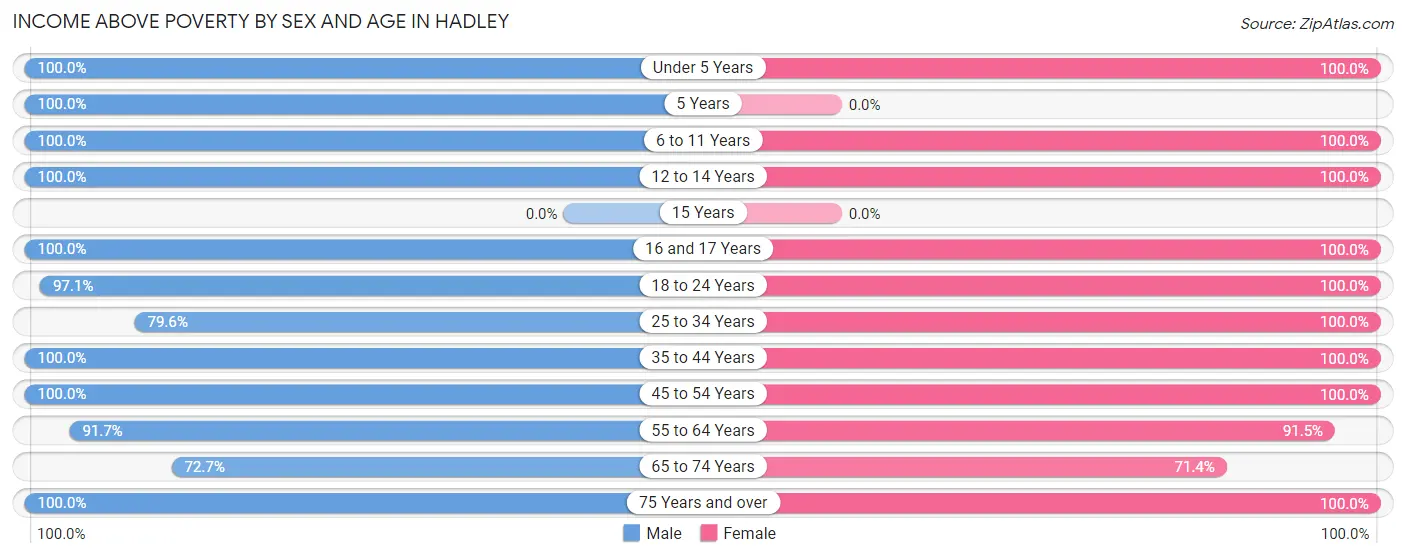
| Age Bracket | Male | Female |
| Under 5 Years | 15 (100.0%) | 41 (100.0%) |
| 5 Years | 16 (100.0%) | 0 (0.0%) |
| 6 to 11 Years | 7 (100.0%) | 19 (100.0%) |
| 12 to 14 Years | 27 (100.0%) | 16 (100.0%) |
| 15 Years | 0 (0.0%) | 0 (0.0%) |
| 16 and 17 Years | 10 (100.0%) | 17 (100.0%) |
| 18 to 24 Years | 34 (97.1%) | 32 (100.0%) |
| 25 to 34 Years | 39 (79.6%) | 29 (100.0%) |
| 35 to 44 Years | 107 (100.0%) | 64 (100.0%) |
| 45 to 54 Years | 66 (100.0%) | 85 (100.0%) |
| 55 to 64 Years | 77 (91.7%) | 54 (91.5%) |
| 65 to 74 Years | 48 (72.7%) | 75 (71.4%) |
| 75 Years and over | 55 (100.0%) | 68 (100.0%) |
| Total | 501 (93.3%) | 500 (93.5%) |
Income Below Poverty Among Married-Couple Families in Hadley
The poverty statistics for married-couple families in Hadley show that 6.7% or 18 of the total 269 families live below the poverty line. Families with no children have the highest poverty rate of 9.9%, comprising of 18 families. On the other hand, families with 1 or 2 children have the lowest poverty rate of 0.0%, which includes 0 families.
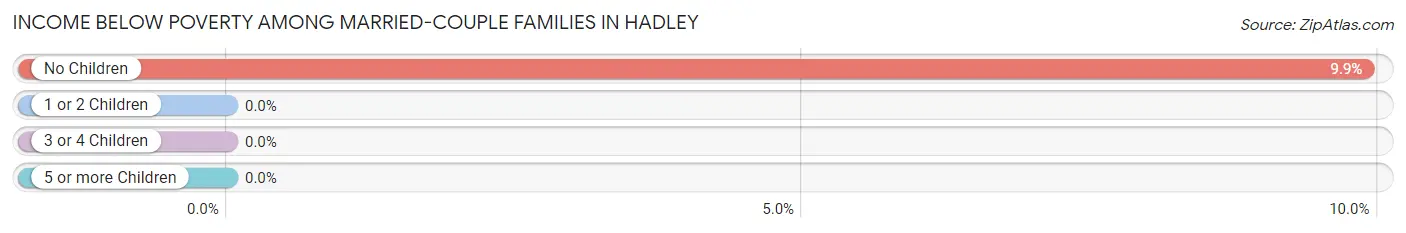
| Children | Above Poverty | Below Poverty |
| No Children | 164 (90.1%) | 18 (9.9%) |
| 1 or 2 Children | 81 (100.0%) | 0 (0.0%) |
| 3 or 4 Children | 6 (100.0%) | 0 (0.0%) |
| 5 or more Children | 0 (0.0%) | 0 (0.0%) |
| Total | 251 (93.3%) | 18 (6.7%) |
Income Below Poverty Among Single-Parent Households in Hadley
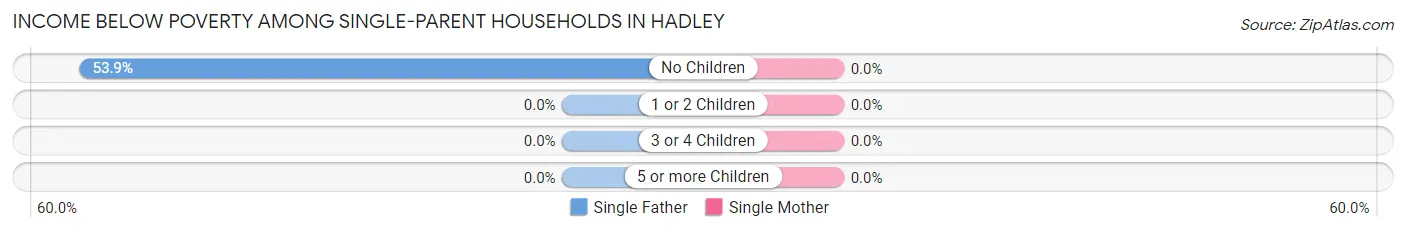
| Children | Single Father | Single Mother |
| No Children | 7 (53.8%) | 0 (0.0%) |
| 1 or 2 Children | 0 (0.0%) | 0 (0.0%) |
| 3 or 4 Children | 0 (0.0%) | 0 (0.0%) |
| 5 or more Children | 0 (0.0%) | 0 (0.0%) |
| Total | 7 (35.0%) | 0 (0.0%) |
Income Below Poverty Among Married-Couple vs Single-Parent Households in Hadley
The poverty data for Hadley shows that 18 of the married-couple family households (6.7%) and 7 of the single-parent households (18.9%) are living below the poverty level. Within the married-couple family households, those with no children have the highest poverty rate, with 18 households (9.9%) falling below the poverty line. Among the single-parent households, those with no children have the highest poverty rate, with 7 household (23.3%) living below poverty.
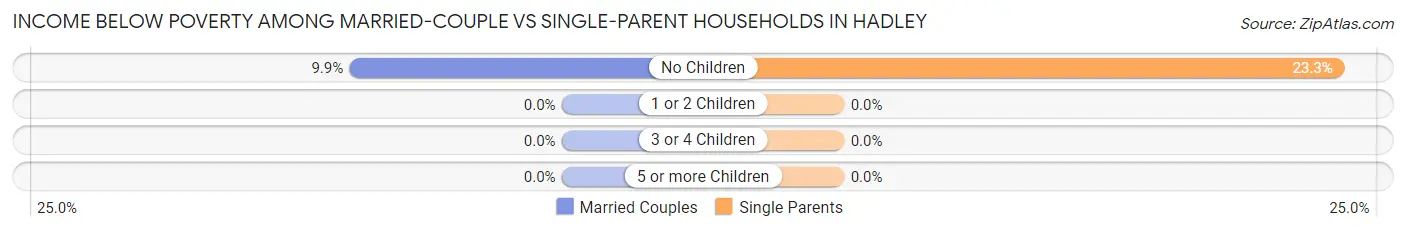
| Children | Married-Couple Families | Single-Parent Households |
| No Children | 18 (9.9%) | 7 (23.3%) |
| 1 or 2 Children | 0 (0.0%) | 0 (0.0%) |
| 3 or 4 Children | 0 (0.0%) | 0 (0.0%) |
| 5 or more Children | 0 (0.0%) | 0 (0.0%) |
| Total | 18 (6.7%) | 7 (18.9%) |
Race in Hadley
The most populous races in Hadley are White / Caucasian (988 | 92.2%), Two or more Races (68 | 6.3%), and Hispanic or Latino (16 | 1.5%).
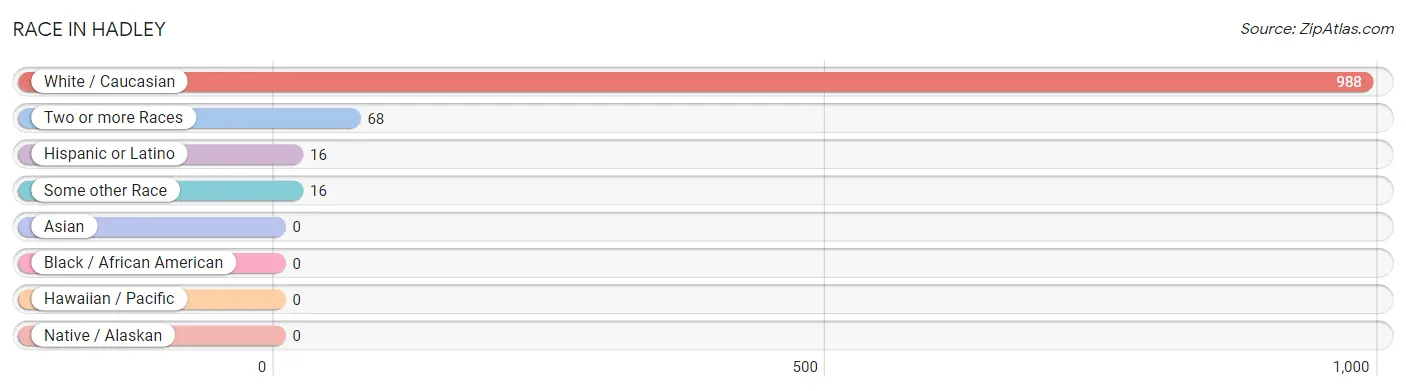
| Race | # Population | % Population |
| Asian | 0 | 0.0% |
| Black / African American | 0 | 0.0% |
| Hawaiian / Pacific | 0 | 0.0% |
| Hispanic or Latino | 16 | 1.5% |
| Native / Alaskan | 0 | 0.0% |
| White / Caucasian | 988 | 92.2% |
| Two or more Races | 68 | 6.3% |
| Some other Race | 16 | 1.5% |
| Total | 1,072 | 100.0% |
Ancestry in Hadley
The most populous ancestries reported in Hadley are English (194 | 18.1%), Irish (174 | 16.2%), French (141 | 13.2%), Italian (109 | 10.2%), and American (107 | 10.0%), together accounting for 67.6% of all Hadley residents.
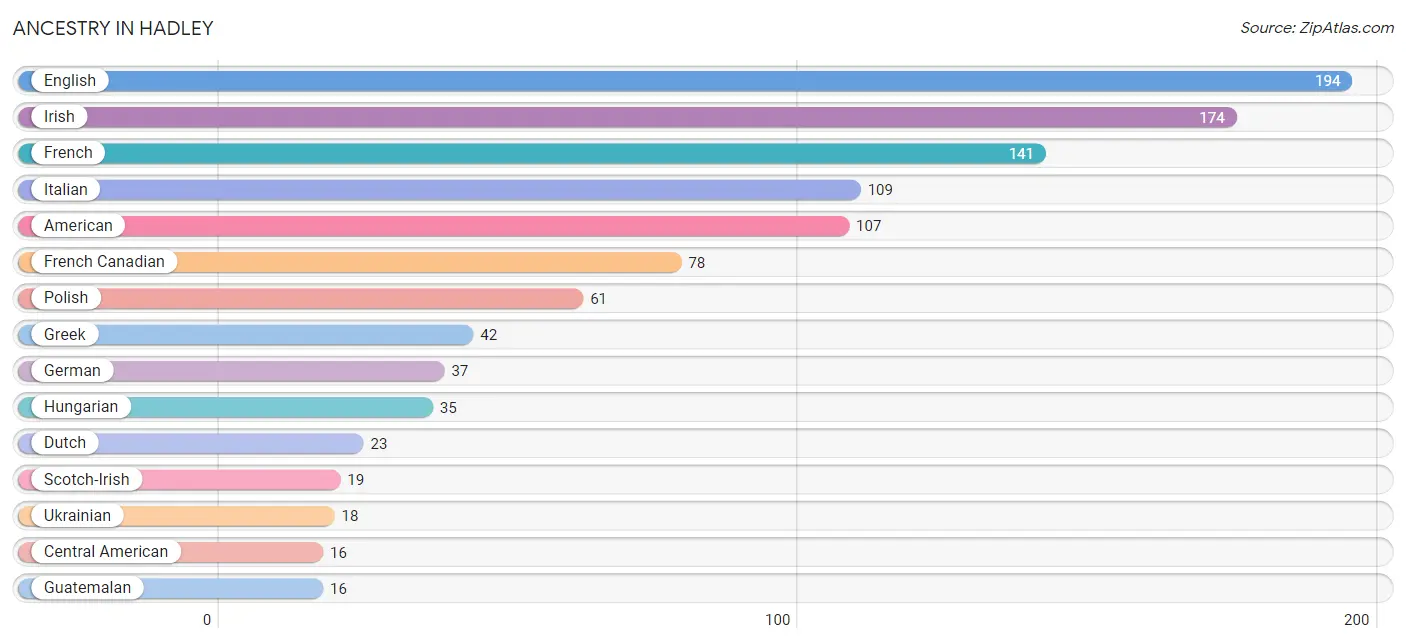
| Ancestry | # Population | % Population |
| American | 107 | 10.0% |
| Austrian | 15 | 1.4% |
| Bhutanese | 5 | 0.5% |
| Canadian | 6 | 0.6% |
| Central American | 16 | 1.5% |
| Czechoslovakian | 7 | 0.6% |
| Dutch | 23 | 2.1% |
| English | 194 | 18.1% |
| French | 141 | 13.2% |
| French American Indian | 3 | 0.3% |
| French Canadian | 78 | 7.3% |
| German | 37 | 3.5% |
| Greek | 42 | 3.9% |
| Guatemalan | 16 | 1.5% |
| Hungarian | 35 | 3.3% |
| Irish | 174 | 16.2% |
| Italian | 109 | 10.2% |
| Polish | 61 | 5.7% |
| Scandinavian | 7 | 0.6% |
| Scotch-Irish | 19 | 1.8% |
| Slovak | 11 | 1.0% |
| Swedish | 5 | 0.5% |
| Ukrainian | 18 | 1.7% | View All 23 Rows |
Immigrants in Hadley
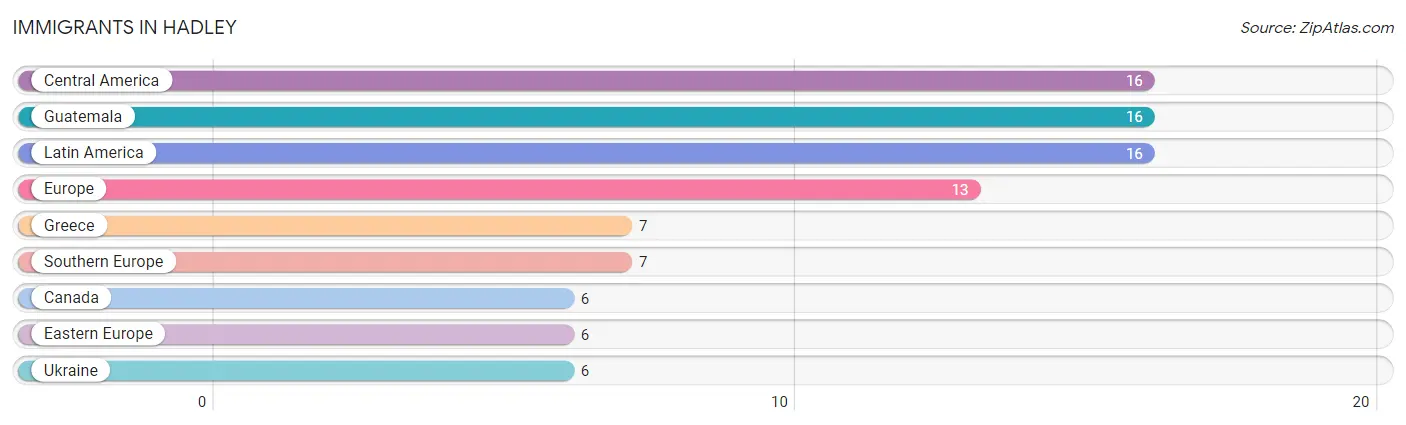
The most numerous immigrant groups reported in Hadley came from Central America (16 | 1.5%), Guatemala (16 | 1.5%), Latin America (16 | 1.5%), Europe (13 | 1.2%), and Greece (7 | 0.6%), together accounting for 6.3% of all Hadley residents.
| Immigration Origin | # Population | % Population |
| Canada | 6 | 0.6% |
| Central America | 16 | 1.5% |
| Eastern Europe | 6 | 0.6% |
| Europe | 13 | 1.2% |
| Greece | 7 | 0.6% |
| Guatemala | 16 | 1.5% |
| Latin America | 16 | 1.5% |
| Southern Europe | 7 | 0.6% |
| Ukraine | 6 | 0.6% | View All 9 Rows |
Sex and Age in Hadley
Sex and Age in Hadley
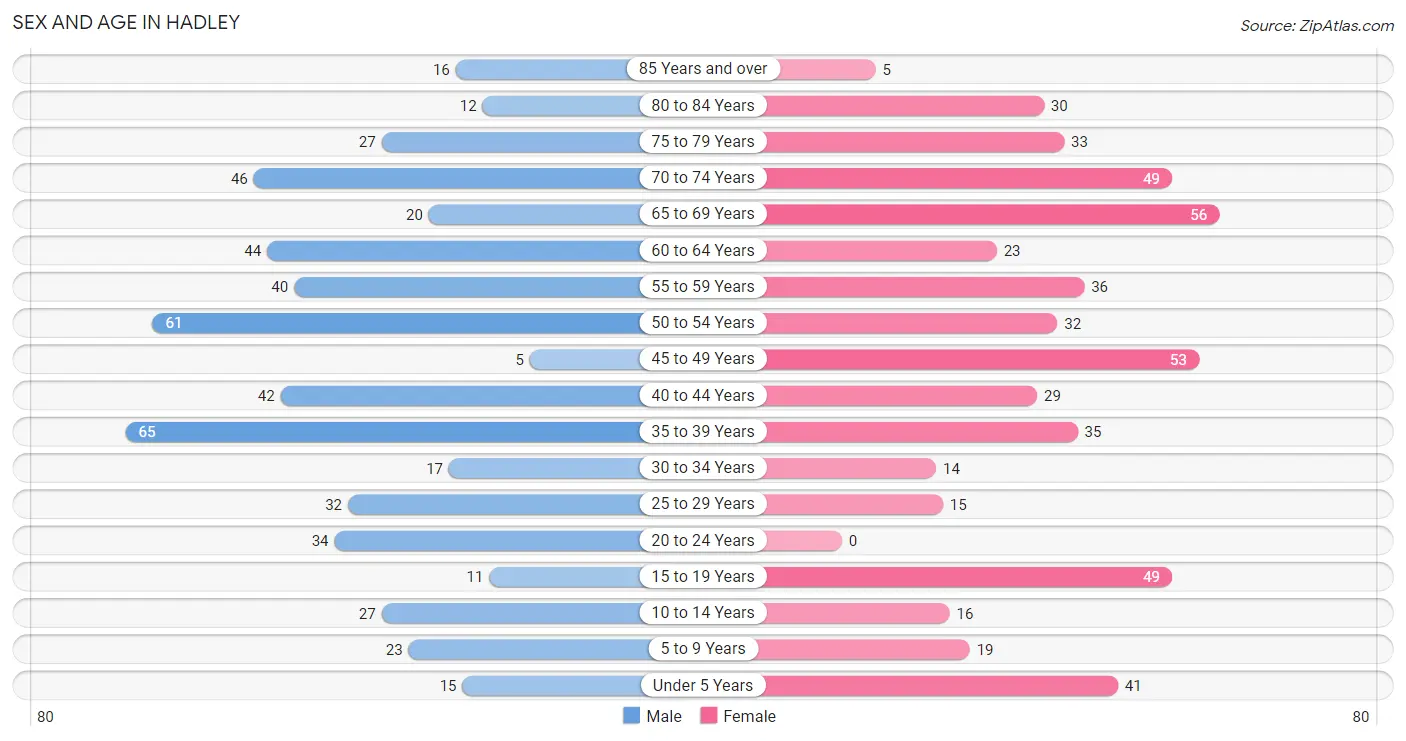
The most populous age groups in Hadley are 35 to 39 Years (65 | 12.1%) for men and 65 to 69 Years (56 | 10.5%) for women.
| Age Bracket | Male | Female |
| Under 5 Years | 15 (2.8%) | 41 (7.7%) |
| 5 to 9 Years | 23 (4.3%) | 19 (3.5%) |
| 10 to 14 Years | 27 (5.0%) | 16 (3.0%) |
| 15 to 19 Years | 11 (2.1%) | 49 (9.2%) |
| 20 to 24 Years | 34 (6.3%) | 0 (0.0%) |
| 25 to 29 Years | 32 (6.0%) | 15 (2.8%) |
| 30 to 34 Years | 17 (3.2%) | 14 (2.6%) |
| 35 to 39 Years | 65 (12.1%) | 35 (6.5%) |
| 40 to 44 Years | 42 (7.8%) | 29 (5.4%) |
| 45 to 49 Years | 5 (0.9%) | 53 (9.9%) |
| 50 to 54 Years | 61 (11.4%) | 32 (6.0%) |
| 55 to 59 Years | 40 (7.4%) | 36 (6.7%) |
| 60 to 64 Years | 44 (8.2%) | 23 (4.3%) |
| 65 to 69 Years | 20 (3.7%) | 56 (10.5%) |
| 70 to 74 Years | 46 (8.6%) | 49 (9.2%) |
| 75 to 79 Years | 27 (5.0%) | 33 (6.2%) |
| 80 to 84 Years | 12 (2.2%) | 30 (5.6%) |
| 85 Years and over | 16 (3.0%) | 5 (0.9%) |
| Total | 537 (100.0%) | 535 (100.0%) |
Families and Households in Hadley
Median Family Size in Hadley
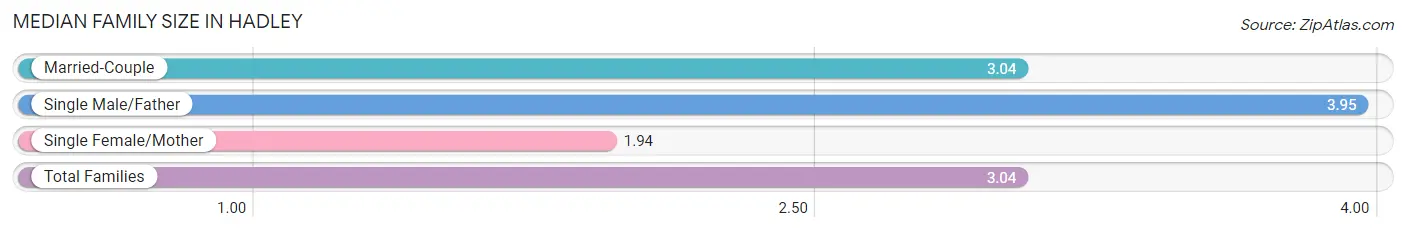
The median family size in Hadley is 3.04 persons per family, with single male/father families (20 | 6.5%) accounting for the largest median family size of 3.95 persons per family. On the other hand, single female/mother families (17 | 5.6%) represent the smallest median family size with 1.94 persons per family.
| Family Type | # Families | Family Size |
| Married-Couple | 269 (87.9%) | 3.04 |
| Single Male/Father | 20 (6.5%) | 3.95 |
| Single Female/Mother | 17 (5.6%) | 1.94 |
| Total Families | 306 (100.0%) | 3.04 |
Median Household Size in Hadley
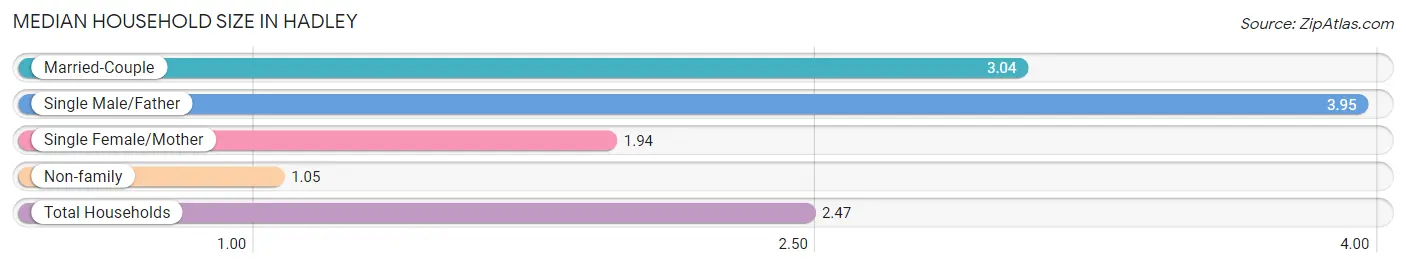
The median household size in Hadley is 2.47 persons per household, with single male/father households (20 | 4.7%) accounting for the largest median household size of 3.95 persons per household. non-family households (123 | 28.7%) represent the smallest median household size with 1.05 persons per household.
| Household Type | # Households | Household Size |
| Married-Couple | 269 (62.7%) | 3.04 |
| Single Male/Father | 20 (4.7%) | 3.95 |
| Single Female/Mother | 17 (4.0%) | 1.94 |
| Non-family | 123 (28.7%) | 1.05 |
| Total Households | 429 (100.0%) | 2.47 |
Household Size by Marriage Status in Hadley
Out of a total of 429 households in Hadley, 306 (71.3%) are family households, while 123 (28.7%) are nonfamily households. The most numerous type of family households are 2-person households, comprising 172, and the most common type of nonfamily households are 1-person households, comprising 112.
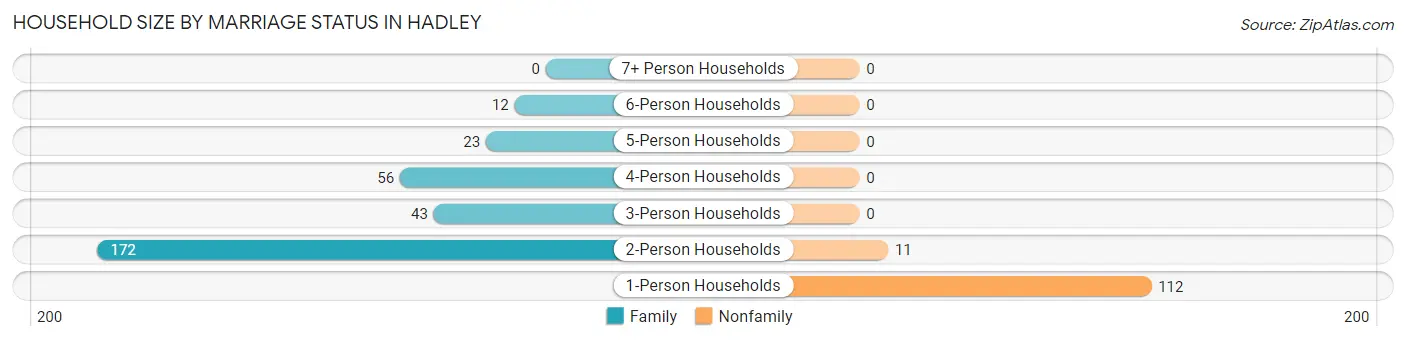
| Household Size | Family Households | Nonfamily Households |
| 1-Person Households | - | 112 (26.1%) |
| 2-Person Households | 172 (40.1%) | 11 (2.6%) |
| 3-Person Households | 43 (10.0%) | 0 (0.0%) |
| 4-Person Households | 56 (13.1%) | 0 (0.0%) |
| 5-Person Households | 23 (5.4%) | 0 (0.0%) |
| 6-Person Households | 12 (2.8%) | 0 (0.0%) |
| 7+ Person Households | 0 (0.0%) | 0 (0.0%) |
| Total | 306 (71.3%) | 123 (28.7%) |
Female Fertility in Hadley
Fertility by Age in Hadley
Average fertility rate in Hadley is 63.0 births per 1,000 women. Women in the age bracket of 20 to 34 years have the highest fertility rate with 448.0 births per 1,000 women. Women in the age bracket of 20 to 34 years acount for 100.0% of all women with births.
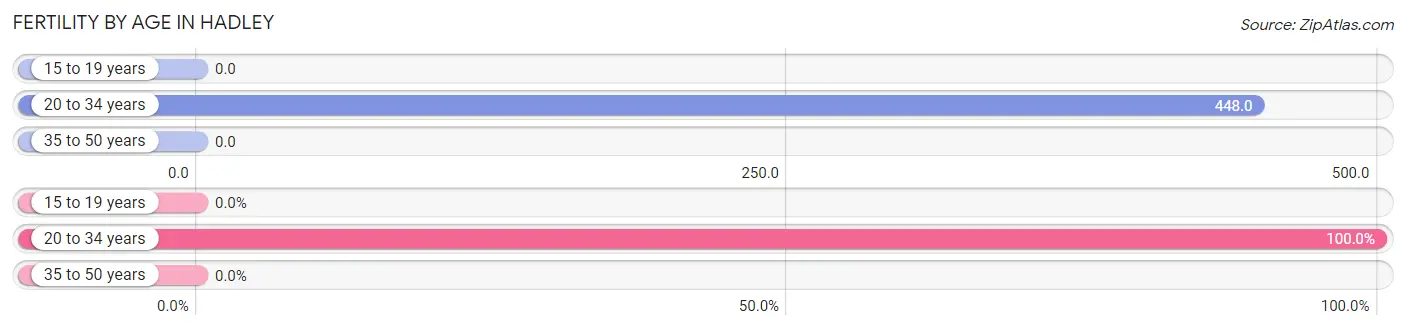
| Age Bracket | Women with Births | Births / 1,000 Women |
| 15 to 19 years | 0 (0.0%) | 0.0 |
| 20 to 34 years | 13 (100.0%) | 448.0 |
| 35 to 50 years | 0 (0.0%) | 0.0 |
| Total | 13 (100.0%) | 63.0 |
Fertility by Age by Marriage Status in Hadley
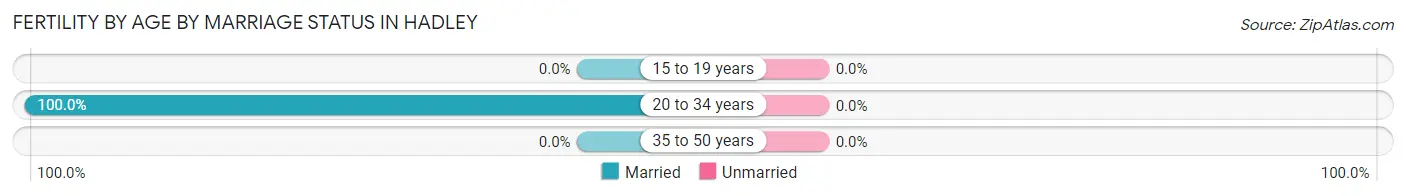
| Age Bracket | Married | Unmarried |
| 15 to 19 years | 0 (0.0%) | 0 (0.0%) |
| 20 to 34 years | 13 (100.0%) | 0 (0.0%) |
| 35 to 50 years | 0 (0.0%) | 0 (0.0%) |
| Total | 13 (100.0%) | 0 (0.0%) |
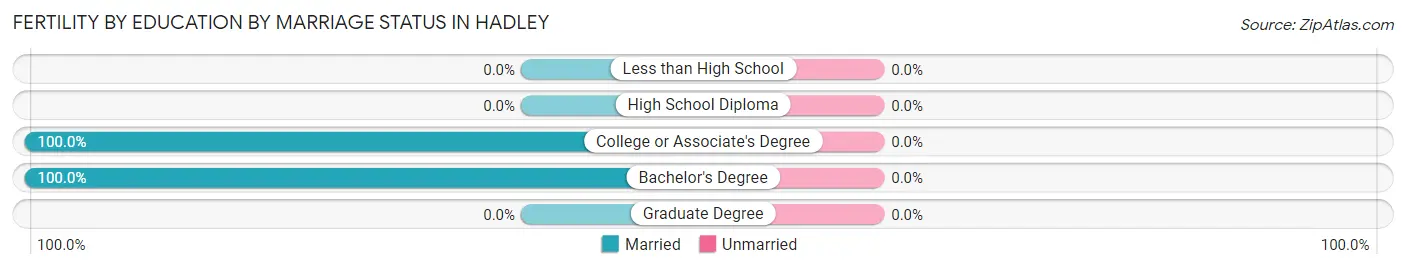
Fertility by Education in Hadley
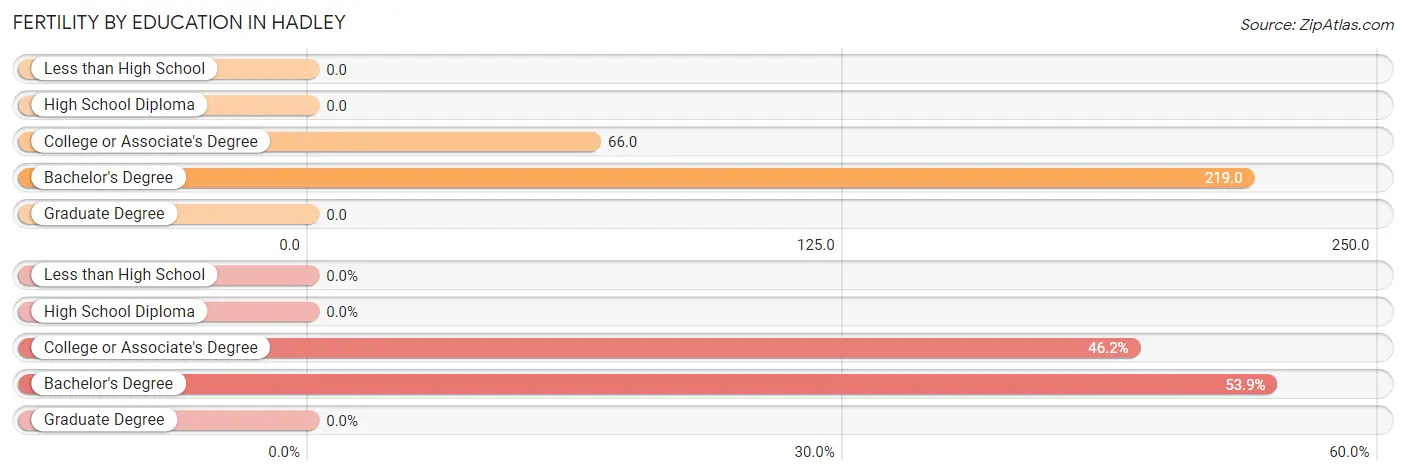
| Educational Attainment | Women with Births | Births / 1,000 Women |
| Less than High School | 0 (0.0%) | 0.0 |
| High School Diploma | 0 (0.0%) | 0.0 |
| College or Associate's Degree | 6 (46.2%) | 66.0 |
| Bachelor's Degree | 7 (53.8%) | 219.0 |
| Graduate Degree | 0 (0.0%) | 0.0 |
| Total | 13 (100.0%) | 63.0 |
Fertility by Education by Marriage Status in Hadley
| Educational Attainment | Married | Unmarried |
| Less than High School | 0 (0.0%) | 0 (0.0%) |
| High School Diploma | 0 (0.0%) | 0 (0.0%) |
| College or Associate's Degree | 6 (100.0%) | 0 (0.0%) |
| Bachelor's Degree | 7 (100.0%) | 0 (0.0%) |
| Graduate Degree | 0 (0.0%) | 0 (0.0%) |
| Total | 13 (100.0%) | 0 (0.0%) |
Employment Characteristics in Hadley
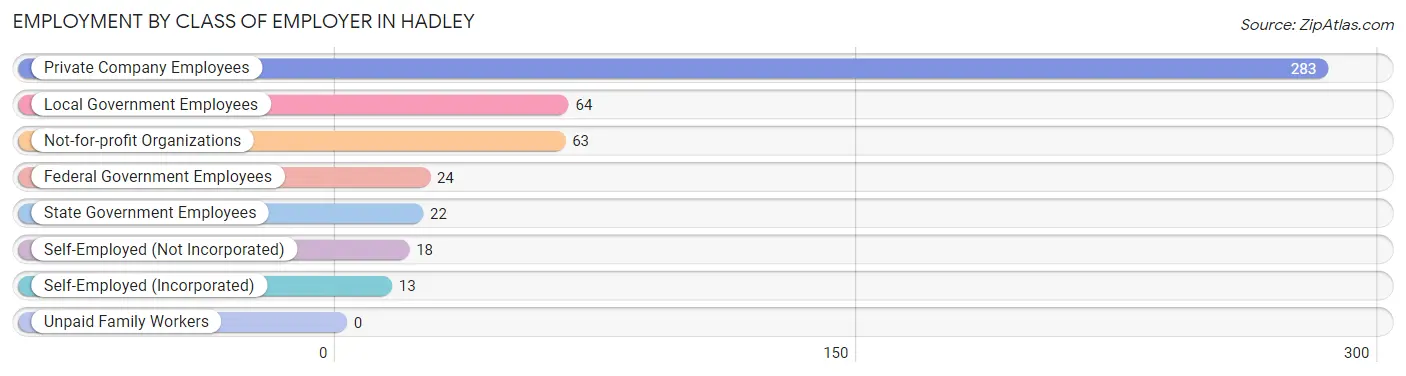
Employment by Class of Employer in Hadley
Among the 487 employed individuals in Hadley, private company employees (283 | 58.1%), local government employees (64 | 13.1%), and not-for-profit organizations (63 | 12.9%) make up the most common classes of employment.
| Employer Class | # Employees | % Employees |
| Private Company Employees | 283 | 58.1% |
| Self-Employed (Incorporated) | 13 | 2.7% |
| Self-Employed (Not Incorporated) | 18 | 3.7% |
| Not-for-profit Organizations | 63 | 12.9% |
| Local Government Employees | 64 | 13.1% |
| State Government Employees | 22 | 4.5% |
| Federal Government Employees | 24 | 4.9% |
| Unpaid Family Workers | 0 | 0.0% |
| Total | 487 | 100.0% |
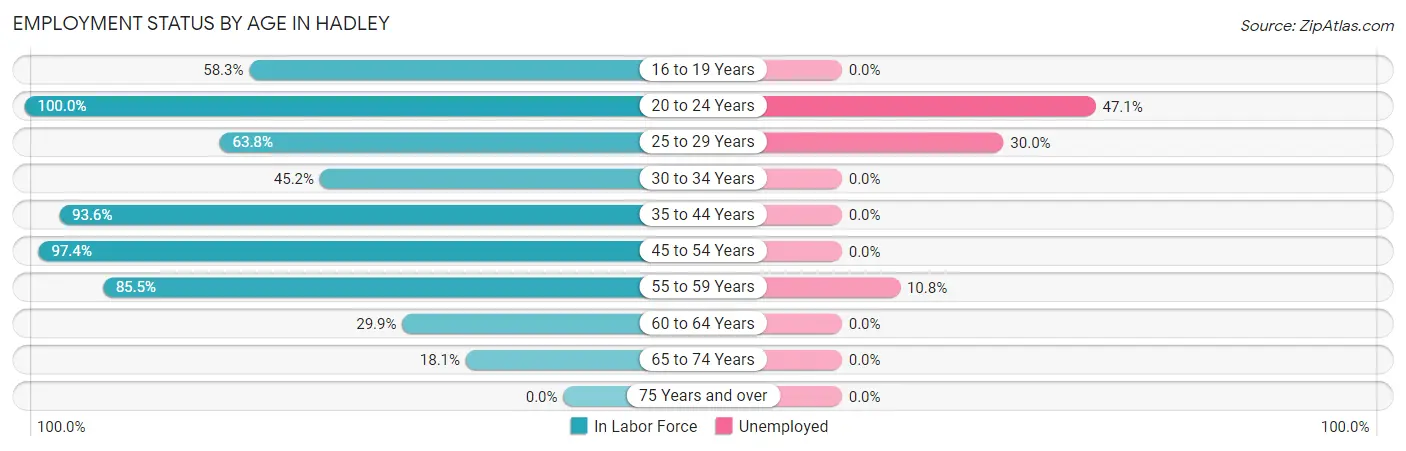
Employment Status by Age in Hadley
According to the labor force statistics for Hadley, out of the total population over 16 years of age (931), 57.6% or 536 individuals are in the labor force, with 6.0% or 32 of them unemployed. The age group with the highest labor force participation rate is 20 to 24 years, with 100.0% or 34 individuals in the labor force. Within the labor force, the 20 to 24 years age range has the highest percentage of unemployed individuals, with 47.1% or 16 of them being unemployed.
| Age Bracket | In Labor Force | Unemployed |
| 16 to 19 Years | 35 (58.3%) | 0 (0.0%) |
| 20 to 24 Years | 34 (100.0%) | 16 (47.1%) |
| 25 to 29 Years | 30 (63.8%) | 9 (30.0%) |
| 30 to 34 Years | 14 (45.2%) | 0 (0.0%) |
| 35 to 44 Years | 160 (93.6%) | 0 (0.0%) |
| 45 to 54 Years | 147 (97.4%) | 0 (0.0%) |
| 55 to 59 Years | 65 (85.5%) | 7 (10.8%) |
| 60 to 64 Years | 20 (29.9%) | 0 (0.0%) |
| 65 to 74 Years | 31 (18.1%) | 0 (0.0%) |
| 75 Years and over | 0 (0.0%) | 0 (0.0%) |
| Total | 536 (57.6%) | 32 (6.0%) |
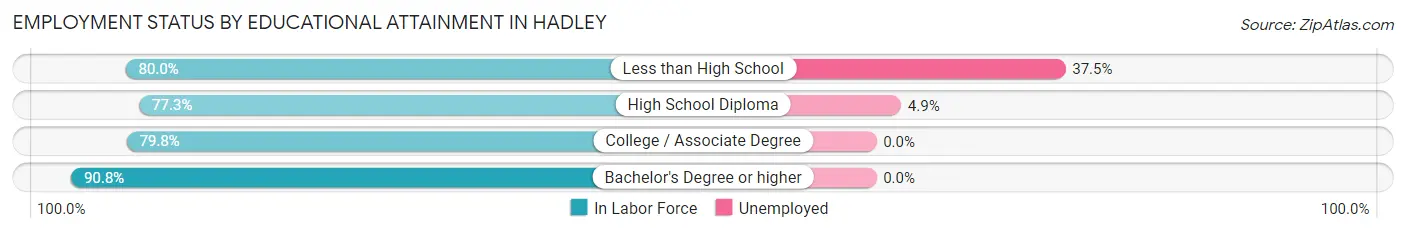
Employment Status by Educational Attainment in Hadley
According to labor force statistics for Hadley, 80.3% of individuals (436) out of the total population between 25 and 64 years of age (543) are in the labor force, with 3.7% or 16 of them being unemployed. The group with the highest labor force participation rate are those with the educational attainment of bachelor's degree or higher, with 90.8% or 59 individuals in the labor force. Within the labor force, individuals with less than high school education have the highest percentage of unemployment, with 37.5% or 9 of them being unemployed.
| Educational Attainment | In Labor Force | Unemployed |
| Less than High School | 24 (80.0%) | 11 (37.5%) |
| High School Diploma | 143 (77.3%) | 9 (4.9%) |
| College / Associate Degree | 210 (79.8%) | 0 (0.0%) |
| Bachelor's Degree or higher | 59 (90.8%) | 0 (0.0%) |
| Total | 436 (80.3%) | 20 (3.7%) |
Employment Occupations by Sex in Hadley
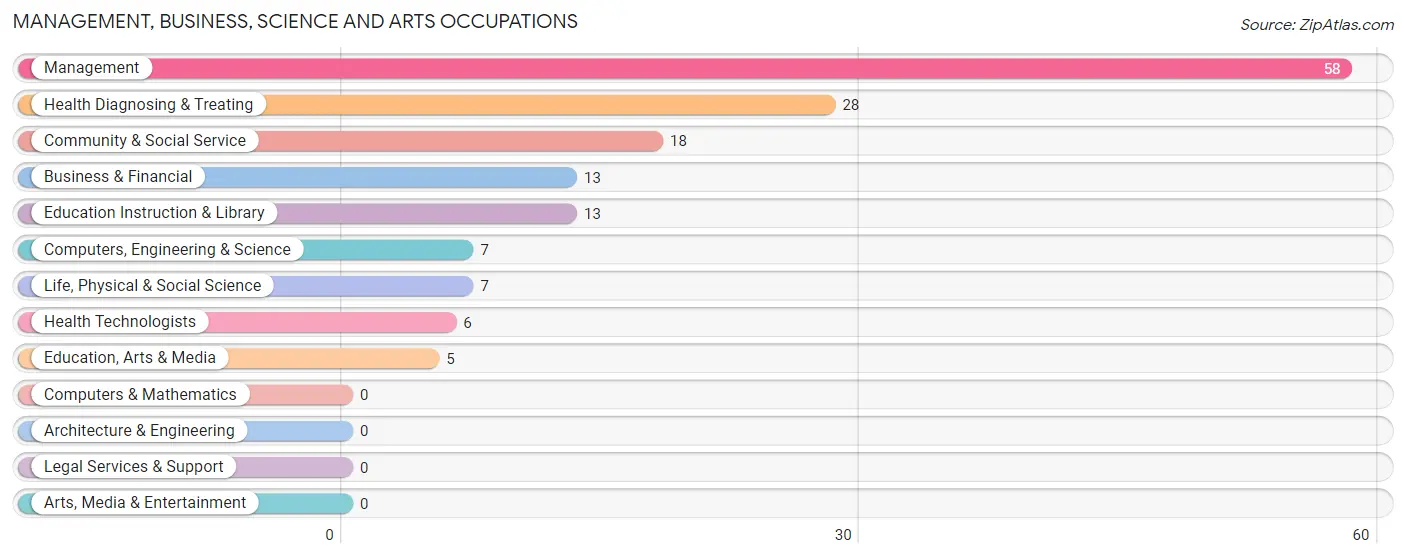
Management, Business, Science and Arts Occupations
The most common Management, Business, Science and Arts occupations in Hadley are Management (58 | 11.5%), Health Diagnosing & Treating (28 | 5.6%), Community & Social Service (18 | 3.6%), Business & Financial (13 | 2.6%), and Education Instruction & Library (13 | 2.6%).
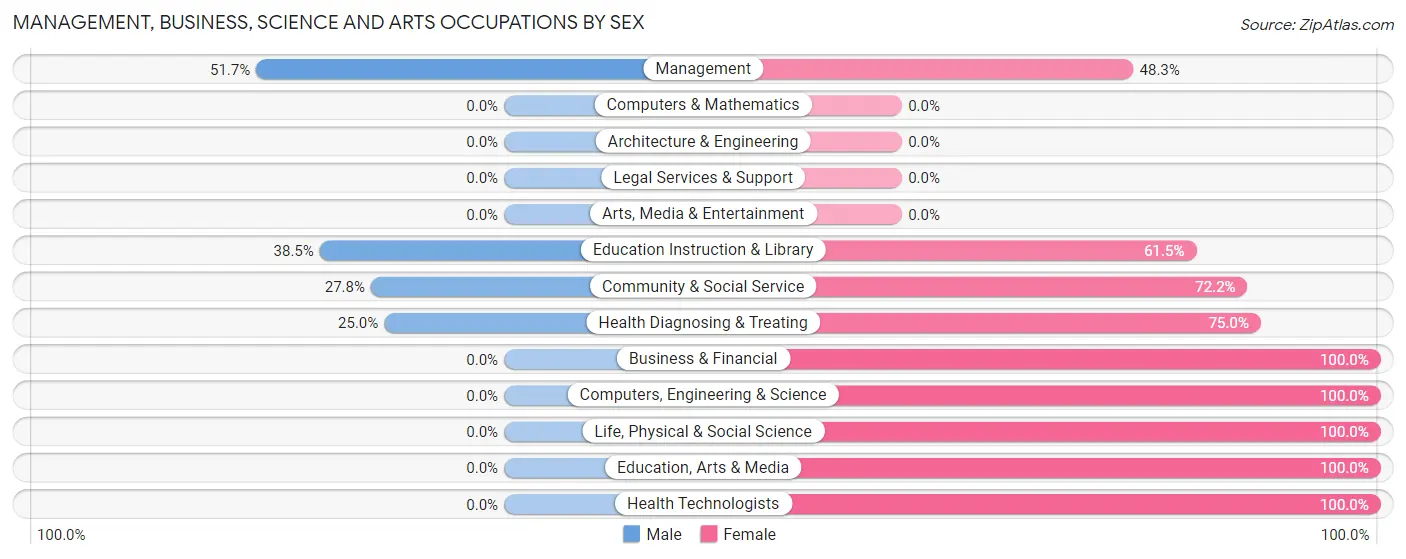
Management, Business, Science and Arts Occupations by Sex
Within the Management, Business, Science and Arts occupations in Hadley, the most male-oriented occupations are Management (51.7%), Education Instruction & Library (38.5%), and Community & Social Service (27.8%), while the most female-oriented occupations are Business & Financial (100.0%), Computers, Engineering & Science (100.0%), and Life, Physical & Social Science (100.0%).
| Occupation | Male | Female |
| Management | 30 (51.7%) | 28 (48.3%) |
| Business & Financial | 0 (0.0%) | 13 (100.0%) |
| Computers, Engineering & Science | 0 (0.0%) | 7 (100.0%) |
| Computers & Mathematics | 0 (0.0%) | 0 (0.0%) |
| Architecture & Engineering | 0 (0.0%) | 0 (0.0%) |
| Life, Physical & Social Science | 0 (0.0%) | 7 (100.0%) |
| Community & Social Service | 5 (27.8%) | 13 (72.2%) |
| Education, Arts & Media | 0 (0.0%) | 5 (100.0%) |
| Legal Services & Support | 0 (0.0%) | 0 (0.0%) |
| Education Instruction & Library | 5 (38.5%) | 8 (61.5%) |
| Arts, Media & Entertainment | 0 (0.0%) | 0 (0.0%) |
| Health Diagnosing & Treating | 7 (25.0%) | 21 (75.0%) |
| Health Technologists | 0 (0.0%) | 6 (100.0%) |
| Total (Category) | 42 (33.9%) | 82 (66.1%) |
| Total (Overall) | 255 (50.6%) | 249 (49.4%) |
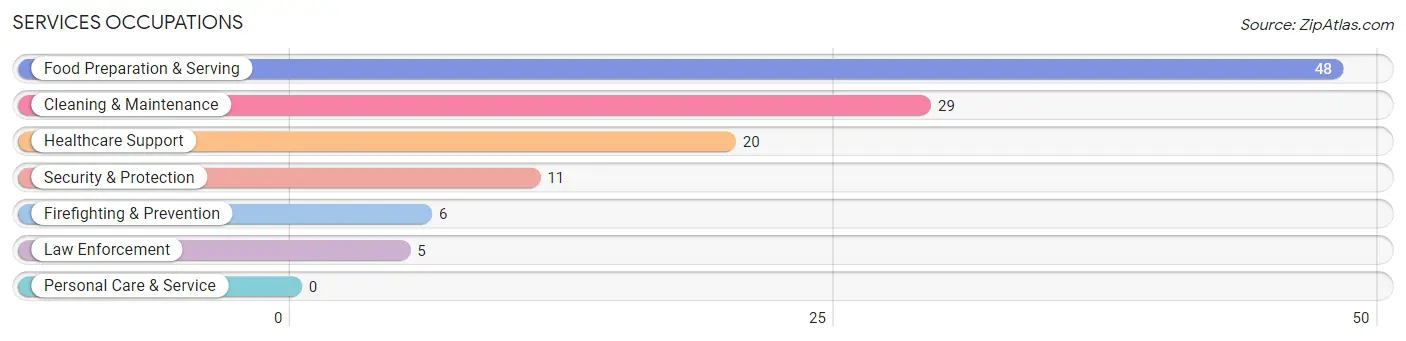
Services Occupations
The most common Services occupations in Hadley are Food Preparation & Serving (48 | 9.5%), Cleaning & Maintenance (29 | 5.8%), Healthcare Support (20 | 4.0%), Security & Protection (11 | 2.2%), and Firefighting & Prevention (6 | 1.2%).
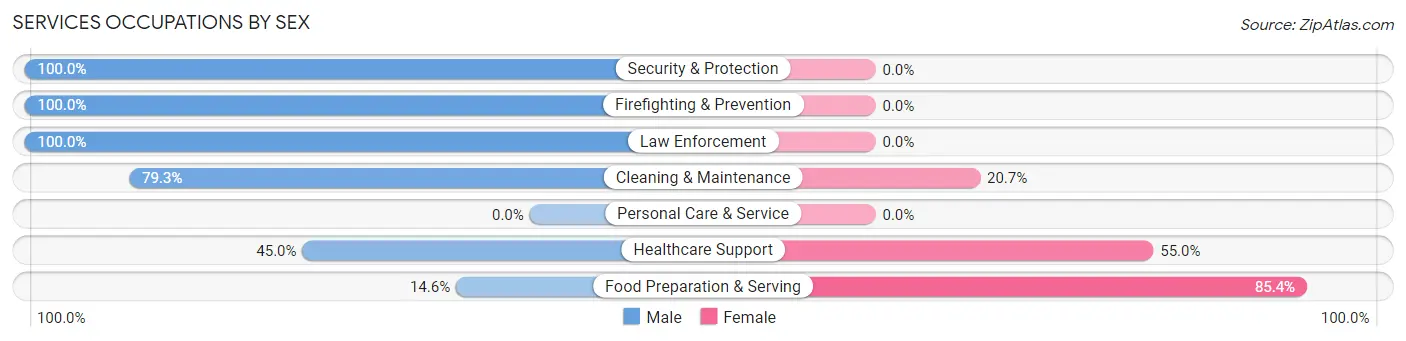
Services Occupations by Sex
Within the Services occupations in Hadley, the most male-oriented occupations are Security & Protection (100.0%), Firefighting & Prevention (100.0%), and Law Enforcement (100.0%), while the most female-oriented occupations are Food Preparation & Serving (85.4%), Healthcare Support (55.0%), and Cleaning & Maintenance (20.7%).
| Occupation | Male | Female |
| Healthcare Support | 9 (45.0%) | 11 (55.0%) |
| Security & Protection | 11 (100.0%) | 0 (0.0%) |
| Firefighting & Prevention | 6 (100.0%) | 0 (0.0%) |
| Law Enforcement | 5 (100.0%) | 0 (0.0%) |
| Food Preparation & Serving | 7 (14.6%) | 41 (85.4%) |
| Cleaning & Maintenance | 23 (79.3%) | 6 (20.7%) |
| Personal Care & Service | 0 (0.0%) | 0 (0.0%) |
| Total (Category) | 50 (46.3%) | 58 (53.7%) |
| Total (Overall) | 255 (50.6%) | 249 (49.4%) |
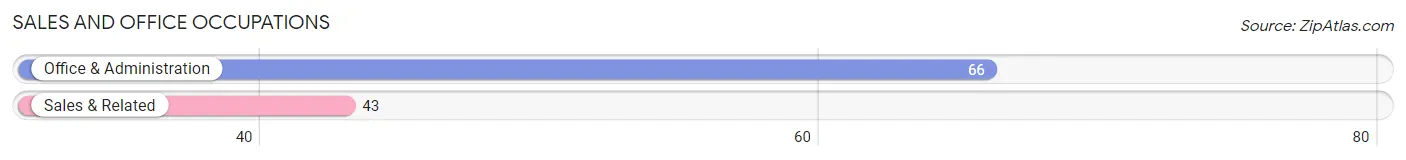
Sales and Office Occupations
The most common Sales and Office occupations in Hadley are Office & Administration (66 | 13.1%), and Sales & Related (43 | 8.5%).
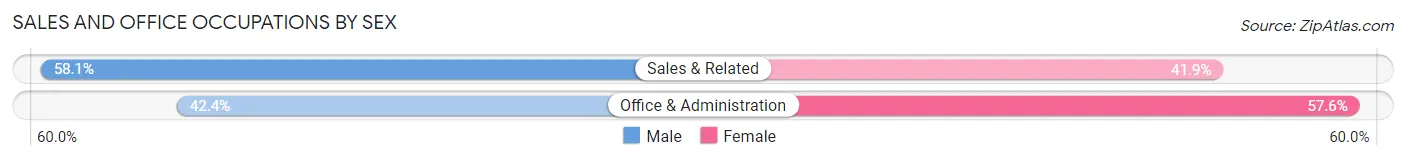
Sales and Office Occupations by Sex
| Occupation | Male | Female |
| Sales & Related | 25 (58.1%) | 18 (41.9%) |
| Office & Administration | 28 (42.4%) | 38 (57.6%) |
| Total (Category) | 53 (48.6%) | 56 (51.4%) |
| Total (Overall) | 255 (50.6%) | 249 (49.4%) |
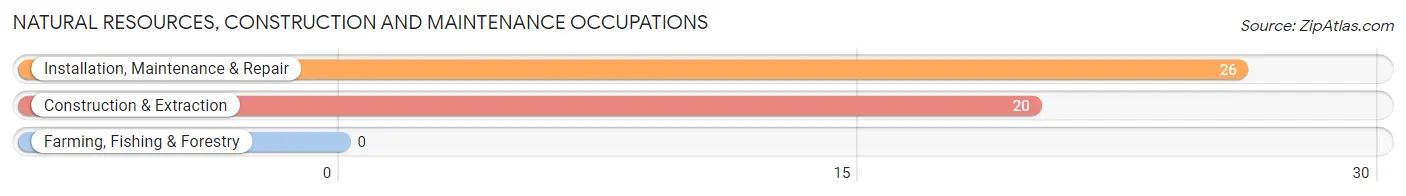
Natural Resources, Construction and Maintenance Occupations
The most common Natural Resources, Construction and Maintenance occupations in Hadley are Installation, Maintenance & Repair (26 | 5.2%), and Construction & Extraction (20 | 4.0%).
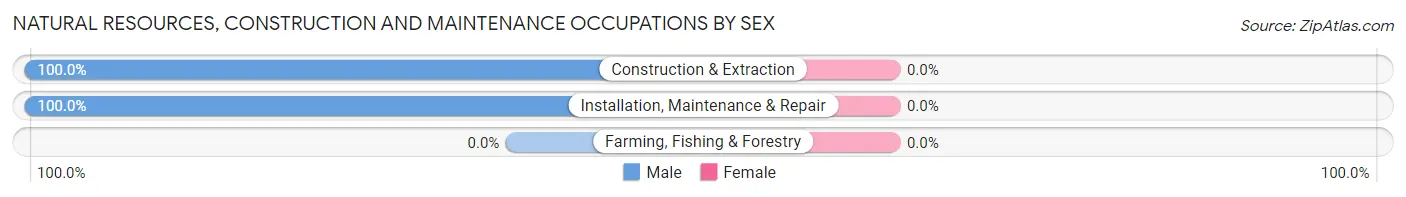
Natural Resources, Construction and Maintenance Occupations by Sex
| Occupation | Male | Female |
| Farming, Fishing & Forestry | 0 (0.0%) | 0 (0.0%) |
| Construction & Extraction | 20 (100.0%) | 0 (0.0%) |
| Installation, Maintenance & Repair | 26 (100.0%) | 0 (0.0%) |
| Total (Category) | 46 (100.0%) | 0 (0.0%) |
| Total (Overall) | 255 (50.6%) | 249 (49.4%) |
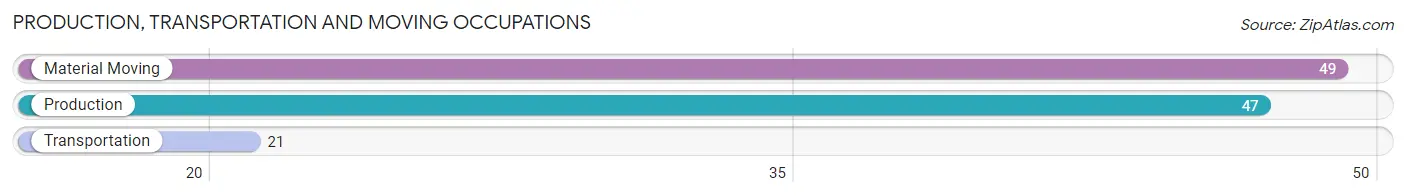
Production, Transportation and Moving Occupations
The most common Production, Transportation and Moving occupations in Hadley are Material Moving (49 | 9.7%), Production (47 | 9.3%), and Transportation (21 | 4.2%).
Production, Transportation and Moving Occupations by Sex
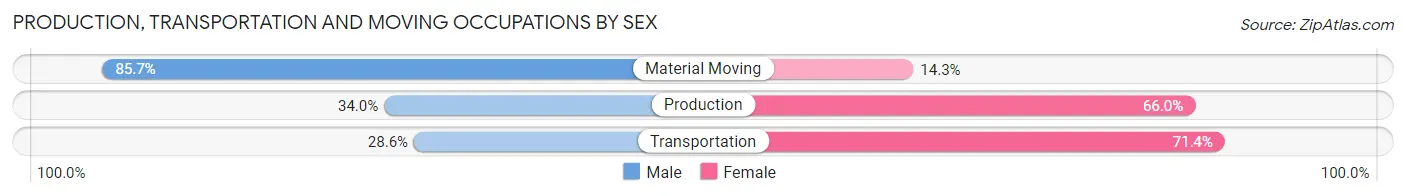
| Occupation | Male | Female |
| Production | 16 (34.0%) | 31 (66.0%) |
| Transportation | 6 (28.6%) | 15 (71.4%) |
| Material Moving | 42 (85.7%) | 7 (14.3%) |
| Total (Category) | 64 (54.7%) | 53 (45.3%) |
| Total (Overall) | 255 (50.6%) | 249 (49.4%) |
Employment Industries by Sex in Hadley
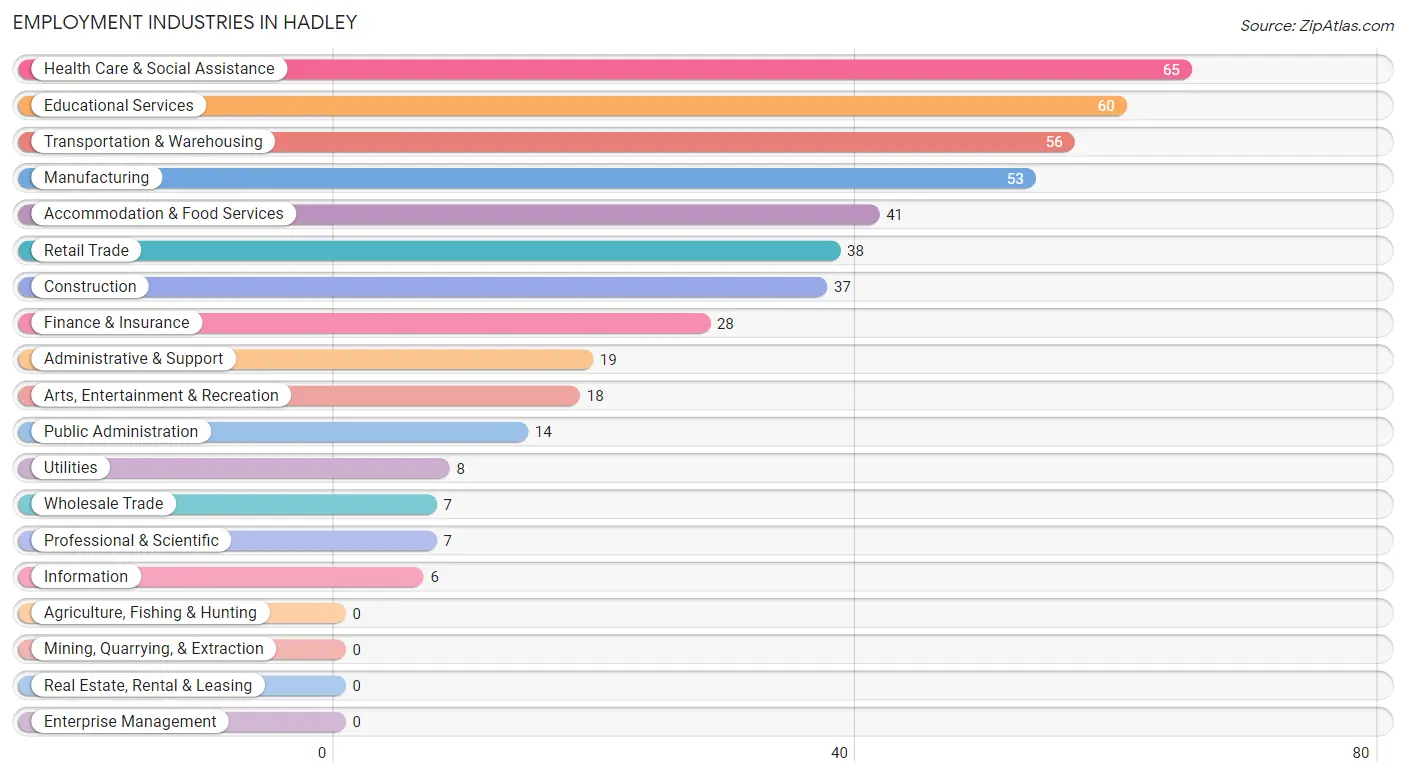
Employment Industries in Hadley
The major employment industries in Hadley include Health Care & Social Assistance (65 | 12.9%), Educational Services (60 | 11.9%), Transportation & Warehousing (56 | 11.1%), Manufacturing (53 | 10.5%), and Accommodation & Food Services (41 | 8.1%).
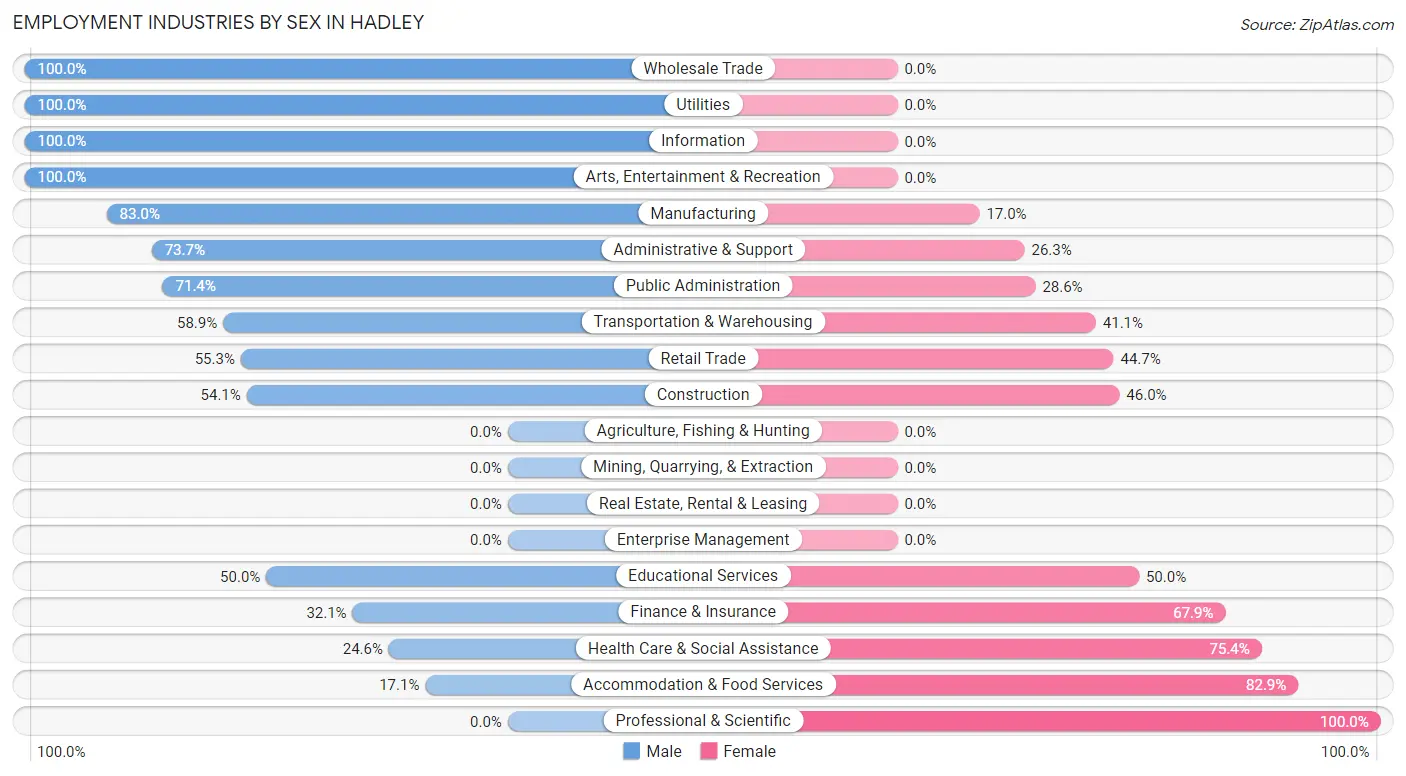
Employment Industries by Sex in Hadley
The Hadley industries that see more men than women are Wholesale Trade (100.0%), Utilities (100.0%), and Information (100.0%), whereas the industries that tend to have a higher number of women are Professional & Scientific (100.0%), Accommodation & Food Services (82.9%), and Health Care & Social Assistance (75.4%).
| Industry | Male | Female |
| Agriculture, Fishing & Hunting | 0 (0.0%) | 0 (0.0%) |
| Mining, Quarrying, & Extraction | 0 (0.0%) | 0 (0.0%) |
| Construction | 20 (54.0%) | 17 (46.0%) |
| Manufacturing | 44 (83.0%) | 9 (17.0%) |
| Wholesale Trade | 7 (100.0%) | 0 (0.0%) |
| Retail Trade | 21 (55.3%) | 17 (44.7%) |
| Transportation & Warehousing | 33 (58.9%) | 23 (41.1%) |
| Utilities | 8 (100.0%) | 0 (0.0%) |
| Information | 6 (100.0%) | 0 (0.0%) |
| Finance & Insurance | 9 (32.1%) | 19 (67.9%) |
| Real Estate, Rental & Leasing | 0 (0.0%) | 0 (0.0%) |
| Professional & Scientific | 0 (0.0%) | 7 (100.0%) |
| Enterprise Management | 0 (0.0%) | 0 (0.0%) |
| Administrative & Support | 14 (73.7%) | 5 (26.3%) |
| Educational Services | 30 (50.0%) | 30 (50.0%) |
| Health Care & Social Assistance | 16 (24.6%) | 49 (75.4%) |
| Arts, Entertainment & Recreation | 18 (100.0%) | 0 (0.0%) |
| Accommodation & Food Services | 7 (17.1%) | 34 (82.9%) |
| Public Administration | 10 (71.4%) | 4 (28.6%) |
| Total | 255 (50.6%) | 249 (49.4%) |
Education in Hadley
School Enrollment in Hadley
The most common levels of schooling among the 139 students in Hadley are high school (46 | 33.1%), middle school (43 | 30.9%), and elementary school (21 | 15.1%).
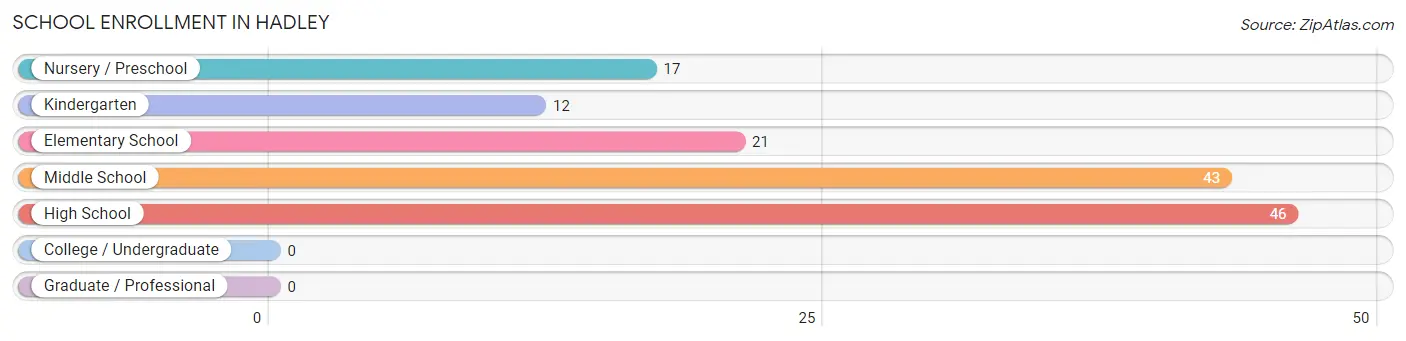
| School Level | # Students | % Students |
| Nursery / Preschool | 17 | 12.2% |
| Kindergarten | 12 | 8.6% |
| Elementary School | 21 | 15.1% |
| Middle School | 43 | 30.9% |
| High School | 46 | 33.1% |
| College / Undergraduate | 0 | 0.0% |
| Graduate / Professional | 0 | 0.0% |
| Total | 139 | 100.0% |
School Enrollment by Age by Funding Source in Hadley
Out of a total of 139 students who are enrolled in schools in Hadley, 16 (11.5%) attend a private institution, while the remaining 123 (88.5%) are enrolled in public schools. The age group of 15 to 17 year olds has the highest likelihood of being enrolled in private schools, with 9 (33.3% in the age bracket) enrolled. Conversely, the age group of 3 to 4 year olds has the lowest likelihood of being enrolled in a private school, with 17 (100.0% in the age bracket) attending a public institution.
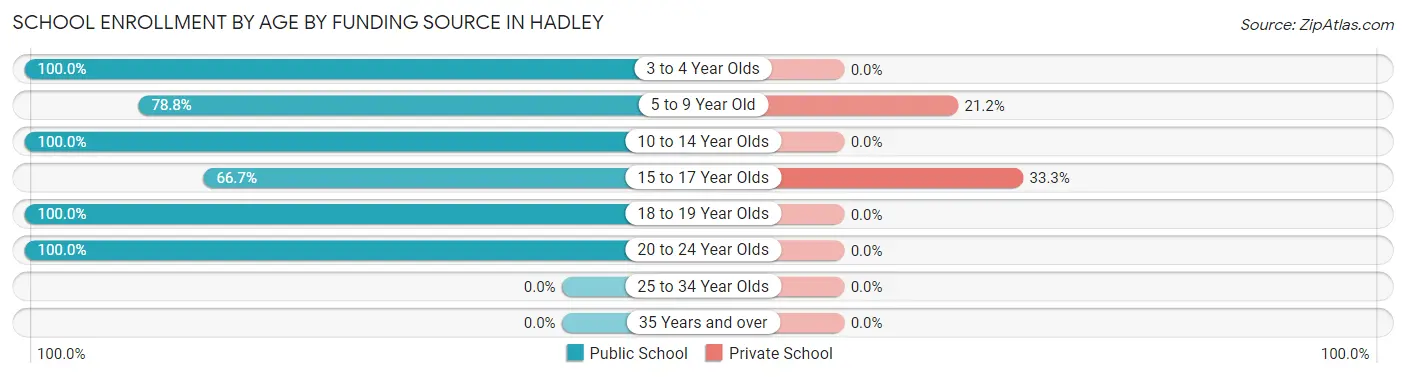
| Age Bracket | Public School | Private School |
| 3 to 4 Year Olds | 17 (100.0%) | 0 (0.0%) |
| 5 to 9 Year Old | 26 (78.8%) | 7 (21.2%) |
| 10 to 14 Year Olds | 43 (100.0%) | 0 (0.0%) |
| 15 to 17 Year Olds | 18 (66.7%) | 9 (33.3%) |
| 18 to 19 Year Olds | 10 (100.0%) | 0 (0.0%) |
| 20 to 24 Year Olds | 9 (100.0%) | 0 (0.0%) |
| 25 to 34 Year Olds | 0 (0.0%) | 0 (0.0%) |
| 35 Years and over | 0 (0.0%) | 0 (0.0%) |
| Total | 123 (88.5%) | 16 (11.5%) |
Educational Attainment by Field of Study in Hadley
Education (48 | 37.2%), physical & health sciences (13 | 10.1%), business (13 | 10.1%), literature & languages (11 | 8.5%), and arts & humanities (11 | 8.5%) are the most common fields of study among 129 individuals in Hadley who have obtained a bachelor's degree or higher.
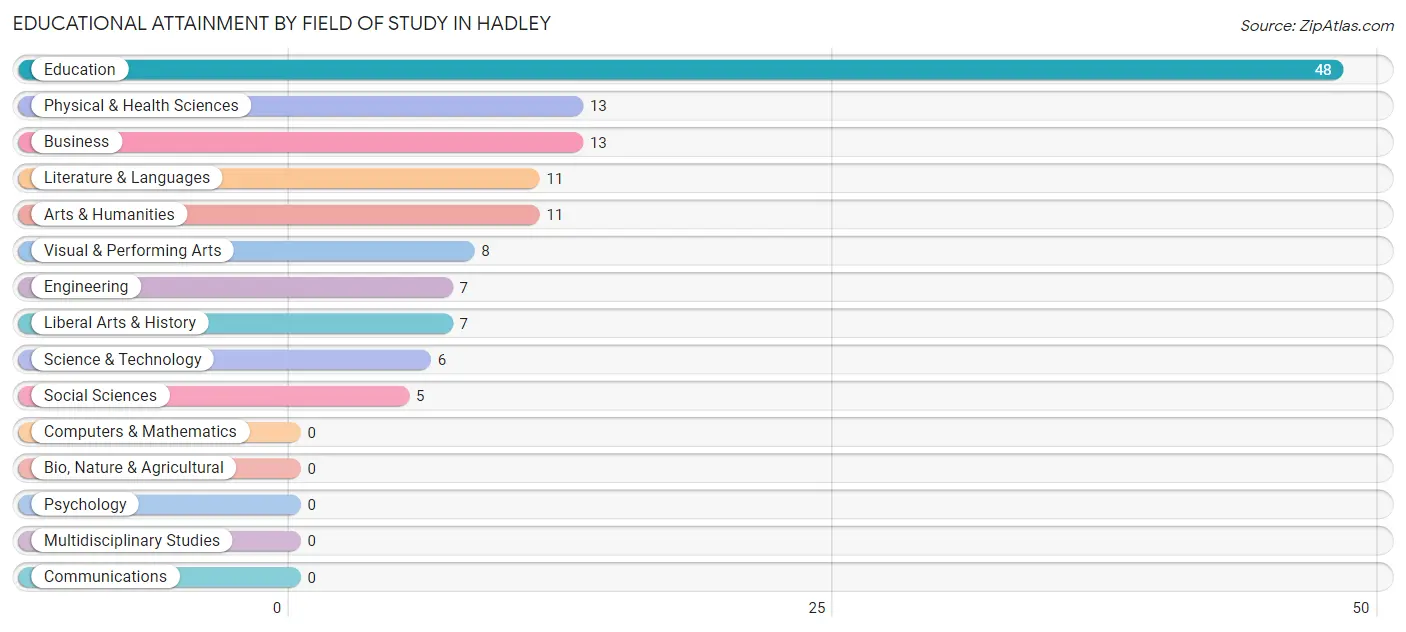
| Field of Study | # Graduates | % Graduates |
| Computers & Mathematics | 0 | 0.0% |
| Bio, Nature & Agricultural | 0 | 0.0% |
| Physical & Health Sciences | 13 | 10.1% |
| Psychology | 0 | 0.0% |
| Social Sciences | 5 | 3.9% |
| Engineering | 7 | 5.4% |
| Multidisciplinary Studies | 0 | 0.0% |
| Science & Technology | 6 | 4.6% |
| Business | 13 | 10.1% |
| Education | 48 | 37.2% |
| Literature & Languages | 11 | 8.5% |
| Liberal Arts & History | 7 | 5.4% |
| Visual & Performing Arts | 8 | 6.2% |
| Communications | 0 | 0.0% |
| Arts & Humanities | 11 | 8.5% |
| Total | 129 | 100.0% |
Transportation & Commute in Hadley
Vehicle Availability by Sex in Hadley
The most prevalent vehicle ownership categories in Hadley are males with 2 vehicles (83, accounting for 33.1%) and females with 2 vehicles (53, making up 35.2%).
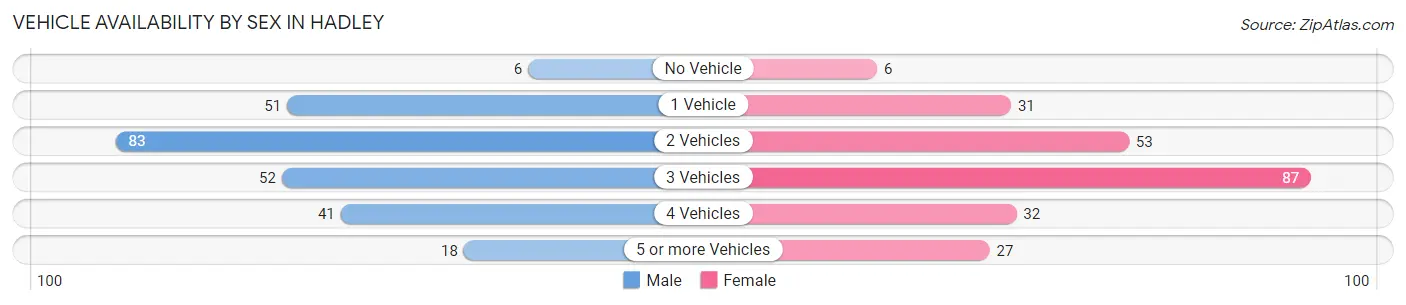
| Vehicles Available | Male | Female |
| No Vehicle | 6 (2.4%) | 6 (2.5%) |
| 1 Vehicle | 51 (20.3%) | 31 (13.1%) |
| 2 Vehicles | 83 (33.1%) | 53 (22.5%) |
| 3 Vehicles | 52 (20.7%) | 87 (36.9%) |
| 4 Vehicles | 41 (16.3%) | 32 (13.6%) |
| 5 or more Vehicles | 18 (7.2%) | 27 (11.4%) |
| Total | 251 (100.0%) | 236 (100.0%) |
Commute Time in Hadley
The most frequently occuring commute durations in Hadley are 30 to 34 minutes (83 commuters, 18.5%), 20 to 24 minutes (55 commuters, 12.3%), and 35 to 39 minutes (53 commuters, 11.8%).
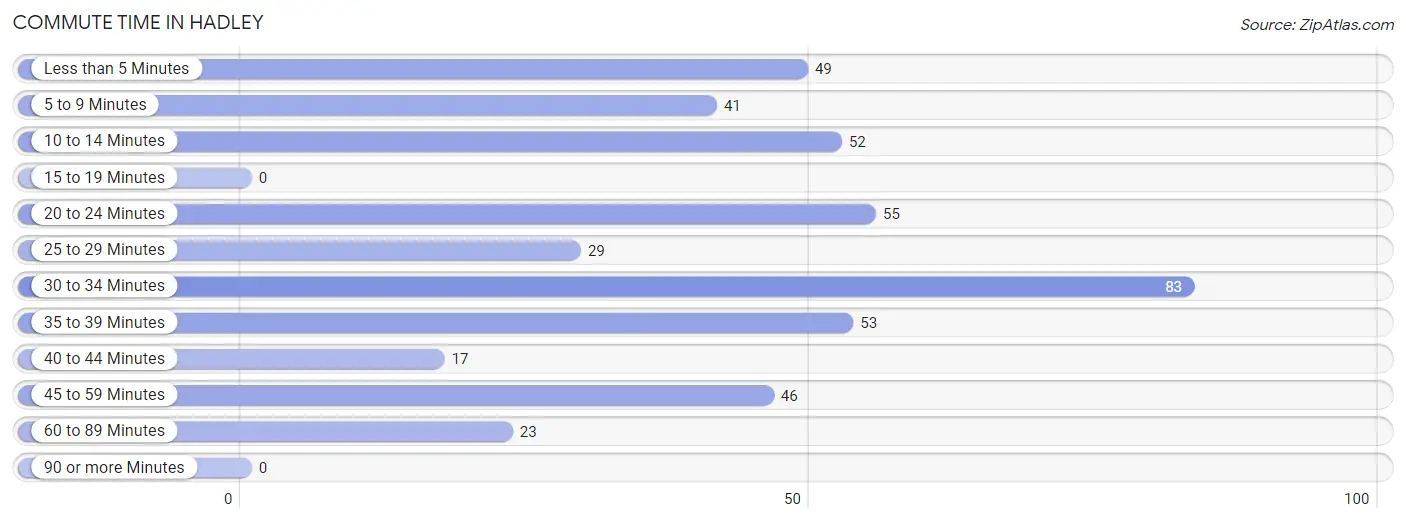
| Commute Time | # Commuters | % Commuters |
| Less than 5 Minutes | 49 | 10.9% |
| 5 to 9 Minutes | 41 | 9.1% |
| 10 to 14 Minutes | 52 | 11.6% |
| 15 to 19 Minutes | 0 | 0.0% |
| 20 to 24 Minutes | 55 | 12.3% |
| 25 to 29 Minutes | 29 | 6.5% |
| 30 to 34 Minutes | 83 | 18.5% |
| 35 to 39 Minutes | 53 | 11.8% |
| 40 to 44 Minutes | 17 | 3.8% |
| 45 to 59 Minutes | 46 | 10.3% |
| 60 to 89 Minutes | 23 | 5.1% |
| 90 or more Minutes | 0 | 0.0% |
Commute Time by Sex in Hadley
The most common commute times in Hadley are 30 to 34 minutes (57 commuters, 24.8%) for males and less than 5 minutes (44 commuters, 20.2%) for females.
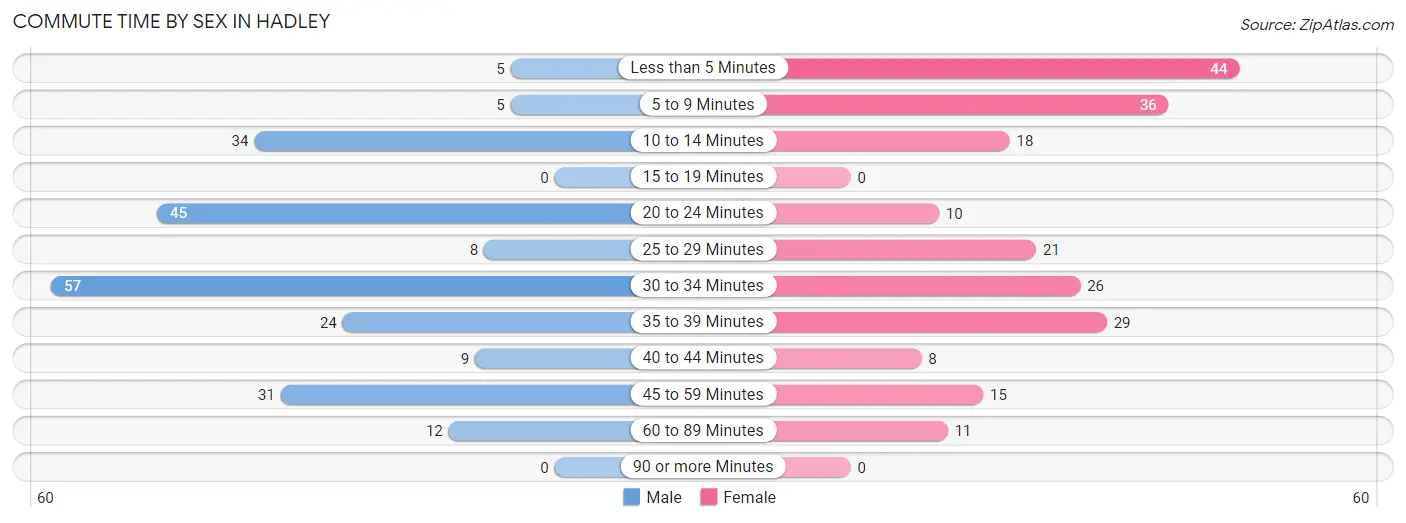
| Commute Time | Male | Female |
| Less than 5 Minutes | 5 (2.2%) | 44 (20.2%) |
| 5 to 9 Minutes | 5 (2.2%) | 36 (16.5%) |
| 10 to 14 Minutes | 34 (14.8%) | 18 (8.3%) |
| 15 to 19 Minutes | 0 (0.0%) | 0 (0.0%) |
| 20 to 24 Minutes | 45 (19.6%) | 10 (4.6%) |
| 25 to 29 Minutes | 8 (3.5%) | 21 (9.6%) |
| 30 to 34 Minutes | 57 (24.8%) | 26 (11.9%) |
| 35 to 39 Minutes | 24 (10.4%) | 29 (13.3%) |
| 40 to 44 Minutes | 9 (3.9%) | 8 (3.7%) |
| 45 to 59 Minutes | 31 (13.5%) | 15 (6.9%) |
| 60 to 89 Minutes | 12 (5.2%) | 11 (5.1%) |
| 90 or more Minutes | 0 (0.0%) | 0 (0.0%) |
Time of Departure to Work by Sex in Hadley
The most frequent times of departure to work in Hadley are 5:30 AM to 5:59 AM (51, 22.2%) for males and 12:00 PM to 3:59 PM (44, 20.2%) for females.
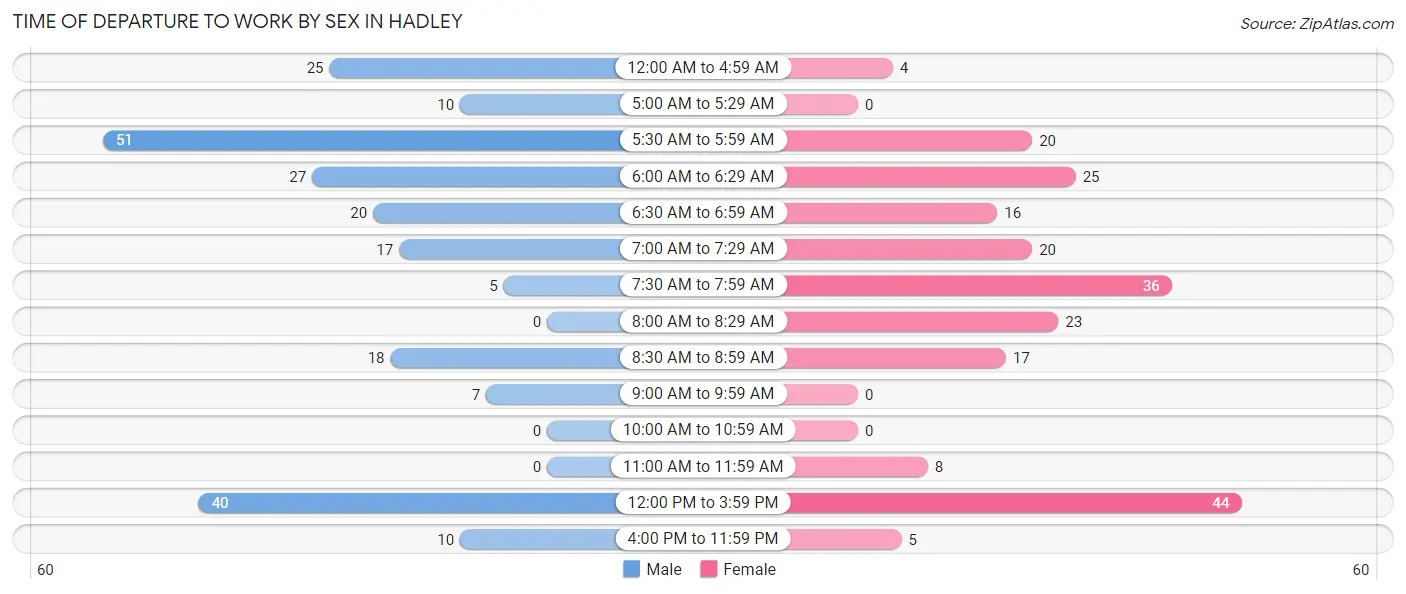
| Time of Departure | Male | Female |
| 12:00 AM to 4:59 AM | 25 (10.9%) | 4 (1.8%) |
| 5:00 AM to 5:29 AM | 10 (4.3%) | 0 (0.0%) |
| 5:30 AM to 5:59 AM | 51 (22.2%) | 20 (9.2%) |
| 6:00 AM to 6:29 AM | 27 (11.7%) | 25 (11.5%) |
| 6:30 AM to 6:59 AM | 20 (8.7%) | 16 (7.3%) |
| 7:00 AM to 7:29 AM | 17 (7.4%) | 20 (9.2%) |
| 7:30 AM to 7:59 AM | 5 (2.2%) | 36 (16.5%) |
| 8:00 AM to 8:29 AM | 0 (0.0%) | 23 (10.5%) |
| 8:30 AM to 8:59 AM | 18 (7.8%) | 17 (7.8%) |
| 9:00 AM to 9:59 AM | 7 (3.0%) | 0 (0.0%) |
| 10:00 AM to 10:59 AM | 0 (0.0%) | 0 (0.0%) |
| 11:00 AM to 11:59 AM | 0 (0.0%) | 8 (3.7%) |
| 12:00 PM to 3:59 PM | 40 (17.4%) | 44 (20.2%) |
| 4:00 PM to 11:59 PM | 10 (4.3%) | 5 (2.3%) |
| Total | 230 (100.0%) | 218 (100.0%) |
Housing Occupancy in Hadley
Occupancy by Ownership in Hadley
Of the total 429 dwellings in Hadley, owner-occupied units account for 305 (71.1%), while renter-occupied units make up 124 (28.9%).
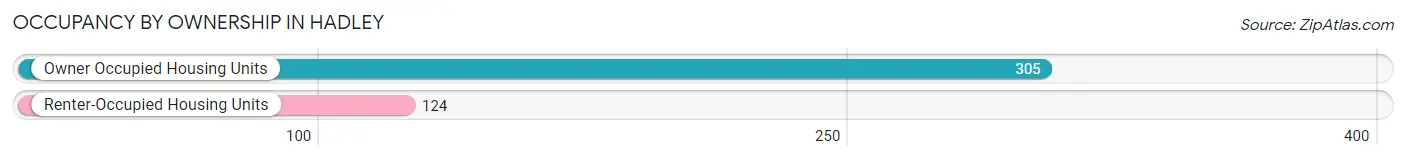
| Occupancy | # Housing Units | % Housing Units |
| Owner Occupied Housing Units | 305 | 71.1% |
| Renter-Occupied Housing Units | 124 | 28.9% |
| Total Occupied Housing Units | 429 | 100.0% |
Occupancy by Household Size in Hadley
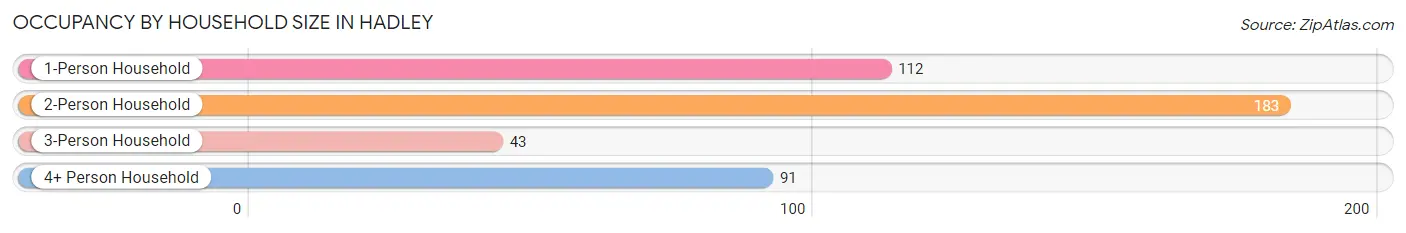
| Household Size | # Housing Units | % Housing Units |
| 1-Person Household | 112 | 26.1% |
| 2-Person Household | 183 | 42.7% |
| 3-Person Household | 43 | 10.0% |
| 4+ Person Household | 91 | 21.2% |
| Total Housing Units | 429 | 100.0% |
Occupancy by Ownership by Household Size in Hadley
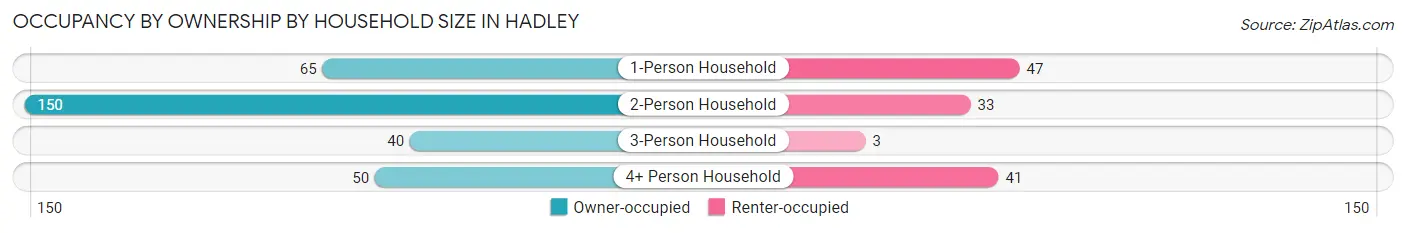
| Household Size | Owner-occupied | Renter-occupied |
| 1-Person Household | 65 (58.0%) | 47 (42.0%) |
| 2-Person Household | 150 (82.0%) | 33 (18.0%) |
| 3-Person Household | 40 (93.0%) | 3 (7.0%) |
| 4+ Person Household | 50 (54.9%) | 41 (45.1%) |
| Total Housing Units | 305 (71.1%) | 124 (28.9%) |
Occupancy by Educational Attainment in Hadley
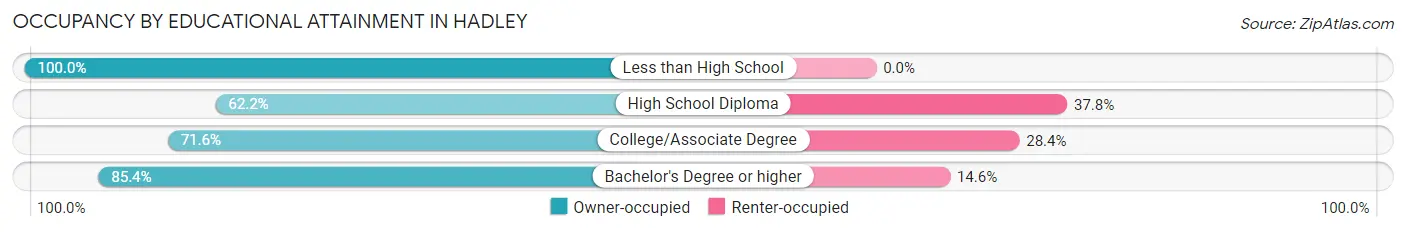
| Household Size | Owner-occupied | Renter-occupied |
| Less than High School | 14 (100.0%) | 0 (0.0%) |
| High School Diploma | 115 (62.2%) | 70 (37.8%) |
| College/Associate Degree | 106 (71.6%) | 42 (28.4%) |
| Bachelor's Degree or higher | 70 (85.4%) | 12 (14.6%) |
Occupancy by Age of Householder in Hadley
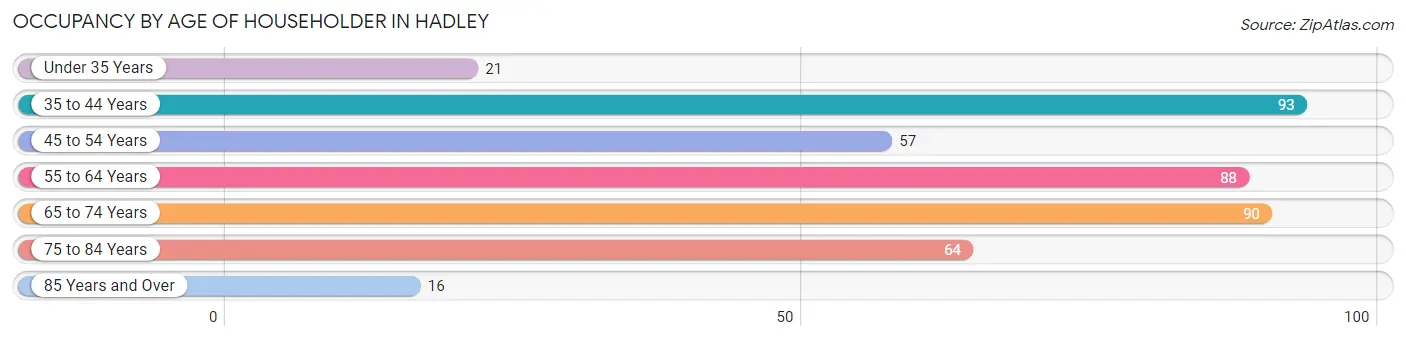
| Age Bracket | # Households | % Households |
| Under 35 Years | 21 | 4.9% |
| 35 to 44 Years | 93 | 21.7% |
| 45 to 54 Years | 57 | 13.3% |
| 55 to 64 Years | 88 | 20.5% |
| 65 to 74 Years | 90 | 21.0% |
| 75 to 84 Years | 64 | 14.9% |
| 85 Years and Over | 16 | 3.7% |
| Total | 429 | 100.0% |
Housing Finances in Hadley
Median Income by Occupancy in Hadley
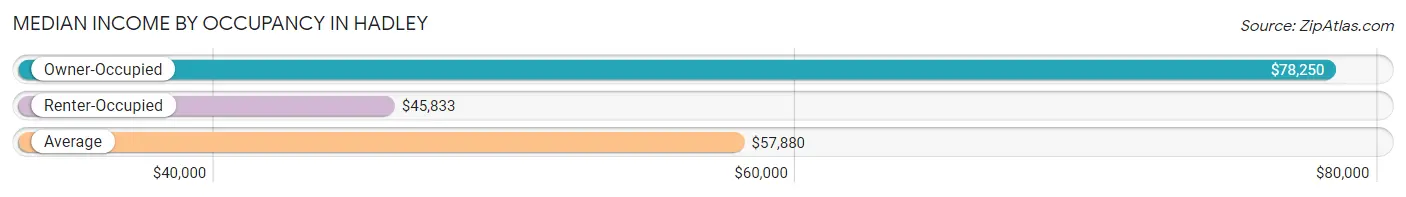
| Occupancy Type | # Households | Median Income |
| Owner-Occupied | 305 (71.1%) | $78,250 |
| Renter-Occupied | 124 (28.9%) | $45,833 |
| Average | 429 (100.0%) | $57,880 |
Occupancy by Householder Income Bracket in Hadley
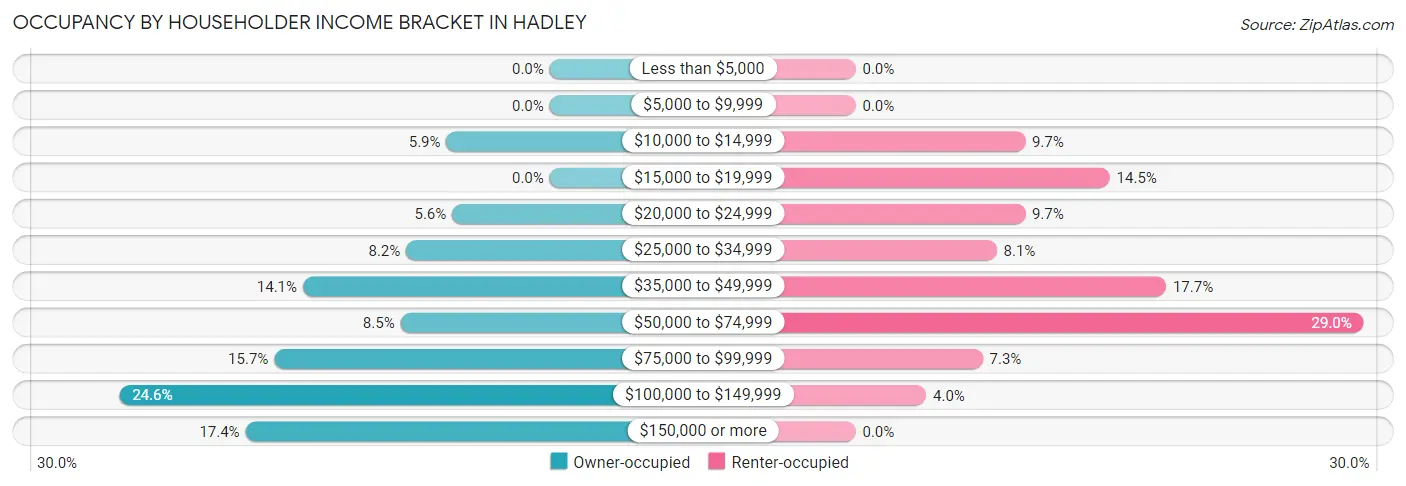
| Income Bracket | Owner-occupied | Renter-occupied |
| Less than $5,000 | 0 (0.0%) | 0 (0.0%) |
| $5,000 to $9,999 | 0 (0.0%) | 0 (0.0%) |
| $10,000 to $14,999 | 18 (5.9%) | 12 (9.7%) |
| $15,000 to $19,999 | 0 (0.0%) | 18 (14.5%) |
| $20,000 to $24,999 | 17 (5.6%) | 12 (9.7%) |
| $25,000 to $34,999 | 25 (8.2%) | 10 (8.1%) |
| $35,000 to $49,999 | 43 (14.1%) | 22 (17.7%) |
| $50,000 to $74,999 | 26 (8.5%) | 36 (29.0%) |
| $75,000 to $99,999 | 48 (15.7%) | 9 (7.3%) |
| $100,000 to $149,999 | 75 (24.6%) | 5 (4.0%) |
| $150,000 or more | 53 (17.4%) | 0 (0.0%) |
| Total | 305 (100.0%) | 124 (100.0%) |
Monthly Housing Cost Tiers in Hadley
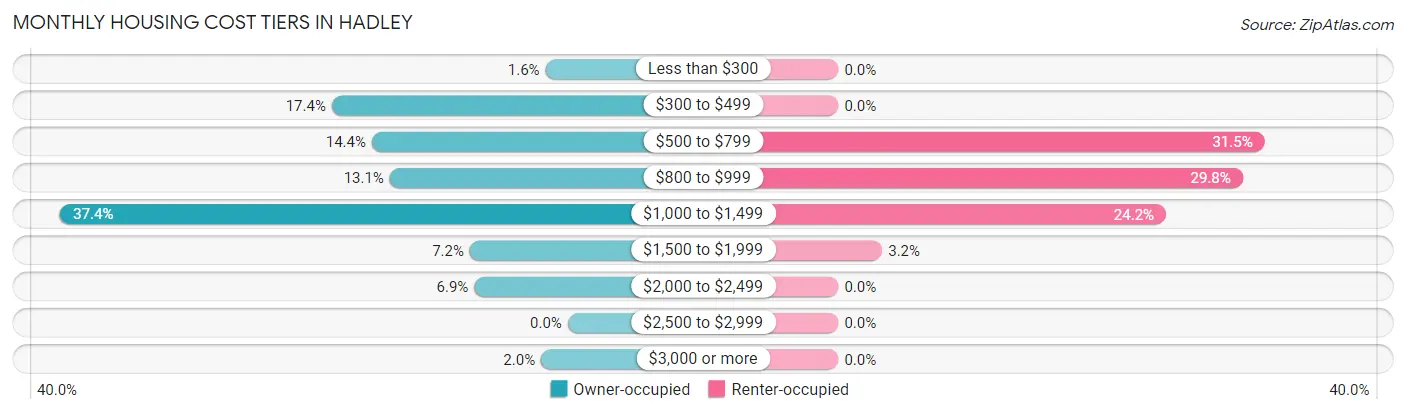
| Monthly Cost | Owner-occupied | Renter-occupied |
| Less than $300 | 5 (1.6%) | 0 (0.0%) |
| $300 to $499 | 53 (17.4%) | 0 (0.0%) |
| $500 to $799 | 44 (14.4%) | 39 (31.5%) |
| $800 to $999 | 40 (13.1%) | 37 (29.8%) |
| $1,000 to $1,499 | 114 (37.4%) | 30 (24.2%) |
| $1,500 to $1,999 | 22 (7.2%) | 4 (3.2%) |
| $2,000 to $2,499 | 21 (6.9%) | 0 (0.0%) |
| $2,500 to $2,999 | 0 (0.0%) | 0 (0.0%) |
| $3,000 or more | 6 (2.0%) | 0 (0.0%) |
| Total | 305 (100.0%) | 124 (100.0%) |
Physical Housing Characteristics in Hadley
Housing Structures in Hadley
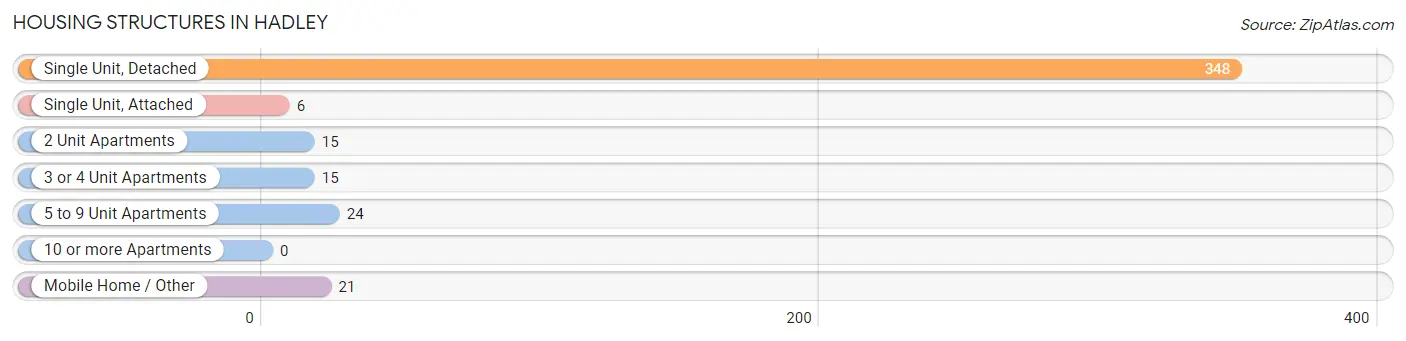
| Structure Type | # Housing Units | % Housing Units |
| Single Unit, Detached | 348 | 81.1% |
| Single Unit, Attached | 6 | 1.4% |
| 2 Unit Apartments | 15 | 3.5% |
| 3 or 4 Unit Apartments | 15 | 3.5% |
| 5 to 9 Unit Apartments | 24 | 5.6% |
| 10 or more Apartments | 0 | 0.0% |
| Mobile Home / Other | 21 | 4.9% |
| Total | 429 | 100.0% |
Housing Structures by Occupancy in Hadley
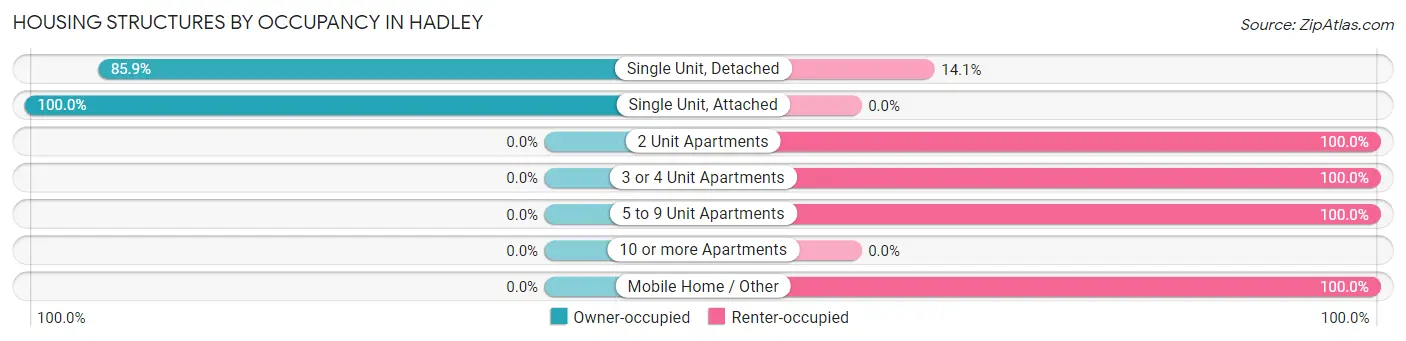
| Structure Type | Owner-occupied | Renter-occupied |
| Single Unit, Detached | 299 (85.9%) | 49 (14.1%) |
| Single Unit, Attached | 6 (100.0%) | 0 (0.0%) |
| 2 Unit Apartments | 0 (0.0%) | 15 (100.0%) |
| 3 or 4 Unit Apartments | 0 (0.0%) | 15 (100.0%) |
| 5 to 9 Unit Apartments | 0 (0.0%) | 24 (100.0%) |
| 10 or more Apartments | 0 (0.0%) | 0 (0.0%) |
| Mobile Home / Other | 0 (0.0%) | 21 (100.0%) |
| Total | 305 (71.1%) | 124 (28.9%) |
Housing Structures by Number of Rooms in Hadley
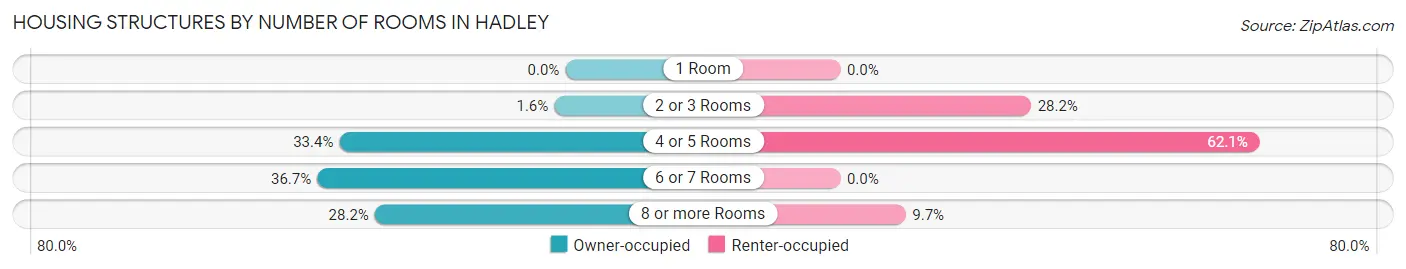
| Number of Rooms | Owner-occupied | Renter-occupied |
| 1 Room | 0 (0.0%) | 0 (0.0%) |
| 2 or 3 Rooms | 5 (1.6%) | 35 (28.2%) |
| 4 or 5 Rooms | 102 (33.4%) | 77 (62.1%) |
| 6 or 7 Rooms | 112 (36.7%) | 0 (0.0%) |
| 8 or more Rooms | 86 (28.2%) | 12 (9.7%) |
| Total | 305 (100.0%) | 124 (100.0%) |
Housing Structure by Heating Type in Hadley
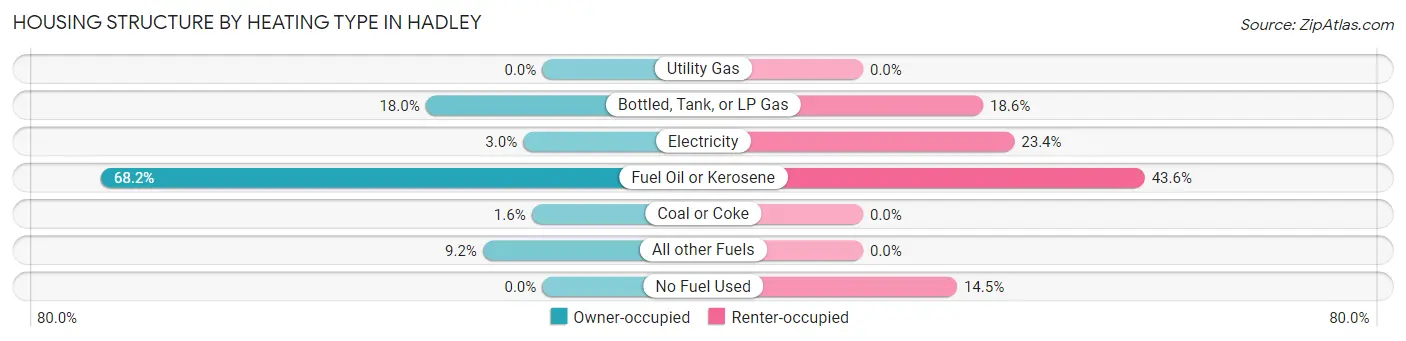
| Heating Type | Owner-occupied | Renter-occupied |
| Utility Gas | 0 (0.0%) | 0 (0.0%) |
| Bottled, Tank, or LP Gas | 55 (18.0%) | 23 (18.5%) |
| Electricity | 9 (2.9%) | 29 (23.4%) |
| Fuel Oil or Kerosene | 208 (68.2%) | 54 (43.5%) |
| Coal or Coke | 5 (1.6%) | 0 (0.0%) |
| All other Fuels | 28 (9.2%) | 0 (0.0%) |
| No Fuel Used | 0 (0.0%) | 18 (14.5%) |
| Total | 305 (100.0%) | 124 (100.0%) |
Household Vehicle Usage in Hadley
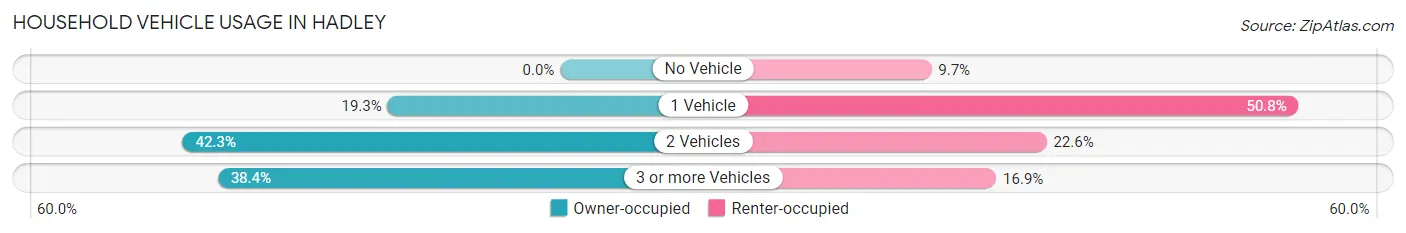
| Vehicles per Household | Owner-occupied | Renter-occupied |
| No Vehicle | 0 (0.0%) | 12 (9.7%) |
| 1 Vehicle | 59 (19.3%) | 63 (50.8%) |
| 2 Vehicles | 129 (42.3%) | 28 (22.6%) |
| 3 or more Vehicles | 117 (38.4%) | 21 (16.9%) |
| Total | 305 (100.0%) | 124 (100.0%) |
Real Estate & Mortgages in Hadley
Real Estate and Mortgage Overview in Hadley
| Characteristic | Without Mortgage | With Mortgage |
| Housing Units | 124 | 181 |
| Median Property Value | $191,300 | $193,200 |
| Median Household Income | $48,864 | $48 |
| Monthly Housing Costs | $533 | $6 |
| Real Estate Taxes | $1,864 | $8 |
Property Value by Mortgage Status in Hadley
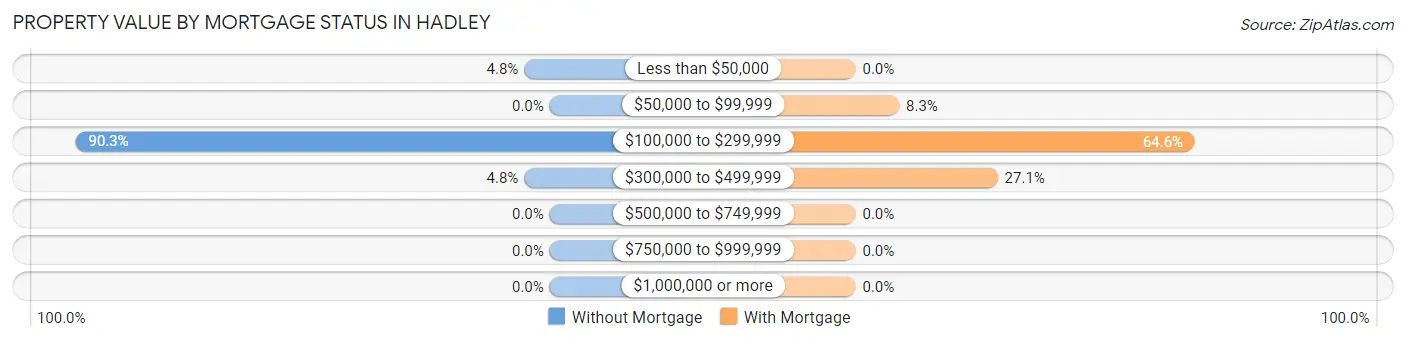
| Property Value | Without Mortgage | With Mortgage |
| Less than $50,000 | 6 (4.8%) | 0 (0.0%) |
| $50,000 to $99,999 | 0 (0.0%) | 15 (8.3%) |
| $100,000 to $299,999 | 112 (90.3%) | 117 (64.6%) |
| $300,000 to $499,999 | 6 (4.8%) | 49 (27.1%) |
| $500,000 to $749,999 | 0 (0.0%) | 0 (0.0%) |
| $750,000 to $999,999 | 0 (0.0%) | 0 (0.0%) |
| $1,000,000 or more | 0 (0.0%) | 0 (0.0%) |
| Total | 124 (100.0%) | 181 (100.0%) |
Household Income by Mortgage Status in Hadley
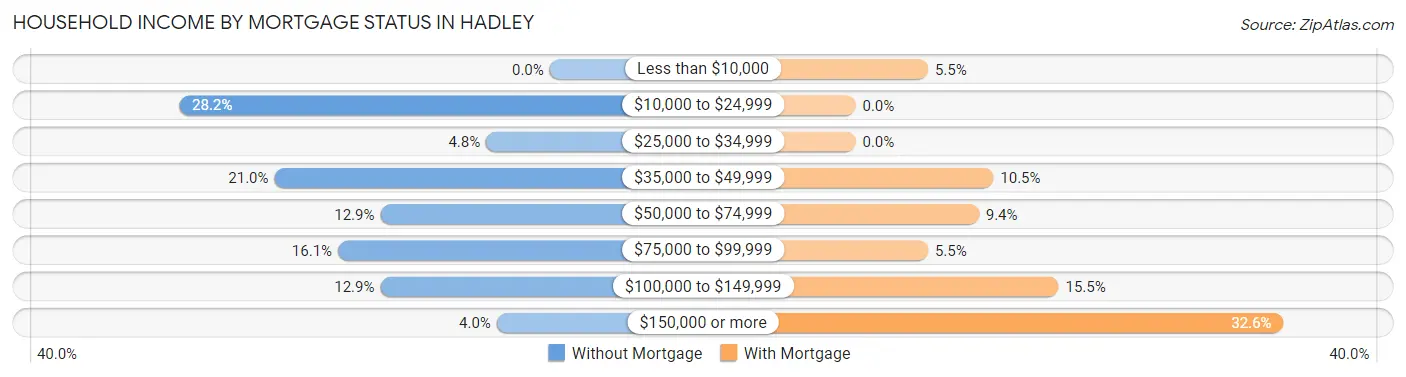
| Household Income | Without Mortgage | With Mortgage |
| Less than $10,000 | 0 (0.0%) | 10 (5.5%) |
| $10,000 to $24,999 | 35 (28.2%) | 0 (0.0%) |
| $25,000 to $34,999 | 6 (4.8%) | 0 (0.0%) |
| $35,000 to $49,999 | 26 (21.0%) | 19 (10.5%) |
| $50,000 to $74,999 | 16 (12.9%) | 17 (9.4%) |
| $75,000 to $99,999 | 20 (16.1%) | 10 (5.5%) |
| $100,000 to $149,999 | 16 (12.9%) | 28 (15.5%) |
| $150,000 or more | 5 (4.0%) | 59 (32.6%) |
| Total | 124 (100.0%) | 181 (100.0%) |
Property Value to Household Income Ratio in Hadley
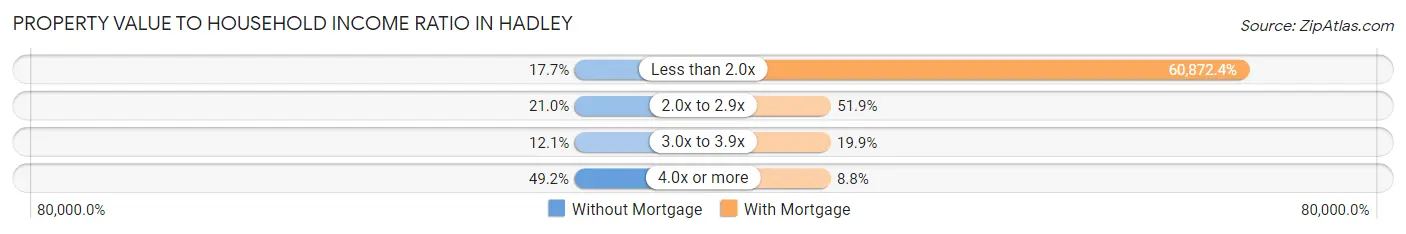
| Value-to-Income Ratio | Without Mortgage | With Mortgage |
| Less than 2.0x | 22 (17.7%) | 110,179 (60,872.4%) |
| 2.0x to 2.9x | 26 (21.0%) | 94 (51.9%) |
| 3.0x to 3.9x | 15 (12.1%) | 36 (19.9%) |
| 4.0x or more | 61 (49.2%) | 16 (8.8%) |
| Total | 124 (100.0%) | 181 (100.0%) |
Real Estate Taxes by Mortgage Status in Hadley
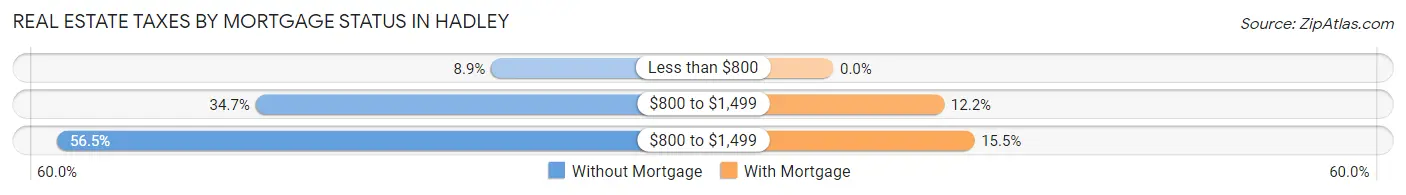
| Property Taxes | Without Mortgage | With Mortgage |
| Less than $800 | 11 (8.9%) | 0 (0.0%) |
| $800 to $1,499 | 43 (34.7%) | 22 (12.1%) |
| $800 to $1,499 | 70 (56.5%) | 28 (15.5%) |
| Total | 124 (100.0%) | 181 (100.0%) |
Health & Disability in Hadley
Health Insurance Coverage by Age in Hadley
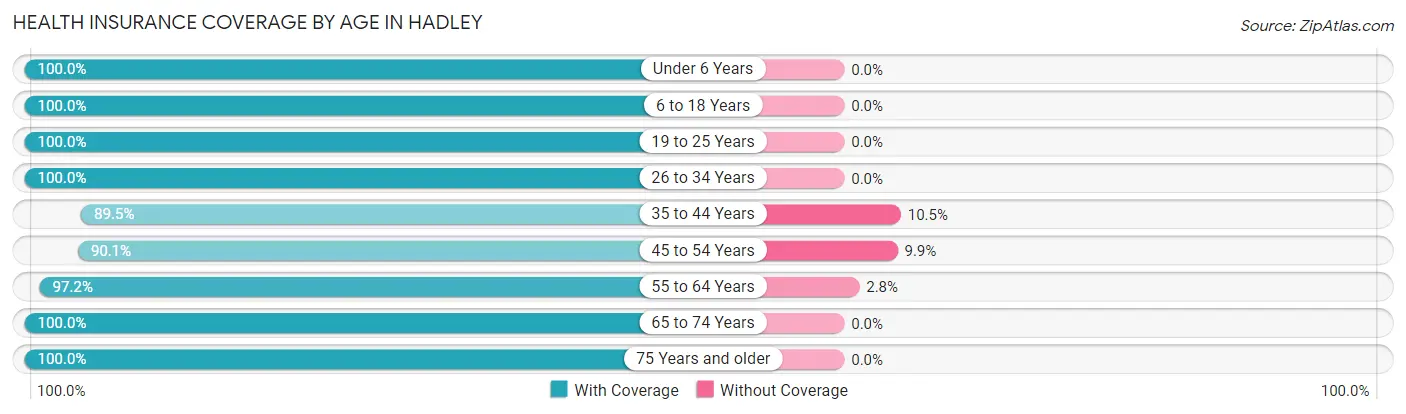
| Age Bracket | With Coverage | Without Coverage |
| Under 6 Years | 72 (100.0%) | 0 (0.0%) |
| 6 to 18 Years | 128 (100.0%) | 0 (0.0%) |
| 19 to 25 Years | 35 (100.0%) | 0 (0.0%) |
| 26 to 34 Years | 78 (100.0%) | 0 (0.0%) |
| 35 to 44 Years | 153 (89.5%) | 18 (10.5%) |
| 45 to 54 Years | 136 (90.1%) | 15 (9.9%) |
| 55 to 64 Years | 139 (97.2%) | 4 (2.8%) |
| 65 to 74 Years | 171 (100.0%) | 0 (0.0%) |
| 75 Years and older | 123 (100.0%) | 0 (0.0%) |
| Total | 1,035 (96.6%) | 37 (3.5%) |
Health Insurance Coverage by Citizenship Status in Hadley
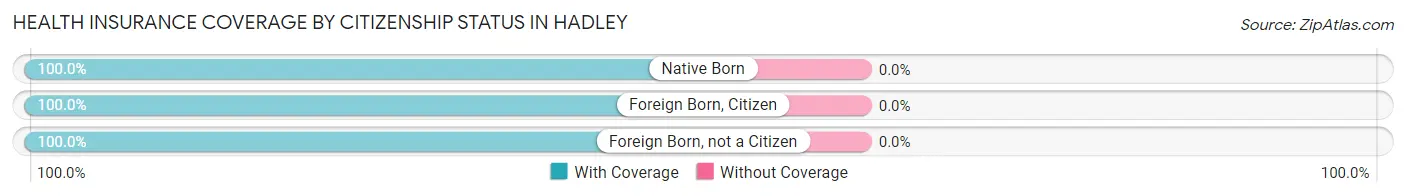
| Citizenship Status | With Coverage | Without Coverage |
| Native Born | 72 (100.0%) | 0 (0.0%) |
| Foreign Born, Citizen | 128 (100.0%) | 0 (0.0%) |
| Foreign Born, not a Citizen | 35 (100.0%) | 0 (0.0%) |
Health Insurance Coverage by Household Income in Hadley
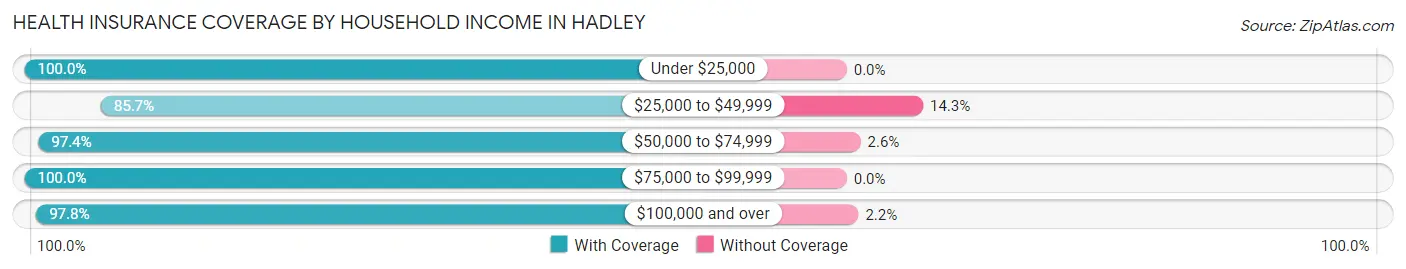
| Household Income | With Coverage | Without Coverage |
| Under $25,000 | 126 (100.0%) | 0 (0.0%) |
| $25,000 to $49,999 | 132 (85.7%) | 22 (14.3%) |
| $50,000 to $74,999 | 188 (97.4%) | 5 (2.6%) |
| $75,000 to $99,999 | 130 (100.0%) | 0 (0.0%) |
| $100,000 and over | 447 (97.8%) | 10 (2.2%) |
Public vs Private Health Insurance Coverage by Age in Hadley
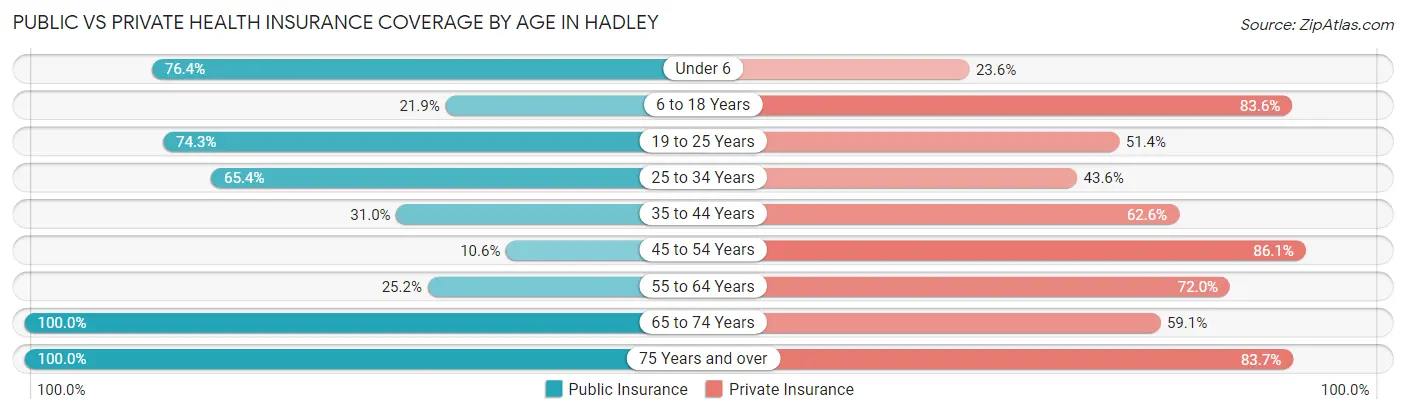
| Age Bracket | Public Insurance | Private Insurance |
| Under 6 | 55 (76.4%) | 17 (23.6%) |
| 6 to 18 Years | 28 (21.9%) | 107 (83.6%) |
| 19 to 25 Years | 26 (74.3%) | 18 (51.4%) |
| 25 to 34 Years | 51 (65.4%) | 34 (43.6%) |
| 35 to 44 Years | 53 (31.0%) | 107 (62.6%) |
| 45 to 54 Years | 16 (10.6%) | 130 (86.1%) |
| 55 to 64 Years | 36 (25.2%) | 103 (72.0%) |
| 65 to 74 Years | 171 (100.0%) | 101 (59.1%) |
| 75 Years and over | 123 (100.0%) | 103 (83.7%) |
| Total | 559 (52.1%) | 720 (67.2%) |
Disability Status by Sex by Age in Hadley
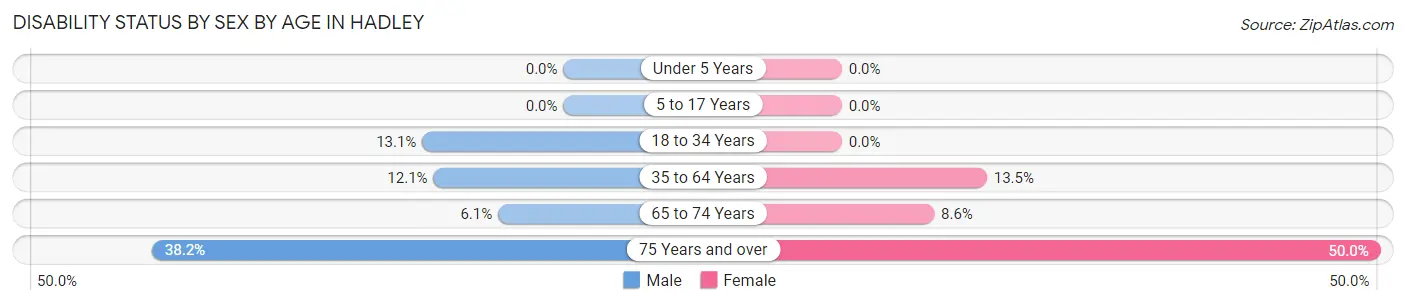
| Age Bracket | Male | Female |
| Under 5 Years | 0 (0.0%) | 0 (0.0%) |
| 5 to 17 Years | 0 (0.0%) | 0 (0.0%) |
| 18 to 34 Years | 11 (13.1%) | 0 (0.0%) |
| 35 to 64 Years | 31 (12.1%) | 28 (13.5%) |
| 65 to 74 Years | 4 (6.1%) | 9 (8.6%) |
| 75 Years and over | 21 (38.2%) | 34 (50.0%) |
Disability Class by Sex by Age in Hadley
Disability Class: Hearing Difficulty
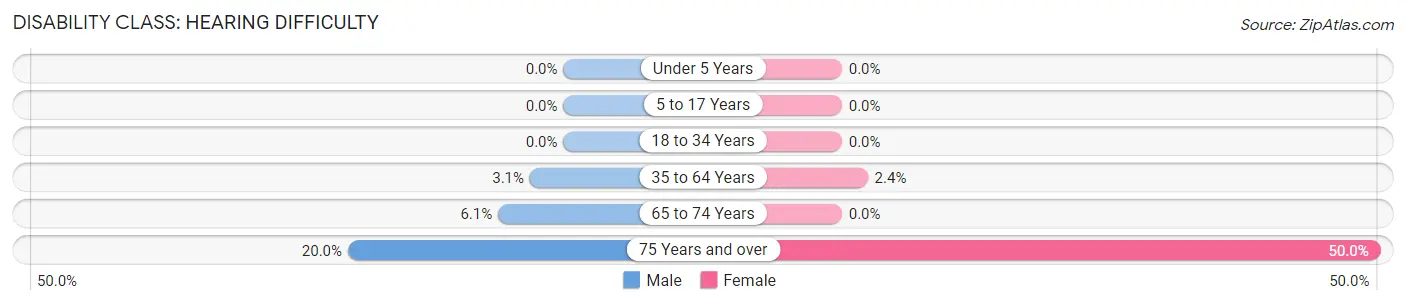
| Age Bracket | Male | Female |
| Under 5 Years | 0 (0.0%) | 0 (0.0%) |
| 5 to 17 Years | 0 (0.0%) | 0 (0.0%) |
| 18 to 34 Years | 0 (0.0%) | 0 (0.0%) |
| 35 to 64 Years | 8 (3.1%) | 5 (2.4%) |
| 65 to 74 Years | 4 (6.1%) | 0 (0.0%) |
| 75 Years and over | 11 (20.0%) | 34 (50.0%) |
Disability Class: Vision Difficulty
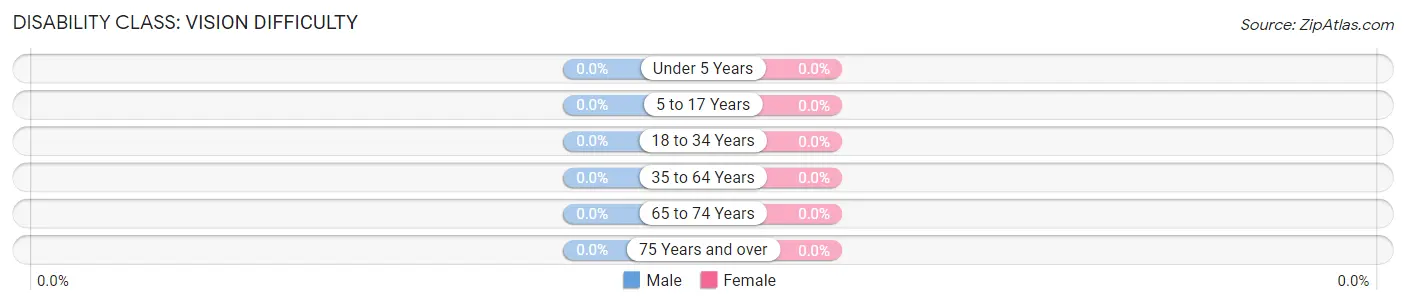
| Age Bracket | Male | Female |
| Under 5 Years | 0 (0.0%) | 0 (0.0%) |
| 5 to 17 Years | 0 (0.0%) | 0 (0.0%) |
| 18 to 34 Years | 0 (0.0%) | 0 (0.0%) |
| 35 to 64 Years | 0 (0.0%) | 0 (0.0%) |
| 65 to 74 Years | 0 (0.0%) | 0 (0.0%) |
| 75 Years and over | 0 (0.0%) | 0 (0.0%) |
Disability Class: Cognitive Difficulty
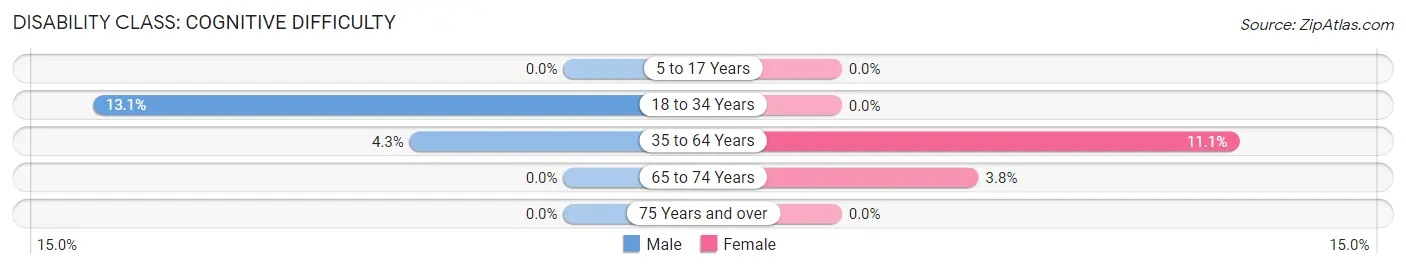
| Age Bracket | Male | Female |
| 5 to 17 Years | 0 (0.0%) | 0 (0.0%) |
| 18 to 34 Years | 11 (13.1%) | 0 (0.0%) |
| 35 to 64 Years | 11 (4.3%) | 23 (11.1%) |
| 65 to 74 Years | 0 (0.0%) | 4 (3.8%) |
| 75 Years and over | 0 (0.0%) | 0 (0.0%) |
Disability Class: Ambulatory Difficulty
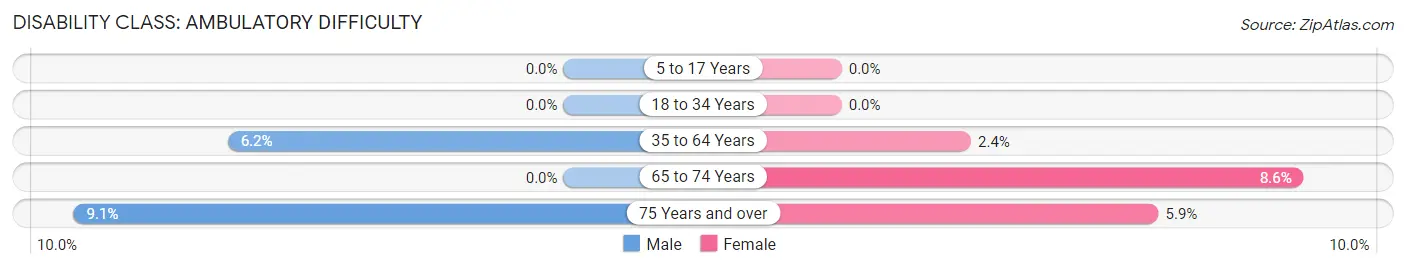
| Age Bracket | Male | Female |
| 5 to 17 Years | 0 (0.0%) | 0 (0.0%) |
| 18 to 34 Years | 0 (0.0%) | 0 (0.0%) |
| 35 to 64 Years | 16 (6.2%) | 5 (2.4%) |
| 65 to 74 Years | 0 (0.0%) | 9 (8.6%) |
| 75 Years and over | 5 (9.1%) | 4 (5.9%) |
Disability Class: Self-Care Difficulty
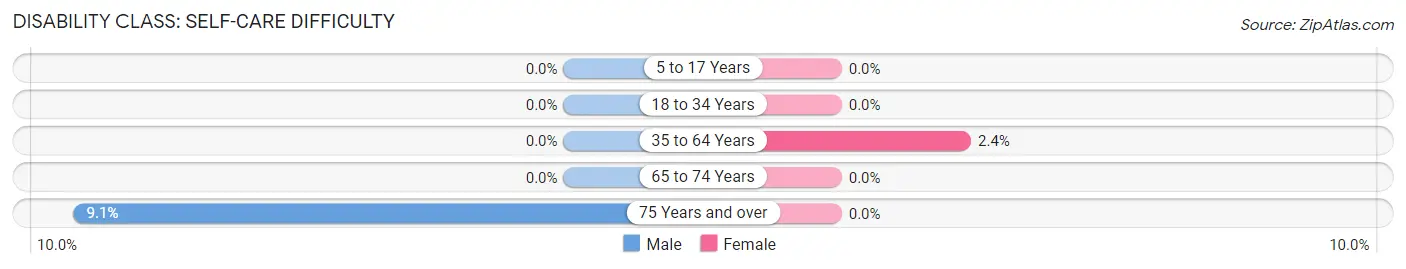
| Age Bracket | Male | Female |
| 5 to 17 Years | 0 (0.0%) | 0 (0.0%) |
| 18 to 34 Years | 0 (0.0%) | 0 (0.0%) |
| 35 to 64 Years | 0 (0.0%) | 5 (2.4%) |
| 65 to 74 Years | 0 (0.0%) | 0 (0.0%) |
| 75 Years and over | 5 (9.1%) | 0 (0.0%) |
Technology Access in Hadley
Computing Device Access in Hadley
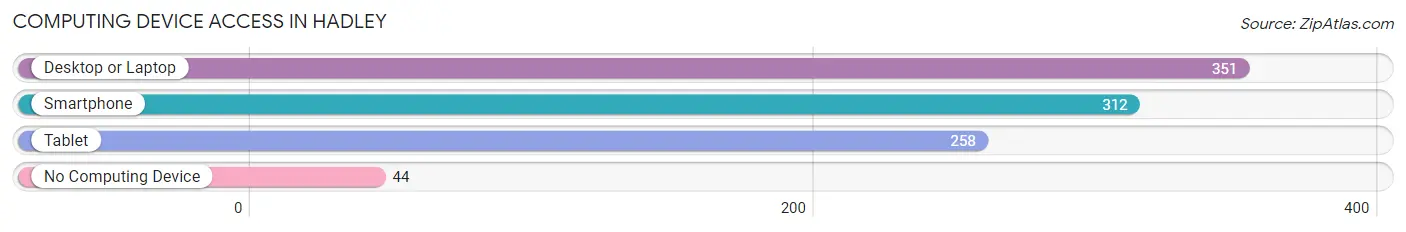
| Device Type | # Households | % Households |
| Desktop or Laptop | 351 | 81.8% |
| Smartphone | 312 | 72.7% |
| Tablet | 258 | 60.1% |
| No Computing Device | 44 | 10.3% |
| Total | 429 | 100.0% |
Internet Access in Hadley
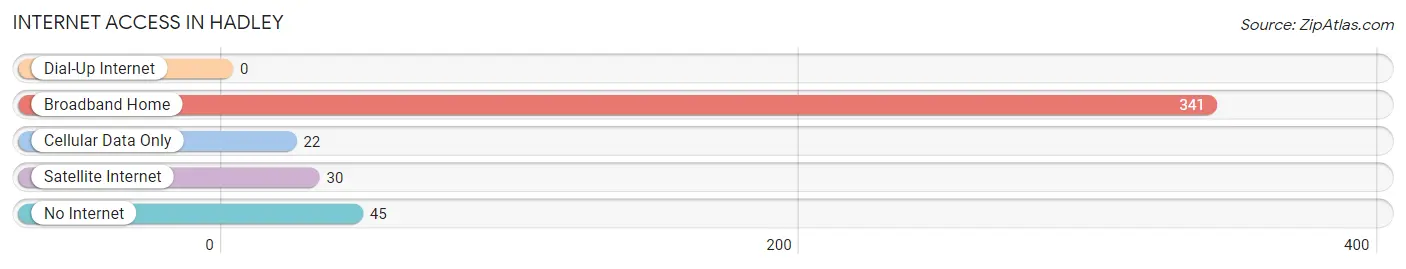
| Internet Type | # Households | % Households |
| Dial-Up Internet | 0 | 0.0% |
| Broadband Home | 341 | 79.5% |
| Cellular Data Only | 22 | 5.1% |
| Satellite Internet | 30 | 7.0% |
| No Internet | 45 | 10.5% |
| Total | 429 | 100.0% |
Hadley Summary
Hadley, NY is a small town located in the Adirondack Mountains of New York State. It is situated in the northern part of the state, about 30 miles south of the Canadian border. The town was founded in 1797 and has a population of approximately 1,500 people.
History
Hadley was first settled in 1797 by a group of settlers from Massachusetts. The town was named after Hadley, Massachusetts, the hometown of the settlers. The settlers were attracted to the area due to its abundance of natural resources, including timber, water, and fertile soil. The town quickly grew and by 1810, it had a population of over 500 people.
In the early 19th century, Hadley was a thriving agricultural community. The town was known for its dairy farms, which produced milk, butter, and cheese. The town also had several sawmills, which provided lumber for the construction of homes and other buildings.
In the late 19th century, the town began to decline due to the depletion of natural resources and the decline of the agricultural industry. By the early 20th century, the population had dropped to less than 500 people.
Geography
Hadley is located in the northern part of New York State, in the Adirondack Mountains. The town is situated on the banks of the Sacandaga River, which flows through the town. The town is surrounded by forests and mountains, and is home to several lakes, including Lake Hadley and Lake Sacandaga.
The town has a total area of 8.2 square miles, of which 8.1 square miles is land and 0.1 square miles is water. The town is located at an elevation of 1,400 feet above sea level.
Economy
Hadley’s economy is largely based on tourism. The town is home to several ski resorts, which attract visitors from all over the world. The town also has several restaurants, hotels, and other businesses that cater to tourists.
In addition to tourism, the town is also home to several small businesses, including a sawmill, a lumber yard, and a furniture store. The town also has several farms, which produce dairy products, vegetables, and other agricultural products.
Demographics
As of the 2010 census, Hadley had a population of 1,500 people. The racial makeup of the town was 97.3% White, 0.7% African American, 0.3% Native American, 0.3% Asian, and 1.3% from other races. The median household income was $41,250, and the median family income was $50,000.
The town has a high rate of homeownership, with over 80% of the population owning their own homes. The town also has a high rate of educational attainment, with over 90% of the population having at least a high school diploma.
Conclusion
Hadley, NY is a small town located in the Adirondack Mountains of New York State. The town was founded in 1797 and has a population of approximately 1,500 people. The town’s economy is largely based on tourism, and it is home to several ski resorts, restaurants, hotels, and other businesses. The town also has several small businesses, farms, and a high rate of homeownership.
Common Questions
What is Per Capita Income in Hadley?
Per Capita income in Hadley is $32,921.
What is the Median Family Income in Hadley?
Median Family Income in Hadley is $86,364.
What is the Median Household income in Hadley?
Median Household Income in Hadley is $57,880.
What is Income or Wage Gap in Hadley?
Income or Wage Gap in Hadley is 36.7%.
Women in Hadley earn 63.3 cents for every dollar earned by a man.
What is Inequality or Gini Index in Hadley?
Inequality or Gini Index in Hadley is 0.39.
What is the Total Population of Hadley?
Total Population of Hadley is 1,072.
What is the Total Male Population of Hadley?
Total Male Population of Hadley is 537.
What is the Total Female Population of Hadley?
Total Female Population of Hadley is 535.
What is the Ratio of Males per 100 Females in Hadley?
There are 100.37 Males per 100 Females in Hadley.
What is the Ratio of Females per 100 Males in Hadley?
There are 99.63 Females per 100 Males in Hadley.
What is the Median Population Age in Hadley?
Median Population Age in Hadley is 49.3 Years.
What is the Average Family Size in Hadley
Average Family Size in Hadley is 3.0 People.
What is the Average Household Size in Hadley
Average Household Size in Hadley is 2.5 People.
How Large is the Labor Force in Hadley?
There are 536 People in the Labor Forcein in Hadley.
What is the Percentage of People in the Labor Force in Hadley?
57.6% of People are in the Labor Force in Hadley.
What is the Unemployment Rate in Hadley?
Unemployment Rate in Hadley is 6.0%.