Chenango Bridge, NY Map & Demographics
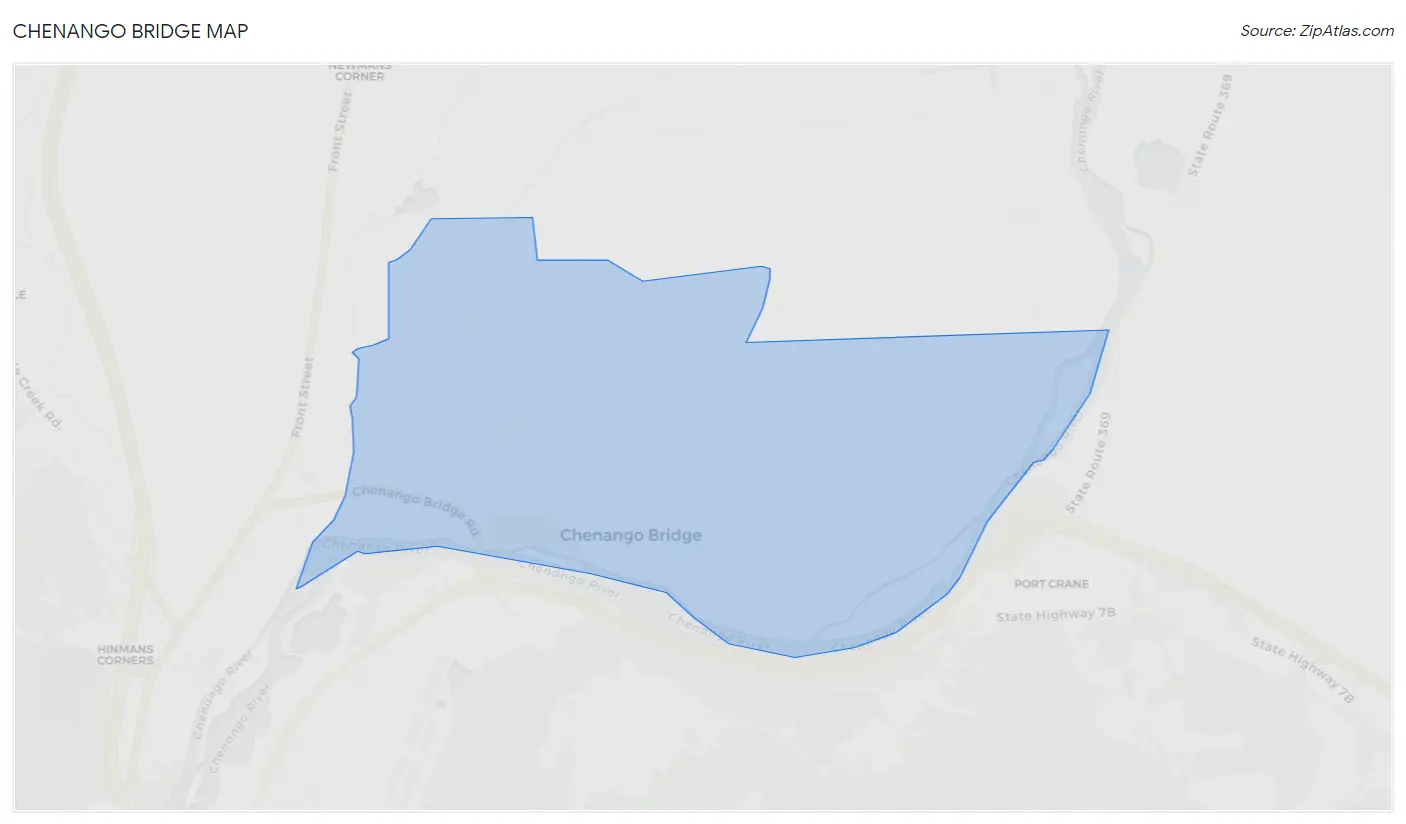
Chenango Bridge Map
Chenango Bridge Overview
$35,957
PER CAPITA INCOME
$101,952
AVG FAMILY INCOME
$97,321
AVG HOUSEHOLD INCOME
38.9%
WAGE / INCOME GAP [ % ]
61.1¢/ $1
WAGE / INCOME GAP [ $ ]
0.34
INEQUALITY / GINI INDEX
3,224
TOTAL POPULATION
1,672
MALE POPULATION
1,552
FEMALE POPULATION
107.73
MALES / 100 FEMALES
92.82
FEMALES / 100 MALES
39.5
MEDIAN AGE
3.1
AVG FAMILY SIZE
2.6
AVG HOUSEHOLD SIZE
1,638
LABOR FORCE [ PEOPLE ]
64.7%
PERCENT IN LABOR FORCE
9.7%
UNEMPLOYMENT RATE
Chenango Bridge Area Codes
Income in Chenango Bridge
Income Overview in Chenango Bridge
Per Capita Income in Chenango Bridge is $35,957, while median incomes of families and households are $101,952 and $97,321 respectively.
| Characteristic | Number | Measure |
| Per Capita Income | 3,224 | $35,957 |
| Median Family Income | 924 | $101,952 |
| Mean Family Income | 924 | $104,692 |
| Median Household Income | 1,235 | $97,321 |
| Mean Household Income | 1,235 | $92,496 |
| Income Deficit | 924 | $0 |
| Wage / Income Gap (%) | 3,224 | 38.88% |
| Wage / Income Gap ($) | 3,224 | 61.12¢ per $1 |
| Gini / Inequality Index | 3,224 | 0.34 |
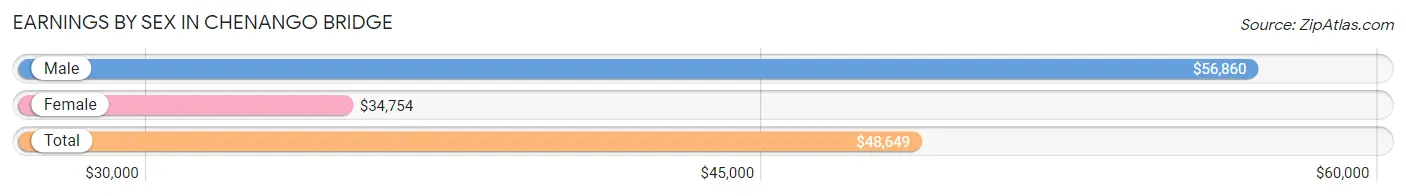
Earnings by Sex in Chenango Bridge
Average Earnings in Chenango Bridge are $48,649, $56,860 for men and $34,754 for women, a difference of 38.9%.
| Sex | Number | Average Earnings |
| Male | 786 (49.9%) | $56,860 |
| Female | 788 (50.1%) | $34,754 |
| Total | 1,574 (100.0%) | $48,649 |
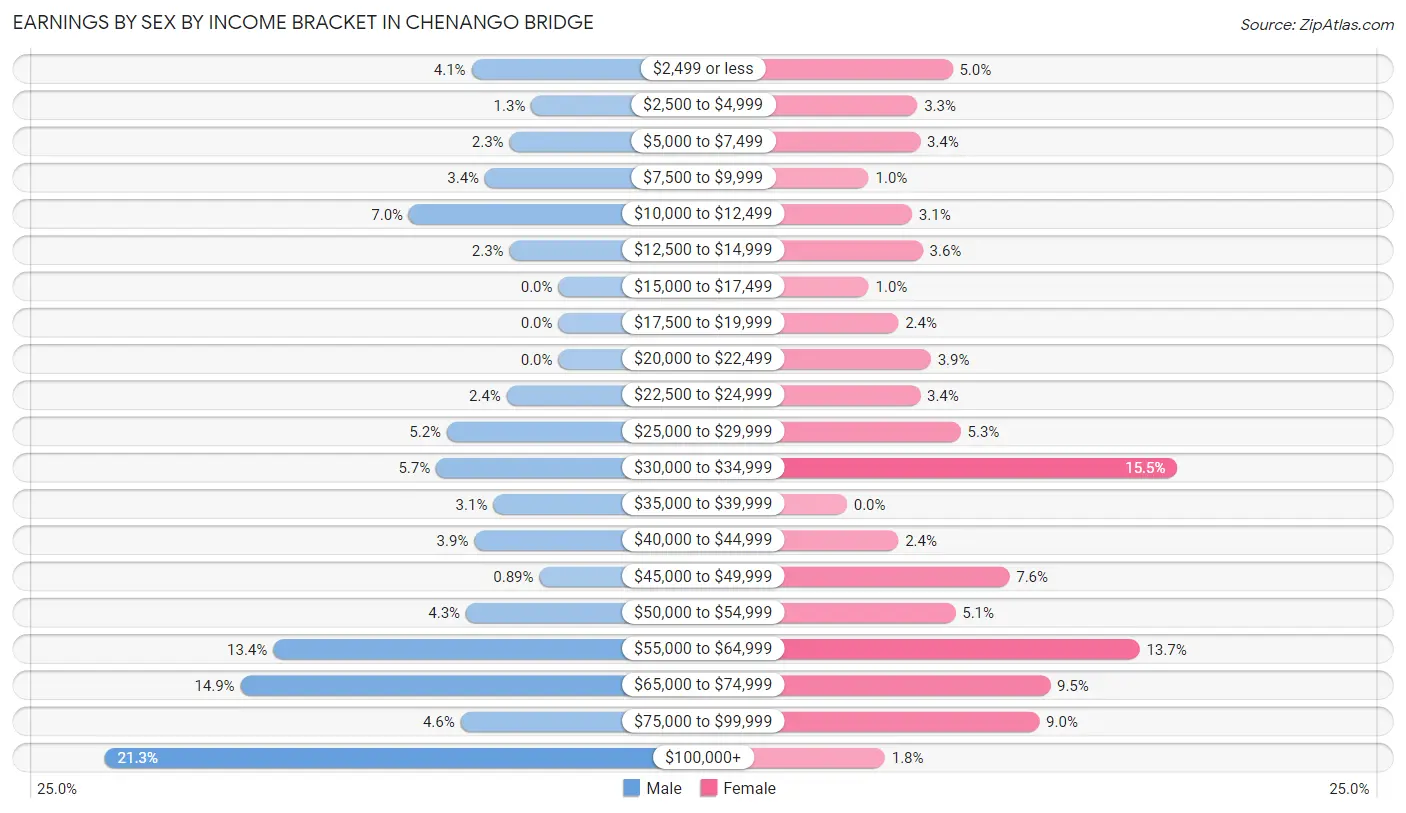
Earnings by Sex by Income Bracket in Chenango Bridge
The most common earnings brackets in Chenango Bridge are $100,000+ for men (167 | 21.2%) and $30,000 to $34,999 for women (122 | 15.5%).
| Income | Male | Female |
| $2,499 or less | 32 (4.1%) | 39 (5.0%) |
| $2,500 to $4,999 | 10 (1.3%) | 26 (3.3%) |
| $5,000 to $7,499 | 18 (2.3%) | 27 (3.4%) |
| $7,500 to $9,999 | 27 (3.4%) | 8 (1.0%) |
| $10,000 to $12,499 | 55 (7.0%) | 24 (3.0%) |
| $12,500 to $14,999 | 18 (2.3%) | 28 (3.5%) |
| $15,000 to $17,499 | 0 (0.0%) | 8 (1.0%) |
| $17,500 to $19,999 | 0 (0.0%) | 19 (2.4%) |
| $20,000 to $22,499 | 0 (0.0%) | 31 (3.9%) |
| $22,500 to $24,999 | 19 (2.4%) | 27 (3.4%) |
| $25,000 to $29,999 | 41 (5.2%) | 42 (5.3%) |
| $30,000 to $34,999 | 45 (5.7%) | 122 (15.5%) |
| $35,000 to $39,999 | 24 (3.0%) | 0 (0.0%) |
| $40,000 to $44,999 | 31 (3.9%) | 19 (2.4%) |
| $45,000 to $49,999 | 7 (0.9%) | 60 (7.6%) |
| $50,000 to $54,999 | 34 (4.3%) | 40 (5.1%) |
| $55,000 to $64,999 | 105 (13.4%) | 108 (13.7%) |
| $65,000 to $74,999 | 117 (14.9%) | 75 (9.5%) |
| $75,000 to $99,999 | 36 (4.6%) | 71 (9.0%) |
| $100,000+ | 167 (21.2%) | 14 (1.8%) |
| Total | 786 (100.0%) | 788 (100.0%) |
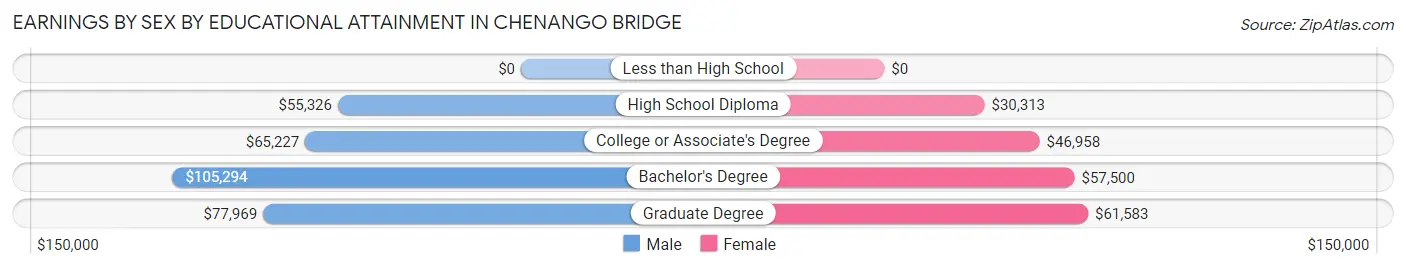
Earnings by Sex by Educational Attainment in Chenango Bridge
Average earnings in Chenango Bridge are $63,487 for men and $45,583 for women, a difference of 28.2%. Men with an educational attainment of bachelor's degree enjoy the highest average annual earnings of $105,294, while those with high school diploma education earn the least with $55,326. Women with an educational attainment of graduate degree earn the most with the average annual earnings of $61,583, while those with high school diploma education have the smallest earnings of $30,313.
| Educational Attainment | Male Income | Female Income |
| Less than High School | - | - |
| High School Diploma | $55,326 | $30,313 |
| College or Associate's Degree | $65,227 | $46,958 |
| Bachelor's Degree | $105,294 | $57,500 |
| Graduate Degree | $77,969 | $61,583 |
| Total | $63,487 | $45,583 |
Family Income in Chenango Bridge
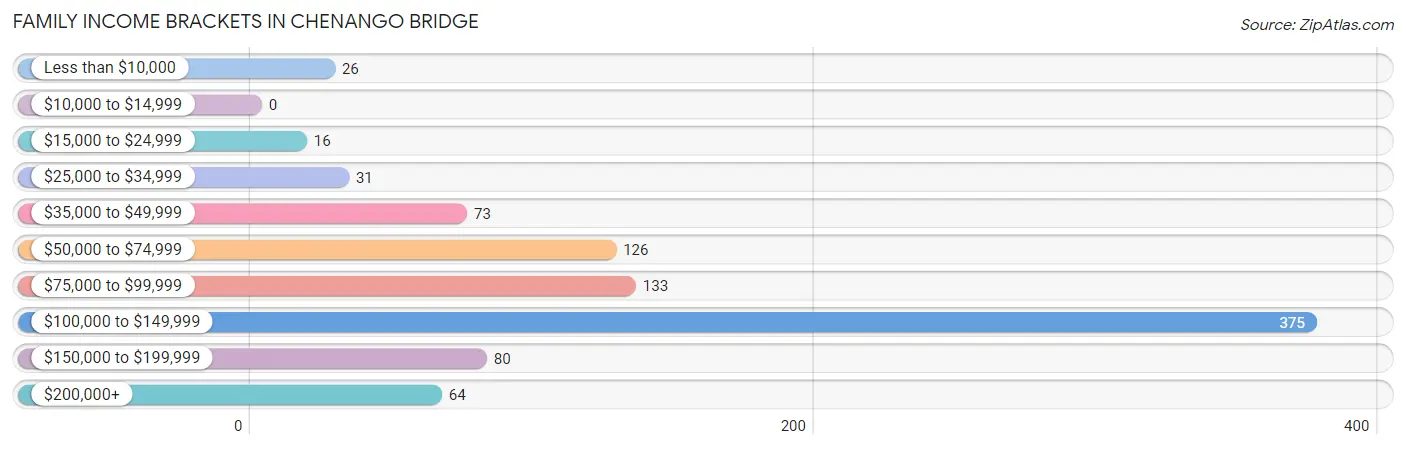
Family Income Brackets in Chenango Bridge
According to the Chenango Bridge family income data, there are 375 families falling into the $100,000 to $149,999 income range, which is the most common income bracket and makes up 40.6% of all families.
| Income Bracket | # Families | % Families |
| Less than $10,000 | 26 | 2.8% |
| $10,000 to $14,999 | 0 | 0.0% |
| $15,000 to $24,999 | 16 | 1.7% |
| $25,000 to $34,999 | 31 | 3.4% |
| $35,000 to $49,999 | 73 | 7.9% |
| $50,000 to $74,999 | 126 | 13.6% |
| $75,000 to $99,999 | 133 | 14.4% |
| $100,000 to $149,999 | 375 | 40.6% |
| $150,000 to $199,999 | 80 | 8.7% |
| $200,000+ | 64 | 6.9% |
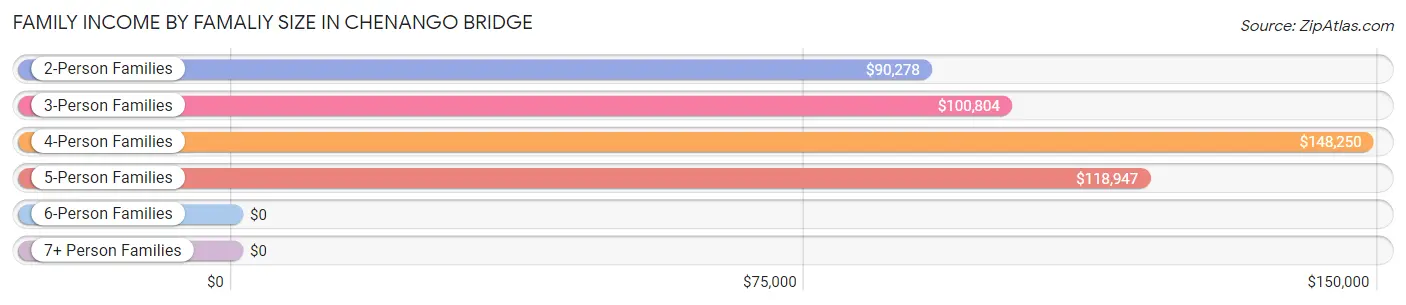
Family Income by Famaliy Size in Chenango Bridge
4-person families (122 | 13.2%) account for the highest median family income in Chenango Bridge with $148,250 per family, while 2-person families (486 | 52.6%) have the highest median income of $45,139 per family member.
| Income Bracket | # Families | Median Income |
| 2-Person Families | 486 (52.6%) | $90,278 |
| 3-Person Families | 202 (21.9%) | $100,804 |
| 4-Person Families | 122 (13.2%) | $148,250 |
| 5-Person Families | 42 (4.5%) | $118,947 |
| 6-Person Families | 66 (7.1%) | $0 |
| 7+ Person Families | 6 (0.6%) | $0 |
| Total | 924 (100.0%) | $101,952 |
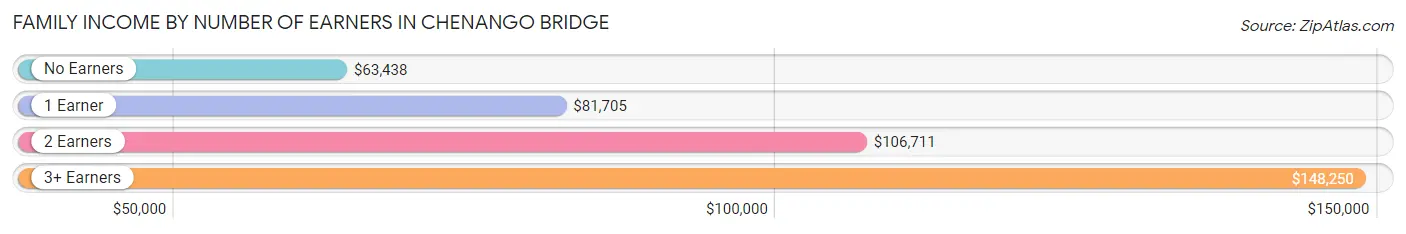
Family Income by Number of Earners in Chenango Bridge
The median family income in Chenango Bridge is $101,952, with families comprising 3+ earners (84) having the highest median family income of $148,250, while families with no earners (233) have the lowest median family income of $63,438, accounting for 9.1% and 25.2% of families, respectively.
| Number of Earners | # Families | Median Income |
| No Earners | 233 (25.2%) | $63,438 |
| 1 Earner | 221 (23.9%) | $81,705 |
| 2 Earners | 386 (41.8%) | $106,711 |
| 3+ Earners | 84 (9.1%) | $148,250 |
| Total | 924 (100.0%) | $101,952 |
Household Income in Chenango Bridge
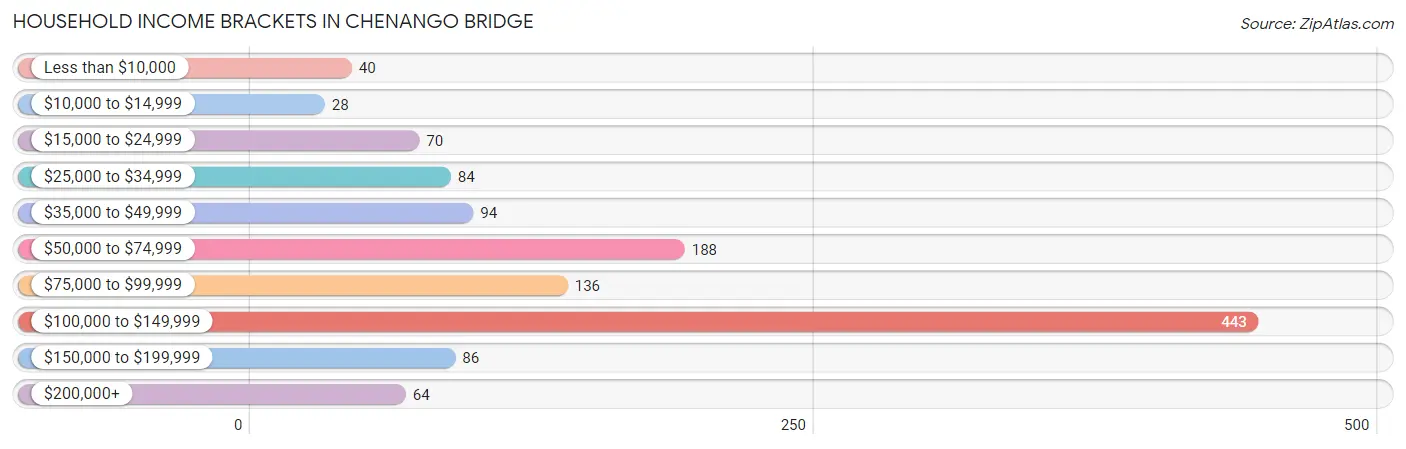
Household Income Brackets in Chenango Bridge
With 443 households falling in the category, the $100,000 to $149,999 income range is the most frequent in Chenango Bridge, accounting for 35.9% of all households. In contrast, only 28 households (2.3%) fall into the $10,000 to $14,999 income bracket, making it the least populous group.
| Income Bracket | # Households | % Households |
| Less than $10,000 | 40 | 3.2% |
| $10,000 to $14,999 | 28 | 2.3% |
| $15,000 to $24,999 | 70 | 5.7% |
| $25,000 to $34,999 | 84 | 6.8% |
| $35,000 to $49,999 | 94 | 7.6% |
| $50,000 to $74,999 | 188 | 15.2% |
| $75,000 to $99,999 | 136 | 11.0% |
| $100,000 to $149,999 | 443 | 35.9% |
| $150,000 to $199,999 | 86 | 7.0% |
| $200,000+ | 64 | 5.2% |
Household Income by Householder Age in Chenango Bridge
The median household income in Chenango Bridge is $97,321, with the highest median household income of $112,826 found in the 25 to 44 years age bracket for the primary householder. A total of 408 households (33.0%) fall into this category.
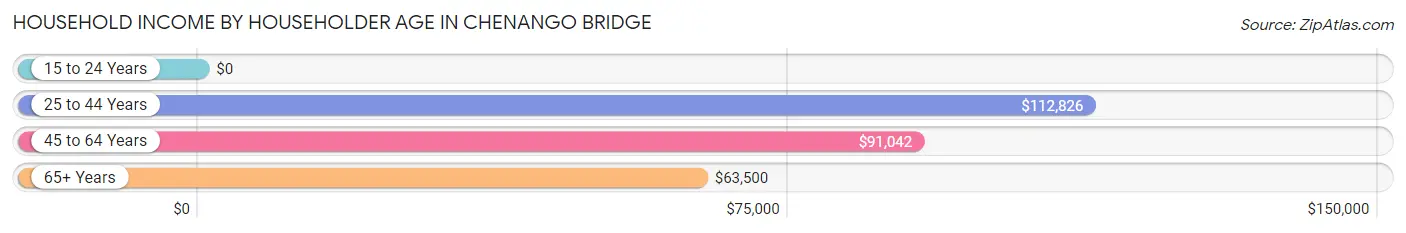
| Income Bracket | # Households | Median Income |
| 15 to 24 Years | 0 (0.0%) | $0 |
| 25 to 44 Years | 408 (33.0%) | $112,826 |
| 45 to 64 Years | 357 (28.9%) | $91,042 |
| 65+ Years | 470 (38.1%) | $63,500 |
| Total | 1,235 (100.0%) | $97,321 |
Poverty in Chenango Bridge
Income Below Poverty by Sex and Age in Chenango Bridge
With 4.1% poverty level for males and 8.4% for females among the residents of Chenango Bridge, 5 year old males and 5 year old females are the most vulnerable to poverty, with 11 males (20.7%) and 15 females (44.1%) in their respective age groups living below the poverty level.
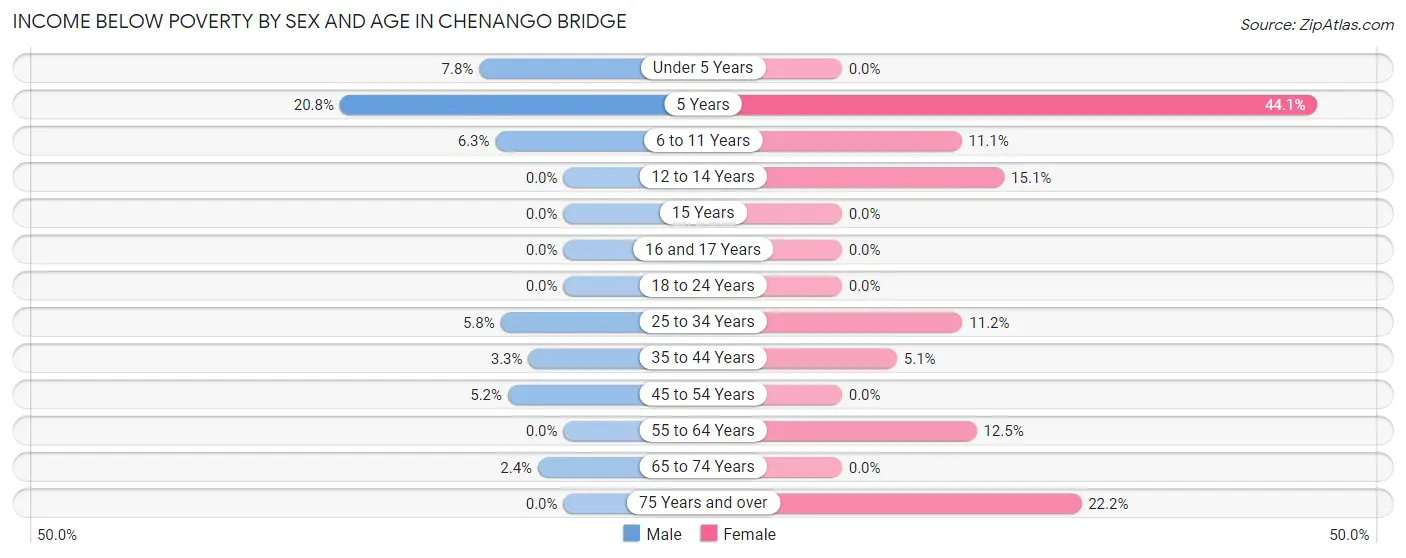
| Age Bracket | Male | Female |
| Under 5 Years | 15 (7.8%) | 0 (0.0%) |
| 5 Years | 11 (20.7%) | 15 (44.1%) |
| 6 to 11 Years | 7 (6.3%) | 6 (11.1%) |
| 12 to 14 Years | 0 (0.0%) | 11 (15.1%) |
| 15 Years | 0 (0.0%) | 0 (0.0%) |
| 16 and 17 Years | 0 (0.0%) | 0 (0.0%) |
| 18 to 24 Years | 0 (0.0%) | 0 (0.0%) |
| 25 to 34 Years | 14 (5.8%) | 33 (11.2%) |
| 35 to 44 Years | 8 (3.3%) | 7 (5.1%) |
| 45 to 54 Years | 7 (5.1%) | 0 (0.0%) |
| 55 to 64 Years | 0 (0.0%) | 18 (12.5%) |
| 65 to 74 Years | 6 (2.4%) | 0 (0.0%) |
| 75 Years and over | 0 (0.0%) | 40 (22.2%) |
| Total | 68 (4.1%) | 130 (8.4%) |
Income Above Poverty by Sex and Age in Chenango Bridge
According to the poverty statistics in Chenango Bridge, males aged 12 to 14 years and females aged under 5 years are the age groups that are most secure financially, with 100.0% of males and 100.0% of females in these age groups living above the poverty line.
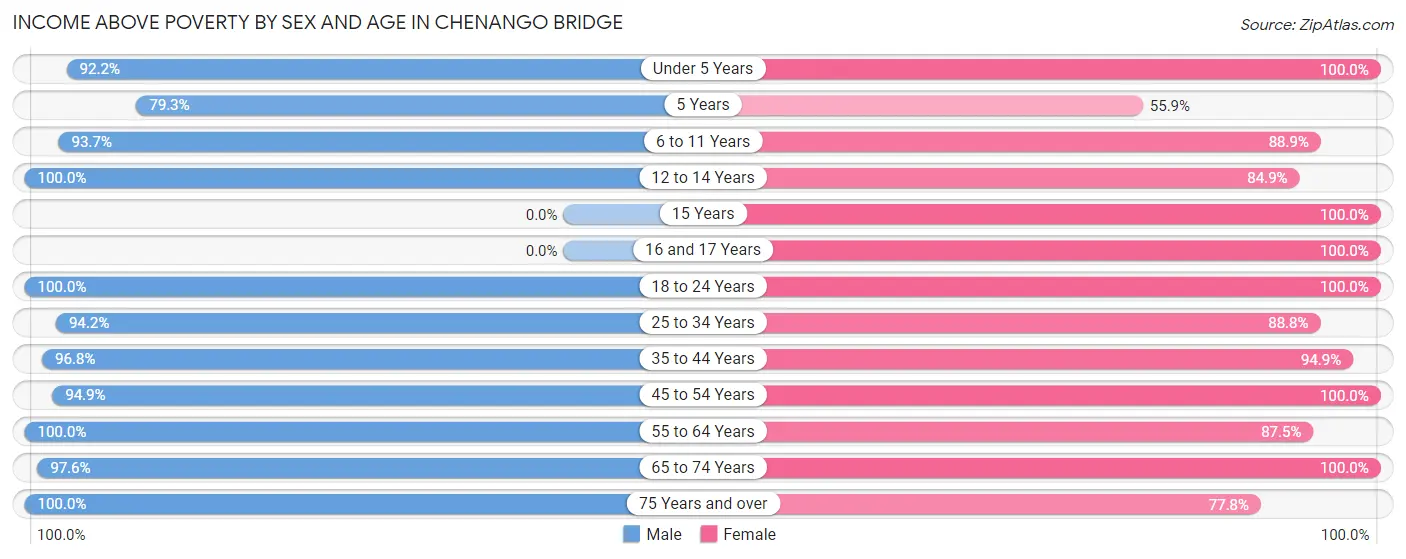
| Age Bracket | Male | Female |
| Under 5 Years | 177 (92.2%) | 71 (100.0%) |
| 5 Years | 42 (79.2%) | 19 (55.9%) |
| 6 to 11 Years | 104 (93.7%) | 48 (88.9%) |
| 12 to 14 Years | 69 (100.0%) | 62 (84.9%) |
| 15 Years | 0 (0.0%) | 35 (100.0%) |
| 16 and 17 Years | 0 (0.0%) | 36 (100.0%) |
| 18 to 24 Years | 131 (100.0%) | 46 (100.0%) |
| 25 to 34 Years | 226 (94.2%) | 262 (88.8%) |
| 35 to 44 Years | 238 (96.8%) | 130 (94.9%) |
| 45 to 54 Years | 129 (94.9%) | 184 (100.0%) |
| 55 to 64 Years | 169 (100.0%) | 126 (87.5%) |
| 65 to 74 Years | 248 (97.6%) | 263 (100.0%) |
| 75 Years and over | 71 (100.0%) | 140 (77.8%) |
| Total | 1,604 (95.9%) | 1,422 (91.6%) |
Income Below Poverty Among Married-Couple Families in Chenango Bridge
The poverty statistics for married-couple families in Chenango Bridge show that 0.9% or 7 of the total 812 families live below the poverty line. Families with 1 or 2 children have the highest poverty rate of 2.4%, comprising of 7 families. On the other hand, families with no children have the lowest poverty rate of 0.0%, which includes 0 families.
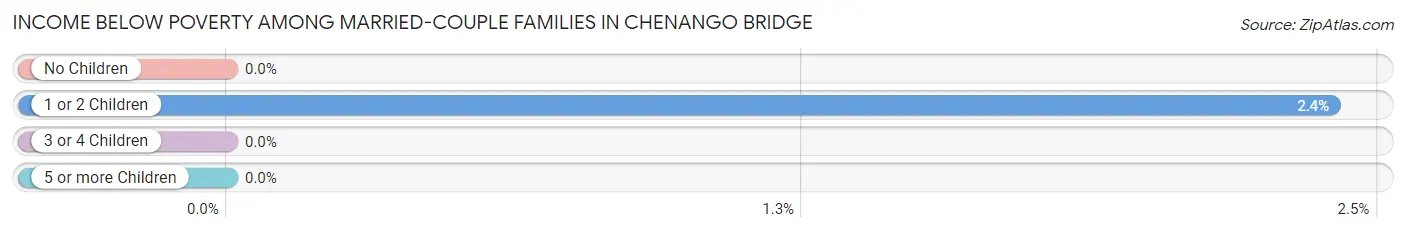
| Children | Above Poverty | Below Poverty |
| No Children | 478 (100.0%) | 0 (0.0%) |
| 1 or 2 Children | 285 (97.6%) | 7 (2.4%) |
| 3 or 4 Children | 36 (100.0%) | 0 (0.0%) |
| 5 or more Children | 6 (100.0%) | 0 (0.0%) |
| Total | 805 (99.1%) | 7 (0.9%) |
Income Below Poverty Among Single-Parent Households in Chenango Bridge
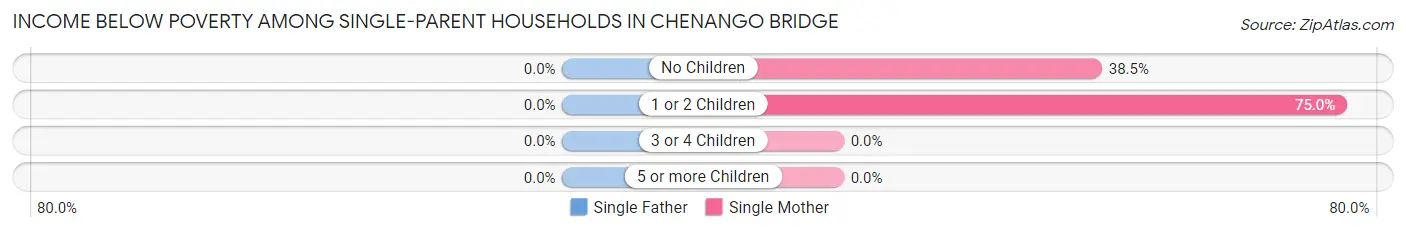
| Children | Single Father | Single Mother |
| No Children | 0 (0.0%) | 15 (38.5%) |
| 1 or 2 Children | 0 (0.0%) | 27 (75.0%) |
| 3 or 4 Children | 0 (0.0%) | 0 (0.0%) |
| 5 or more Children | 0 (0.0%) | 0 (0.0%) |
| Total | 0 (0.0%) | 42 (56.0%) |
Income Below Poverty Among Married-Couple vs Single-Parent Households in Chenango Bridge
The poverty data for Chenango Bridge shows that 7 of the married-couple family households (0.9%) and 42 of the single-parent households (37.5%) are living below the poverty level. Within the married-couple family households, those with 1 or 2 children have the highest poverty rate, with 7 households (2.4%) falling below the poverty line. Among the single-parent households, those with no children have the highest poverty rate, with 15 household (38.5%) living below poverty.
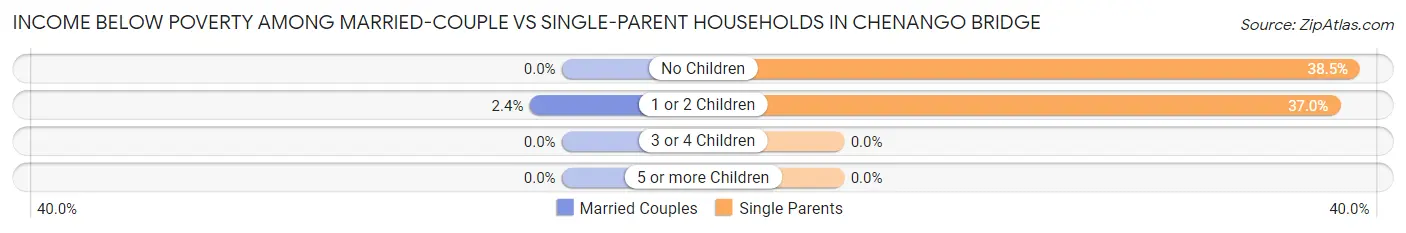
| Children | Married-Couple Families | Single-Parent Households |
| No Children | 0 (0.0%) | 15 (38.5%) |
| 1 or 2 Children | 7 (2.4%) | 27 (37.0%) |
| 3 or 4 Children | 0 (0.0%) | 0 (0.0%) |
| 5 or more Children | 0 (0.0%) | 0 (0.0%) |
| Total | 7 (0.9%) | 42 (37.5%) |
Race in Chenango Bridge
The most populous races in Chenango Bridge are White / Caucasian (3,052 | 94.7%), Two or more Races (91 | 2.8%), and Asian (72 | 2.2%).
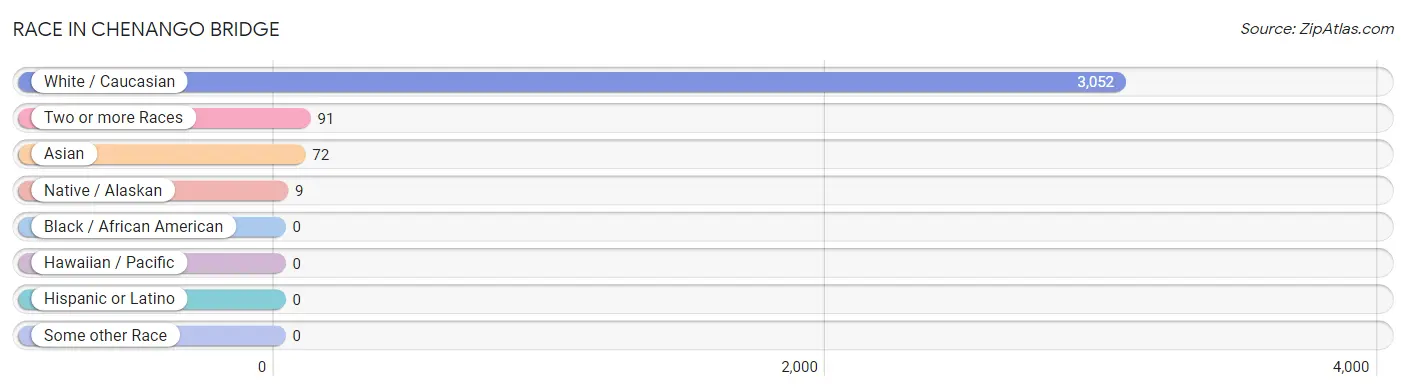
| Race | # Population | % Population |
| Asian | 72 | 2.2% |
| Black / African American | 0 | 0.0% |
| Hawaiian / Pacific | 0 | 0.0% |
| Hispanic or Latino | 0 | 0.0% |
| Native / Alaskan | 9 | 0.3% |
| White / Caucasian | 3,052 | 94.7% |
| Two or more Races | 91 | 2.8% |
| Some other Race | 0 | 0.0% |
| Total | 3,224 | 100.0% |
Ancestry in Chenango Bridge
The most populous ancestries reported in Chenango Bridge are Irish (669 | 20.7%), Italian (525 | 16.3%), German (523 | 16.2%), English (522 | 16.2%), and American (277 | 8.6%), together accounting for 78.0% of all Chenango Bridge residents.
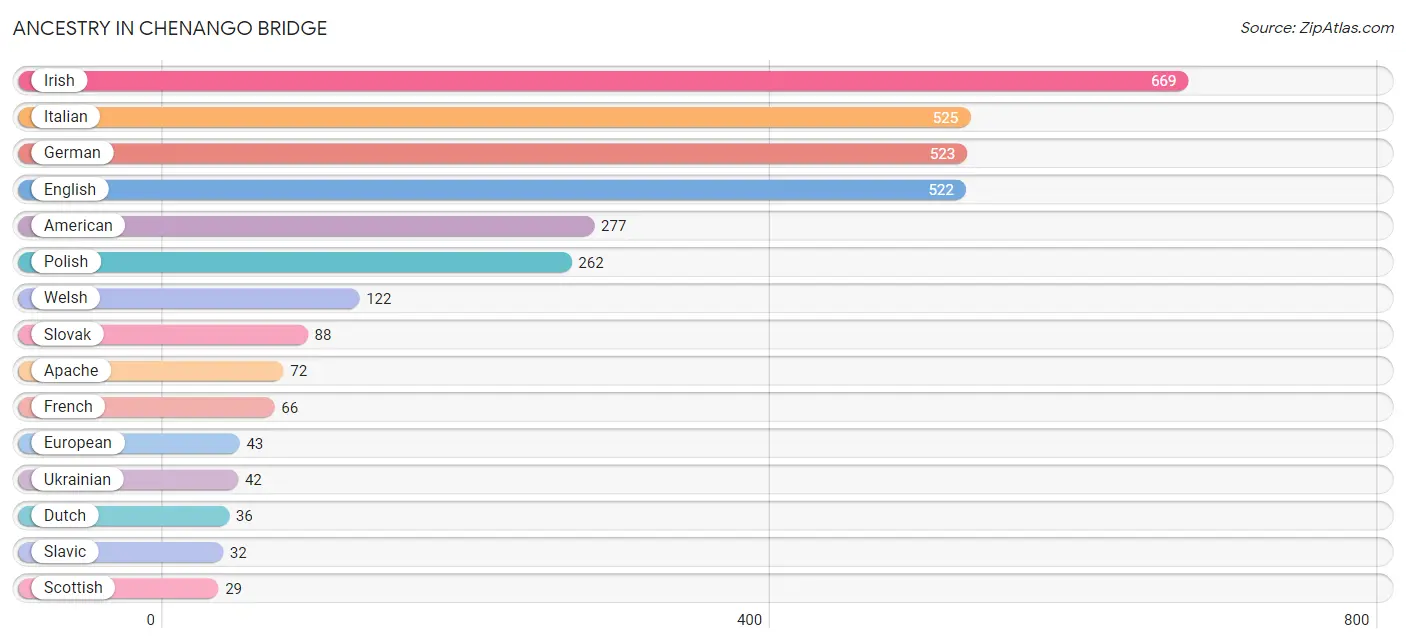
| Ancestry | # Population | % Population |
| American | 277 | 8.6% |
| Apache | 72 | 2.2% |
| Austrian | 9 | 0.3% |
| Belgian | 11 | 0.3% |
| British | 17 | 0.5% |
| Canadian | 16 | 0.5% |
| Cherokee | 2 | 0.1% |
| Czechoslovakian | 16 | 0.5% |
| Dutch | 36 | 1.1% |
| Eastern European | 9 | 0.3% |
| English | 522 | 16.2% |
| European | 43 | 1.3% |
| Finnish | 7 | 0.2% |
| French | 66 | 2.1% |
| German | 523 | 16.2% |
| Greek | 28 | 0.9% |
| Hungarian | 20 | 0.6% |
| Irish | 669 | 20.7% |
| Italian | 525 | 16.3% |
| Korean | 8 | 0.3% |
| Polish | 262 | 8.1% |
| Russian | 10 | 0.3% |
| Scandinavian | 27 | 0.8% |
| Scottish | 29 | 0.9% |
| Sioux | 3 | 0.1% |
| Slavic | 32 | 1.0% |
| Slovak | 88 | 2.7% |
| Swiss | 5 | 0.2% |
| Ukrainian | 42 | 1.3% |
| Welsh | 122 | 3.8% | View All 30 Rows |
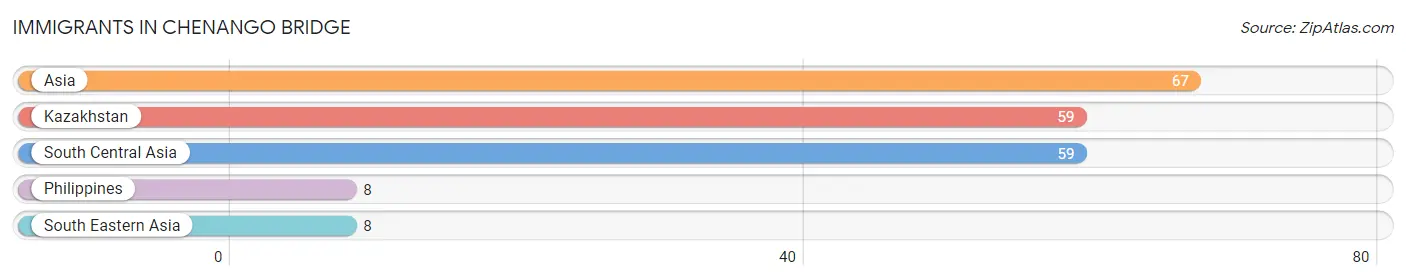
Immigrants in Chenango Bridge
The most numerous immigrant groups reported in Chenango Bridge came from Asia (67 | 2.1%), Kazakhstan (59 | 1.8%), South Central Asia (59 | 1.8%), Philippines (8 | 0.3%), and South Eastern Asia (8 | 0.3%), together accounting for 6.2% of all Chenango Bridge residents.
| Immigration Origin | # Population | % Population |
| Asia | 67 | 2.1% |
| Kazakhstan | 59 | 1.8% |
| Philippines | 8 | 0.3% |
| South Central Asia | 59 | 1.8% |
| South Eastern Asia | 8 | 0.3% | View All 5 Rows |
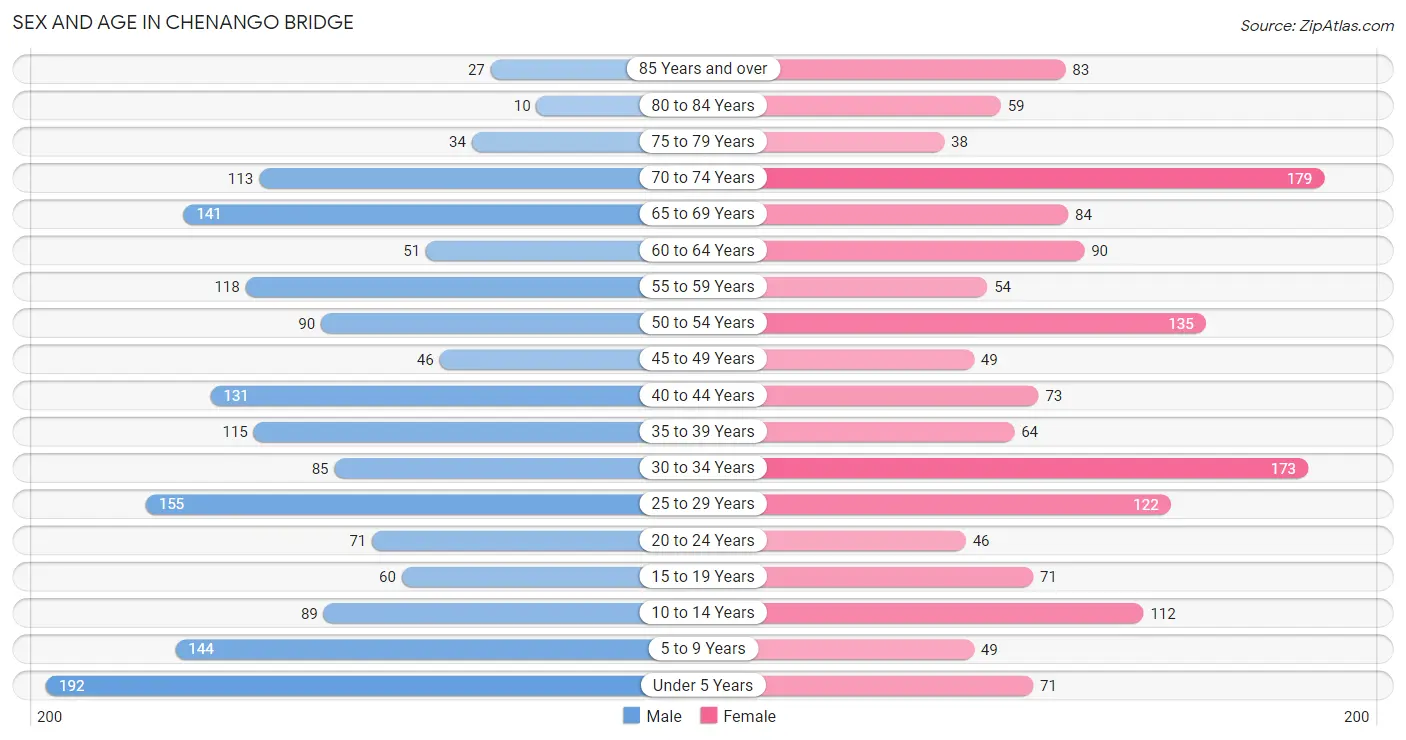
Sex and Age in Chenango Bridge
Sex and Age in Chenango Bridge
The most populous age groups in Chenango Bridge are Under 5 Years (192 | 11.5%) for men and 70 to 74 Years (179 | 11.5%) for women.
| Age Bracket | Male | Female |
| Under 5 Years | 192 (11.5%) | 71 (4.6%) |
| 5 to 9 Years | 144 (8.6%) | 49 (3.2%) |
| 10 to 14 Years | 89 (5.3%) | 112 (7.2%) |
| 15 to 19 Years | 60 (3.6%) | 71 (4.6%) |
| 20 to 24 Years | 71 (4.3%) | 46 (3.0%) |
| 25 to 29 Years | 155 (9.3%) | 122 (7.9%) |
| 30 to 34 Years | 85 (5.1%) | 173 (11.2%) |
| 35 to 39 Years | 115 (6.9%) | 64 (4.1%) |
| 40 to 44 Years | 131 (7.8%) | 73 (4.7%) |
| 45 to 49 Years | 46 (2.8%) | 49 (3.2%) |
| 50 to 54 Years | 90 (5.4%) | 135 (8.7%) |
| 55 to 59 Years | 118 (7.1%) | 54 (3.5%) |
| 60 to 64 Years | 51 (3.0%) | 90 (5.8%) |
| 65 to 69 Years | 141 (8.4%) | 84 (5.4%) |
| 70 to 74 Years | 113 (6.8%) | 179 (11.5%) |
| 75 to 79 Years | 34 (2.0%) | 38 (2.5%) |
| 80 to 84 Years | 10 (0.6%) | 59 (3.8%) |
| 85 Years and over | 27 (1.6%) | 83 (5.3%) |
| Total | 1,672 (100.0%) | 1,552 (100.0%) |
Families and Households in Chenango Bridge
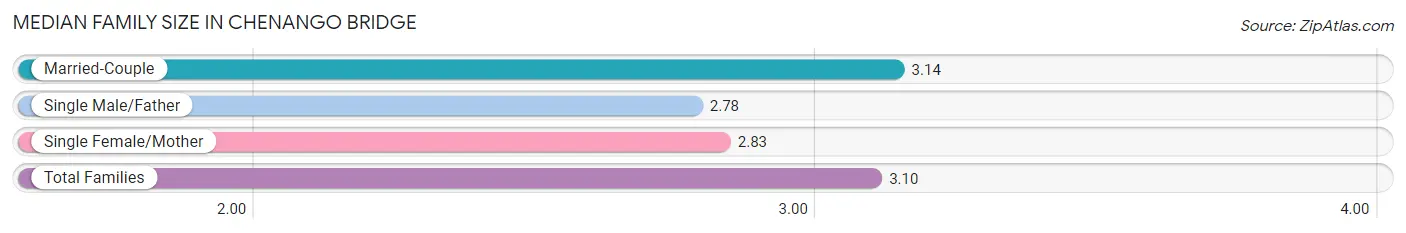
Median Family Size in Chenango Bridge
The median family size in Chenango Bridge is 3.10 persons per family, with married-couple families (812 | 87.9%) accounting for the largest median family size of 3.14 persons per family. On the other hand, single male/father families (37 | 4.0%) represent the smallest median family size with 2.78 persons per family.
| Family Type | # Families | Family Size |
| Married-Couple | 812 (87.9%) | 3.14 |
| Single Male/Father | 37 (4.0%) | 2.78 |
| Single Female/Mother | 75 (8.1%) | 2.83 |
| Total Families | 924 (100.0%) | 3.10 |
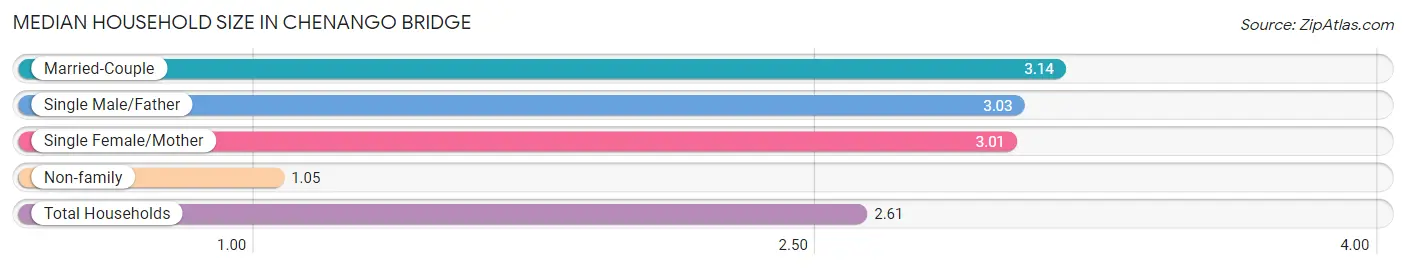
Median Household Size in Chenango Bridge
The median household size in Chenango Bridge is 2.61 persons per household, with married-couple households (812 | 65.7%) accounting for the largest median household size of 3.14 persons per household. non-family households (311 | 25.2%) represent the smallest median household size with 1.05 persons per household.
| Household Type | # Households | Household Size |
| Married-Couple | 812 (65.7%) | 3.14 |
| Single Male/Father | 37 (3.0%) | 3.03 |
| Single Female/Mother | 75 (6.1%) | 3.01 |
| Non-family | 311 (25.2%) | 1.05 |
| Total Households | 1,235 (100.0%) | 2.61 |
Household Size by Marriage Status in Chenango Bridge
Out of a total of 1,235 households in Chenango Bridge, 924 (74.8%) are family households, while 311 (25.2%) are nonfamily households. The most numerous type of family households are 2-person households, comprising 478, and the most common type of nonfamily households are 1-person households, comprising 293.
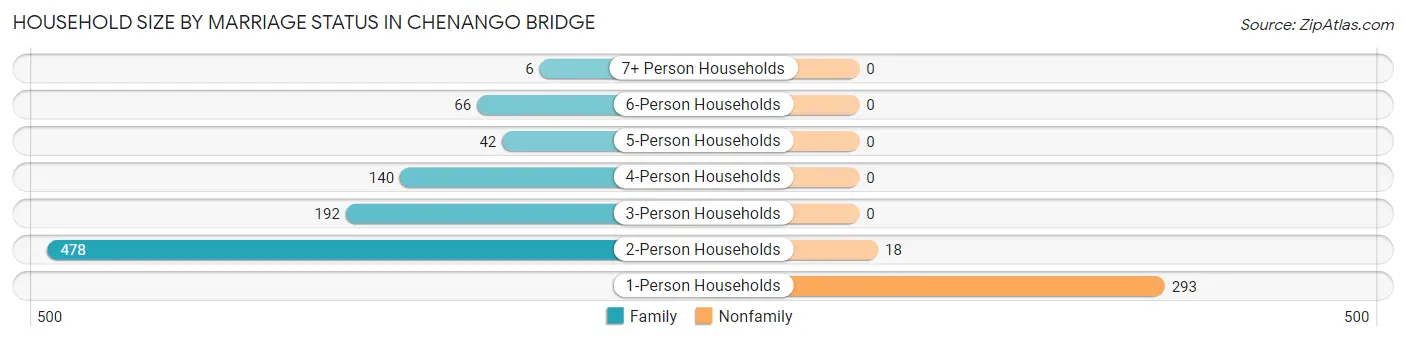
| Household Size | Family Households | Nonfamily Households |
| 1-Person Households | - | 293 (23.7%) |
| 2-Person Households | 478 (38.7%) | 18 (1.5%) |
| 3-Person Households | 192 (15.5%) | 0 (0.0%) |
| 4-Person Households | 140 (11.3%) | 0 (0.0%) |
| 5-Person Households | 42 (3.4%) | 0 (0.0%) |
| 6-Person Households | 66 (5.3%) | 0 (0.0%) |
| 7+ Person Households | 6 (0.5%) | 0 (0.0%) |
| Total | 924 (74.8%) | 311 (25.2%) |
Female Fertility in Chenango Bridge
Fertility by Age in Chenango Bridge
Average fertility rate in Chenango Bridge is 55.0 births per 1,000 women. Women in the age bracket of 20 to 34 years have the highest fertility rate with 103.0 births per 1,000 women. Women in the age bracket of 20 to 34 years acount for 100.0% of all women with births.
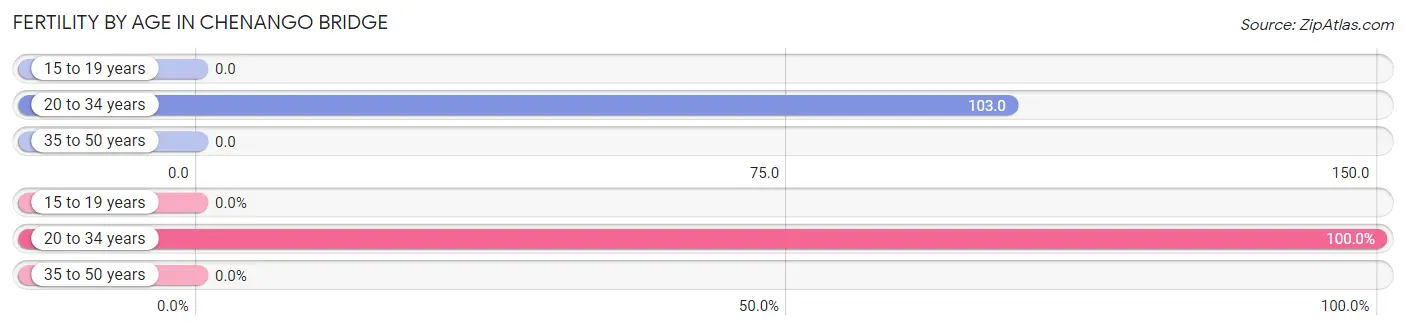
| Age Bracket | Women with Births | Births / 1,000 Women |
| 15 to 19 years | 0 (0.0%) | 0.0 |
| 20 to 34 years | 35 (100.0%) | 103.0 |
| 35 to 50 years | 0 (0.0%) | 0.0 |
| Total | 35 (100.0%) | 55.0 |
Fertility by Age by Marriage Status in Chenango Bridge
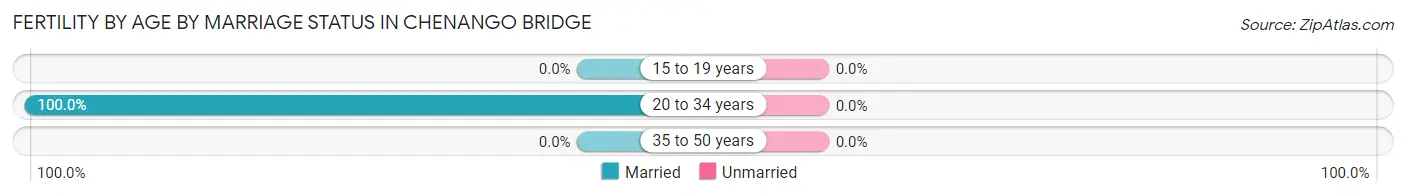
| Age Bracket | Married | Unmarried |
| 15 to 19 years | 0 (0.0%) | 0 (0.0%) |
| 20 to 34 years | 35 (100.0%) | 0 (0.0%) |
| 35 to 50 years | 0 (0.0%) | 0 (0.0%) |
| Total | 35 (100.0%) | 0 (0.0%) |
Fertility by Education in Chenango Bridge
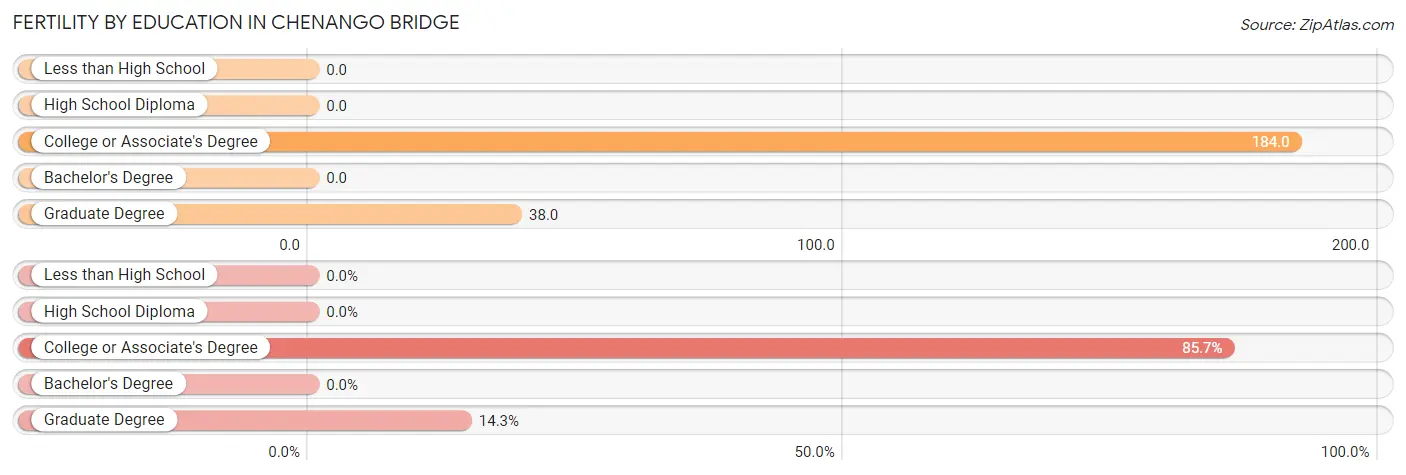
| Educational Attainment | Women with Births | Births / 1,000 Women |
| Less than High School | 0 (0.0%) | 0.0 |
| High School Diploma | 0 (0.0%) | 0.0 |
| College or Associate's Degree | 30 (85.7%) | 184.0 |
| Bachelor's Degree | 0 (0.0%) | 0.0 |
| Graduate Degree | 5 (14.3%) | 38.0 |
| Total | 35 (100.0%) | 55.0 |
Fertility by Education by Marriage Status in Chenango Bridge
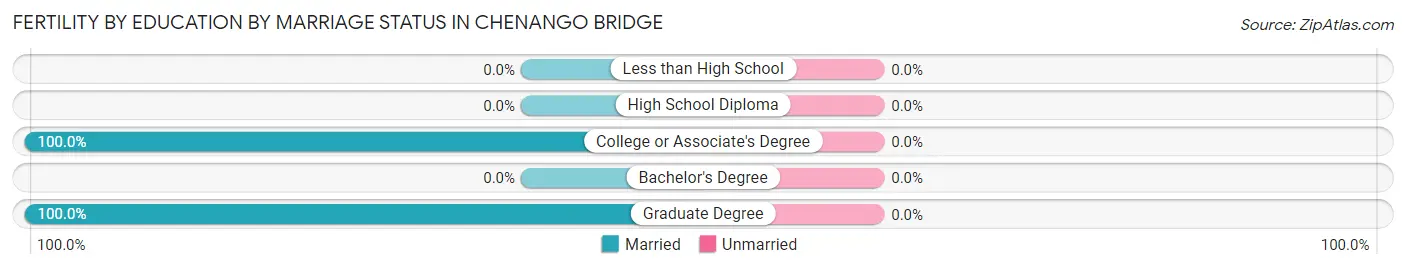
| Educational Attainment | Married | Unmarried |
| Less than High School | 0 (0.0%) | 0 (0.0%) |
| High School Diploma | 0 (0.0%) | 0 (0.0%) |
| College or Associate's Degree | 30 (100.0%) | 0 (0.0%) |
| Bachelor's Degree | 0 (0.0%) | 0 (0.0%) |
| Graduate Degree | 5 (100.0%) | 0 (0.0%) |
| Total | 35 (100.0%) | 0 (0.0%) |
Employment Characteristics in Chenango Bridge
Employment by Class of Employer in Chenango Bridge
Among the 1,431 employed individuals in Chenango Bridge, private company employees (822 | 57.4%), local government employees (311 | 21.7%), and state government employees (146 | 10.2%) make up the most common classes of employment.
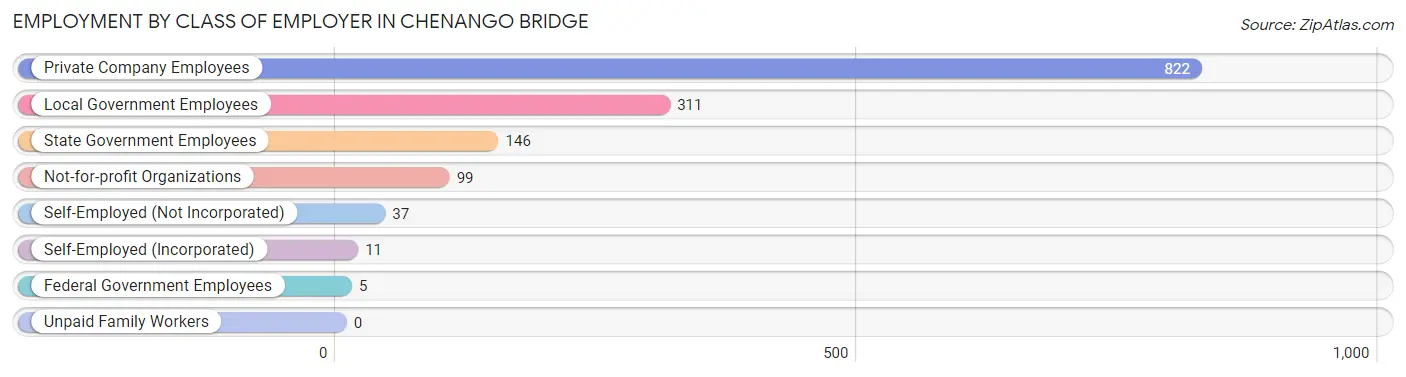
| Employer Class | # Employees | % Employees |
| Private Company Employees | 822 | 57.4% |
| Self-Employed (Incorporated) | 11 | 0.8% |
| Self-Employed (Not Incorporated) | 37 | 2.6% |
| Not-for-profit Organizations | 99 | 6.9% |
| Local Government Employees | 311 | 21.7% |
| State Government Employees | 146 | 10.2% |
| Federal Government Employees | 5 | 0.4% |
| Unpaid Family Workers | 0 | 0.0% |
| Total | 1,431 | 100.0% |
Employment Status by Age in Chenango Bridge
According to the labor force statistics for Chenango Bridge, out of the total population over 16 years of age (2,532), 64.7% or 1,638 individuals are in the labor force, with 9.7% or 159 of them unemployed. The age group with the highest labor force participation rate is 35 to 44 years, with 95.8% or 367 individuals in the labor force. Within the labor force, the 25 to 29 years age range has the highest percentage of unemployed individuals, with 51.4% or 133 of them being unemployed.
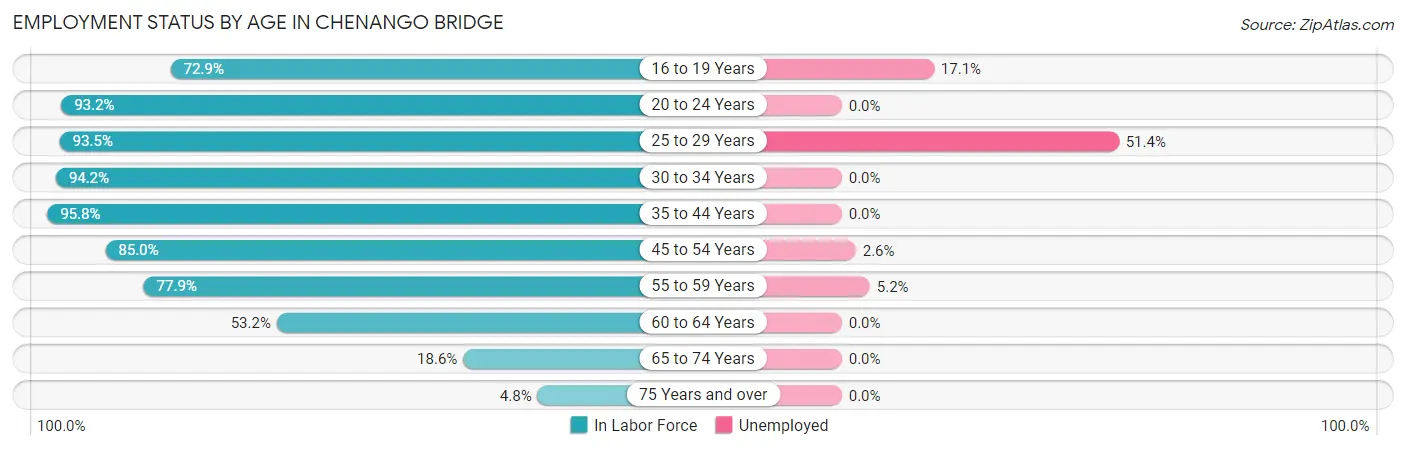
| Age Bracket | In Labor Force | Unemployed |
| 16 to 19 Years | 70 (72.9%) | 12 (17.1%) |
| 20 to 24 Years | 109 (93.2%) | 0 (0.0%) |
| 25 to 29 Years | 259 (93.5%) | 133 (51.4%) |
| 30 to 34 Years | 243 (94.2%) | 0 (0.0%) |
| 35 to 44 Years | 367 (95.8%) | 0 (0.0%) |
| 45 to 54 Years | 272 (85.0%) | 7 (2.6%) |
| 55 to 59 Years | 134 (77.9%) | 7 (5.2%) |
| 60 to 64 Years | 75 (53.2%) | 0 (0.0%) |
| 65 to 74 Years | 96 (18.6%) | 0 (0.0%) |
| 75 Years and over | 12 (4.8%) | 0 (0.0%) |
| Total | 1,638 (64.7%) | 159 (9.7%) |
Employment Status by Educational Attainment in Chenango Bridge
According to labor force statistics for Chenango Bridge, 87.0% of individuals (1,349) out of the total population between 25 and 64 years of age (1,551) are in the labor force, with 10.9% or 147 of them being unemployed. The group with the highest labor force participation rate are those with the educational attainment of less than high school, with 100.0% or 14 individuals in the labor force. Within the labor force, individuals with high school diploma education have the highest percentage of unemployment, with 29.2% or 133 of them being unemployed.
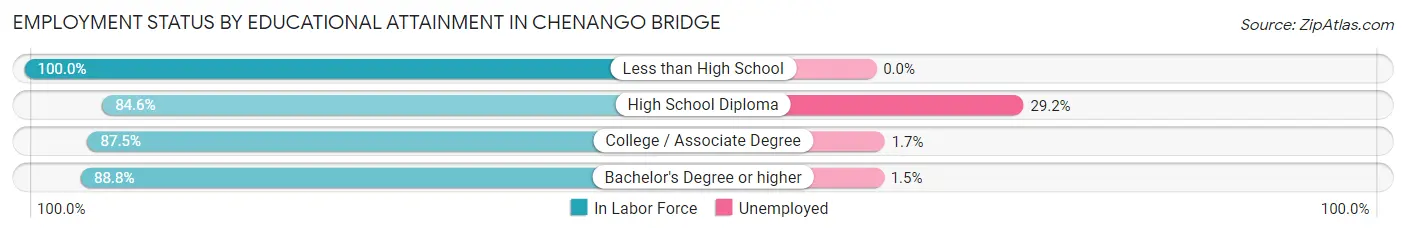
| Educational Attainment | In Labor Force | Unemployed |
| Less than High School | 14 (100.0%) | 0 (0.0%) |
| High School Diploma | 455 (84.6%) | 157 (29.2%) |
| College / Associate Degree | 414 (87.5%) | 8 (1.7%) |
| Bachelor's Degree or higher | 467 (88.8%) | 8 (1.5%) |
| Total | 1,349 (87.0%) | 169 (10.9%) |
Employment Occupations by Sex in Chenango Bridge
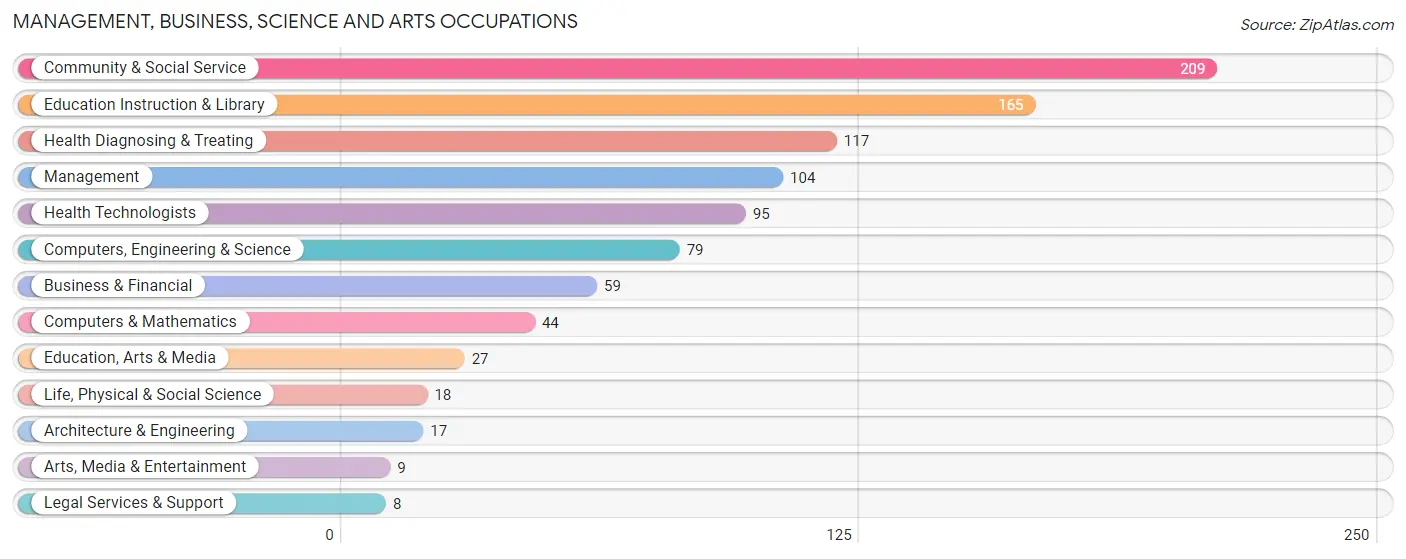
Management, Business, Science and Arts Occupations
The most common Management, Business, Science and Arts occupations in Chenango Bridge are Community & Social Service (209 | 14.1%), Education Instruction & Library (165 | 11.2%), Health Diagnosing & Treating (117 | 7.9%), Management (104 | 7.0%), and Health Technologists (95 | 6.4%).
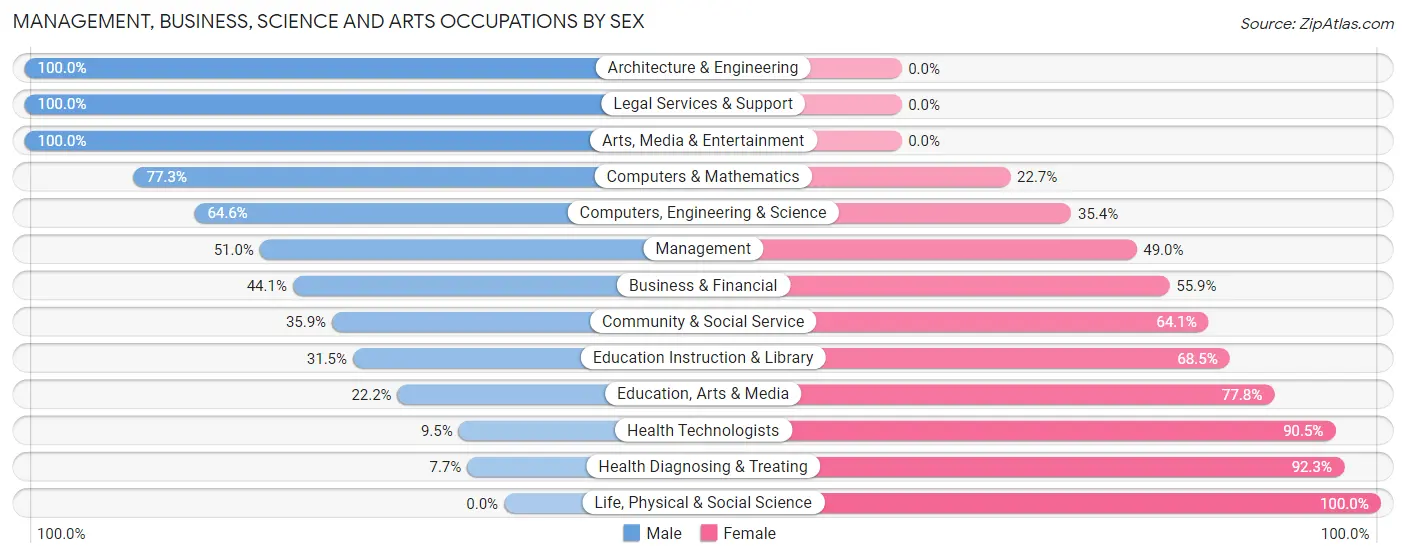
Management, Business, Science and Arts Occupations by Sex
Within the Management, Business, Science and Arts occupations in Chenango Bridge, the most male-oriented occupations are Architecture & Engineering (100.0%), Legal Services & Support (100.0%), and Arts, Media & Entertainment (100.0%), while the most female-oriented occupations are Life, Physical & Social Science (100.0%), Health Diagnosing & Treating (92.3%), and Health Technologists (90.5%).
| Occupation | Male | Female |
| Management | 53 (51.0%) | 51 (49.0%) |
| Business & Financial | 26 (44.1%) | 33 (55.9%) |
| Computers, Engineering & Science | 51 (64.6%) | 28 (35.4%) |
| Computers & Mathematics | 34 (77.3%) | 10 (22.7%) |
| Architecture & Engineering | 17 (100.0%) | 0 (0.0%) |
| Life, Physical & Social Science | 0 (0.0%) | 18 (100.0%) |
| Community & Social Service | 75 (35.9%) | 134 (64.1%) |
| Education, Arts & Media | 6 (22.2%) | 21 (77.8%) |
| Legal Services & Support | 8 (100.0%) | 0 (0.0%) |
| Education Instruction & Library | 52 (31.5%) | 113 (68.5%) |
| Arts, Media & Entertainment | 9 (100.0%) | 0 (0.0%) |
| Health Diagnosing & Treating | 9 (7.7%) | 108 (92.3%) |
| Health Technologists | 9 (9.5%) | 86 (90.5%) |
| Total (Category) | 214 (37.7%) | 354 (62.3%) |
| Total (Overall) | 739 (50.0%) | 739 (50.0%) |
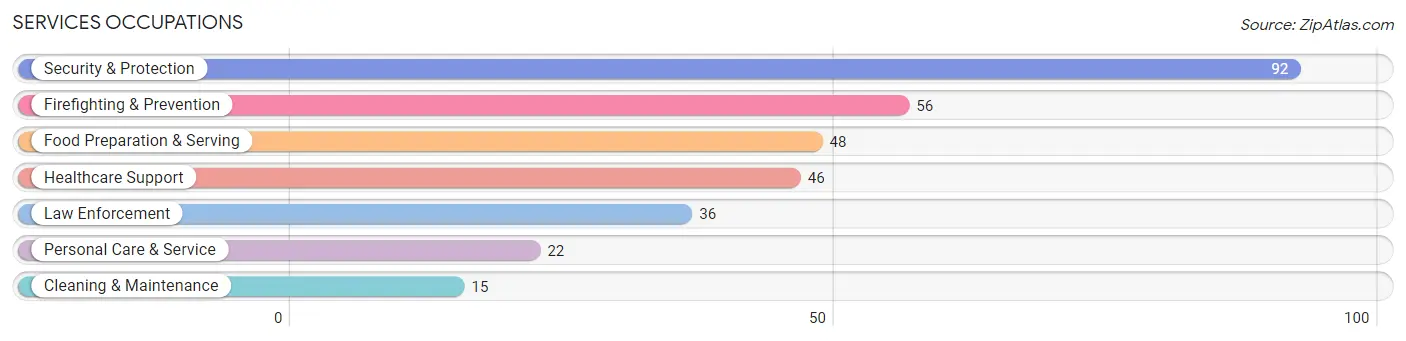
Services Occupations
The most common Services occupations in Chenango Bridge are Security & Protection (92 | 6.2%), Firefighting & Prevention (56 | 3.8%), Food Preparation & Serving (48 | 3.3%), Healthcare Support (46 | 3.1%), and Law Enforcement (36 | 2.4%).
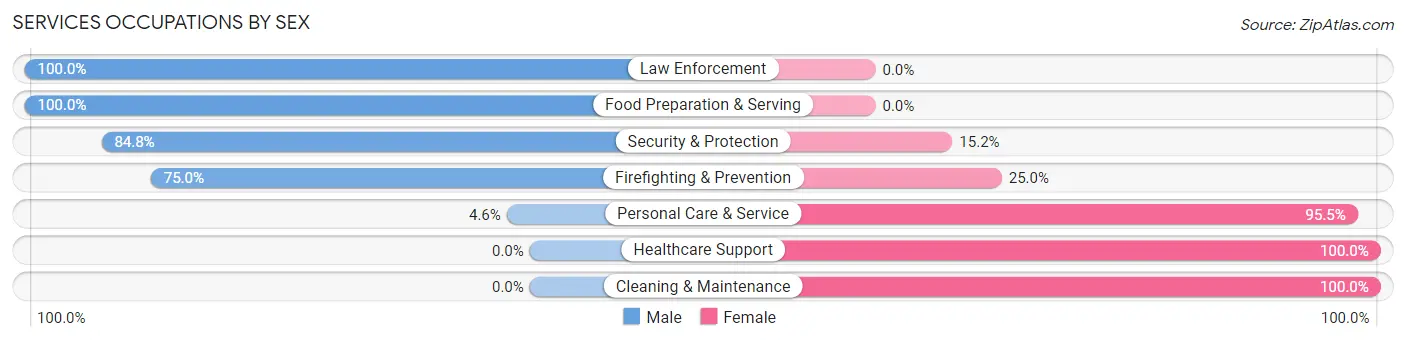
Services Occupations by Sex
Within the Services occupations in Chenango Bridge, the most male-oriented occupations are Law Enforcement (100.0%), Food Preparation & Serving (100.0%), and Security & Protection (84.8%), while the most female-oriented occupations are Healthcare Support (100.0%), Cleaning & Maintenance (100.0%), and Personal Care & Service (95.5%).
| Occupation | Male | Female |
| Healthcare Support | 0 (0.0%) | 46 (100.0%) |
| Security & Protection | 78 (84.8%) | 14 (15.2%) |
| Firefighting & Prevention | 42 (75.0%) | 14 (25.0%) |
| Law Enforcement | 36 (100.0%) | 0 (0.0%) |
| Food Preparation & Serving | 48 (100.0%) | 0 (0.0%) |
| Cleaning & Maintenance | 0 (0.0%) | 15 (100.0%) |
| Personal Care & Service | 1 (4.5%) | 21 (95.5%) |
| Total (Category) | 127 (57.0%) | 96 (43.0%) |
| Total (Overall) | 739 (50.0%) | 739 (50.0%) |
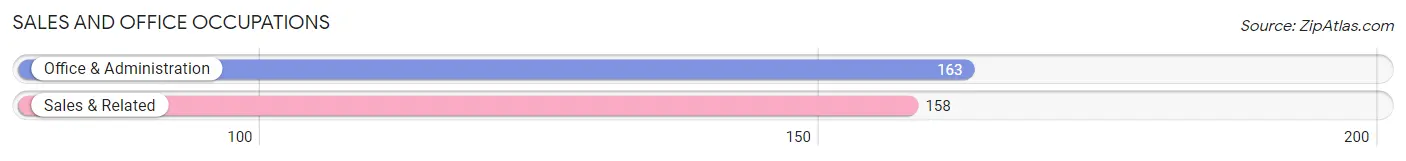
Sales and Office Occupations
The most common Sales and Office occupations in Chenango Bridge are Office & Administration (163 | 11.0%), and Sales & Related (158 | 10.7%).
Sales and Office Occupations by Sex
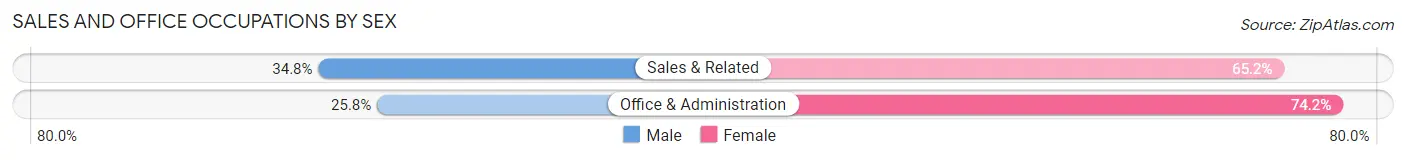
| Occupation | Male | Female |
| Sales & Related | 55 (34.8%) | 103 (65.2%) |
| Office & Administration | 42 (25.8%) | 121 (74.2%) |
| Total (Category) | 97 (30.2%) | 224 (69.8%) |
| Total (Overall) | 739 (50.0%) | 739 (50.0%) |
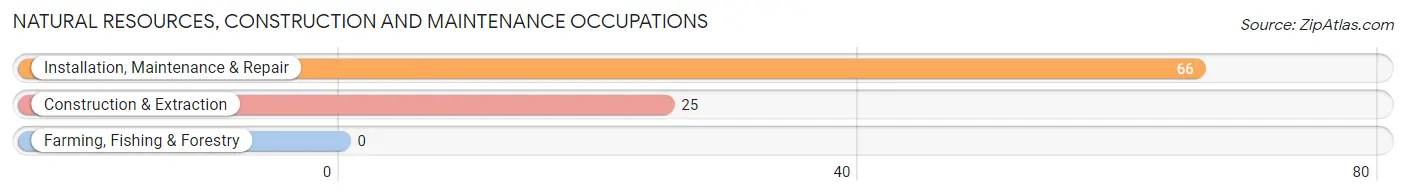
Natural Resources, Construction and Maintenance Occupations
The most common Natural Resources, Construction and Maintenance occupations in Chenango Bridge are Installation, Maintenance & Repair (66 | 4.5%), and Construction & Extraction (25 | 1.7%).
Natural Resources, Construction and Maintenance Occupations by Sex
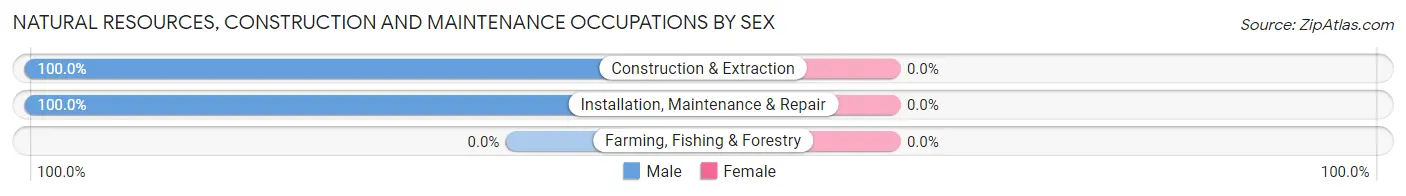
| Occupation | Male | Female |
| Farming, Fishing & Forestry | 0 (0.0%) | 0 (0.0%) |
| Construction & Extraction | 25 (100.0%) | 0 (0.0%) |
| Installation, Maintenance & Repair | 66 (100.0%) | 0 (0.0%) |
| Total (Category) | 91 (100.0%) | 0 (0.0%) |
| Total (Overall) | 739 (50.0%) | 739 (50.0%) |
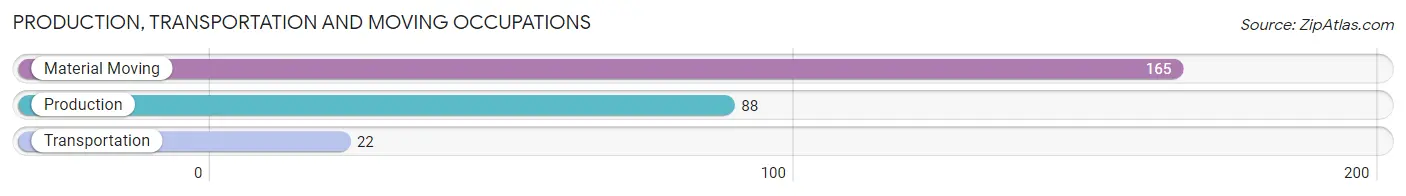
Production, Transportation and Moving Occupations
The most common Production, Transportation and Moving occupations in Chenango Bridge are Material Moving (165 | 11.2%), Production (88 | 5.9%), and Transportation (22 | 1.5%).
Production, Transportation and Moving Occupations by Sex
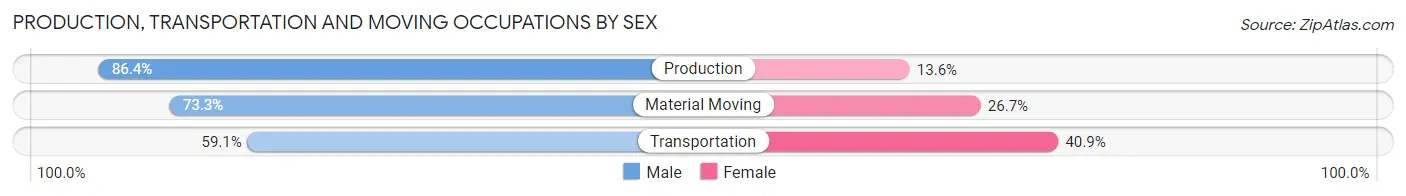
| Occupation | Male | Female |
| Production | 76 (86.4%) | 12 (13.6%) |
| Transportation | 13 (59.1%) | 9 (40.9%) |
| Material Moving | 121 (73.3%) | 44 (26.7%) |
| Total (Category) | 210 (76.4%) | 65 (23.6%) |
| Total (Overall) | 739 (50.0%) | 739 (50.0%) |
Employment Industries by Sex in Chenango Bridge
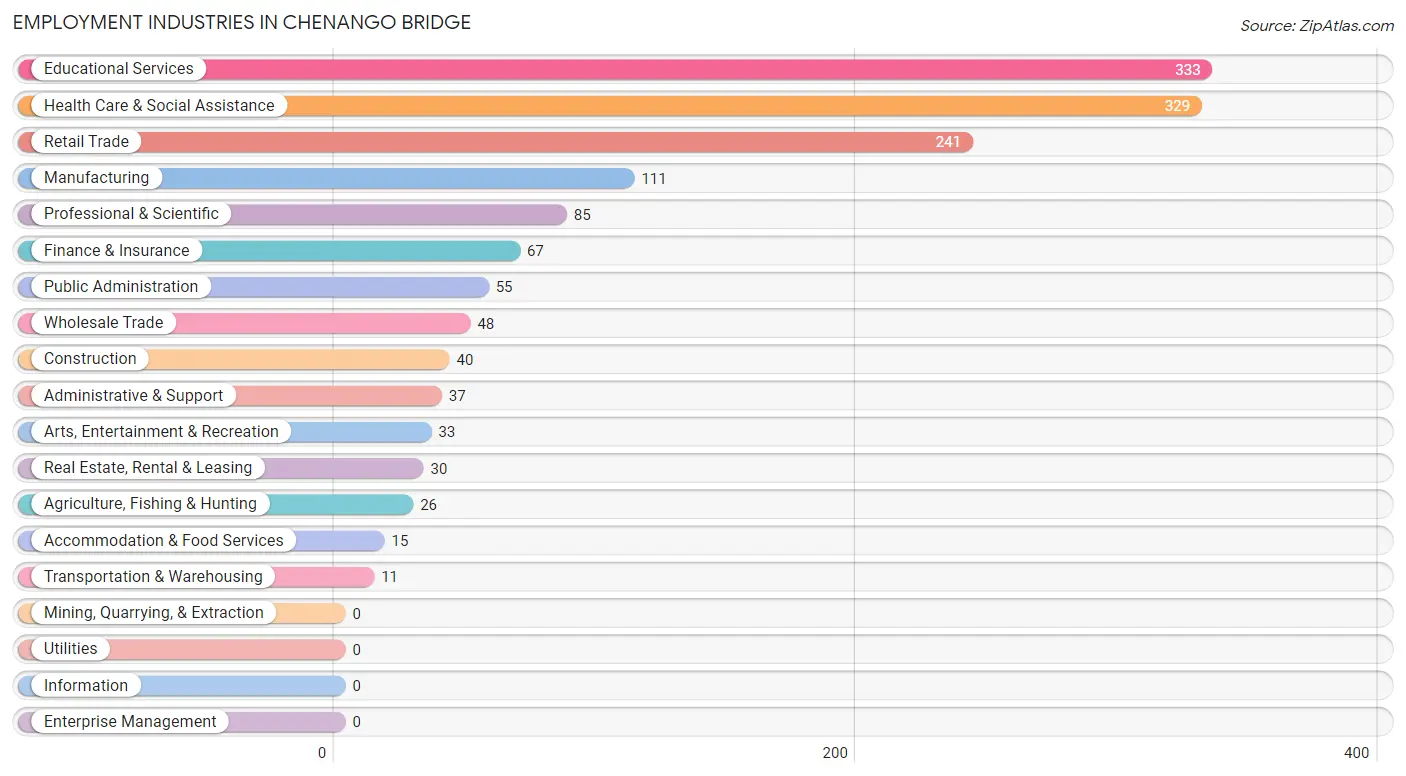
Employment Industries in Chenango Bridge
The major employment industries in Chenango Bridge include Educational Services (333 | 22.5%), Health Care & Social Assistance (329 | 22.3%), Retail Trade (241 | 16.3%), Manufacturing (111 | 7.5%), and Professional & Scientific (85 | 5.8%).
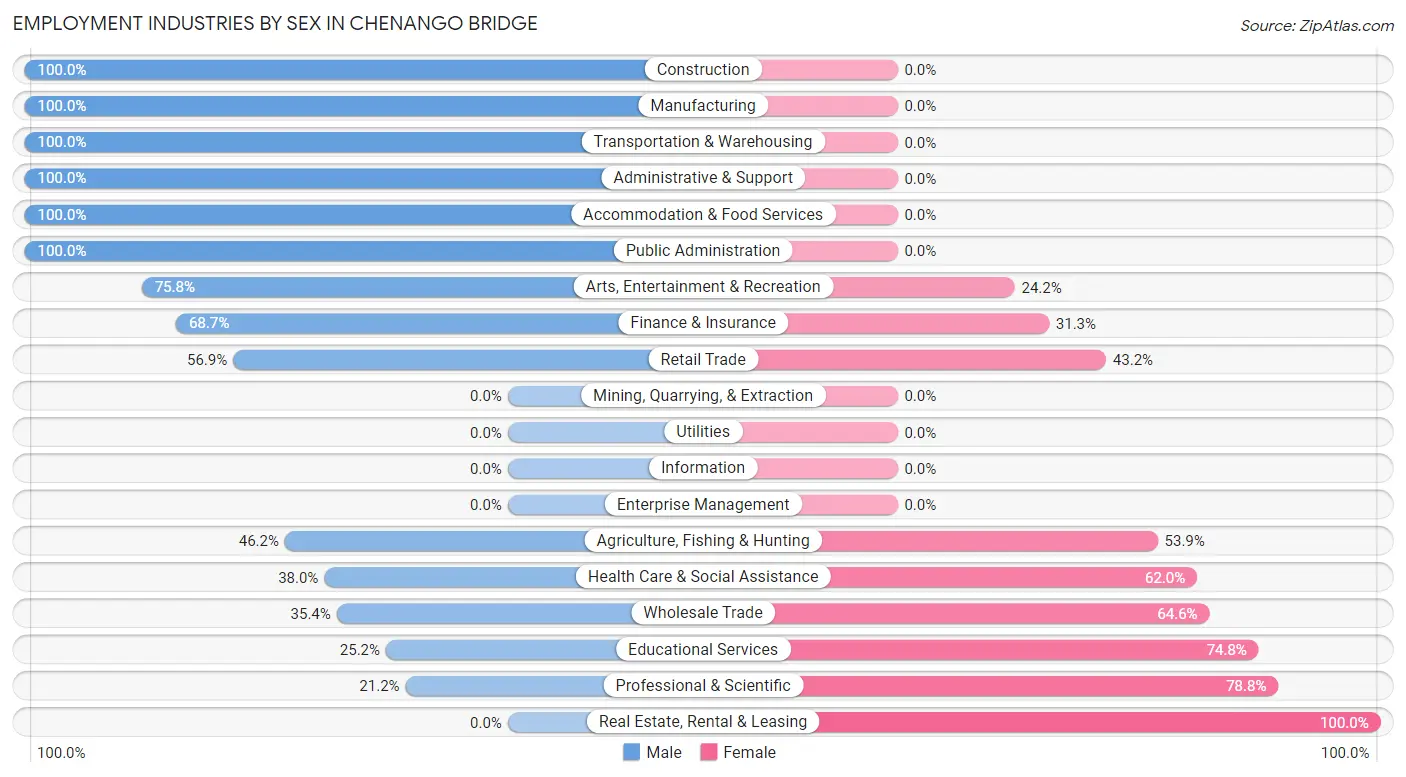
Employment Industries by Sex in Chenango Bridge
The Chenango Bridge industries that see more men than women are Construction (100.0%), Manufacturing (100.0%), and Transportation & Warehousing (100.0%), whereas the industries that tend to have a higher number of women are Real Estate, Rental & Leasing (100.0%), Professional & Scientific (78.8%), and Educational Services (74.8%).
| Industry | Male | Female |
| Agriculture, Fishing & Hunting | 12 (46.2%) | 14 (53.8%) |
| Mining, Quarrying, & Extraction | 0 (0.0%) | 0 (0.0%) |
| Construction | 40 (100.0%) | 0 (0.0%) |
| Manufacturing | 111 (100.0%) | 0 (0.0%) |
| Wholesale Trade | 17 (35.4%) | 31 (64.6%) |
| Retail Trade | 137 (56.9%) | 104 (43.1%) |
| Transportation & Warehousing | 11 (100.0%) | 0 (0.0%) |
| Utilities | 0 (0.0%) | 0 (0.0%) |
| Information | 0 (0.0%) | 0 (0.0%) |
| Finance & Insurance | 46 (68.7%) | 21 (31.3%) |
| Real Estate, Rental & Leasing | 0 (0.0%) | 30 (100.0%) |
| Professional & Scientific | 18 (21.2%) | 67 (78.8%) |
| Enterprise Management | 0 (0.0%) | 0 (0.0%) |
| Administrative & Support | 37 (100.0%) | 0 (0.0%) |
| Educational Services | 84 (25.2%) | 249 (74.8%) |
| Health Care & Social Assistance | 125 (38.0%) | 204 (62.0%) |
| Arts, Entertainment & Recreation | 25 (75.8%) | 8 (24.2%) |
| Accommodation & Food Services | 15 (100.0%) | 0 (0.0%) |
| Public Administration | 55 (100.0%) | 0 (0.0%) |
| Total | 739 (50.0%) | 739 (50.0%) |
Education in Chenango Bridge
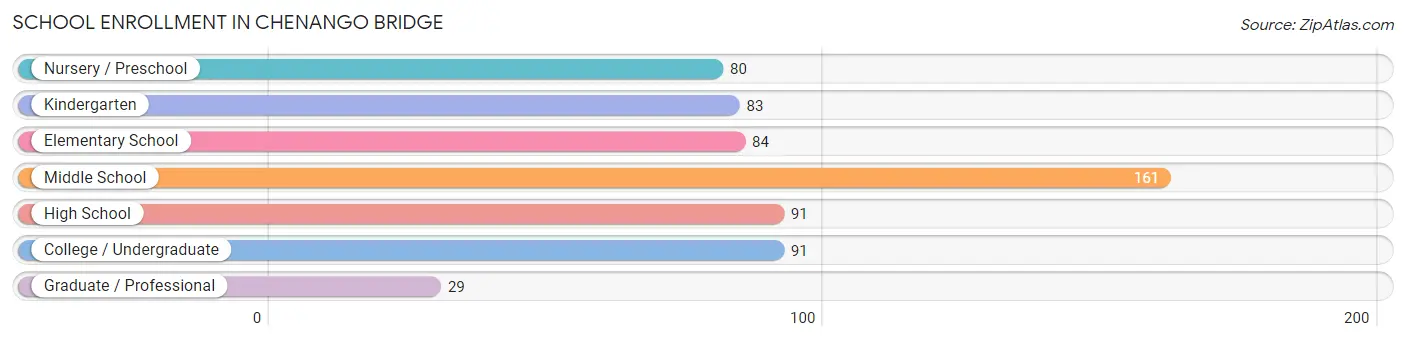
School Enrollment in Chenango Bridge
The most common levels of schooling among the 619 students in Chenango Bridge are middle school (161 | 26.0%), high school (91 | 14.7%), and college / undergraduate (91 | 14.7%).
| School Level | # Students | % Students |
| Nursery / Preschool | 80 | 12.9% |
| Kindergarten | 83 | 13.4% |
| Elementary School | 84 | 13.6% |
| Middle School | 161 | 26.0% |
| High School | 91 | 14.7% |
| College / Undergraduate | 91 | 14.7% |
| Graduate / Professional | 29 | 4.7% |
| Total | 619 | 100.0% |
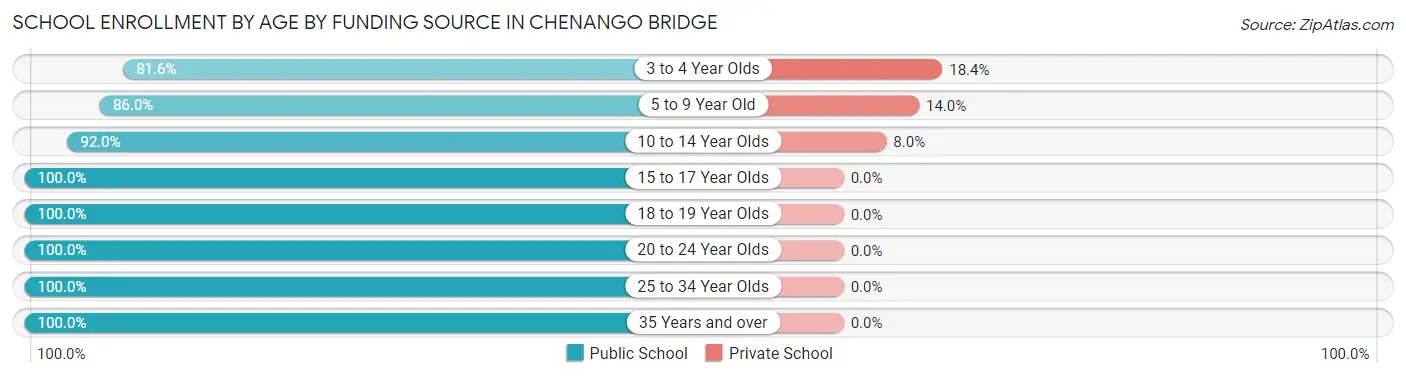
School Enrollment by Age by Funding Source in Chenango Bridge
Out of a total of 619 students who are enrolled in schools in Chenango Bridge, 50 (8.1%) attend a private institution, while the remaining 569 (91.9%) are enrolled in public schools. The age group of 3 to 4 year olds has the highest likelihood of being enrolled in private schools, with 9 (18.4% in the age bracket) enrolled. Conversely, the age group of 15 to 17 year olds has the lowest likelihood of being enrolled in a private school, with 71 (100.0% in the age bracket) attending a public institution.
| Age Bracket | Public School | Private School |
| 3 to 4 Year Olds | 40 (81.6%) | 9 (18.4%) |
| 5 to 9 Year Old | 153 (86.0%) | 25 (14.0%) |
| 10 to 14 Year Olds | 185 (92.0%) | 16 (8.0%) |
| 15 to 17 Year Olds | 71 (100.0%) | 0 (0.0%) |
| 18 to 19 Year Olds | 48 (100.0%) | 0 (0.0%) |
| 20 to 24 Year Olds | 27 (100.0%) | 0 (0.0%) |
| 25 to 34 Year Olds | 9 (100.0%) | 0 (0.0%) |
| 35 Years and over | 36 (100.0%) | 0 (0.0%) |
| Total | 569 (91.9%) | 50 (8.1%) |
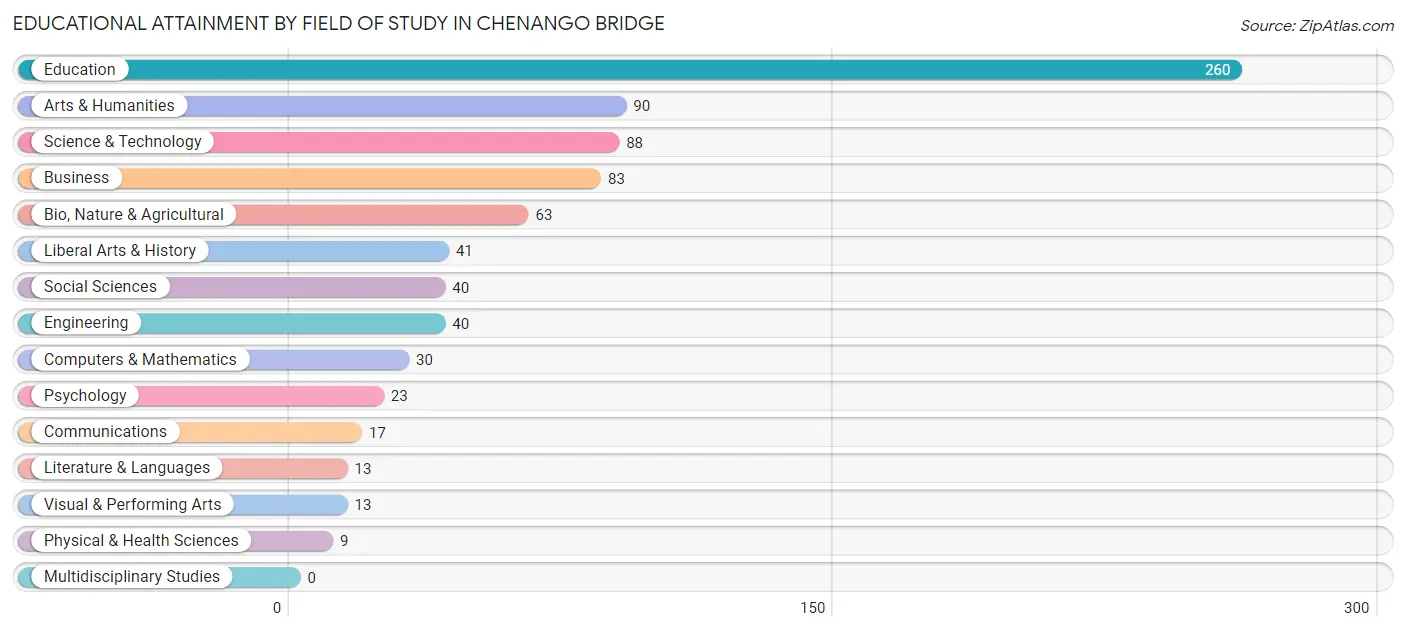
Educational Attainment by Field of Study in Chenango Bridge
Education (260 | 32.1%), arts & humanities (90 | 11.1%), science & technology (88 | 10.9%), business (83 | 10.2%), and bio, nature & agricultural (63 | 7.8%) are the most common fields of study among 810 individuals in Chenango Bridge who have obtained a bachelor's degree or higher.
| Field of Study | # Graduates | % Graduates |
| Computers & Mathematics | 30 | 3.7% |
| Bio, Nature & Agricultural | 63 | 7.8% |
| Physical & Health Sciences | 9 | 1.1% |
| Psychology | 23 | 2.8% |
| Social Sciences | 40 | 4.9% |
| Engineering | 40 | 4.9% |
| Multidisciplinary Studies | 0 | 0.0% |
| Science & Technology | 88 | 10.9% |
| Business | 83 | 10.2% |
| Education | 260 | 32.1% |
| Literature & Languages | 13 | 1.6% |
| Liberal Arts & History | 41 | 5.1% |
| Visual & Performing Arts | 13 | 1.6% |
| Communications | 17 | 2.1% |
| Arts & Humanities | 90 | 11.1% |
| Total | 810 | 100.0% |
Transportation & Commute in Chenango Bridge
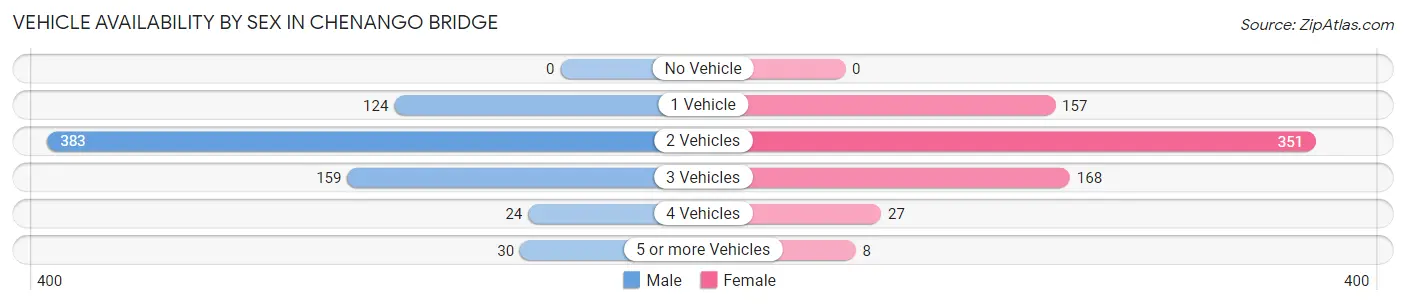
Vehicle Availability by Sex in Chenango Bridge
The most prevalent vehicle ownership categories in Chenango Bridge are males with 2 vehicles (383, accounting for 53.2%) and females with 2 vehicles (351, making up 53.9%).
| Vehicles Available | Male | Female |
| No Vehicle | 0 (0.0%) | 0 (0.0%) |
| 1 Vehicle | 124 (17.2%) | 157 (22.1%) |
| 2 Vehicles | 383 (53.2%) | 351 (49.4%) |
| 3 Vehicles | 159 (22.1%) | 168 (23.6%) |
| 4 Vehicles | 24 (3.3%) | 27 (3.8%) |
| 5 or more Vehicles | 30 (4.2%) | 8 (1.1%) |
| Total | 720 (100.0%) | 711 (100.0%) |
Commute Time in Chenango Bridge
The most frequently occuring commute durations in Chenango Bridge are 10 to 14 minutes (291 commuters, 22.1%), 15 to 19 minutes (278 commuters, 21.1%), and 20 to 24 minutes (268 commuters, 20.4%).
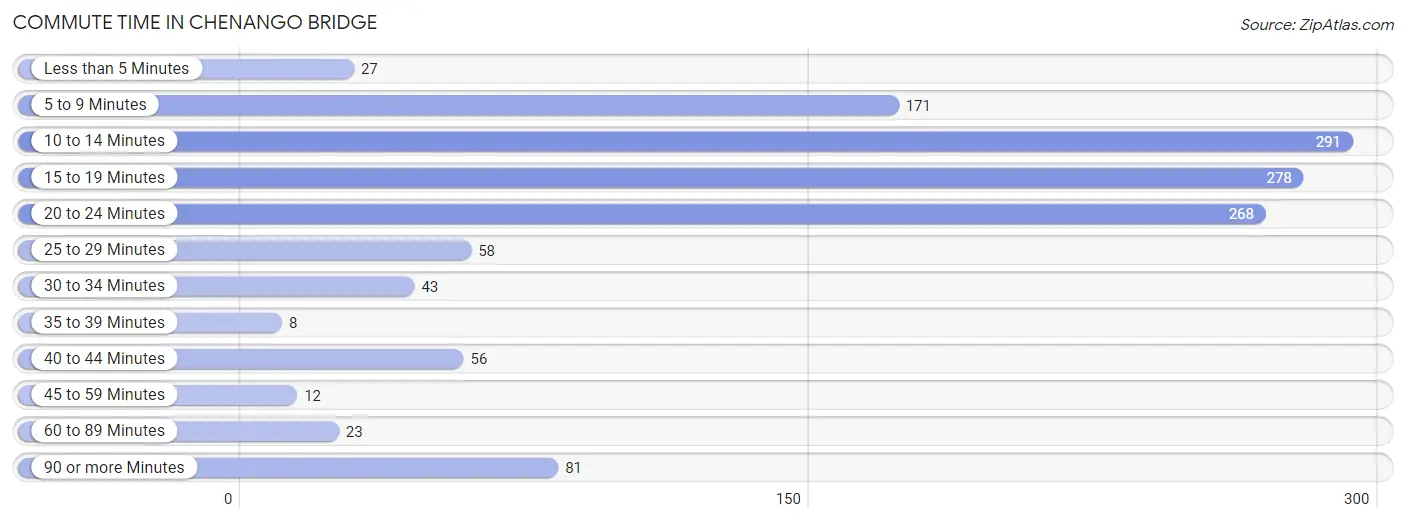
| Commute Time | # Commuters | % Commuters |
| Less than 5 Minutes | 27 | 2.1% |
| 5 to 9 Minutes | 171 | 13.0% |
| 10 to 14 Minutes | 291 | 22.1% |
| 15 to 19 Minutes | 278 | 21.1% |
| 20 to 24 Minutes | 268 | 20.4% |
| 25 to 29 Minutes | 58 | 4.4% |
| 30 to 34 Minutes | 43 | 3.3% |
| 35 to 39 Minutes | 8 | 0.6% |
| 40 to 44 Minutes | 56 | 4.3% |
| 45 to 59 Minutes | 12 | 0.9% |
| 60 to 89 Minutes | 23 | 1.8% |
| 90 or more Minutes | 81 | 6.2% |
Commute Time by Sex in Chenango Bridge
The most common commute times in Chenango Bridge are 10 to 14 minutes (170 commuters, 25.5%) for males and 15 to 19 minutes (145 commuters, 22.3%) for females.
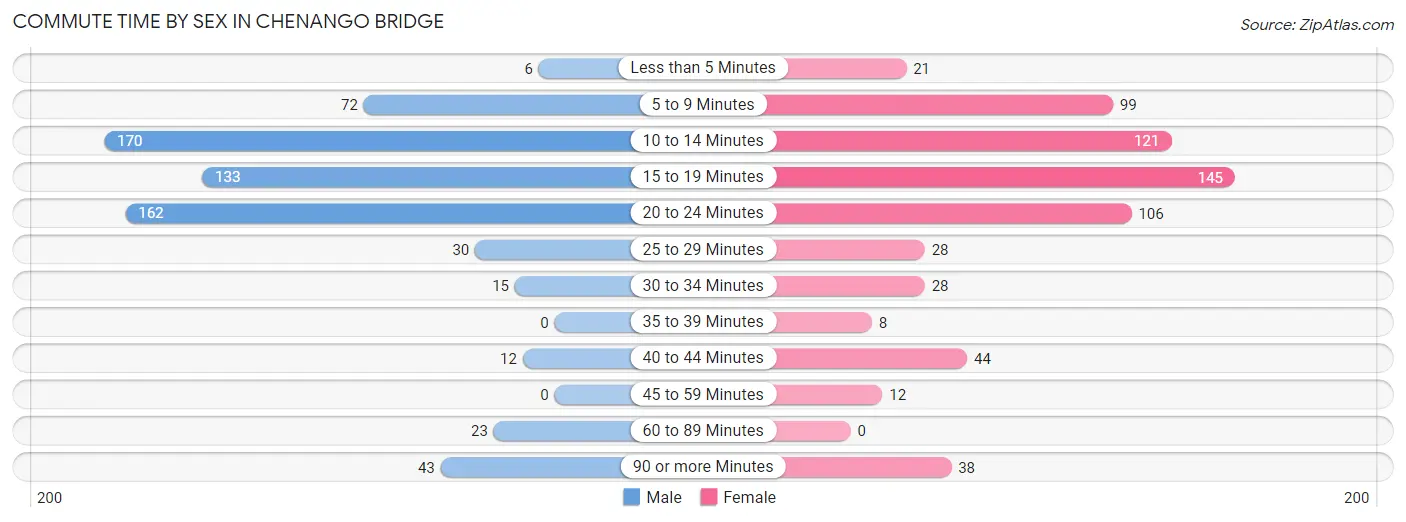
| Commute Time | Male | Female |
| Less than 5 Minutes | 6 (0.9%) | 21 (3.2%) |
| 5 to 9 Minutes | 72 (10.8%) | 99 (15.2%) |
| 10 to 14 Minutes | 170 (25.5%) | 121 (18.6%) |
| 15 to 19 Minutes | 133 (20.0%) | 145 (22.3%) |
| 20 to 24 Minutes | 162 (24.3%) | 106 (16.3%) |
| 25 to 29 Minutes | 30 (4.5%) | 28 (4.3%) |
| 30 to 34 Minutes | 15 (2.2%) | 28 (4.3%) |
| 35 to 39 Minutes | 0 (0.0%) | 8 (1.2%) |
| 40 to 44 Minutes | 12 (1.8%) | 44 (6.8%) |
| 45 to 59 Minutes | 0 (0.0%) | 12 (1.8%) |
| 60 to 89 Minutes | 23 (3.5%) | 0 (0.0%) |
| 90 or more Minutes | 43 (6.5%) | 38 (5.9%) |
Time of Departure to Work by Sex in Chenango Bridge
The most frequent times of departure to work in Chenango Bridge are 7:00 AM to 7:29 AM (101, 15.2%) for males and 7:30 AM to 7:59 AM (111, 17.1%) for females.
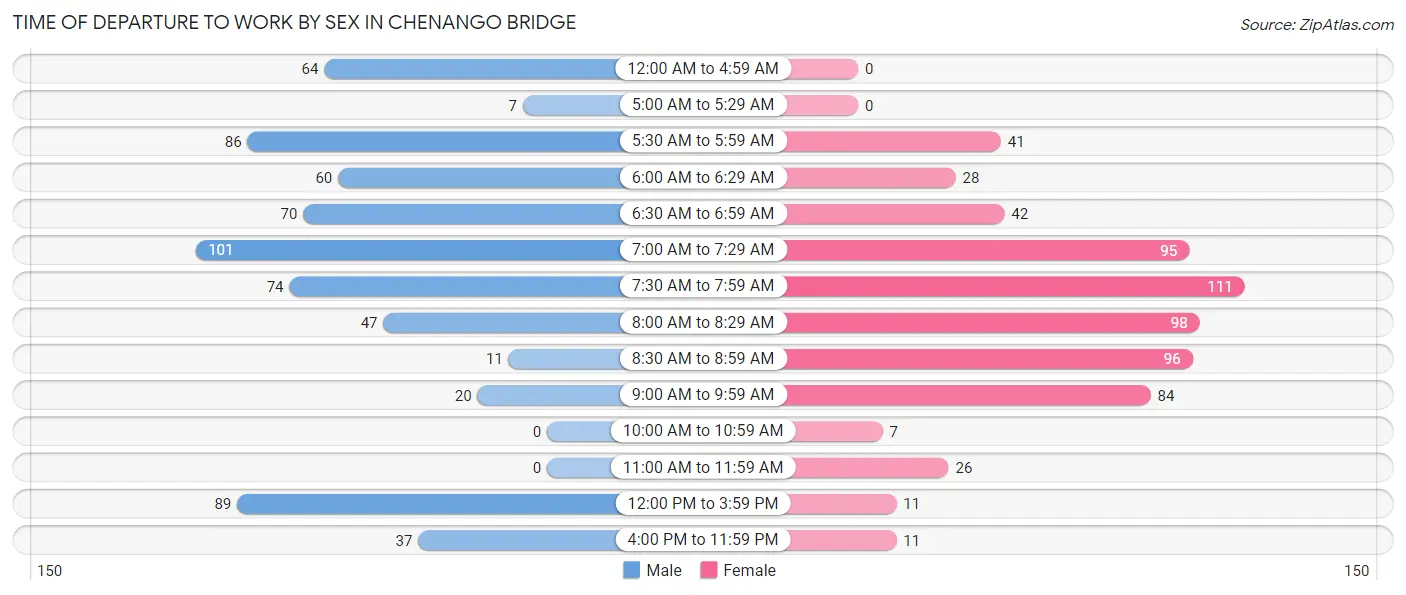
| Time of Departure | Male | Female |
| 12:00 AM to 4:59 AM | 64 (9.6%) | 0 (0.0%) |
| 5:00 AM to 5:29 AM | 7 (1.1%) | 0 (0.0%) |
| 5:30 AM to 5:59 AM | 86 (12.9%) | 41 (6.3%) |
| 6:00 AM to 6:29 AM | 60 (9.0%) | 28 (4.3%) |
| 6:30 AM to 6:59 AM | 70 (10.5%) | 42 (6.5%) |
| 7:00 AM to 7:29 AM | 101 (15.2%) | 95 (14.6%) |
| 7:30 AM to 7:59 AM | 74 (11.1%) | 111 (17.1%) |
| 8:00 AM to 8:29 AM | 47 (7.1%) | 98 (15.1%) |
| 8:30 AM to 8:59 AM | 11 (1.7%) | 96 (14.8%) |
| 9:00 AM to 9:59 AM | 20 (3.0%) | 84 (12.9%) |
| 10:00 AM to 10:59 AM | 0 (0.0%) | 7 (1.1%) |
| 11:00 AM to 11:59 AM | 0 (0.0%) | 26 (4.0%) |
| 12:00 PM to 3:59 PM | 89 (13.4%) | 11 (1.7%) |
| 4:00 PM to 11:59 PM | 37 (5.6%) | 11 (1.7%) |
| Total | 666 (100.0%) | 650 (100.0%) |
Housing Occupancy in Chenango Bridge
Occupancy by Ownership in Chenango Bridge
Of the total 1,235 dwellings in Chenango Bridge, owner-occupied units account for 1,156 (93.6%), while renter-occupied units make up 79 (6.4%).
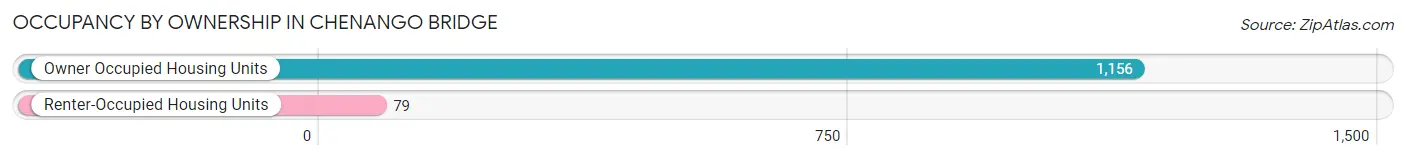
| Occupancy | # Housing Units | % Housing Units |
| Owner Occupied Housing Units | 1,156 | 93.6% |
| Renter-Occupied Housing Units | 79 | 6.4% |
| Total Occupied Housing Units | 1,235 | 100.0% |
Occupancy by Household Size in Chenango Bridge
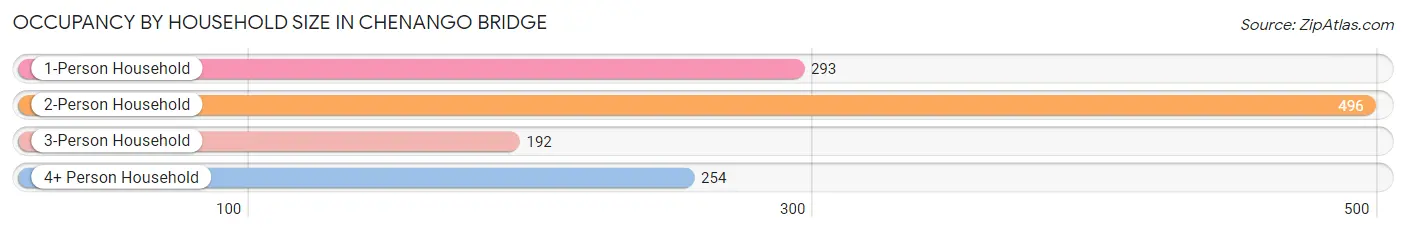
| Household Size | # Housing Units | % Housing Units |
| 1-Person Household | 293 | 23.7% |
| 2-Person Household | 496 | 40.2% |
| 3-Person Household | 192 | 15.5% |
| 4+ Person Household | 254 | 20.6% |
| Total Housing Units | 1,235 | 100.0% |
Occupancy by Ownership by Household Size in Chenango Bridge
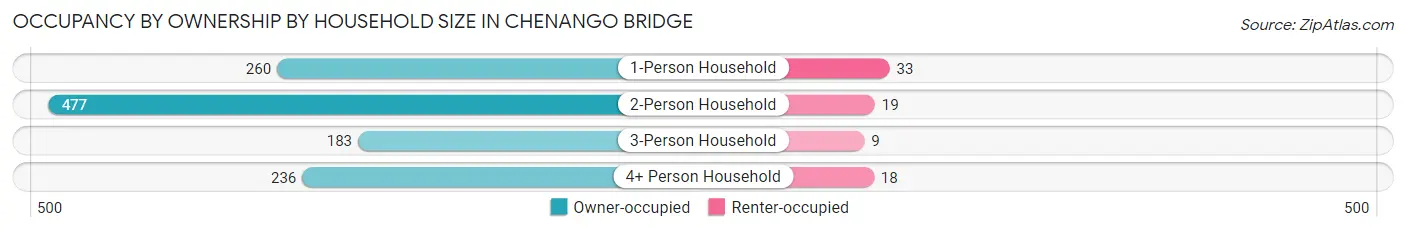
| Household Size | Owner-occupied | Renter-occupied |
| 1-Person Household | 260 (88.7%) | 33 (11.3%) |
| 2-Person Household | 477 (96.2%) | 19 (3.8%) |
| 3-Person Household | 183 (95.3%) | 9 (4.7%) |
| 4+ Person Household | 236 (92.9%) | 18 (7.1%) |
| Total Housing Units | 1,156 (93.6%) | 79 (6.4%) |
Occupancy by Educational Attainment in Chenango Bridge
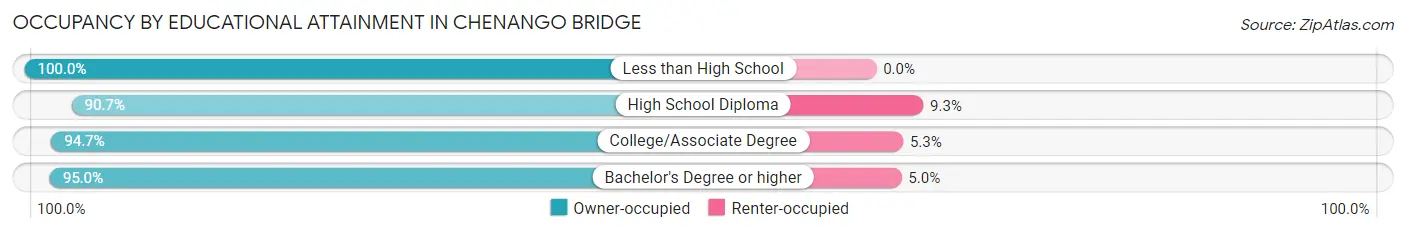
| Household Size | Owner-occupied | Renter-occupied |
| Less than High School | 24 (100.0%) | 0 (0.0%) |
| High School Diploma | 360 (90.7%) | 37 (9.3%) |
| College/Associate Degree | 392 (94.7%) | 22 (5.3%) |
| Bachelor's Degree or higher | 380 (95.0%) | 20 (5.0%) |
Occupancy by Age of Householder in Chenango Bridge
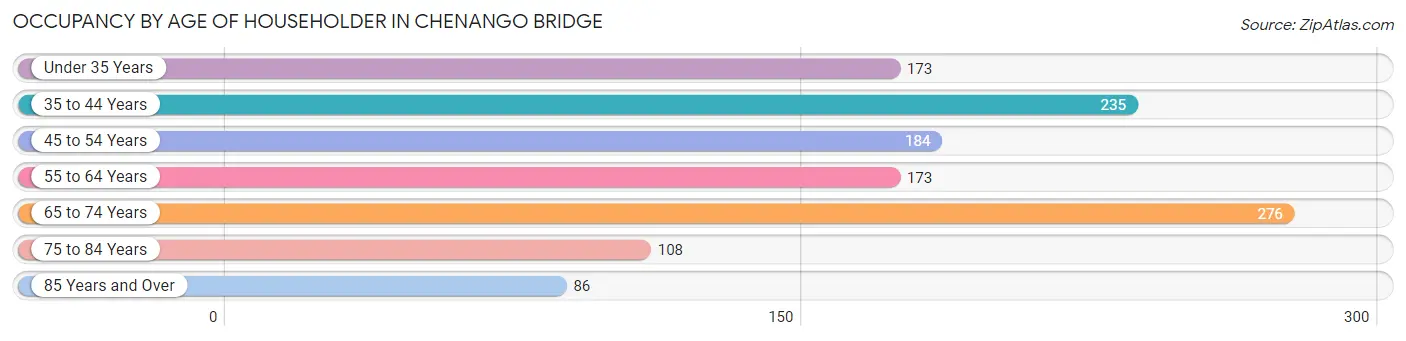
| Age Bracket | # Households | % Households |
| Under 35 Years | 173 | 14.0% |
| 35 to 44 Years | 235 | 19.0% |
| 45 to 54 Years | 184 | 14.9% |
| 55 to 64 Years | 173 | 14.0% |
| 65 to 74 Years | 276 | 22.4% |
| 75 to 84 Years | 108 | 8.7% |
| 85 Years and Over | 86 | 7.0% |
| Total | 1,235 | 100.0% |
Housing Finances in Chenango Bridge
Median Income by Occupancy in Chenango Bridge
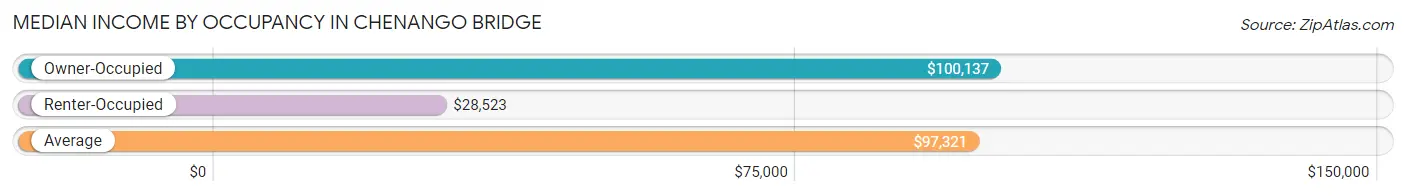
| Occupancy Type | # Households | Median Income |
| Owner-Occupied | 1,156 (93.6%) | $100,137 |
| Renter-Occupied | 79 (6.4%) | $28,523 |
| Average | 1,235 (100.0%) | $97,321 |
Occupancy by Householder Income Bracket in Chenango Bridge
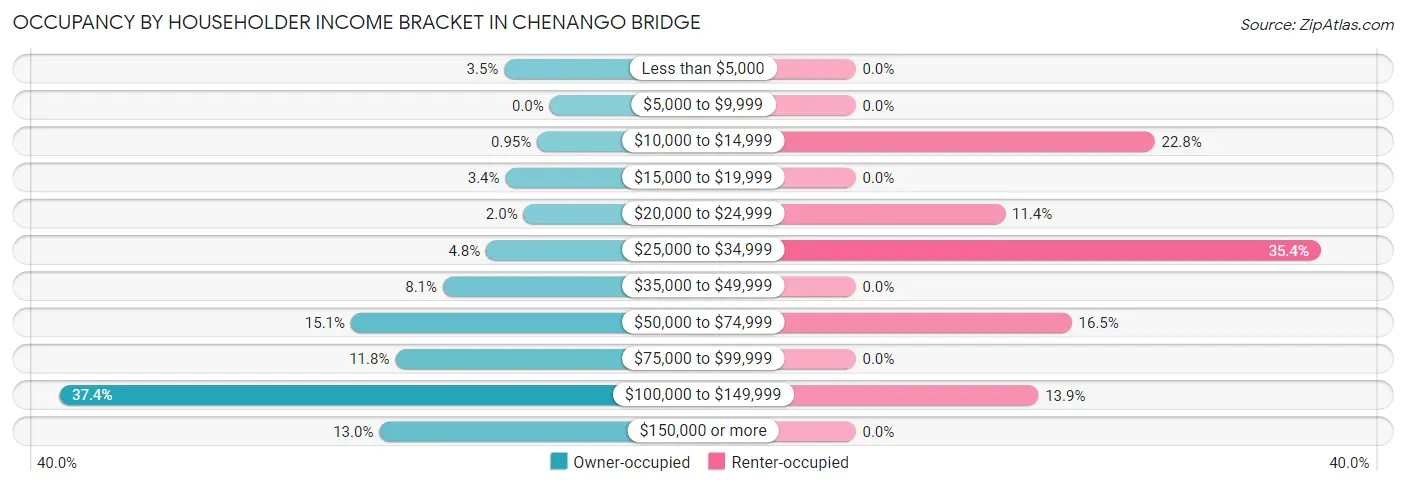
| Income Bracket | Owner-occupied | Renter-occupied |
| Less than $5,000 | 40 (3.5%) | 0 (0.0%) |
| $5,000 to $9,999 | 0 (0.0%) | 0 (0.0%) |
| $10,000 to $14,999 | 11 (0.9%) | 18 (22.8%) |
| $15,000 to $19,999 | 39 (3.4%) | 0 (0.0%) |
| $20,000 to $24,999 | 23 (2.0%) | 9 (11.4%) |
| $25,000 to $34,999 | 56 (4.8%) | 28 (35.4%) |
| $35,000 to $49,999 | 94 (8.1%) | 0 (0.0%) |
| $50,000 to $74,999 | 175 (15.1%) | 13 (16.5%) |
| $75,000 to $99,999 | 136 (11.8%) | 0 (0.0%) |
| $100,000 to $149,999 | 432 (37.4%) | 11 (13.9%) |
| $150,000 or more | 150 (13.0%) | 0 (0.0%) |
| Total | 1,156 (100.0%) | 79 (100.0%) |
Monthly Housing Cost Tiers in Chenango Bridge
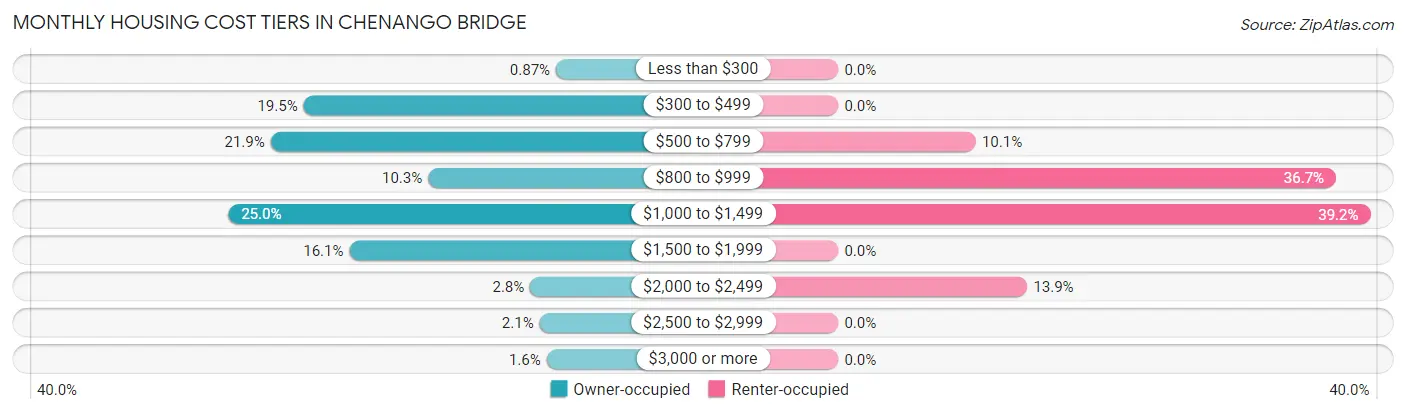
| Monthly Cost | Owner-occupied | Renter-occupied |
| Less than $300 | 10 (0.9%) | 0 (0.0%) |
| $300 to $499 | 225 (19.5%) | 0 (0.0%) |
| $500 to $799 | 253 (21.9%) | 8 (10.1%) |
| $800 to $999 | 119 (10.3%) | 29 (36.7%) |
| $1,000 to $1,499 | 289 (25.0%) | 31 (39.2%) |
| $1,500 to $1,999 | 186 (16.1%) | 0 (0.0%) |
| $2,000 to $2,499 | 32 (2.8%) | 11 (13.9%) |
| $2,500 to $2,999 | 24 (2.1%) | 0 (0.0%) |
| $3,000 or more | 18 (1.6%) | 0 (0.0%) |
| Total | 1,156 (100.0%) | 79 (100.0%) |
Physical Housing Characteristics in Chenango Bridge
Housing Structures in Chenango Bridge
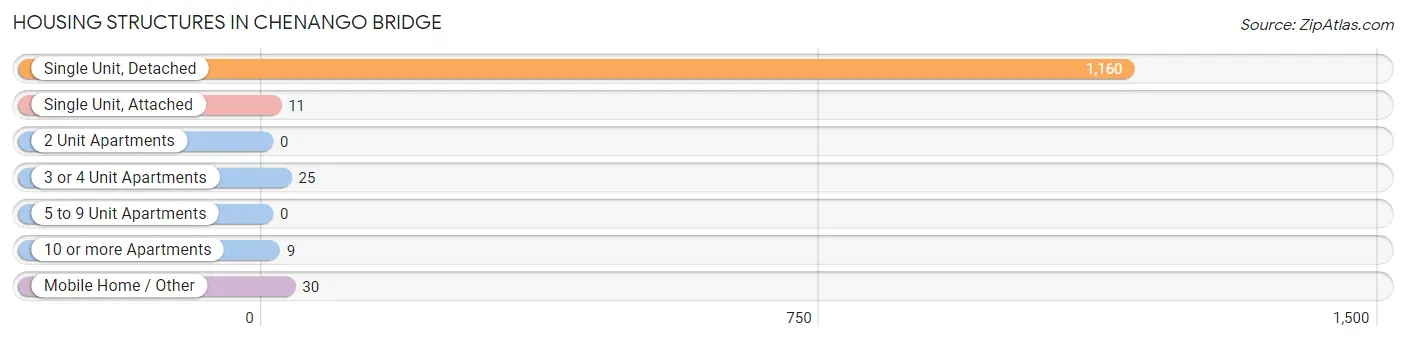
| Structure Type | # Housing Units | % Housing Units |
| Single Unit, Detached | 1,160 | 93.9% |
| Single Unit, Attached | 11 | 0.9% |
| 2 Unit Apartments | 0 | 0.0% |
| 3 or 4 Unit Apartments | 25 | 2.0% |
| 5 to 9 Unit Apartments | 0 | 0.0% |
| 10 or more Apartments | 9 | 0.7% |
| Mobile Home / Other | 30 | 2.4% |
| Total | 1,235 | 100.0% |
Housing Structures by Occupancy in Chenango Bridge
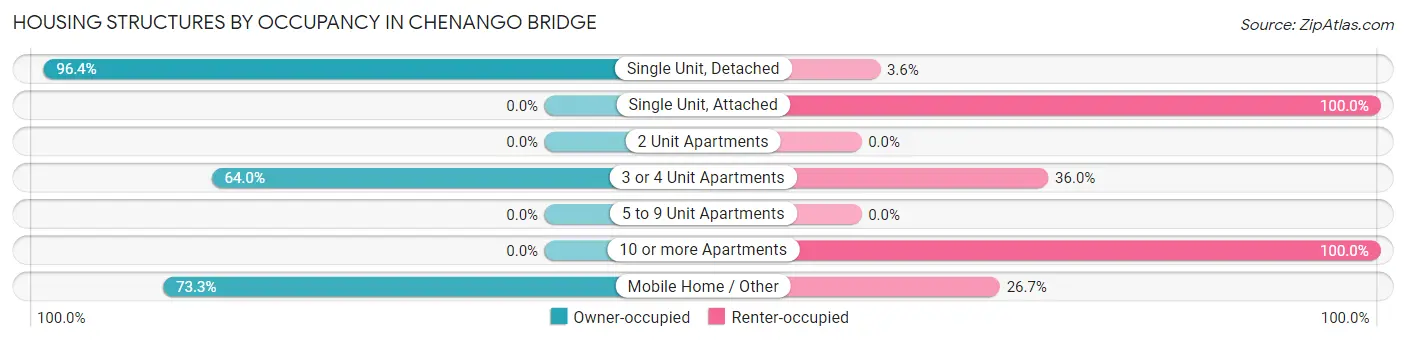
| Structure Type | Owner-occupied | Renter-occupied |
| Single Unit, Detached | 1,118 (96.4%) | 42 (3.6%) |
| Single Unit, Attached | 0 (0.0%) | 11 (100.0%) |
| 2 Unit Apartments | 0 (0.0%) | 0 (0.0%) |
| 3 or 4 Unit Apartments | 16 (64.0%) | 9 (36.0%) |
| 5 to 9 Unit Apartments | 0 (0.0%) | 0 (0.0%) |
| 10 or more Apartments | 0 (0.0%) | 9 (100.0%) |
| Mobile Home / Other | 22 (73.3%) | 8 (26.7%) |
| Total | 1,156 (93.6%) | 79 (6.4%) |
Housing Structures by Number of Rooms in Chenango Bridge
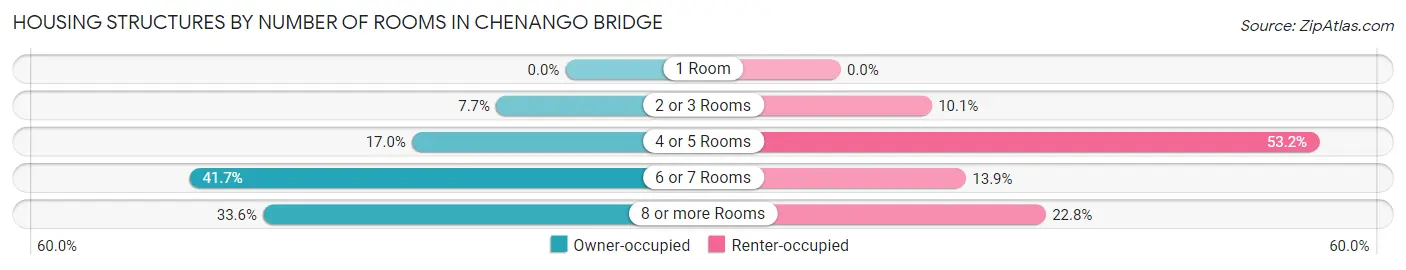
| Number of Rooms | Owner-occupied | Renter-occupied |
| 1 Room | 0 (0.0%) | 0 (0.0%) |
| 2 or 3 Rooms | 89 (7.7%) | 8 (10.1%) |
| 4 or 5 Rooms | 197 (17.0%) | 42 (53.2%) |
| 6 or 7 Rooms | 482 (41.7%) | 11 (13.9%) |
| 8 or more Rooms | 388 (33.6%) | 18 (22.8%) |
| Total | 1,156 (100.0%) | 79 (100.0%) |
Housing Structure by Heating Type in Chenango Bridge
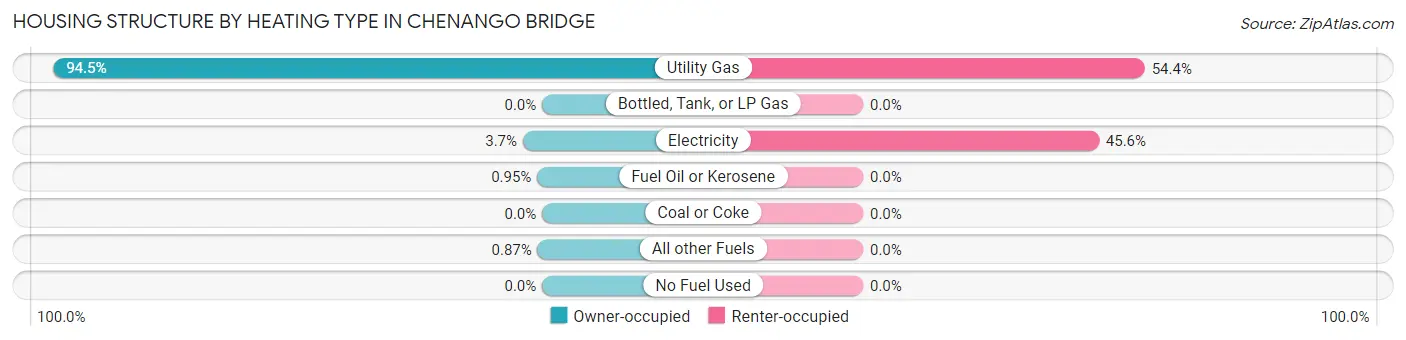
| Heating Type | Owner-occupied | Renter-occupied |
| Utility Gas | 1,092 (94.5%) | 43 (54.4%) |
| Bottled, Tank, or LP Gas | 0 (0.0%) | 0 (0.0%) |
| Electricity | 43 (3.7%) | 36 (45.6%) |
| Fuel Oil or Kerosene | 11 (0.9%) | 0 (0.0%) |
| Coal or Coke | 0 (0.0%) | 0 (0.0%) |
| All other Fuels | 10 (0.9%) | 0 (0.0%) |
| No Fuel Used | 0 (0.0%) | 0 (0.0%) |
| Total | 1,156 (100.0%) | 79 (100.0%) |
Household Vehicle Usage in Chenango Bridge
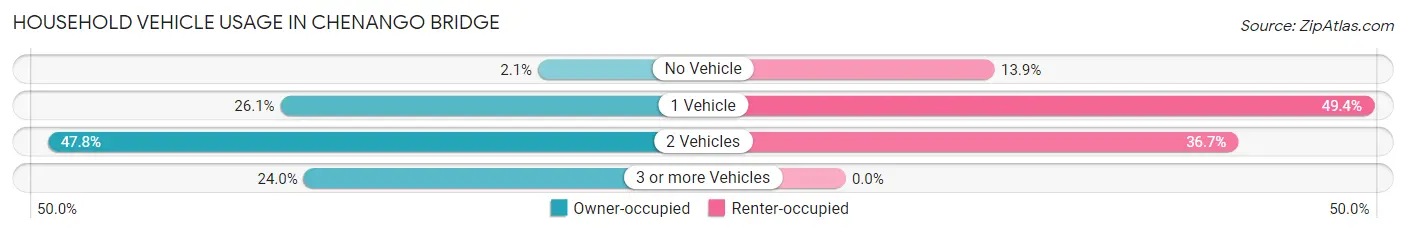
| Vehicles per Household | Owner-occupied | Renter-occupied |
| No Vehicle | 24 (2.1%) | 11 (13.9%) |
| 1 Vehicle | 302 (26.1%) | 39 (49.4%) |
| 2 Vehicles | 553 (47.8%) | 29 (36.7%) |
| 3 or more Vehicles | 277 (24.0%) | 0 (0.0%) |
| Total | 1,156 (100.0%) | 79 (100.0%) |
Real Estate & Mortgages in Chenango Bridge
Real Estate and Mortgage Overview in Chenango Bridge
| Characteristic | Without Mortgage | With Mortgage |
| Housing Units | 550 | 606 |
| Median Property Value | $171,900 | $157,000 |
| Median Household Income | $101,894 | $84 |
| Monthly Housing Costs | $531 | $18 |
| Real Estate Taxes | $2,916 | $13 |
Property Value by Mortgage Status in Chenango Bridge
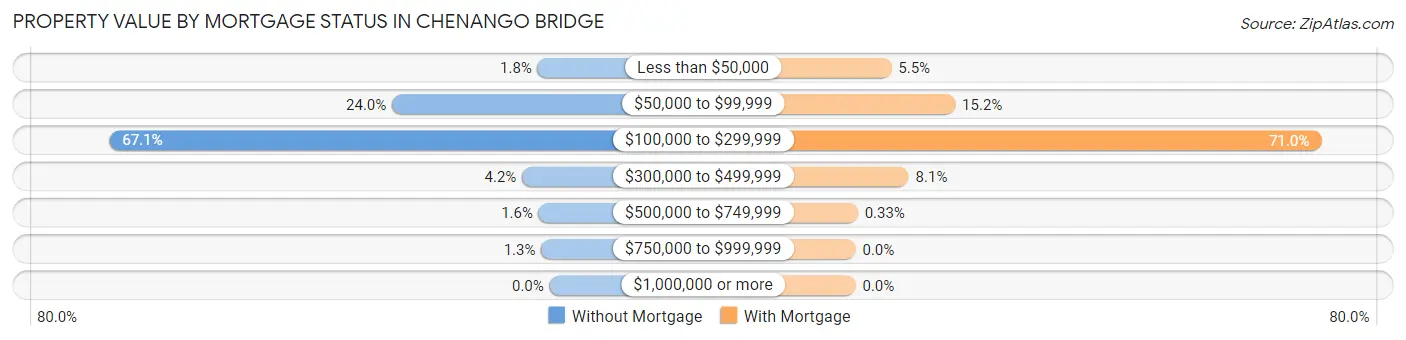
| Property Value | Without Mortgage | With Mortgage |
| Less than $50,000 | 10 (1.8%) | 33 (5.4%) |
| $50,000 to $99,999 | 132 (24.0%) | 92 (15.2%) |
| $100,000 to $299,999 | 369 (67.1%) | 430 (71.0%) |
| $300,000 to $499,999 | 23 (4.2%) | 49 (8.1%) |
| $500,000 to $749,999 | 9 (1.6%) | 2 (0.3%) |
| $750,000 to $999,999 | 7 (1.3%) | 0 (0.0%) |
| $1,000,000 or more | 0 (0.0%) | 0 (0.0%) |
| Total | 550 (100.0%) | 606 (100.0%) |
Household Income by Mortgage Status in Chenango Bridge
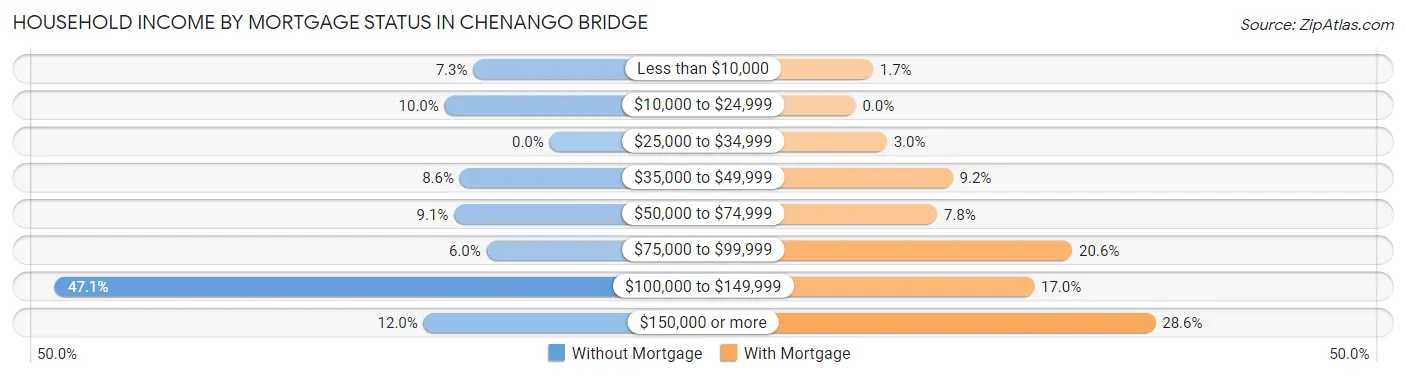
| Household Income | Without Mortgage | With Mortgage |
| Less than $10,000 | 40 (7.3%) | 10 (1.7%) |
| $10,000 to $24,999 | 55 (10.0%) | 0 (0.0%) |
| $25,000 to $34,999 | 0 (0.0%) | 18 (3.0%) |
| $35,000 to $49,999 | 47 (8.6%) | 56 (9.2%) |
| $50,000 to $74,999 | 50 (9.1%) | 47 (7.8%) |
| $75,000 to $99,999 | 33 (6.0%) | 125 (20.6%) |
| $100,000 to $149,999 | 259 (47.1%) | 103 (17.0%) |
| $150,000 or more | 66 (12.0%) | 173 (28.5%) |
| Total | 550 (100.0%) | 606 (100.0%) |
Property Value to Household Income Ratio in Chenango Bridge
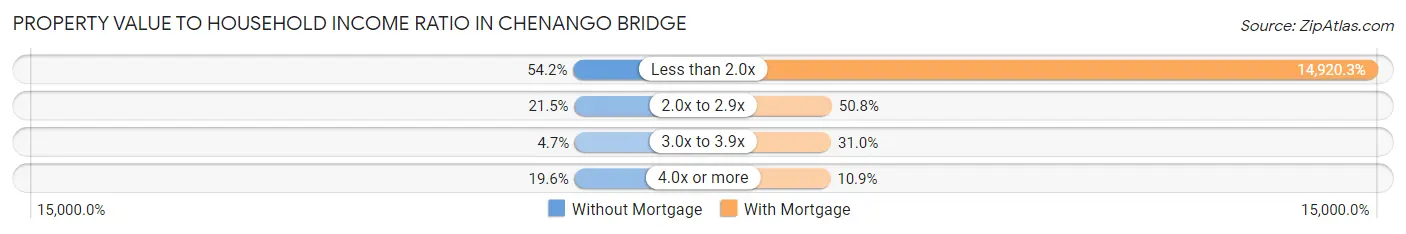
| Value-to-Income Ratio | Without Mortgage | With Mortgage |
| Less than 2.0x | 298 (54.2%) | 90,417 (14,920.3%) |
| 2.0x to 2.9x | 118 (21.4%) | 308 (50.8%) |
| 3.0x to 3.9x | 26 (4.7%) | 188 (31.0%) |
| 4.0x or more | 108 (19.6%) | 66 (10.9%) |
| Total | 550 (100.0%) | 606 (100.0%) |
Real Estate Taxes by Mortgage Status in Chenango Bridge
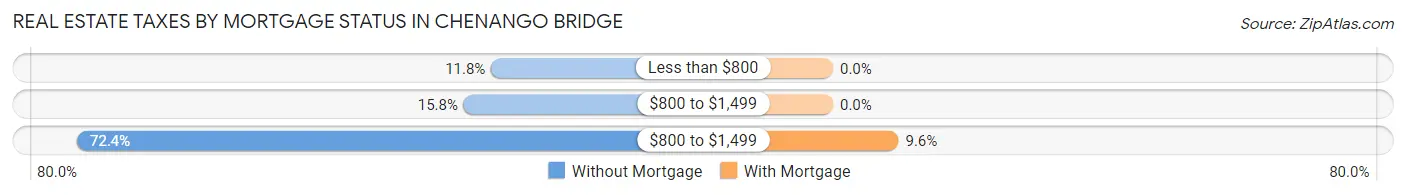
| Property Taxes | Without Mortgage | With Mortgage |
| Less than $800 | 65 (11.8%) | 0 (0.0%) |
| $800 to $1,499 | 87 (15.8%) | 0 (0.0%) |
| $800 to $1,499 | 398 (72.4%) | 58 (9.6%) |
| Total | 550 (100.0%) | 606 (100.0%) |
Health & Disability in Chenango Bridge
Health Insurance Coverage by Age in Chenango Bridge
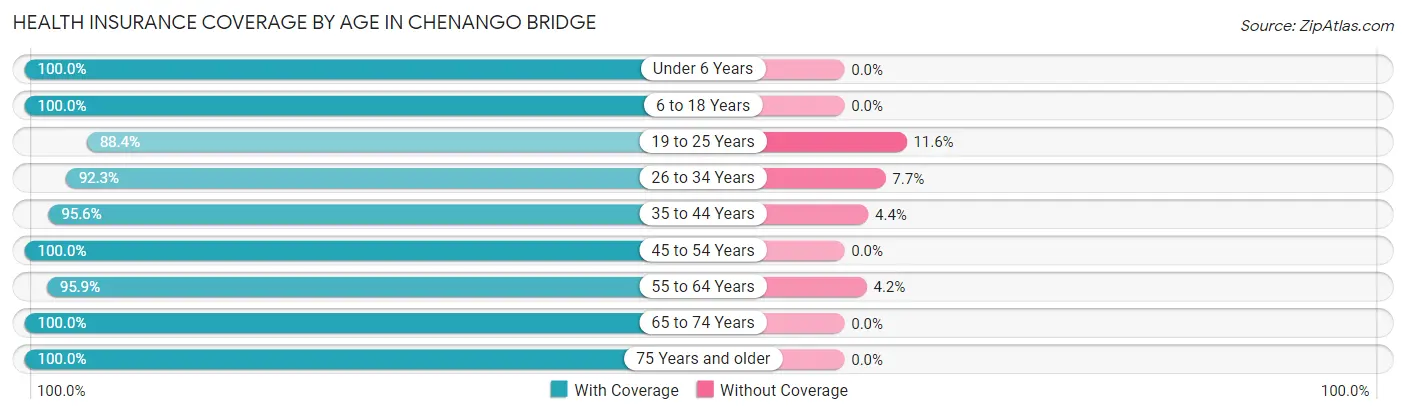
| Age Bracket | With Coverage | Without Coverage |
| Under 6 Years | 350 (100.0%) | 0 (0.0%) |
| 6 to 18 Years | 423 (100.0%) | 0 (0.0%) |
| 19 to 25 Years | 244 (88.4%) | 32 (11.6%) |
| 26 to 34 Years | 361 (92.3%) | 30 (7.7%) |
| 35 to 44 Years | 366 (95.6%) | 17 (4.4%) |
| 45 to 54 Years | 320 (100.0%) | 0 (0.0%) |
| 55 to 64 Years | 300 (95.9%) | 13 (4.2%) |
| 65 to 74 Years | 517 (100.0%) | 0 (0.0%) |
| 75 Years and older | 251 (100.0%) | 0 (0.0%) |
| Total | 3,132 (97.2%) | 92 (2.9%) |
Health Insurance Coverage by Citizenship Status in Chenango Bridge
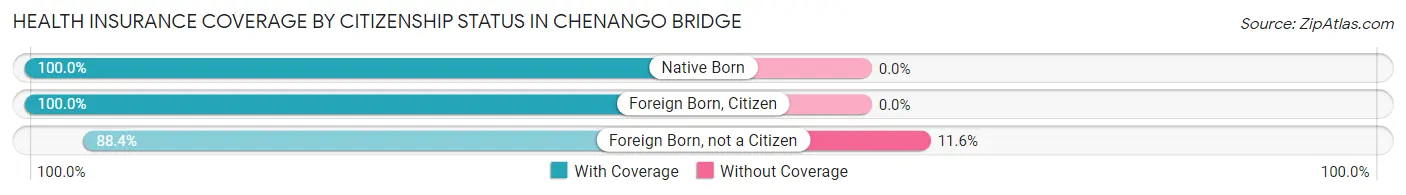
| Citizenship Status | With Coverage | Without Coverage |
| Native Born | 350 (100.0%) | 0 (0.0%) |
| Foreign Born, Citizen | 423 (100.0%) | 0 (0.0%) |
| Foreign Born, not a Citizen | 244 (88.4%) | 32 (11.6%) |
Health Insurance Coverage by Household Income in Chenango Bridge
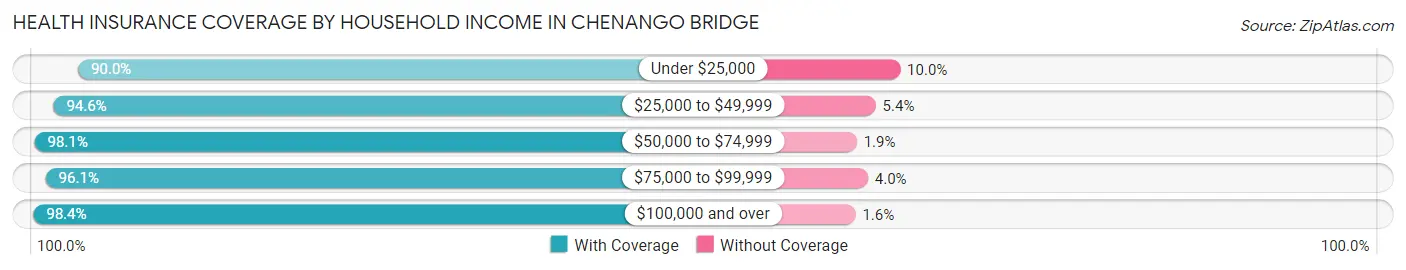
| Household Income | With Coverage | Without Coverage |
| Under $25,000 | 198 (90.0%) | 22 (10.0%) |
| $25,000 to $49,999 | 315 (94.6%) | 18 (5.4%) |
| $50,000 to $74,999 | 370 (98.1%) | 7 (1.9%) |
| $75,000 to $99,999 | 316 (96.1%) | 13 (4.0%) |
| $100,000 and over | 1,927 (98.4%) | 32 (1.6%) |
Public vs Private Health Insurance Coverage by Age in Chenango Bridge
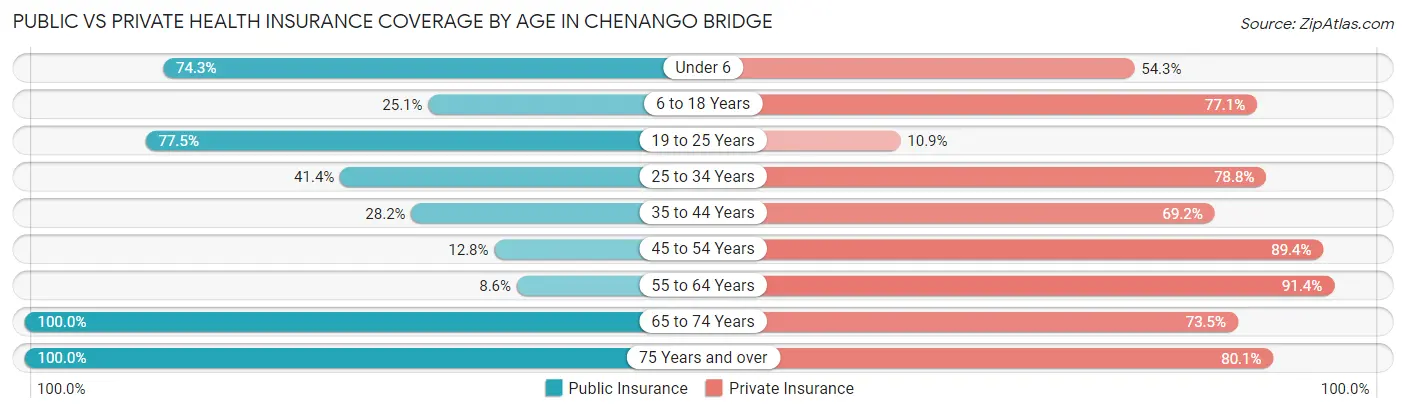
| Age Bracket | Public Insurance | Private Insurance |
| Under 6 | 260 (74.3%) | 190 (54.3%) |
| 6 to 18 Years | 106 (25.1%) | 326 (77.1%) |
| 19 to 25 Years | 214 (77.5%) | 30 (10.9%) |
| 25 to 34 Years | 162 (41.4%) | 308 (78.8%) |
| 35 to 44 Years | 108 (28.2%) | 265 (69.2%) |
| 45 to 54 Years | 41 (12.8%) | 286 (89.4%) |
| 55 to 64 Years | 27 (8.6%) | 286 (91.4%) |
| 65 to 74 Years | 517 (100.0%) | 380 (73.5%) |
| 75 Years and over | 251 (100.0%) | 201 (80.1%) |
| Total | 1,686 (52.3%) | 2,272 (70.5%) |
Disability Status by Sex by Age in Chenango Bridge
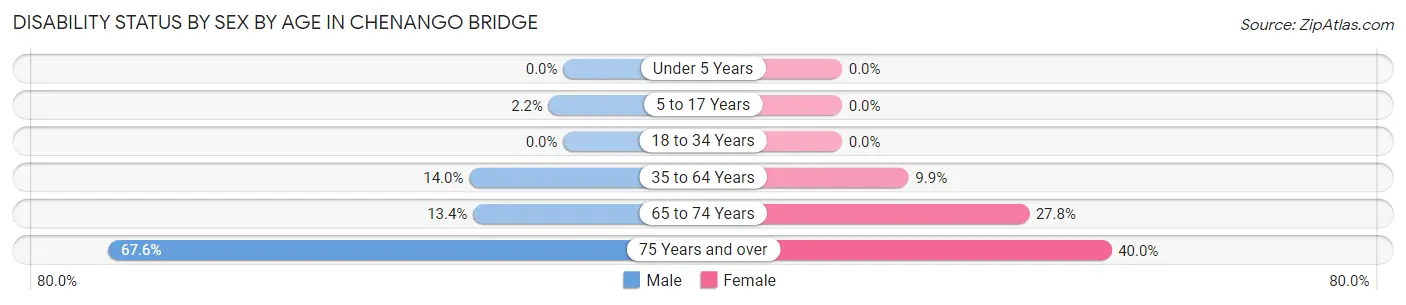
| Age Bracket | Male | Female |
| Under 5 Years | 0 (0.0%) | 0 (0.0%) |
| 5 to 17 Years | 5 (2.1%) | 0 (0.0%) |
| 18 to 34 Years | 0 (0.0%) | 0 (0.0%) |
| 35 to 64 Years | 77 (14.0%) | 46 (9.9%) |
| 65 to 74 Years | 34 (13.4%) | 73 (27.8%) |
| 75 Years and over | 48 (67.6%) | 72 (40.0%) |
Disability Class by Sex by Age in Chenango Bridge
Disability Class: Hearing Difficulty
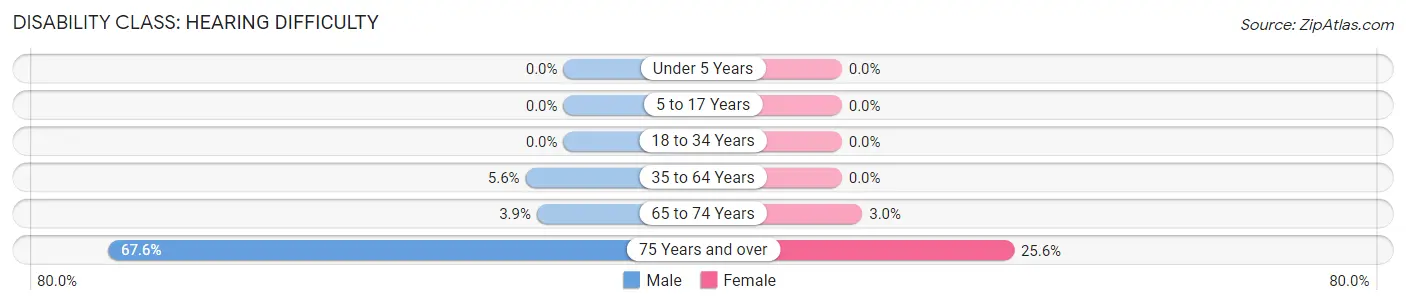
| Age Bracket | Male | Female |
| Under 5 Years | 0 (0.0%) | 0 (0.0%) |
| 5 to 17 Years | 0 (0.0%) | 0 (0.0%) |
| 18 to 34 Years | 0 (0.0%) | 0 (0.0%) |
| 35 to 64 Years | 31 (5.6%) | 0 (0.0%) |
| 65 to 74 Years | 10 (3.9%) | 8 (3.0%) |
| 75 Years and over | 48 (67.6%) | 46 (25.6%) |
Disability Class: Vision Difficulty
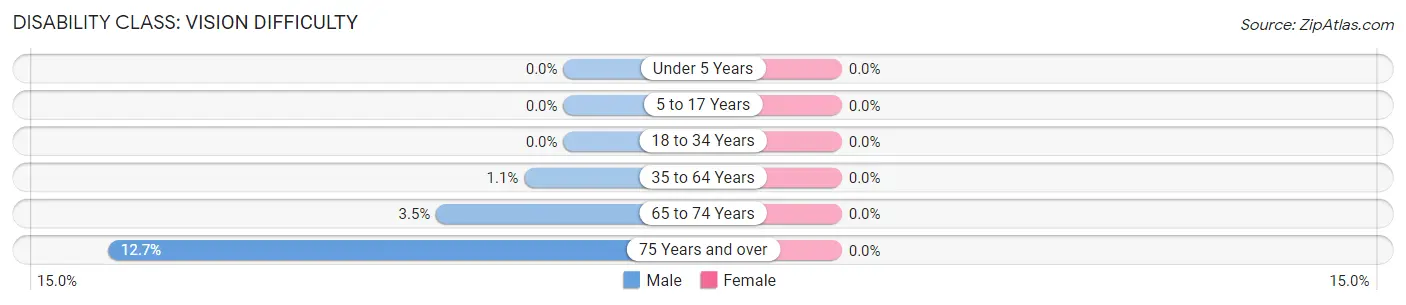
| Age Bracket | Male | Female |
| Under 5 Years | 0 (0.0%) | 0 (0.0%) |
| 5 to 17 Years | 0 (0.0%) | 0 (0.0%) |
| 18 to 34 Years | 0 (0.0%) | 0 (0.0%) |
| 35 to 64 Years | 6 (1.1%) | 0 (0.0%) |
| 65 to 74 Years | 9 (3.5%) | 0 (0.0%) |
| 75 Years and over | 9 (12.7%) | 0 (0.0%) |
Disability Class: Cognitive Difficulty
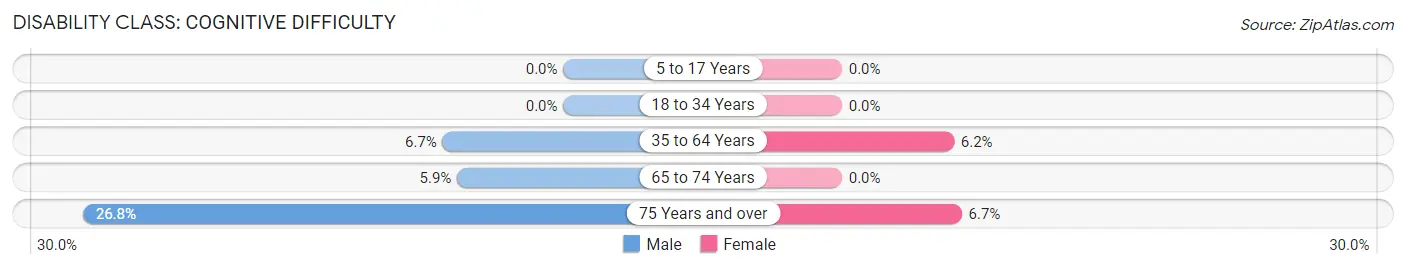
| Age Bracket | Male | Female |
| 5 to 17 Years | 0 (0.0%) | 0 (0.0%) |
| 18 to 34 Years | 0 (0.0%) | 0 (0.0%) |
| 35 to 64 Years | 37 (6.7%) | 29 (6.2%) |
| 65 to 74 Years | 15 (5.9%) | 0 (0.0%) |
| 75 Years and over | 19 (26.8%) | 12 (6.7%) |
Disability Class: Ambulatory Difficulty
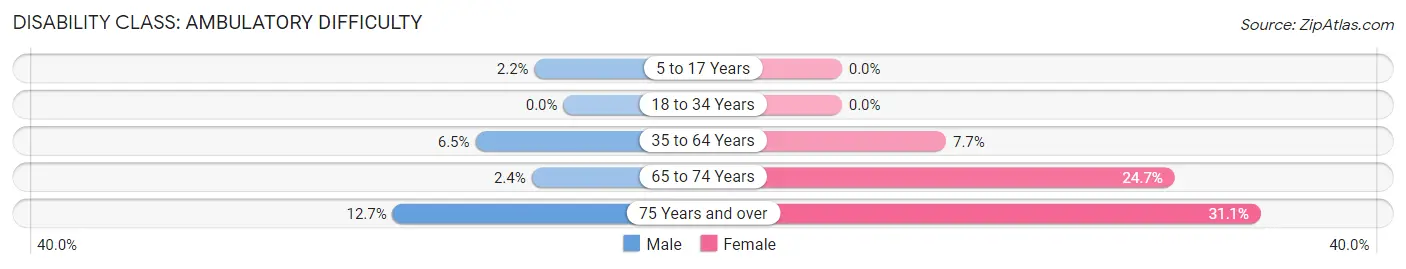
| Age Bracket | Male | Female |
| 5 to 17 Years | 5 (2.1%) | 0 (0.0%) |
| 18 to 34 Years | 0 (0.0%) | 0 (0.0%) |
| 35 to 64 Years | 36 (6.5%) | 36 (7.7%) |
| 65 to 74 Years | 6 (2.4%) | 65 (24.7%) |
| 75 Years and over | 9 (12.7%) | 56 (31.1%) |
Disability Class: Self-Care Difficulty
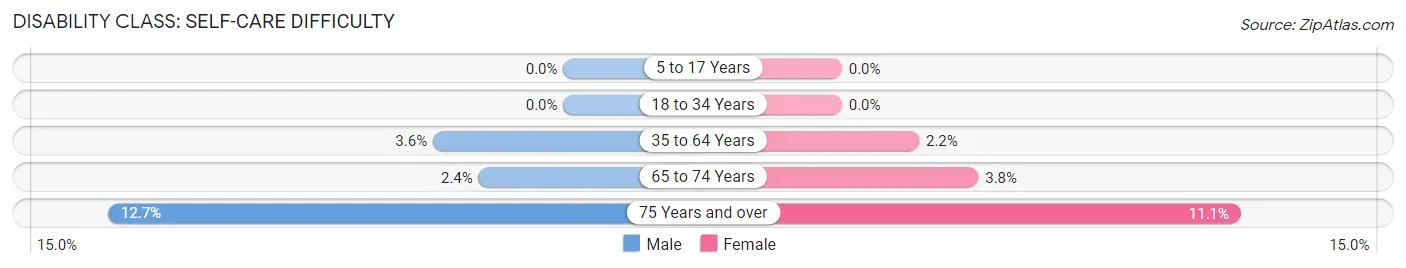
| Age Bracket | Male | Female |
| 5 to 17 Years | 0 (0.0%) | 0 (0.0%) |
| 18 to 34 Years | 0 (0.0%) | 0 (0.0%) |
| 35 to 64 Years | 20 (3.6%) | 10 (2.1%) |
| 65 to 74 Years | 6 (2.4%) | 10 (3.8%) |
| 75 Years and over | 9 (12.7%) | 20 (11.1%) |
Technology Access in Chenango Bridge
Computing Device Access in Chenango Bridge
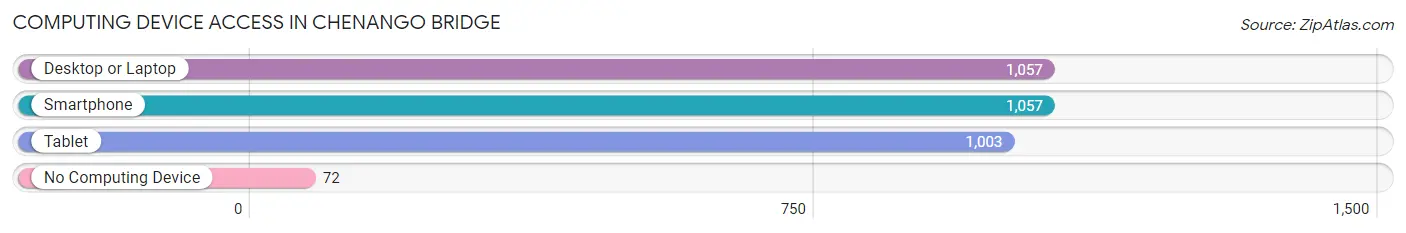
| Device Type | # Households | % Households |
| Desktop or Laptop | 1,057 | 85.6% |
| Smartphone | 1,057 | 85.6% |
| Tablet | 1,003 | 81.2% |
| No Computing Device | 72 | 5.8% |
| Total | 1,235 | 100.0% |
Internet Access in Chenango Bridge
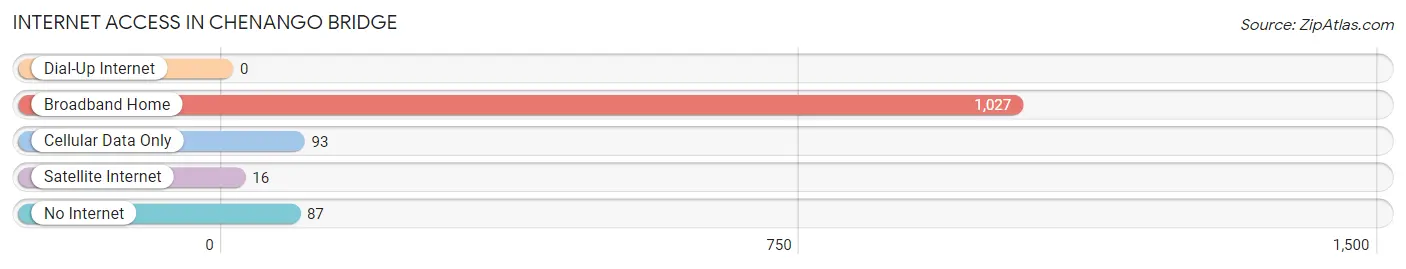
| Internet Type | # Households | % Households |
| Dial-Up Internet | 0 | 0.0% |
| Broadband Home | 1,027 | 83.2% |
| Cellular Data Only | 93 | 7.5% |
| Satellite Internet | 16 | 1.3% |
| No Internet | 87 | 7.0% |
| Total | 1,235 | 100.0% |
Chenango Bridge Summary
Chenango Bridge is a hamlet located in the Town of Chenango in Broome County, New York. It is situated on the banks of the Chenango River, which is a tributary of the Susquehanna River. The hamlet is located approximately 10 miles south of Binghamton, the county seat.
History
The area that is now Chenango Bridge was originally inhabited by the Iroquois Native American tribe. The first European settlers arrived in the area in the late 1700s. The hamlet was originally known as “Chenango Point” and was a small farming community. In 1812, a bridge was built across the Chenango River, giving the hamlet its current name.
In the mid-1800s, the hamlet began to grow and develop. The Chenango Canal was built in 1837, connecting the Chenango River to the Susquehanna River. This allowed for increased trade and commerce in the area. The hamlet also became a popular stop for travelers on the Chenango Canal.
In the late 1800s, the hamlet was home to several industries, including a sawmill, a gristmill, a tannery, and a brickyard. The hamlet also had several stores, a post office, and a school.
Geography
Chenango Bridge is located in the Town of Chenango in Broome County, New York. It is situated on the banks of the Chenango River, which is a tributary of the Susquehanna River. The hamlet is located approximately 10 miles south of Binghamton, the county seat.
The hamlet is located in a rural area and is surrounded by farmland. The terrain is mostly flat, with some rolling hills. The climate is humid continental, with cold winters and hot, humid summers.
Economy
The economy of Chenango Bridge is largely based on agriculture. The hamlet is home to several farms, which produce a variety of crops, including corn, soybeans, hay, and wheat. The hamlet also has several small businesses, including a gas station, a convenience store, and a restaurant.
Demographics
As of the 2010 census, the population of Chenango Bridge was 1,845. The median age was 43.7 years, and the median household income was $45,938. The racial makeup of the hamlet was 97.3% White, 0.7% African American, 0.3% Native American, 0.3% Asian, and 1.4% from other races.
Conclusion
Chenango Bridge is a small hamlet located in the Town of Chenango in Broome County, New York. It is situated on the banks of the Chenango River, which is a tributary of the Susquehanna River. The hamlet is located approximately 10 miles south of Binghamton, the county seat. The economy of Chenango Bridge is largely based on agriculture, and the hamlet is home to several small businesses. As of the 2010 census, the population of Chenango Bridge was 1,845. The median age was 43.7 years, and the median household income was $45,938.
Common Questions
What is Per Capita Income in Chenango Bridge?
Per Capita income in Chenango Bridge is $35,957.
What is the Median Family Income in Chenango Bridge?
Median Family Income in Chenango Bridge is $101,952.
What is the Median Household income in Chenango Bridge?
Median Household Income in Chenango Bridge is $97,321.
What is Income or Wage Gap in Chenango Bridge?
Income or Wage Gap in Chenango Bridge is 38.9%.
Women in Chenango Bridge earn 61.1 cents for every dollar earned by a man.
What is Inequality or Gini Index in Chenango Bridge?
Inequality or Gini Index in Chenango Bridge is 0.34.
What is the Total Population of Chenango Bridge?
Total Population of Chenango Bridge is 3,224.
What is the Total Male Population of Chenango Bridge?
Total Male Population of Chenango Bridge is 1,672.
What is the Total Female Population of Chenango Bridge?
Total Female Population of Chenango Bridge is 1,552.
What is the Ratio of Males per 100 Females in Chenango Bridge?
There are 107.73 Males per 100 Females in Chenango Bridge.
What is the Ratio of Females per 100 Males in Chenango Bridge?
There are 92.82 Females per 100 Males in Chenango Bridge.
What is the Median Population Age in Chenango Bridge?
Median Population Age in Chenango Bridge is 39.5 Years.
What is the Average Family Size in Chenango Bridge
Average Family Size in Chenango Bridge is 3.1 People.
What is the Average Household Size in Chenango Bridge
Average Household Size in Chenango Bridge is 2.6 People.
How Large is the Labor Force in Chenango Bridge?
There are 1,638 People in the Labor Forcein in Chenango Bridge.
What is the Percentage of People in the Labor Force in Chenango Bridge?
64.7% of People are in the Labor Force in Chenango Bridge.
What is the Unemployment Rate in Chenango Bridge?
Unemployment Rate in Chenango Bridge is 9.7%.