Dexter, NY Map & Demographics
Dexter Map
Dexter Overview
$23,678
PER CAPITA INCOME
$46,757
AVG FAMILY INCOME
$45,946
AVG HOUSEHOLD INCOME
30.4%
WAGE / INCOME GAP [ % ]
69.6¢/ $1
WAGE / INCOME GAP [ $ ]
0.43
INEQUALITY / GINI INDEX
763
TOTAL POPULATION
334
MALE POPULATION
429
FEMALE POPULATION
77.86
MALES / 100 FEMALES
128.44
FEMALES / 100 MALES
39.4
MEDIAN AGE
2.9
AVG FAMILY SIZE
2.5
AVG HOUSEHOLD SIZE
323
LABOR FORCE [ PEOPLE ]
57.2%
PERCENT IN LABOR FORCE
5.4%
UNEMPLOYMENT RATE
Dexter Zip Codes
Dexter Area Codes
Income in Dexter
Income Overview in Dexter
Per Capita Income in Dexter is $23,678, while median incomes of families and households are $46,757 and $45,946 respectively.
| Characteristic | Number | Measure |
| Per Capita Income | 763 | $23,678 |
| Median Family Income | 226 | $46,757 |
| Mean Family Income | 226 | $65,461 |
| Median Household Income | 296 | $45,946 |
| Mean Household Income | 296 | $60,156 |
| Income Deficit | 226 | $0 |
| Wage / Income Gap (%) | 763 | 30.36% |
| Wage / Income Gap ($) | 763 | 69.64¢ per $1 |
| Gini / Inequality Index | 763 | 0.43 |
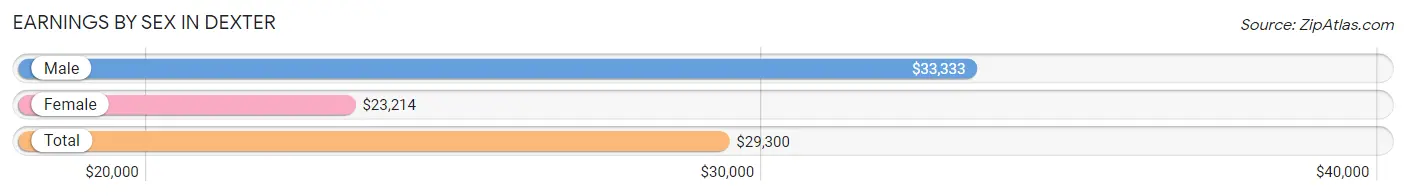
Earnings by Sex in Dexter
Average Earnings in Dexter are $29,300, $33,333 for men and $23,214 for women, a difference of 30.4%.
| Sex | Number | Average Earnings |
| Male | 192 (55.2%) | $33,333 |
| Female | 156 (44.8%) | $23,214 |
| Total | 348 (100.0%) | $29,300 |
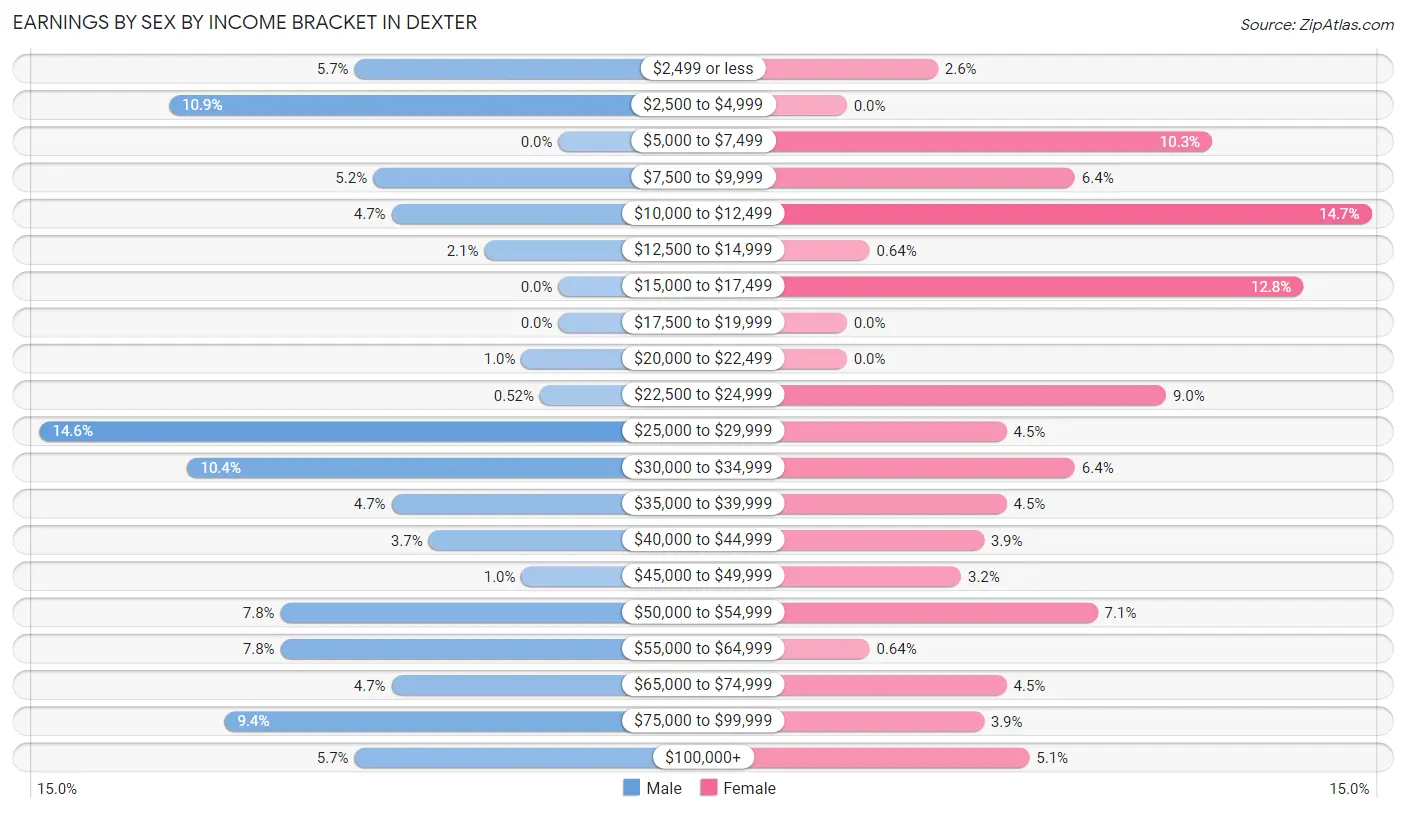
Earnings by Sex by Income Bracket in Dexter
The most common earnings brackets in Dexter are $25,000 to $29,999 for men (28 | 14.6%) and $10,000 to $12,499 for women (23 | 14.7%).
| Income | Male | Female |
| $2,499 or less | 11 (5.7%) | 4 (2.6%) |
| $2,500 to $4,999 | 21 (10.9%) | 0 (0.0%) |
| $5,000 to $7,499 | 0 (0.0%) | 16 (10.3%) |
| $7,500 to $9,999 | 10 (5.2%) | 10 (6.4%) |
| $10,000 to $12,499 | 9 (4.7%) | 23 (14.7%) |
| $12,500 to $14,999 | 4 (2.1%) | 1 (0.6%) |
| $15,000 to $17,499 | 0 (0.0%) | 20 (12.8%) |
| $17,500 to $19,999 | 0 (0.0%) | 0 (0.0%) |
| $20,000 to $22,499 | 2 (1.0%) | 0 (0.0%) |
| $22,500 to $24,999 | 1 (0.5%) | 14 (9.0%) |
| $25,000 to $29,999 | 28 (14.6%) | 7 (4.5%) |
| $30,000 to $34,999 | 20 (10.4%) | 10 (6.4%) |
| $35,000 to $39,999 | 9 (4.7%) | 7 (4.5%) |
| $40,000 to $44,999 | 7 (3.6%) | 6 (3.8%) |
| $45,000 to $49,999 | 2 (1.0%) | 5 (3.2%) |
| $50,000 to $54,999 | 15 (7.8%) | 11 (7.0%) |
| $55,000 to $64,999 | 15 (7.8%) | 1 (0.6%) |
| $65,000 to $74,999 | 9 (4.7%) | 7 (4.5%) |
| $75,000 to $99,999 | 18 (9.4%) | 6 (3.8%) |
| $100,000+ | 11 (5.7%) | 8 (5.1%) |
| Total | 192 (100.0%) | 156 (100.0%) |
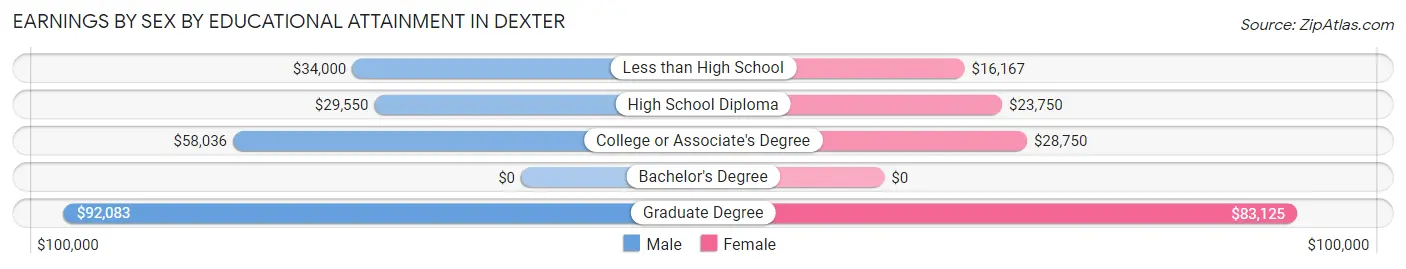
Earnings by Sex by Educational Attainment in Dexter
Average earnings in Dexter are $40,000 for men and $24,107 for women, a difference of 39.7%. Men with an educational attainment of graduate degree enjoy the highest average annual earnings of $92,083, while those with high school diploma education earn the least with $29,550. Women with an educational attainment of graduate degree earn the most with the average annual earnings of $83,125, while those with less than high school education have the smallest earnings of $16,167.
| Educational Attainment | Male Income | Female Income |
| Less than High School | $34,000 | $16,167 |
| High School Diploma | $29,550 | $23,750 |
| College or Associate's Degree | $58,036 | $28,750 |
| Bachelor's Degree | - | - |
| Graduate Degree | $92,083 | $83,125 |
| Total | $40,000 | $24,107 |
Family Income in Dexter
Family Income Brackets in Dexter
According to the Dexter family income data, there are 58 families falling into the $35,000 to $49,999 income range, which is the most common income bracket and makes up 25.7% of all families. Conversely, the less than $10,000 income bracket is the least frequent group with only 7 families (3.1%) belonging to this category.
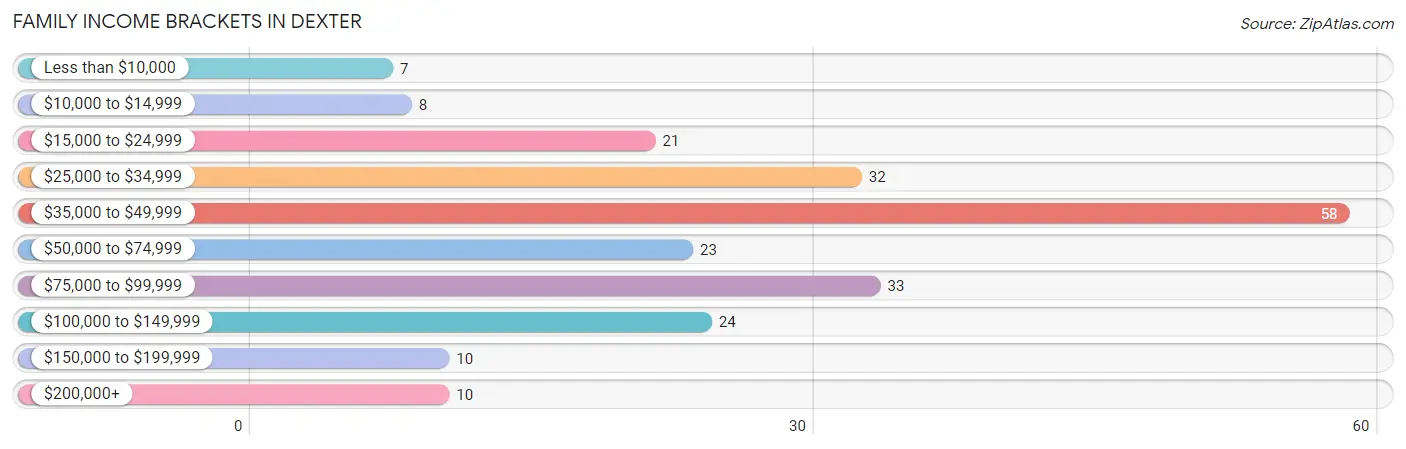
| Income Bracket | # Families | % Families |
| Less than $10,000 | 7 | 3.1% |
| $10,000 to $14,999 | 8 | 3.5% |
| $15,000 to $24,999 | 21 | 9.3% |
| $25,000 to $34,999 | 32 | 14.2% |
| $35,000 to $49,999 | 58 | 25.7% |
| $50,000 to $74,999 | 23 | 10.2% |
| $75,000 to $99,999 | 33 | 14.6% |
| $100,000 to $149,999 | 24 | 10.6% |
| $150,000 to $199,999 | 10 | 4.4% |
| $200,000+ | 10 | 4.4% |
Family Income by Famaliy Size in Dexter
4-person families (16 | 7.1%) account for the highest median family income in Dexter with $103,333 per family, while 4-person families (16 | 7.1%) have the highest median income of $25,833 per family member.
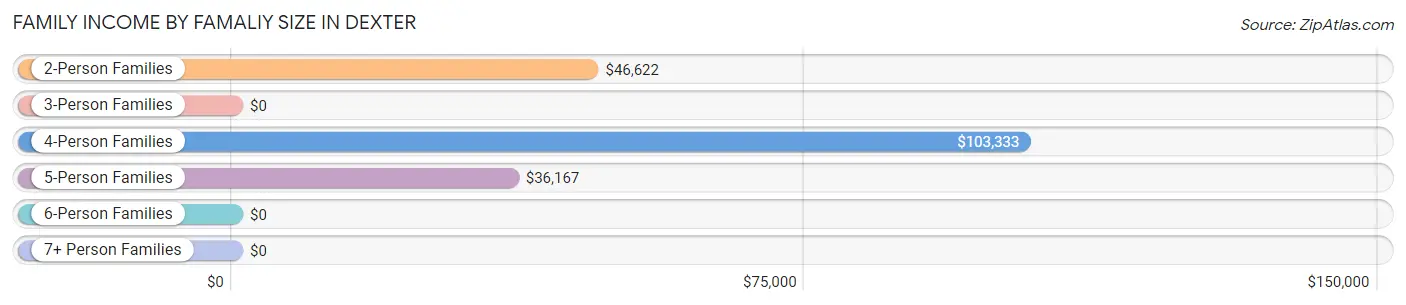
| Income Bracket | # Families | Median Income |
| 2-Person Families | 140 (62.0%) | $46,622 |
| 3-Person Families | 36 (15.9%) | $0 |
| 4-Person Families | 16 (7.1%) | $103,333 |
| 5-Person Families | 28 (12.4%) | $36,167 |
| 6-Person Families | 6 (2.6%) | $0 |
| 7+ Person Families | 0 (0.0%) | $0 |
| Total | 226 (100.0%) | $46,757 |
Family Income by Number of Earners in Dexter
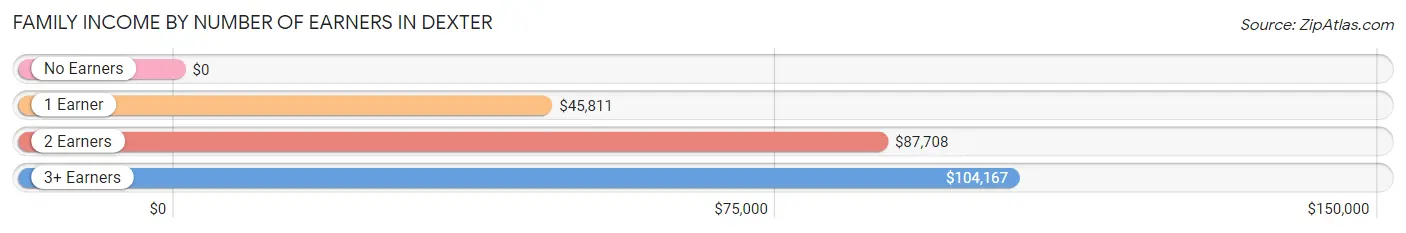
| Number of Earners | # Families | Median Income |
| No Earners | 23 (10.2%) | $0 |
| 1 Earner | 114 (50.4%) | $45,811 |
| 2 Earners | 77 (34.1%) | $87,708 |
| 3+ Earners | 12 (5.3%) | $104,167 |
| Total | 226 (100.0%) | $46,757 |
Household Income in Dexter
Household Income Brackets in Dexter
With 69 households falling in the category, the $35,000 to $49,999 income range is the most frequent in Dexter, accounting for 23.3% of all households. In contrast, only 10 households (3.4%) fall into the $150,000 to $199,999 income bracket, making it the least populous group.
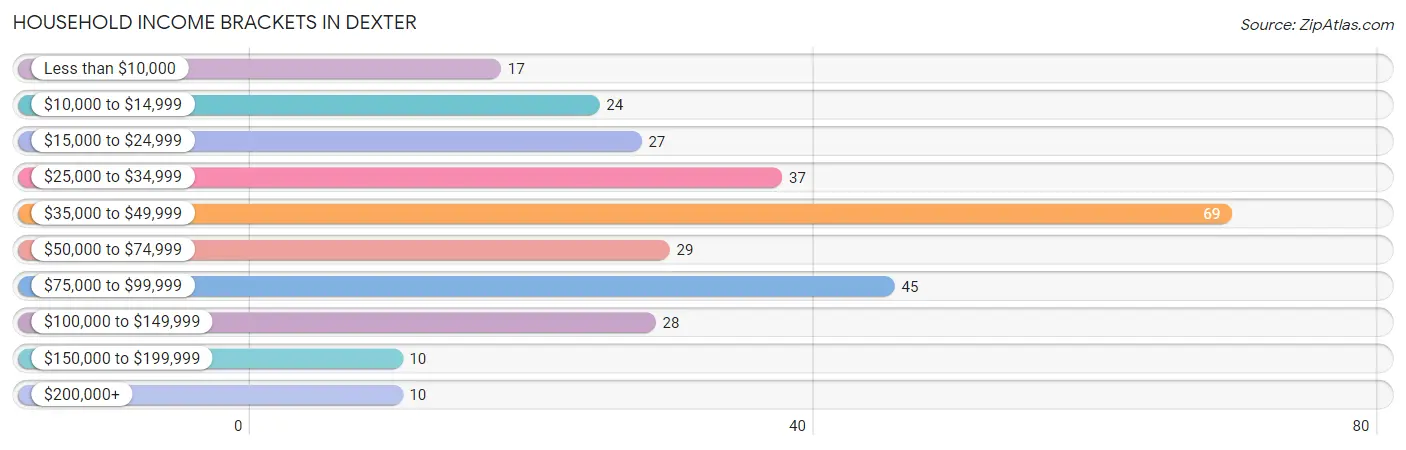
| Income Bracket | # Households | % Households |
| Less than $10,000 | 17 | 5.7% |
| $10,000 to $14,999 | 24 | 8.1% |
| $15,000 to $24,999 | 27 | 9.1% |
| $25,000 to $34,999 | 37 | 12.5% |
| $35,000 to $49,999 | 69 | 23.3% |
| $50,000 to $74,999 | 29 | 9.8% |
| $75,000 to $99,999 | 45 | 15.2% |
| $100,000 to $149,999 | 28 | 9.5% |
| $150,000 to $199,999 | 10 | 3.4% |
| $200,000+ | 10 | 3.4% |
Household Income by Householder Age in Dexter
The median household income in Dexter is $45,946, with the highest median household income of $60,625 found in the 45 to 64 years age bracket for the primary householder. A total of 103 households (34.8%) fall into this category. Meanwhile, the 15 to 24 years age bracket for the primary householder has the lowest median household income of $0, with 7 households (2.4%) in this group.
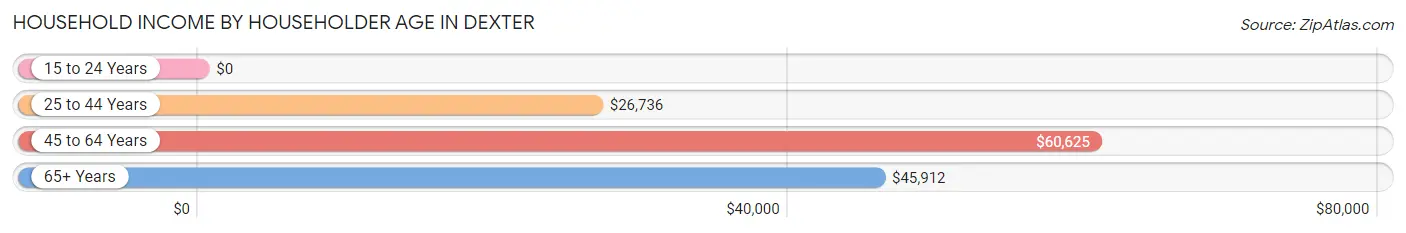
| Income Bracket | # Households | Median Income |
| 15 to 24 Years | 7 (2.4%) | $0 |
| 25 to 44 Years | 75 (25.3%) | $26,736 |
| 45 to 64 Years | 103 (34.8%) | $60,625 |
| 65+ Years | 111 (37.5%) | $45,912 |
| Total | 296 (100.0%) | $45,946 |
Poverty in Dexter
Income Below Poverty by Sex and Age in Dexter
With 11.4% poverty level for males and 21.8% for females among the residents of Dexter, 15 year old males and 15 year old females are the most vulnerable to poverty, with 7 males (70.0%) and 3 females (100.0%) in their respective age groups living below the poverty level.
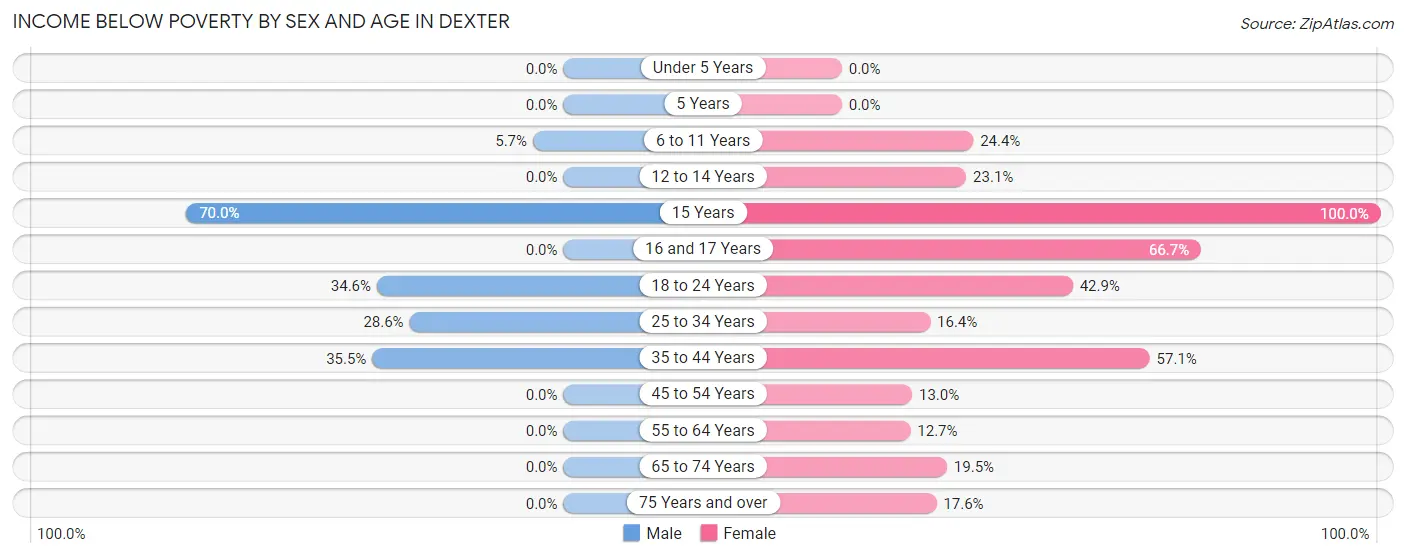
| Age Bracket | Male | Female |
| Under 5 Years | 0 (0.0%) | 0 (0.0%) |
| 5 Years | 0 (0.0%) | 0 (0.0%) |
| 6 to 11 Years | 3 (5.7%) | 10 (24.4%) |
| 12 to 14 Years | 0 (0.0%) | 9 (23.1%) |
| 15 Years | 7 (70.0%) | 3 (100.0%) |
| 16 and 17 Years | 0 (0.0%) | 8 (66.7%) |
| 18 to 24 Years | 9 (34.6%) | 6 (42.9%) |
| 25 to 34 Years | 8 (28.6%) | 10 (16.4%) |
| 35 to 44 Years | 11 (35.5%) | 12 (57.1%) |
| 45 to 54 Years | 0 (0.0%) | 6 (13.0%) |
| 55 to 64 Years | 0 (0.0%) | 7 (12.7%) |
| 65 to 74 Years | 0 (0.0%) | 8 (19.5%) |
| 75 Years and over | 0 (0.0%) | 13 (17.6%) |
| Total | 38 (11.4%) | 92 (21.8%) |
Income Above Poverty by Sex and Age in Dexter
According to the poverty statistics in Dexter, males aged under 5 years and females aged under 5 years are the age groups that are most secure financially, with 100.0% of males and 100.0% of females in these age groups living above the poverty line.
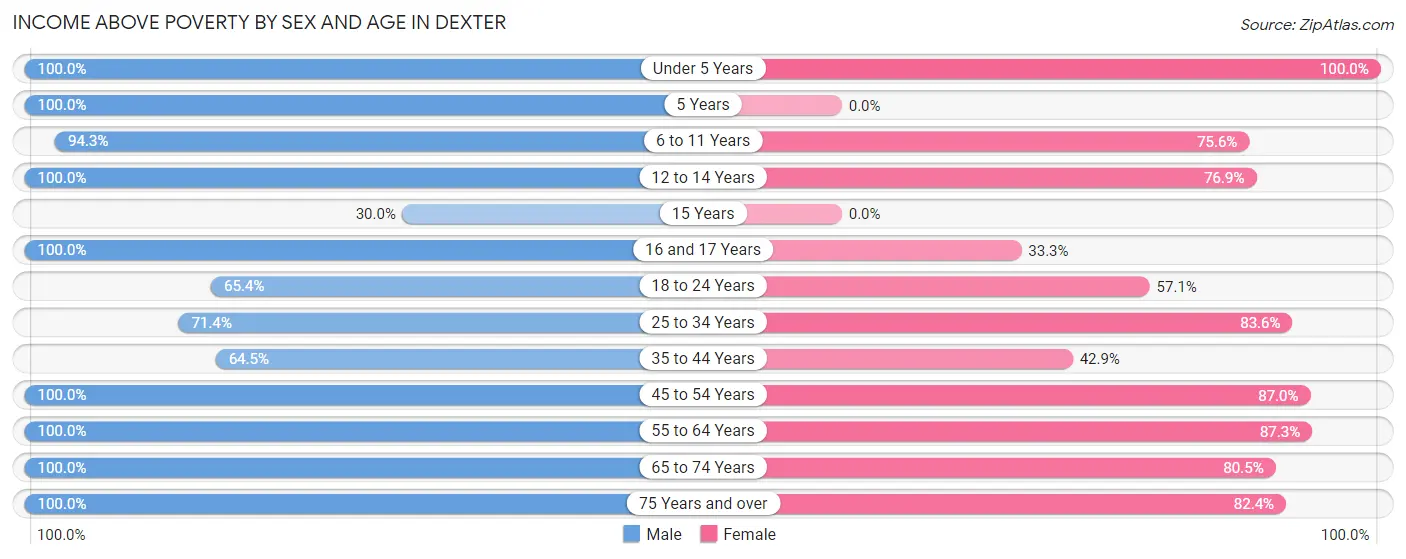
| Age Bracket | Male | Female |
| Under 5 Years | 13 (100.0%) | 15 (100.0%) |
| 5 Years | 6 (100.0%) | 0 (0.0%) |
| 6 to 11 Years | 50 (94.3%) | 31 (75.6%) |
| 12 to 14 Years | 11 (100.0%) | 30 (76.9%) |
| 15 Years | 3 (30.0%) | 0 (0.0%) |
| 16 and 17 Years | 19 (100.0%) | 4 (33.3%) |
| 18 to 24 Years | 17 (65.4%) | 8 (57.1%) |
| 25 to 34 Years | 20 (71.4%) | 51 (83.6%) |
| 35 to 44 Years | 20 (64.5%) | 9 (42.9%) |
| 45 to 54 Years | 64 (100.0%) | 40 (87.0%) |
| 55 to 64 Years | 32 (100.0%) | 48 (87.3%) |
| 65 to 74 Years | 20 (100.0%) | 33 (80.5%) |
| 75 Years and over | 21 (100.0%) | 61 (82.4%) |
| Total | 296 (88.6%) | 330 (78.2%) |
Income Below Poverty Among Married-Couple Families in Dexter
The poverty statistics for married-couple families in Dexter show that 1.9% or 2 of the total 106 families live below the poverty line. Families with 1 or 2 children have the highest poverty rate of 6.9%, comprising of 2 families. On the other hand, families with no children have the lowest poverty rate of 0.0%, which includes 0 families.
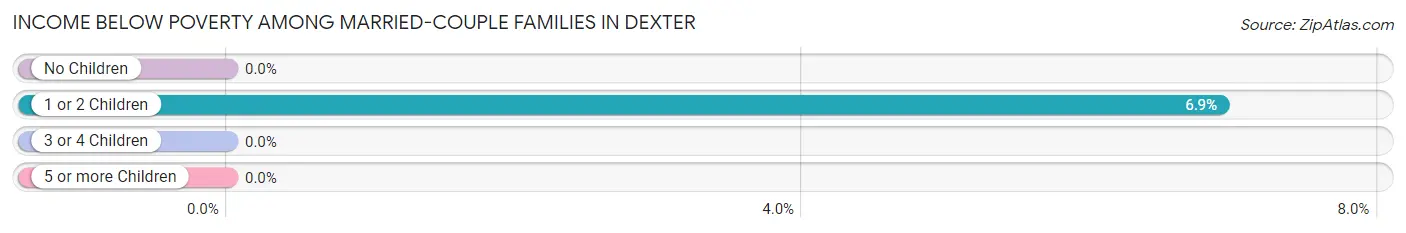
| Children | Above Poverty | Below Poverty |
| No Children | 55 (100.0%) | 0 (0.0%) |
| 1 or 2 Children | 27 (93.1%) | 2 (6.9%) |
| 3 or 4 Children | 22 (100.0%) | 0 (0.0%) |
| 5 or more Children | 0 (0.0%) | 0 (0.0%) |
| Total | 104 (98.1%) | 2 (1.9%) |
Income Below Poverty Among Single-Parent Households in Dexter
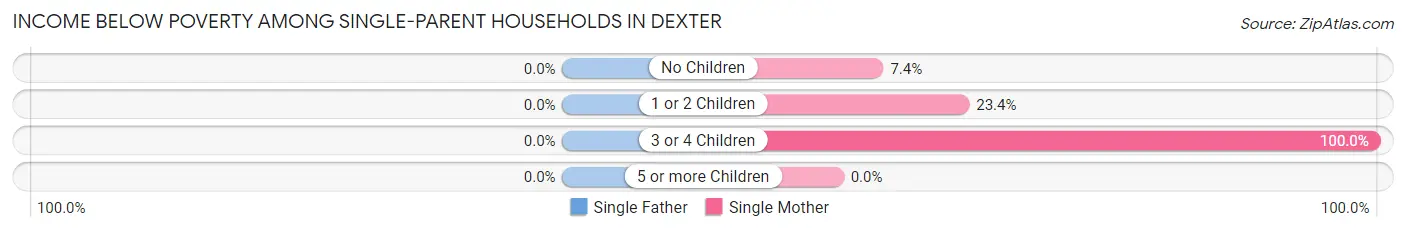
| Children | Single Father | Single Mother |
| No Children | 0 (0.0%) | 4 (7.4%) |
| 1 or 2 Children | 0 (0.0%) | 11 (23.4%) |
| 3 or 4 Children | 0 (0.0%) | 7 (100.0%) |
| 5 or more Children | 0 (0.0%) | 0 (0.0%) |
| Total | 0 (0.0%) | 22 (20.4%) |
Income Below Poverty Among Married-Couple vs Single-Parent Households in Dexter
The poverty data for Dexter shows that 2 of the married-couple family households (1.9%) and 22 of the single-parent households (18.3%) are living below the poverty level. Within the married-couple family households, those with 1 or 2 children have the highest poverty rate, with 2 households (6.9%) falling below the poverty line. Among the single-parent households, those with 3 or 4 children have the highest poverty rate, with 7 household (100.0%) living below poverty.
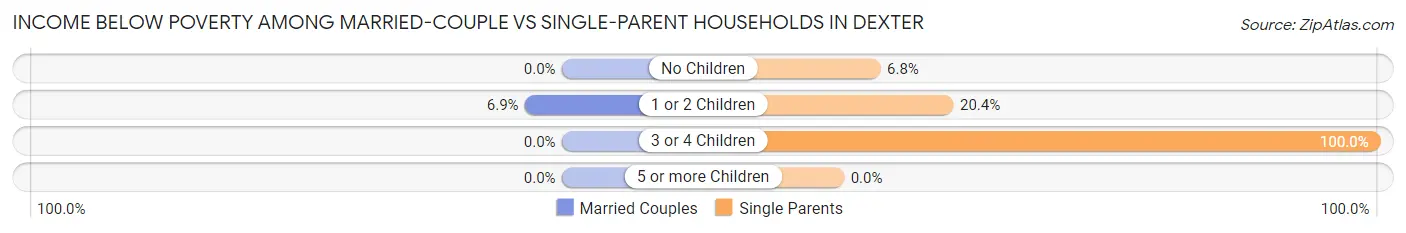
| Children | Married-Couple Families | Single-Parent Households |
| No Children | 0 (0.0%) | 4 (6.8%) |
| 1 or 2 Children | 2 (6.9%) | 11 (20.4%) |
| 3 or 4 Children | 0 (0.0%) | 7 (100.0%) |
| 5 or more Children | 0 (0.0%) | 0 (0.0%) |
| Total | 2 (1.9%) | 22 (18.3%) |
Race in Dexter
The most populous races in Dexter are White / Caucasian (719 | 94.2%), Hispanic or Latino (38 | 5.0%), and Two or more Races (33 | 4.3%).
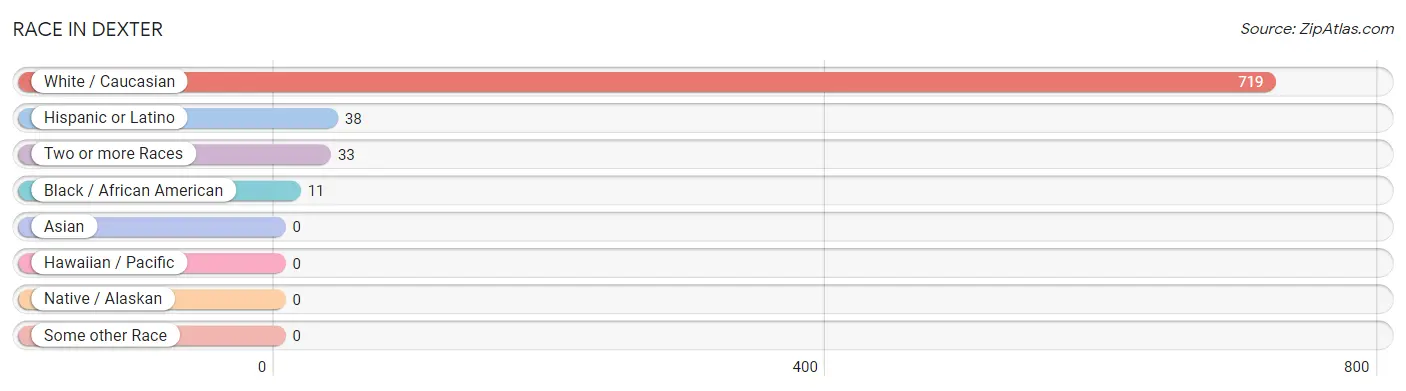
| Race | # Population | % Population |
| Asian | 0 | 0.0% |
| Black / African American | 11 | 1.4% |
| Hawaiian / Pacific | 0 | 0.0% |
| Hispanic or Latino | 38 | 5.0% |
| Native / Alaskan | 0 | 0.0% |
| White / Caucasian | 719 | 94.2% |
| Two or more Races | 33 | 4.3% |
| Some other Race | 0 | 0.0% |
| Total | 763 | 100.0% |
Ancestry in Dexter
The most populous ancestries reported in Dexter are Irish (210 | 27.5%), German (158 | 20.7%), English (150 | 19.7%), Ukrainian (70 | 9.2%), and French Canadian (52 | 6.8%), together accounting for 83.9% of all Dexter residents.
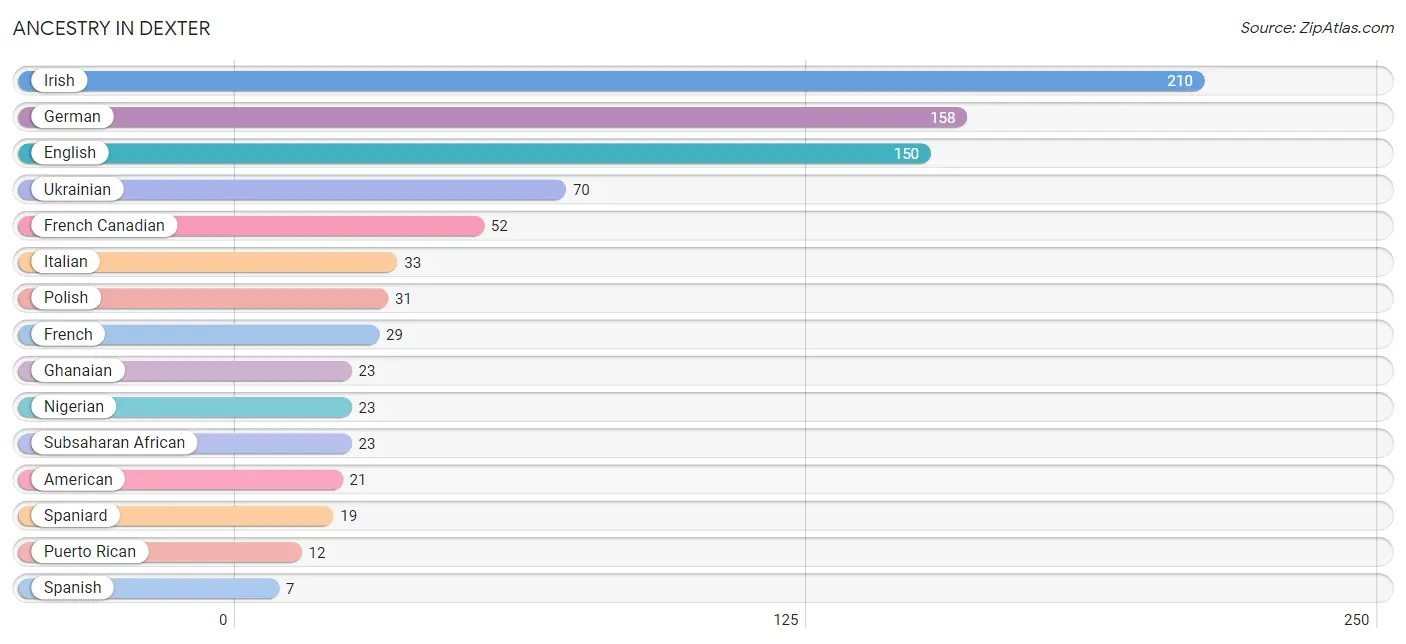
| Ancestry | # Population | % Population |
| American | 21 | 2.8% |
| Arab | 4 | 0.5% |
| Czechoslovakian | 6 | 0.8% |
| Dutch | 2 | 0.3% |
| English | 150 | 19.7% |
| European | 2 | 0.3% |
| French | 29 | 3.8% |
| French Canadian | 52 | 6.8% |
| German | 158 | 20.7% |
| Ghanaian | 23 | 3.0% |
| Irish | 210 | 27.5% |
| Italian | 33 | 4.3% |
| Lebanese | 4 | 0.5% |
| Lithuanian | 1 | 0.1% |
| Nigerian | 23 | 3.0% |
| Polish | 31 | 4.1% |
| Puerto Rican | 12 | 1.6% |
| Romanian | 2 | 0.3% |
| Scotch-Irish | 1 | 0.1% |
| Scottish | 3 | 0.4% |
| Spaniard | 19 | 2.5% |
| Spanish | 7 | 0.9% |
| Subsaharan African | 23 | 3.0% |
| Ukrainian | 70 | 9.2% | View All 24 Rows |
Immigrants in Dexter
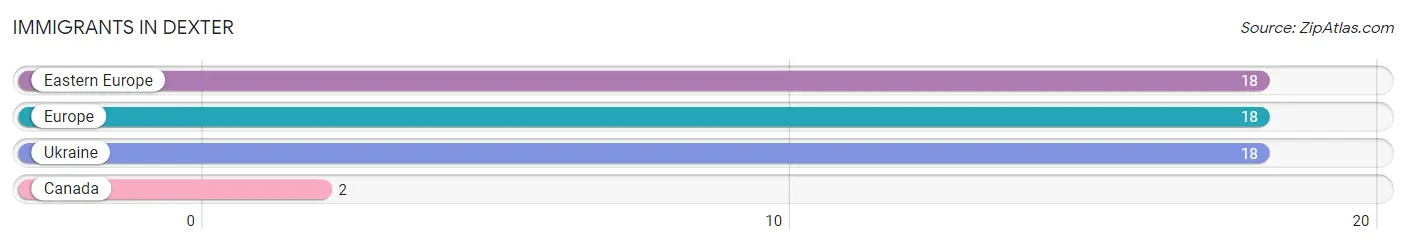
The most numerous immigrant groups reported in Dexter came from Eastern Europe (18 | 2.4%), Europe (18 | 2.4%), Ukraine (18 | 2.4%), and Canada (2 | 0.3%), together accounting for 7.3% of all Dexter residents.
| Immigration Origin | # Population | % Population |
| Canada | 2 | 0.3% |
| Eastern Europe | 18 | 2.4% |
| Europe | 18 | 2.4% |
| Ukraine | 18 | 2.4% | View All 4 Rows |
Sex and Age in Dexter
Sex and Age in Dexter
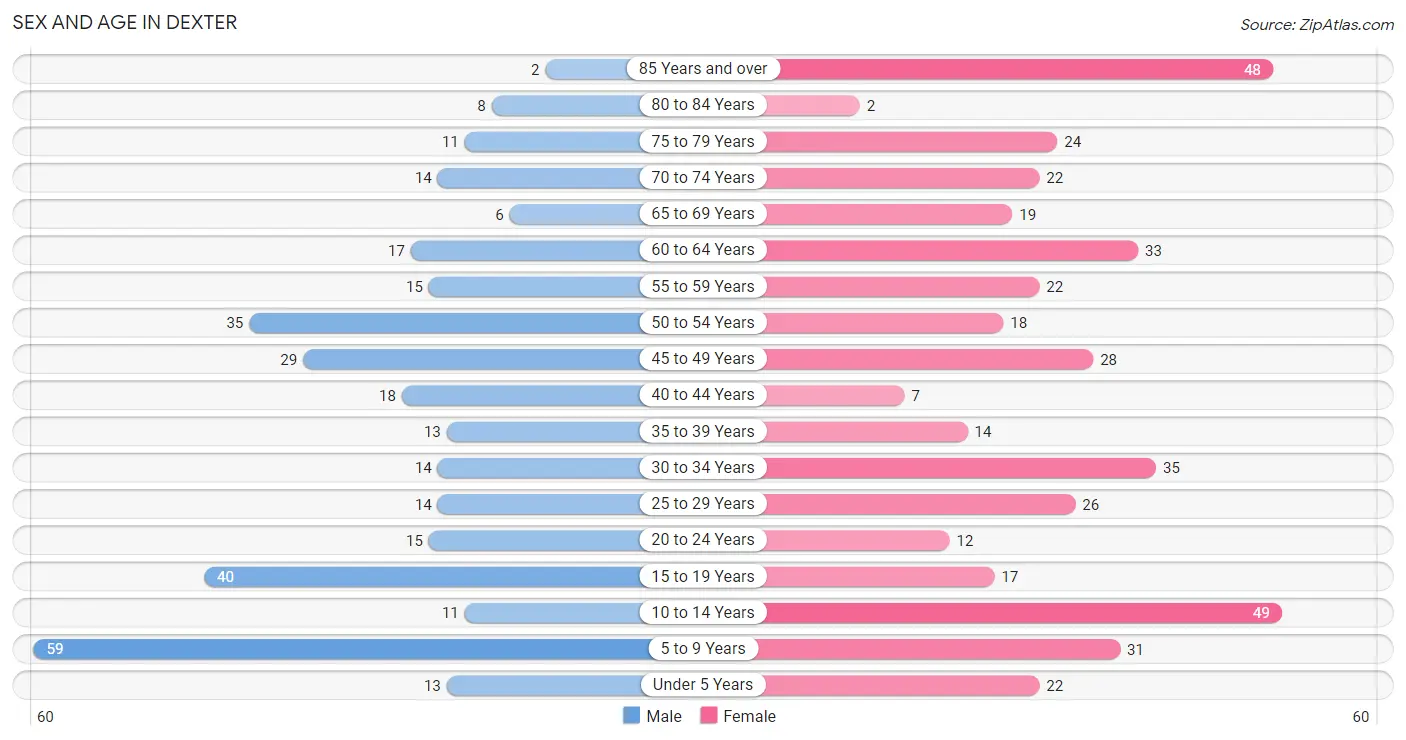
The most populous age groups in Dexter are 5 to 9 Years (59 | 17.7%) for men and 10 to 14 Years (49 | 11.4%) for women.
| Age Bracket | Male | Female |
| Under 5 Years | 13 (3.9%) | 22 (5.1%) |
| 5 to 9 Years | 59 (17.7%) | 31 (7.2%) |
| 10 to 14 Years | 11 (3.3%) | 49 (11.4%) |
| 15 to 19 Years | 40 (12.0%) | 17 (4.0%) |
| 20 to 24 Years | 15 (4.5%) | 12 (2.8%) |
| 25 to 29 Years | 14 (4.2%) | 26 (6.1%) |
| 30 to 34 Years | 14 (4.2%) | 35 (8.2%) |
| 35 to 39 Years | 13 (3.9%) | 14 (3.3%) |
| 40 to 44 Years | 18 (5.4%) | 7 (1.6%) |
| 45 to 49 Years | 29 (8.7%) | 28 (6.5%) |
| 50 to 54 Years | 35 (10.5%) | 18 (4.2%) |
| 55 to 59 Years | 15 (4.5%) | 22 (5.1%) |
| 60 to 64 Years | 17 (5.1%) | 33 (7.7%) |
| 65 to 69 Years | 6 (1.8%) | 19 (4.4%) |
| 70 to 74 Years | 14 (4.2%) | 22 (5.1%) |
| 75 to 79 Years | 11 (3.3%) | 24 (5.6%) |
| 80 to 84 Years | 8 (2.4%) | 2 (0.5%) |
| 85 Years and over | 2 (0.6%) | 48 (11.2%) |
| Total | 334 (100.0%) | 429 (100.0%) |
Families and Households in Dexter
Median Family Size in Dexter
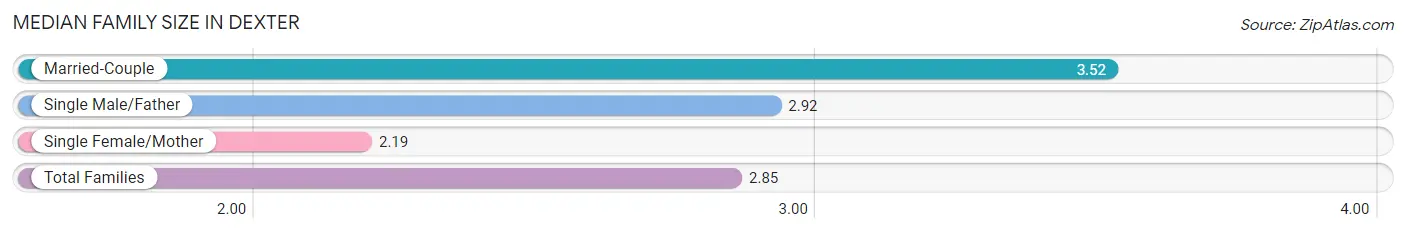
The median family size in Dexter is 2.85 persons per family, with married-couple families (106 | 46.9%) accounting for the largest median family size of 3.52 persons per family. On the other hand, single female/mother families (108 | 47.8%) represent the smallest median family size with 2.19 persons per family.
| Family Type | # Families | Family Size |
| Married-Couple | 106 (46.9%) | 3.52 |
| Single Male/Father | 12 (5.3%) | 2.92 |
| Single Female/Mother | 108 (47.8%) | 2.19 |
| Total Families | 226 (100.0%) | 2.85 |
Median Household Size in Dexter
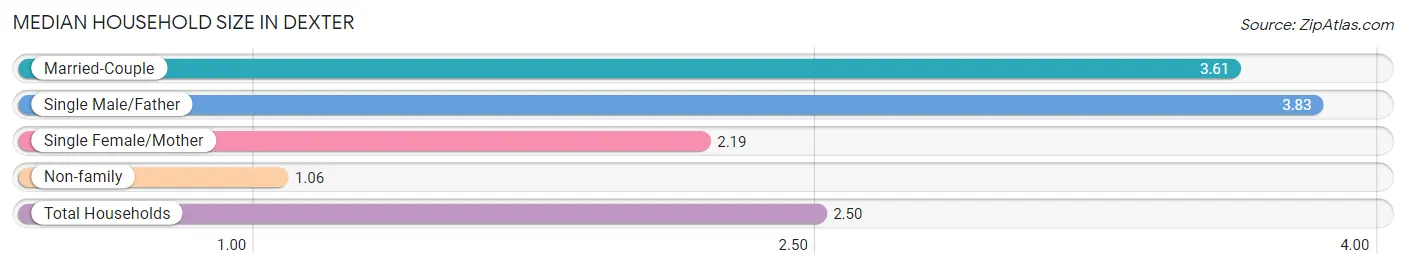
The median household size in Dexter is 2.50 persons per household, with single male/father households (12 | 4.1%) accounting for the largest median household size of 3.83 persons per household. non-family households (70 | 23.6%) represent the smallest median household size with 1.06 persons per household.
| Household Type | # Households | Household Size |
| Married-Couple | 106 (35.8%) | 3.61 |
| Single Male/Father | 12 (4.1%) | 3.83 |
| Single Female/Mother | 108 (36.5%) | 2.19 |
| Non-family | 70 (23.6%) | 1.06 |
| Total Households | 296 (100.0%) | 2.50 |
Household Size by Marriage Status in Dexter
Out of a total of 296 households in Dexter, 226 (76.3%) are family households, while 70 (23.6%) are nonfamily households. The most numerous type of family households are 2-person households, comprising 133, and the most common type of nonfamily households are 1-person households, comprising 67.
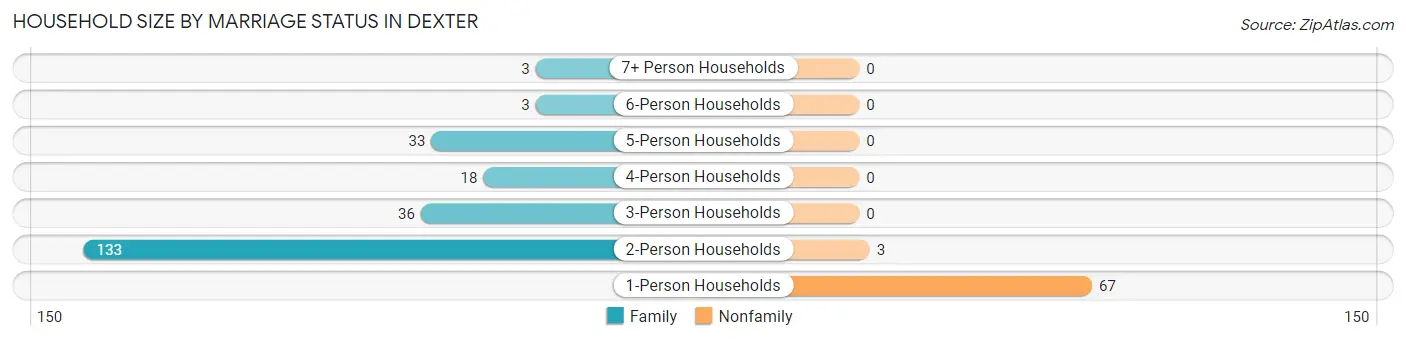
| Household Size | Family Households | Nonfamily Households |
| 1-Person Households | - | 67 (22.6%) |
| 2-Person Households | 133 (44.9%) | 3 (1.0%) |
| 3-Person Households | 36 (12.2%) | 0 (0.0%) |
| 4-Person Households | 18 (6.1%) | 0 (0.0%) |
| 5-Person Households | 33 (11.2%) | 0 (0.0%) |
| 6-Person Households | 3 (1.0%) | 0 (0.0%) |
| 7+ Person Households | 3 (1.0%) | 0 (0.0%) |
| Total | 226 (76.3%) | 70 (23.6%) |
Female Fertility in Dexter
Fertility by Age in Dexter
Average fertility rate in Dexter is 14.0 births per 1,000 women. Women in the age bracket of 20 to 34 years have the highest fertility rate with 27.0 births per 1,000 women. Women in the age bracket of 20 to 34 years acount for 100.0% of all women with births.
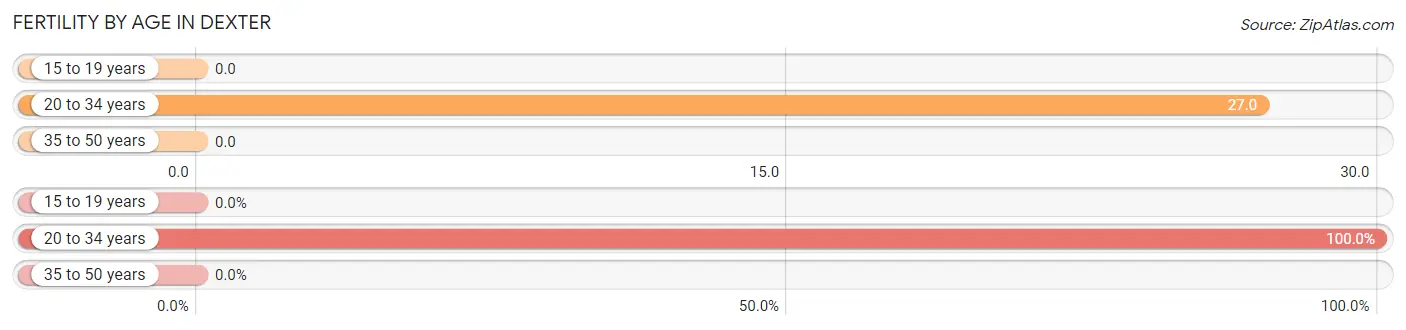
| Age Bracket | Women with Births | Births / 1,000 Women |
| 15 to 19 years | 0 (0.0%) | 0.0 |
| 20 to 34 years | 2 (100.0%) | 27.0 |
| 35 to 50 years | 0 (0.0%) | 0.0 |
| Total | 2 (100.0%) | 14.0 |
Fertility by Age by Marriage Status in Dexter
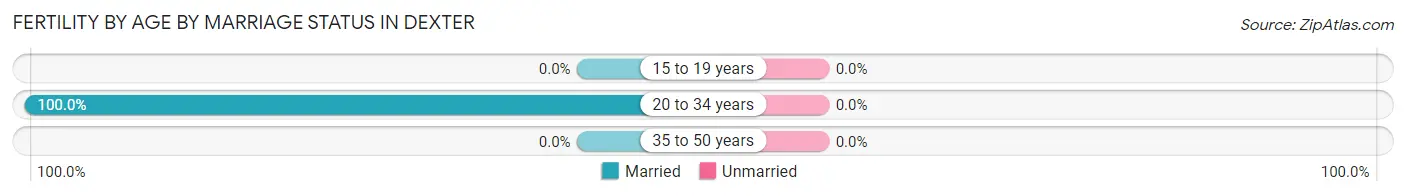
| Age Bracket | Married | Unmarried |
| 15 to 19 years | 0 (0.0%) | 0 (0.0%) |
| 20 to 34 years | 2 (100.0%) | 0 (0.0%) |
| 35 to 50 years | 0 (0.0%) | 0 (0.0%) |
| Total | 2 (100.0%) | 0 (0.0%) |
Fertility by Education in Dexter
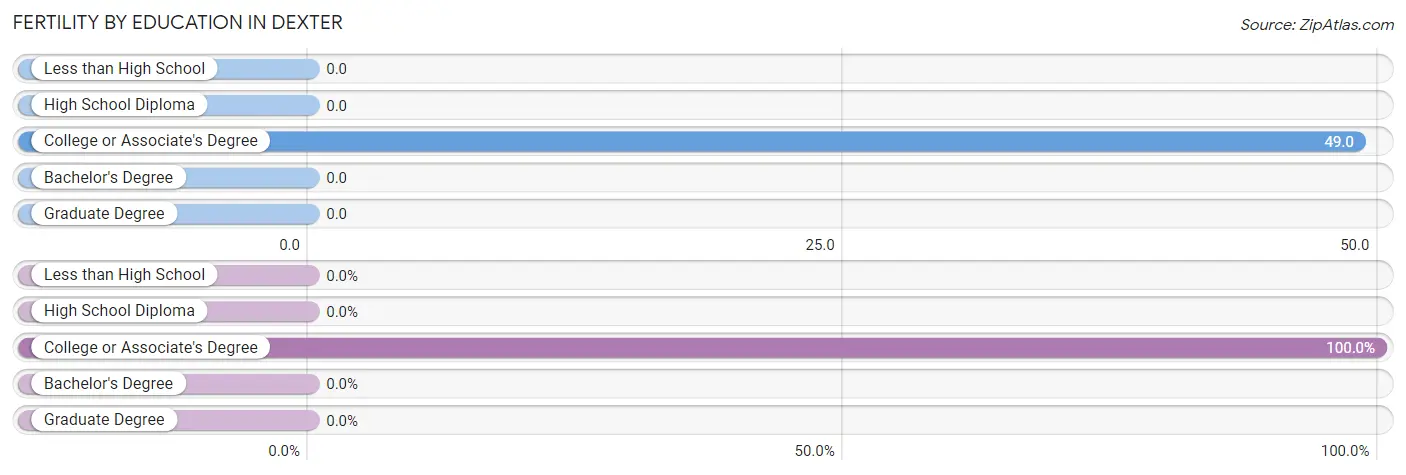
| Educational Attainment | Women with Births | Births / 1,000 Women |
| Less than High School | 0 (0.0%) | 0.0 |
| High School Diploma | 0 (0.0%) | 0.0 |
| College or Associate's Degree | 2 (100.0%) | 49.0 |
| Bachelor's Degree | 0 (0.0%) | 0.0 |
| Graduate Degree | 0 (0.0%) | 0.0 |
| Total | 2 (100.0%) | 14.0 |
Fertility by Education by Marriage Status in Dexter
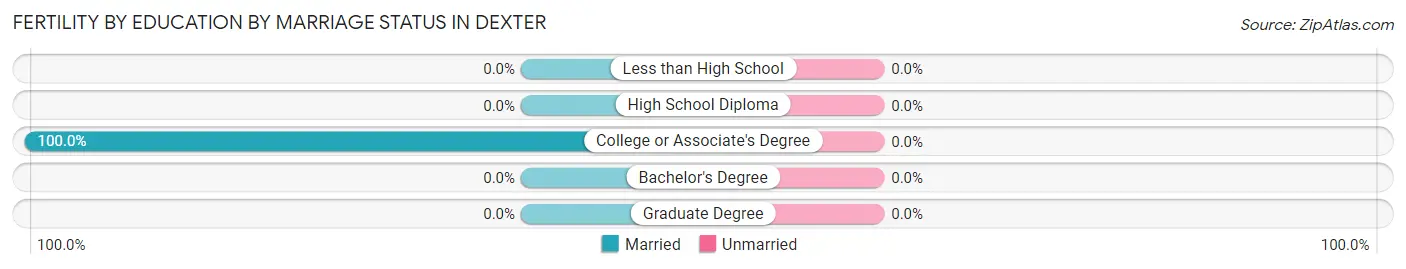
| Educational Attainment | Married | Unmarried |
| Less than High School | 0 (0.0%) | 0 (0.0%) |
| High School Diploma | 0 (0.0%) | 0 (0.0%) |
| College or Associate's Degree | 2 (100.0%) | 0 (0.0%) |
| Bachelor's Degree | 0 (0.0%) | 0 (0.0%) |
| Graduate Degree | 0 (0.0%) | 0 (0.0%) |
| Total | 2 (100.0%) | 0 (0.0%) |
Employment Characteristics in Dexter
Employment by Class of Employer in Dexter
Among the 295 employed individuals in Dexter, private company employees (143 | 48.5%), local government employees (53 | 18.0%), and state government employees (37 | 12.5%) make up the most common classes of employment.
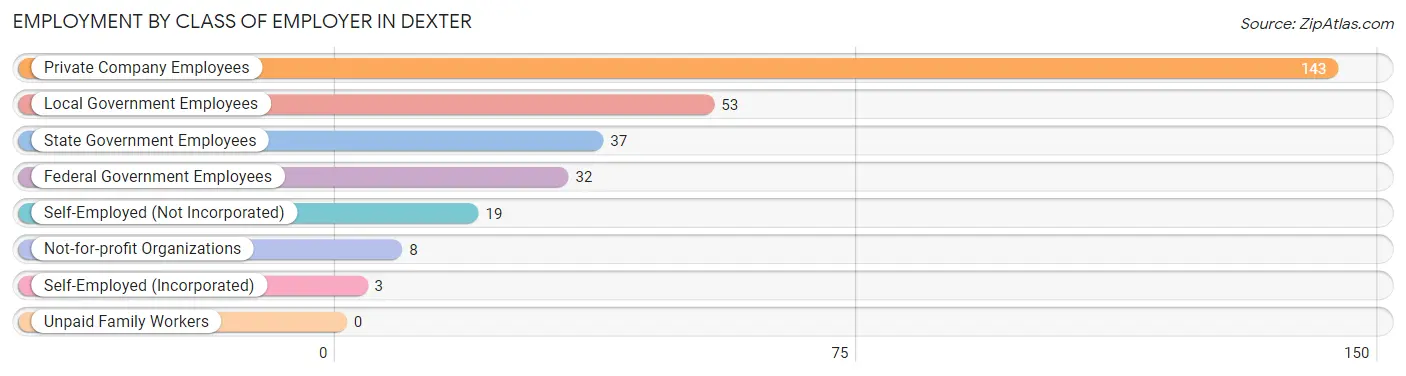
| Employer Class | # Employees | % Employees |
| Private Company Employees | 143 | 48.5% |
| Self-Employed (Incorporated) | 3 | 1.0% |
| Self-Employed (Not Incorporated) | 19 | 6.4% |
| Not-for-profit Organizations | 8 | 2.7% |
| Local Government Employees | 53 | 18.0% |
| State Government Employees | 37 | 12.5% |
| Federal Government Employees | 32 | 10.8% |
| Unpaid Family Workers | 0 | 0.0% |
| Total | 295 | 100.0% |
Employment Status by Age in Dexter
According to the labor force statistics for Dexter, out of the total population over 16 years of age (565), 57.2% or 323 individuals are in the labor force, with 5.4% or 17 of them unemployed. The age group with the highest labor force participation rate is 30 to 34 years, with 100.0% or 49 individuals in the labor force. Within the labor force, the 35 to 44 years age range has the highest percentage of unemployed individuals, with 21.2% or 7 of them being unemployed.
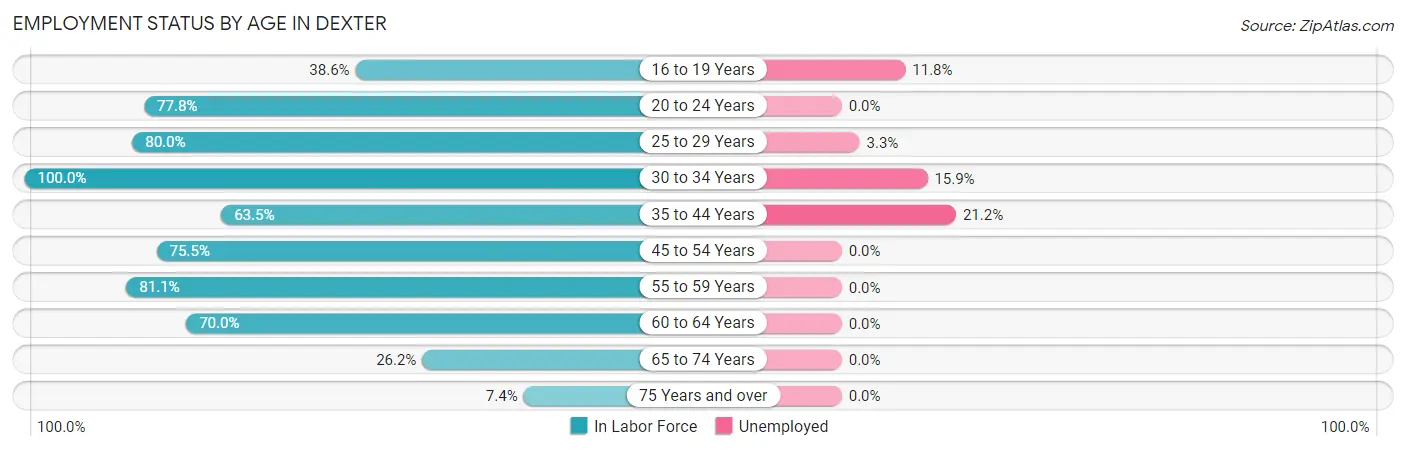
| Age Bracket | In Labor Force | Unemployed |
| 16 to 19 Years | 17 (38.6%) | 2 (11.8%) |
| 20 to 24 Years | 21 (77.8%) | 0 (0.0%) |
| 25 to 29 Years | 32 (80.0%) | 1 (3.3%) |
| 30 to 34 Years | 49 (100.0%) | 8 (15.9%) |
| 35 to 44 Years | 33 (63.5%) | 7 (21.2%) |
| 45 to 54 Years | 83 (75.5%) | 0 (0.0%) |
| 55 to 59 Years | 30 (81.1%) | 0 (0.0%) |
| 60 to 64 Years | 35 (70.0%) | 0 (0.0%) |
| 65 to 74 Years | 16 (26.2%) | 0 (0.0%) |
| 75 Years and over | 7 (7.4%) | 0 (0.0%) |
| Total | 323 (57.2%) | 17 (5.4%) |
Employment Status by Educational Attainment in Dexter
According to labor force statistics for Dexter, 77.5% of individuals (262) out of the total population between 25 and 64 years of age (338) are in the labor force, with 5.9% or 15 of them being unemployed. The group with the highest labor force participation rate are those with the educational attainment of bachelor's degree or higher, with 95.5% or 42 individuals in the labor force. Within the labor force, individuals with high school diploma education have the highest percentage of unemployment, with 8.7% or 8 of them being unemployed.
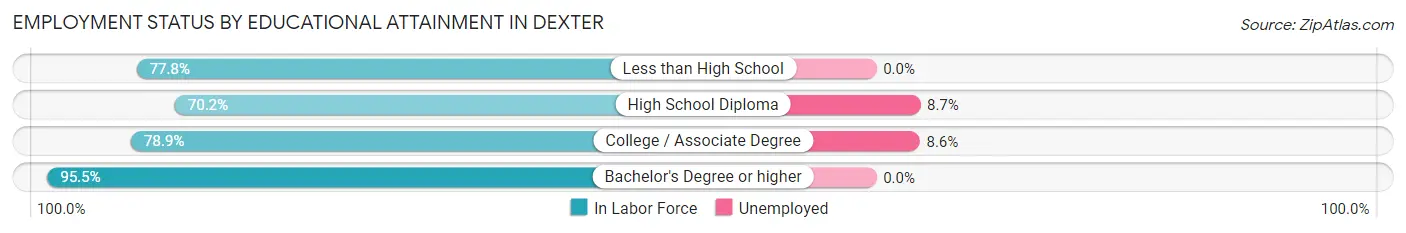
| Educational Attainment | In Labor Force | Unemployed |
| Less than High School | 42 (77.8%) | 0 (0.0%) |
| High School Diploma | 92 (70.2%) | 11 (8.7%) |
| College / Associate Degree | 86 (78.9%) | 9 (8.6%) |
| Bachelor's Degree or higher | 42 (95.5%) | 0 (0.0%) |
| Total | 262 (77.5%) | 20 (5.9%) |
Employment Occupations by Sex in Dexter
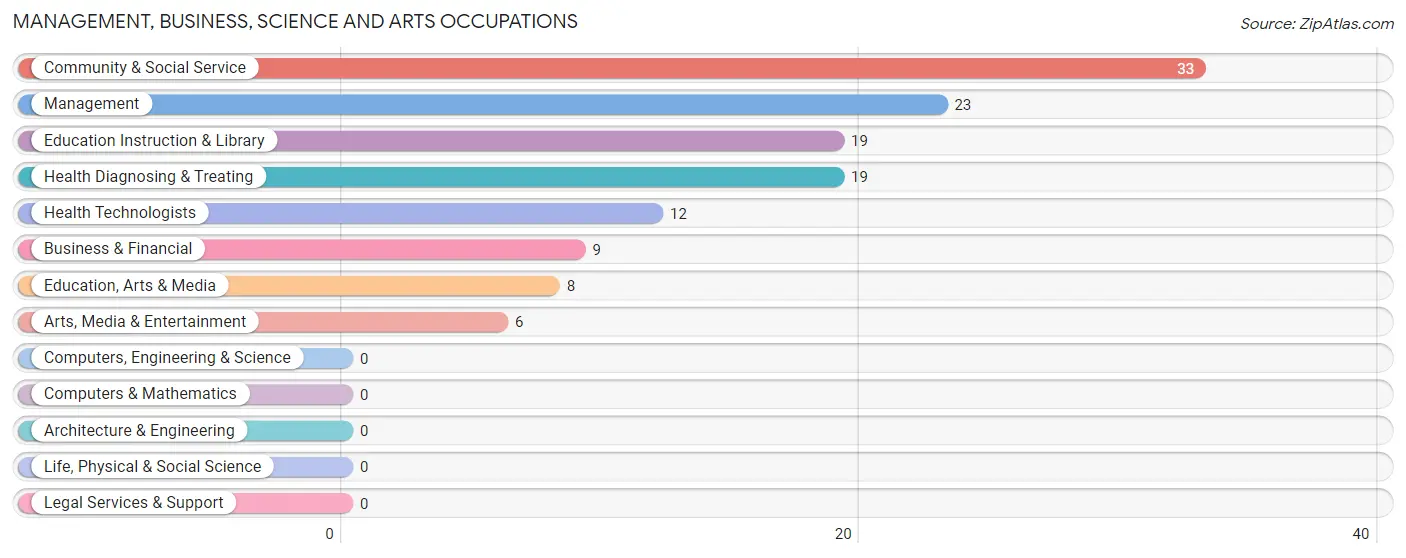
Management, Business, Science and Arts Occupations
The most common Management, Business, Science and Arts occupations in Dexter are Community & Social Service (33 | 11.0%), Management (23 | 7.7%), Education Instruction & Library (19 | 6.4%), Health Diagnosing & Treating (19 | 6.4%), and Health Technologists (12 | 4.0%).
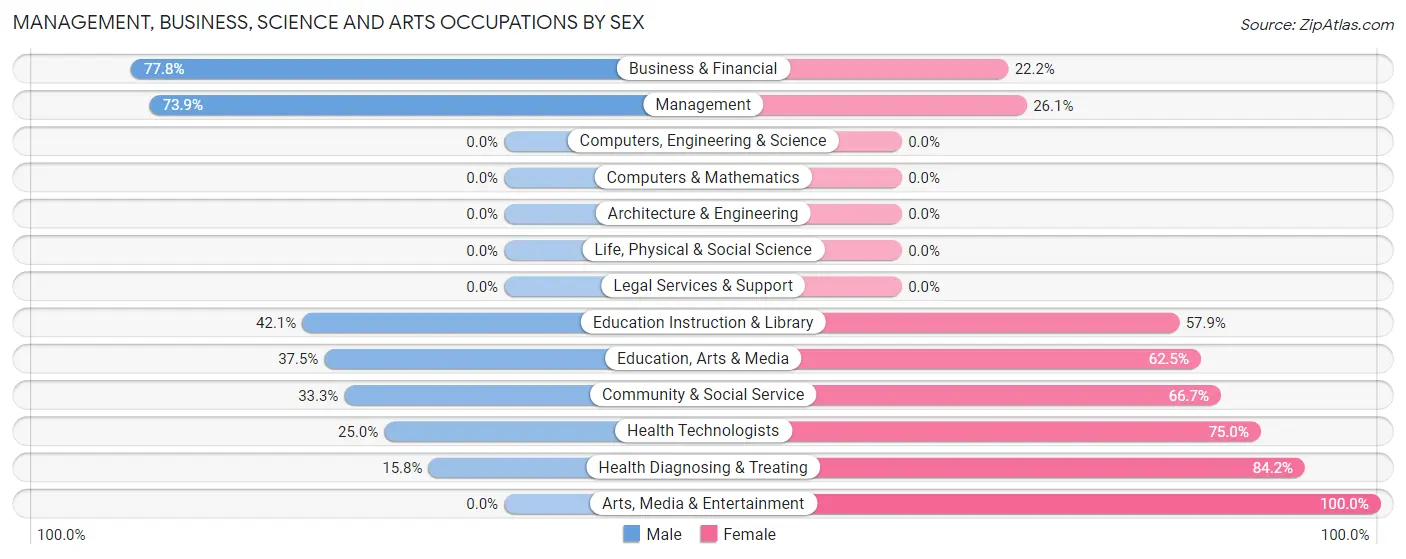
Management, Business, Science and Arts Occupations by Sex
Within the Management, Business, Science and Arts occupations in Dexter, the most male-oriented occupations are Business & Financial (77.8%), Management (73.9%), and Education Instruction & Library (42.1%), while the most female-oriented occupations are Arts, Media & Entertainment (100.0%), Health Diagnosing & Treating (84.2%), and Health Technologists (75.0%).
| Occupation | Male | Female |
| Management | 17 (73.9%) | 6 (26.1%) |
| Business & Financial | 7 (77.8%) | 2 (22.2%) |
| Computers, Engineering & Science | 0 (0.0%) | 0 (0.0%) |
| Computers & Mathematics | 0 (0.0%) | 0 (0.0%) |
| Architecture & Engineering | 0 (0.0%) | 0 (0.0%) |
| Life, Physical & Social Science | 0 (0.0%) | 0 (0.0%) |
| Community & Social Service | 11 (33.3%) | 22 (66.7%) |
| Education, Arts & Media | 3 (37.5%) | 5 (62.5%) |
| Legal Services & Support | 0 (0.0%) | 0 (0.0%) |
| Education Instruction & Library | 8 (42.1%) | 11 (57.9%) |
| Arts, Media & Entertainment | 0 (0.0%) | 6 (100.0%) |
| Health Diagnosing & Treating | 3 (15.8%) | 16 (84.2%) |
| Health Technologists | 3 (25.0%) | 9 (75.0%) |
| Total (Category) | 38 (45.2%) | 46 (54.8%) |
| Total (Overall) | 161 (53.8%) | 138 (46.2%) |
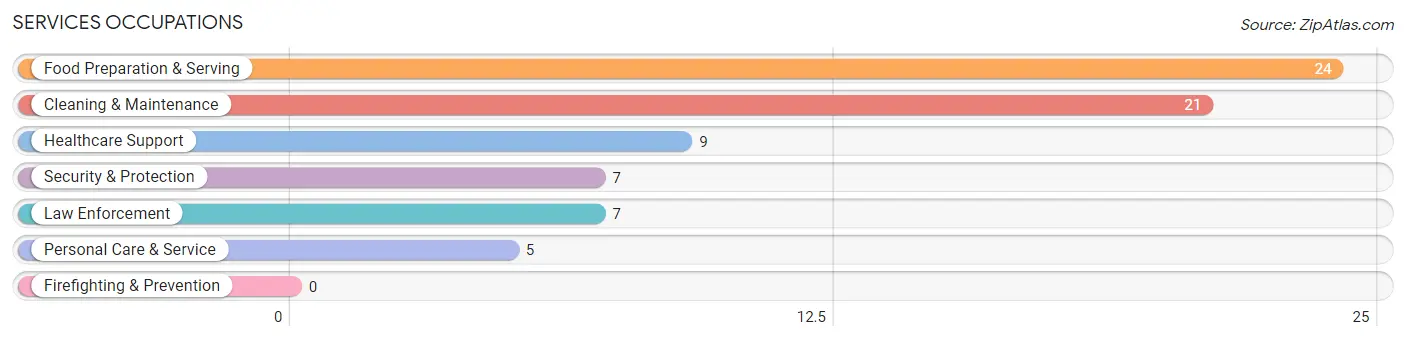
Services Occupations
The most common Services occupations in Dexter are Food Preparation & Serving (24 | 8.0%), Cleaning & Maintenance (21 | 7.0%), Healthcare Support (9 | 3.0%), Security & Protection (7 | 2.3%), and Law Enforcement (7 | 2.3%).
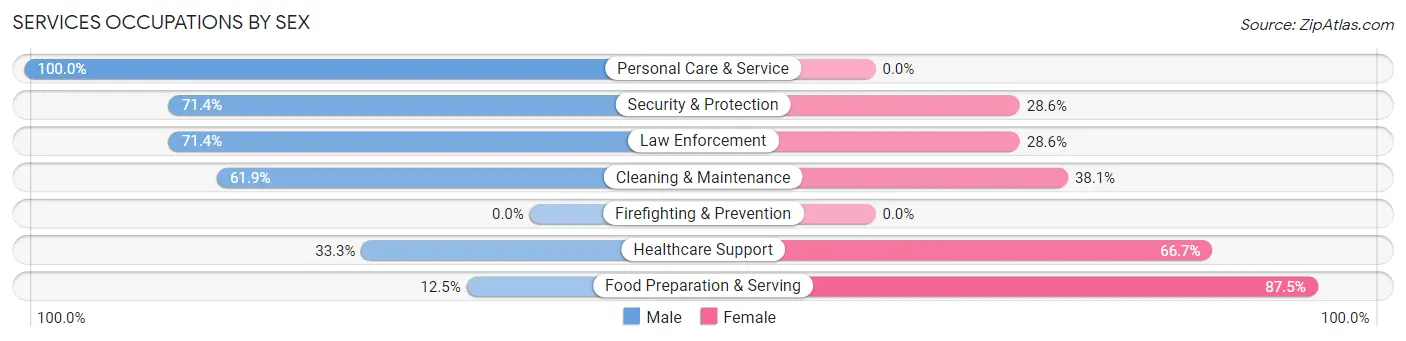
Services Occupations by Sex
Within the Services occupations in Dexter, the most male-oriented occupations are Personal Care & Service (100.0%), Security & Protection (71.4%), and Law Enforcement (71.4%), while the most female-oriented occupations are Food Preparation & Serving (87.5%), Healthcare Support (66.7%), and Cleaning & Maintenance (38.1%).
| Occupation | Male | Female |
| Healthcare Support | 3 (33.3%) | 6 (66.7%) |
| Security & Protection | 5 (71.4%) | 2 (28.6%) |
| Firefighting & Prevention | 0 (0.0%) | 0 (0.0%) |
| Law Enforcement | 5 (71.4%) | 2 (28.6%) |
| Food Preparation & Serving | 3 (12.5%) | 21 (87.5%) |
| Cleaning & Maintenance | 13 (61.9%) | 8 (38.1%) |
| Personal Care & Service | 5 (100.0%) | 0 (0.0%) |
| Total (Category) | 29 (43.9%) | 37 (56.1%) |
| Total (Overall) | 161 (53.8%) | 138 (46.2%) |
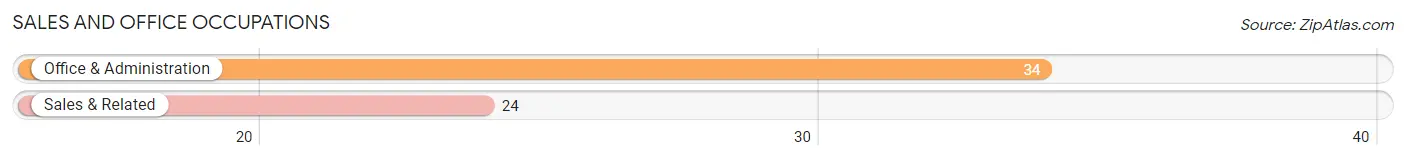
Sales and Office Occupations
The most common Sales and Office occupations in Dexter are Office & Administration (34 | 11.4%), and Sales & Related (24 | 8.0%).
Sales and Office Occupations by Sex
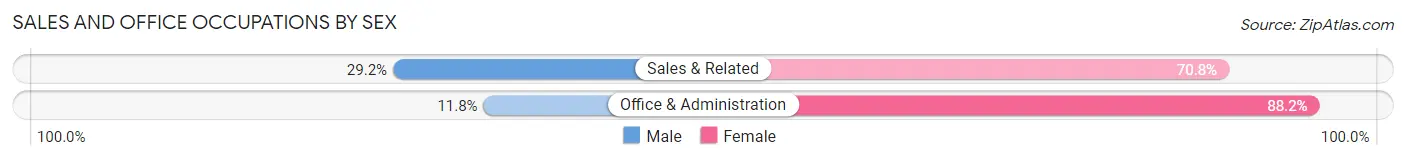
| Occupation | Male | Female |
| Sales & Related | 7 (29.2%) | 17 (70.8%) |
| Office & Administration | 4 (11.8%) | 30 (88.2%) |
| Total (Category) | 11 (19.0%) | 47 (81.0%) |
| Total (Overall) | 161 (53.8%) | 138 (46.2%) |
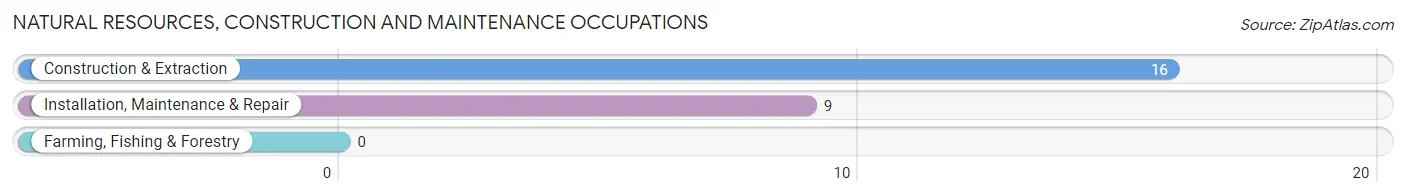
Natural Resources, Construction and Maintenance Occupations
The most common Natural Resources, Construction and Maintenance occupations in Dexter are Construction & Extraction (16 | 5.3%), and Installation, Maintenance & Repair (9 | 3.0%).
Natural Resources, Construction and Maintenance Occupations by Sex
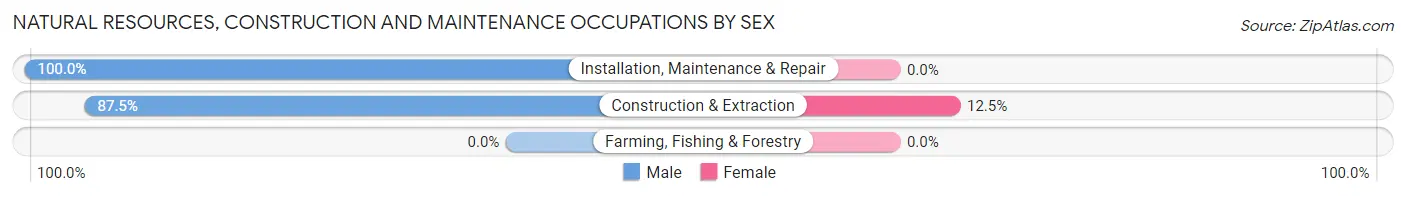
| Occupation | Male | Female |
| Farming, Fishing & Forestry | 0 (0.0%) | 0 (0.0%) |
| Construction & Extraction | 14 (87.5%) | 2 (12.5%) |
| Installation, Maintenance & Repair | 9 (100.0%) | 0 (0.0%) |
| Total (Category) | 23 (92.0%) | 2 (8.0%) |
| Total (Overall) | 161 (53.8%) | 138 (46.2%) |
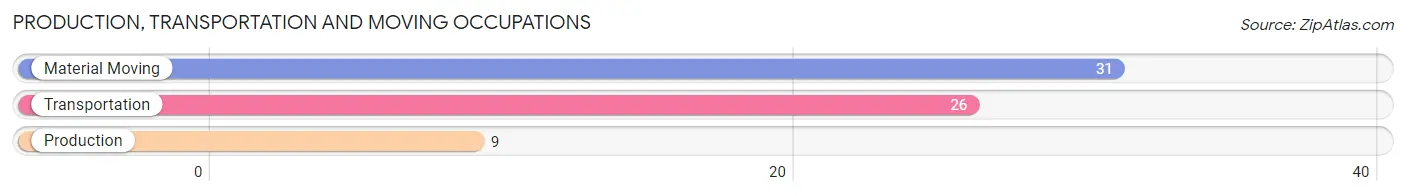
Production, Transportation and Moving Occupations
The most common Production, Transportation and Moving occupations in Dexter are Material Moving (31 | 10.4%), Transportation (26 | 8.7%), and Production (9 | 3.0%).
Production, Transportation and Moving Occupations by Sex
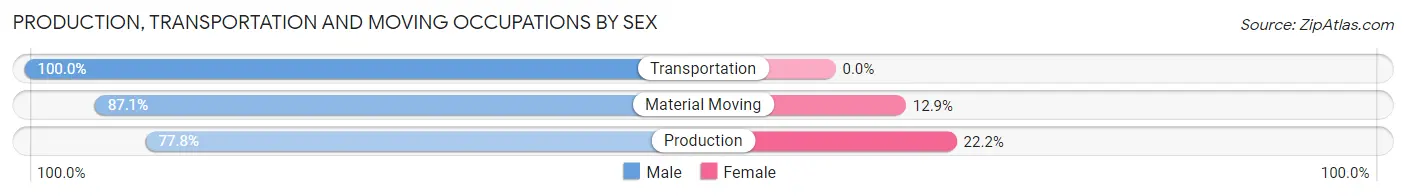
| Occupation | Male | Female |
| Production | 7 (77.8%) | 2 (22.2%) |
| Transportation | 26 (100.0%) | 0 (0.0%) |
| Material Moving | 27 (87.1%) | 4 (12.9%) |
| Total (Category) | 60 (90.9%) | 6 (9.1%) |
| Total (Overall) | 161 (53.8%) | 138 (46.2%) |
Employment Industries by Sex in Dexter
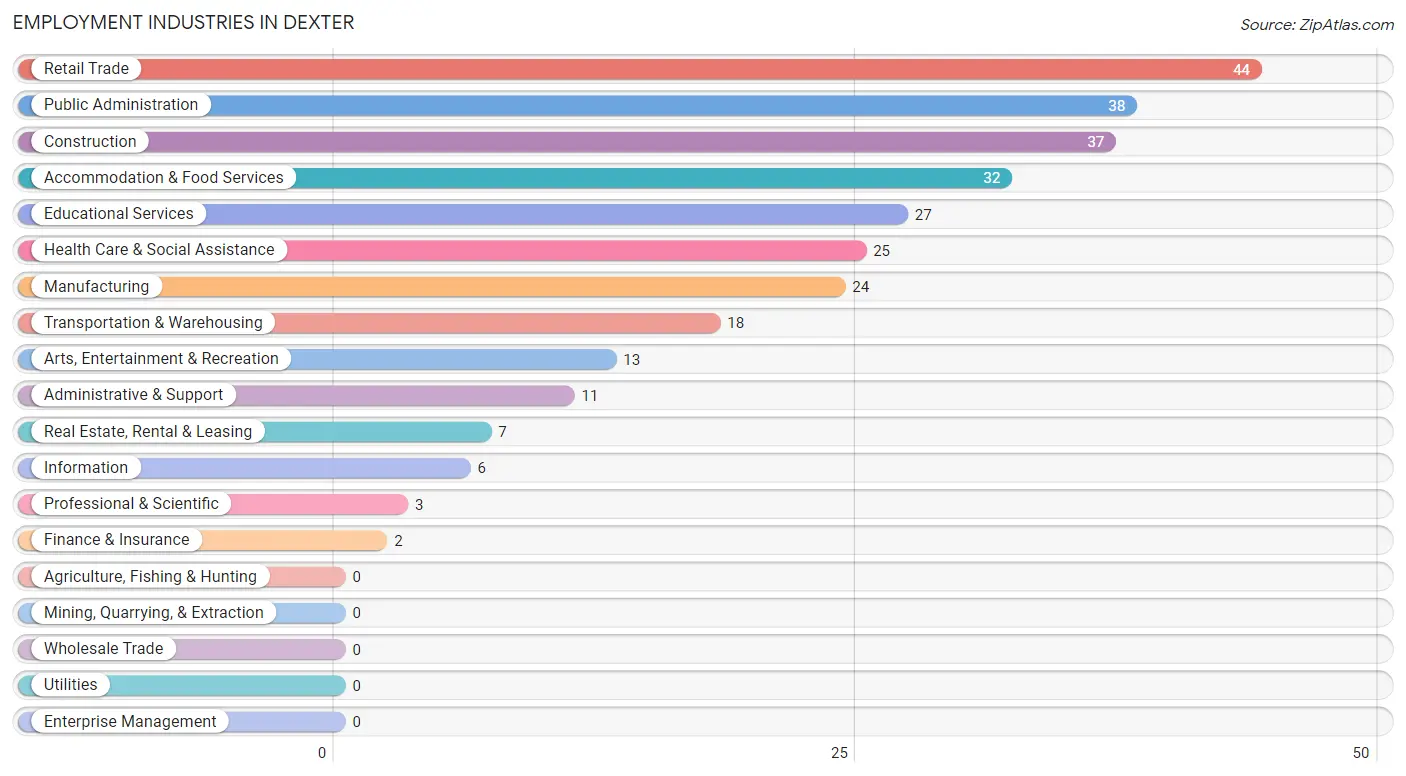
Employment Industries in Dexter
The major employment industries in Dexter include Retail Trade (44 | 14.7%), Public Administration (38 | 12.7%), Construction (37 | 12.4%), Accommodation & Food Services (32 | 10.7%), and Educational Services (27 | 9.0%).
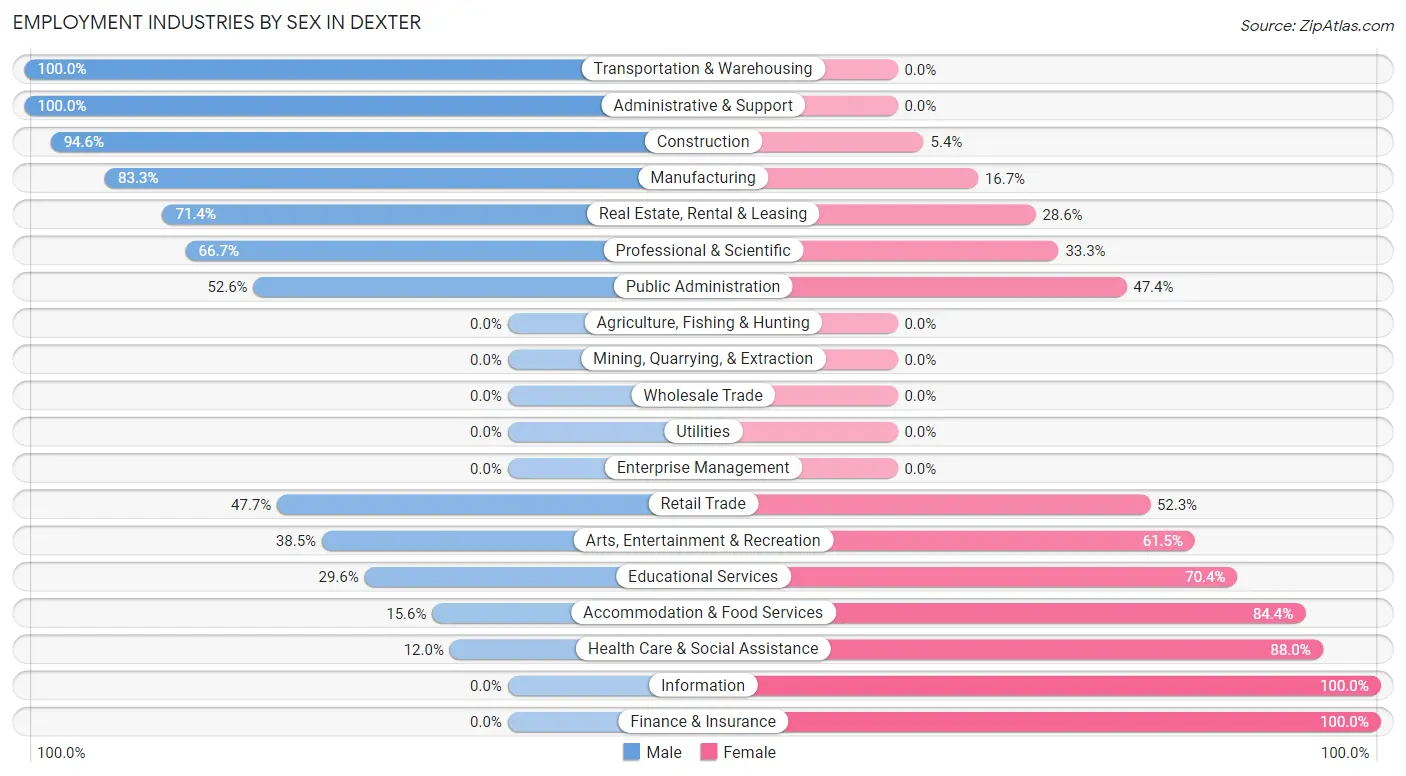
Employment Industries by Sex in Dexter
The Dexter industries that see more men than women are Transportation & Warehousing (100.0%), Administrative & Support (100.0%), and Construction (94.6%), whereas the industries that tend to have a higher number of women are Information (100.0%), Finance & Insurance (100.0%), and Health Care & Social Assistance (88.0%).
| Industry | Male | Female |
| Agriculture, Fishing & Hunting | 0 (0.0%) | 0 (0.0%) |
| Mining, Quarrying, & Extraction | 0 (0.0%) | 0 (0.0%) |
| Construction | 35 (94.6%) | 2 (5.4%) |
| Manufacturing | 20 (83.3%) | 4 (16.7%) |
| Wholesale Trade | 0 (0.0%) | 0 (0.0%) |
| Retail Trade | 21 (47.7%) | 23 (52.3%) |
| Transportation & Warehousing | 18 (100.0%) | 0 (0.0%) |
| Utilities | 0 (0.0%) | 0 (0.0%) |
| Information | 0 (0.0%) | 6 (100.0%) |
| Finance & Insurance | 0 (0.0%) | 2 (100.0%) |
| Real Estate, Rental & Leasing | 5 (71.4%) | 2 (28.6%) |
| Professional & Scientific | 2 (66.7%) | 1 (33.3%) |
| Enterprise Management | 0 (0.0%) | 0 (0.0%) |
| Administrative & Support | 11 (100.0%) | 0 (0.0%) |
| Educational Services | 8 (29.6%) | 19 (70.4%) |
| Health Care & Social Assistance | 3 (12.0%) | 22 (88.0%) |
| Arts, Entertainment & Recreation | 5 (38.5%) | 8 (61.5%) |
| Accommodation & Food Services | 5 (15.6%) | 27 (84.4%) |
| Public Administration | 20 (52.6%) | 18 (47.4%) |
| Total | 161 (53.8%) | 138 (46.2%) |
Education in Dexter
School Enrollment in Dexter
The most common levels of schooling among the 223 students in Dexter are elementary school (89 | 39.9%), middle school (55 | 24.7%), and high school (46 | 20.6%).
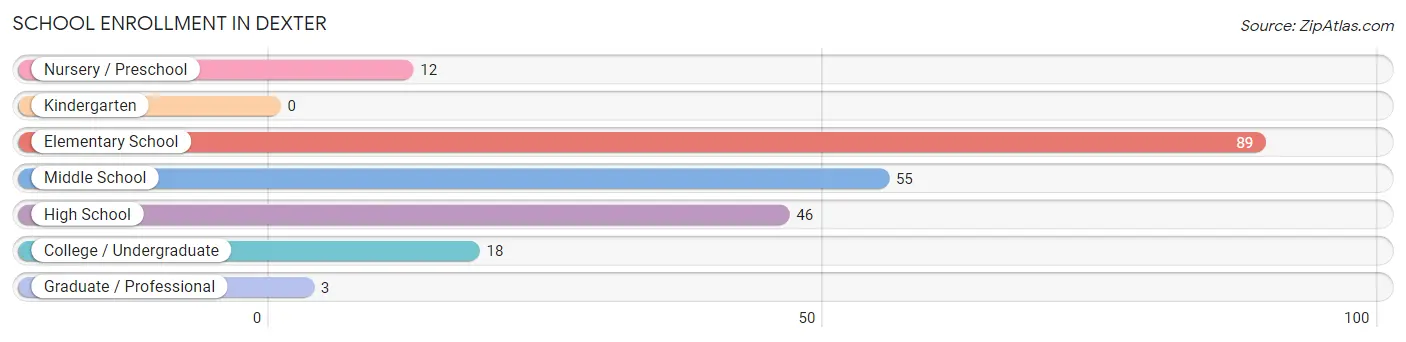
| School Level | # Students | % Students |
| Nursery / Preschool | 12 | 5.4% |
| Kindergarten | 0 | 0.0% |
| Elementary School | 89 | 39.9% |
| Middle School | 55 | 24.7% |
| High School | 46 | 20.6% |
| College / Undergraduate | 18 | 8.1% |
| Graduate / Professional | 3 | 1.3% |
| Total | 223 | 100.0% |
School Enrollment by Age by Funding Source in Dexter
Out of a total of 223 students who are enrolled in schools in Dexter, 15 (6.7%) attend a private institution, while the remaining 208 (93.3%) are enrolled in public schools. The age group of 20 to 24 year olds has the highest likelihood of being enrolled in private schools, with 9 (100.0% in the age bracket) enrolled. Conversely, the age group of 3 to 4 year olds has the lowest likelihood of being enrolled in a private school, with 6 (100.0% in the age bracket) attending a public institution.
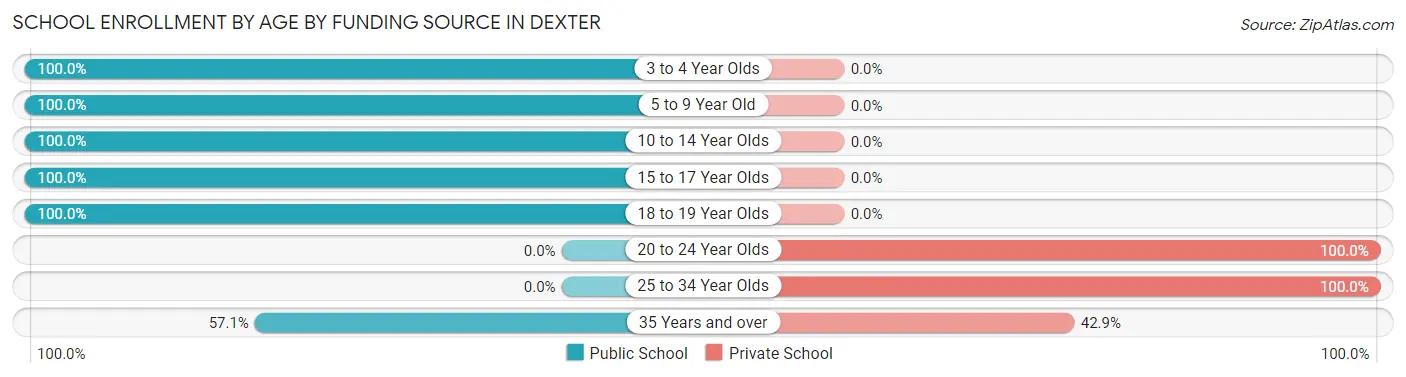
| Age Bracket | Public School | Private School |
| 3 to 4 Year Olds | 6 (100.0%) | 0 (0.0%) |
| 5 to 9 Year Old | 90 (100.0%) | 0 (0.0%) |
| 10 to 14 Year Olds | 60 (100.0%) | 0 (0.0%) |
| 15 to 17 Year Olds | 44 (100.0%) | 0 (0.0%) |
| 18 to 19 Year Olds | 4 (100.0%) | 0 (0.0%) |
| 20 to 24 Year Olds | 0 (0.0%) | 9 (100.0%) |
| 25 to 34 Year Olds | 0 (0.0%) | 3 (100.0%) |
| 35 Years and over | 4 (57.1%) | 3 (42.9%) |
| Total | 208 (93.3%) | 15 (6.7%) |
Educational Attainment by Field of Study in Dexter
Psychology (10 | 18.2%), social sciences (10 | 18.2%), communications (9 | 16.4%), arts & humanities (8 | 14.5%), and science & technology (5 | 9.1%) are the most common fields of study among 55 individuals in Dexter who have obtained a bachelor's degree or higher.
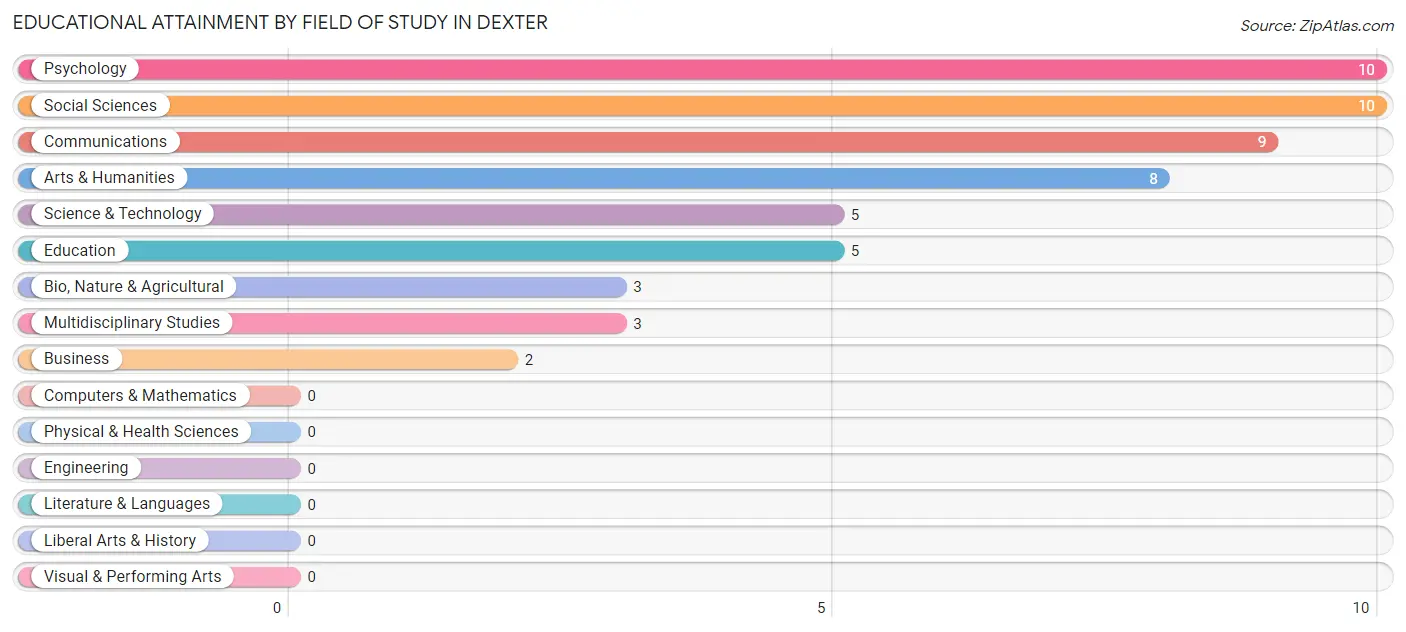
| Field of Study | # Graduates | % Graduates |
| Computers & Mathematics | 0 | 0.0% |
| Bio, Nature & Agricultural | 3 | 5.4% |
| Physical & Health Sciences | 0 | 0.0% |
| Psychology | 10 | 18.2% |
| Social Sciences | 10 | 18.2% |
| Engineering | 0 | 0.0% |
| Multidisciplinary Studies | 3 | 5.4% |
| Science & Technology | 5 | 9.1% |
| Business | 2 | 3.6% |
| Education | 5 | 9.1% |
| Literature & Languages | 0 | 0.0% |
| Liberal Arts & History | 0 | 0.0% |
| Visual & Performing Arts | 0 | 0.0% |
| Communications | 9 | 16.4% |
| Arts & Humanities | 8 | 14.5% |
| Total | 55 | 100.0% |
Transportation & Commute in Dexter
Vehicle Availability by Sex in Dexter
The most prevalent vehicle ownership categories in Dexter are males with 2 vehicles (86, accounting for 53.7%) and females with 2 vehicles (53, making up 65.6%).
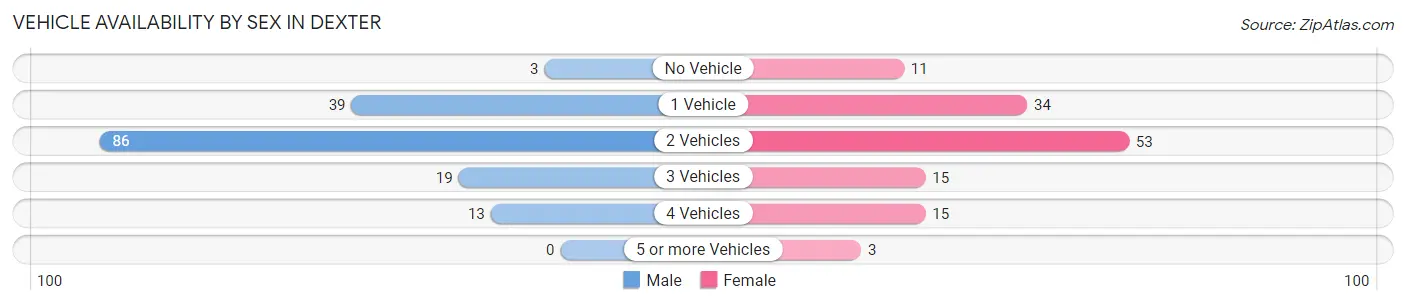
| Vehicles Available | Male | Female |
| No Vehicle | 3 (1.9%) | 11 (8.4%) |
| 1 Vehicle | 39 (24.4%) | 34 (26.0%) |
| 2 Vehicles | 86 (53.7%) | 53 (40.5%) |
| 3 Vehicles | 19 (11.9%) | 15 (11.5%) |
| 4 Vehicles | 13 (8.1%) | 15 (11.5%) |
| 5 or more Vehicles | 0 (0.0%) | 3 (2.3%) |
| Total | 160 (100.0%) | 131 (100.0%) |
Commute Time in Dexter
The most frequently occuring commute durations in Dexter are 20 to 24 minutes (64 commuters, 23.1%), 5 to 9 minutes (59 commuters, 21.3%), and 10 to 14 minutes (48 commuters, 17.3%).
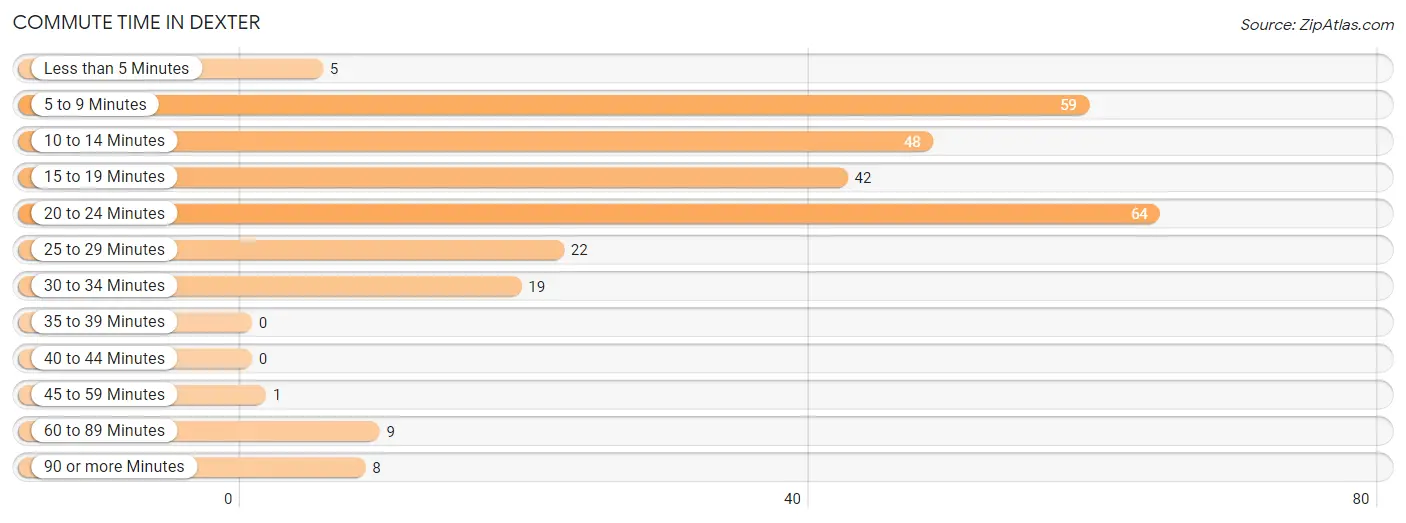
| Commute Time | # Commuters | % Commuters |
| Less than 5 Minutes | 5 | 1.8% |
| 5 to 9 Minutes | 59 | 21.3% |
| 10 to 14 Minutes | 48 | 17.3% |
| 15 to 19 Minutes | 42 | 15.2% |
| 20 to 24 Minutes | 64 | 23.1% |
| 25 to 29 Minutes | 22 | 7.9% |
| 30 to 34 Minutes | 19 | 6.9% |
| 35 to 39 Minutes | 0 | 0.0% |
| 40 to 44 Minutes | 0 | 0.0% |
| 45 to 59 Minutes | 1 | 0.4% |
| 60 to 89 Minutes | 9 | 3.3% |
| 90 or more Minutes | 8 | 2.9% |
Commute Time by Sex in Dexter
The most common commute times in Dexter are 5 to 9 minutes (48 commuters, 29.4%) for males and 10 to 14 minutes (34 commuters, 29.8%) for females.
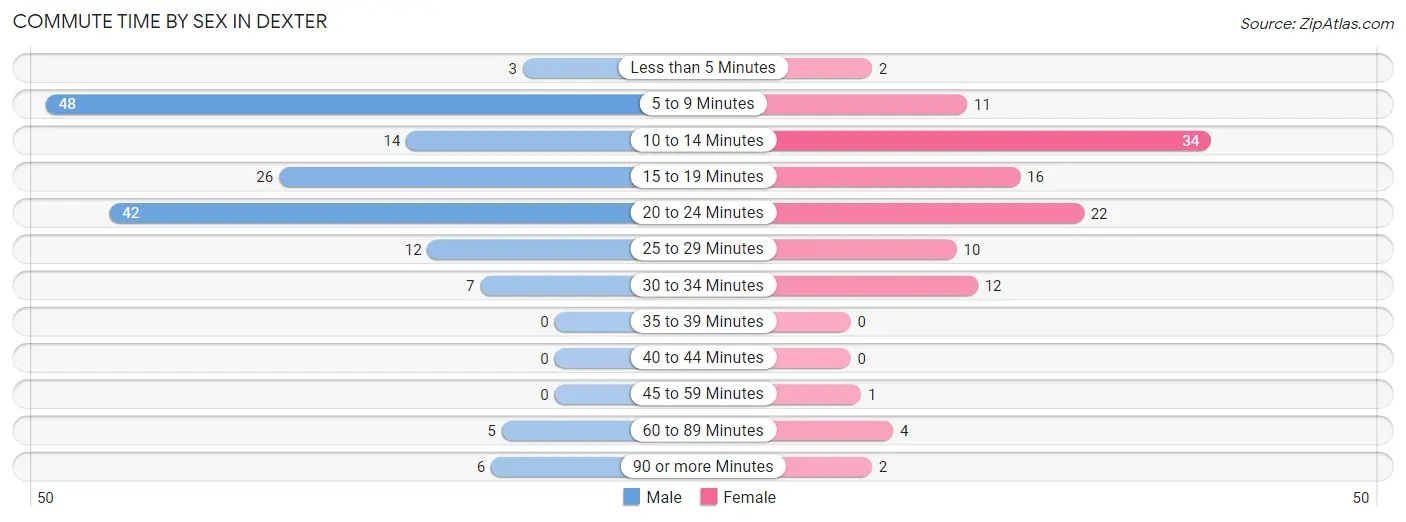
| Commute Time | Male | Female |
| Less than 5 Minutes | 3 (1.8%) | 2 (1.8%) |
| 5 to 9 Minutes | 48 (29.4%) | 11 (9.7%) |
| 10 to 14 Minutes | 14 (8.6%) | 34 (29.8%) |
| 15 to 19 Minutes | 26 (16.0%) | 16 (14.0%) |
| 20 to 24 Minutes | 42 (25.8%) | 22 (19.3%) |
| 25 to 29 Minutes | 12 (7.4%) | 10 (8.8%) |
| 30 to 34 Minutes | 7 (4.3%) | 12 (10.5%) |
| 35 to 39 Minutes | 0 (0.0%) | 0 (0.0%) |
| 40 to 44 Minutes | 0 (0.0%) | 0 (0.0%) |
| 45 to 59 Minutes | 0 (0.0%) | 1 (0.9%) |
| 60 to 89 Minutes | 5 (3.1%) | 4 (3.5%) |
| 90 or more Minutes | 6 (3.7%) | 2 (1.8%) |
Time of Departure to Work by Sex in Dexter
The most frequent times of departure to work in Dexter are 8:00 AM to 8:29 AM (36, 22.1%) for males and 7:30 AM to 7:59 AM (37, 32.5%) for females.
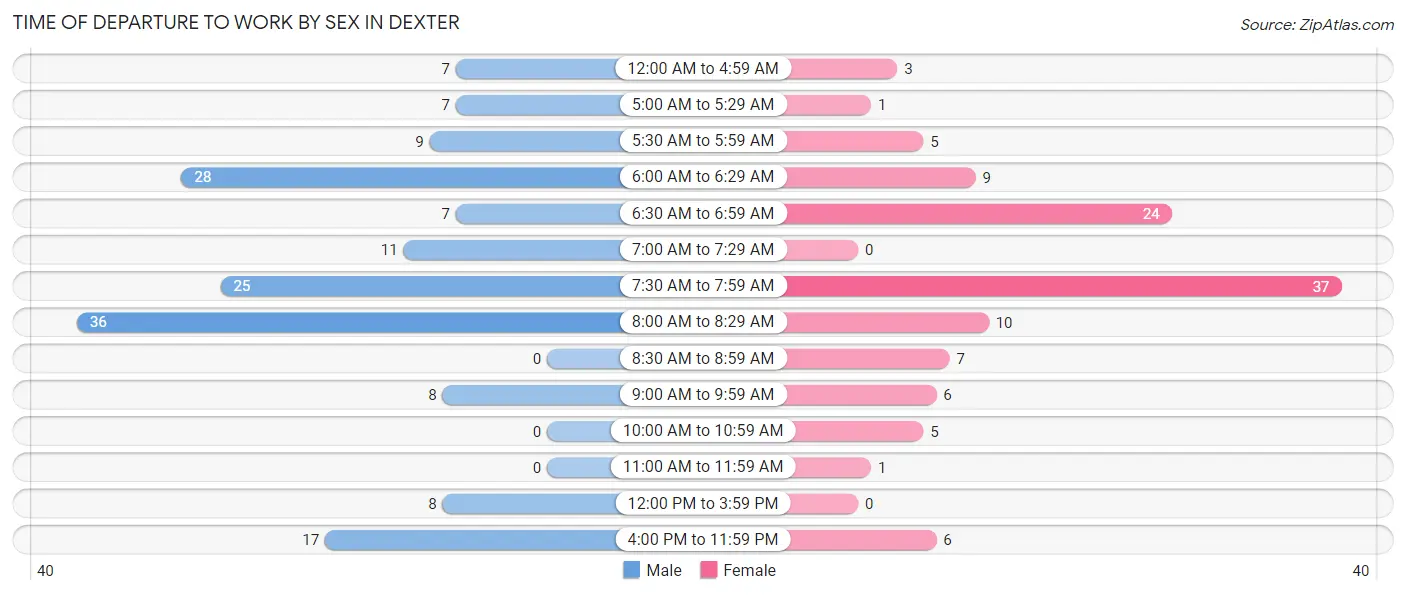
| Time of Departure | Male | Female |
| 12:00 AM to 4:59 AM | 7 (4.3%) | 3 (2.6%) |
| 5:00 AM to 5:29 AM | 7 (4.3%) | 1 (0.9%) |
| 5:30 AM to 5:59 AM | 9 (5.5%) | 5 (4.4%) |
| 6:00 AM to 6:29 AM | 28 (17.2%) | 9 (7.9%) |
| 6:30 AM to 6:59 AM | 7 (4.3%) | 24 (21.0%) |
| 7:00 AM to 7:29 AM | 11 (6.8%) | 0 (0.0%) |
| 7:30 AM to 7:59 AM | 25 (15.3%) | 37 (32.5%) |
| 8:00 AM to 8:29 AM | 36 (22.1%) | 10 (8.8%) |
| 8:30 AM to 8:59 AM | 0 (0.0%) | 7 (6.1%) |
| 9:00 AM to 9:59 AM | 8 (4.9%) | 6 (5.3%) |
| 10:00 AM to 10:59 AM | 0 (0.0%) | 5 (4.4%) |
| 11:00 AM to 11:59 AM | 0 (0.0%) | 1 (0.9%) |
| 12:00 PM to 3:59 PM | 8 (4.9%) | 0 (0.0%) |
| 4:00 PM to 11:59 PM | 17 (10.4%) | 6 (5.3%) |
| Total | 163 (100.0%) | 114 (100.0%) |
Housing Occupancy in Dexter
Occupancy by Ownership in Dexter
Of the total 296 dwellings in Dexter, owner-occupied units account for 189 (63.8%), while renter-occupied units make up 107 (36.1%).
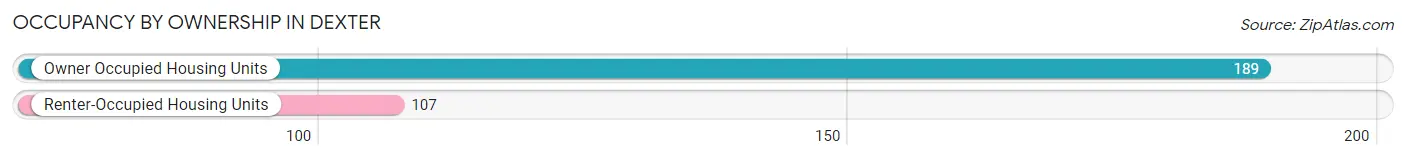
| Occupancy | # Housing Units | % Housing Units |
| Owner Occupied Housing Units | 189 | 63.8% |
| Renter-Occupied Housing Units | 107 | 36.1% |
| Total Occupied Housing Units | 296 | 100.0% |
Occupancy by Household Size in Dexter
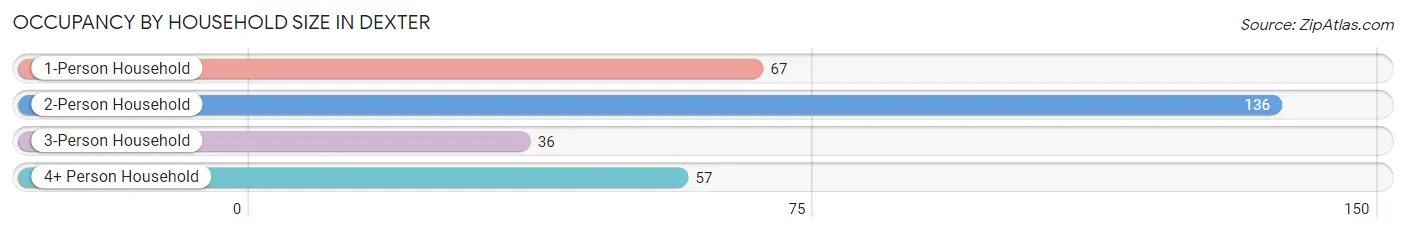
| Household Size | # Housing Units | % Housing Units |
| 1-Person Household | 67 | 22.6% |
| 2-Person Household | 136 | 46.0% |
| 3-Person Household | 36 | 12.2% |
| 4+ Person Household | 57 | 19.3% |
| Total Housing Units | 296 | 100.0% |
Occupancy by Ownership by Household Size in Dexter
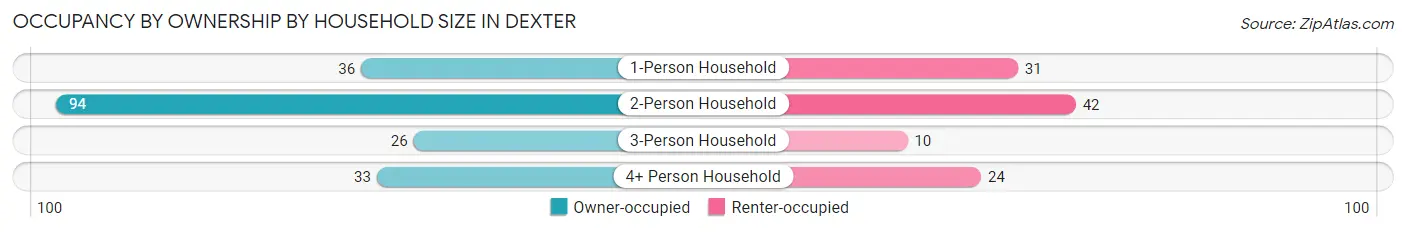
| Household Size | Owner-occupied | Renter-occupied |
| 1-Person Household | 36 (53.7%) | 31 (46.3%) |
| 2-Person Household | 94 (69.1%) | 42 (30.9%) |
| 3-Person Household | 26 (72.2%) | 10 (27.8%) |
| 4+ Person Household | 33 (57.9%) | 24 (42.1%) |
| Total Housing Units | 189 (63.8%) | 107 (36.1%) |
Occupancy by Educational Attainment in Dexter
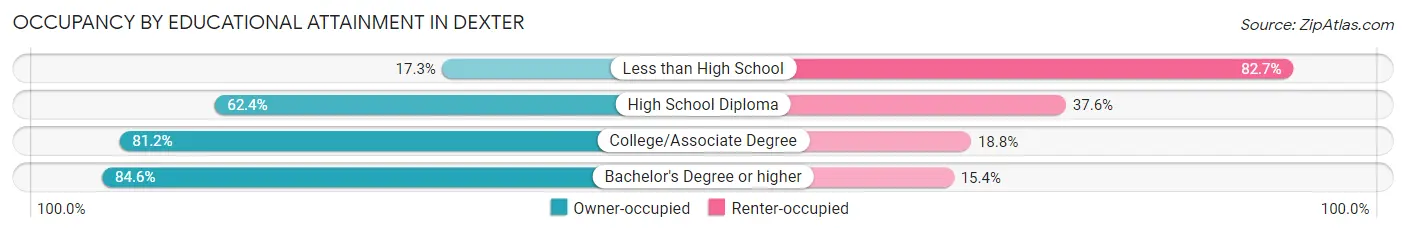
| Household Size | Owner-occupied | Renter-occupied |
| Less than High School | 9 (17.3%) | 43 (82.7%) |
| High School Diploma | 63 (62.4%) | 38 (37.6%) |
| College/Associate Degree | 95 (81.2%) | 22 (18.8%) |
| Bachelor's Degree or higher | 22 (84.6%) | 4 (15.4%) |
Occupancy by Age of Householder in Dexter
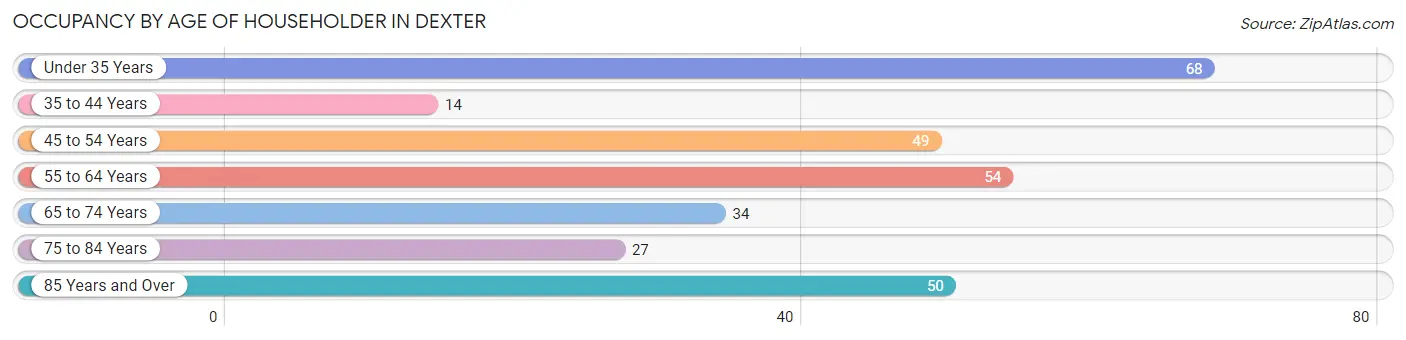
| Age Bracket | # Households | % Households |
| Under 35 Years | 68 | 23.0% |
| 35 to 44 Years | 14 | 4.7% |
| 45 to 54 Years | 49 | 16.6% |
| 55 to 64 Years | 54 | 18.2% |
| 65 to 74 Years | 34 | 11.5% |
| 75 to 84 Years | 27 | 9.1% |
| 85 Years and Over | 50 | 16.9% |
| Total | 296 | 100.0% |
Housing Finances in Dexter
Median Income by Occupancy in Dexter
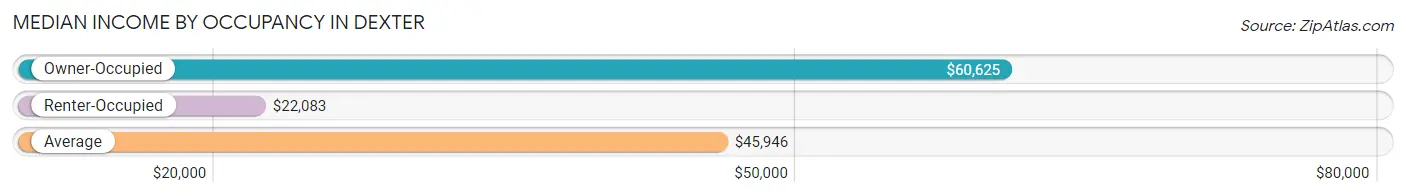
| Occupancy Type | # Households | Median Income |
| Owner-Occupied | 189 (63.8%) | $60,625 |
| Renter-Occupied | 107 (36.1%) | $22,083 |
| Average | 296 (100.0%) | $45,946 |
Occupancy by Householder Income Bracket in Dexter
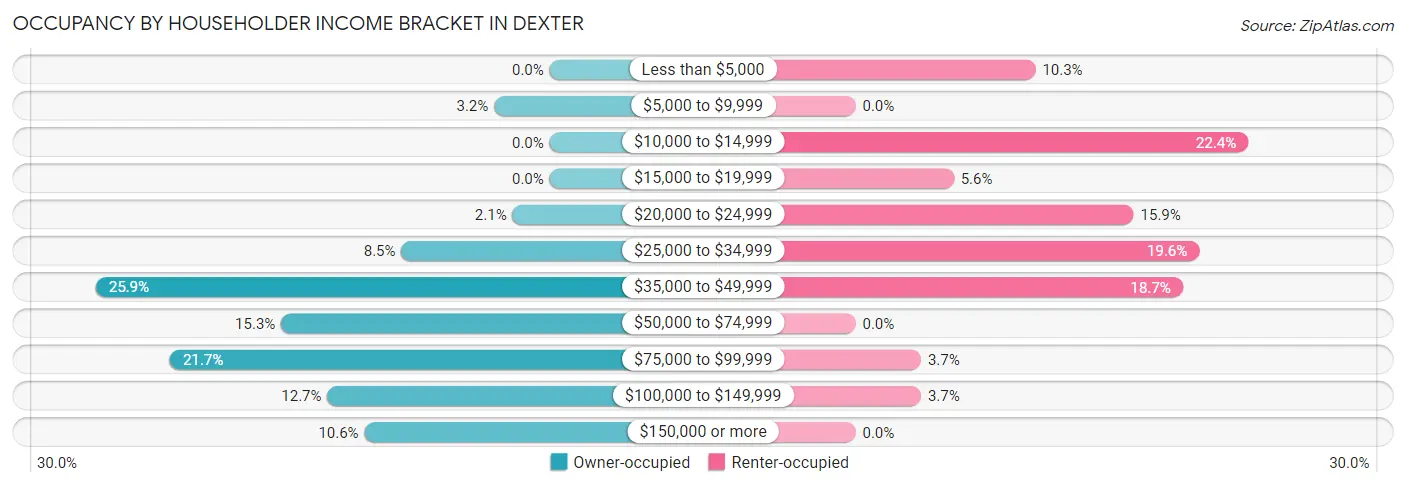
| Income Bracket | Owner-occupied | Renter-occupied |
| Less than $5,000 | 0 (0.0%) | 11 (10.3%) |
| $5,000 to $9,999 | 6 (3.2%) | 0 (0.0%) |
| $10,000 to $14,999 | 0 (0.0%) | 24 (22.4%) |
| $15,000 to $19,999 | 0 (0.0%) | 6 (5.6%) |
| $20,000 to $24,999 | 4 (2.1%) | 17 (15.9%) |
| $25,000 to $34,999 | 16 (8.5%) | 21 (19.6%) |
| $35,000 to $49,999 | 49 (25.9%) | 20 (18.7%) |
| $50,000 to $74,999 | 29 (15.3%) | 0 (0.0%) |
| $75,000 to $99,999 | 41 (21.7%) | 4 (3.7%) |
| $100,000 to $149,999 | 24 (12.7%) | 4 (3.7%) |
| $150,000 or more | 20 (10.6%) | 0 (0.0%) |
| Total | 189 (100.0%) | 107 (100.0%) |
Monthly Housing Cost Tiers in Dexter
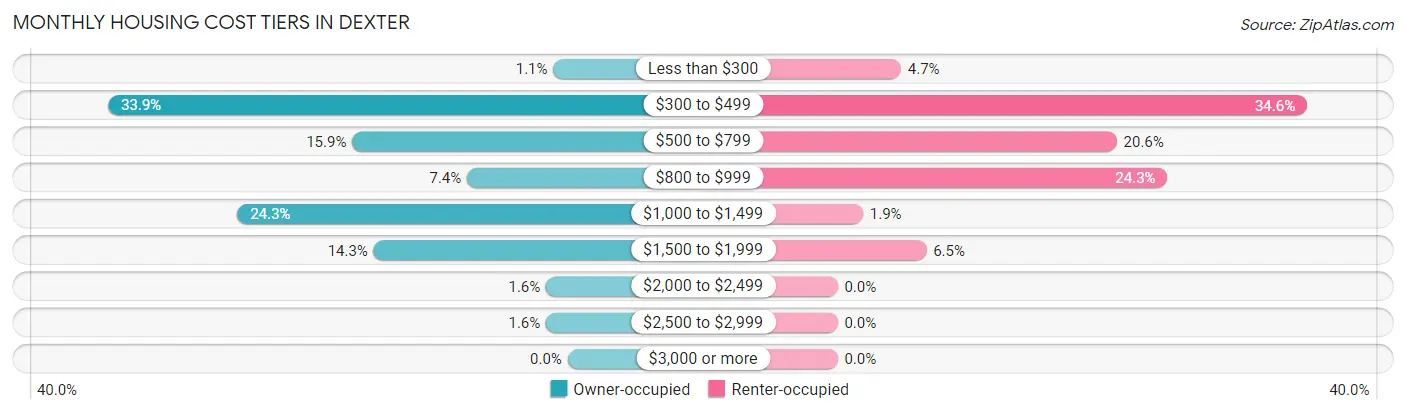
| Monthly Cost | Owner-occupied | Renter-occupied |
| Less than $300 | 2 (1.1%) | 5 (4.7%) |
| $300 to $499 | 64 (33.9%) | 37 (34.6%) |
| $500 to $799 | 30 (15.9%) | 22 (20.6%) |
| $800 to $999 | 14 (7.4%) | 26 (24.3%) |
| $1,000 to $1,499 | 46 (24.3%) | 2 (1.9%) |
| $1,500 to $1,999 | 27 (14.3%) | 7 (6.5%) |
| $2,000 to $2,499 | 3 (1.6%) | 0 (0.0%) |
| $2,500 to $2,999 | 3 (1.6%) | 0 (0.0%) |
| $3,000 or more | 0 (0.0%) | 0 (0.0%) |
| Total | 189 (100.0%) | 107 (100.0%) |
Physical Housing Characteristics in Dexter
Housing Structures in Dexter
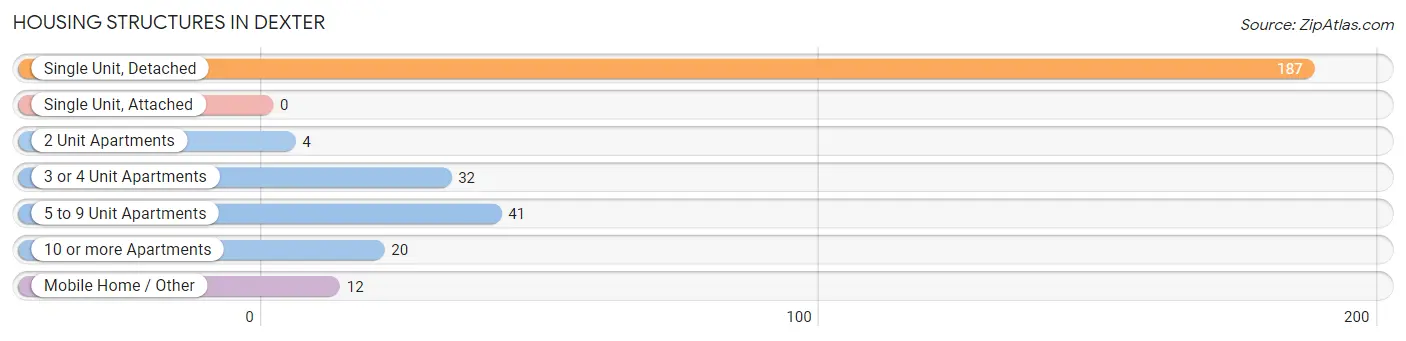
| Structure Type | # Housing Units | % Housing Units |
| Single Unit, Detached | 187 | 63.2% |
| Single Unit, Attached | 0 | 0.0% |
| 2 Unit Apartments | 4 | 1.3% |
| 3 or 4 Unit Apartments | 32 | 10.8% |
| 5 to 9 Unit Apartments | 41 | 13.9% |
| 10 or more Apartments | 20 | 6.8% |
| Mobile Home / Other | 12 | 4.1% |
| Total | 296 | 100.0% |
Housing Structures by Occupancy in Dexter
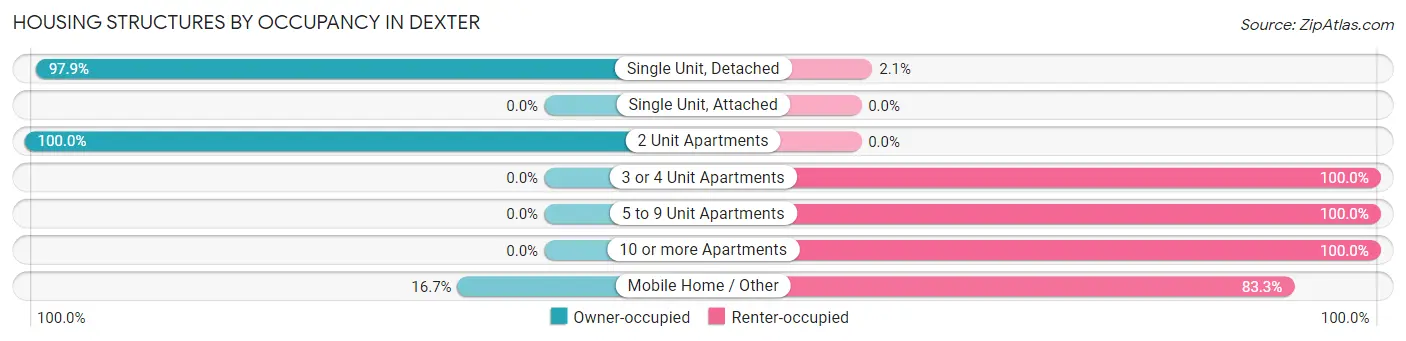
| Structure Type | Owner-occupied | Renter-occupied |
| Single Unit, Detached | 183 (97.9%) | 4 (2.1%) |
| Single Unit, Attached | 0 (0.0%) | 0 (0.0%) |
| 2 Unit Apartments | 4 (100.0%) | 0 (0.0%) |
| 3 or 4 Unit Apartments | 0 (0.0%) | 32 (100.0%) |
| 5 to 9 Unit Apartments | 0 (0.0%) | 41 (100.0%) |
| 10 or more Apartments | 0 (0.0%) | 20 (100.0%) |
| Mobile Home / Other | 2 (16.7%) | 10 (83.3%) |
| Total | 189 (63.8%) | 107 (36.1%) |
Housing Structures by Number of Rooms in Dexter
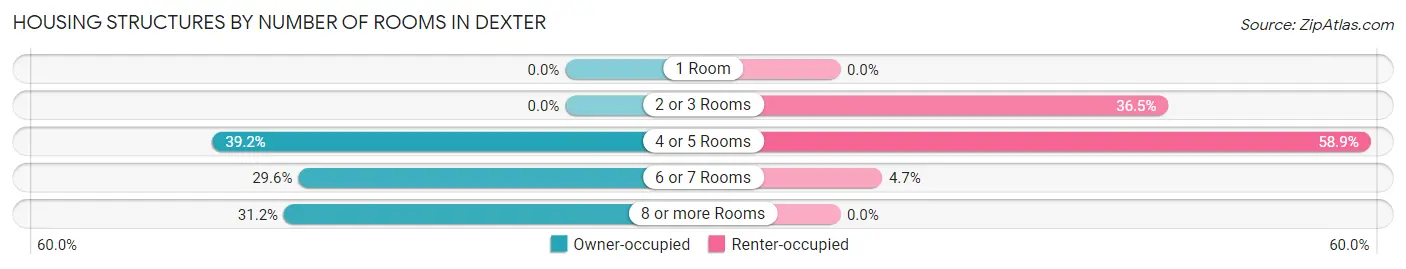
| Number of Rooms | Owner-occupied | Renter-occupied |
| 1 Room | 0 (0.0%) | 0 (0.0%) |
| 2 or 3 Rooms | 0 (0.0%) | 39 (36.4%) |
| 4 or 5 Rooms | 74 (39.2%) | 63 (58.9%) |
| 6 or 7 Rooms | 56 (29.6%) | 5 (4.7%) |
| 8 or more Rooms | 59 (31.2%) | 0 (0.0%) |
| Total | 189 (100.0%) | 107 (100.0%) |
Housing Structure by Heating Type in Dexter
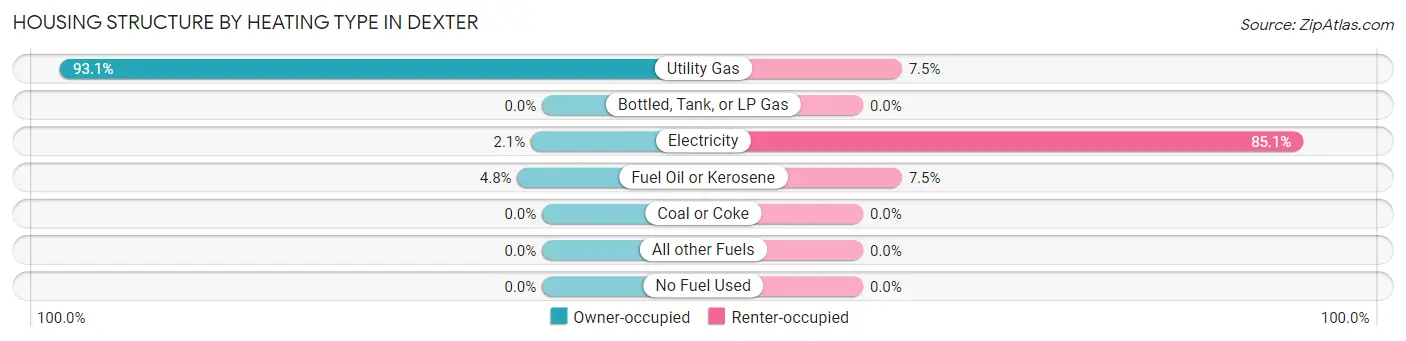
| Heating Type | Owner-occupied | Renter-occupied |
| Utility Gas | 176 (93.1%) | 8 (7.5%) |
| Bottled, Tank, or LP Gas | 0 (0.0%) | 0 (0.0%) |
| Electricity | 4 (2.1%) | 91 (85.1%) |
| Fuel Oil or Kerosene | 9 (4.8%) | 8 (7.5%) |
| Coal or Coke | 0 (0.0%) | 0 (0.0%) |
| All other Fuels | 0 (0.0%) | 0 (0.0%) |
| No Fuel Used | 0 (0.0%) | 0 (0.0%) |
| Total | 189 (100.0%) | 107 (100.0%) |
Household Vehicle Usage in Dexter
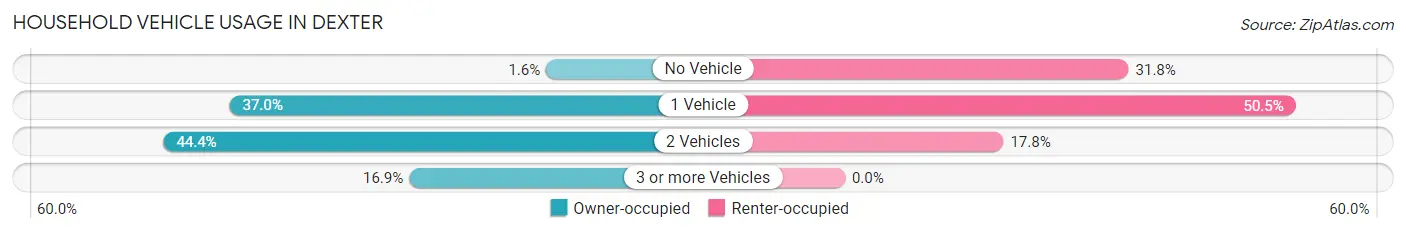
| Vehicles per Household | Owner-occupied | Renter-occupied |
| No Vehicle | 3 (1.6%) | 34 (31.8%) |
| 1 Vehicle | 70 (37.0%) | 54 (50.5%) |
| 2 Vehicles | 84 (44.4%) | 19 (17.8%) |
| 3 or more Vehicles | 32 (16.9%) | 0 (0.0%) |
| Total | 189 (100.0%) | 107 (100.0%) |
Real Estate & Mortgages in Dexter
Real Estate and Mortgage Overview in Dexter
| Characteristic | Without Mortgage | With Mortgage |
| Housing Units | 102 | 87 |
| Median Property Value | $117,600 | $154,200 |
| Median Household Income | $46,622 | $13 |
| Monthly Housing Costs | $470 | $0 |
| Real Estate Taxes | $1,943 | $0 |
Property Value by Mortgage Status in Dexter
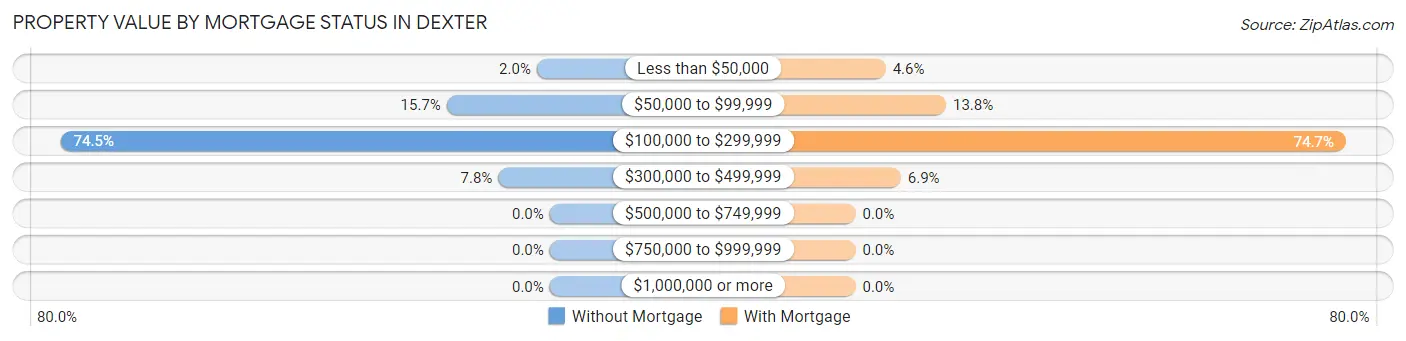
| Property Value | Without Mortgage | With Mortgage |
| Less than $50,000 | 2 (2.0%) | 4 (4.6%) |
| $50,000 to $99,999 | 16 (15.7%) | 12 (13.8%) |
| $100,000 to $299,999 | 76 (74.5%) | 65 (74.7%) |
| $300,000 to $499,999 | 8 (7.8%) | 6 (6.9%) |
| $500,000 to $749,999 | 0 (0.0%) | 0 (0.0%) |
| $750,000 to $999,999 | 0 (0.0%) | 0 (0.0%) |
| $1,000,000 or more | 0 (0.0%) | 0 (0.0%) |
| Total | 102 (100.0%) | 87 (100.0%) |
Household Income by Mortgage Status in Dexter
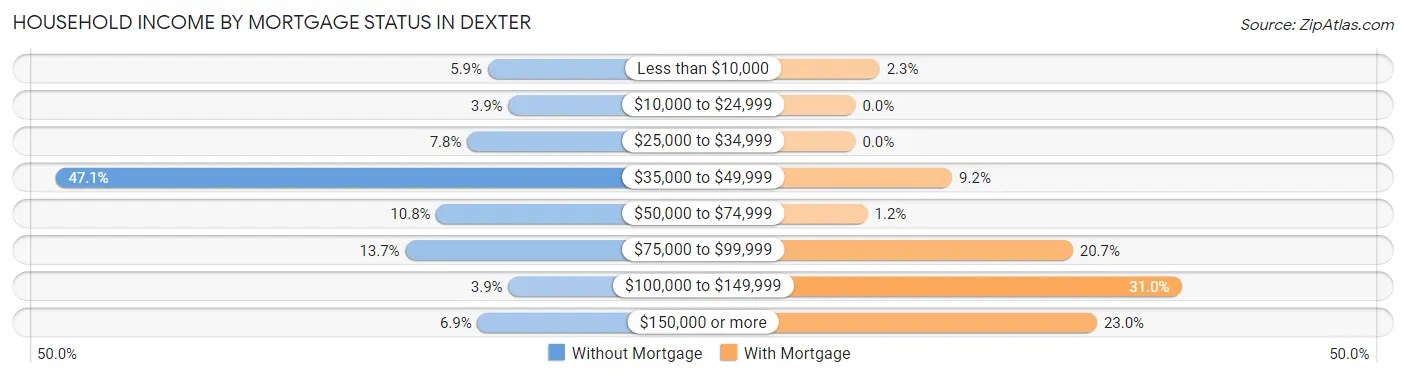
| Household Income | Without Mortgage | With Mortgage |
| Less than $10,000 | 6 (5.9%) | 2 (2.3%) |
| $10,000 to $24,999 | 4 (3.9%) | 0 (0.0%) |
| $25,000 to $34,999 | 8 (7.8%) | 0 (0.0%) |
| $35,000 to $49,999 | 48 (47.1%) | 8 (9.2%) |
| $50,000 to $74,999 | 11 (10.8%) | 1 (1.1%) |
| $75,000 to $99,999 | 14 (13.7%) | 18 (20.7%) |
| $100,000 to $149,999 | 4 (3.9%) | 27 (31.0%) |
| $150,000 or more | 7 (6.9%) | 20 (23.0%) |
| Total | 102 (100.0%) | 87 (100.0%) |
Property Value to Household Income Ratio in Dexter
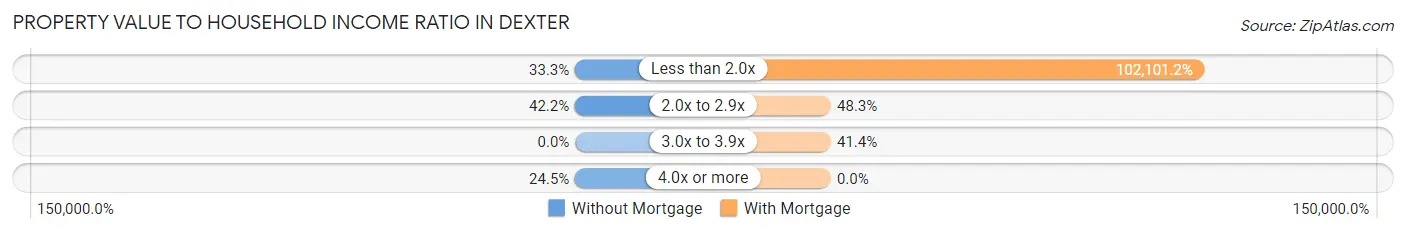
| Value-to-Income Ratio | Without Mortgage | With Mortgage |
| Less than 2.0x | 34 (33.3%) | 88,828 (102,101.1%) |
| 2.0x to 2.9x | 43 (42.2%) | 42 (48.3%) |
| 3.0x to 3.9x | 0 (0.0%) | 36 (41.4%) |
| 4.0x or more | 25 (24.5%) | 0 (0.0%) |
| Total | 102 (100.0%) | 87 (100.0%) |
Real Estate Taxes by Mortgage Status in Dexter
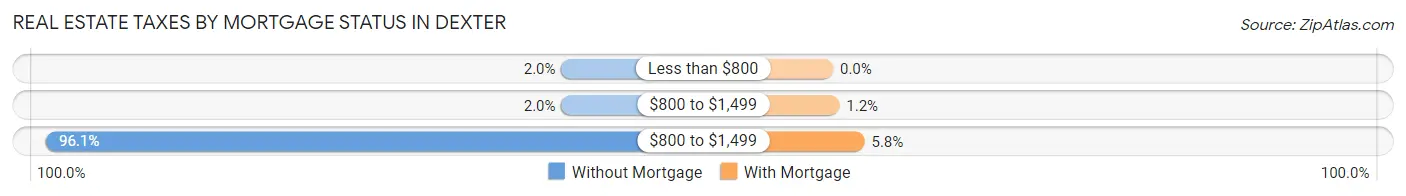
| Property Taxes | Without Mortgage | With Mortgage |
| Less than $800 | 2 (2.0%) | 0 (0.0%) |
| $800 to $1,499 | 2 (2.0%) | 1 (1.1%) |
| $800 to $1,499 | 98 (96.1%) | 5 (5.8%) |
| Total | 102 (100.0%) | 87 (100.0%) |
Health & Disability in Dexter
Health Insurance Coverage by Age in Dexter
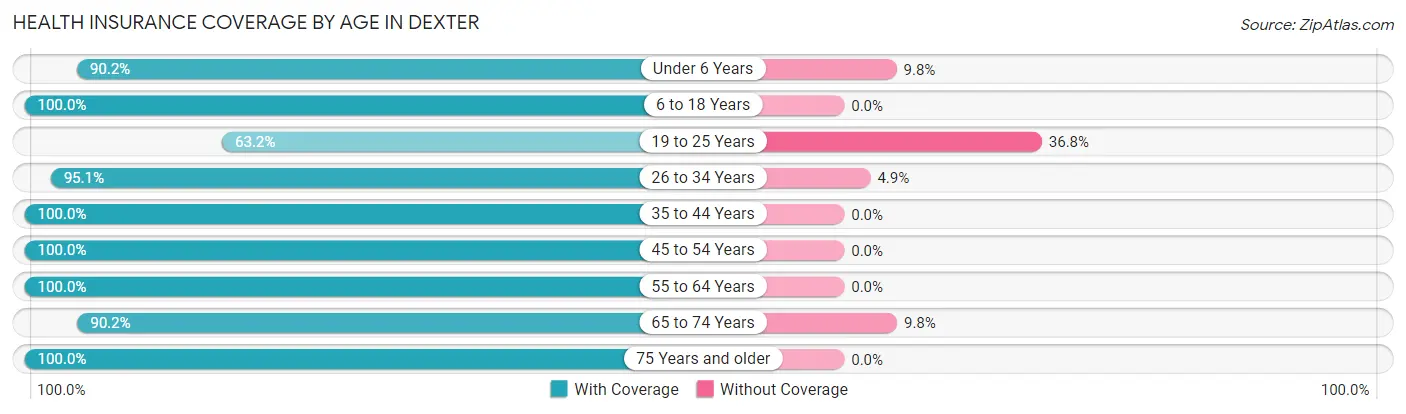
| Age Bracket | With Coverage | Without Coverage |
| Under 6 Years | 37 (90.2%) | 4 (9.8%) |
| 6 to 18 Years | 190 (100.0%) | 0 (0.0%) |
| 19 to 25 Years | 24 (63.2%) | 14 (36.8%) |
| 26 to 34 Years | 78 (95.1%) | 4 (4.9%) |
| 35 to 44 Years | 52 (100.0%) | 0 (0.0%) |
| 45 to 54 Years | 110 (100.0%) | 0 (0.0%) |
| 55 to 64 Years | 87 (100.0%) | 0 (0.0%) |
| 65 to 74 Years | 55 (90.2%) | 6 (9.8%) |
| 75 Years and older | 95 (100.0%) | 0 (0.0%) |
| Total | 728 (96.3%) | 28 (3.7%) |
Health Insurance Coverage by Citizenship Status in Dexter
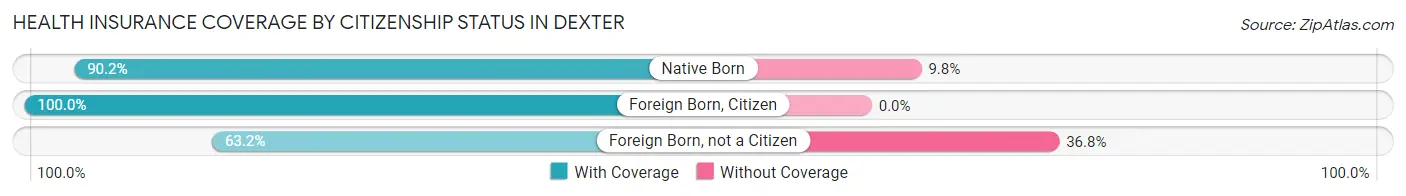
| Citizenship Status | With Coverage | Without Coverage |
| Native Born | 37 (90.2%) | 4 (9.8%) |
| Foreign Born, Citizen | 190 (100.0%) | 0 (0.0%) |
| Foreign Born, not a Citizen | 24 (63.2%) | 14 (36.8%) |
Health Insurance Coverage by Household Income in Dexter
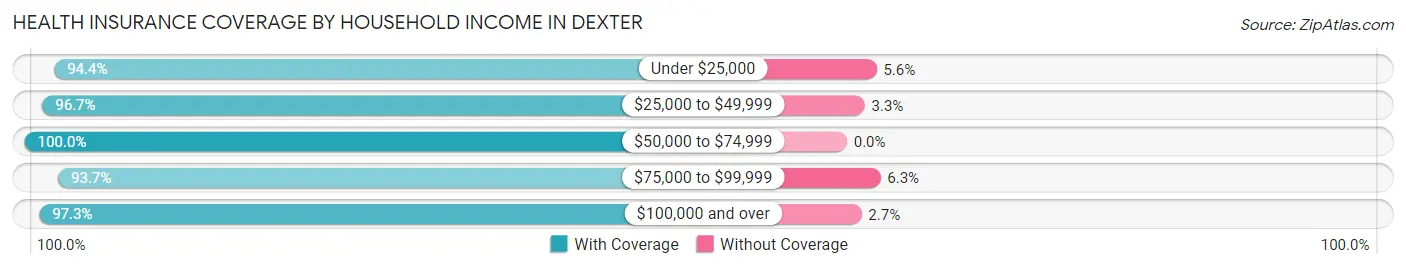
| Household Income | With Coverage | Without Coverage |
| Under $25,000 | 102 (94.4%) | 6 (5.6%) |
| $25,000 to $49,999 | 261 (96.7%) | 9 (3.3%) |
| $50,000 to $74,999 | 66 (100.0%) | 0 (0.0%) |
| $75,000 to $99,999 | 134 (93.7%) | 9 (6.3%) |
| $100,000 and over | 142 (97.3%) | 4 (2.7%) |
Public vs Private Health Insurance Coverage by Age in Dexter
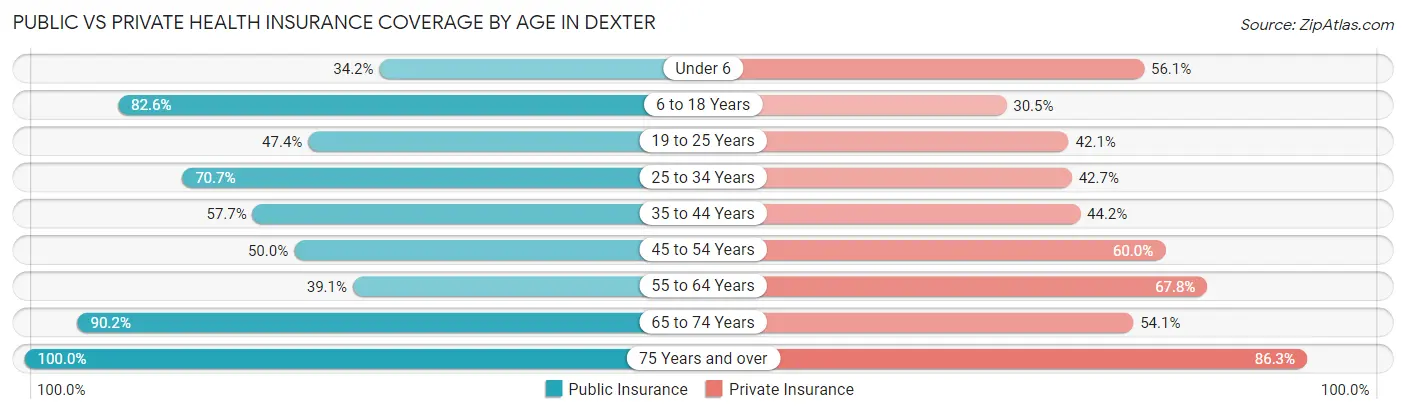
| Age Bracket | Public Insurance | Private Insurance |
| Under 6 | 14 (34.2%) | 23 (56.1%) |
| 6 to 18 Years | 157 (82.6%) | 58 (30.5%) |
| 19 to 25 Years | 18 (47.4%) | 16 (42.1%) |
| 25 to 34 Years | 58 (70.7%) | 35 (42.7%) |
| 35 to 44 Years | 30 (57.7%) | 23 (44.2%) |
| 45 to 54 Years | 55 (50.0%) | 66 (60.0%) |
| 55 to 64 Years | 34 (39.1%) | 59 (67.8%) |
| 65 to 74 Years | 55 (90.2%) | 33 (54.1%) |
| 75 Years and over | 95 (100.0%) | 82 (86.3%) |
| Total | 516 (68.2%) | 395 (52.2%) |
Disability Status by Sex by Age in Dexter
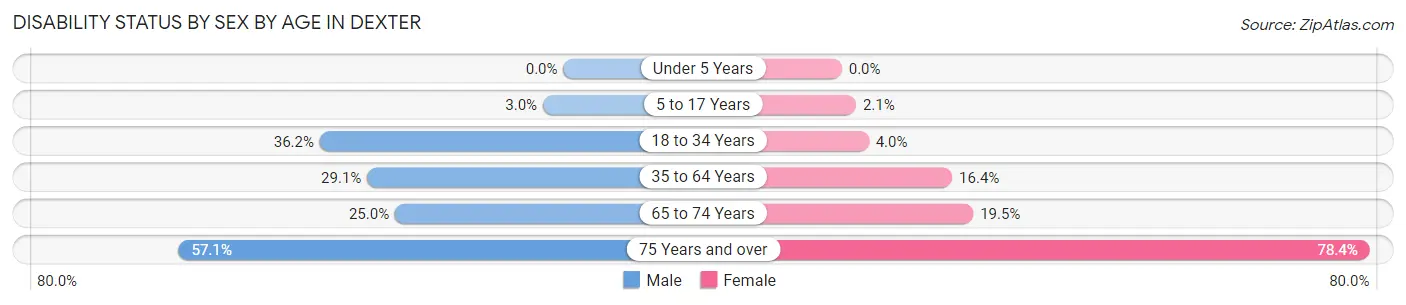
| Age Bracket | Male | Female |
| Under 5 Years | 0 (0.0%) | 0 (0.0%) |
| 5 to 17 Years | 3 (3.0%) | 2 (2.1%) |
| 18 to 34 Years | 17 (36.2%) | 3 (4.0%) |
| 35 to 64 Years | 37 (29.1%) | 20 (16.4%) |
| 65 to 74 Years | 5 (25.0%) | 8 (19.5%) |
| 75 Years and over | 12 (57.1%) | 58 (78.4%) |
Disability Class by Sex by Age in Dexter
Disability Class: Hearing Difficulty
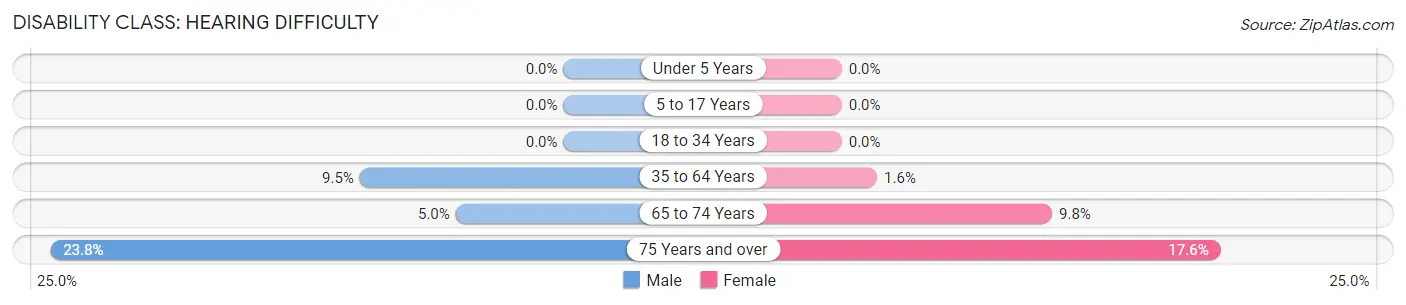
| Age Bracket | Male | Female |
| Under 5 Years | 0 (0.0%) | 0 (0.0%) |
| 5 to 17 Years | 0 (0.0%) | 0 (0.0%) |
| 18 to 34 Years | 0 (0.0%) | 0 (0.0%) |
| 35 to 64 Years | 12 (9.5%) | 2 (1.6%) |
| 65 to 74 Years | 1 (5.0%) | 4 (9.8%) |
| 75 Years and over | 5 (23.8%) | 13 (17.6%) |
Disability Class: Vision Difficulty
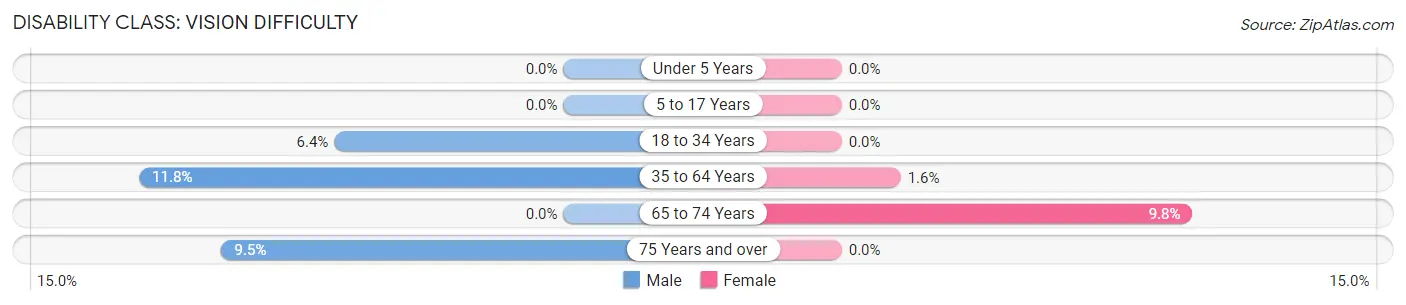
| Age Bracket | Male | Female |
| Under 5 Years | 0 (0.0%) | 0 (0.0%) |
| 5 to 17 Years | 0 (0.0%) | 0 (0.0%) |
| 18 to 34 Years | 3 (6.4%) | 0 (0.0%) |
| 35 to 64 Years | 15 (11.8%) | 2 (1.6%) |
| 65 to 74 Years | 0 (0.0%) | 4 (9.8%) |
| 75 Years and over | 2 (9.5%) | 0 (0.0%) |
Disability Class: Cognitive Difficulty
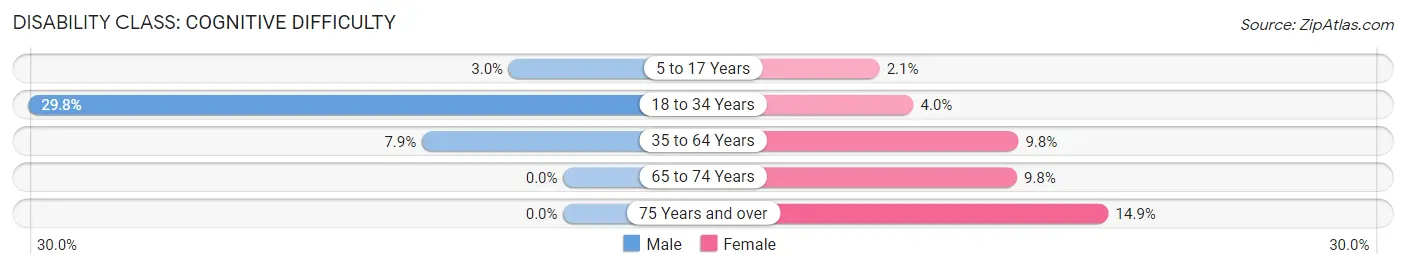
| Age Bracket | Male | Female |
| 5 to 17 Years | 3 (3.0%) | 2 (2.1%) |
| 18 to 34 Years | 14 (29.8%) | 3 (4.0%) |
| 35 to 64 Years | 10 (7.9%) | 12 (9.8%) |
| 65 to 74 Years | 0 (0.0%) | 4 (9.8%) |
| 75 Years and over | 0 (0.0%) | 11 (14.9%) |
Disability Class: Ambulatory Difficulty
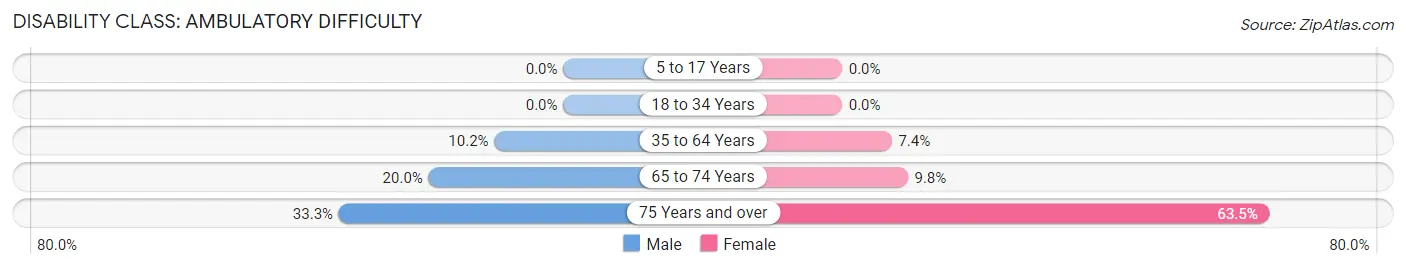
| Age Bracket | Male | Female |
| 5 to 17 Years | 0 (0.0%) | 0 (0.0%) |
| 18 to 34 Years | 0 (0.0%) | 0 (0.0%) |
| 35 to 64 Years | 13 (10.2%) | 9 (7.4%) |
| 65 to 74 Years | 4 (20.0%) | 4 (9.8%) |
| 75 Years and over | 7 (33.3%) | 47 (63.5%) |
Disability Class: Self-Care Difficulty
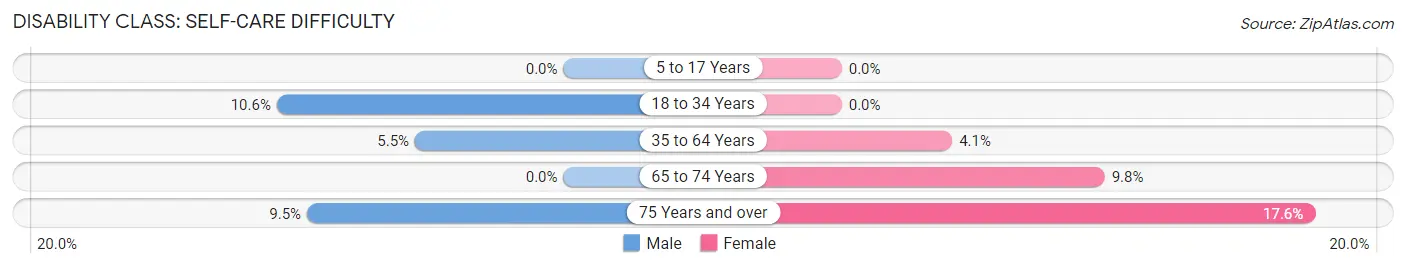
| Age Bracket | Male | Female |
| 5 to 17 Years | 0 (0.0%) | 0 (0.0%) |
| 18 to 34 Years | 5 (10.6%) | 0 (0.0%) |
| 35 to 64 Years | 7 (5.5%) | 5 (4.1%) |
| 65 to 74 Years | 0 (0.0%) | 4 (9.8%) |
| 75 Years and over | 2 (9.5%) | 13 (17.6%) |
Technology Access in Dexter
Computing Device Access in Dexter
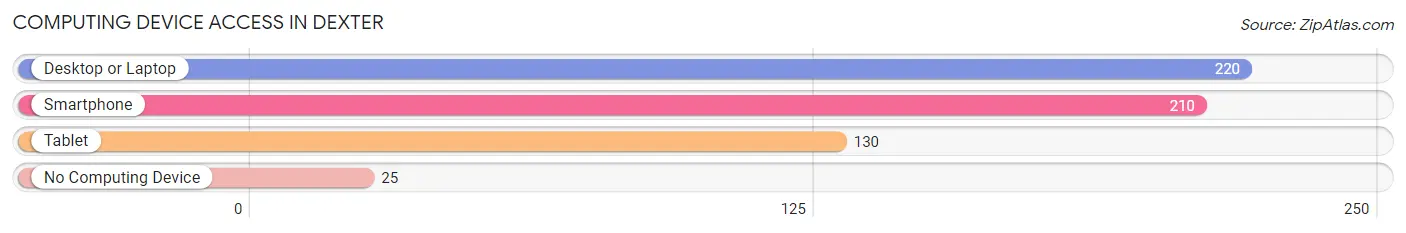
| Device Type | # Households | % Households |
| Desktop or Laptop | 220 | 74.3% |
| Smartphone | 210 | 71.0% |
| Tablet | 130 | 43.9% |
| No Computing Device | 25 | 8.5% |
| Total | 296 | 100.0% |
Internet Access in Dexter
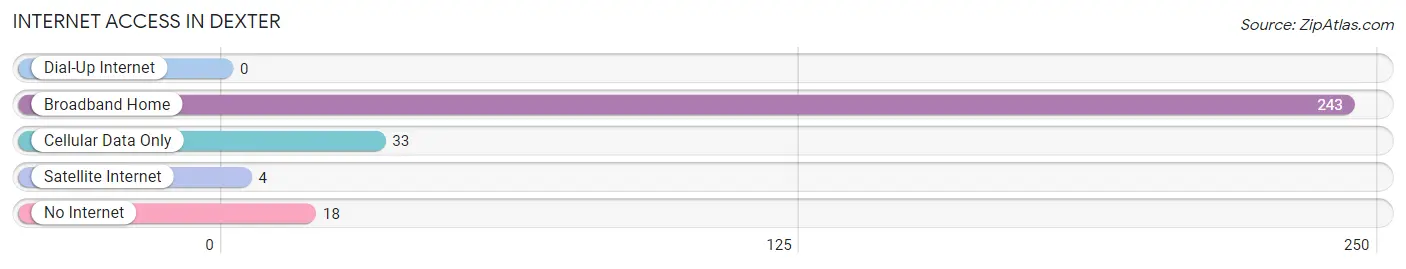
| Internet Type | # Households | % Households |
| Dial-Up Internet | 0 | 0.0% |
| Broadband Home | 243 | 82.1% |
| Cellular Data Only | 33 | 11.2% |
| Satellite Internet | 4 | 1.3% |
| No Internet | 18 | 6.1% |
| Total | 296 | 100.0% |
Dexter Summary
Dexter, New York is a small town located in Jefferson County, in the northern part of the state. It is situated on the eastern shore of Lake Ontario, and is part of the Thousand Islands region. The town has a population of just over 1,000 people, and is known for its rural charm and natural beauty.
History
The area that is now Dexter was first settled in the early 1800s by a group of settlers from Massachusetts. The town was originally known as “The Town of Dexter”, and was named after the first settler, Dexter Smith. The town was officially incorporated in 1819, and was one of the first towns in Jefferson County.
In the early 1900s, the town was a popular tourist destination, and many people came to the area to enjoy the natural beauty of the Thousand Islands region. The town was also home to a number of small businesses, including a sawmill, a grist mill, and a general store.
Geography
Dexter is located in the northern part of Jefferson County, on the eastern shore of Lake Ontario. The town is situated in the Thousand Islands region, and is surrounded by a number of small lakes and rivers. The town is also home to a number of parks and nature preserves, including the Dexter Nature Preserve and the Dexter State Forest.
The town has a total area of 8.2 square miles, and is located at an elevation of 545 feet above sea level. The town is located approximately 30 miles north of Watertown, and is about an hour and a half drive from Syracuse.
Economy
The economy of Dexter is largely based on tourism and agriculture. The town is home to a number of small businesses, including restaurants, shops, and lodging. The town is also home to a number of farms, which produce a variety of crops, including corn, soybeans, and hay.
The town is also home to a number of recreational activities, including fishing, boating, and camping. The town is also home to a number of festivals and events, including the annual Dexter Days Festival, which is held every summer.
Demographics
As of the 2010 census, the population of Dexter was 1,072. The town has a population density of 130 people per square mile. The median age of the population is 44.7 years, and the median household income is $45,000.
The town is predominantly white, with 95.3% of the population identifying as white. The town also has a small Hispanic population, with 2.3% of the population identifying as Hispanic or Latino. The town also has a small African American population, with 0.7% of the population identifying as African American.
Conclusion
Dexter, New York is a small town located in Jefferson County, in the northern part of the state. It is situated on the eastern shore of Lake Ontario, and is part of the Thousand Islands region. The town has a population of just over 1,000 people, and is known for its rural charm and natural beauty. The economy of Dexter is largely based on tourism and agriculture, and the town is home to a number of small businesses, farms, and recreational activities. The town is predominantly white, with 95.3% of the population identifying as white. The town also has a small Hispanic population, with 2.3% of the population identifying as Hispanic or Latino. The town also has a small African American population, with 0.7% of the population identifying as African American.
Common Questions
What is Per Capita Income in Dexter?
Per Capita income in Dexter is $23,678.
What is the Median Family Income in Dexter?
Median Family Income in Dexter is $46,757.
What is the Median Household income in Dexter?
Median Household Income in Dexter is $45,946.
What is Income or Wage Gap in Dexter?
Income or Wage Gap in Dexter is 30.4%.
Women in Dexter earn 69.6 cents for every dollar earned by a man.
What is Inequality or Gini Index in Dexter?
Inequality or Gini Index in Dexter is 0.43.
What is the Total Population of Dexter?
Total Population of Dexter is 763.
What is the Total Male Population of Dexter?
Total Male Population of Dexter is 334.
What is the Total Female Population of Dexter?
Total Female Population of Dexter is 429.
What is the Ratio of Males per 100 Females in Dexter?
There are 77.86 Males per 100 Females in Dexter.
What is the Ratio of Females per 100 Males in Dexter?
There are 128.44 Females per 100 Males in Dexter.
What is the Median Population Age in Dexter?
Median Population Age in Dexter is 39.4 Years.
What is the Average Family Size in Dexter
Average Family Size in Dexter is 2.9 People.
What is the Average Household Size in Dexter
Average Household Size in Dexter is 2.5 People.
How Large is the Labor Force in Dexter?
There are 323 People in the Labor Forcein in Dexter.
What is the Percentage of People in the Labor Force in Dexter?
57.2% of People are in the Labor Force in Dexter.
What is the Unemployment Rate in Dexter?
Unemployment Rate in Dexter is 5.4%.