Altona, NY Map & Demographics
Altona Map
Altona Overview
$8,477
PER CAPITA INCOME
0.41
INEQUALITY / GINI INDEX
657
TOTAL POPULATION
570
MALE POPULATION
87
FEMALE POPULATION
655.17
MALES / 100 FEMALES
15.26
FEMALES / 100 MALES
35.5
MEDIAN AGE
3.0
AVG FAMILY SIZE
2.8
AVG HOUSEHOLD SIZE
173
LABOR FORCE [ PEOPLE ]
27.6%
PERCENT IN LABOR FORCE
15.6%
UNEMPLOYMENT RATE
Altona Zip Codes
Altona Area Codes
Income in Altona
Income Overview in Altona
| Characteristic | Number | Measure |
| Per Capita Income | 657 | $8,477 |
| Median Family Income | 91 | $0 |
| Mean Family Income | 91 | $42,935 |
| Median Household Income | 108 | $0 |
| Mean Household Income | 108 | $43,042 |
| Income Deficit | 91 | $0 |
| Wage / Income Gap (%) | 657 | 0.00% |
| Wage / Income Gap ($) | 657 | 100.00¢ per $1 |
| Gini / Inequality Index | 657 | 0.41 |
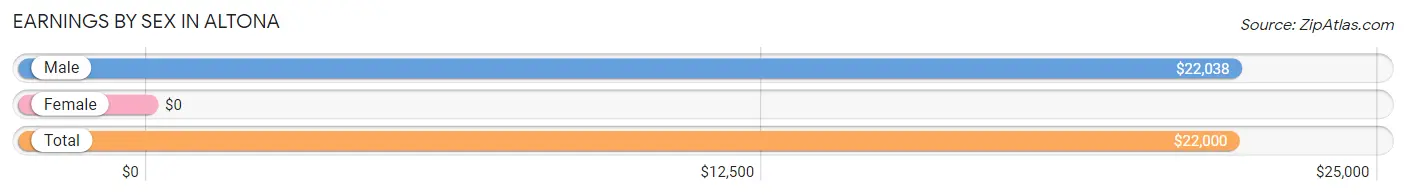
Earnings by Sex in Altona
| Sex | Number | Average Earnings |
| Male | 124 (77.5%) | $22,038 |
| Female | 36 (22.5%) | $0 |
| Total | 160 (100.0%) | $22,000 |
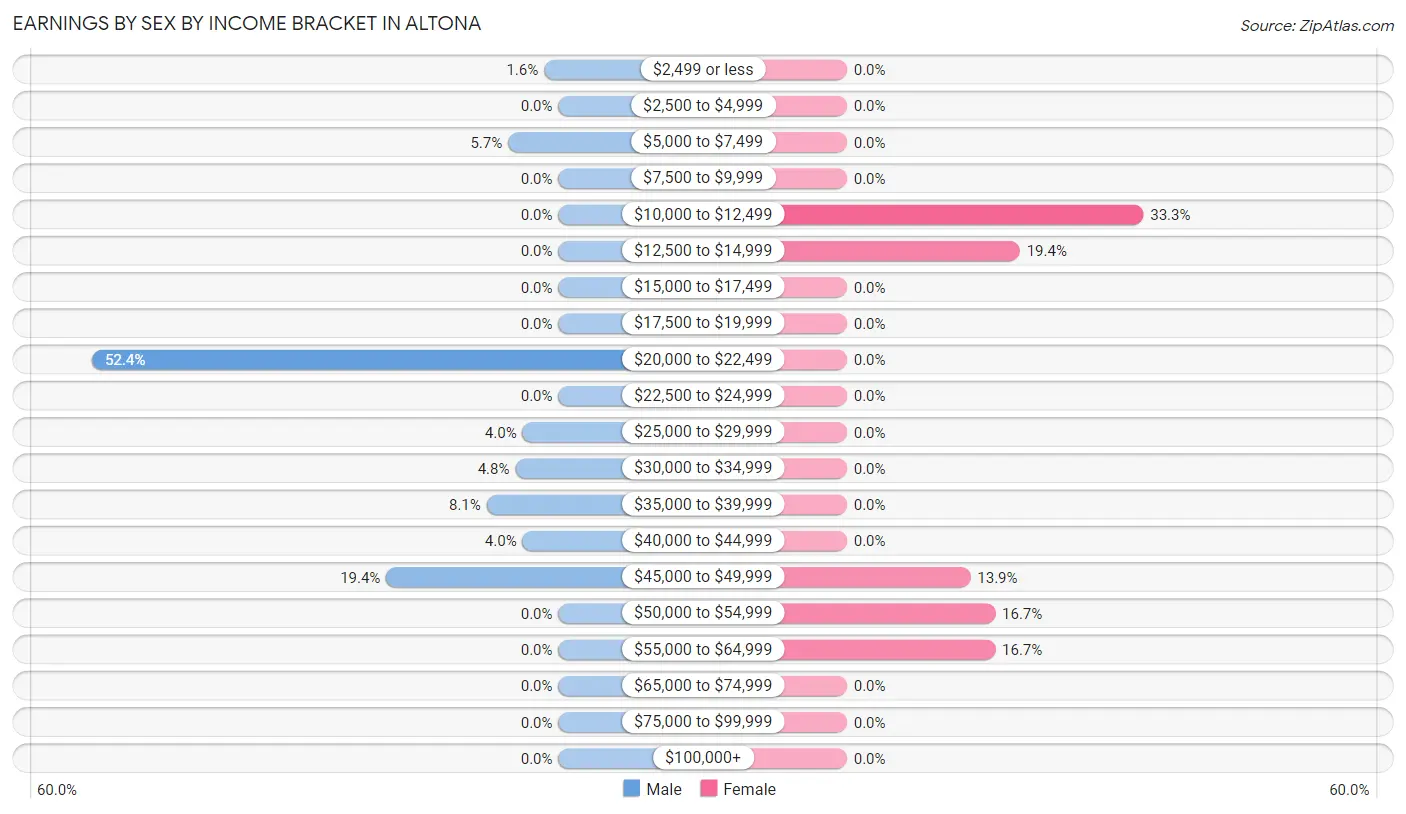
Earnings by Sex by Income Bracket in Altona
The most common earnings brackets in Altona are $20,000 to $22,499 for men (65 | 52.4%) and $10,000 to $12,499 for women (12 | 33.3%).
| Income | Male | Female |
| $2,499 or less | 2 (1.6%) | 0 (0.0%) |
| $2,500 to $4,999 | 0 (0.0%) | 0 (0.0%) |
| $5,000 to $7,499 | 7 (5.7%) | 0 (0.0%) |
| $7,500 to $9,999 | 0 (0.0%) | 0 (0.0%) |
| $10,000 to $12,499 | 0 (0.0%) | 12 (33.3%) |
| $12,500 to $14,999 | 0 (0.0%) | 7 (19.4%) |
| $15,000 to $17,499 | 0 (0.0%) | 0 (0.0%) |
| $17,500 to $19,999 | 0 (0.0%) | 0 (0.0%) |
| $20,000 to $22,499 | 65 (52.4%) | 0 (0.0%) |
| $22,500 to $24,999 | 0 (0.0%) | 0 (0.0%) |
| $25,000 to $29,999 | 5 (4.0%) | 0 (0.0%) |
| $30,000 to $34,999 | 6 (4.8%) | 0 (0.0%) |
| $35,000 to $39,999 | 10 (8.1%) | 0 (0.0%) |
| $40,000 to $44,999 | 5 (4.0%) | 0 (0.0%) |
| $45,000 to $49,999 | 24 (19.4%) | 5 (13.9%) |
| $50,000 to $54,999 | 0 (0.0%) | 6 (16.7%) |
| $55,000 to $64,999 | 0 (0.0%) | 6 (16.7%) |
| $65,000 to $74,999 | 0 (0.0%) | 0 (0.0%) |
| $75,000 to $99,999 | 0 (0.0%) | 0 (0.0%) |
| $100,000+ | 0 (0.0%) | 0 (0.0%) |
| Total | 124 (100.0%) | 36 (100.0%) |
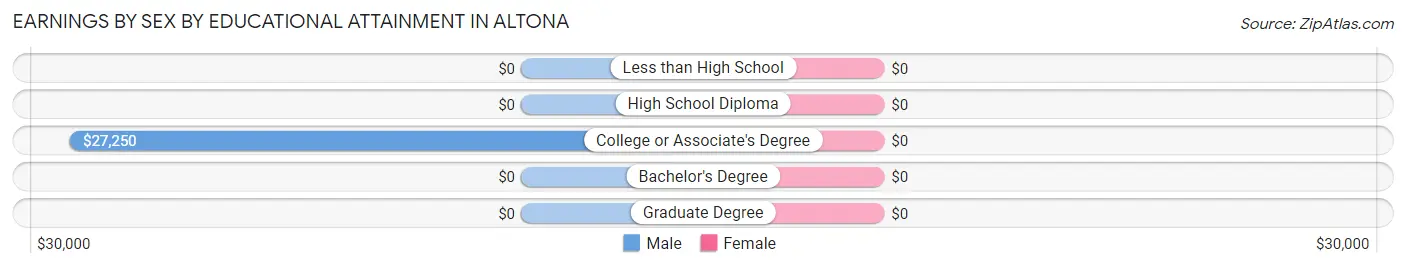
Earnings by Sex by Educational Attainment in Altona
| Educational Attainment | Male Income | Female Income |
| Less than High School | - | - |
| High School Diploma | - | - |
| College or Associate's Degree | $27,250 | $0 |
| Bachelor's Degree | - | - |
| Graduate Degree | - | - |
| Total | $38,958 | $0 |
Family Income in Altona
Family Income Brackets in Altona
According to the Altona family income data, there are 46 families falling into the $15,000 to $24,999 income range, which is the most common income bracket and makes up 50.5% of all families.
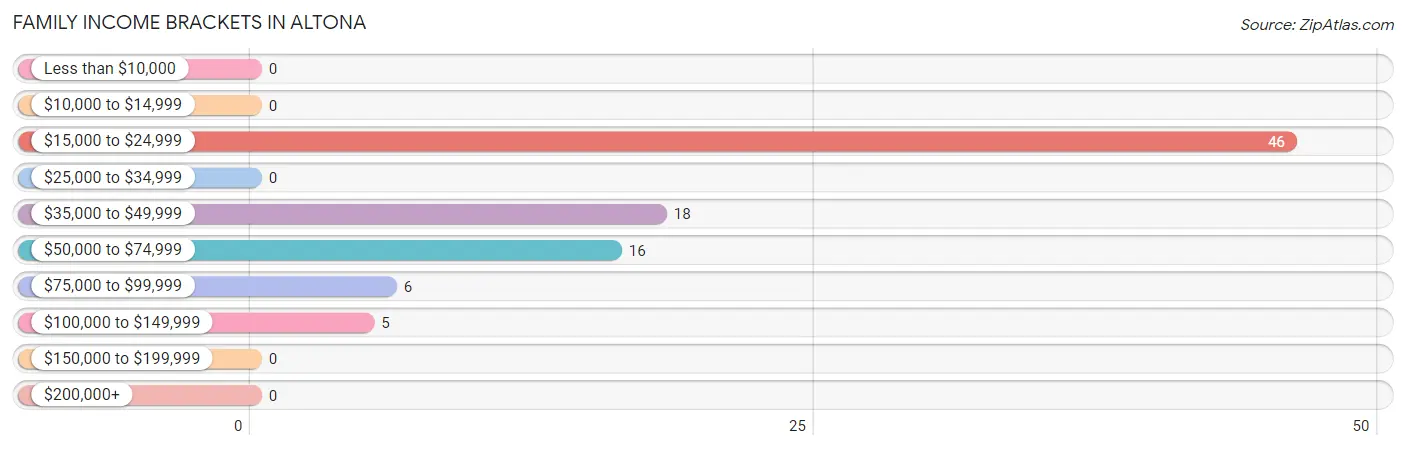
| Income Bracket | # Families | % Families |
| Less than $10,000 | 0 | 0.0% |
| $10,000 to $14,999 | 0 | 0.0% |
| $15,000 to $24,999 | 46 | 50.5% |
| $25,000 to $34,999 | 0 | 0.0% |
| $35,000 to $49,999 | 18 | 19.8% |
| $50,000 to $74,999 | 16 | 17.6% |
| $75,000 to $99,999 | 6 | 6.6% |
| $100,000 to $149,999 | 5 | 5.5% |
| $150,000 to $199,999 | 0 | 0.0% |
| $200,000+ | 0 | 0.0% |
Family Income by Famaliy Size in Altona
| Income Bracket | # Families | Median Income |
| 2-Person Families | 28 (30.8%) | $0 |
| 3-Person Families | 58 (63.7%) | $0 |
| 4-Person Families | 5 (5.5%) | $0 |
| 5-Person Families | 0 (0.0%) | $0 |
| 6-Person Families | 0 (0.0%) | $0 |
| 7+ Person Families | 0 (0.0%) | $0 |
| Total | 91 (100.0%) | $0 |
Family Income by Number of Earners in Altona
| Number of Earners | # Families | Median Income |
| No Earners | 14 (15.4%) | $0 |
| 1 Earner | 56 (61.5%) | $0 |
| 2 Earners | 16 (17.6%) | $0 |
| 3+ Earners | 5 (5.5%) | $0 |
| Total | 91 (100.0%) | $0 |
Household Income in Altona
Household Income Brackets in Altona
With 46 households falling in the category, the $15,000 to $24,999 income range is the most frequent in Altona, accounting for 42.6% of all households.
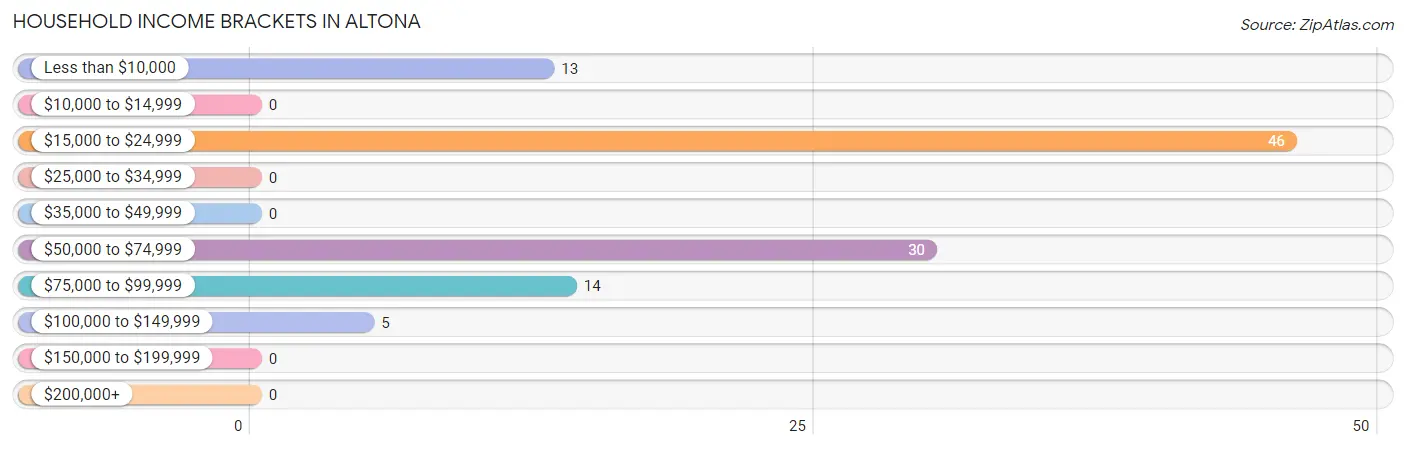
| Income Bracket | # Households | % Households |
| Less than $10,000 | 13 | 12.0% |
| $10,000 to $14,999 | 0 | 0.0% |
| $15,000 to $24,999 | 46 | 42.6% |
| $25,000 to $34,999 | 0 | 0.0% |
| $35,000 to $49,999 | 0 | 0.0% |
| $50,000 to $74,999 | 30 | 27.8% |
| $75,000 to $99,999 | 14 | 13.0% |
| $100,000 to $149,999 | 5 | 4.6% |
| $150,000 to $199,999 | 0 | 0.0% |
| $200,000+ | 0 | 0.0% |
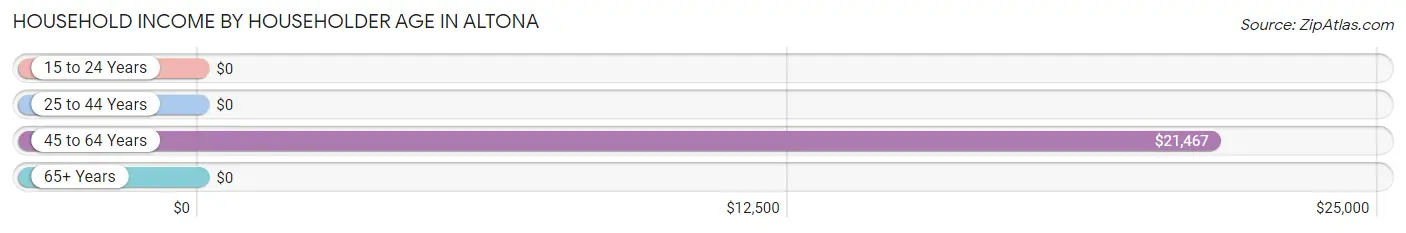
Household Income by Householder Age in Altona
The median household income in Altona is $0, with the highest median household income of $21,467 found in the 45 to 64 years age bracket for the primary householder. A total of 80 households (74.1%) fall into this category. Meanwhile, the 15 to 24 years age bracket for the primary householder has the lowest median household income of $0, with 10 households (9.3%) in this group.
| Income Bracket | # Households | Median Income |
| 15 to 24 Years | 10 (9.3%) | $0 |
| 25 to 44 Years | 18 (16.7%) | $0 |
| 45 to 64 Years | 80 (74.1%) | $21,467 |
| 65+ Years | 0 (0.0%) | $0 |
| Total | 108 (100.0%) | $0 |
Poverty in Altona
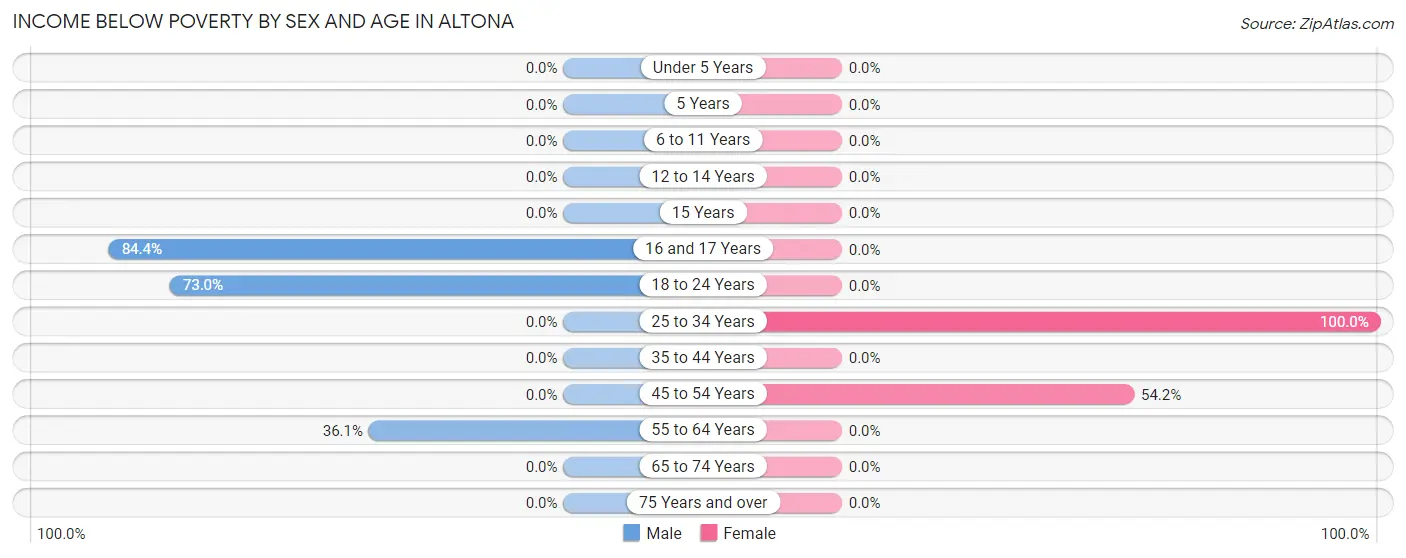
Income Below Poverty by Sex and Age in Altona
With 48.4% poverty level for males and 50.6% for females among the residents of Altona, 16 and 17 year old males and 25 to 34 year old females are the most vulnerable to poverty, with 27 males (84.4%) and 12 females (100.0%) in their respective age groups living below the poverty level.
| Age Bracket | Male | Female |
| Under 5 Years | 0 (0.0%) | 0 (0.0%) |
| 5 Years | 0 (0.0%) | 0 (0.0%) |
| 6 to 11 Years | 0 (0.0%) | 0 (0.0%) |
| 12 to 14 Years | 0 (0.0%) | 0 (0.0%) |
| 15 Years | 0 (0.0%) | 0 (0.0%) |
| 16 and 17 Years | 27 (84.4%) | 0 (0.0%) |
| 18 to 24 Years | 65 (73.0%) | 0 (0.0%) |
| 25 to 34 Years | 0 (0.0%) | 12 (100.0%) |
| 35 to 44 Years | 0 (0.0%) | 0 (0.0%) |
| 45 to 54 Years | 0 (0.0%) | 32 (54.2%) |
| 55 to 64 Years | 13 (36.1%) | 0 (0.0%) |
| 65 to 74 Years | 0 (0.0%) | 0 (0.0%) |
| 75 Years and over | 0 (0.0%) | 0 (0.0%) |
| Total | 105 (48.4%) | 44 (50.6%) |
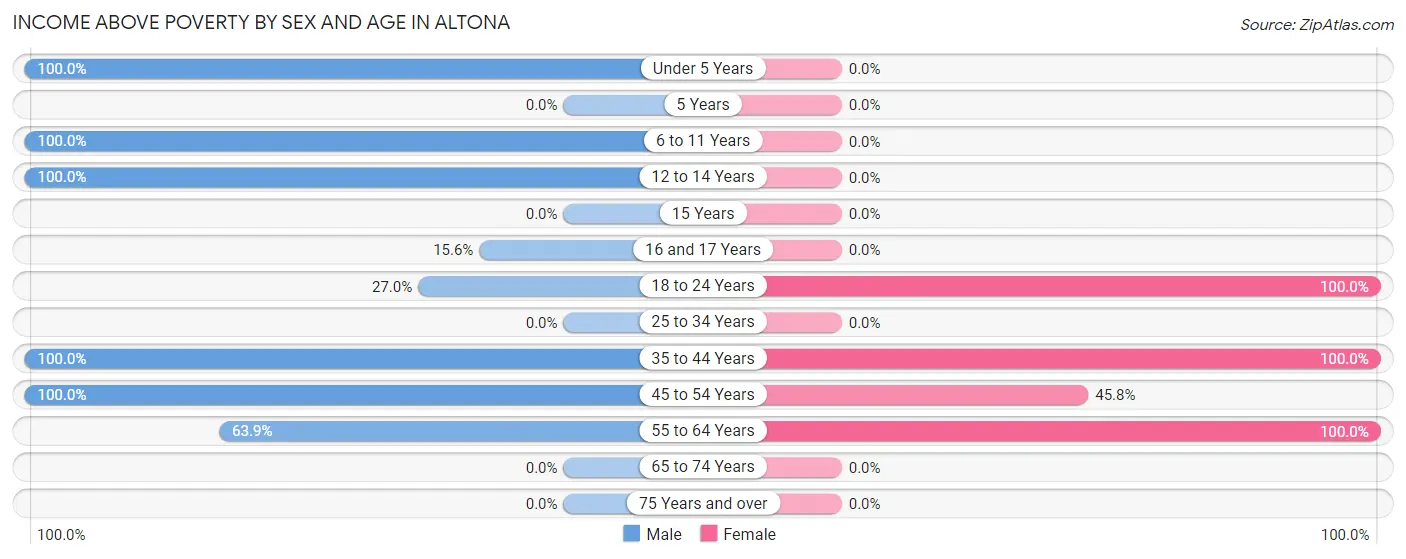
Income Above Poverty by Sex and Age in Altona
According to the poverty statistics in Altona, males aged under 5 years and females aged 18 to 24 years are the age groups that are most secure financially, with 100.0% of males and 100.0% of females in these age groups living above the poverty line.
| Age Bracket | Male | Female |
| Under 5 Years | 20 (100.0%) | 0 (0.0%) |
| 5 Years | 0 (0.0%) | 0 (0.0%) |
| 6 to 11 Years | 8 (100.0%) | 0 (0.0%) |
| 12 to 14 Years | 3 (100.0%) | 0 (0.0%) |
| 15 Years | 0 (0.0%) | 0 (0.0%) |
| 16 and 17 Years | 5 (15.6%) | 0 (0.0%) |
| 18 to 24 Years | 24 (27.0%) | 7 (100.0%) |
| 25 to 34 Years | 0 (0.0%) | 0 (0.0%) |
| 35 to 44 Years | 23 (100.0%) | 4 (100.0%) |
| 45 to 54 Years | 6 (100.0%) | 27 (45.8%) |
| 55 to 64 Years | 23 (63.9%) | 5 (100.0%) |
| 65 to 74 Years | 0 (0.0%) | 0 (0.0%) |
| 75 Years and over | 0 (0.0%) | 0 (0.0%) |
| Total | 112 (51.6%) | 43 (49.4%) |
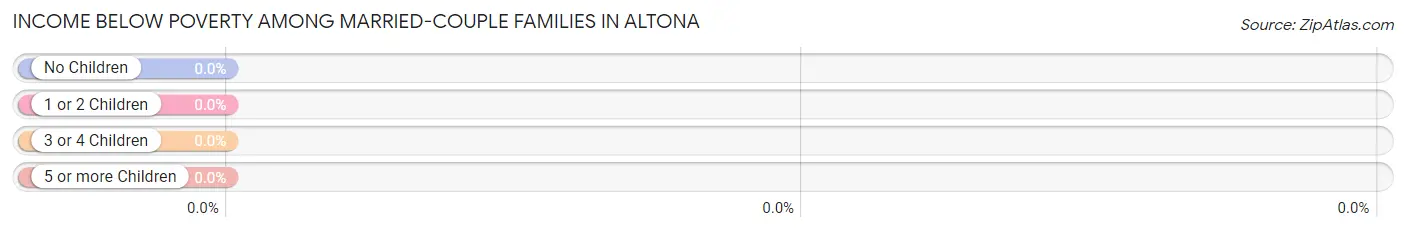
Income Below Poverty Among Married-Couple Families in Altona
| Children | Above Poverty | Below Poverty |
| No Children | 20 (100.0%) | 0 (0.0%) |
| 1 or 2 Children | 21 (100.0%) | 0 (0.0%) |
| 3 or 4 Children | 0 (0.0%) | 0 (0.0%) |
| 5 or more Children | 0 (0.0%) | 0 (0.0%) |
| Total | 41 (100.0%) | 0 (0.0%) |
Income Below Poverty Among Single-Parent Households in Altona
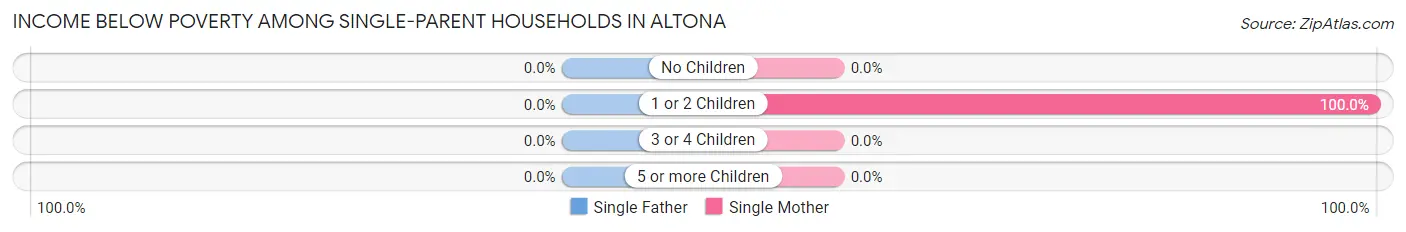
| Children | Single Father | Single Mother |
| No Children | 0 (0.0%) | 0 (0.0%) |
| 1 or 2 Children | 0 (0.0%) | 32 (100.0%) |
| 3 or 4 Children | 0 (0.0%) | 0 (0.0%) |
| 5 or more Children | 0 (0.0%) | 0 (0.0%) |
| Total | 0 (0.0%) | 32 (100.0%) |
Income Below Poverty Among Married-Couple vs Single-Parent Households in Altona
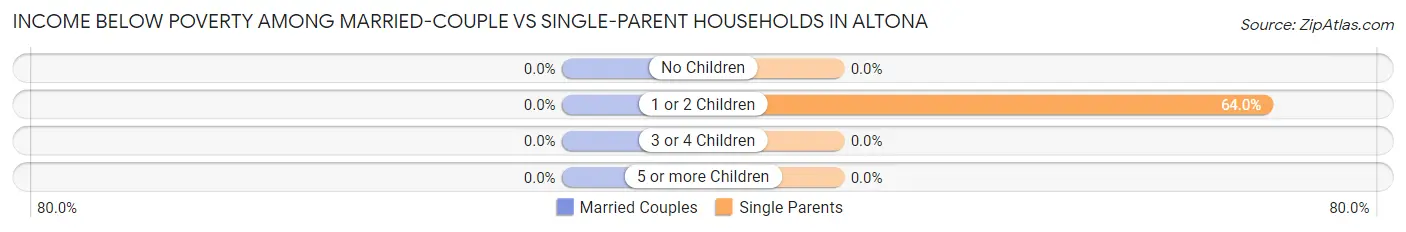
| Children | Married-Couple Families | Single-Parent Households |
| No Children | 0 (0.0%) | 0 (0.0%) |
| 1 or 2 Children | 0 (0.0%) | 32 (64.0%) |
| 3 or 4 Children | 0 (0.0%) | 0 (0.0%) |
| 5 or more Children | 0 (0.0%) | 0 (0.0%) |
| Total | 0 (0.0%) | 32 (64.0%) |
Race in Altona
The most populous races in Altona are White / Caucasian (423 | 64.4%), Black / African American (159 | 24.2%), and Hispanic or Latino (79 | 12.0%).
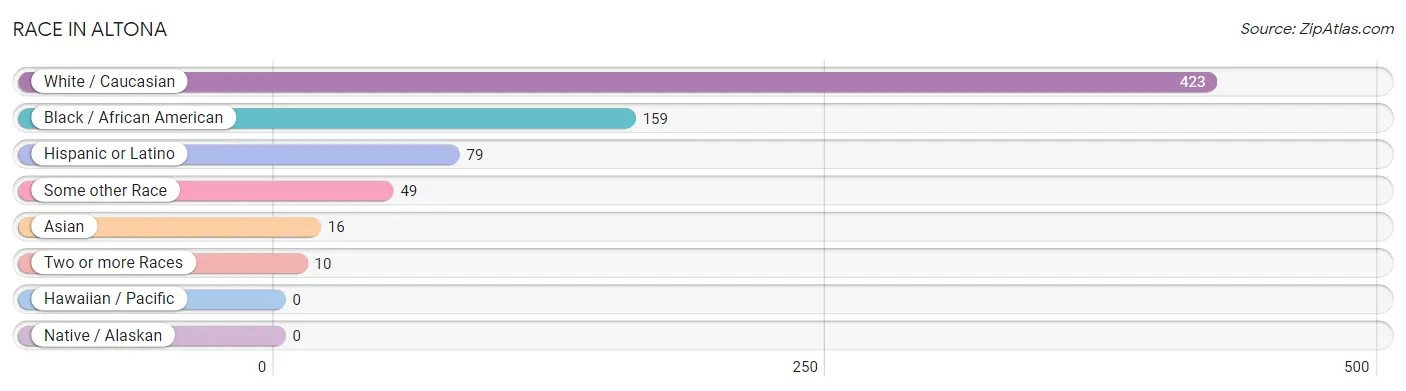
| Race | # Population | % Population |
| Asian | 16 | 2.4% |
| Black / African American | 159 | 24.2% |
| Hawaiian / Pacific | 0 | 0.0% |
| Hispanic or Latino | 79 | 12.0% |
| Native / Alaskan | 0 | 0.0% |
| White / Caucasian | 423 | 64.4% |
| Two or more Races | 10 | 1.5% |
| Some other Race | 49 | 7.5% |
| Total | 657 | 100.0% |
Ancestry in Altona
The most populous ancestries reported in Altona are French (159 | 24.2%), English (104 | 15.8%), Italian (53 | 8.1%), Puerto Rican (39 | 5.9%), and Jamaican (29 | 4.4%), together accounting for 58.5% of all Altona residents.
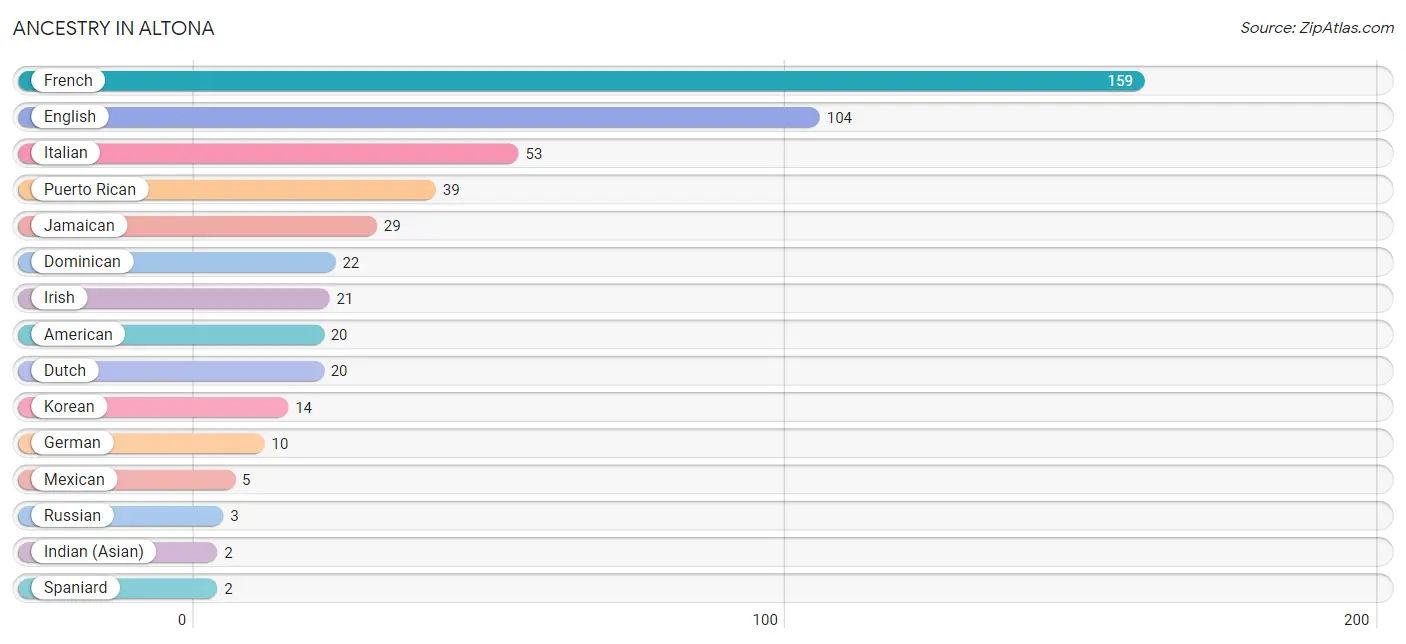
| Ancestry | # Population | % Population |
| American | 20 | 3.0% |
| Dominican | 22 | 3.4% |
| Dutch | 20 | 3.0% |
| English | 104 | 15.8% |
| French | 159 | 24.2% |
| German | 10 | 1.5% |
| Indian (Asian) | 2 | 0.3% |
| Irish | 21 | 3.2% |
| Italian | 53 | 8.1% |
| Jamaican | 29 | 4.4% |
| Korean | 14 | 2.1% |
| Mexican | 5 | 0.8% |
| Puerto Rican | 39 | 5.9% |
| Russian | 3 | 0.5% |
| Spaniard | 2 | 0.3% | View All 15 Rows |
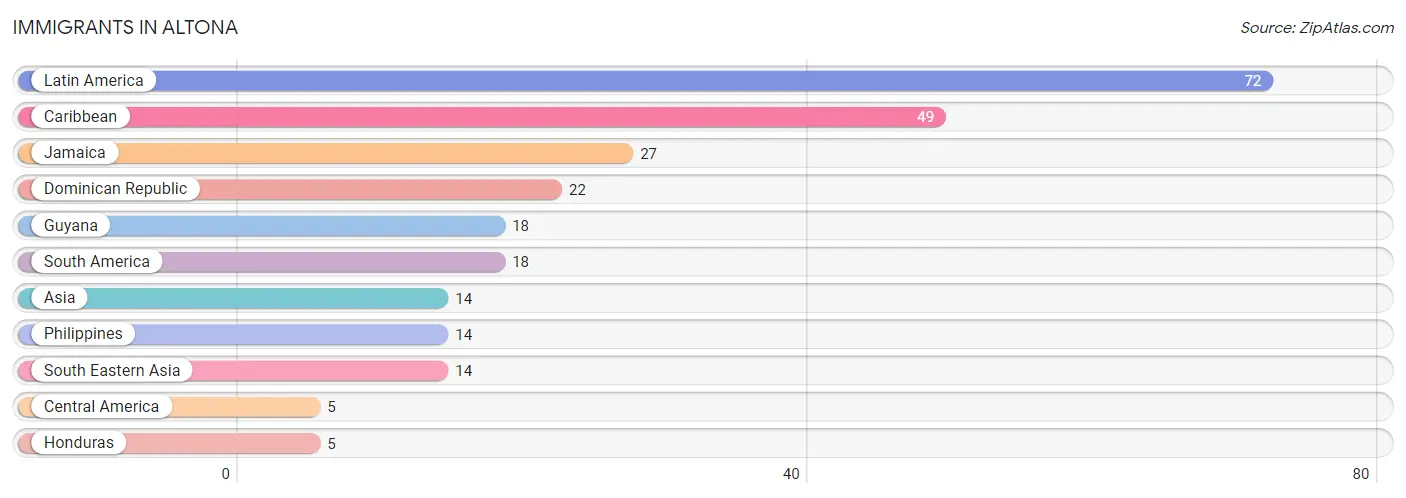
Immigrants in Altona
The most numerous immigrant groups reported in Altona came from Latin America (72 | 11.0%), Caribbean (49 | 7.5%), Jamaica (27 | 4.1%), Dominican Republic (22 | 3.4%), and Guyana (18 | 2.7%), together accounting for 28.6% of all Altona residents.
| Immigration Origin | # Population | % Population |
| Asia | 14 | 2.1% |
| Caribbean | 49 | 7.5% |
| Central America | 5 | 0.8% |
| Dominican Republic | 22 | 3.4% |
| Guyana | 18 | 2.7% |
| Honduras | 5 | 0.8% |
| Jamaica | 27 | 4.1% |
| Latin America | 72 | 11.0% |
| Philippines | 14 | 2.1% |
| South America | 18 | 2.7% |
| South Eastern Asia | 14 | 2.1% | View All 11 Rows |
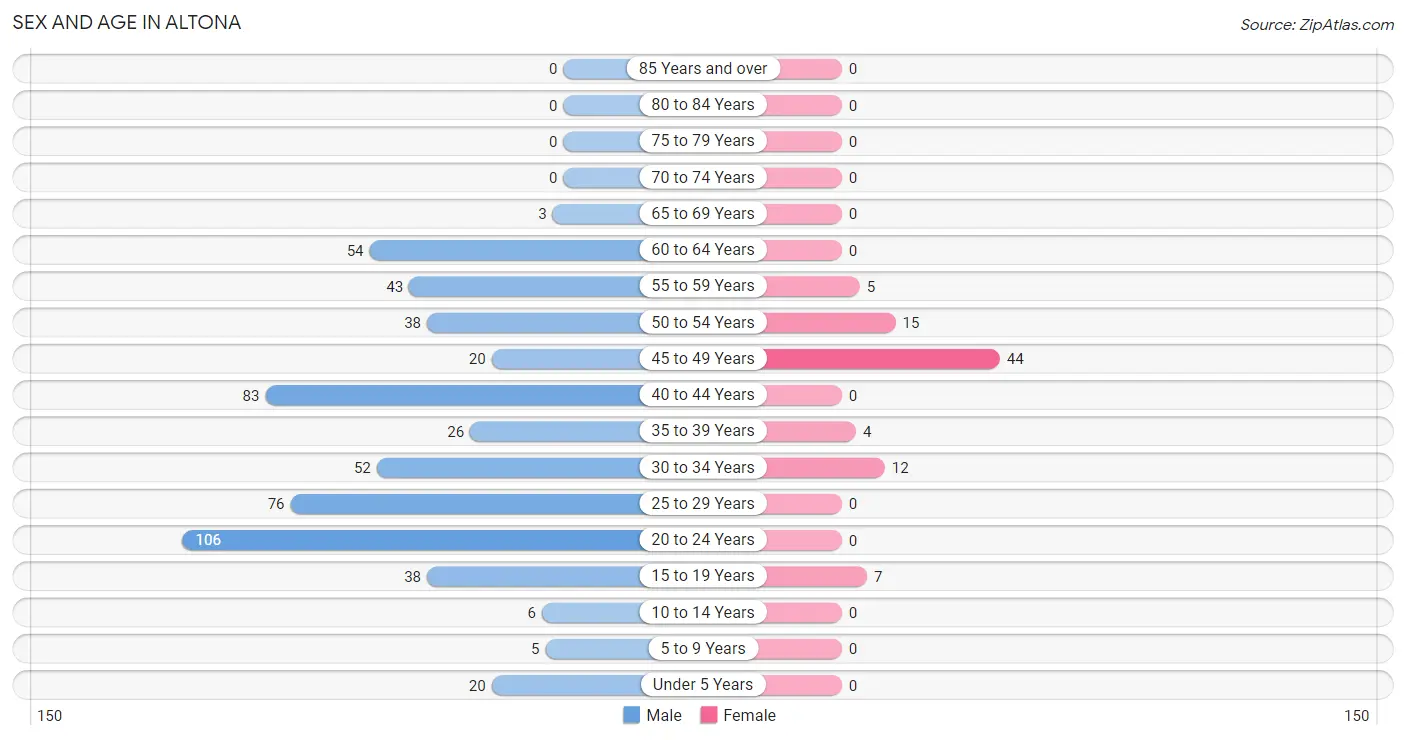
Sex and Age in Altona
Sex and Age in Altona
The most populous age groups in Altona are 20 to 24 Years (106 | 18.6%) for men and 45 to 49 Years (44 | 50.6%) for women.
| Age Bracket | Male | Female |
| Under 5 Years | 20 (3.5%) | 0 (0.0%) |
| 5 to 9 Years | 5 (0.9%) | 0 (0.0%) |
| 10 to 14 Years | 6 (1.1%) | 0 (0.0%) |
| 15 to 19 Years | 38 (6.7%) | 7 (8.1%) |
| 20 to 24 Years | 106 (18.6%) | 0 (0.0%) |
| 25 to 29 Years | 76 (13.3%) | 0 (0.0%) |
| 30 to 34 Years | 52 (9.1%) | 12 (13.8%) |
| 35 to 39 Years | 26 (4.6%) | 4 (4.6%) |
| 40 to 44 Years | 83 (14.6%) | 0 (0.0%) |
| 45 to 49 Years | 20 (3.5%) | 44 (50.6%) |
| 50 to 54 Years | 38 (6.7%) | 15 (17.2%) |
| 55 to 59 Years | 43 (7.5%) | 5 (5.8%) |
| 60 to 64 Years | 54 (9.5%) | 0 (0.0%) |
| 65 to 69 Years | 3 (0.5%) | 0 (0.0%) |
| 70 to 74 Years | 0 (0.0%) | 0 (0.0%) |
| 75 to 79 Years | 0 (0.0%) | 0 (0.0%) |
| 80 to 84 Years | 0 (0.0%) | 0 (0.0%) |
| 85 Years and over | 0 (0.0%) | 0 (0.0%) |
| Total | 570 (100.0%) | 87 (100.0%) |
Families and Households in Altona
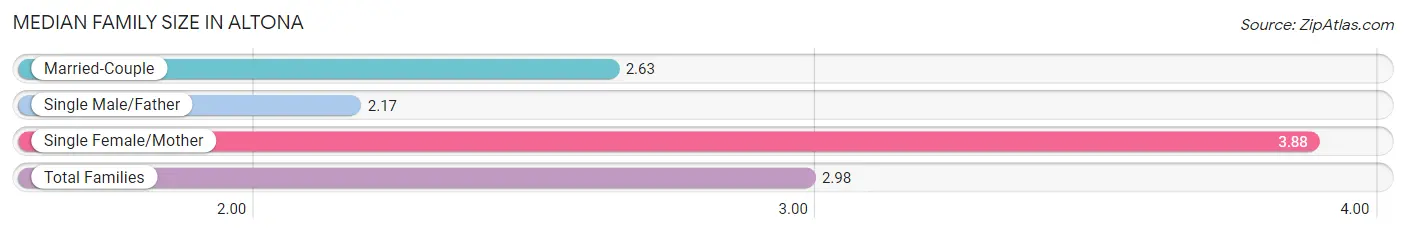
Median Family Size in Altona
The median family size in Altona is 2.98 persons per family, with single female/mother families (32 | 35.2%) accounting for the largest median family size of 3.88 persons per family. On the other hand, single male/father families (18 | 19.8%) represent the smallest median family size with 2.17 persons per family.
| Family Type | # Families | Family Size |
| Married-Couple | 41 (45.1%) | 2.63 |
| Single Male/Father | 18 (19.8%) | 2.17 |
| Single Female/Mother | 32 (35.2%) | 3.88 |
| Total Families | 91 (100.0%) | 2.98 |
Median Household Size in Altona
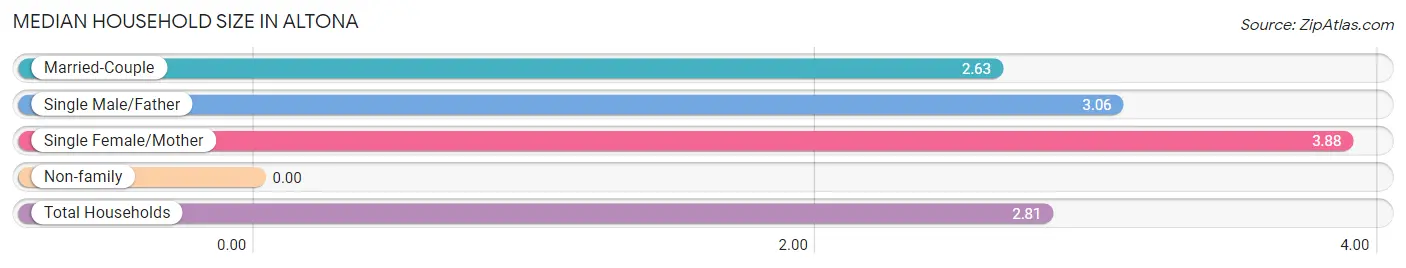
| Household Type | # Households | Household Size |
| Married-Couple | 41 (38.0%) | 2.63 |
| Single Male/Father | 18 (16.7%) | 3.06 |
| Single Female/Mother | 32 (29.6%) | 3.88 |
| Non-family | 17 (15.7%) | - |
| Total Households | 108 (100.0%) | 2.81 |
Household Size by Marriage Status in Altona
Out of a total of 108 households in Altona, 91 (84.3%) are family households, while 17 (15.7%) are nonfamily households. The most numerous type of family households are 3-person households, comprising 68, and the most common type of nonfamily households are 1-person households, comprising 17.
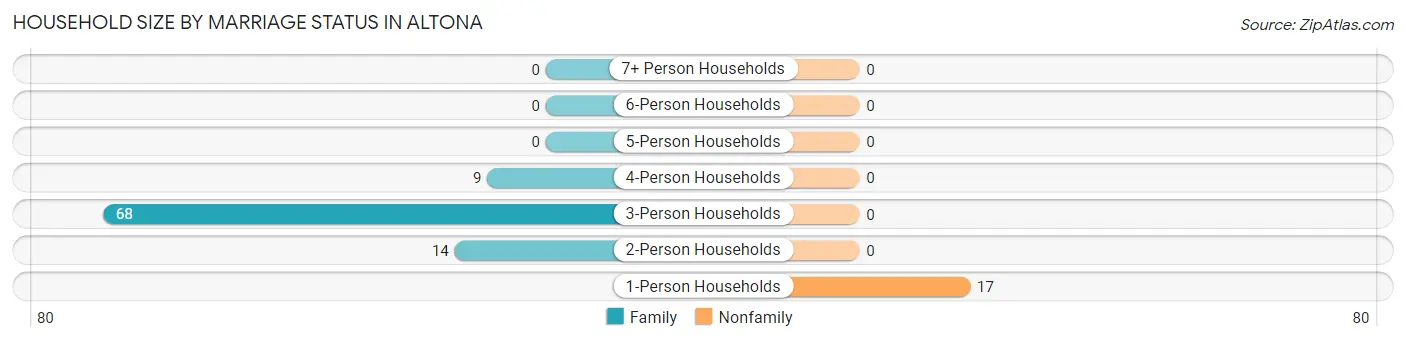
| Household Size | Family Households | Nonfamily Households |
| 1-Person Households | - | 17 (15.7%) |
| 2-Person Households | 14 (13.0%) | 0 (0.0%) |
| 3-Person Households | 68 (63.0%) | 0 (0.0%) |
| 4-Person Households | 9 (8.3%) | 0 (0.0%) |
| 5-Person Households | 0 (0.0%) | 0 (0.0%) |
| 6-Person Households | 0 (0.0%) | 0 (0.0%) |
| 7+ Person Households | 0 (0.0%) | 0 (0.0%) |
| Total | 91 (84.3%) | 17 (15.7%) |
Female Fertility in Altona
Fertility by Age in Altona
Average fertility rate in Altona is 104.0 births per 1,000 women. Women in the age bracket of 15 to 19 years have the highest fertility rate with 1,000.0 births per 1,000 women. Women in the age bracket of 15 to 19 years acount for 100.0% of all women with births.
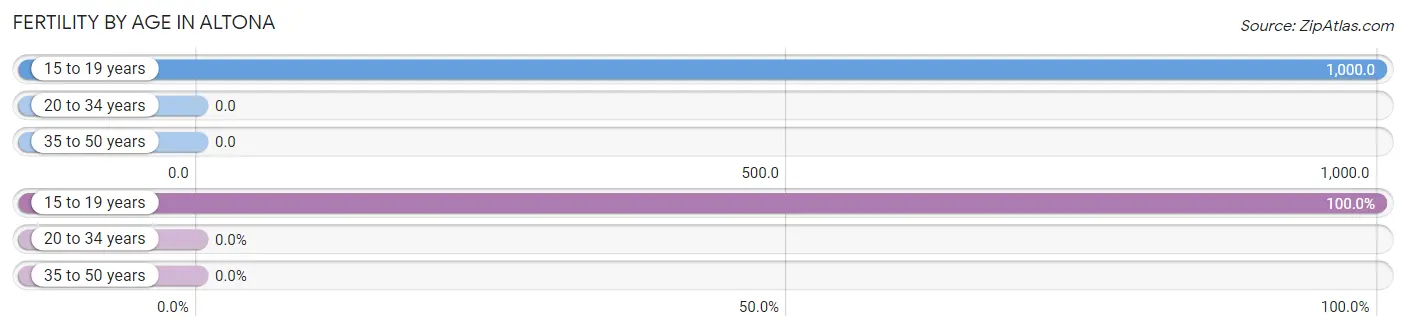
| Age Bracket | Women with Births | Births / 1,000 Women |
| 15 to 19 years | 7 (100.0%) | 1,000.0 |
| 20 to 34 years | 0 (0.0%) | 0.0 |
| 35 to 50 years | 0 (0.0%) | 0.0 |
| Total | 7 (100.0%) | 104.0 |
Fertility by Age by Marriage Status in Altona
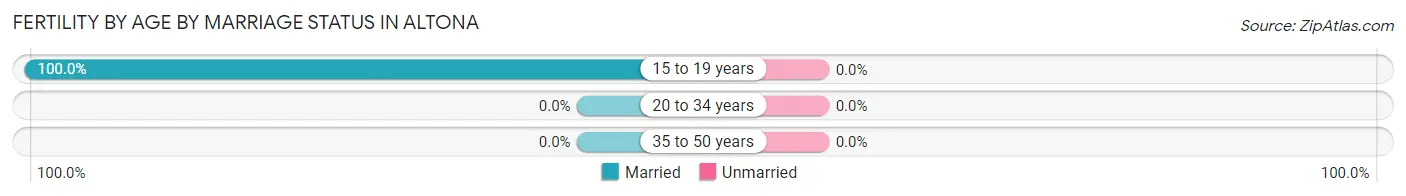
| Age Bracket | Married | Unmarried |
| 15 to 19 years | 7 (100.0%) | 0 (0.0%) |
| 20 to 34 years | 0 (0.0%) | 0 (0.0%) |
| 35 to 50 years | 0 (0.0%) | 0 (0.0%) |
| Total | 7 (100.0%) | 0 (0.0%) |
Fertility by Education in Altona
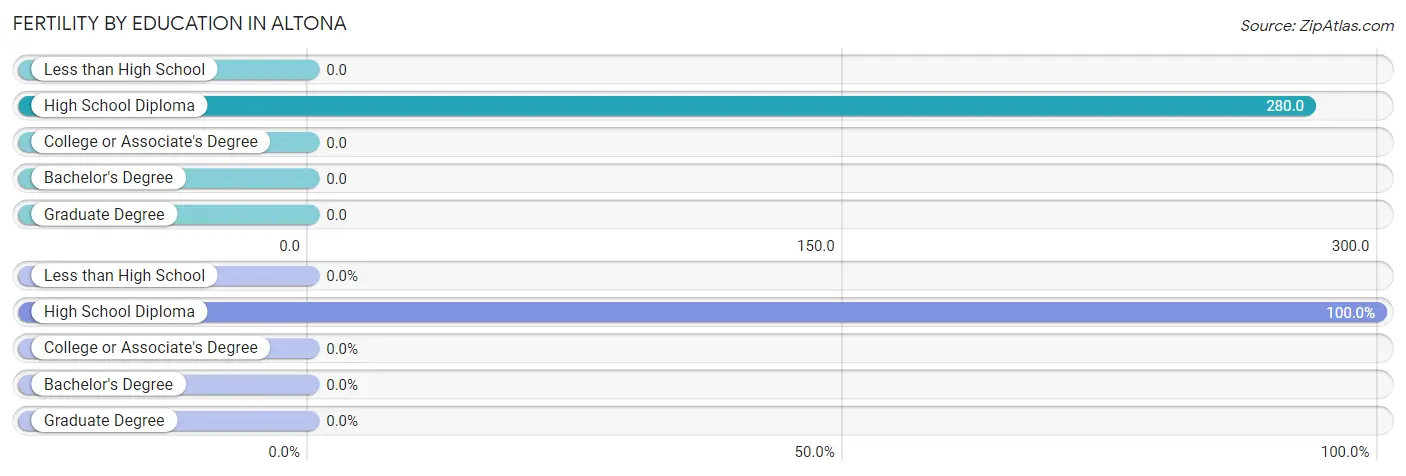
| Educational Attainment | Women with Births | Births / 1,000 Women |
| Less than High School | 0 (0.0%) | 0.0 |
| High School Diploma | 7 (100.0%) | 280.0 |
| College or Associate's Degree | 0 (0.0%) | 0.0 |
| Bachelor's Degree | 0 (0.0%) | 0.0 |
| Graduate Degree | 0 (0.0%) | 0.0 |
| Total | 7 (100.0%) | 104.0 |
Fertility by Education by Marriage Status in Altona
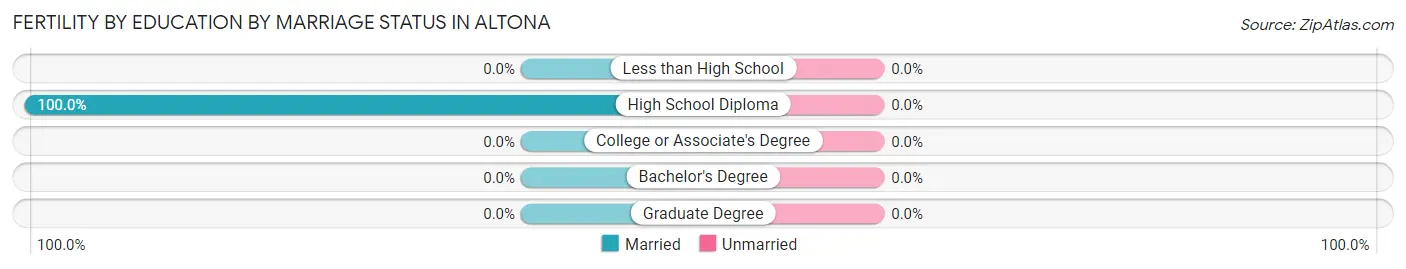
| Educational Attainment | Married | Unmarried |
| Less than High School | 0 (0.0%) | 0 (0.0%) |
| High School Diploma | 7 (100.0%) | 0 (0.0%) |
| College or Associate's Degree | 0 (0.0%) | 0 (0.0%) |
| Bachelor's Degree | 0 (0.0%) | 0 (0.0%) |
| Graduate Degree | 0 (0.0%) | 0 (0.0%) |
| Total | 7 (100.0%) | 0 (0.0%) |
Employment Characteristics in Altona
Employment by Class of Employer in Altona
Among the 146 employed individuals in Altona, private company employees (128 | 87.7%), state government employees (14 | 9.6%), and self-employed (not incorporated) (4 | 2.7%) make up the most common classes of employment.
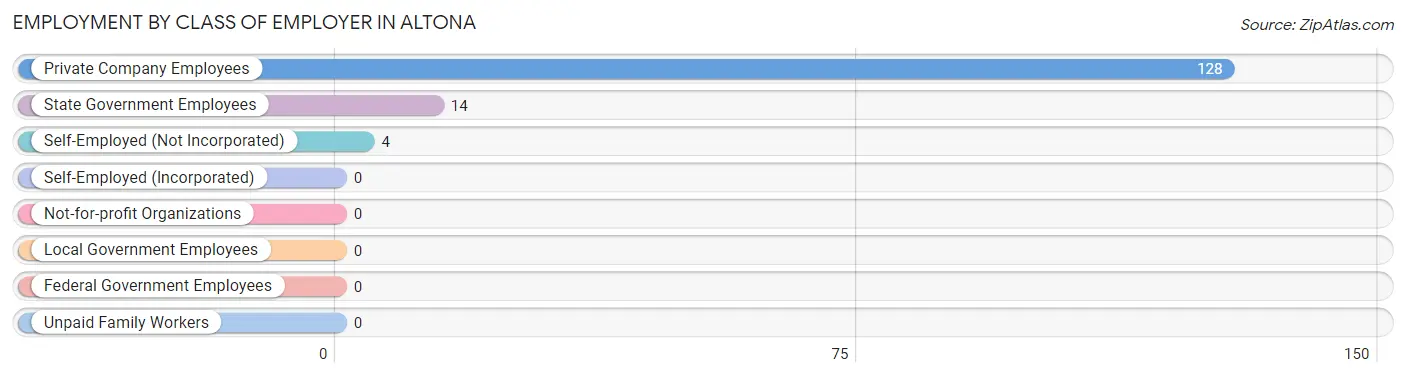
| Employer Class | # Employees | % Employees |
| Private Company Employees | 128 | 87.7% |
| Self-Employed (Incorporated) | 0 | 0.0% |
| Self-Employed (Not Incorporated) | 4 | 2.7% |
| Not-for-profit Organizations | 0 | 0.0% |
| Local Government Employees | 0 | 0.0% |
| State Government Employees | 14 | 9.6% |
| Federal Government Employees | 0 | 0.0% |
| Unpaid Family Workers | 0 | 0.0% |
| Total | 146 | 100.0% |
Employment Status by Age in Altona
According to the labor force statistics for Altona, out of the total population over 16 years of age (626), 27.6% or 173 individuals are in the labor force, with 15.6% or 27 of them unemployed. The age group with the highest labor force participation rate is 16 to 19 years, with 88.9% or 40 individuals in the labor force. Within the labor force, the 16 to 19 years age range has the highest percentage of unemployed individuals, with 67.5% or 27 of them being unemployed.
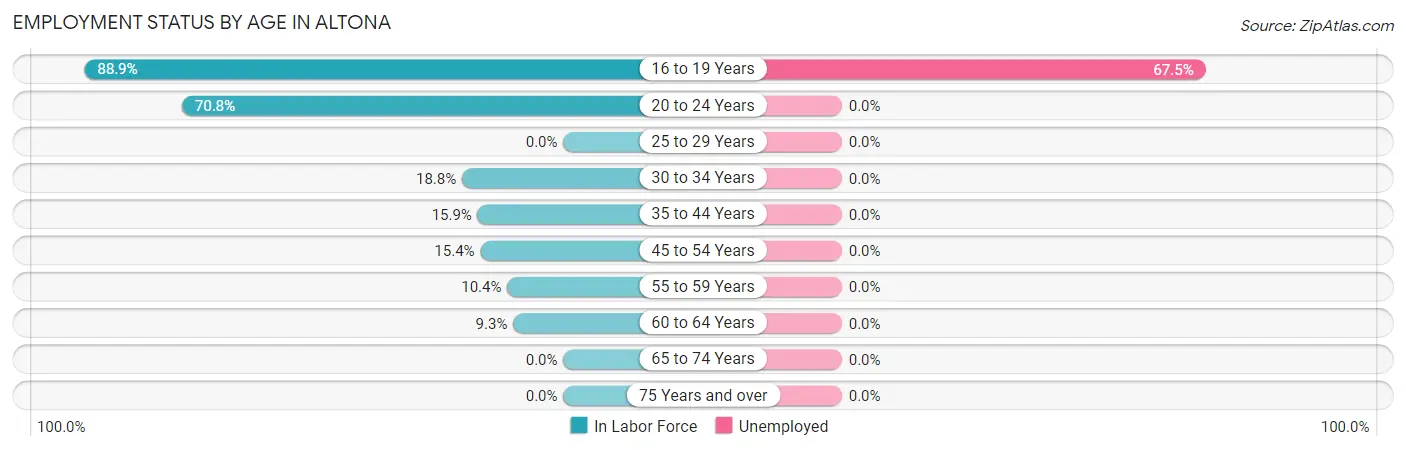
| Age Bracket | In Labor Force | Unemployed |
| 16 to 19 Years | 40 (88.9%) | 27 (67.5%) |
| 20 to 24 Years | 75 (70.8%) | 0 (0.0%) |
| 25 to 29 Years | 0 (0.0%) | 0 (0.0%) |
| 30 to 34 Years | 12 (18.8%) | 0 (0.0%) |
| 35 to 44 Years | 18 (15.9%) | 0 (0.0%) |
| 45 to 54 Years | 18 (15.4%) | 0 (0.0%) |
| 55 to 59 Years | 5 (10.4%) | 0 (0.0%) |
| 60 to 64 Years | 5 (9.3%) | 0 (0.0%) |
| 65 to 74 Years | 0 (0.0%) | 0 (0.0%) |
| 75 Years and over | 0 (0.0%) | 0 (0.0%) |
| Total | 173 (27.6%) | 27 (15.6%) |
Employment Status by Educational Attainment in Altona
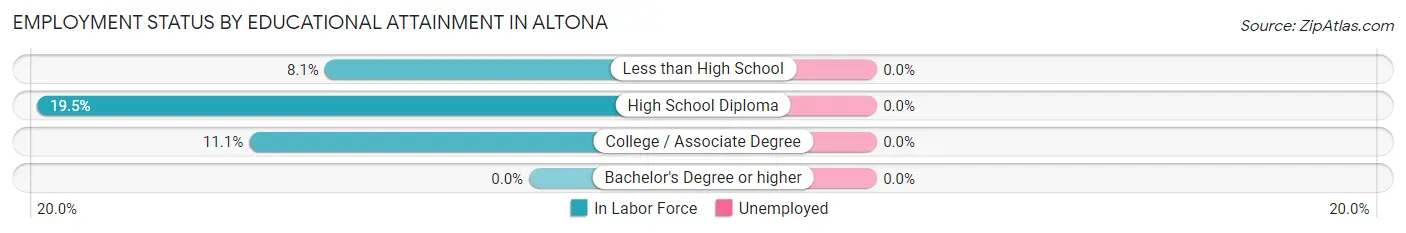
| Educational Attainment | In Labor Force | Unemployed |
| Less than High School | 16 (8.1%) | 0 (0.0%) |
| High School Diploma | 32 (19.5%) | 0 (0.0%) |
| College / Associate Degree | 10 (11.1%) | 0 (0.0%) |
| Bachelor's Degree or higher | 0 (0.0%) | 0 (0.0%) |
| Total | 58 (12.3%) | 0 (0.0%) |
Employment Occupations by Sex in Altona
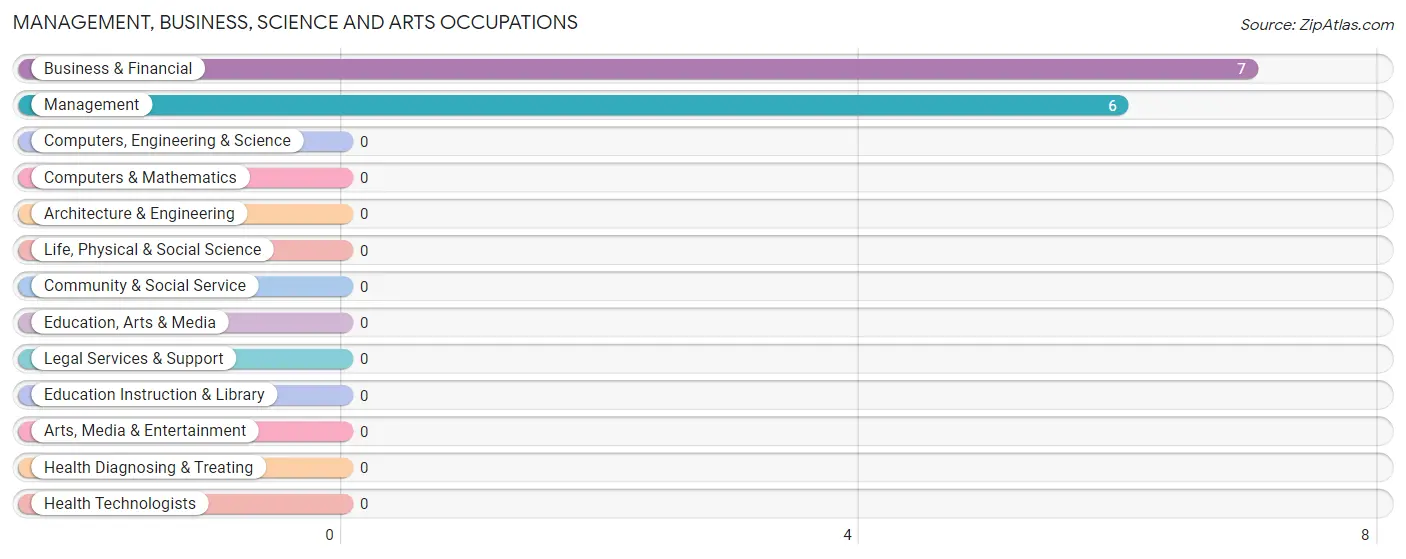
Management, Business, Science and Arts Occupations
The most common Management, Business, Science and Arts occupations in Altona are Business & Financial (7 | 4.8%), and Management (6 | 4.1%).
Management, Business, Science and Arts Occupations by Sex
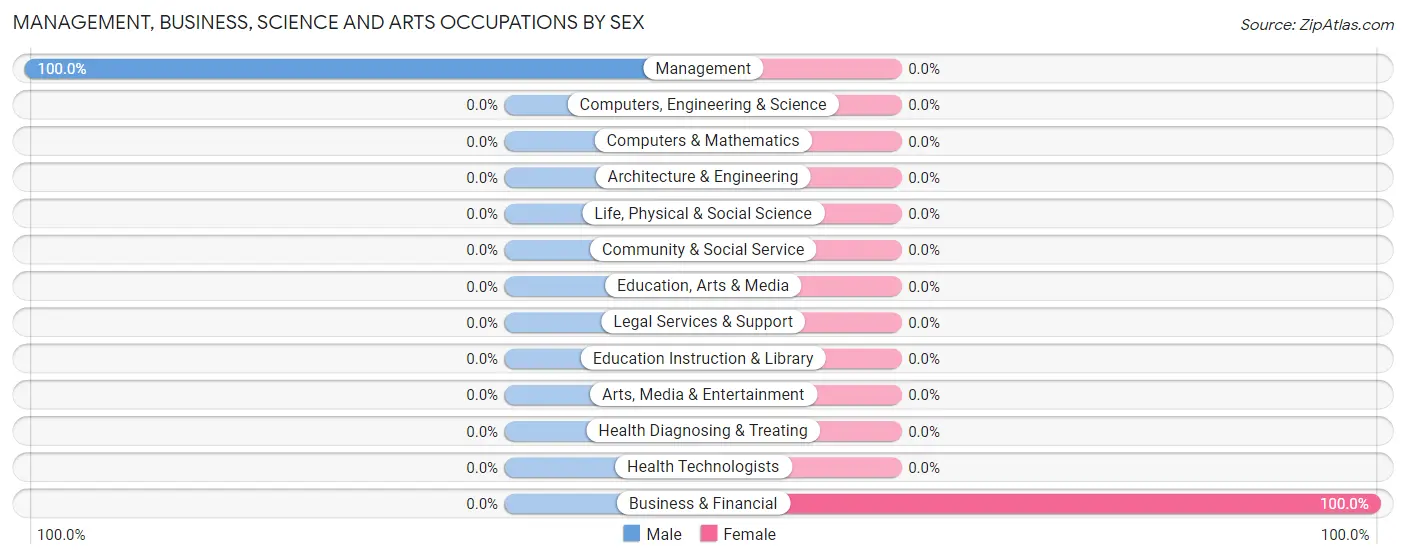
| Occupation | Male | Female |
| Management | 6 (100.0%) | 0 (0.0%) |
| Business & Financial | 0 (0.0%) | 7 (100.0%) |
| Computers, Engineering & Science | 0 (0.0%) | 0 (0.0%) |
| Computers & Mathematics | 0 (0.0%) | 0 (0.0%) |
| Architecture & Engineering | 0 (0.0%) | 0 (0.0%) |
| Life, Physical & Social Science | 0 (0.0%) | 0 (0.0%) |
| Community & Social Service | 0 (0.0%) | 0 (0.0%) |
| Education, Arts & Media | 0 (0.0%) | 0 (0.0%) |
| Legal Services & Support | 0 (0.0%) | 0 (0.0%) |
| Education Instruction & Library | 0 (0.0%) | 0 (0.0%) |
| Arts, Media & Entertainment | 0 (0.0%) | 0 (0.0%) |
| Health Diagnosing & Treating | 0 (0.0%) | 0 (0.0%) |
| Health Technologists | 0 (0.0%) | 0 (0.0%) |
| Total (Category) | 6 (46.2%) | 7 (53.8%) |
| Total (Overall) | 110 (75.3%) | 36 (24.7%) |
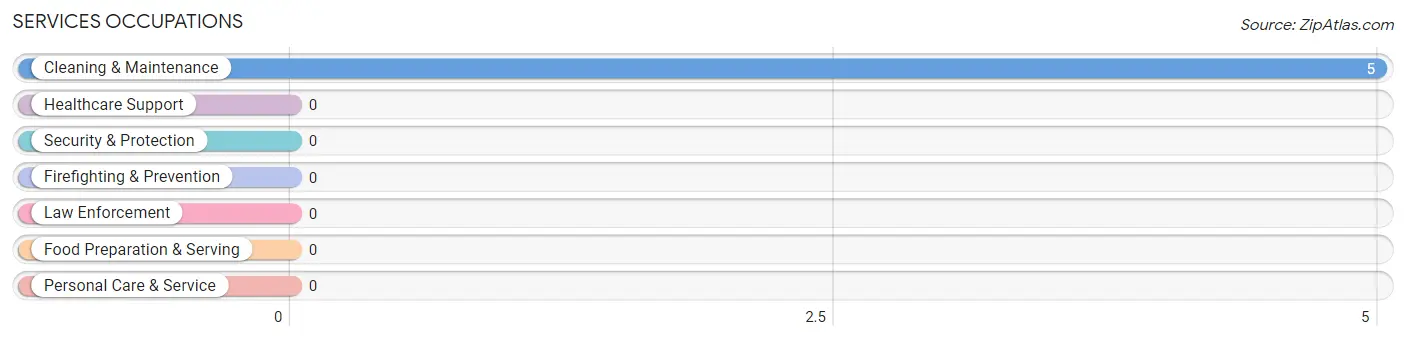
Services Occupations
The most common Services occupations in Altona are , and Cleaning & Maintenance (5 | 3.4%).
Services Occupations by Sex
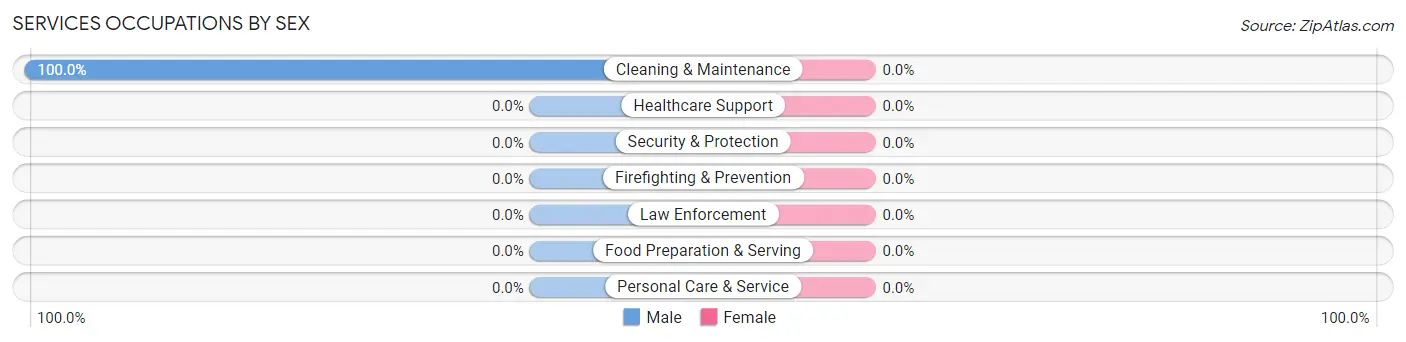
| Occupation | Male | Female |
| Healthcare Support | 0 (0.0%) | 0 (0.0%) |
| Security & Protection | 0 (0.0%) | 0 (0.0%) |
| Firefighting & Prevention | 0 (0.0%) | 0 (0.0%) |
| Law Enforcement | 0 (0.0%) | 0 (0.0%) |
| Food Preparation & Serving | 0 (0.0%) | 0 (0.0%) |
| Cleaning & Maintenance | 5 (100.0%) | 0 (0.0%) |
| Personal Care & Service | 0 (0.0%) | 0 (0.0%) |
| Total (Category) | 5 (100.0%) | 0 (0.0%) |
| Total (Overall) | 110 (75.3%) | 36 (24.7%) |
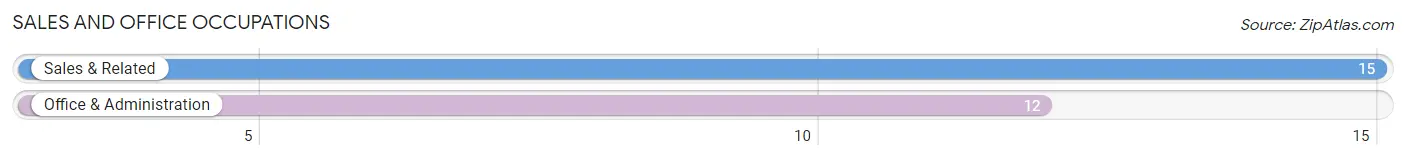
Sales and Office Occupations
The most common Sales and Office occupations in Altona are Sales & Related (15 | 10.3%), and Office & Administration (12 | 8.2%).
Sales and Office Occupations by Sex
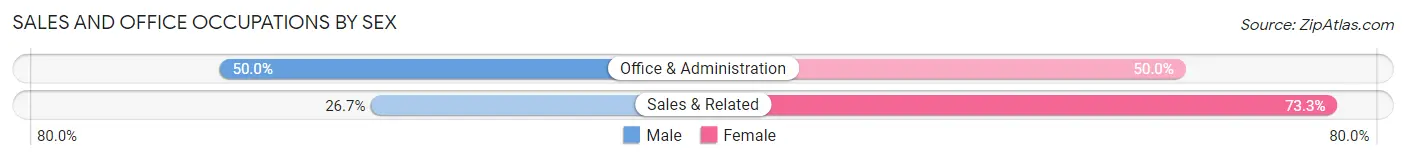
| Occupation | Male | Female |
| Sales & Related | 4 (26.7%) | 11 (73.3%) |
| Office & Administration | 6 (50.0%) | 6 (50.0%) |
| Total (Category) | 10 (37.0%) | 17 (63.0%) |
| Total (Overall) | 110 (75.3%) | 36 (24.7%) |
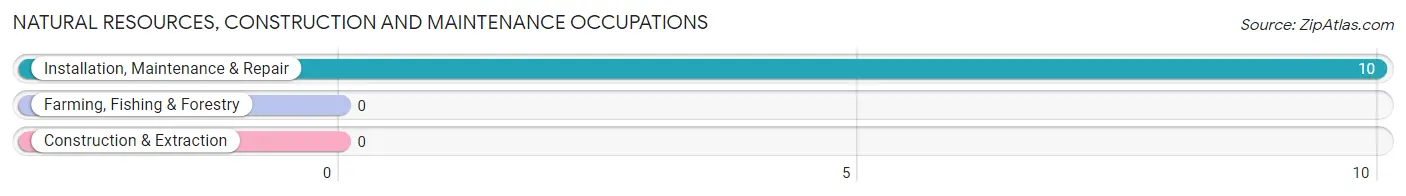
Natural Resources, Construction and Maintenance Occupations
The most common Natural Resources, Construction and Maintenance occupations in Altona are , and Installation, Maintenance & Repair (10 | 6.9%).
Natural Resources, Construction and Maintenance Occupations by Sex
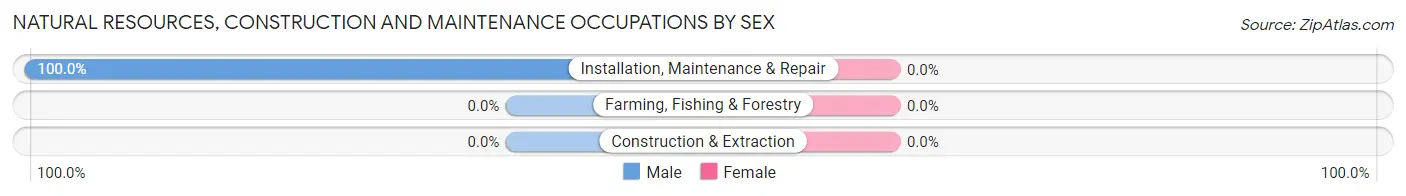
| Occupation | Male | Female |
| Farming, Fishing & Forestry | 0 (0.0%) | 0 (0.0%) |
| Construction & Extraction | 0 (0.0%) | 0 (0.0%) |
| Installation, Maintenance & Repair | 10 (100.0%) | 0 (0.0%) |
| Total (Category) | 10 (100.0%) | 0 (0.0%) |
| Total (Overall) | 110 (75.3%) | 36 (24.7%) |
Production, Transportation and Moving Occupations
The most common Production, Transportation and Moving occupations in Altona are Production (65 | 44.5%), Transportation (14 | 9.6%), and Material Moving (12 | 8.2%).
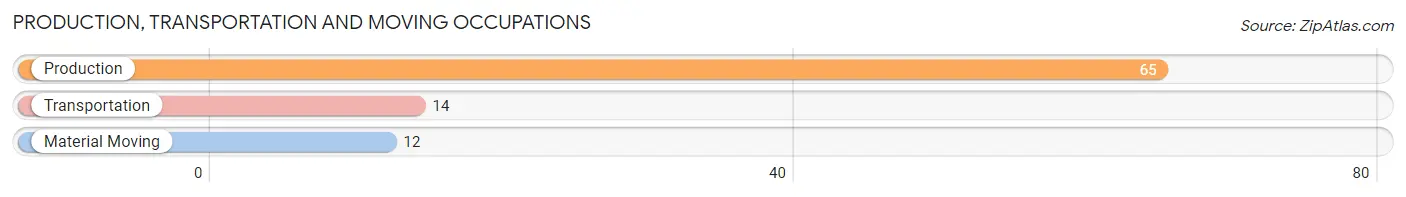
Production, Transportation and Moving Occupations by Sex
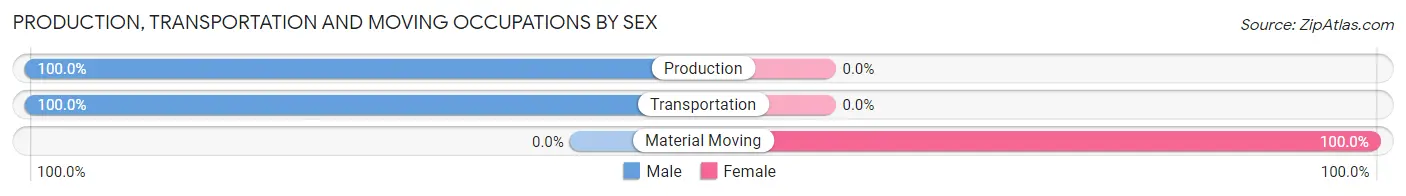
| Occupation | Male | Female |
| Production | 65 (100.0%) | 0 (0.0%) |
| Transportation | 14 (100.0%) | 0 (0.0%) |
| Material Moving | 0 (0.0%) | 12 (100.0%) |
| Total (Category) | 79 (86.8%) | 12 (13.2%) |
| Total (Overall) | 110 (75.3%) | 36 (24.7%) |
Employment Industries by Sex in Altona
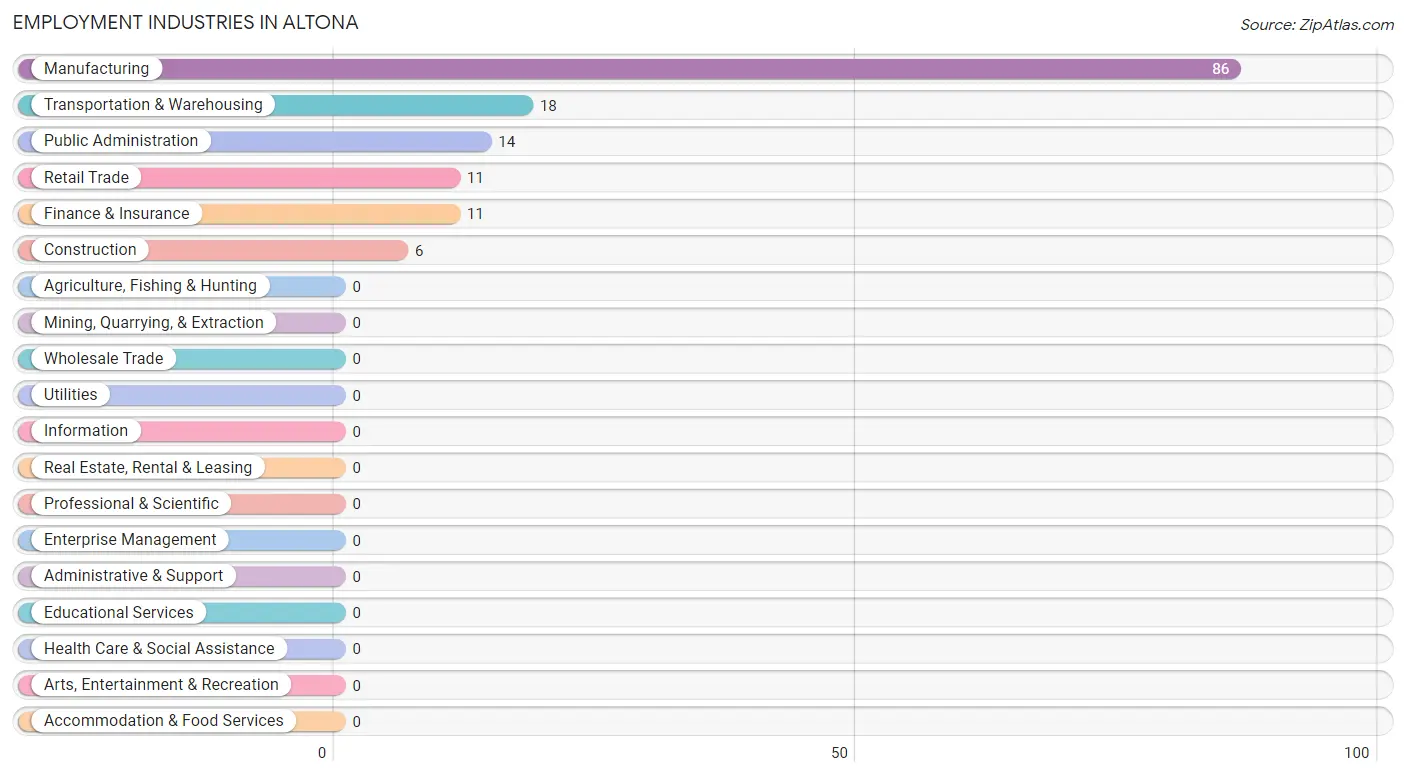
Employment Industries in Altona
The major employment industries in Altona include Manufacturing (86 | 58.9%), Transportation & Warehousing (18 | 12.3%), Public Administration (14 | 9.6%), Retail Trade (11 | 7.5%), and Finance & Insurance (11 | 7.5%).
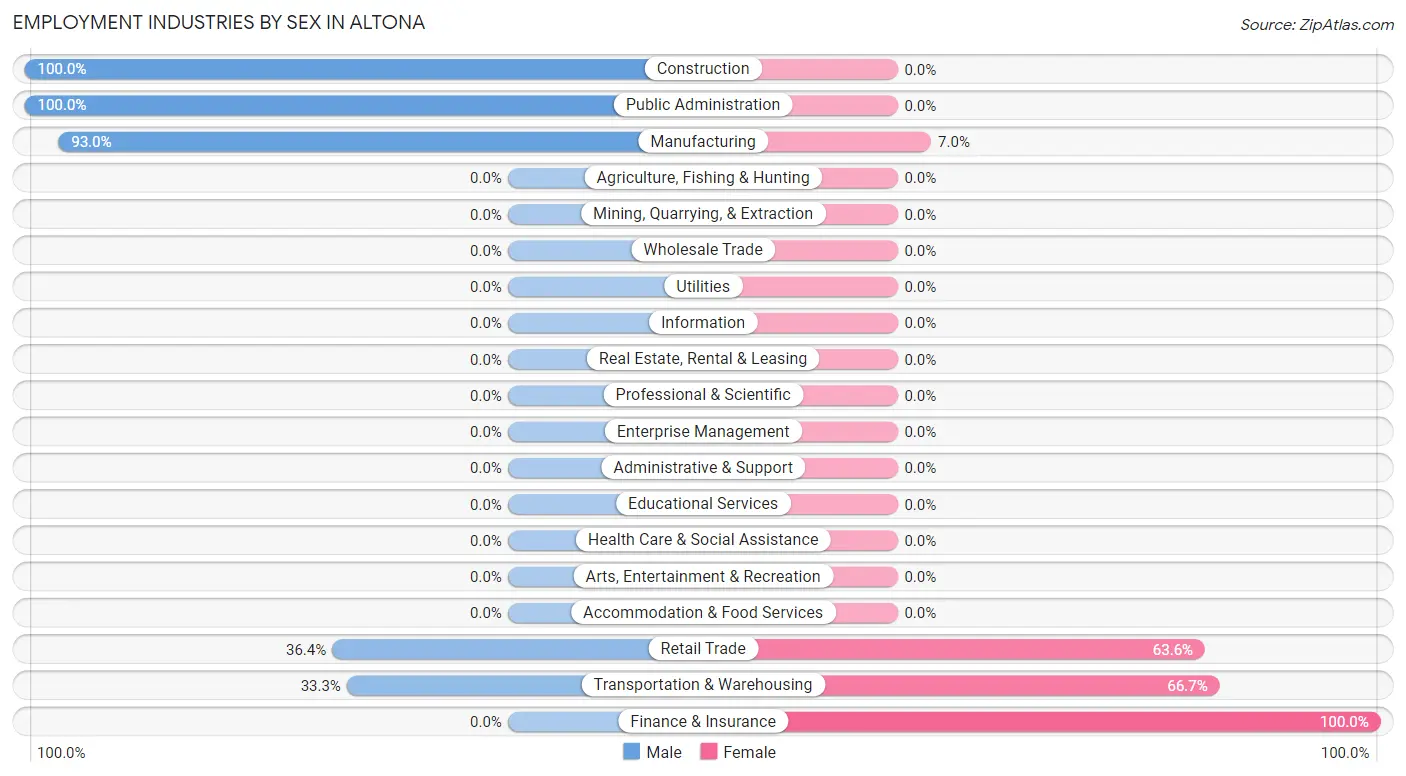
Employment Industries by Sex in Altona
The Altona industries that see more men than women are Construction (100.0%), Public Administration (100.0%), and Manufacturing (93.0%), whereas the industries that tend to have a higher number of women are Finance & Insurance (100.0%), Transportation & Warehousing (66.7%), and Retail Trade (63.6%).
| Industry | Male | Female |
| Agriculture, Fishing & Hunting | 0 (0.0%) | 0 (0.0%) |
| Mining, Quarrying, & Extraction | 0 (0.0%) | 0 (0.0%) |
| Construction | 6 (100.0%) | 0 (0.0%) |
| Manufacturing | 80 (93.0%) | 6 (7.0%) |
| Wholesale Trade | 0 (0.0%) | 0 (0.0%) |
| Retail Trade | 4 (36.4%) | 7 (63.6%) |
| Transportation & Warehousing | 6 (33.3%) | 12 (66.7%) |
| Utilities | 0 (0.0%) | 0 (0.0%) |
| Information | 0 (0.0%) | 0 (0.0%) |
| Finance & Insurance | 0 (0.0%) | 11 (100.0%) |
| Real Estate, Rental & Leasing | 0 (0.0%) | 0 (0.0%) |
| Professional & Scientific | 0 (0.0%) | 0 (0.0%) |
| Enterprise Management | 0 (0.0%) | 0 (0.0%) |
| Administrative & Support | 0 (0.0%) | 0 (0.0%) |
| Educational Services | 0 (0.0%) | 0 (0.0%) |
| Health Care & Social Assistance | 0 (0.0%) | 0 (0.0%) |
| Arts, Entertainment & Recreation | 0 (0.0%) | 0 (0.0%) |
| Accommodation & Food Services | 0 (0.0%) | 0 (0.0%) |
| Public Administration | 14 (100.0%) | 0 (0.0%) |
| Total | 110 (75.3%) | 36 (24.7%) |
Education in Altona
School Enrollment in Altona
The most common levels of schooling among the 58 students in Altona are high school (47 | 81.0%), middle school (6 | 10.3%), and elementary school (5 | 8.6%).
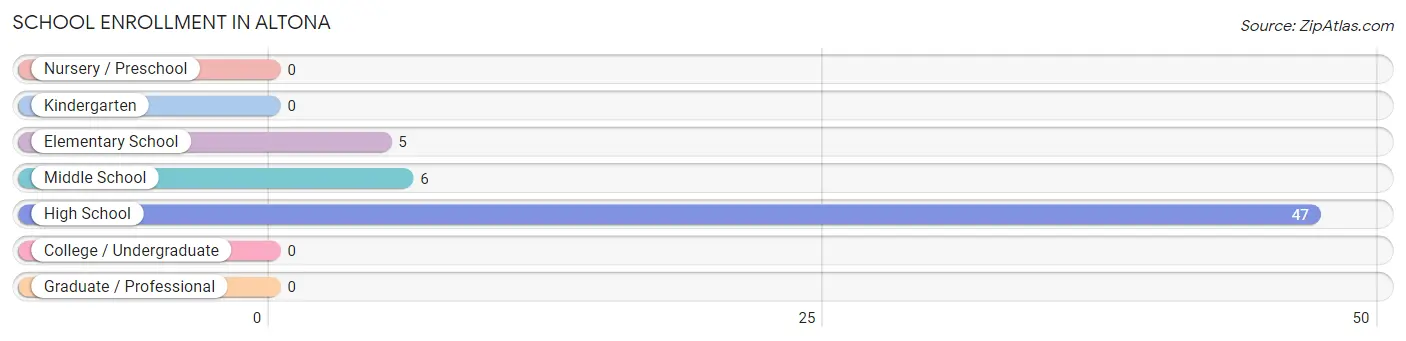
| School Level | # Students | % Students |
| Nursery / Preschool | 0 | 0.0% |
| Kindergarten | 0 | 0.0% |
| Elementary School | 5 | 8.6% |
| Middle School | 6 | 10.3% |
| High School | 47 | 81.0% |
| College / Undergraduate | 0 | 0.0% |
| Graduate / Professional | 0 | 0.0% |
| Total | 58 | 100.0% |
School Enrollment by Age by Funding Source in Altona
Out of a total of 58 students who are enrolled in schools in Altona, 6 (10.3%) attend a private institution, while the remaining 52 (89.7%) are enrolled in public schools. The age group of 10 to 14 year olds has the highest likelihood of being enrolled in private schools, with 6 (100.0% in the age bracket) enrolled. Conversely, the age group of 5 to 9 year old has the lowest likelihood of being enrolled in a private school, with 5 (100.0% in the age bracket) attending a public institution.
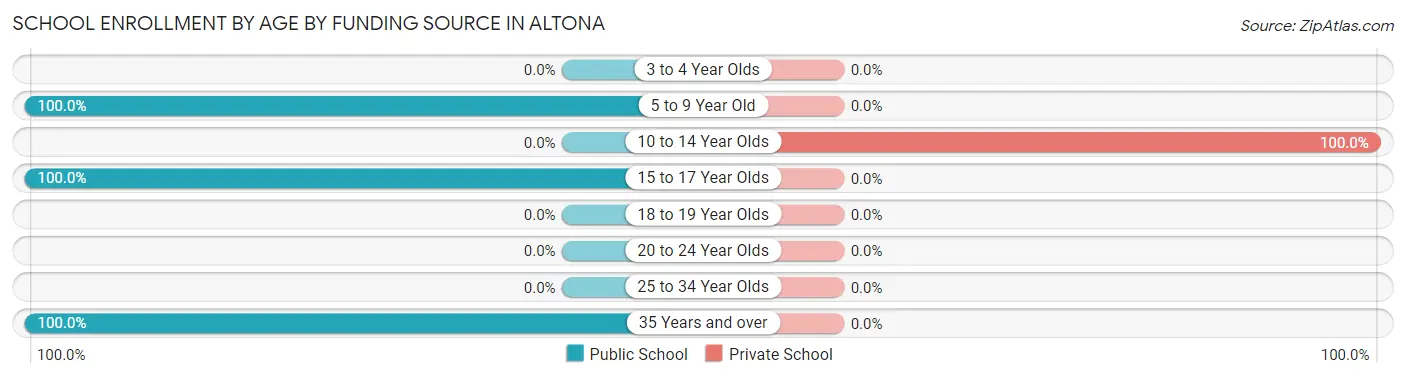
| Age Bracket | Public School | Private School |
| 3 to 4 Year Olds | 0 (0.0%) | 0 (0.0%) |
| 5 to 9 Year Old | 5 (100.0%) | 0 (0.0%) |
| 10 to 14 Year Olds | 0 (0.0%) | 6 (100.0%) |
| 15 to 17 Year Olds | 32 (100.0%) | 0 (0.0%) |
| 18 to 19 Year Olds | 0 (0.0%) | 0 (0.0%) |
| 20 to 24 Year Olds | 0 (0.0%) | 0 (0.0%) |
| 25 to 34 Year Olds | 0 (0.0%) | 0 (0.0%) |
| 35 Years and over | 15 (100.0%) | 0 (0.0%) |
| Total | 52 (89.7%) | 6 (10.3%) |
Educational Attainment by Field of Study in Altona
Business (10 | 50.0%), bio, nature & agricultural (4 | 20.0%), arts & humanities (4 | 20.0%), and engineering (2 | 10.0%) are the most common fields of study among 20 individuals in Altona who have obtained a bachelor's degree or higher.
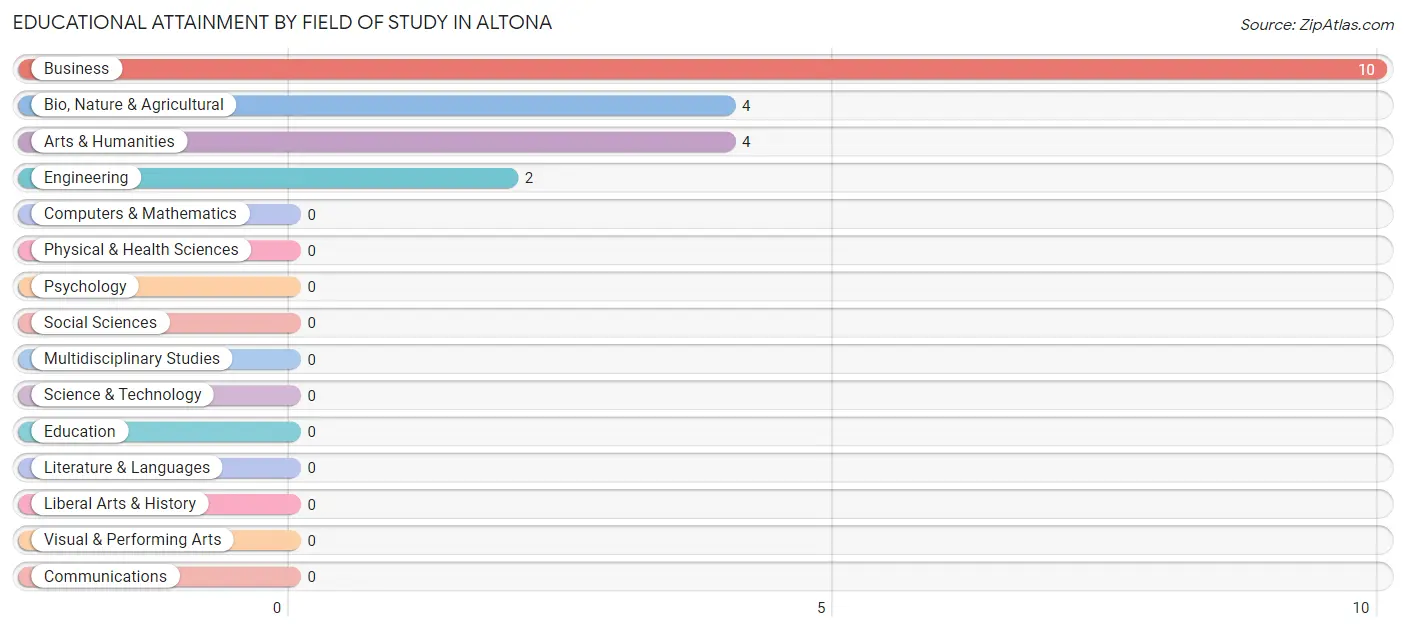
| Field of Study | # Graduates | % Graduates |
| Computers & Mathematics | 0 | 0.0% |
| Bio, Nature & Agricultural | 4 | 20.0% |
| Physical & Health Sciences | 0 | 0.0% |
| Psychology | 0 | 0.0% |
| Social Sciences | 0 | 0.0% |
| Engineering | 2 | 10.0% |
| Multidisciplinary Studies | 0 | 0.0% |
| Science & Technology | 0 | 0.0% |
| Business | 10 | 50.0% |
| Education | 0 | 0.0% |
| Literature & Languages | 0 | 0.0% |
| Liberal Arts & History | 0 | 0.0% |
| Visual & Performing Arts | 0 | 0.0% |
| Communications | 0 | 0.0% |
| Arts & Humanities | 4 | 20.0% |
| Total | 20 | 100.0% |
Transportation & Commute in Altona
Vehicle Availability by Sex in Altona
The most prevalent vehicle ownership categories in Altona are males with 2 vehicles (79, accounting for 71.8%) and females with 2 vehicles (7, making up 219.4%).
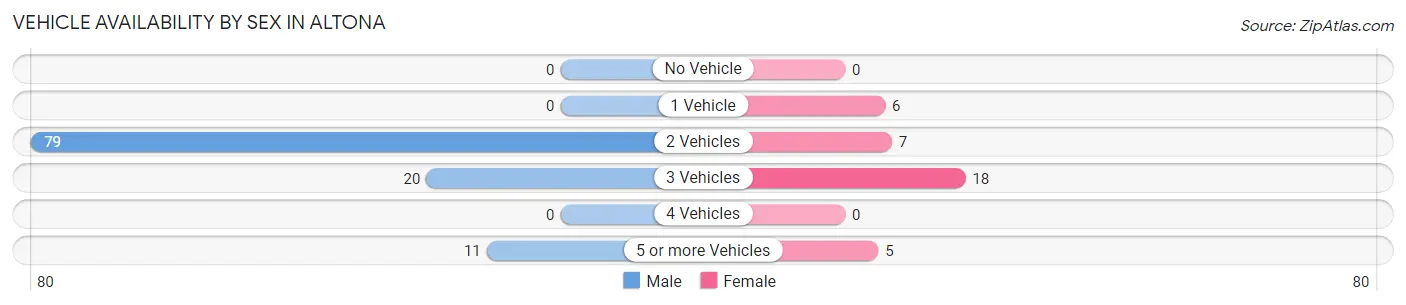
| Vehicles Available | Male | Female |
| No Vehicle | 0 (0.0%) | 0 (0.0%) |
| 1 Vehicle | 0 (0.0%) | 6 (16.7%) |
| 2 Vehicles | 79 (71.8%) | 7 (19.4%) |
| 3 Vehicles | 20 (18.2%) | 18 (50.0%) |
| 4 Vehicles | 0 (0.0%) | 0 (0.0%) |
| 5 or more Vehicles | 11 (10.0%) | 5 (13.9%) |
| Total | 110 (100.0%) | 36 (100.0%) |
Commute Time in Altona
The most frequently occuring commute durations in Altona are 25 to 29 minutes (72 commuters, 51.4%), 30 to 34 minutes (31 commuters, 22.1%), and 20 to 24 minutes (19 commuters, 13.6%).
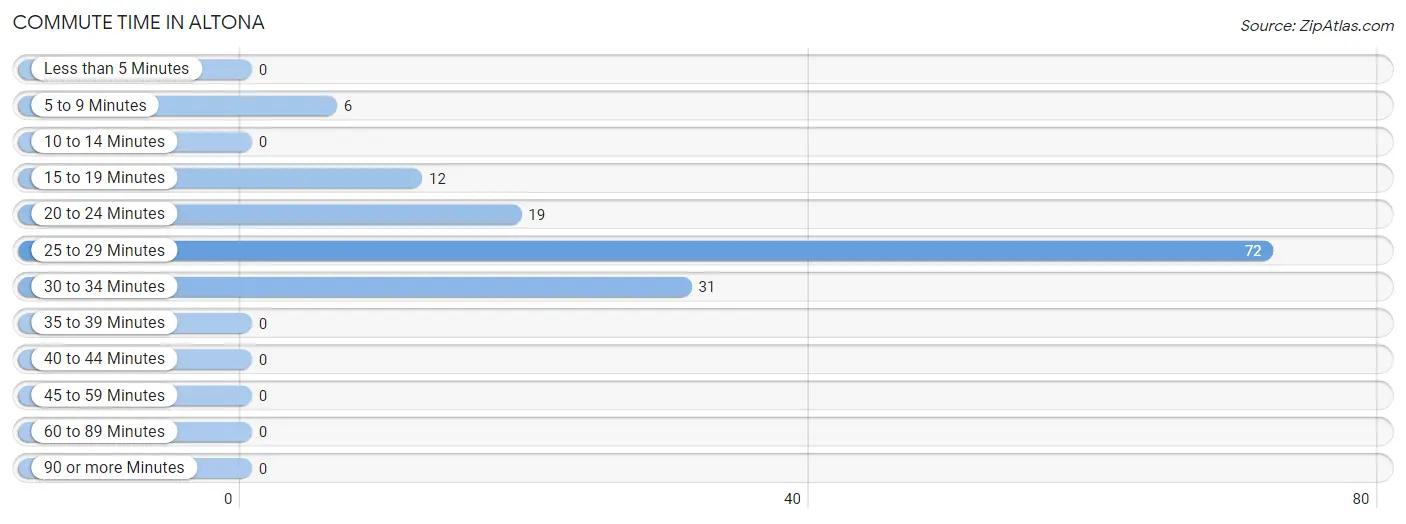
| Commute Time | # Commuters | % Commuters |
| Less than 5 Minutes | 0 | 0.0% |
| 5 to 9 Minutes | 6 | 4.3% |
| 10 to 14 Minutes | 0 | 0.0% |
| 15 to 19 Minutes | 12 | 8.6% |
| 20 to 24 Minutes | 19 | 13.6% |
| 25 to 29 Minutes | 72 | 51.4% |
| 30 to 34 Minutes | 31 | 22.1% |
| 35 to 39 Minutes | 0 | 0.0% |
| 40 to 44 Minutes | 0 | 0.0% |
| 45 to 59 Minutes | 0 | 0.0% |
| 60 to 89 Minutes | 0 | 0.0% |
| 90 or more Minutes | 0 | 0.0% |
Commute Time by Sex in Altona
The most common commute times in Altona are 25 to 29 minutes (65 commuters, 59.1%) for males and 30 to 34 minutes (17 commuters, 56.7%) for females.
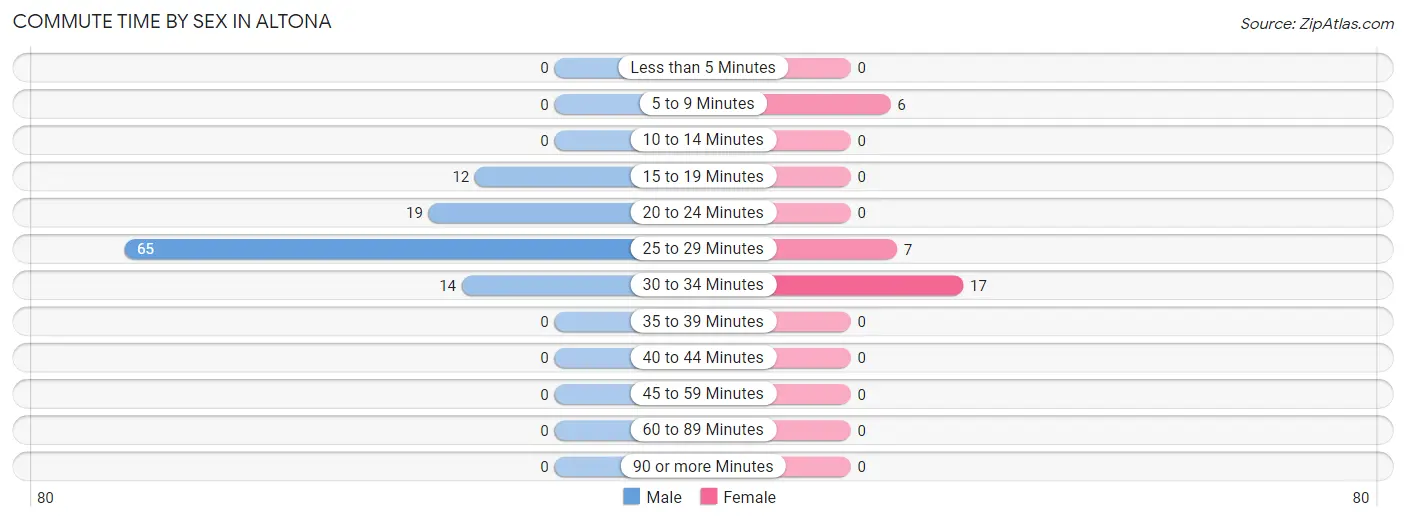
| Commute Time | Male | Female |
| Less than 5 Minutes | 0 (0.0%) | 0 (0.0%) |
| 5 to 9 Minutes | 0 (0.0%) | 6 (20.0%) |
| 10 to 14 Minutes | 0 (0.0%) | 0 (0.0%) |
| 15 to 19 Minutes | 12 (10.9%) | 0 (0.0%) |
| 20 to 24 Minutes | 19 (17.3%) | 0 (0.0%) |
| 25 to 29 Minutes | 65 (59.1%) | 7 (23.3%) |
| 30 to 34 Minutes | 14 (12.7%) | 17 (56.7%) |
| 35 to 39 Minutes | 0 (0.0%) | 0 (0.0%) |
| 40 to 44 Minutes | 0 (0.0%) | 0 (0.0%) |
| 45 to 59 Minutes | 0 (0.0%) | 0 (0.0%) |
| 60 to 89 Minutes | 0 (0.0%) | 0 (0.0%) |
| 90 or more Minutes | 0 (0.0%) | 0 (0.0%) |
Time of Departure to Work by Sex in Altona
The most frequent times of departure to work in Altona are 6:30 AM to 6:59 AM (76, 69.1%) for males and 7:00 AM to 7:29 AM (12, 40.0%) for females.
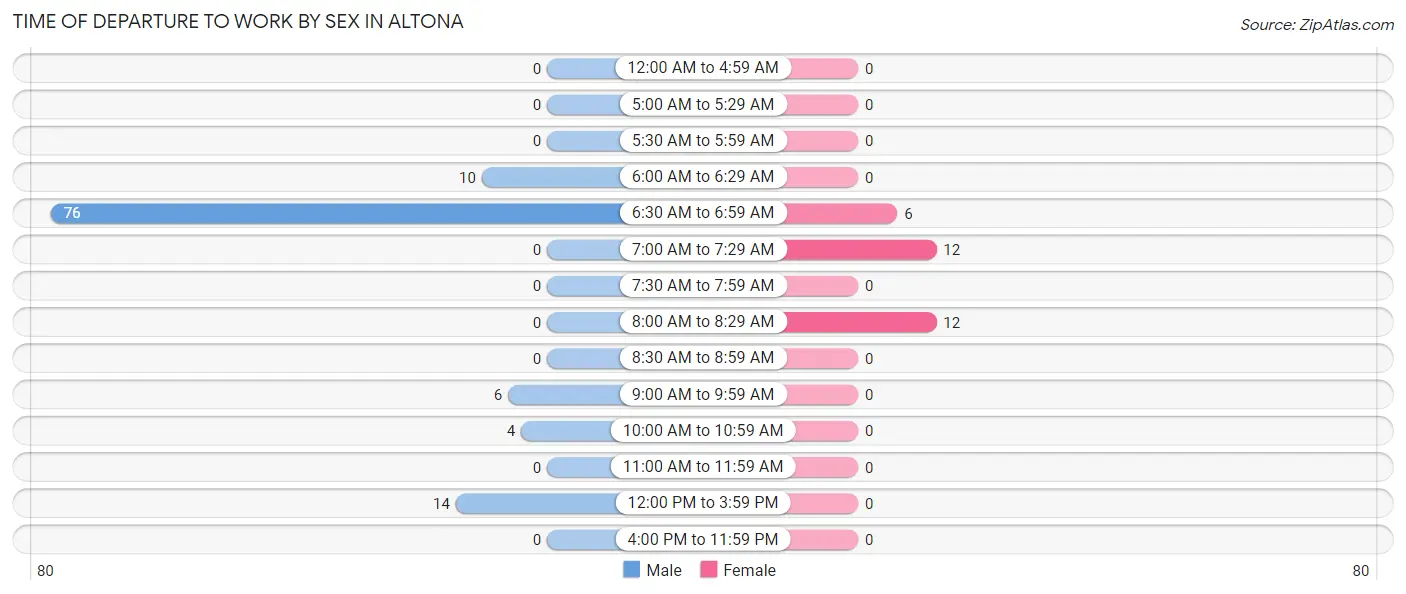
| Time of Departure | Male | Female |
| 12:00 AM to 4:59 AM | 0 (0.0%) | 0 (0.0%) |
| 5:00 AM to 5:29 AM | 0 (0.0%) | 0 (0.0%) |
| 5:30 AM to 5:59 AM | 0 (0.0%) | 0 (0.0%) |
| 6:00 AM to 6:29 AM | 10 (9.1%) | 0 (0.0%) |
| 6:30 AM to 6:59 AM | 76 (69.1%) | 6 (20.0%) |
| 7:00 AM to 7:29 AM | 0 (0.0%) | 12 (40.0%) |
| 7:30 AM to 7:59 AM | 0 (0.0%) | 0 (0.0%) |
| 8:00 AM to 8:29 AM | 0 (0.0%) | 12 (40.0%) |
| 8:30 AM to 8:59 AM | 0 (0.0%) | 0 (0.0%) |
| 9:00 AM to 9:59 AM | 6 (5.4%) | 0 (0.0%) |
| 10:00 AM to 10:59 AM | 4 (3.6%) | 0 (0.0%) |
| 11:00 AM to 11:59 AM | 0 (0.0%) | 0 (0.0%) |
| 12:00 PM to 3:59 PM | 14 (12.7%) | 0 (0.0%) |
| 4:00 PM to 11:59 PM | 0 (0.0%) | 0 (0.0%) |
| Total | 110 (100.0%) | 30 (100.0%) |
Housing Occupancy in Altona
Occupancy by Ownership in Altona
Of the total 108 dwellings in Altona, owner-occupied units account for 56 (51.8%), while renter-occupied units make up 52 (48.1%).
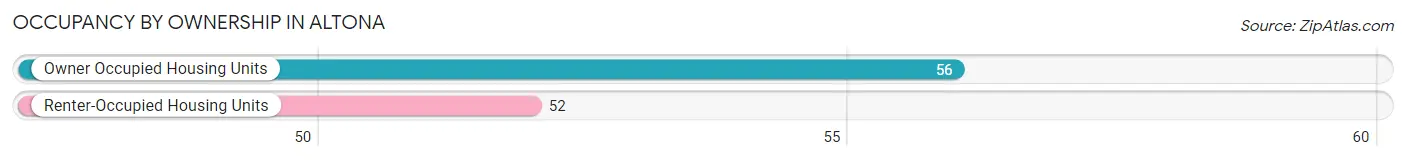
| Occupancy | # Housing Units | % Housing Units |
| Owner Occupied Housing Units | 56 | 51.8% |
| Renter-Occupied Housing Units | 52 | 48.1% |
| Total Occupied Housing Units | 108 | 100.0% |
Occupancy by Household Size in Altona
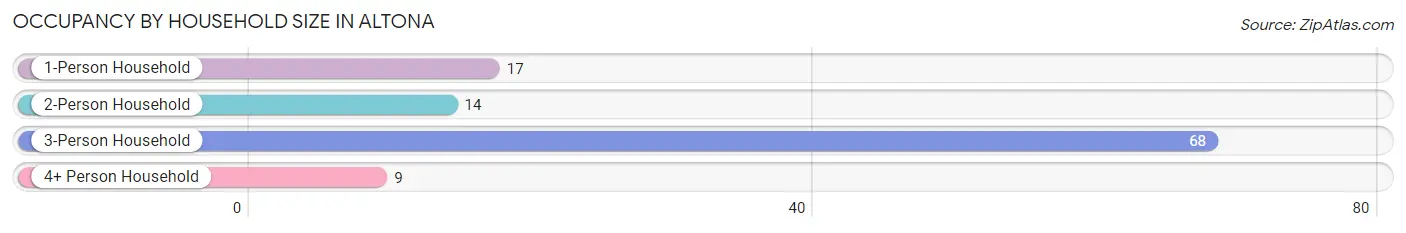
| Household Size | # Housing Units | % Housing Units |
| 1-Person Household | 17 | 15.7% |
| 2-Person Household | 14 | 13.0% |
| 3-Person Household | 68 | 63.0% |
| 4+ Person Household | 9 | 8.3% |
| Total Housing Units | 108 | 100.0% |
Occupancy by Ownership by Household Size in Altona
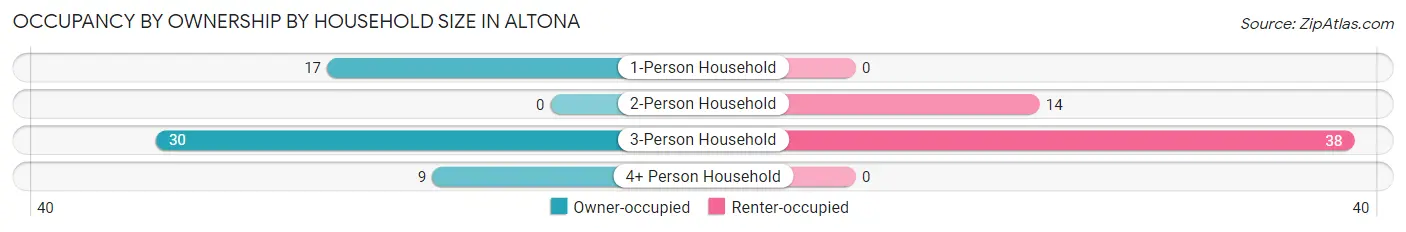
| Household Size | Owner-occupied | Renter-occupied |
| 1-Person Household | 17 (100.0%) | 0 (0.0%) |
| 2-Person Household | 0 (0.0%) | 14 (100.0%) |
| 3-Person Household | 30 (44.1%) | 38 (55.9%) |
| 4+ Person Household | 9 (100.0%) | 0 (0.0%) |
| Total Housing Units | 56 (51.8%) | 52 (48.1%) |
Occupancy by Educational Attainment in Altona
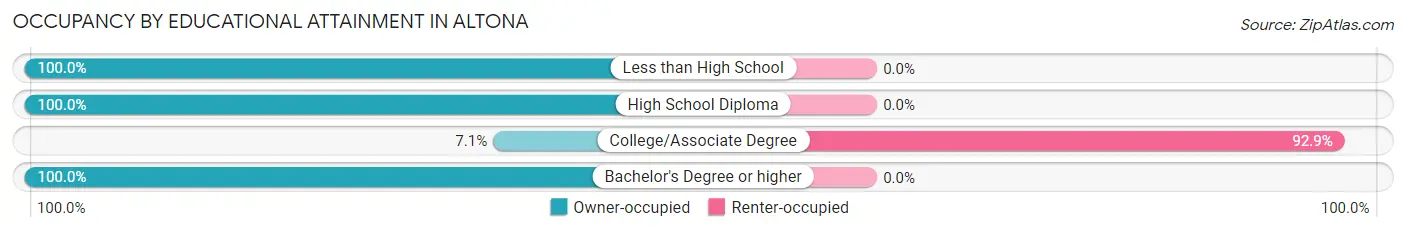
| Household Size | Owner-occupied | Renter-occupied |
| Less than High School | 18 (100.0%) | 0 (0.0%) |
| High School Diploma | 30 (100.0%) | 0 (0.0%) |
| College/Associate Degree | 4 (7.1%) | 52 (92.9%) |
| Bachelor's Degree or higher | 4 (100.0%) | 0 (0.0%) |
Occupancy by Age of Householder in Altona
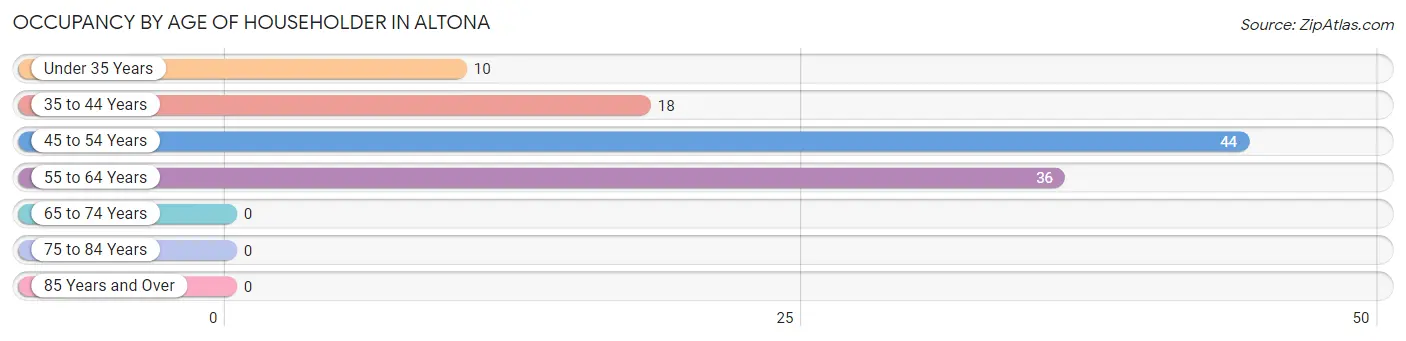
| Age Bracket | # Households | % Households |
| Under 35 Years | 10 | 9.3% |
| 35 to 44 Years | 18 | 16.7% |
| 45 to 54 Years | 44 | 40.7% |
| 55 to 64 Years | 36 | 33.3% |
| 65 to 74 Years | 0 | 0.0% |
| 75 to 84 Years | 0 | 0.0% |
| 85 Years and Over | 0 | 0.0% |
| Total | 108 | 100.0% |
Housing Finances in Altona
Median Income by Occupancy in Altona
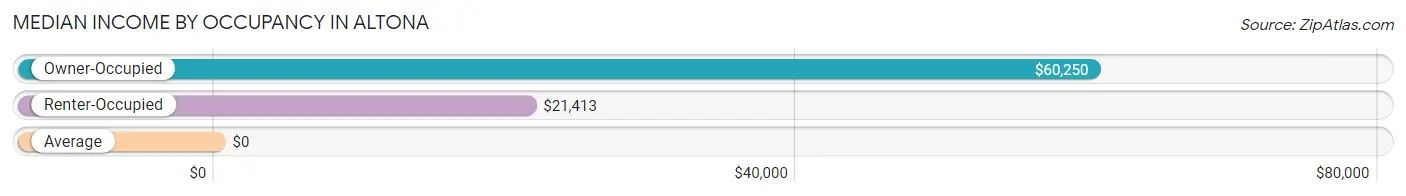
| Occupancy Type | # Households | Median Income |
| Owner-Occupied | 56 (51.8%) | $60,250 |
| Renter-Occupied | 52 (48.1%) | $21,413 |
| Average | 108 (100.0%) | $0 |
Occupancy by Householder Income Bracket in Altona
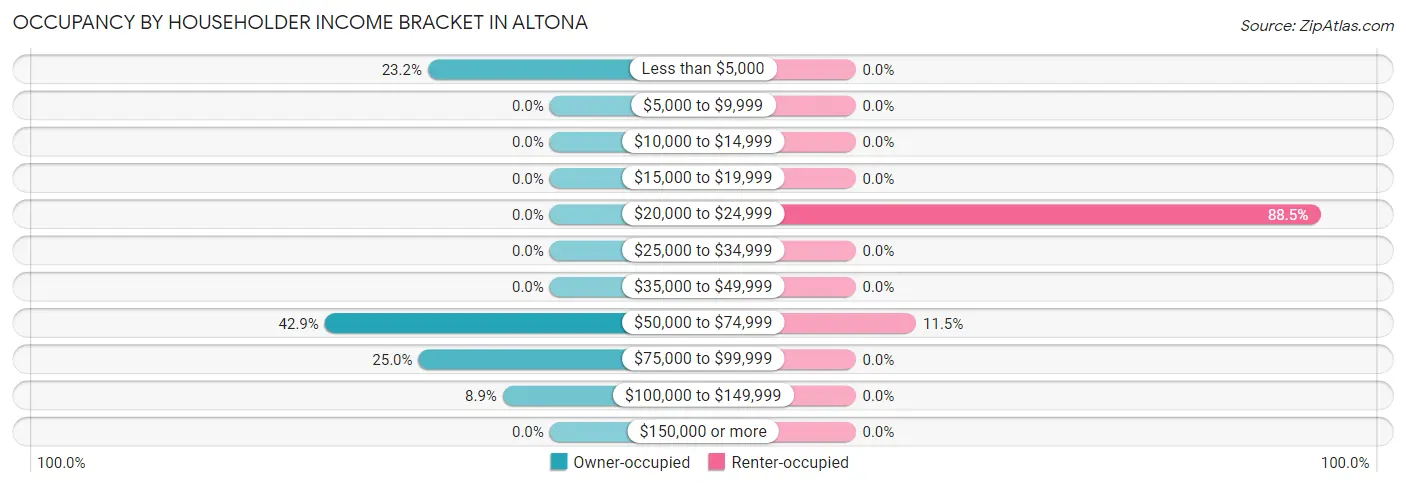
| Income Bracket | Owner-occupied | Renter-occupied |
| Less than $5,000 | 13 (23.2%) | 0 (0.0%) |
| $5,000 to $9,999 | 0 (0.0%) | 0 (0.0%) |
| $10,000 to $14,999 | 0 (0.0%) | 0 (0.0%) |
| $15,000 to $19,999 | 0 (0.0%) | 0 (0.0%) |
| $20,000 to $24,999 | 0 (0.0%) | 46 (88.5%) |
| $25,000 to $34,999 | 0 (0.0%) | 0 (0.0%) |
| $35,000 to $49,999 | 0 (0.0%) | 0 (0.0%) |
| $50,000 to $74,999 | 24 (42.9%) | 6 (11.5%) |
| $75,000 to $99,999 | 14 (25.0%) | 0 (0.0%) |
| $100,000 to $149,999 | 5 (8.9%) | 0 (0.0%) |
| $150,000 or more | 0 (0.0%) | 0 (0.0%) |
| Total | 56 (100.0%) | 52 (100.0%) |
Monthly Housing Cost Tiers in Altona
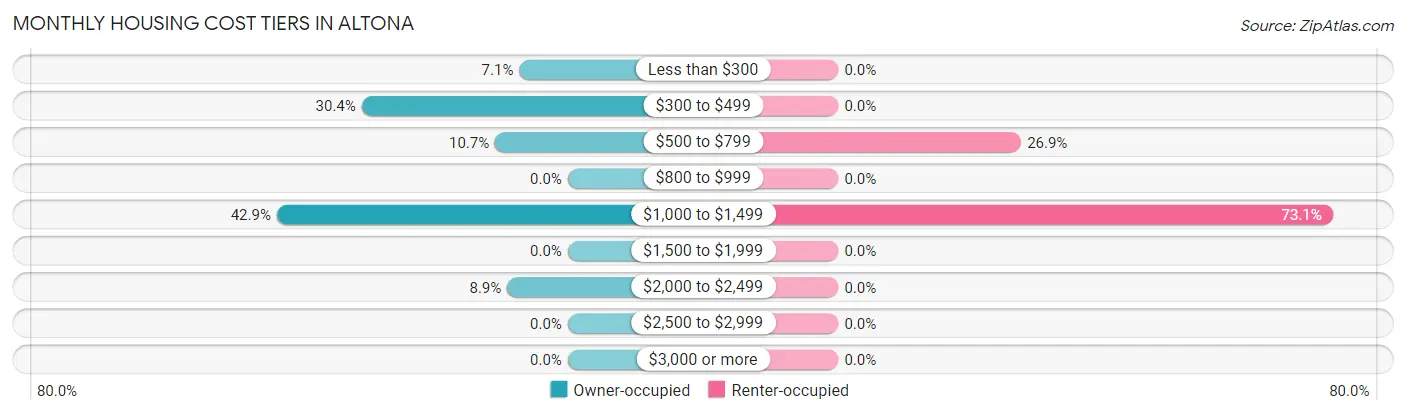
| Monthly Cost | Owner-occupied | Renter-occupied |
| Less than $300 | 4 (7.1%) | 0 (0.0%) |
| $300 to $499 | 17 (30.4%) | 0 (0.0%) |
| $500 to $799 | 6 (10.7%) | 14 (26.9%) |
| $800 to $999 | 0 (0.0%) | 0 (0.0%) |
| $1,000 to $1,499 | 24 (42.9%) | 38 (73.1%) |
| $1,500 to $1,999 | 0 (0.0%) | 0 (0.0%) |
| $2,000 to $2,499 | 5 (8.9%) | 0 (0.0%) |
| $2,500 to $2,999 | 0 (0.0%) | 0 (0.0%) |
| $3,000 or more | 0 (0.0%) | 0 (0.0%) |
| Total | 56 (100.0%) | 52 (100.0%) |
Physical Housing Characteristics in Altona
Housing Structures in Altona
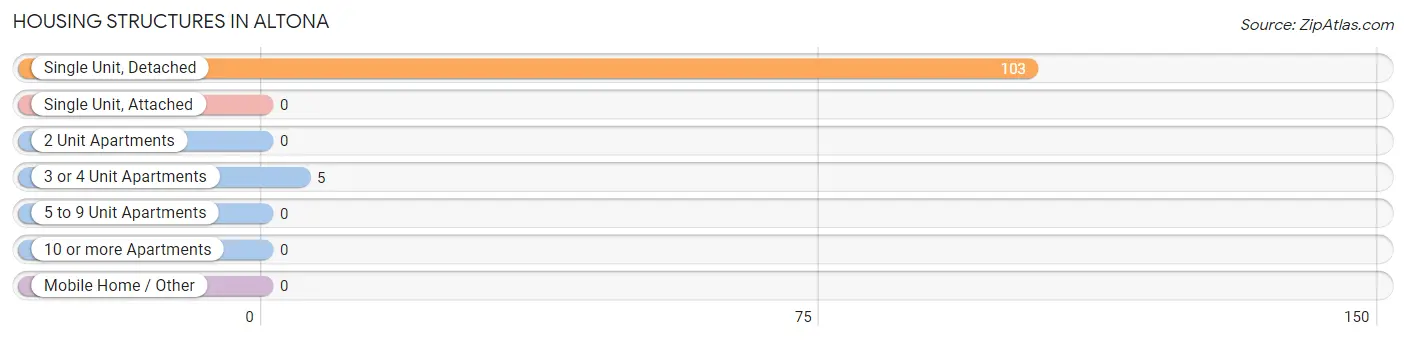
| Structure Type | # Housing Units | % Housing Units |
| Single Unit, Detached | 103 | 95.4% |
| Single Unit, Attached | 0 | 0.0% |
| 2 Unit Apartments | 0 | 0.0% |
| 3 or 4 Unit Apartments | 5 | 4.6% |
| 5 to 9 Unit Apartments | 0 | 0.0% |
| 10 or more Apartments | 0 | 0.0% |
| Mobile Home / Other | 0 | 0.0% |
| Total | 108 | 100.0% |
Housing Structures by Occupancy in Altona
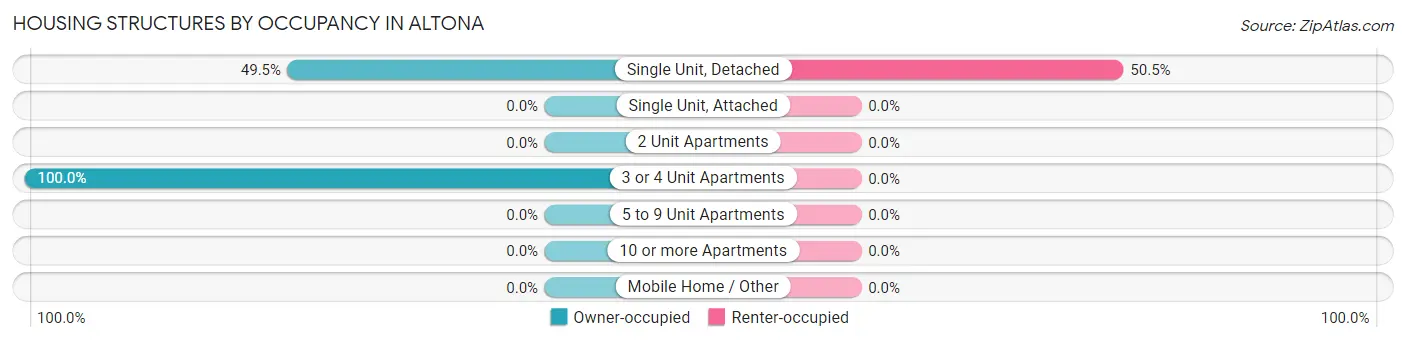
| Structure Type | Owner-occupied | Renter-occupied |
| Single Unit, Detached | 51 (49.5%) | 52 (50.5%) |
| Single Unit, Attached | 0 (0.0%) | 0 (0.0%) |
| 2 Unit Apartments | 0 (0.0%) | 0 (0.0%) |
| 3 or 4 Unit Apartments | 5 (100.0%) | 0 (0.0%) |
| 5 to 9 Unit Apartments | 0 (0.0%) | 0 (0.0%) |
| 10 or more Apartments | 0 (0.0%) | 0 (0.0%) |
| Mobile Home / Other | 0 (0.0%) | 0 (0.0%) |
| Total | 56 (51.8%) | 52 (48.1%) |
Housing Structures by Number of Rooms in Altona
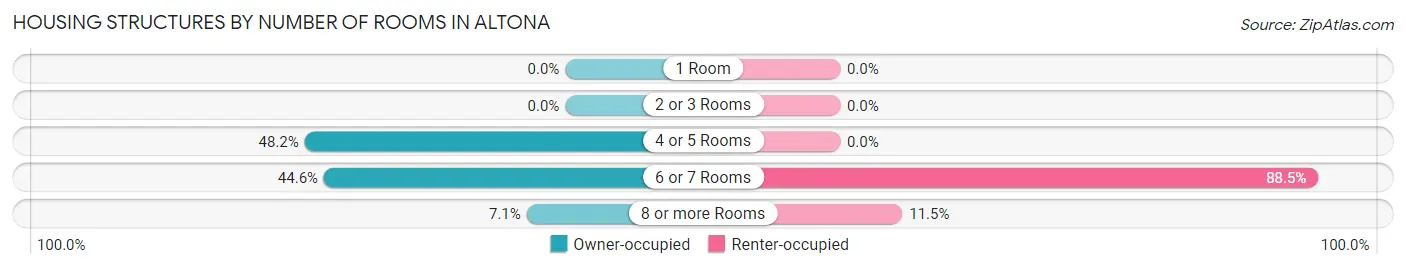
| Number of Rooms | Owner-occupied | Renter-occupied |
| 1 Room | 0 (0.0%) | 0 (0.0%) |
| 2 or 3 Rooms | 0 (0.0%) | 0 (0.0%) |
| 4 or 5 Rooms | 27 (48.2%) | 0 (0.0%) |
| 6 or 7 Rooms | 25 (44.6%) | 46 (88.5%) |
| 8 or more Rooms | 4 (7.1%) | 6 (11.5%) |
| Total | 56 (100.0%) | 52 (100.0%) |
Housing Structure by Heating Type in Altona
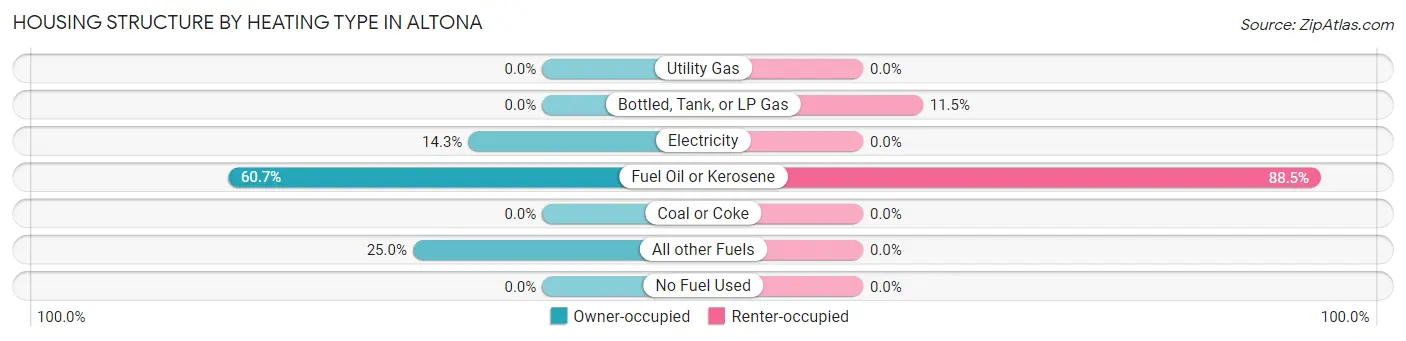
| Heating Type | Owner-occupied | Renter-occupied |
| Utility Gas | 0 (0.0%) | 0 (0.0%) |
| Bottled, Tank, or LP Gas | 0 (0.0%) | 6 (11.5%) |
| Electricity | 8 (14.3%) | 0 (0.0%) |
| Fuel Oil or Kerosene | 34 (60.7%) | 46 (88.5%) |
| Coal or Coke | 0 (0.0%) | 0 (0.0%) |
| All other Fuels | 14 (25.0%) | 0 (0.0%) |
| No Fuel Used | 0 (0.0%) | 0 (0.0%) |
| Total | 56 (100.0%) | 52 (100.0%) |
Household Vehicle Usage in Altona
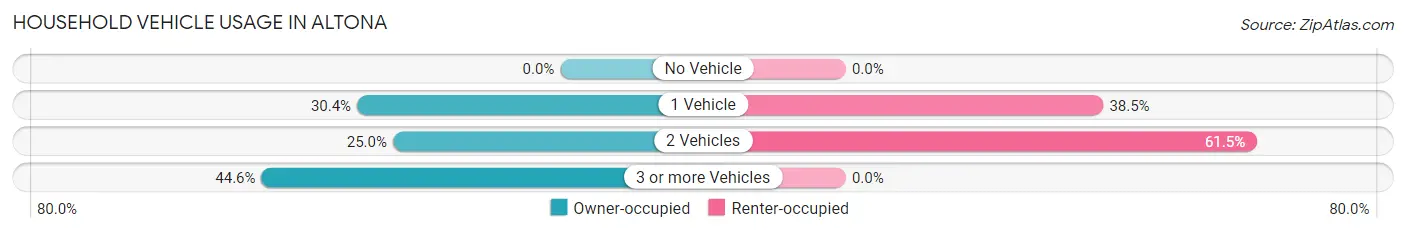
| Vehicles per Household | Owner-occupied | Renter-occupied |
| No Vehicle | 0 (0.0%) | 0 (0.0%) |
| 1 Vehicle | 17 (30.4%) | 20 (38.5%) |
| 2 Vehicles | 14 (25.0%) | 32 (61.5%) |
| 3 or more Vehicles | 25 (44.6%) | 0 (0.0%) |
| Total | 56 (100.0%) | 52 (100.0%) |
Real Estate & Mortgages in Altona
Real Estate and Mortgage Overview in Altona
| Characteristic | Without Mortgage | With Mortgage |
| Housing Units | 21 | 35 |
| Median Property Value | - | - |
| Median Household Income | $2,499 | $0 |
| Monthly Housing Costs | $325 | $0 |
| Real Estate Taxes | - | - |
Property Value by Mortgage Status in Altona
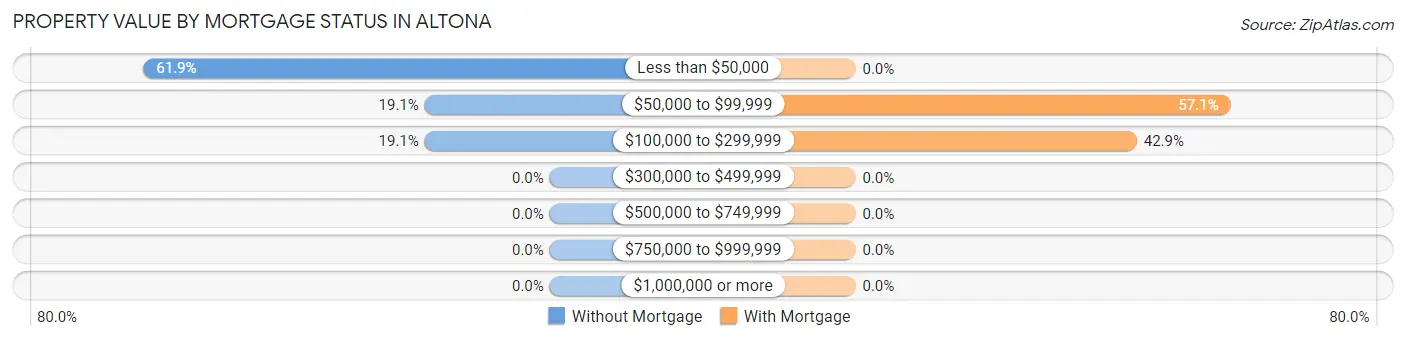
| Property Value | Without Mortgage | With Mortgage |
| Less than $50,000 | 13 (61.9%) | 0 (0.0%) |
| $50,000 to $99,999 | 4 (19.1%) | 20 (57.1%) |
| $100,000 to $299,999 | 4 (19.1%) | 15 (42.9%) |
| $300,000 to $499,999 | 0 (0.0%) | 0 (0.0%) |
| $500,000 to $749,999 | 0 (0.0%) | 0 (0.0%) |
| $750,000 to $999,999 | 0 (0.0%) | 0 (0.0%) |
| $1,000,000 or more | 0 (0.0%) | 0 (0.0%) |
| Total | 21 (100.0%) | 35 (100.0%) |
Household Income by Mortgage Status in Altona
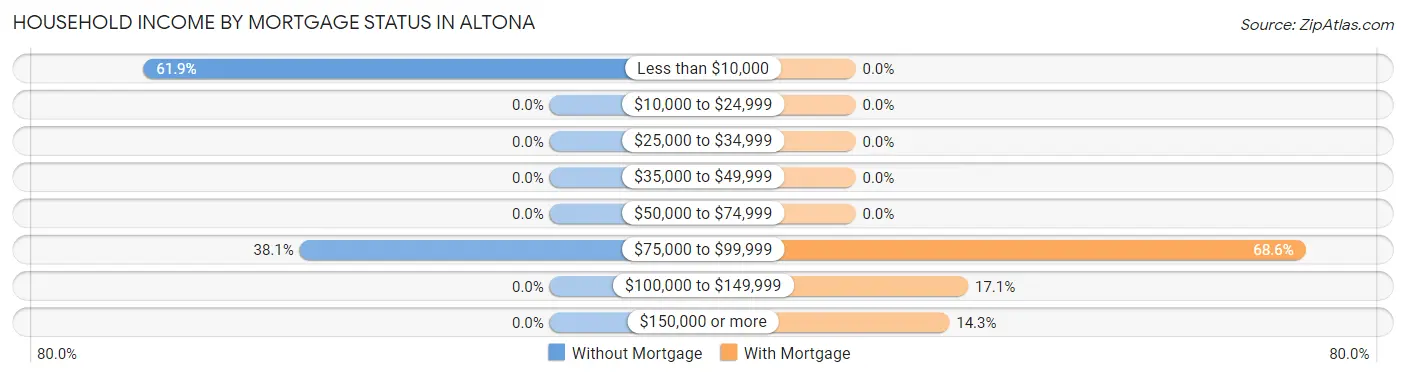
| Household Income | Without Mortgage | With Mortgage |
| Less than $10,000 | 13 (61.9%) | 0 (0.0%) |
| $10,000 to $24,999 | 0 (0.0%) | 0 (0.0%) |
| $25,000 to $34,999 | 0 (0.0%) | 0 (0.0%) |
| $35,000 to $49,999 | 0 (0.0%) | 0 (0.0%) |
| $50,000 to $74,999 | 0 (0.0%) | 0 (0.0%) |
| $75,000 to $99,999 | 8 (38.1%) | 24 (68.6%) |
| $100,000 to $149,999 | 0 (0.0%) | 6 (17.1%) |
| $150,000 or more | 0 (0.0%) | 5 (14.3%) |
| Total | 21 (100.0%) | 35 (100.0%) |
Property Value to Household Income Ratio in Altona
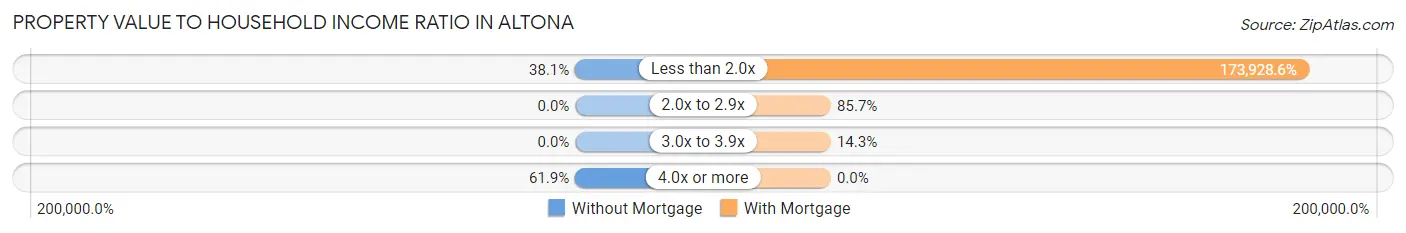
| Value-to-Income Ratio | Without Mortgage | With Mortgage |
| Less than 2.0x | 8 (38.1%) | 60,875 (173,928.6%) |
| 2.0x to 2.9x | 0 (0.0%) | 30 (85.7%) |
| 3.0x to 3.9x | 0 (0.0%) | 5 (14.3%) |
| 4.0x or more | 13 (61.9%) | 0 (0.0%) |
| Total | 21 (100.0%) | 35 (100.0%) |
Real Estate Taxes by Mortgage Status in Altona
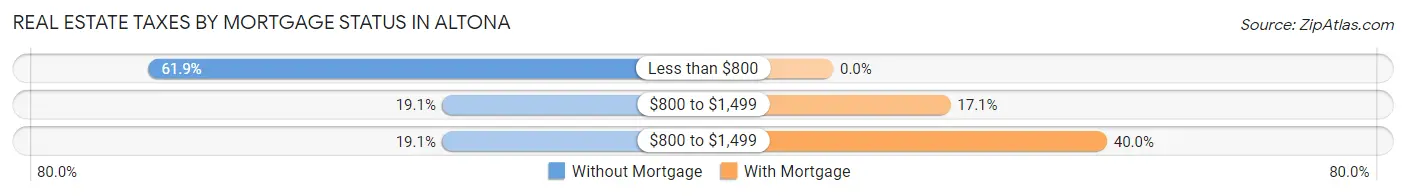
| Property Taxes | Without Mortgage | With Mortgage |
| Less than $800 | 13 (61.9%) | 0 (0.0%) |
| $800 to $1,499 | 4 (19.1%) | 6 (17.1%) |
| $800 to $1,499 | 4 (19.1%) | 14 (40.0%) |
| Total | 21 (100.0%) | 35 (100.0%) |
Health & Disability in Altona
Health Insurance Coverage by Age in Altona
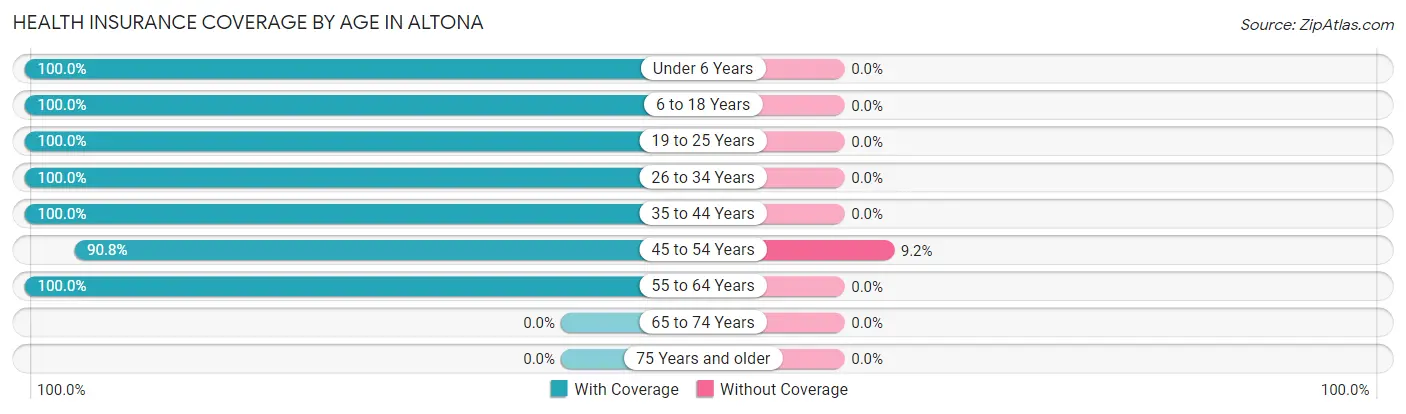
| Age Bracket | With Coverage | Without Coverage |
| Under 6 Years | 20 (100.0%) | 0 (0.0%) |
| 6 to 18 Years | 43 (100.0%) | 0 (0.0%) |
| 19 to 25 Years | 96 (100.0%) | 0 (0.0%) |
| 26 to 34 Years | 12 (100.0%) | 0 (0.0%) |
| 35 to 44 Years | 27 (100.0%) | 0 (0.0%) |
| 45 to 54 Years | 59 (90.8%) | 6 (9.2%) |
| 55 to 64 Years | 41 (100.0%) | 0 (0.0%) |
| 65 to 74 Years | 0 (0.0%) | 0 (0.0%) |
| 75 Years and older | 0 (0.0%) | 0 (0.0%) |
| Total | 298 (98.0%) | 6 (2.0%) |
Health Insurance Coverage by Citizenship Status in Altona

| Citizenship Status | With Coverage | Without Coverage |
| Native Born | 20 (100.0%) | 0 (0.0%) |
| Foreign Born, Citizen | 43 (100.0%) | 0 (0.0%) |
| Foreign Born, not a Citizen | 96 (100.0%) | 0 (0.0%) |
Health Insurance Coverage by Household Income in Altona
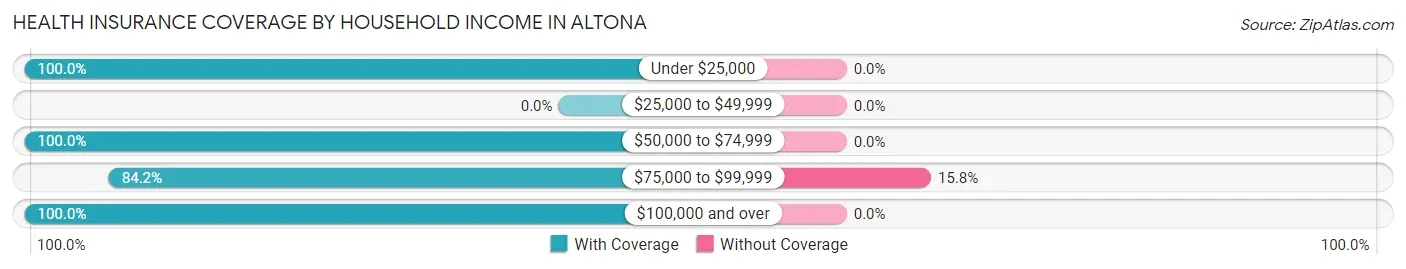
| Household Income | With Coverage | Without Coverage |
| Under $25,000 | 166 (100.0%) | 0 (0.0%) |
| $25,000 to $49,999 | 0 (0.0%) | 0 (0.0%) |
| $50,000 to $74,999 | 79 (100.0%) | 0 (0.0%) |
| $75,000 to $99,999 | 32 (84.2%) | 6 (15.8%) |
| $100,000 and over | 21 (100.0%) | 0 (0.0%) |
Public vs Private Health Insurance Coverage by Age in Altona
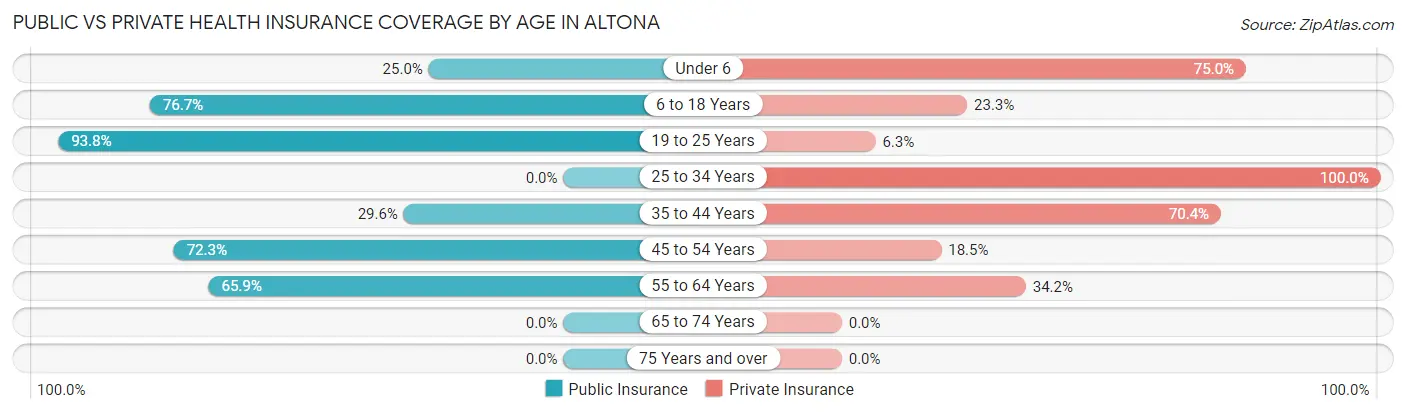
| Age Bracket | Public Insurance | Private Insurance |
| Under 6 | 5 (25.0%) | 15 (75.0%) |
| 6 to 18 Years | 33 (76.7%) | 10 (23.3%) |
| 19 to 25 Years | 90 (93.8%) | 6 (6.2%) |
| 25 to 34 Years | 0 (0.0%) | 12 (100.0%) |
| 35 to 44 Years | 8 (29.6%) | 19 (70.4%) |
| 45 to 54 Years | 47 (72.3%) | 12 (18.5%) |
| 55 to 64 Years | 27 (65.8%) | 14 (34.2%) |
| 65 to 74 Years | 0 (0.0%) | 0 (0.0%) |
| 75 Years and over | 0 (0.0%) | 0 (0.0%) |
| Total | 210 (69.1%) | 88 (28.9%) |
Disability Status by Sex by Age in Altona
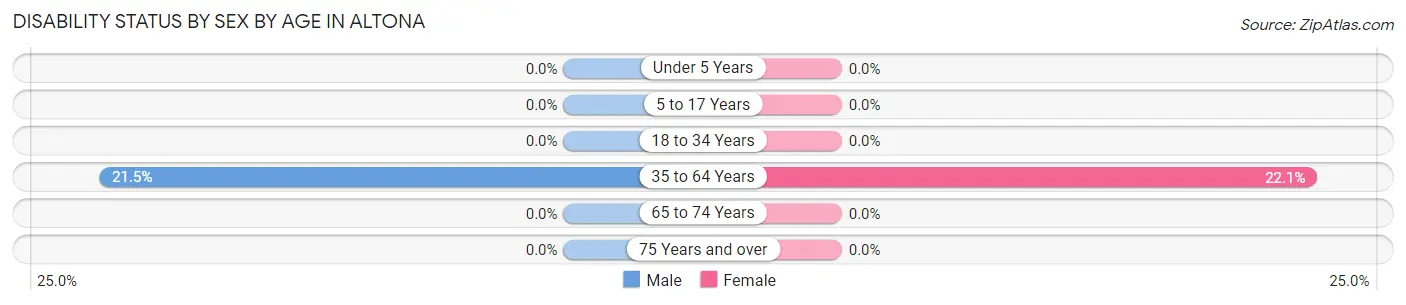
| Age Bracket | Male | Female |
| Under 5 Years | 0 (0.0%) | 0 (0.0%) |
| 5 to 17 Years | 0 (0.0%) | 0 (0.0%) |
| 18 to 34 Years | 0 (0.0%) | 0 (0.0%) |
| 35 to 64 Years | 14 (21.5%) | 15 (22.1%) |
| 65 to 74 Years | 0 (0.0%) | 0 (0.0%) |
| 75 Years and over | 0 (0.0%) | 0 (0.0%) |
Disability Class by Sex by Age in Altona
Disability Class: Hearing Difficulty
| Age Bracket | Male | Female |
| Under 5 Years | 0 (0.0%) | 0 (0.0%) |
| 5 to 17 Years | 0 (0.0%) | 0 (0.0%) |
| 18 to 34 Years | 0 (0.0%) | 0 (0.0%) |
| 35 to 64 Years | 0 (0.0%) | 0 (0.0%) |
| 65 to 74 Years | 0 (0.0%) | 0 (0.0%) |
| 75 Years and over | 0 (0.0%) | 0 (0.0%) |
Disability Class: Vision Difficulty
| Age Bracket | Male | Female |
| Under 5 Years | 0 (0.0%) | 0 (0.0%) |
| 5 to 17 Years | 0 (0.0%) | 0 (0.0%) |
| 18 to 34 Years | 0 (0.0%) | 0 (0.0%) |
| 35 to 64 Years | 0 (0.0%) | 15 (22.1%) |
| 65 to 74 Years | 0 (0.0%) | 0 (0.0%) |
| 75 Years and over | 0 (0.0%) | 0 (0.0%) |
Disability Class: Cognitive Difficulty
| Age Bracket | Male | Female |
| 5 to 17 Years | 0 (0.0%) | 0 (0.0%) |
| 18 to 34 Years | 0 (0.0%) | 0 (0.0%) |
| 35 to 64 Years | 0 (0.0%) | 15 (22.1%) |
| 65 to 74 Years | 0 (0.0%) | 0 (0.0%) |
| 75 Years and over | 0 (0.0%) | 0 (0.0%) |
Disability Class: Ambulatory Difficulty
| Age Bracket | Male | Female |
| 5 to 17 Years | 0 (0.0%) | 0 (0.0%) |
| 18 to 34 Years | 0 (0.0%) | 0 (0.0%) |
| 35 to 64 Years | 14 (21.5%) | 0 (0.0%) |
| 65 to 74 Years | 0 (0.0%) | 0 (0.0%) |
| 75 Years and over | 0 (0.0%) | 0 (0.0%) |
Disability Class: Self-Care Difficulty
| Age Bracket | Male | Female |
| 5 to 17 Years | 0 (0.0%) | 0 (0.0%) |
| 18 to 34 Years | 0 (0.0%) | 0 (0.0%) |
| 35 to 64 Years | 0 (0.0%) | 0 (0.0%) |
| 65 to 74 Years | 0 (0.0%) | 0 (0.0%) |
| 75 Years and over | 0 (0.0%) | 0 (0.0%) |
Technology Access in Altona
Computing Device Access in Altona
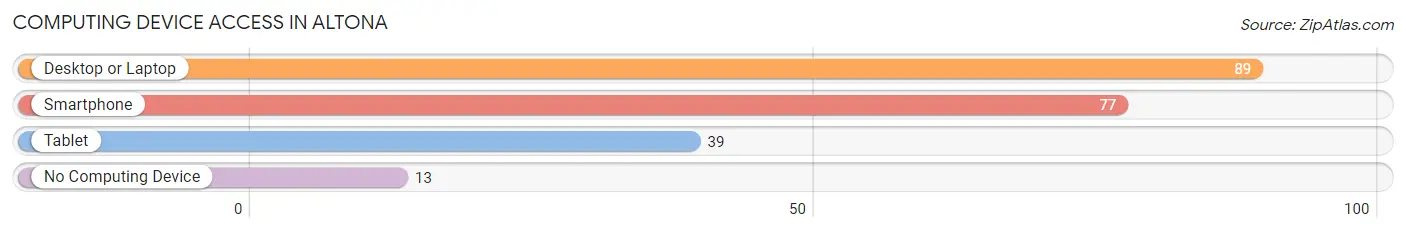
| Device Type | # Households | % Households |
| Desktop or Laptop | 89 | 82.4% |
| Smartphone | 77 | 71.3% |
| Tablet | 39 | 36.1% |
| No Computing Device | 13 | 12.0% |
| Total | 108 | 100.0% |
Internet Access in Altona
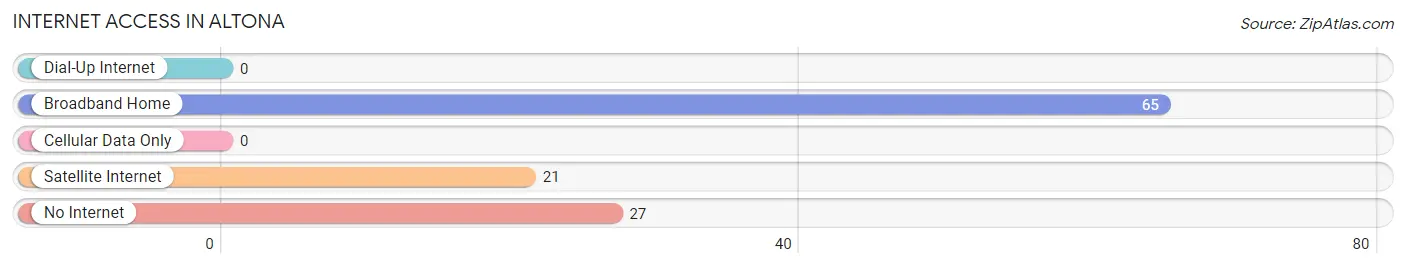
| Internet Type | # Households | % Households |
| Dial-Up Internet | 0 | 0.0% |
| Broadband Home | 65 | 60.2% |
| Cellular Data Only | 0 | 0.0% |
| Satellite Internet | 21 | 19.4% |
| No Internet | 27 | 25.0% |
| Total | 108 | 100.0% |
Altona Summary
Altona, New York is a small town located in Clinton County, in the northeastern part of the state. It is situated on the western shore of Lake Champlain, near the Canadian border. The town was first settled in 1790 and was incorporated in 1817. As of the 2010 census, the population of Altona was 1,845.
Geography
Altona is located at 44°48'N 73°30'W (44.8, -73.5). It is bordered by the towns of Chazy to the north, Mooers to the east, and Peru to the south. The town is situated on the western shore of Lake Champlain, and is part of the Adirondack Park. The Ausable River flows through the town, and the town is home to several small lakes, including Lake Altona, Lake Placid, and Lake Champlain.
The town has a total area of 36.2 square miles, of which 35.7 square miles is land and 0.5 square miles is water. The highest point in the town is an unnamed peak in the Adirondack Mountains, which has an elevation of 2,890 feet.
Demographics
As of the 2010 census, there were 1,845 people, 745 households, and 517 families residing in the town. The population density was 51.6 people per square mile. There were 845 housing units at an average density of 23.6 per square mile. The racial makeup of the town was 97.2% White, 0.3% African American, 0.3% Native American, 0.2% Asian, 0.1% Pacific Islander, 0.4% from other races, and 1.5% from two or more races. Hispanic or Latino of any race were 1.2% of the population.
There were 745 households, out of which 28.7% had children under the age of 18 living with them, 54.2% were married couples living together, 9.2% had a female householder with no husband present, and 31.2% were non-families. 25.7% of all households were made up of individuals, and 11.2% had someone living alone who was 65 years of age or older. The average household size was 2.47 and the average family size was 2.94.
The median age in the town was 42.3 years. 22.7% of residents were under the age of 18; 6.7% were between the ages of 18 and 24; 24.2% were from 25 to 44; 30.2% were from 45 to 64; and 16.2% were 65 years of age or older. The gender makeup of the town was 48.7% male and 51.3% female.
Economy
The economy of Altona is largely based on agriculture and tourism. The town is home to several dairy farms, as well as a number of apple orchards. The town is also home to several small businesses, including a general store, a hardware store, and a restaurant.
Tourism is an important part of the town's economy. The town is home to several popular attractions, including the Ausable Chasm, a natural gorge carved by the Ausable River, and the Ausable Point State Park, which offers camping, fishing, and boating. The town is also home to several historic sites, including the Altona Flat Iron, a historic iron ore furnace, and the Altona Grange Hall, a historic grange hall.
The town is served by the Ausable Valley Central School District, which includes the Ausable Valley High School. The town is also home to the Ausable Valley Community College, which offers a variety of courses and programs.
Altona is served by the Clinton County Airport, which is located in nearby Plattsburgh. The town is also served by several major highways, including Interstate 87, U.S. Route 9, and New York State Route 22.
Common Questions
What is Per Capita Income in Altona?
Per Capita income in Altona is $8,477.
What is Inequality or Gini Index in Altona?
Inequality or Gini Index in Altona is 0.41.
What is the Total Population of Altona?
Total Population of Altona is 657.
What is the Total Male Population of Altona?
Total Male Population of Altona is 570.
What is the Total Female Population of Altona?
Total Female Population of Altona is 87.
What is the Ratio of Males per 100 Females in Altona?
There are 655.17 Males per 100 Females in Altona.
What is the Ratio of Females per 100 Males in Altona?
There are 15.26 Females per 100 Males in Altona.
What is the Median Population Age in Altona?
Median Population Age in Altona is 35.5 Years.
What is the Average Family Size in Altona
Average Family Size in Altona is 3.0 People.
What is the Average Household Size in Altona
Average Household Size in Altona is 2.8 People.
How Large is the Labor Force in Altona?
There are 173 People in the Labor Forcein in Altona.
What is the Percentage of People in the Labor Force in Altona?
27.6% of People are in the Labor Force in Altona.
What is the Unemployment Rate in Altona?
Unemployment Rate in Altona is 15.6%.