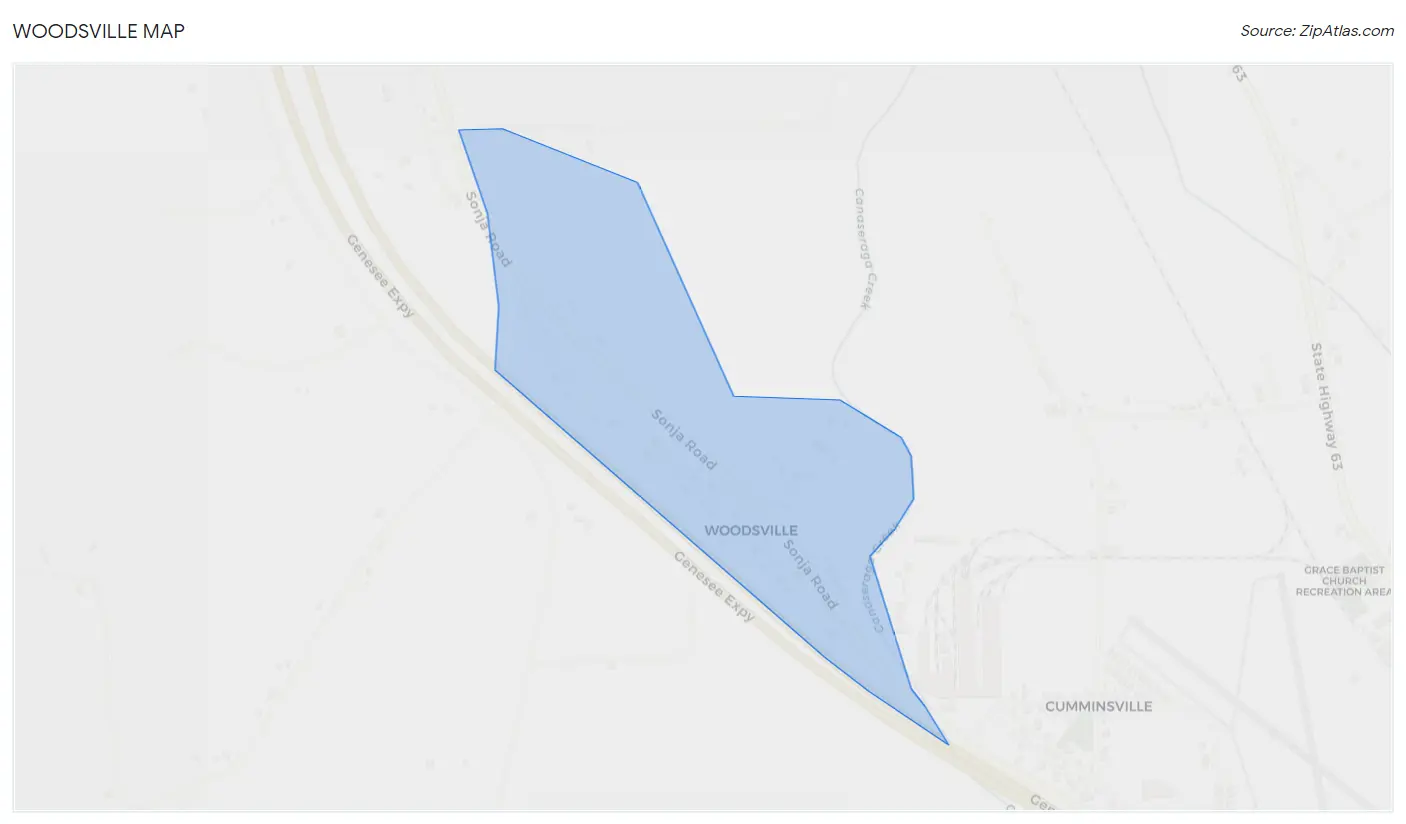
Woodsville, NY Map & Demographics
Woodsville Map
Woodsville Overview
$25,552
PER CAPITA INCOME
$51,146
AVG FAMILY INCOME
$51,667
AVG HOUSEHOLD INCOME
0.19
INEQUALITY / GINI INDEX
67
TOTAL POPULATION
31
MALE POPULATION
36
FEMALE POPULATION
86.11
MALES / 100 FEMALES
116.13
FEMALES / 100 MALES
48.8
MEDIAN AGE
2.8
AVG FAMILY SIZE
2.6
AVG HOUSEHOLD SIZE
29
LABOR FORCE [ PEOPLE ]
58.0%
PERCENT IN LABOR FORCE
Income in Woodsville
Income Overview in Woodsville
Per Capita Income in Woodsville is $25,552, while median incomes of families and households are $51,146 and $51,667 respectively.
| Characteristic | Number | Measure |
| Per Capita Income | 67 | $25,552 |
| Median Family Income | 21 | $51,146 |
| Mean Family Income | 21 | $63,657 |
| Median Household Income | 26 | $51,667 |
| Mean Household Income | 26 | $64,508 |
| Income Deficit | 21 | $0 |
| Wage / Income Gap (%) | 67 | 0.00% |
| Wage / Income Gap ($) | 67 | 100.00¢ per $1 |
| Gini / Inequality Index | 67 | 0.19 |
Earnings by Sex in Woodsville
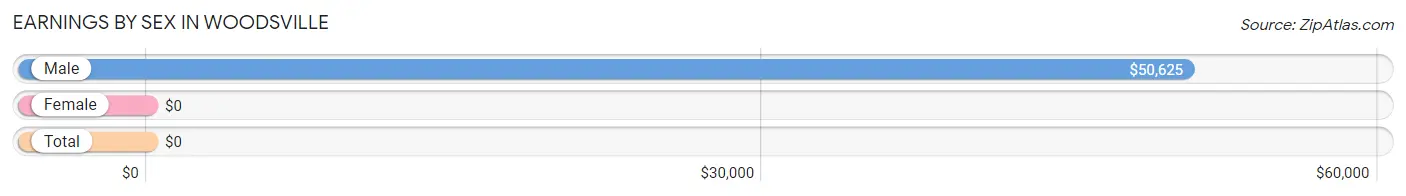
| Sex | Number | Average Earnings |
| Male | 11 (37.9%) | $50,625 |
| Female | 18 (62.1%) | $0 |
| Total | 29 (100.0%) | $0 |
Earnings by Sex by Income Bracket in Woodsville
The most common earnings brackets in Woodsville are $45,000 to $49,999 for men (5 | 45.5%) and $17,500 to $19,999 for women (12 | 66.7%).
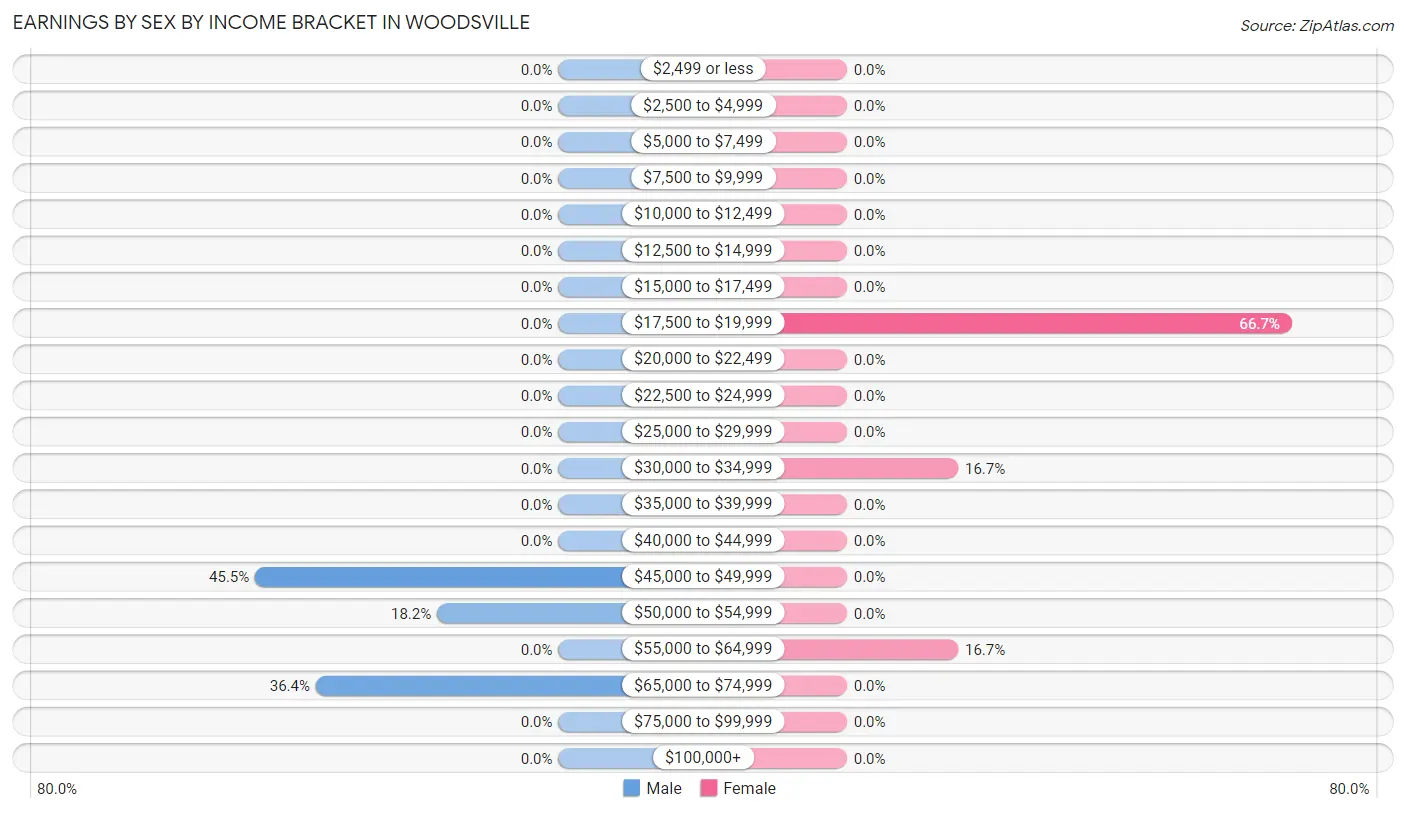
| Income | Male | Female |
| $2,499 or less | 0 (0.0%) | 0 (0.0%) |
| $2,500 to $4,999 | 0 (0.0%) | 0 (0.0%) |
| $5,000 to $7,499 | 0 (0.0%) | 0 (0.0%) |
| $7,500 to $9,999 | 0 (0.0%) | 0 (0.0%) |
| $10,000 to $12,499 | 0 (0.0%) | 0 (0.0%) |
| $12,500 to $14,999 | 0 (0.0%) | 0 (0.0%) |
| $15,000 to $17,499 | 0 (0.0%) | 0 (0.0%) |
| $17,500 to $19,999 | 0 (0.0%) | 12 (66.7%) |
| $20,000 to $22,499 | 0 (0.0%) | 0 (0.0%) |
| $22,500 to $24,999 | 0 (0.0%) | 0 (0.0%) |
| $25,000 to $29,999 | 0 (0.0%) | 0 (0.0%) |
| $30,000 to $34,999 | 0 (0.0%) | 3 (16.7%) |
| $35,000 to $39,999 | 0 (0.0%) | 0 (0.0%) |
| $40,000 to $44,999 | 0 (0.0%) | 0 (0.0%) |
| $45,000 to $49,999 | 5 (45.5%) | 0 (0.0%) |
| $50,000 to $54,999 | 2 (18.2%) | 0 (0.0%) |
| $55,000 to $64,999 | 0 (0.0%) | 3 (16.7%) |
| $65,000 to $74,999 | 4 (36.4%) | 0 (0.0%) |
| $75,000 to $99,999 | 0 (0.0%) | 0 (0.0%) |
| $100,000+ | 0 (0.0%) | 0 (0.0%) |
| Total | 11 (100.0%) | 18 (100.0%) |
Earnings by Sex by Educational Attainment in Woodsville
| Educational Attainment | Male Income | Female Income |
| Less than High School | - | - |
| High School Diploma | - | - |
| College or Associate's Degree | - | - |
| Bachelor's Degree | - | - |
| Graduate Degree | - | - |
| Total | $50,625 | $0 |
Family Income in Woodsville
Family Income Brackets in Woodsville
According to the Woodsville family income data, there are 12 families falling into the $50,000 to $74,999 income range, which is the most common income bracket and makes up 57.1% of all families.
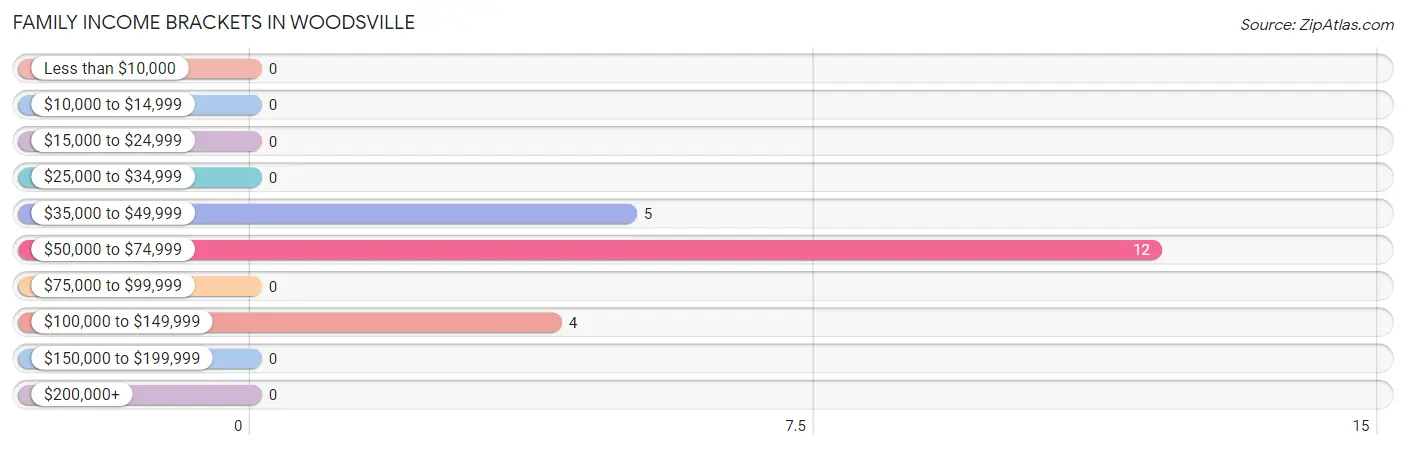
| Income Bracket | # Families | % Families |
| Less than $10,000 | 0 | 0.0% |
| $10,000 to $14,999 | 0 | 0.0% |
| $15,000 to $24,999 | 0 | 0.0% |
| $25,000 to $34,999 | 0 | 0.0% |
| $35,000 to $49,999 | 5 | 23.8% |
| $50,000 to $74,999 | 12 | 57.1% |
| $75,000 to $99,999 | 0 | 0.0% |
| $100,000 to $149,999 | 4 | 19.0% |
| $150,000 to $199,999 | 0 | 0.0% |
| $200,000+ | 0 | 0.0% |
Family Income by Famaliy Size in Woodsville
| Income Bracket | # Families | Median Income |
| 2-Person Families | 12 (57.1%) | $0 |
| 3-Person Families | 0 (0.0%) | $0 |
| 4-Person Families | 9 (42.9%) | $0 |
| 5-Person Families | 0 (0.0%) | $0 |
| 6-Person Families | 0 (0.0%) | $0 |
| 7+ Person Families | 0 (0.0%) | $0 |
| Total | 21 (100.0%) | $51,146 |
Family Income by Number of Earners in Woodsville
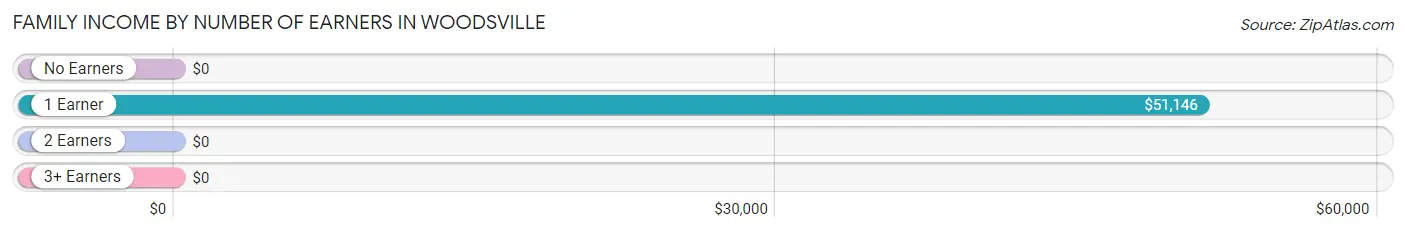
| Number of Earners | # Families | Median Income |
| No Earners | 0 (0.0%) | $0 |
| 1 Earner | 21 (100.0%) | $51,146 |
| 2 Earners | 0 (0.0%) | $0 |
| 3+ Earners | 0 (0.0%) | $0 |
| Total | 21 (100.0%) | $51,146 |
Household Income in Woodsville
Household Income Brackets in Woodsville
With 15 households falling in the category, the $50,000 to $74,999 income range is the most frequent in Woodsville, accounting for 57.7% of all households.
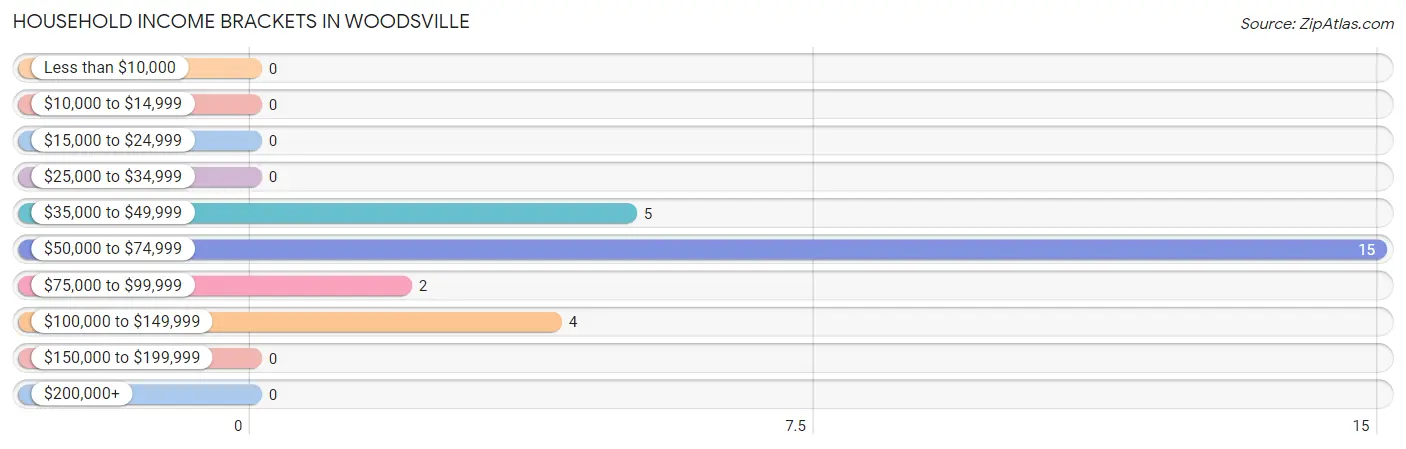
| Income Bracket | # Households | % Households |
| Less than $10,000 | 0 | 0.0% |
| $10,000 to $14,999 | 0 | 0.0% |
| $15,000 to $24,999 | 0 | 0.0% |
| $25,000 to $34,999 | 0 | 0.0% |
| $35,000 to $49,999 | 5 | 19.2% |
| $50,000 to $74,999 | 15 | 57.7% |
| $75,000 to $99,999 | 2 | 7.7% |
| $100,000 to $149,999 | 4 | 15.4% |
| $150,000 to $199,999 | 0 | 0.0% |
| $200,000+ | 0 | 0.0% |
Household Income by Householder Age in Woodsville
The median household income in Woodsville is $51,667, with the highest median household income of $52,188 found in the 45 to 64 years age bracket for the primary householder. A total of 21 households (80.8%) fall into this category.
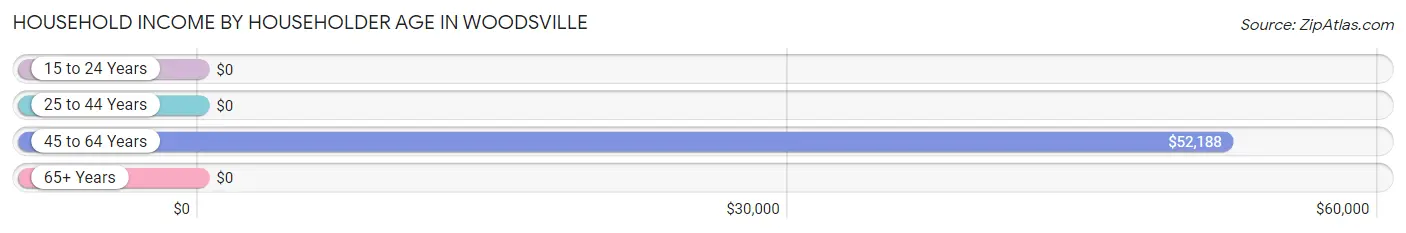
| Income Bracket | # Households | Median Income |
| 15 to 24 Years | 0 (0.0%) | $0 |
| 25 to 44 Years | 5 (19.2%) | $0 |
| 45 to 64 Years | 21 (80.8%) | $52,188 |
| 65+ Years | 0 (0.0%) | $0 |
| Total | 26 (100.0%) | $51,667 |
Poverty in Woodsville
Income Below Poverty by Sex and Age in Woodsville
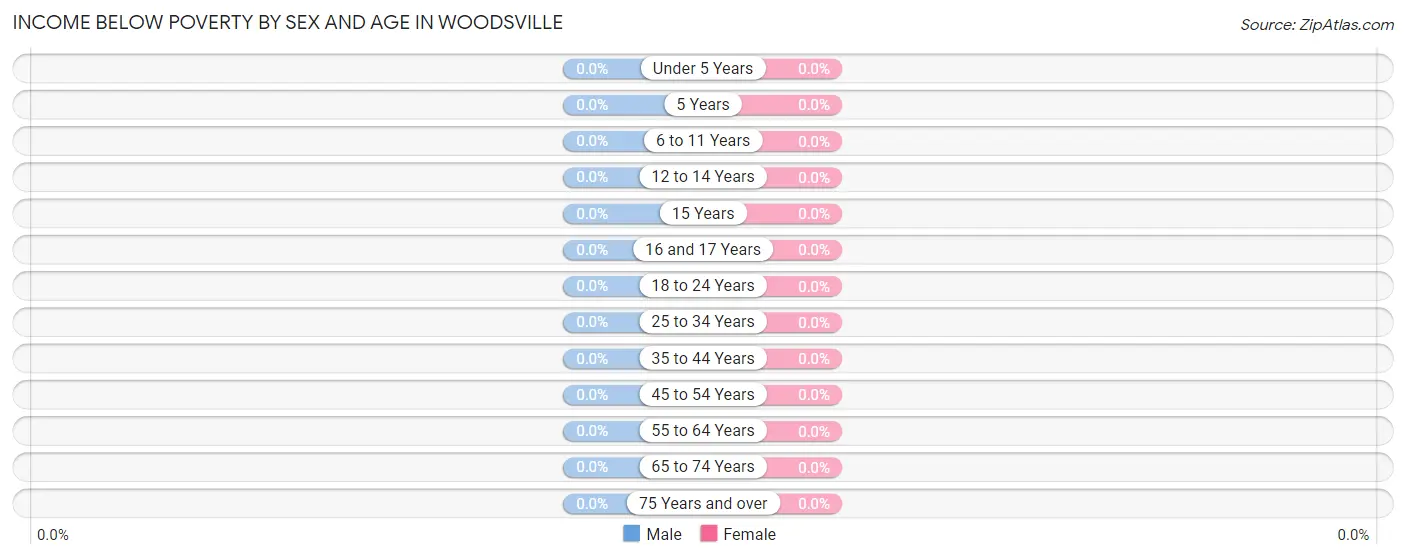
| Age Bracket | Male | Female |
| Under 5 Years | 0 (0.0%) | 0 (0.0%) |
| 5 Years | 0 (0.0%) | 0 (0.0%) |
| 6 to 11 Years | 0 (0.0%) | 0 (0.0%) |
| 12 to 14 Years | 0 (0.0%) | 0 (0.0%) |
| 15 Years | 0 (0.0%) | 0 (0.0%) |
| 16 and 17 Years | 0 (0.0%) | 0 (0.0%) |
| 18 to 24 Years | 0 (0.0%) | 0 (0.0%) |
| 25 to 34 Years | 0 (0.0%) | 0 (0.0%) |
| 35 to 44 Years | 0 (0.0%) | 0 (0.0%) |
| 45 to 54 Years | 0 (0.0%) | 0 (0.0%) |
| 55 to 64 Years | 0 (0.0%) | 0 (0.0%) |
| 65 to 74 Years | 0 (0.0%) | 0 (0.0%) |
| 75 Years and over | 0 (0.0%) | 0 (0.0%) |
| Total | 0 (0.0%) | 0 (0.0%) |
Income Above Poverty by Sex and Age in Woodsville
According to the poverty statistics in Woodsville, males aged under 5 years and females aged under 5 years are the age groups that are most secure financially, with 100.0% of males and 100.0% of females in these age groups living above the poverty line.
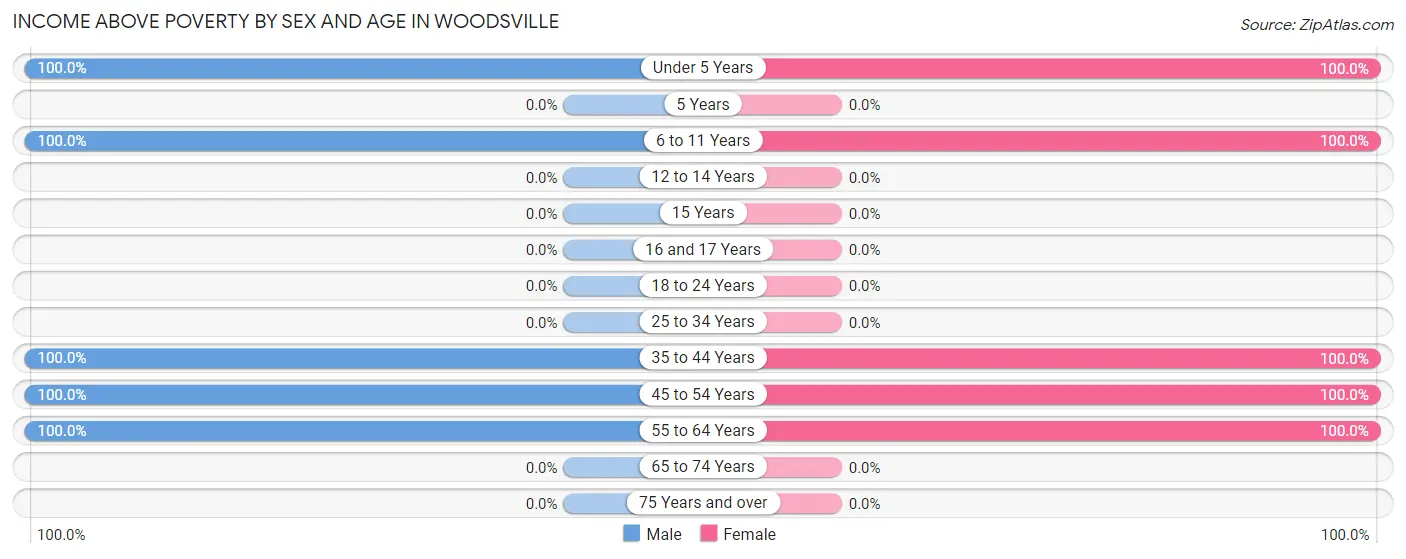
| Age Bracket | Male | Female |
| Under 5 Years | 4 (100.0%) | 4 (100.0%) |
| 5 Years | 0 (0.0%) | 0 (0.0%) |
| 6 to 11 Years | 4 (100.0%) | 5 (100.0%) |
| 12 to 14 Years | 0 (0.0%) | 0 (0.0%) |
| 15 Years | 0 (0.0%) | 0 (0.0%) |
| 16 and 17 Years | 0 (0.0%) | 0 (0.0%) |
| 18 to 24 Years | 0 (0.0%) | 0 (0.0%) |
| 25 to 34 Years | 0 (0.0%) | 0 (0.0%) |
| 35 to 44 Years | 5 (100.0%) | 5 (100.0%) |
| 45 to 54 Years | 6 (100.0%) | 4 (100.0%) |
| 55 to 64 Years | 12 (100.0%) | 18 (100.0%) |
| 65 to 74 Years | 0 (0.0%) | 0 (0.0%) |
| 75 Years and over | 0 (0.0%) | 0 (0.0%) |
| Total | 31 (100.0%) | 36 (100.0%) |
Income Below Poverty Among Married-Couple Families in Woodsville
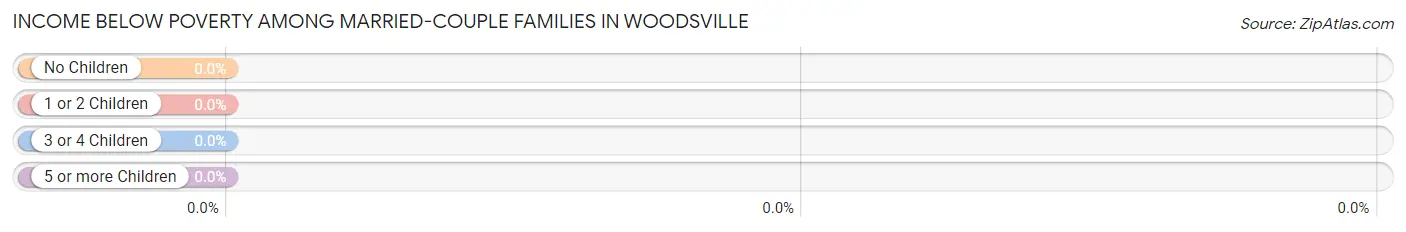
| Children | Above Poverty | Below Poverty |
| No Children | 12 (100.0%) | 0 (0.0%) |
| 1 or 2 Children | 9 (100.0%) | 0 (0.0%) |
| 3 or 4 Children | 0 (0.0%) | 0 (0.0%) |
| 5 or more Children | 0 (0.0%) | 0 (0.0%) |
| Total | 21 (100.0%) | 0 (0.0%) |
Income Below Poverty Among Single-Parent Households in Woodsville
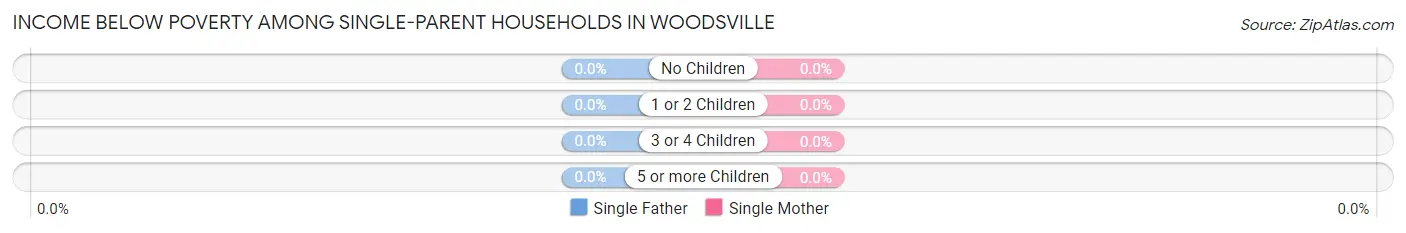
| Children | Single Father | Single Mother |
| No Children | 0 (0.0%) | 0 (0.0%) |
| 1 or 2 Children | 0 (0.0%) | 0 (0.0%) |
| 3 or 4 Children | 0 (0.0%) | 0 (0.0%) |
| 5 or more Children | 0 (0.0%) | 0 (0.0%) |
| Total | 0 (0.0%) | 0 (0.0%) |
Income Below Poverty Among Married-Couple vs Single-Parent Households in Woodsville
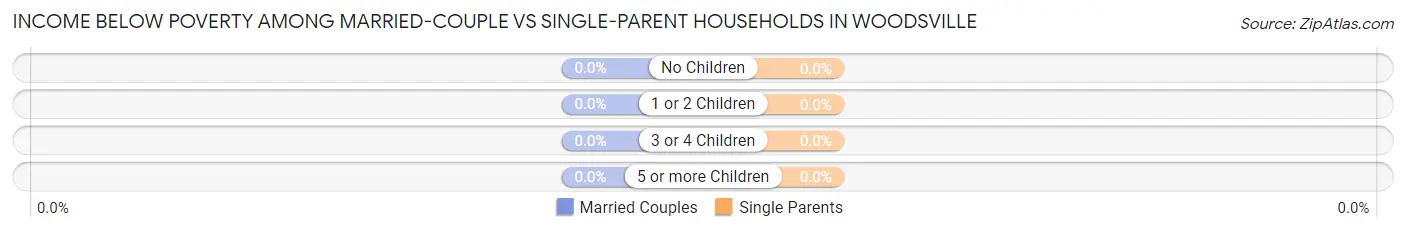
| Children | Married-Couple Families | Single-Parent Households |
| No Children | 0 (0.0%) | 0 (0.0%) |
| 1 or 2 Children | 0 (0.0%) | 0 (0.0%) |
| 3 or 4 Children | 0 (0.0%) | 0 (0.0%) |
| 5 or more Children | 0 (0.0%) | 0 (0.0%) |
| Total | 0 (0.0%) | 0 (0.0%) |
Race in Woodsville
The most populous races in Woodsville are , and White / Caucasian (67 | 100.0%).
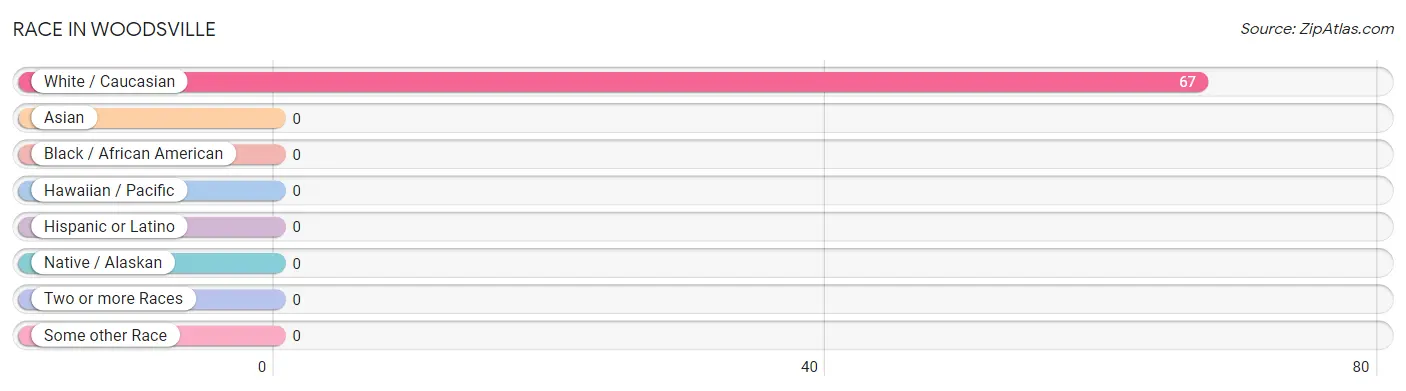
| Race | # Population | % Population |
| Asian | 0 | 0.0% |
| Black / African American | 0 | 0.0% |
| Hawaiian / Pacific | 0 | 0.0% |
| Hispanic or Latino | 0 | 0.0% |
| Native / Alaskan | 0 | 0.0% |
| White / Caucasian | 67 | 100.0% |
| Two or more Races | 0 | 0.0% |
| Some other Race | 0 | 0.0% |
| Total | 67 | 100.0% |
Ancestry in Woodsville
The most populous ancestries reported in Woodsville are Irish (28 | 41.8%), Italian (17 | 25.4%), French (12 | 17.9%), and German (8 | 11.9%), together accounting for 97.0% of all Woodsville residents.
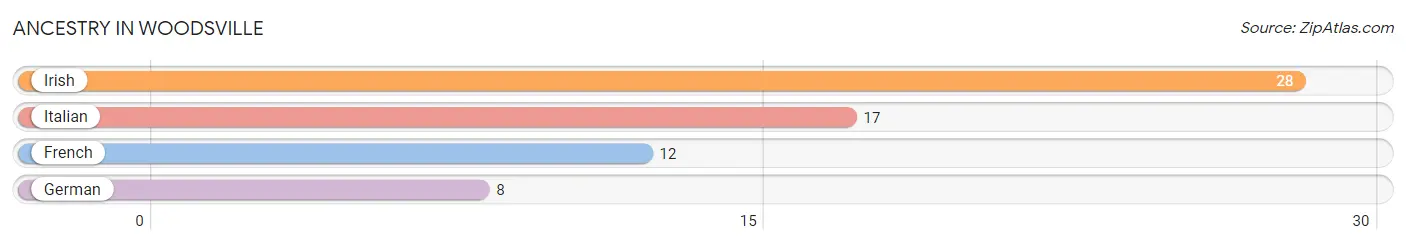
| Ancestry | # Population | % Population |
| French | 12 | 17.9% |
| German | 8 | 11.9% |
| Irish | 28 | 41.8% |
| Italian | 17 | 25.4% | View All 4 Rows |
Immigrants in Woodsville

| Immigration Origin | # Population | % Population | View All 0 Rows |
Sex and Age in Woodsville
Sex and Age in Woodsville
The most populous age groups in Woodsville are 60 to 64 Years (12 | 38.7%) for men and 60 to 64 Years (12 | 33.3%) for women.
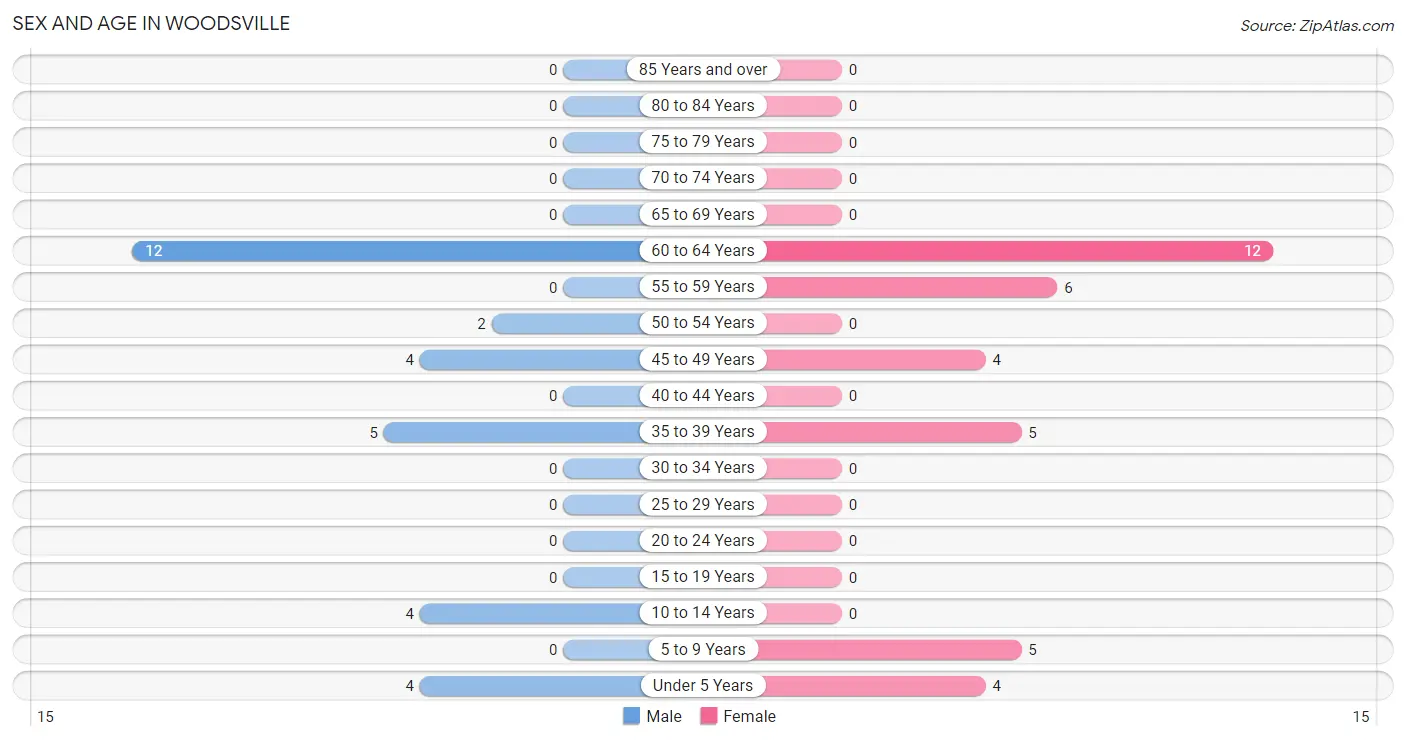
| Age Bracket | Male | Female |
| Under 5 Years | 4 (12.9%) | 4 (11.1%) |
| 5 to 9 Years | 0 (0.0%) | 5 (13.9%) |
| 10 to 14 Years | 4 (12.9%) | 0 (0.0%) |
| 15 to 19 Years | 0 (0.0%) | 0 (0.0%) |
| 20 to 24 Years | 0 (0.0%) | 0 (0.0%) |
| 25 to 29 Years | 0 (0.0%) | 0 (0.0%) |
| 30 to 34 Years | 0 (0.0%) | 0 (0.0%) |
| 35 to 39 Years | 5 (16.1%) | 5 (13.9%) |
| 40 to 44 Years | 0 (0.0%) | 0 (0.0%) |
| 45 to 49 Years | 4 (12.9%) | 4 (11.1%) |
| 50 to 54 Years | 2 (6.5%) | 0 (0.0%) |
| 55 to 59 Years | 0 (0.0%) | 6 (16.7%) |
| 60 to 64 Years | 12 (38.7%) | 12 (33.3%) |
| 65 to 69 Years | 0 (0.0%) | 0 (0.0%) |
| 70 to 74 Years | 0 (0.0%) | 0 (0.0%) |
| 75 to 79 Years | 0 (0.0%) | 0 (0.0%) |
| 80 to 84 Years | 0 (0.0%) | 0 (0.0%) |
| 85 Years and over | 0 (0.0%) | 0 (0.0%) |
| Total | 31 (100.0%) | 36 (100.0%) |
Families and Households in Woodsville
Median Family Size in Woodsville
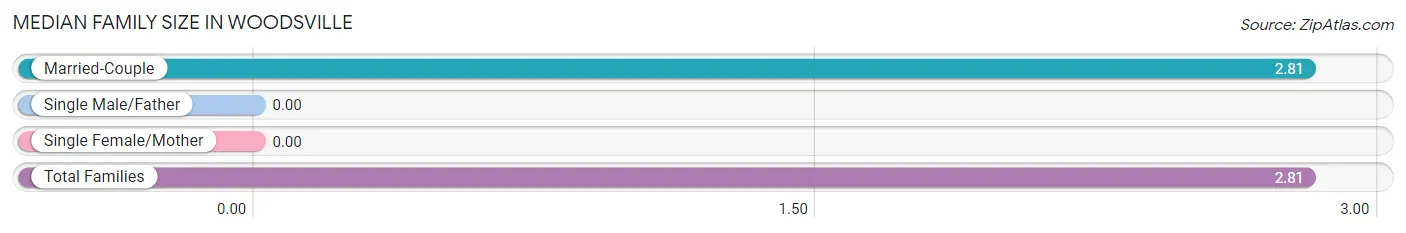
| Family Type | # Families | Family Size |
| Married-Couple | 21 (100.0%) | 2.81 |
| Single Male/Father | 0 (0.0%) | - |
| Single Female/Mother | 0 (0.0%) | - |
| Total Families | 21 (100.0%) | 2.81 |
Median Household Size in Woodsville
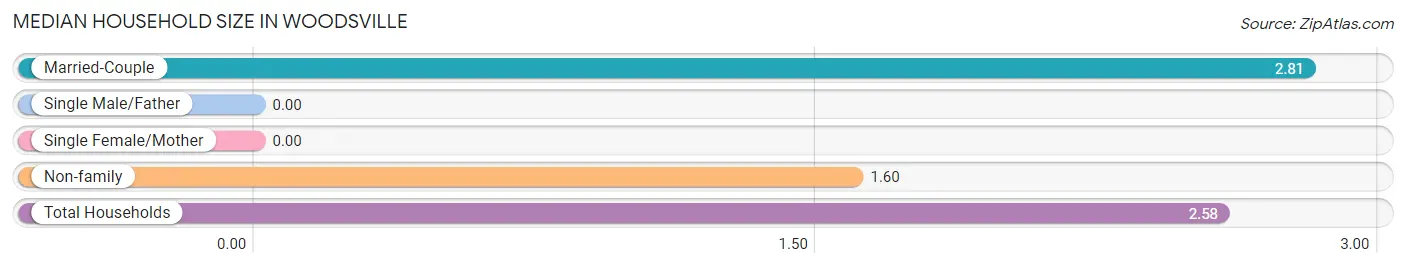
| Household Type | # Households | Household Size |
| Married-Couple | 21 (80.8%) | 2.81 |
| Single Male/Father | 0 (0.0%) | - |
| Single Female/Mother | 0 (0.0%) | - |
| Non-family | 5 (19.2%) | 1.60 |
| Total Households | 26 (100.0%) | 2.58 |
Household Size by Marriage Status in Woodsville
Out of a total of 26 households in Woodsville, 21 (80.8%) are family households, while 5 (19.2%) are nonfamily households. The most numerous type of family households are 2-person households, comprising 12, and the most common type of nonfamily households are 1-person households, comprising 3.
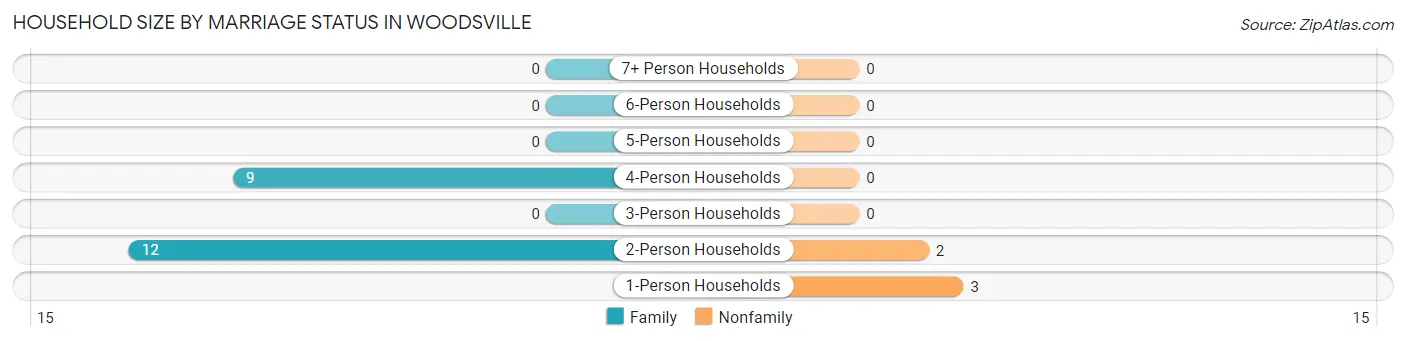
| Household Size | Family Households | Nonfamily Households |
| 1-Person Households | - | 3 (11.5%) |
| 2-Person Households | 12 (46.2%) | 2 (7.7%) |
| 3-Person Households | 0 (0.0%) | 0 (0.0%) |
| 4-Person Households | 9 (34.6%) | 0 (0.0%) |
| 5-Person Households | 0 (0.0%) | 0 (0.0%) |
| 6-Person Households | 0 (0.0%) | 0 (0.0%) |
| 7+ Person Households | 0 (0.0%) | 0 (0.0%) |
| Total | 21 (80.8%) | 5 (19.2%) |
Female Fertility in Woodsville
Fertility by Age in Woodsville
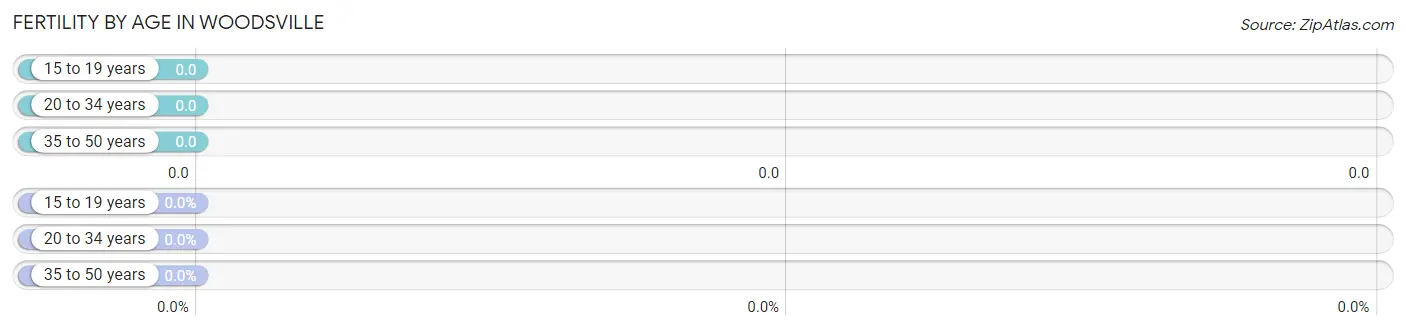
| Age Bracket | Women with Births | Births / 1,000 Women |
| 15 to 19 years | 0 (0.0%) | 0.0 |
| 20 to 34 years | 0 (0.0%) | 0.0 |
| 35 to 50 years | 0 (0.0%) | 0.0 |
| Total | 0 (0.0%) | 0.0 |
Fertility by Age by Marriage Status in Woodsville
| Age Bracket | Married | Unmarried |
| 15 to 19 years | 0 (0.0%) | 0 (0.0%) |
| 20 to 34 years | 0 (0.0%) | 0 (0.0%) |
| 35 to 50 years | 0 (0.0%) | 0 (0.0%) |
| Total | 0 (0.0%) | 0 (0.0%) |
Fertility by Education in Woodsville
| Educational Attainment | Women with Births | Births / 1,000 Women |
| Less than High School | 0 (0.0%) | 0.0 |
| High School Diploma | 0 (0.0%) | 0.0 |
| College or Associate's Degree | 0 (0.0%) | 0.0 |
| Bachelor's Degree | 0 (0.0%) | 0.0 |
| Graduate Degree | 0 (0.0%) | 0.0 |
| Total | 0 (0.0%) | 0.0 |
Fertility by Education by Marriage Status in Woodsville
| Educational Attainment | Married | Unmarried |
| Less than High School | 0 (0.0%) | 0 (0.0%) |
| High School Diploma | 0 (0.0%) | 0 (0.0%) |
| College or Associate's Degree | 0 (0.0%) | 0 (0.0%) |
| Bachelor's Degree | 0 (0.0%) | 0 (0.0%) |
| Graduate Degree | 0 (0.0%) | 0 (0.0%) |
| Total | 0 (0.0%) | 0 (0.0%) |
Employment Characteristics in Woodsville
Employment by Class of Employer in Woodsville
Among the 29 employed individuals in Woodsville, private company employees (23 | 79.3%), state government employees (4 | 13.8%), and self-employed (incorporated) (2 | 6.9%) make up the most common classes of employment.
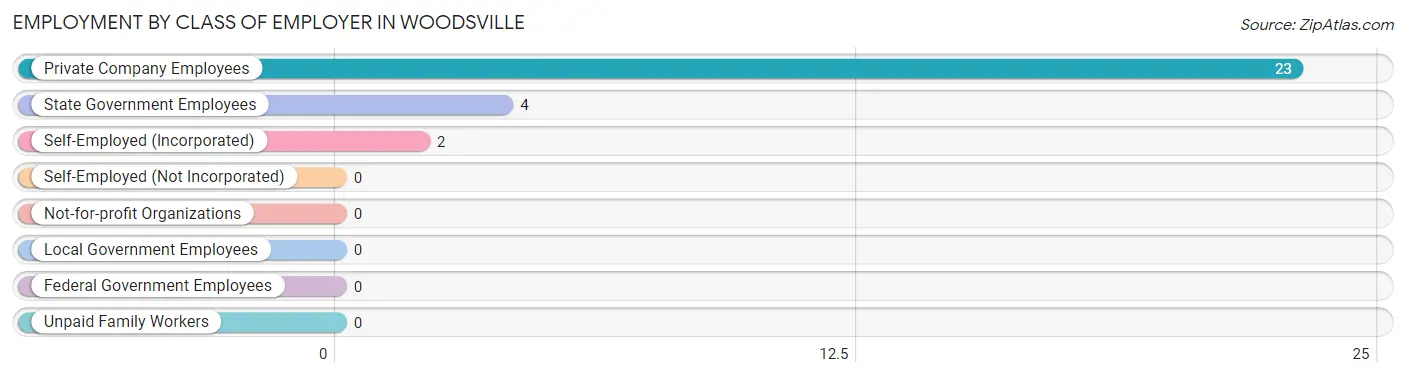
| Employer Class | # Employees | % Employees |
| Private Company Employees | 23 | 79.3% |
| Self-Employed (Incorporated) | 2 | 6.9% |
| Self-Employed (Not Incorporated) | 0 | 0.0% |
| Not-for-profit Organizations | 0 | 0.0% |
| Local Government Employees | 0 | 0.0% |
| State Government Employees | 4 | 13.8% |
| Federal Government Employees | 0 | 0.0% |
| Unpaid Family Workers | 0 | 0.0% |
| Total | 29 | 100.0% |
Employment Status by Age in Woodsville
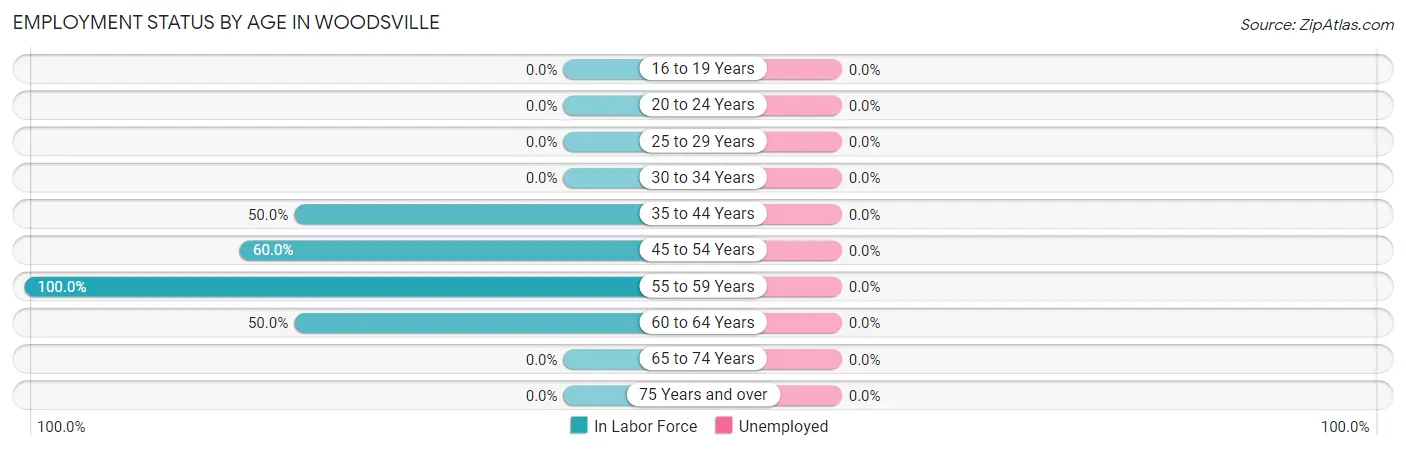
| Age Bracket | In Labor Force | Unemployed |
| 16 to 19 Years | 0 (0.0%) | 0 (0.0%) |
| 20 to 24 Years | 0 (0.0%) | 0 (0.0%) |
| 25 to 29 Years | 0 (0.0%) | 0 (0.0%) |
| 30 to 34 Years | 0 (0.0%) | 0 (0.0%) |
| 35 to 44 Years | 5 (50.0%) | 0 (0.0%) |
| 45 to 54 Years | 6 (60.0%) | 0 (0.0%) |
| 55 to 59 Years | 6 (100.0%) | 0 (0.0%) |
| 60 to 64 Years | 12 (50.0%) | 0 (0.0%) |
| 65 to 74 Years | 0 (0.0%) | 0 (0.0%) |
| 75 Years and over | 0 (0.0%) | 0 (0.0%) |
| Total | 29 (58.0%) | 0 (0.0%) |
Employment Status by Educational Attainment in Woodsville
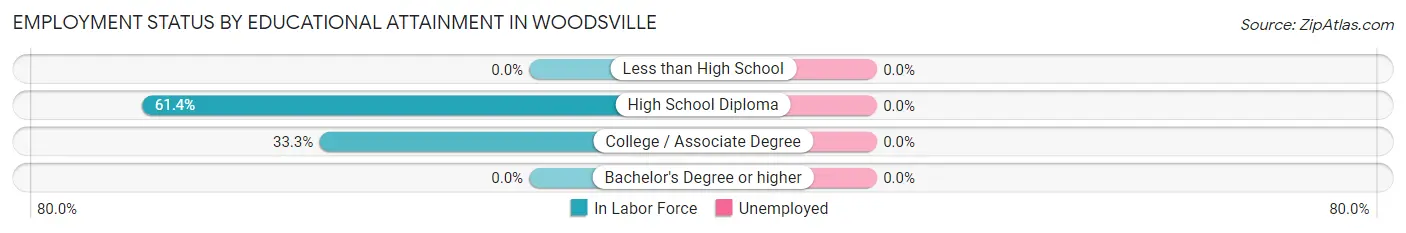
| Educational Attainment | In Labor Force | Unemployed |
| Less than High School | 0 (0.0%) | 0 (0.0%) |
| High School Diploma | 27 (61.4%) | 0 (0.0%) |
| College / Associate Degree | 2 (33.3%) | 0 (0.0%) |
| Bachelor's Degree or higher | 0 (0.0%) | 0 (0.0%) |
| Total | 29 (58.0%) | 0 (0.0%) |
Employment Occupations by Sex in Woodsville
Management, Business, Science and Arts Occupations
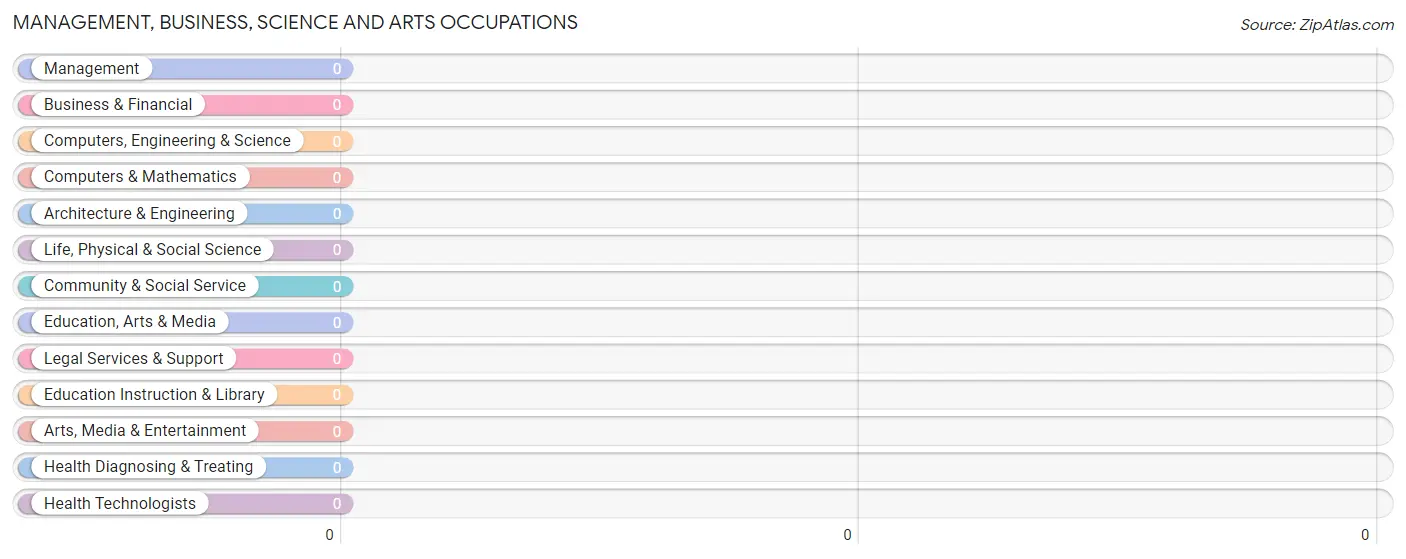
Management, Business, Science and Arts Occupations by Sex
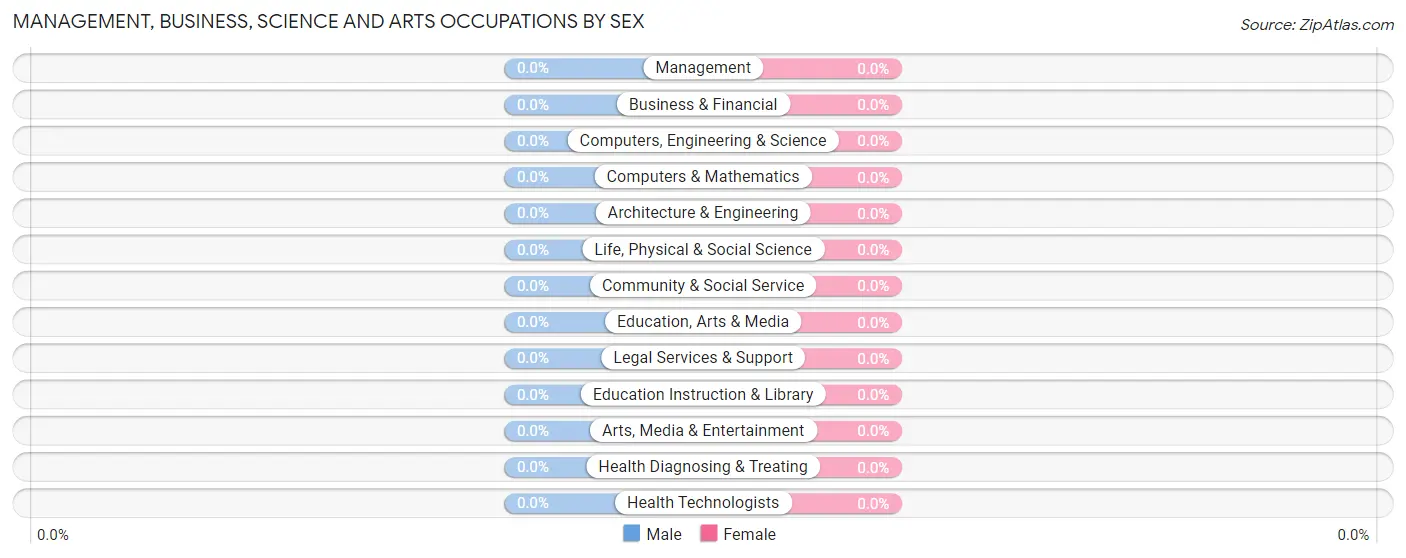
| Occupation | Male | Female |
| Management | 0 (0.0%) | 0 (0.0%) |
| Business & Financial | 0 (0.0%) | 0 (0.0%) |
| Computers, Engineering & Science | 0 (0.0%) | 0 (0.0%) |
| Computers & Mathematics | 0 (0.0%) | 0 (0.0%) |
| Architecture & Engineering | 0 (0.0%) | 0 (0.0%) |
| Life, Physical & Social Science | 0 (0.0%) | 0 (0.0%) |
| Community & Social Service | 0 (0.0%) | 0 (0.0%) |
| Education, Arts & Media | 0 (0.0%) | 0 (0.0%) |
| Legal Services & Support | 0 (0.0%) | 0 (0.0%) |
| Education Instruction & Library | 0 (0.0%) | 0 (0.0%) |
| Arts, Media & Entertainment | 0 (0.0%) | 0 (0.0%) |
| Health Diagnosing & Treating | 0 (0.0%) | 0 (0.0%) |
| Health Technologists | 0 (0.0%) | 0 (0.0%) |
| Total (Category) | 0 (0.0%) | 0 (0.0%) |
| Total (Overall) | 11 (37.9%) | 18 (62.1%) |
Services Occupations
The most common Services occupations in Woodsville are , and Cleaning & Maintenance (12 | 41.4%).
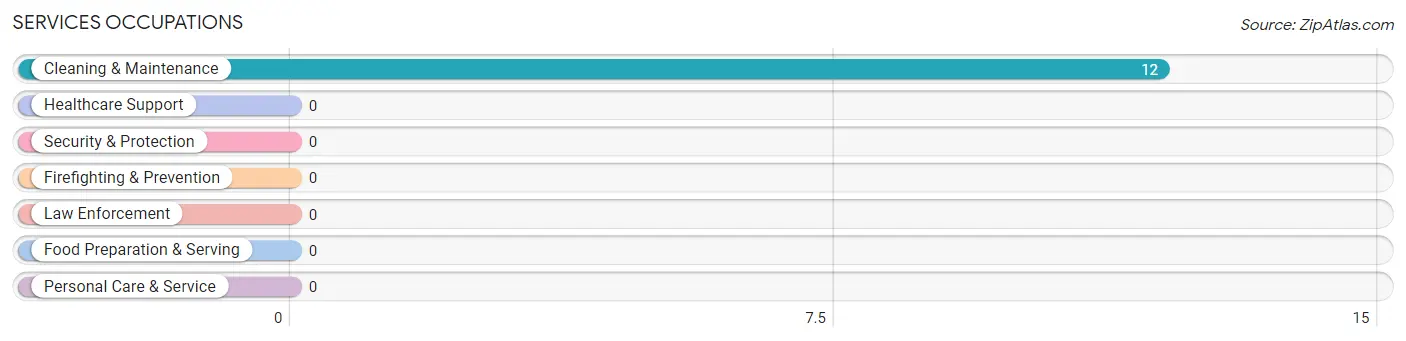
Services Occupations by Sex
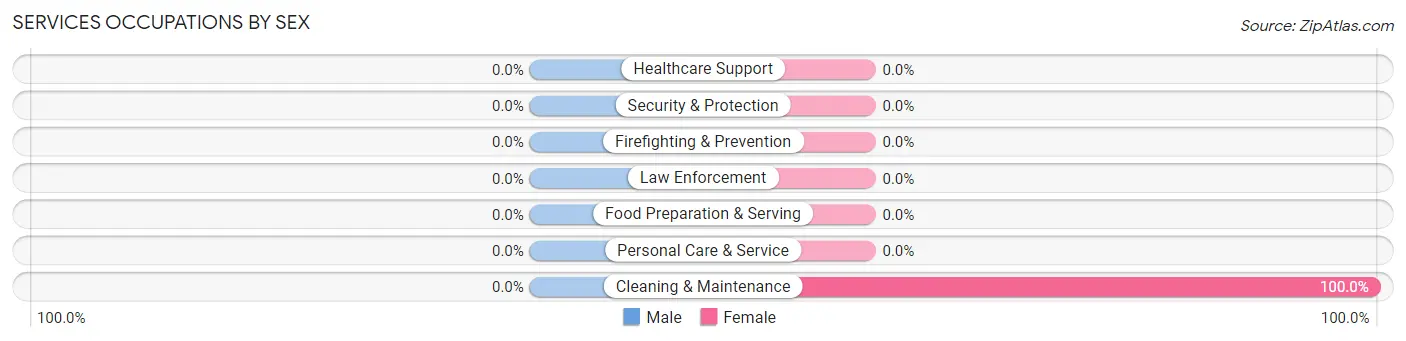
| Occupation | Male | Female |
| Healthcare Support | 0 (0.0%) | 0 (0.0%) |
| Security & Protection | 0 (0.0%) | 0 (0.0%) |
| Firefighting & Prevention | 0 (0.0%) | 0 (0.0%) |
| Law Enforcement | 0 (0.0%) | 0 (0.0%) |
| Food Preparation & Serving | 0 (0.0%) | 0 (0.0%) |
| Cleaning & Maintenance | 0 (0.0%) | 12 (100.0%) |
| Personal Care & Service | 0 (0.0%) | 0 (0.0%) |
| Total (Category) | 0 (0.0%) | 12 (100.0%) |
| Total (Overall) | 11 (37.9%) | 18 (62.1%) |
Sales and Office Occupations
The most common Sales and Office occupations in Woodsville are Office & Administration (3 | 10.3%), and Sales & Related (2 | 6.9%).
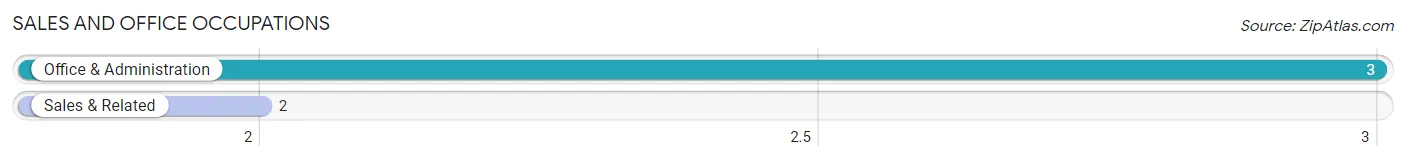
Sales and Office Occupations by Sex
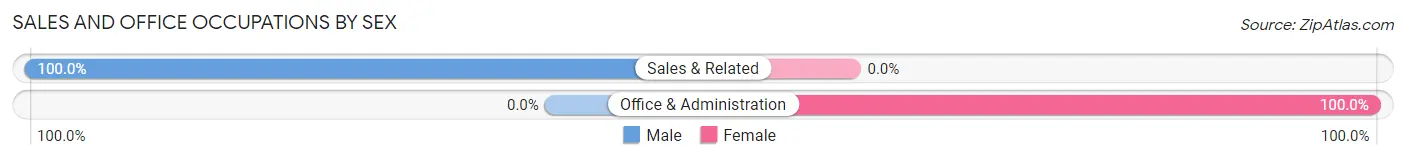
| Occupation | Male | Female |
| Sales & Related | 2 (100.0%) | 0 (0.0%) |
| Office & Administration | 0 (0.0%) | 3 (100.0%) |
| Total (Category) | 2 (40.0%) | 3 (60.0%) |
| Total (Overall) | 11 (37.9%) | 18 (62.1%) |
Natural Resources, Construction and Maintenance Occupations
The most common Natural Resources, Construction and Maintenance occupations in Woodsville are , and Installation, Maintenance & Repair (4 | 13.8%).
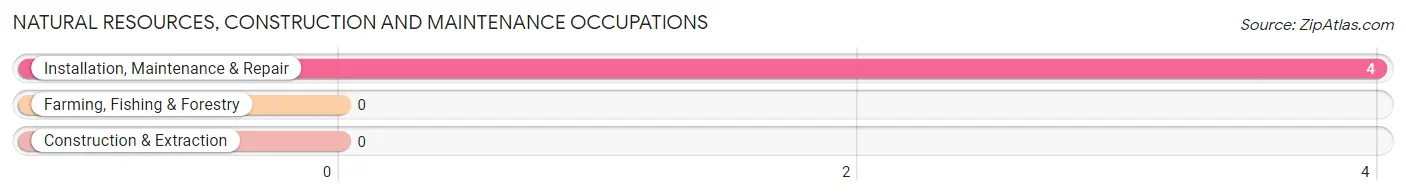
Natural Resources, Construction and Maintenance Occupations by Sex
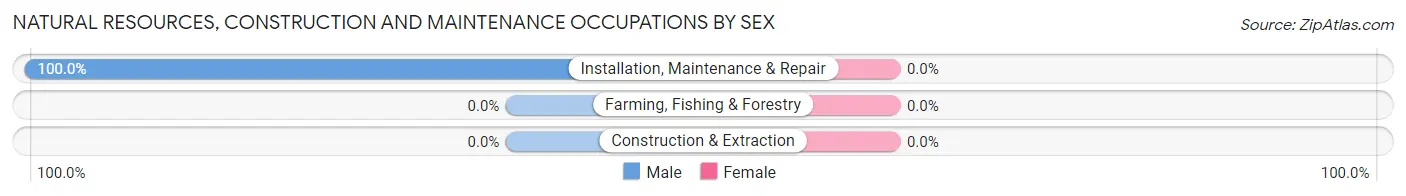
| Occupation | Male | Female |
| Farming, Fishing & Forestry | 0 (0.0%) | 0 (0.0%) |
| Construction & Extraction | 0 (0.0%) | 0 (0.0%) |
| Installation, Maintenance & Repair | 4 (100.0%) | 0 (0.0%) |
| Total (Category) | 4 (100.0%) | 0 (0.0%) |
| Total (Overall) | 11 (37.9%) | 18 (62.1%) |
Production, Transportation and Moving Occupations
The most common Production, Transportation and Moving occupations in Woodsville are Production (5 | 17.2%), and Material Moving (3 | 10.3%).
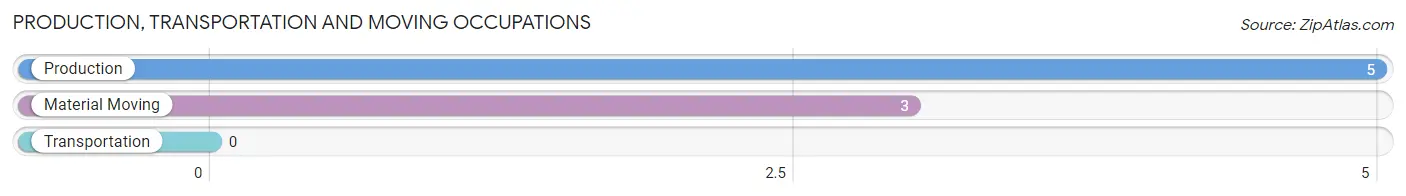
Production, Transportation and Moving Occupations by Sex
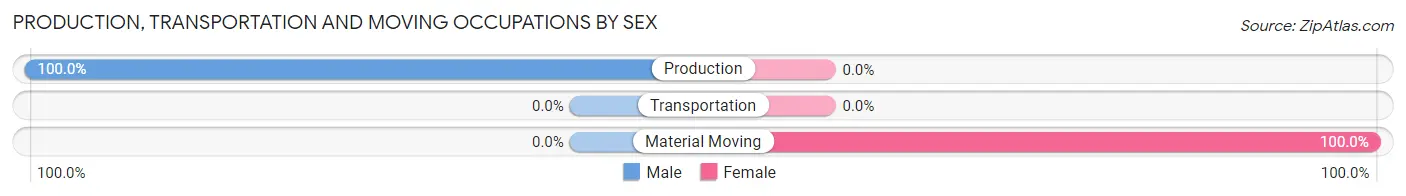
| Occupation | Male | Female |
| Production | 5 (100.0%) | 0 (0.0%) |
| Transportation | 0 (0.0%) | 0 (0.0%) |
| Material Moving | 0 (0.0%) | 3 (100.0%) |
| Total (Category) | 5 (62.5%) | 3 (37.5%) |
| Total (Overall) | 11 (37.9%) | 18 (62.1%) |
Employment Industries by Sex in Woodsville
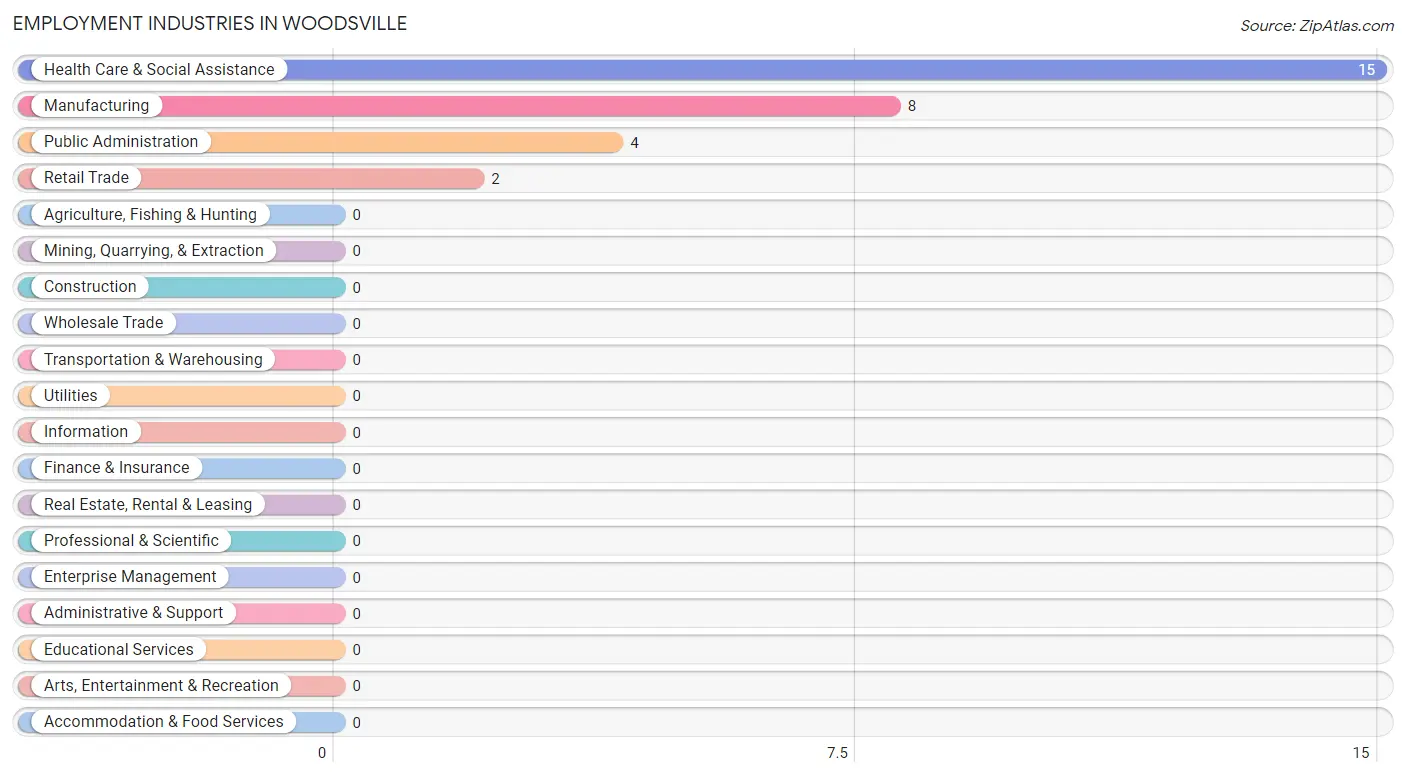
Employment Industries in Woodsville
The major employment industries in Woodsville include Health Care & Social Assistance (15 | 51.7%), Manufacturing (8 | 27.6%), Public Administration (4 | 13.8%), and Retail Trade (2 | 6.9%).
Employment Industries by Sex in Woodsville
The Woodsville industries that see more men than women are Retail Trade (100.0%), Public Administration (100.0%), and Manufacturing (62.5%), whereas the industries that tend to have a higher number of women are Health Care & Social Assistance (100.0%), and Manufacturing (37.5%).
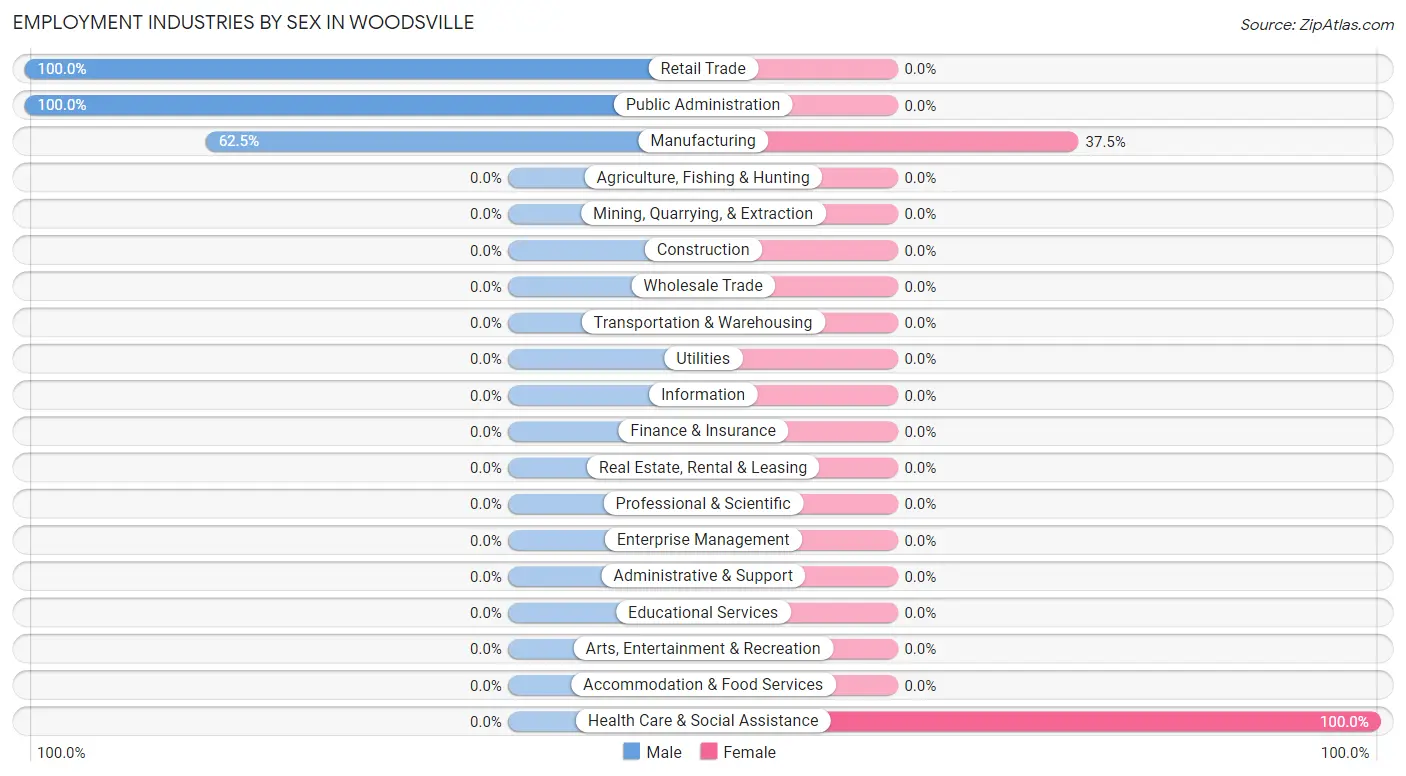
| Industry | Male | Female |
| Agriculture, Fishing & Hunting | 0 (0.0%) | 0 (0.0%) |
| Mining, Quarrying, & Extraction | 0 (0.0%) | 0 (0.0%) |
| Construction | 0 (0.0%) | 0 (0.0%) |
| Manufacturing | 5 (62.5%) | 3 (37.5%) |
| Wholesale Trade | 0 (0.0%) | 0 (0.0%) |
| Retail Trade | 2 (100.0%) | 0 (0.0%) |
| Transportation & Warehousing | 0 (0.0%) | 0 (0.0%) |
| Utilities | 0 (0.0%) | 0 (0.0%) |
| Information | 0 (0.0%) | 0 (0.0%) |
| Finance & Insurance | 0 (0.0%) | 0 (0.0%) |
| Real Estate, Rental & Leasing | 0 (0.0%) | 0 (0.0%) |
| Professional & Scientific | 0 (0.0%) | 0 (0.0%) |
| Enterprise Management | 0 (0.0%) | 0 (0.0%) |
| Administrative & Support | 0 (0.0%) | 0 (0.0%) |
| Educational Services | 0 (0.0%) | 0 (0.0%) |
| Health Care & Social Assistance | 0 (0.0%) | 15 (100.0%) |
| Arts, Entertainment & Recreation | 0 (0.0%) | 0 (0.0%) |
| Accommodation & Food Services | 0 (0.0%) | 0 (0.0%) |
| Public Administration | 4 (100.0%) | 0 (0.0%) |
| Total | 11 (37.9%) | 18 (62.1%) |
Education in Woodsville
School Enrollment in Woodsville
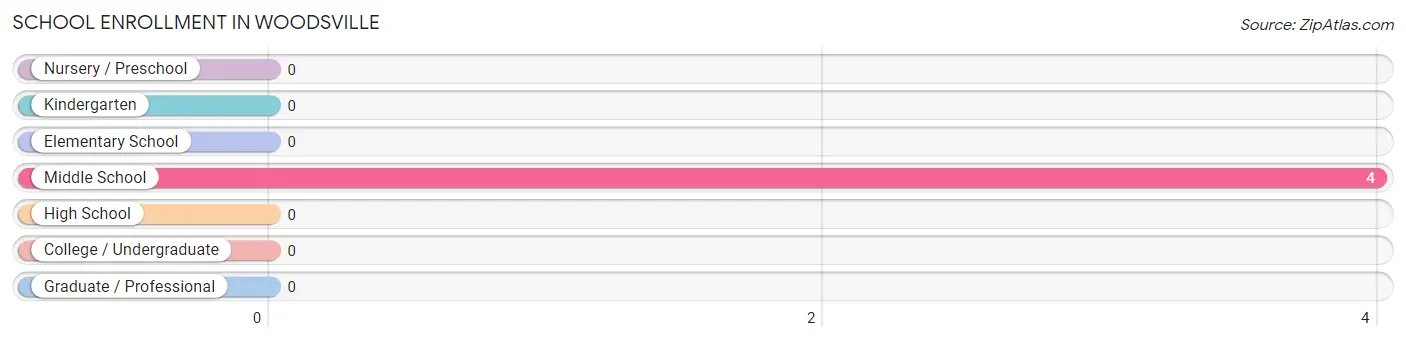
| School Level | # Students | % Students |
| Nursery / Preschool | 0 | 0.0% |
| Kindergarten | 0 | 0.0% |
| Elementary School | 0 | 0.0% |
| Middle School | 4 | 100.0% |
| High School | 0 | 0.0% |
| College / Undergraduate | 0 | 0.0% |
| Graduate / Professional | 0 | 0.0% |
| Total | 4 | 100.0% |
School Enrollment by Age by Funding Source in Woodsville
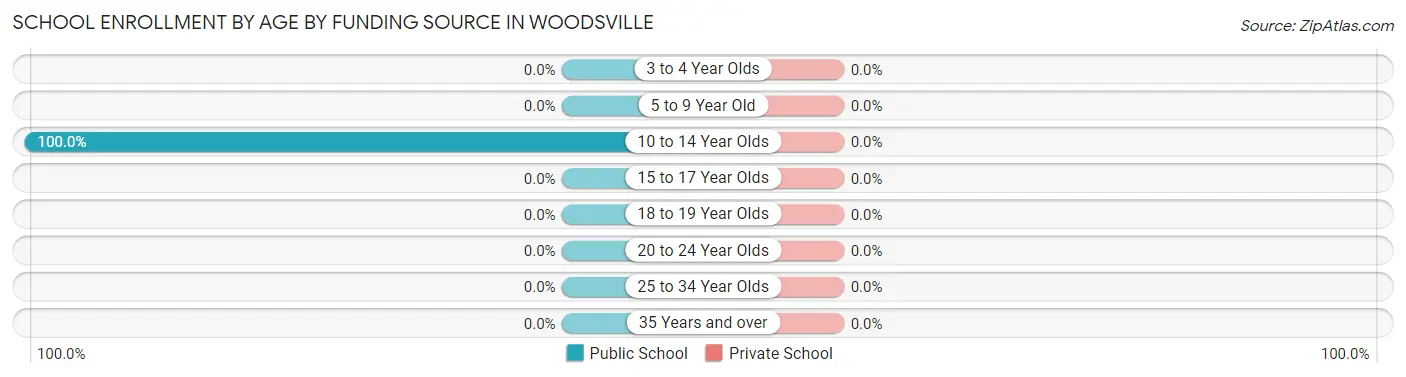
| Age Bracket | Public School | Private School |
| 3 to 4 Year Olds | 0 (0.0%) | 0 (0.0%) |
| 5 to 9 Year Old | 0 (0.0%) | 0 (0.0%) |
| 10 to 14 Year Olds | 4 (100.0%) | 0 (0.0%) |
| 15 to 17 Year Olds | 0 (0.0%) | 0 (0.0%) |
| 18 to 19 Year Olds | 0 (0.0%) | 0 (0.0%) |
| 20 to 24 Year Olds | 0 (0.0%) | 0 (0.0%) |
| 25 to 34 Year Olds | 0 (0.0%) | 0 (0.0%) |
| 35 Years and over | 0 (0.0%) | 0 (0.0%) |
| Total | 4 (100.0%) | 0 (0.0%) |
Educational Attainment by Field of Study in Woodsville
| Field of Study | # Graduates | % Graduates |
| Computers & Mathematics | 0 | 0.0% |
| Bio, Nature & Agricultural | 0 | 0.0% |
| Physical & Health Sciences | 0 | 0.0% |
| Psychology | 0 | 0.0% |
| Social Sciences | 0 | 0.0% |
| Engineering | 0 | 0.0% |
| Multidisciplinary Studies | 0 | 0.0% |
| Science & Technology | 0 | 0.0% |
| Business | 0 | 0.0% |
| Education | 0 | 0.0% |
| Literature & Languages | 0 | 0.0% |
| Liberal Arts & History | 0 | 0.0% |
| Visual & Performing Arts | 0 | 0.0% |
| Communications | 0 | 0.0% |
| Arts & Humanities | 0 | 0.0% |
| Total | 0 | 0.0% |
Transportation & Commute in Woodsville
Vehicle Availability by Sex in Woodsville
The most prevalent vehicle ownership categories in Woodsville are males with 3 vehicles (5, accounting for 45.5%) and females with 3 vehicles (3, making up 27.8%).
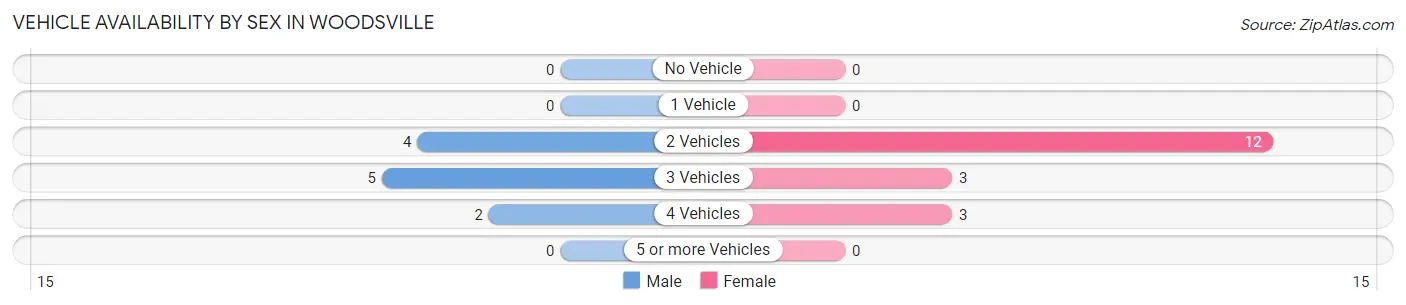
| Vehicles Available | Male | Female |
| No Vehicle | 0 (0.0%) | 0 (0.0%) |
| 1 Vehicle | 0 (0.0%) | 0 (0.0%) |
| 2 Vehicles | 4 (36.4%) | 12 (66.7%) |
| 3 Vehicles | 5 (45.5%) | 3 (16.7%) |
| 4 Vehicles | 2 (18.2%) | 3 (16.7%) |
| 5 or more Vehicles | 0 (0.0%) | 0 (0.0%) |
| Total | 11 (100.0%) | 18 (100.0%) |
Commute Time in Woodsville
The most frequently occuring commute durations in Woodsville are 10 to 14 minutes (17 commuters, 58.6%), 45 to 59 minutes (5 commuters, 17.2%), and 30 to 34 minutes (4 commuters, 13.8%).
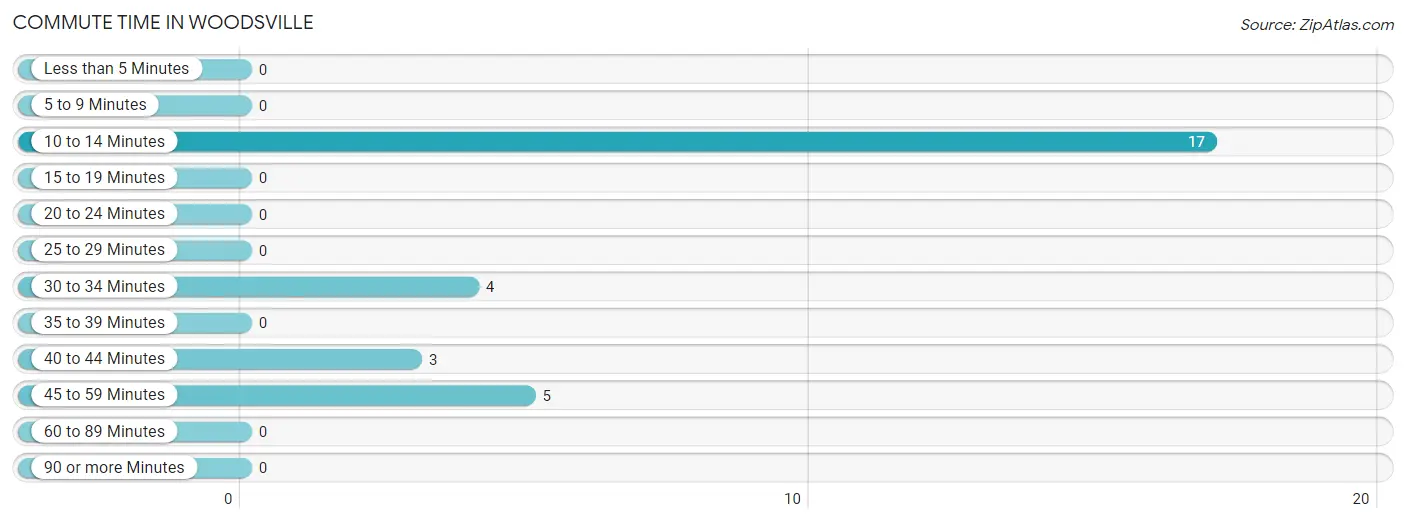
| Commute Time | # Commuters | % Commuters |
| Less than 5 Minutes | 0 | 0.0% |
| 5 to 9 Minutes | 0 | 0.0% |
| 10 to 14 Minutes | 17 | 58.6% |
| 15 to 19 Minutes | 0 | 0.0% |
| 20 to 24 Minutes | 0 | 0.0% |
| 25 to 29 Minutes | 0 | 0.0% |
| 30 to 34 Minutes | 4 | 13.8% |
| 35 to 39 Minutes | 0 | 0.0% |
| 40 to 44 Minutes | 3 | 10.3% |
| 45 to 59 Minutes | 5 | 17.2% |
| 60 to 89 Minutes | 0 | 0.0% |
| 90 or more Minutes | 0 | 0.0% |
Commute Time by Sex in Woodsville
The most common commute times in Woodsville are 45 to 59 minutes (5 commuters, 45.5%) for males and 10 to 14 minutes (15 commuters, 83.3%) for females.
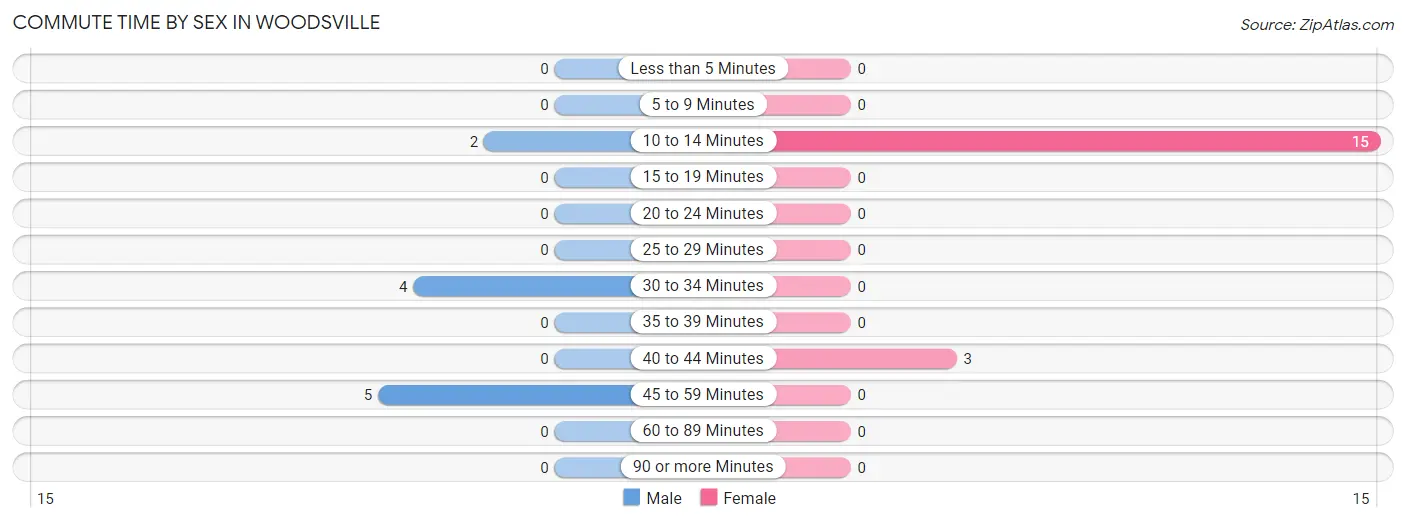
| Commute Time | Male | Female |
| Less than 5 Minutes | 0 (0.0%) | 0 (0.0%) |
| 5 to 9 Minutes | 0 (0.0%) | 0 (0.0%) |
| 10 to 14 Minutes | 2 (18.2%) | 15 (83.3%) |
| 15 to 19 Minutes | 0 (0.0%) | 0 (0.0%) |
| 20 to 24 Minutes | 0 (0.0%) | 0 (0.0%) |
| 25 to 29 Minutes | 0 (0.0%) | 0 (0.0%) |
| 30 to 34 Minutes | 4 (36.4%) | 0 (0.0%) |
| 35 to 39 Minutes | 0 (0.0%) | 0 (0.0%) |
| 40 to 44 Minutes | 0 (0.0%) | 3 (16.7%) |
| 45 to 59 Minutes | 5 (45.5%) | 0 (0.0%) |
| 60 to 89 Minutes | 0 (0.0%) | 0 (0.0%) |
| 90 or more Minutes | 0 (0.0%) | 0 (0.0%) |
Time of Departure to Work by Sex in Woodsville
The most frequent times of departure to work in Woodsville are 5:00 AM to 5:29 AM (6, 54.5%) for males and 4:00 PM to 11:59 PM (15, 83.3%) for females.
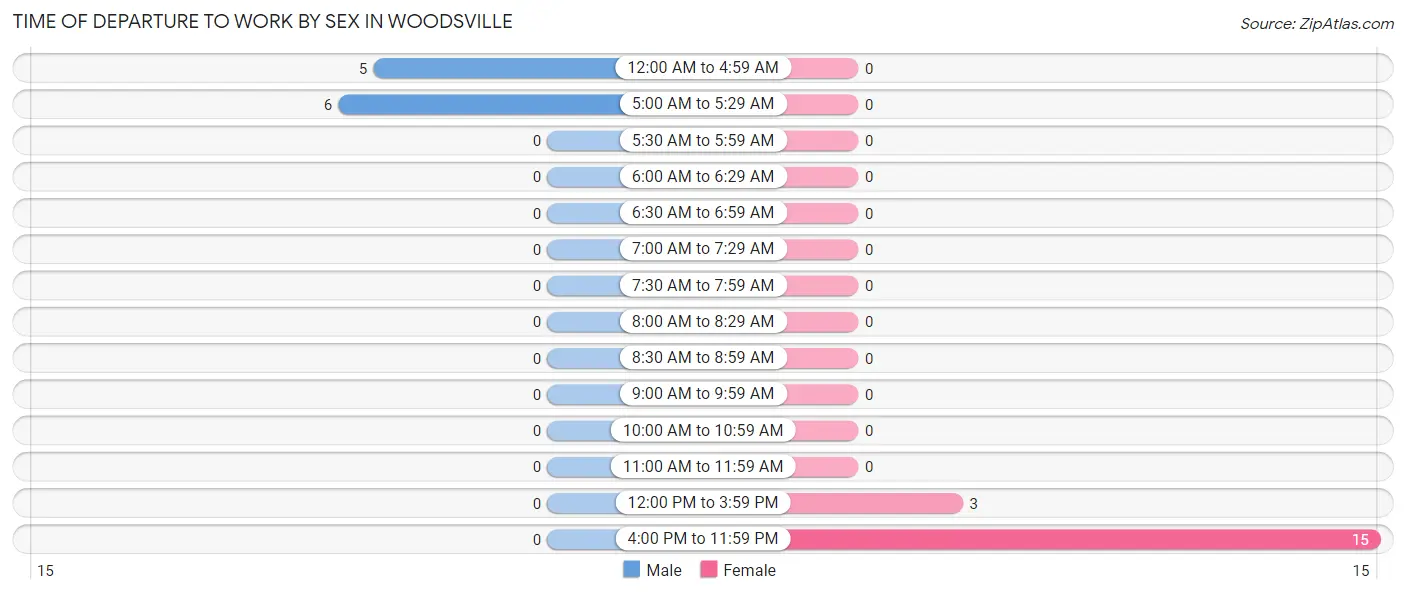
| Time of Departure | Male | Female |
| 12:00 AM to 4:59 AM | 5 (45.5%) | 0 (0.0%) |
| 5:00 AM to 5:29 AM | 6 (54.5%) | 0 (0.0%) |
| 5:30 AM to 5:59 AM | 0 (0.0%) | 0 (0.0%) |
| 6:00 AM to 6:29 AM | 0 (0.0%) | 0 (0.0%) |
| 6:30 AM to 6:59 AM | 0 (0.0%) | 0 (0.0%) |
| 7:00 AM to 7:29 AM | 0 (0.0%) | 0 (0.0%) |
| 7:30 AM to 7:59 AM | 0 (0.0%) | 0 (0.0%) |
| 8:00 AM to 8:29 AM | 0 (0.0%) | 0 (0.0%) |
| 8:30 AM to 8:59 AM | 0 (0.0%) | 0 (0.0%) |
| 9:00 AM to 9:59 AM | 0 (0.0%) | 0 (0.0%) |
| 10:00 AM to 10:59 AM | 0 (0.0%) | 0 (0.0%) |
| 11:00 AM to 11:59 AM | 0 (0.0%) | 0 (0.0%) |
| 12:00 PM to 3:59 PM | 0 (0.0%) | 3 (16.7%) |
| 4:00 PM to 11:59 PM | 0 (0.0%) | 15 (83.3%) |
| Total | 11 (100.0%) | 18 (100.0%) |
Housing Occupancy in Woodsville
Occupancy by Ownership in Woodsville
Of the total 26 dwellings in Woodsville, owner-occupied units account for 26 (100.0%), while renter-occupied units make up 0 (0.0%).
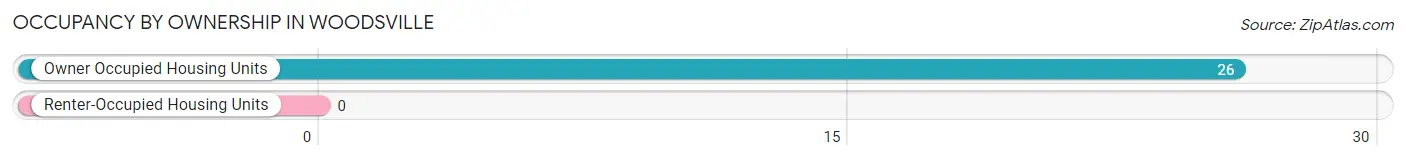
| Occupancy | # Housing Units | % Housing Units |
| Owner Occupied Housing Units | 26 | 100.0% |
| Renter-Occupied Housing Units | 0 | 0.0% |
| Total Occupied Housing Units | 26 | 100.0% |
Occupancy by Household Size in Woodsville
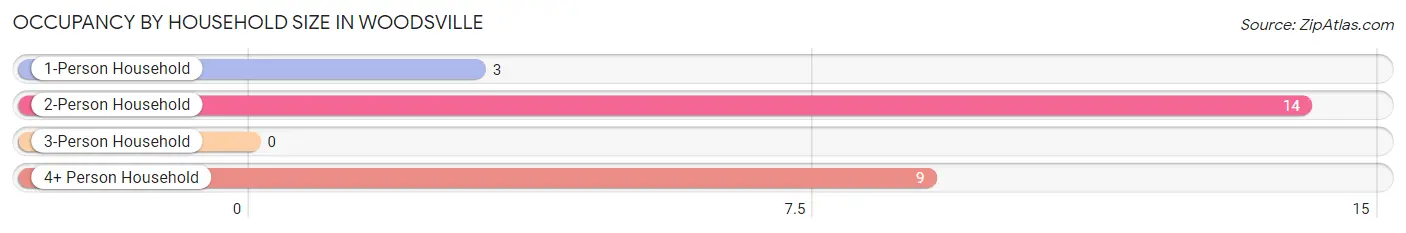
| Household Size | # Housing Units | % Housing Units |
| 1-Person Household | 3 | 11.5% |
| 2-Person Household | 14 | 53.8% |
| 3-Person Household | 0 | 0.0% |
| 4+ Person Household | 9 | 34.6% |
| Total Housing Units | 26 | 100.0% |
Occupancy by Ownership by Household Size in Woodsville
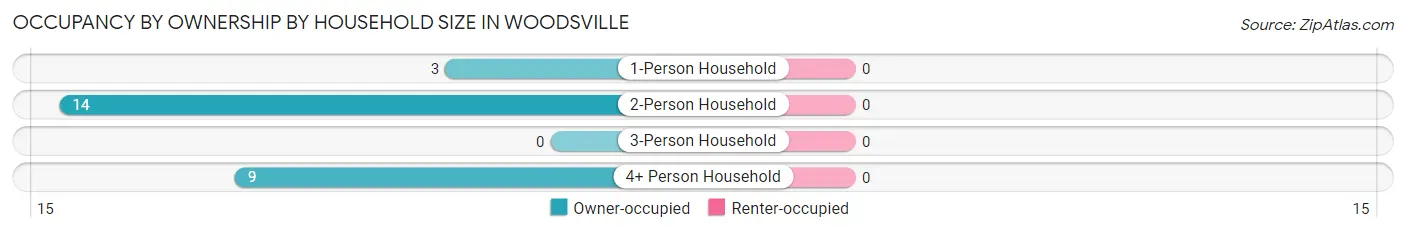
| Household Size | Owner-occupied | Renter-occupied |
| 1-Person Household | 3 (100.0%) | 0 (0.0%) |
| 2-Person Household | 14 (100.0%) | 0 (0.0%) |
| 3-Person Household | 0 (0.0%) | 0 (0.0%) |
| 4+ Person Household | 9 (100.0%) | 0 (0.0%) |
| Total Housing Units | 26 (100.0%) | 0 (0.0%) |
Occupancy by Educational Attainment in Woodsville
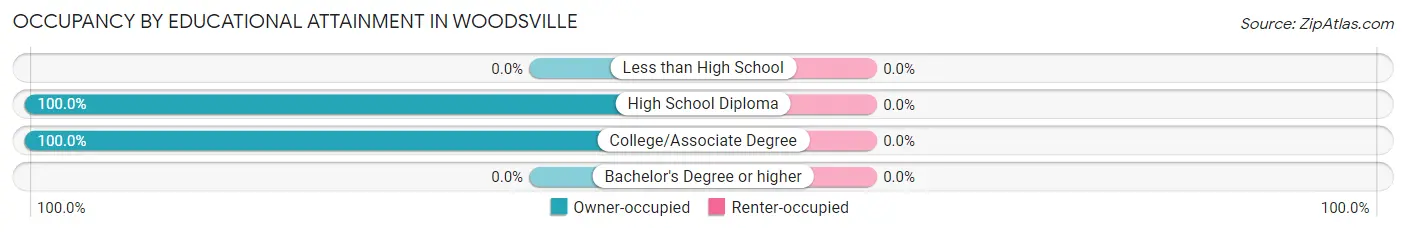
| Household Size | Owner-occupied | Renter-occupied |
| Less than High School | 0 (0.0%) | 0 (0.0%) |
| High School Diploma | 24 (100.0%) | 0 (0.0%) |
| College/Associate Degree | 2 (100.0%) | 0 (0.0%) |
| Bachelor's Degree or higher | 0 (0.0%) | 0 (0.0%) |
Occupancy by Age of Householder in Woodsville
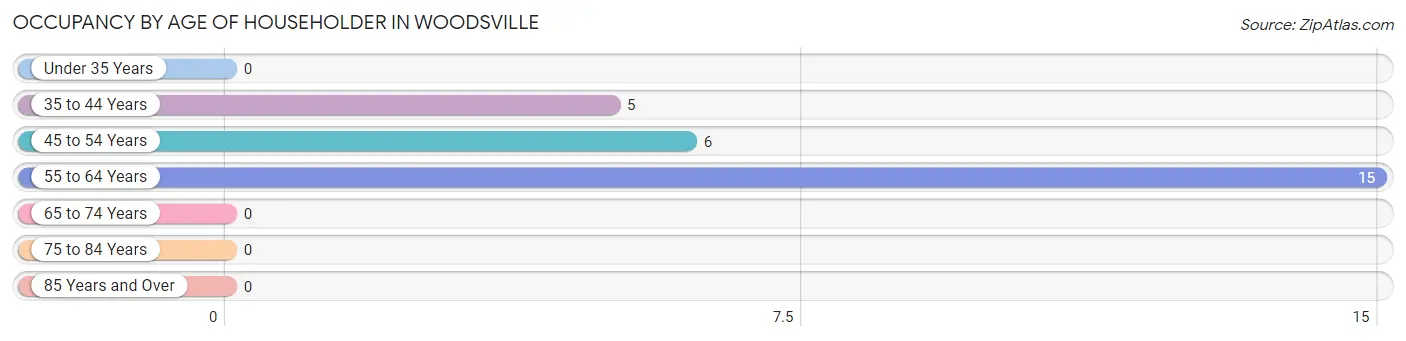
| Age Bracket | # Households | % Households |
| Under 35 Years | 0 | 0.0% |
| 35 to 44 Years | 5 | 19.2% |
| 45 to 54 Years | 6 | 23.1% |
| 55 to 64 Years | 15 | 57.7% |
| 65 to 74 Years | 0 | 0.0% |
| 75 to 84 Years | 0 | 0.0% |
| 85 Years and Over | 0 | 0.0% |
| Total | 26 | 100.0% |
Housing Finances in Woodsville
Median Income by Occupancy in Woodsville
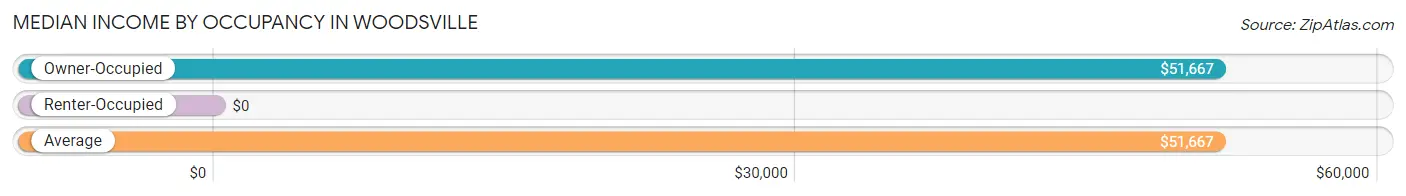
| Occupancy Type | # Households | Median Income |
| Owner-Occupied | 26 (100.0%) | $51,667 |
| Renter-Occupied | 0 (0.0%) | $0 |
| Average | 26 (100.0%) | $51,667 |
Occupancy by Householder Income Bracket in Woodsville
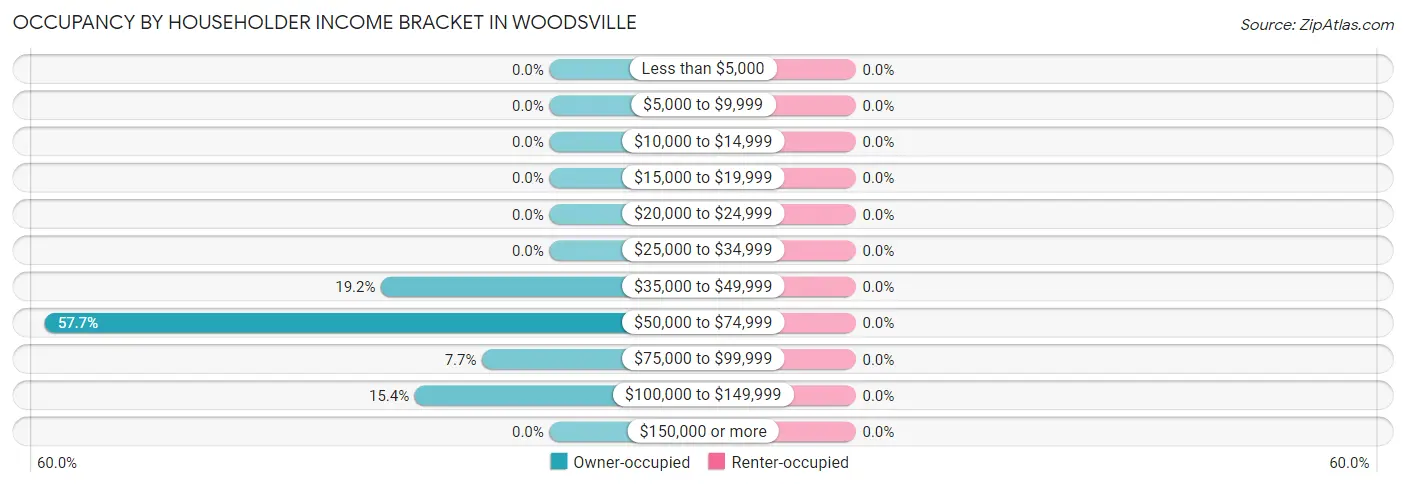
| Income Bracket | Owner-occupied | Renter-occupied |
| Less than $5,000 | 0 (0.0%) | 0 (0.0%) |
| $5,000 to $9,999 | 0 (0.0%) | 0 (0.0%) |
| $10,000 to $14,999 | 0 (0.0%) | 0 (0.0%) |
| $15,000 to $19,999 | 0 (0.0%) | 0 (0.0%) |
| $20,000 to $24,999 | 0 (0.0%) | 0 (0.0%) |
| $25,000 to $34,999 | 0 (0.0%) | 0 (0.0%) |
| $35,000 to $49,999 | 5 (19.2%) | 0 (0.0%) |
| $50,000 to $74,999 | 15 (57.7%) | 0 (0.0%) |
| $75,000 to $99,999 | 2 (7.7%) | 0 (0.0%) |
| $100,000 to $149,999 | 4 (15.4%) | 0 (0.0%) |
| $150,000 or more | 0 (0.0%) | 0 (0.0%) |
| Total | 26 (100.0%) | 0 (0.0%) |
Monthly Housing Cost Tiers in Woodsville
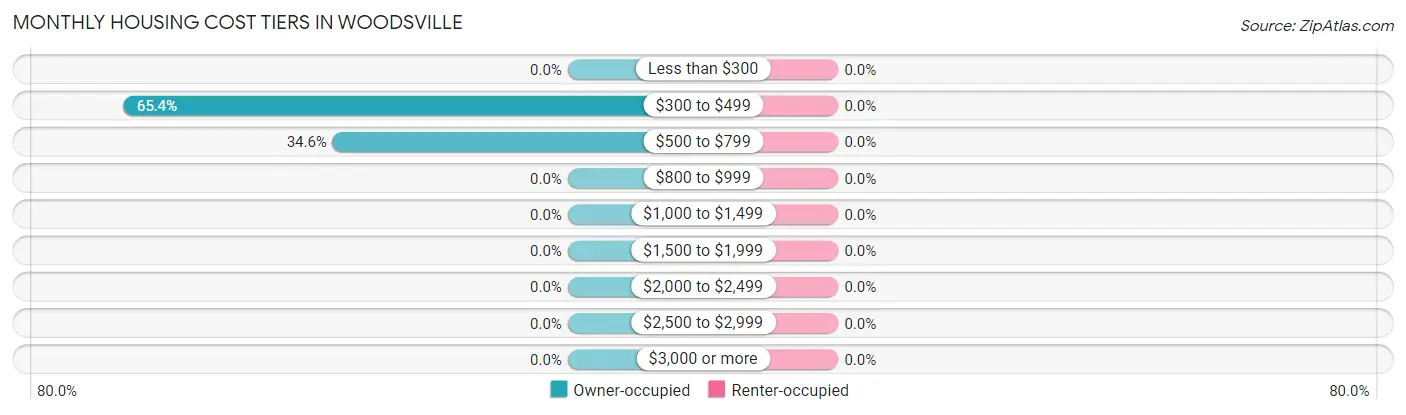
| Monthly Cost | Owner-occupied | Renter-occupied |
| Less than $300 | 0 (0.0%) | 0 (0.0%) |
| $300 to $499 | 17 (65.4%) | 0 (0.0%) |
| $500 to $799 | 9 (34.6%) | 0 (0.0%) |
| $800 to $999 | 0 (0.0%) | 0 (0.0%) |
| $1,000 to $1,499 | 0 (0.0%) | 0 (0.0%) |
| $1,500 to $1,999 | 0 (0.0%) | 0 (0.0%) |
| $2,000 to $2,499 | 0 (0.0%) | 0 (0.0%) |
| $2,500 to $2,999 | 0 (0.0%) | 0 (0.0%) |
| $3,000 or more | 0 (0.0%) | 0 (0.0%) |
| Total | 26 (100.0%) | 0 (0.0%) |
Physical Housing Characteristics in Woodsville
Housing Structures in Woodsville
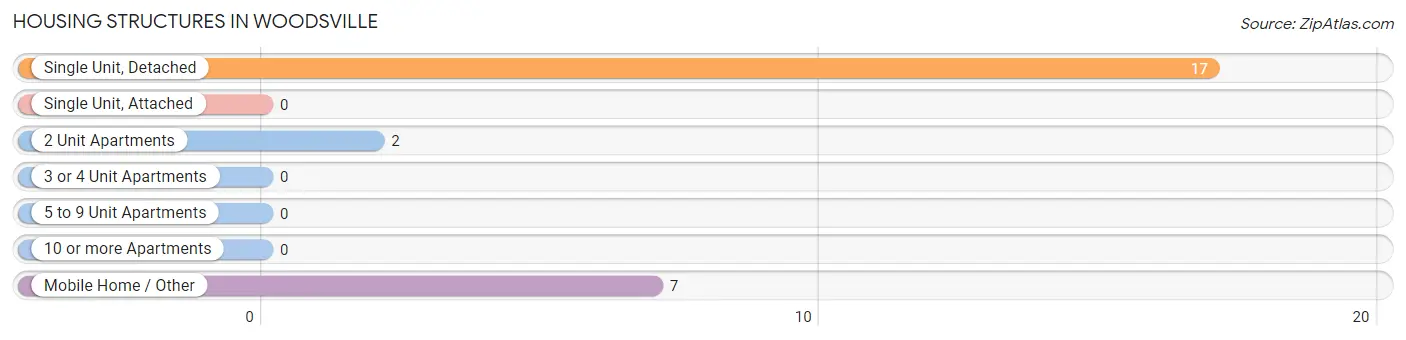
| Structure Type | # Housing Units | % Housing Units |
| Single Unit, Detached | 17 | 65.4% |
| Single Unit, Attached | 0 | 0.0% |
| 2 Unit Apartments | 2 | 7.7% |
| 3 or 4 Unit Apartments | 0 | 0.0% |
| 5 to 9 Unit Apartments | 0 | 0.0% |
| 10 or more Apartments | 0 | 0.0% |
| Mobile Home / Other | 7 | 26.9% |
| Total | 26 | 100.0% |
Housing Structures by Occupancy in Woodsville
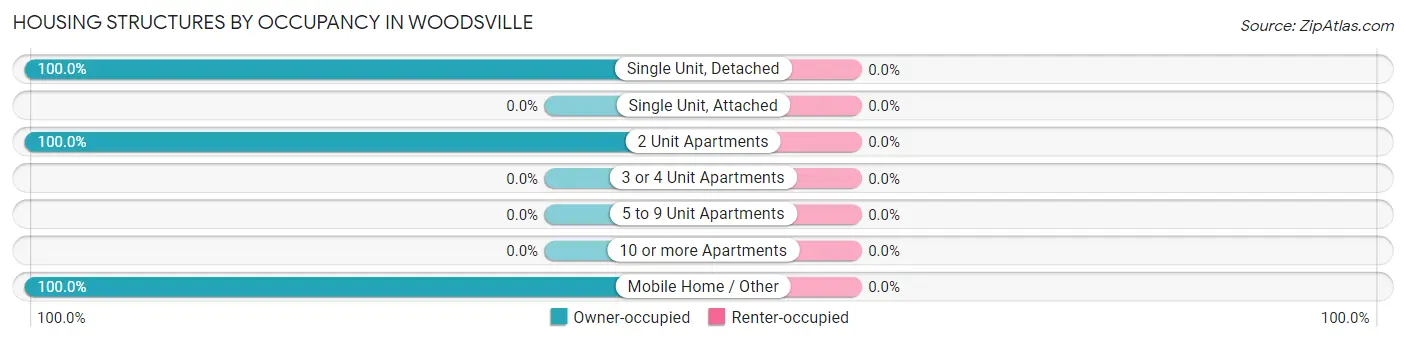
| Structure Type | Owner-occupied | Renter-occupied |
| Single Unit, Detached | 17 (100.0%) | 0 (0.0%) |
| Single Unit, Attached | 0 (0.0%) | 0 (0.0%) |
| 2 Unit Apartments | 2 (100.0%) | 0 (0.0%) |
| 3 or 4 Unit Apartments | 0 (0.0%) | 0 (0.0%) |
| 5 to 9 Unit Apartments | 0 (0.0%) | 0 (0.0%) |
| 10 or more Apartments | 0 (0.0%) | 0 (0.0%) |
| Mobile Home / Other | 7 (100.0%) | 0 (0.0%) |
| Total | 26 (100.0%) | 0 (0.0%) |
Housing Structures by Number of Rooms in Woodsville
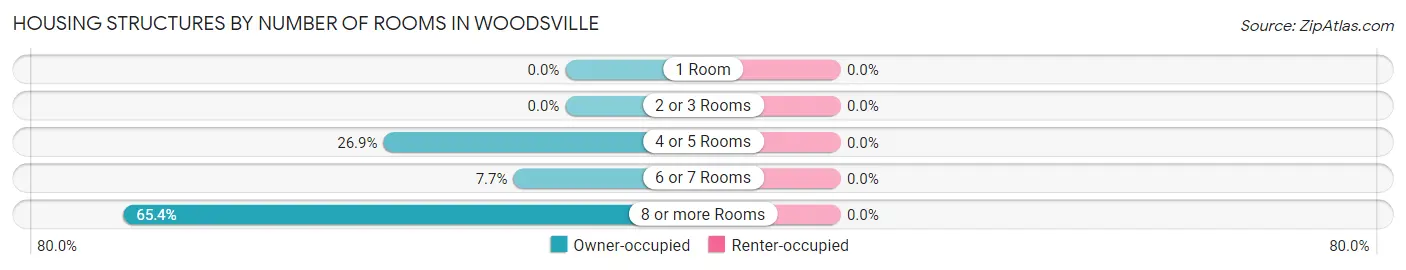
| Number of Rooms | Owner-occupied | Renter-occupied |
| 1 Room | 0 (0.0%) | 0 (0.0%) |
| 2 or 3 Rooms | 0 (0.0%) | 0 (0.0%) |
| 4 or 5 Rooms | 7 (26.9%) | 0 (0.0%) |
| 6 or 7 Rooms | 2 (7.7%) | 0 (0.0%) |
| 8 or more Rooms | 17 (65.4%) | 0 (0.0%) |
| Total | 26 (100.0%) | 0 (0.0%) |
Housing Structure by Heating Type in Woodsville
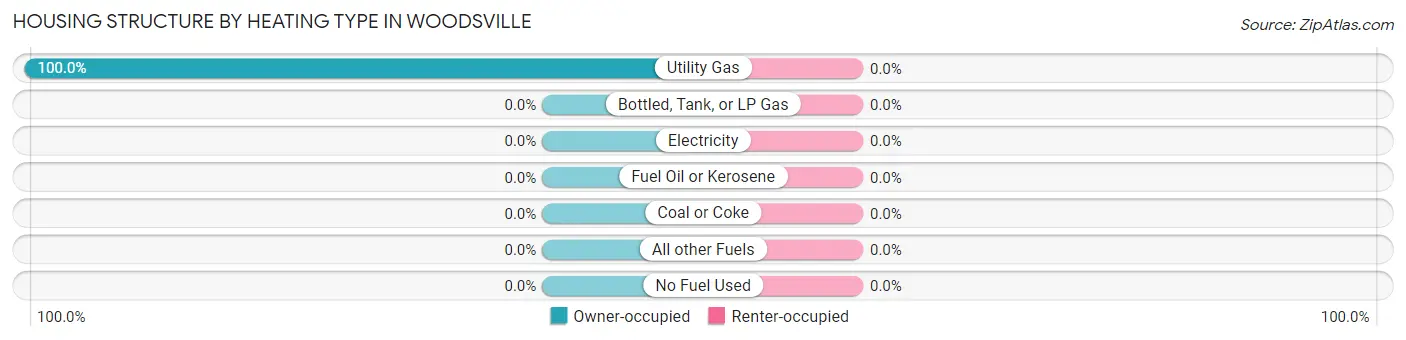
| Heating Type | Owner-occupied | Renter-occupied |
| Utility Gas | 26 (100.0%) | 0 (0.0%) |
| Bottled, Tank, or LP Gas | 0 (0.0%) | 0 (0.0%) |
| Electricity | 0 (0.0%) | 0 (0.0%) |
| Fuel Oil or Kerosene | 0 (0.0%) | 0 (0.0%) |
| Coal or Coke | 0 (0.0%) | 0 (0.0%) |
| All other Fuels | 0 (0.0%) | 0 (0.0%) |
| No Fuel Used | 0 (0.0%) | 0 (0.0%) |
| Total | 26 (100.0%) | 0 (0.0%) |
Household Vehicle Usage in Woodsville
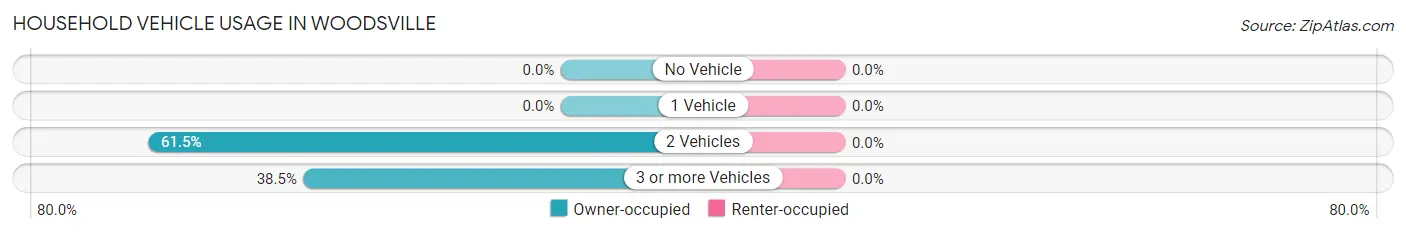
| Vehicles per Household | Owner-occupied | Renter-occupied |
| No Vehicle | 0 (0.0%) | 0 (0.0%) |
| 1 Vehicle | 0 (0.0%) | 0 (0.0%) |
| 2 Vehicles | 16 (61.5%) | 0 (0.0%) |
| 3 or more Vehicles | 10 (38.5%) | 0 (0.0%) |
| Total | 26 (100.0%) | 0 (0.0%) |
Real Estate & Mortgages in Woodsville
Real Estate and Mortgage Overview in Woodsville
| Characteristic | Without Mortgage | With Mortgage |
| Housing Units | 22 | 4 |
| Median Property Value | $86,500 | $0 |
| Median Household Income | $51,250 | $0 |
| Monthly Housing Costs | $396 | $0 |
| Real Estate Taxes | $1,750 | $0 |
Property Value by Mortgage Status in Woodsville
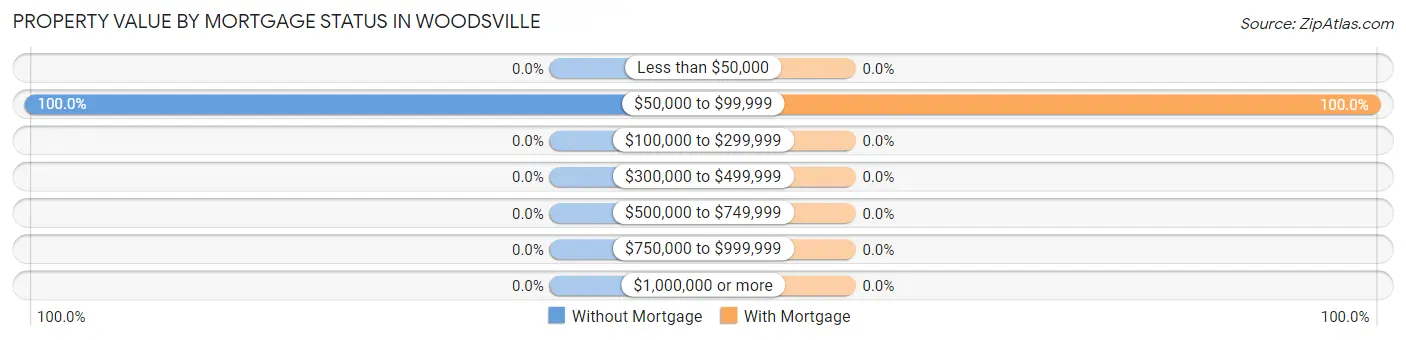
| Property Value | Without Mortgage | With Mortgage |
| Less than $50,000 | 0 (0.0%) | 0 (0.0%) |
| $50,000 to $99,999 | 22 (100.0%) | 4 (100.0%) |
| $100,000 to $299,999 | 0 (0.0%) | 0 (0.0%) |
| $300,000 to $499,999 | 0 (0.0%) | 0 (0.0%) |
| $500,000 to $749,999 | 0 (0.0%) | 0 (0.0%) |
| $750,000 to $999,999 | 0 (0.0%) | 0 (0.0%) |
| $1,000,000 or more | 0 (0.0%) | 0 (0.0%) |
| Total | 22 (100.0%) | 4 (100.0%) |
Household Income by Mortgage Status in Woodsville
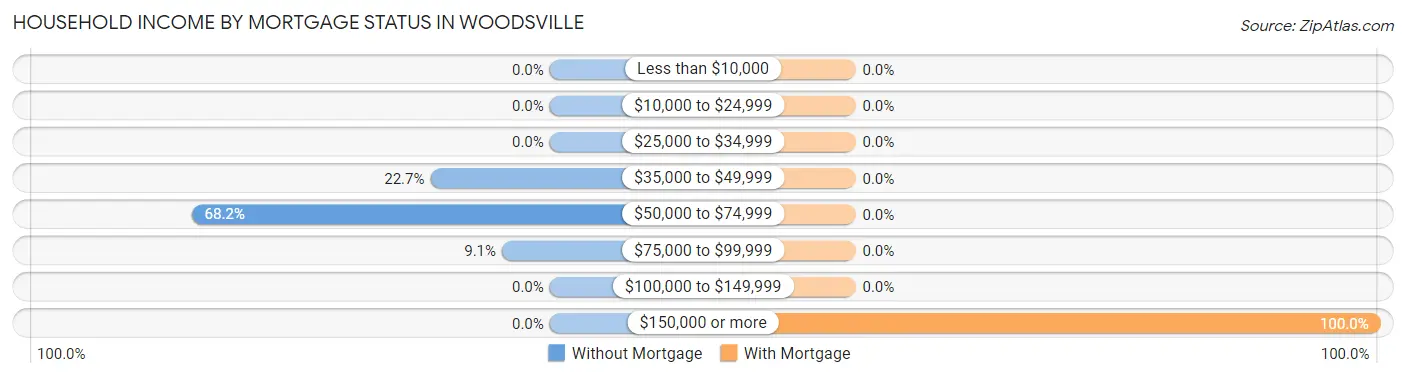
| Household Income | Without Mortgage | With Mortgage |
| Less than $10,000 | 0 (0.0%) | 0 (0.0%) |
| $10,000 to $24,999 | 0 (0.0%) | 0 (0.0%) |
| $25,000 to $34,999 | 0 (0.0%) | 0 (0.0%) |
| $35,000 to $49,999 | 5 (22.7%) | 0 (0.0%) |
| $50,000 to $74,999 | 15 (68.2%) | 0 (0.0%) |
| $75,000 to $99,999 | 2 (9.1%) | 0 (0.0%) |
| $100,000 to $149,999 | 0 (0.0%) | 0 (0.0%) |
| $150,000 or more | 0 (0.0%) | 4 (100.0%) |
| Total | 22 (100.0%) | 4 (100.0%) |
Property Value to Household Income Ratio in Woodsville
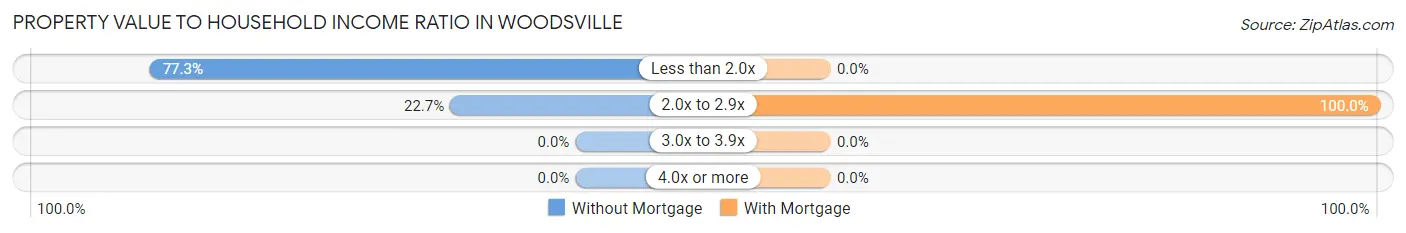
| Value-to-Income Ratio | Without Mortgage | With Mortgage |
| Less than 2.0x | 17 (77.3%) | 0 (0.0%) |
| 2.0x to 2.9x | 5 (22.7%) | 4 (100.0%) |
| 3.0x to 3.9x | 0 (0.0%) | 0 (0.0%) |
| 4.0x or more | 0 (0.0%) | 0 (0.0%) |
| Total | 22 (100.0%) | 4 (100.0%) |
Real Estate Taxes by Mortgage Status in Woodsville
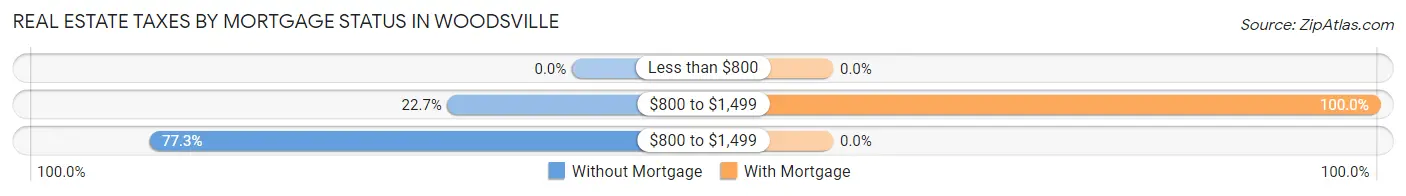
| Property Taxes | Without Mortgage | With Mortgage |
| Less than $800 | 0 (0.0%) | 0 (0.0%) |
| $800 to $1,499 | 5 (22.7%) | 4 (100.0%) |
| $800 to $1,499 | 17 (77.3%) | 0 (0.0%) |
| Total | 22 (100.0%) | 4 (100.0%) |
Health & Disability in Woodsville
Health Insurance Coverage by Age in Woodsville
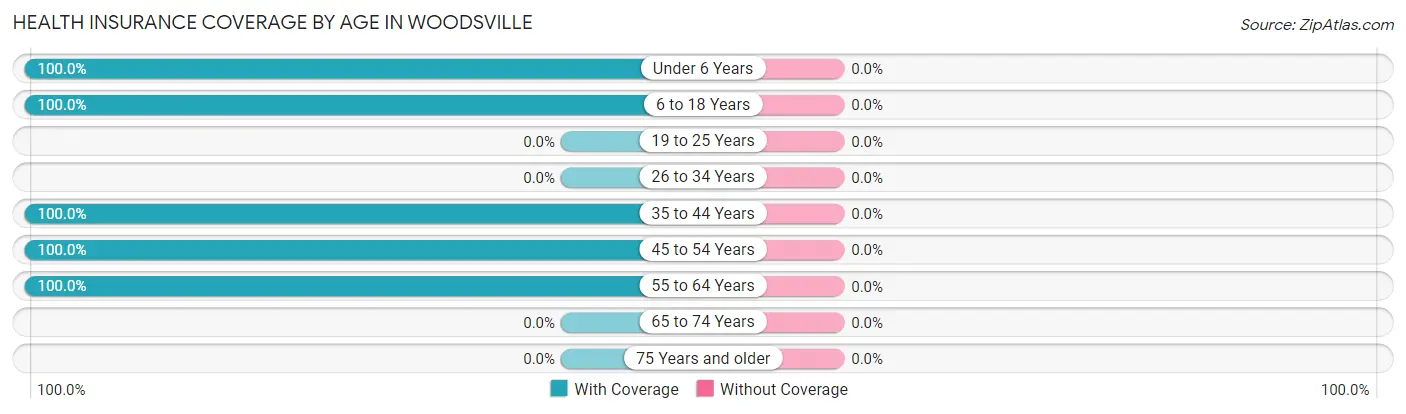
| Age Bracket | With Coverage | Without Coverage |
| Under 6 Years | 8 (100.0%) | 0 (0.0%) |
| 6 to 18 Years | 9 (100.0%) | 0 (0.0%) |
| 19 to 25 Years | 0 (0.0%) | 0 (0.0%) |
| 26 to 34 Years | 0 (0.0%) | 0 (0.0%) |
| 35 to 44 Years | 10 (100.0%) | 0 (0.0%) |
| 45 to 54 Years | 10 (100.0%) | 0 (0.0%) |
| 55 to 64 Years | 30 (100.0%) | 0 (0.0%) |
| 65 to 74 Years | 0 (0.0%) | 0 (0.0%) |
| 75 Years and older | 0 (0.0%) | 0 (0.0%) |
| Total | 67 (100.0%) | 0 (0.0%) |
Health Insurance Coverage by Citizenship Status in Woodsville
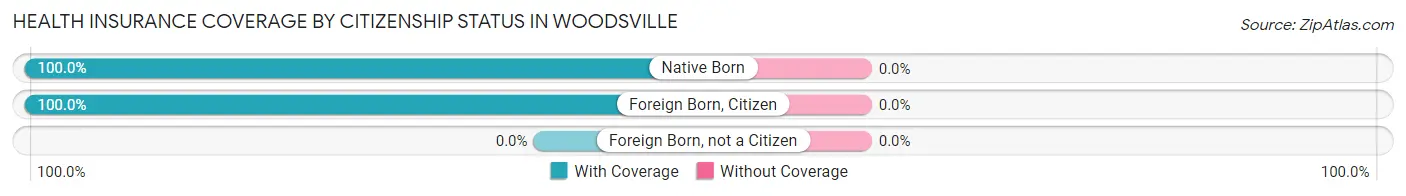
| Citizenship Status | With Coverage | Without Coverage |
| Native Born | 8 (100.0%) | 0 (0.0%) |
| Foreign Born, Citizen | 9 (100.0%) | 0 (0.0%) |
| Foreign Born, not a Citizen | 0 (0.0%) | 0 (0.0%) |
Health Insurance Coverage by Household Income in Woodsville
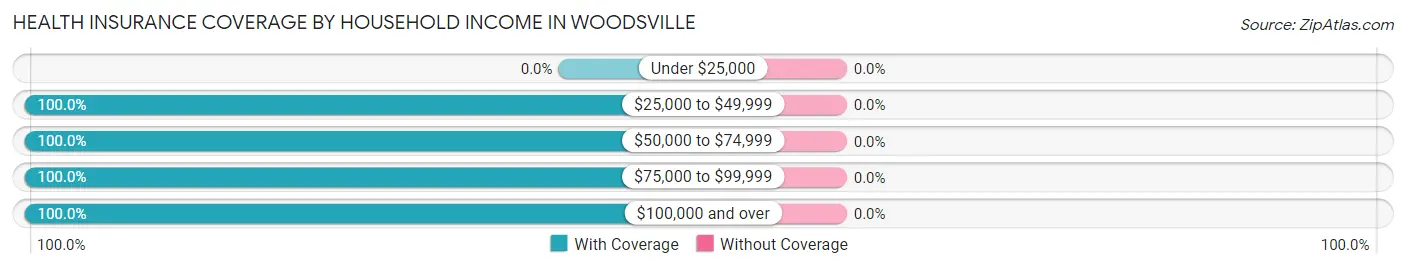
| Household Income | With Coverage | Without Coverage |
| Under $25,000 | 0 (0.0%) | 0 (0.0%) |
| $25,000 to $49,999 | 19 (100.0%) | 0 (0.0%) |
| $50,000 to $74,999 | 27 (100.0%) | 0 (0.0%) |
| $75,000 to $99,999 | 5 (100.0%) | 0 (0.0%) |
| $100,000 and over | 16 (100.0%) | 0 (0.0%) |
Public vs Private Health Insurance Coverage by Age in Woodsville
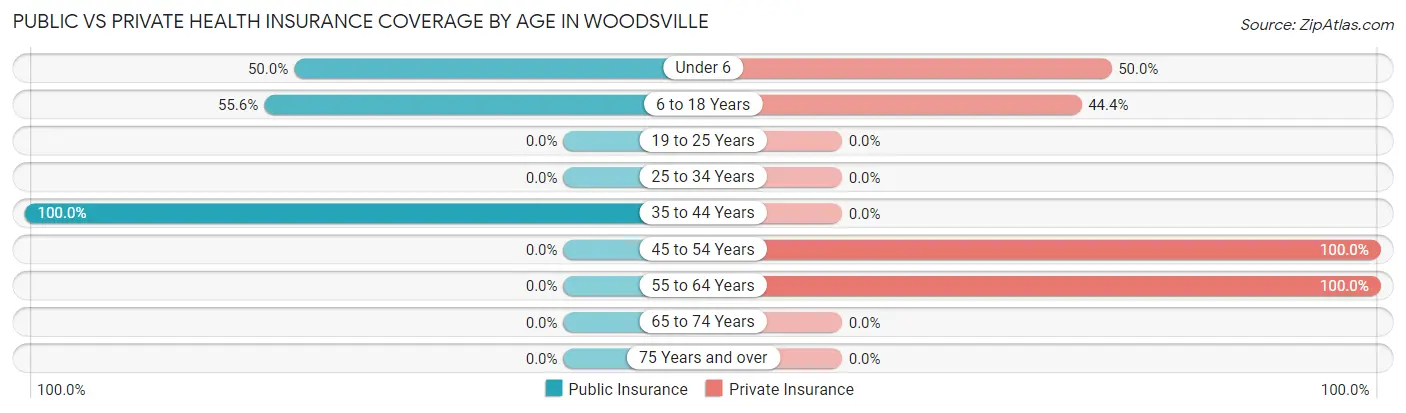
| Age Bracket | Public Insurance | Private Insurance |
| Under 6 | 4 (50.0%) | 4 (50.0%) |
| 6 to 18 Years | 5 (55.6%) | 4 (44.4%) |
| 19 to 25 Years | 0 (0.0%) | 0 (0.0%) |
| 25 to 34 Years | 0 (0.0%) | 0 (0.0%) |
| 35 to 44 Years | 10 (100.0%) | 0 (0.0%) |
| 45 to 54 Years | 0 (0.0%) | 10 (100.0%) |
| 55 to 64 Years | 0 (0.0%) | 30 (100.0%) |
| 65 to 74 Years | 0 (0.0%) | 0 (0.0%) |
| 75 Years and over | 0 (0.0%) | 0 (0.0%) |
| Total | 19 (28.4%) | 48 (71.6%) |
Disability Status by Sex by Age in Woodsville
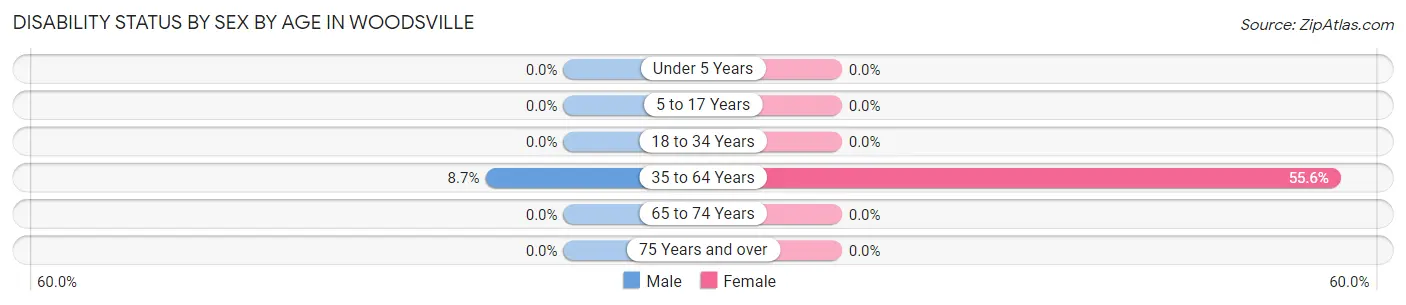
| Age Bracket | Male | Female |
| Under 5 Years | 0 (0.0%) | 0 (0.0%) |
| 5 to 17 Years | 0 (0.0%) | 0 (0.0%) |
| 18 to 34 Years | 0 (0.0%) | 0 (0.0%) |
| 35 to 64 Years | 2 (8.7%) | 15 (55.6%) |
| 65 to 74 Years | 0 (0.0%) | 0 (0.0%) |
| 75 Years and over | 0 (0.0%) | 0 (0.0%) |
Disability Class by Sex by Age in Woodsville
Disability Class: Hearing Difficulty
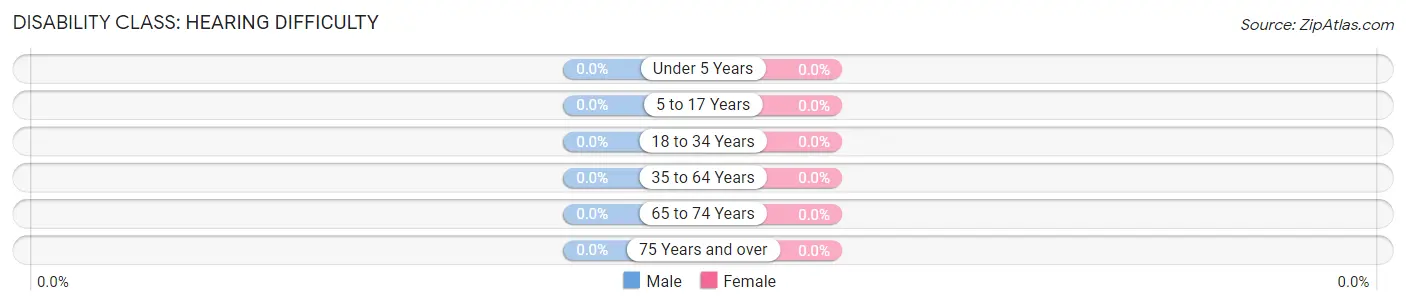
| Age Bracket | Male | Female |
| Under 5 Years | 0 (0.0%) | 0 (0.0%) |
| 5 to 17 Years | 0 (0.0%) | 0 (0.0%) |
| 18 to 34 Years | 0 (0.0%) | 0 (0.0%) |
| 35 to 64 Years | 0 (0.0%) | 0 (0.0%) |
| 65 to 74 Years | 0 (0.0%) | 0 (0.0%) |
| 75 Years and over | 0 (0.0%) | 0 (0.0%) |
Disability Class: Vision Difficulty
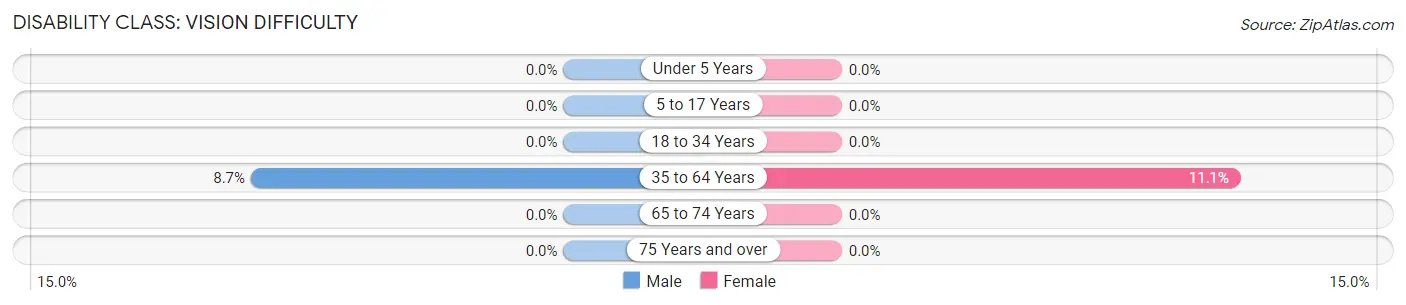
| Age Bracket | Male | Female |
| Under 5 Years | 0 (0.0%) | 0 (0.0%) |
| 5 to 17 Years | 0 (0.0%) | 0 (0.0%) |
| 18 to 34 Years | 0 (0.0%) | 0 (0.0%) |
| 35 to 64 Years | 2 (8.7%) | 3 (11.1%) |
| 65 to 74 Years | 0 (0.0%) | 0 (0.0%) |
| 75 Years and over | 0 (0.0%) | 0 (0.0%) |
Disability Class: Cognitive Difficulty

| Age Bracket | Male | Female |
| 5 to 17 Years | 0 (0.0%) | 0 (0.0%) |
| 18 to 34 Years | 0 (0.0%) | 0 (0.0%) |
| 35 to 64 Years | 0 (0.0%) | 0 (0.0%) |
| 65 to 74 Years | 0 (0.0%) | 0 (0.0%) |
| 75 Years and over | 0 (0.0%) | 0 (0.0%) |
Disability Class: Ambulatory Difficulty
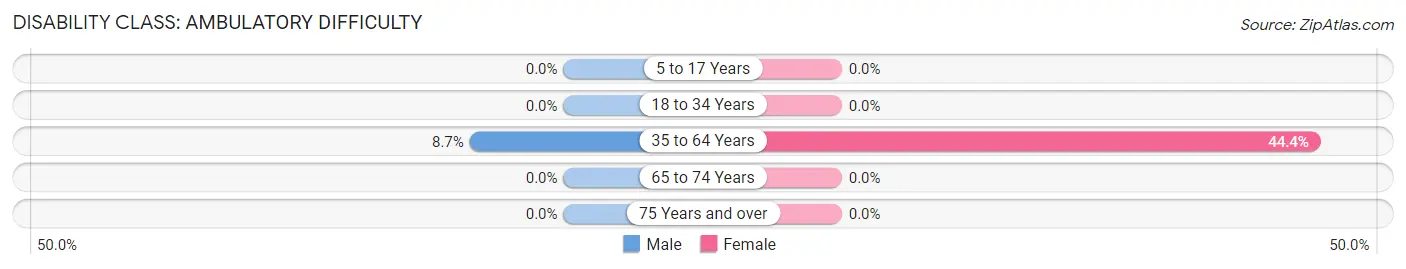
| Age Bracket | Male | Female |
| 5 to 17 Years | 0 (0.0%) | 0 (0.0%) |
| 18 to 34 Years | 0 (0.0%) | 0 (0.0%) |
| 35 to 64 Years | 2 (8.7%) | 12 (44.4%) |
| 65 to 74 Years | 0 (0.0%) | 0 (0.0%) |
| 75 Years and over | 0 (0.0%) | 0 (0.0%) |
Disability Class: Self-Care Difficulty
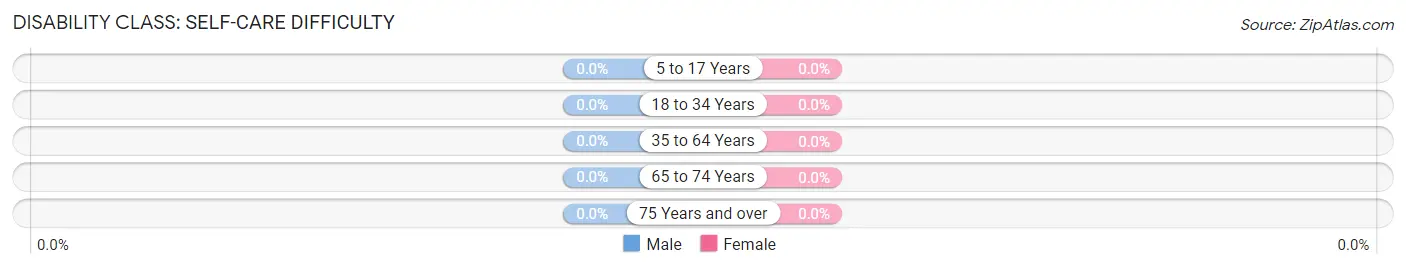
| Age Bracket | Male | Female |
| 5 to 17 Years | 0 (0.0%) | 0 (0.0%) |
| 18 to 34 Years | 0 (0.0%) | 0 (0.0%) |
| 35 to 64 Years | 0 (0.0%) | 0 (0.0%) |
| 65 to 74 Years | 0 (0.0%) | 0 (0.0%) |
| 75 Years and over | 0 (0.0%) | 0 (0.0%) |
Technology Access in Woodsville
Computing Device Access in Woodsville
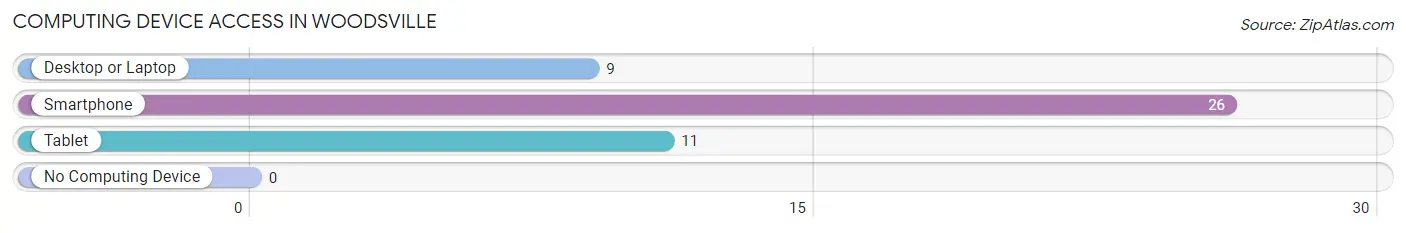
| Device Type | # Households | % Households |
| Desktop or Laptop | 9 | 34.6% |
| Smartphone | 26 | 100.0% |
| Tablet | 11 | 42.3% |
| No Computing Device | 0 | 0.0% |
| Total | 26 | 100.0% |
Internet Access in Woodsville
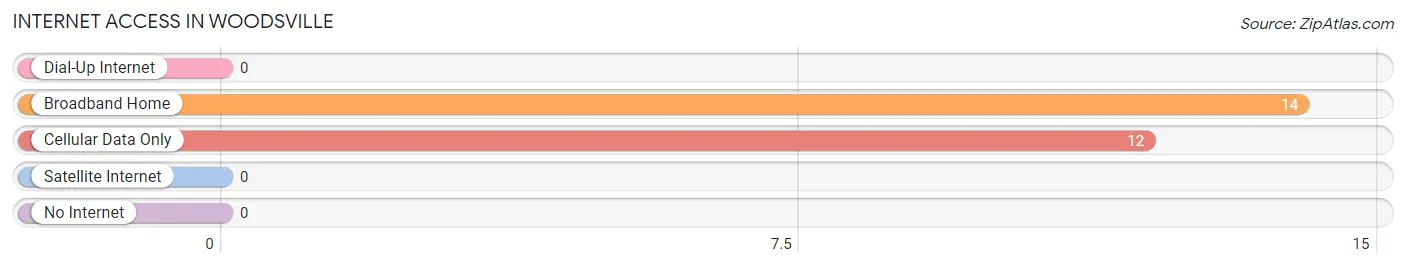
| Internet Type | # Households | % Households |
| Dial-Up Internet | 0 | 0.0% |
| Broadband Home | 14 | 53.8% |
| Cellular Data Only | 12 | 46.2% |
| Satellite Internet | 0 | 0.0% |
| No Internet | 0 | 0.0% |
| Total | 26 | 100.0% |
Woodsville Summary
Woodsville is a small village located in the town of Haverstraw, Rockland County, New York. It is situated on the west bank of the Hudson River, about 25 miles north of New York City. The village is part of the larger Haverstraw-Stony Point Central School District.
History
Woodsville was first settled in the late 1700s by the Dutch and English. The village was originally known as “Woods Landing” and was a popular stop for travelers on the Hudson River. In 1845, the village was officially incorporated as “Woodsville”.
The village was home to a number of industries, including a brickyard, a sawmill, and a gristmill. The village also had a ferry service that connected it to the nearby towns of Haverstraw and Stony Point.
In the late 1800s, the village was home to a number of resorts and hotels, which attracted visitors from New York City and other parts of the country. The village also had a number of churches, including the First Presbyterian Church, which was founded in 1845.
In the early 1900s, the village was home to a number of factories, including a paper mill, a silk mill, and a shoe factory. The village also had a number of stores, including a general store, a drug store, and a hardware store.
In the mid-1900s, the village began to decline as industry moved away and the population decreased. The village was eventually annexed by the town of Haverstraw in the 1970s.
Geography
Woodsville is located in the town of Haverstraw, Rockland County, New York. It is situated on the west bank of the Hudson River, about 25 miles north of New York City. The village is part of the larger Haverstraw-Stony Point Central School District.
The village is bordered by the Hudson River to the east, the town of Stony Point to the north, the town of Haverstraw to the south, and the town of Ramapo to the west. The village is located in the Hudson Valley region of New York.
Economy
The economy of Woodsville is largely based on tourism and retail. The village is home to a number of restaurants, shops, and other businesses. The village also has a number of parks and recreational areas, including the Hudson River Park and the Woodsville Nature Preserve.
The village is also home to a number of small businesses, including a bakery, a florist, and a hardware store. The village also has a number of professional services, including a law office, a real estate office, and a financial services firm.
Demographics
As of the 2010 census, the population of Woodsville was 1,845. The racial makeup of the village was 87.3% White, 5.2% African American, 0.3% Native American, 1.2% Asian, 0.1% Pacific Islander, 3.2% from other races, and 2.9% from two or more races. Hispanic or Latino of any race were 8.2% of the population.
The median household income in Woodsville was $50,972, and the median family income was $60,972. The per capita income in the village was $25,972. About 8.2% of families and 10.2% of the population were below the poverty line, including 14.2% of those under age 18 and 5.2% of those age 65 or over.
Common Questions
What is Per Capita Income in Woodsville?
Per Capita income in Woodsville is $25,552.
What is the Median Family Income in Woodsville?
Median Family Income in Woodsville is $51,146.
What is the Median Household income in Woodsville?
Median Household Income in Woodsville is $51,667.
What is Inequality or Gini Index in Woodsville?
Inequality or Gini Index in Woodsville is 0.19.
What is the Total Population of Woodsville?
Total Population of Woodsville is 67.
What is the Total Male Population of Woodsville?
Total Male Population of Woodsville is 31.
What is the Total Female Population of Woodsville?
Total Female Population of Woodsville is 36.
What is the Ratio of Males per 100 Females in Woodsville?
There are 86.11 Males per 100 Females in Woodsville.
What is the Ratio of Females per 100 Males in Woodsville?
There are 116.13 Females per 100 Males in Woodsville.
What is the Median Population Age in Woodsville?
Median Population Age in Woodsville is 48.8 Years.
What is the Average Family Size in Woodsville
Average Family Size in Woodsville is 2.8 People.
What is the Average Household Size in Woodsville
Average Household Size in Woodsville is 2.6 People.
How Large is the Labor Force in Woodsville?
There are 29 People in the Labor Forcein in Woodsville.
What is the Percentage of People in the Labor Force in Woodsville?
58.0% of People are in the Labor Force in Woodsville.