Tuscarora, NY Map & Demographics
Tuscarora Map
Tuscarora Overview
$39,989
PER CAPITA INCOME
$78,125
AVG FAMILY INCOME
0.17
INEQUALITY / GINI INDEX
167
TOTAL POPULATION
109
MALE POPULATION
58
FEMALE POPULATION
187.93
MALES / 100 FEMALES
53.21
FEMALES / 100 MALES
46.8
MEDIAN AGE
2.8
AVG FAMILY SIZE
2.8
AVG HOUSEHOLD SIZE
104
LABOR FORCE [ PEOPLE ]
62.3%
PERCENT IN LABOR FORCE
Tuscarora Area Codes
Income in Tuscarora
Income Overview in Tuscarora
| Characteristic | Number | Measure |
| Per Capita Income | 167 | $39,989 |
| Median Family Income | 39 | $78,125 |
| Mean Family Income | 39 | $95,508 |
| Median Household Income | 59 | $0 |
| Mean Household Income | 59 | $111,719 |
| Income Deficit | 39 | $0 |
| Wage / Income Gap (%) | 167 | 0.00% |
| Wage / Income Gap ($) | 167 | 100.00¢ per $1 |
| Gini / Inequality Index | 167 | 0.17 |
Earnings by Sex in Tuscarora
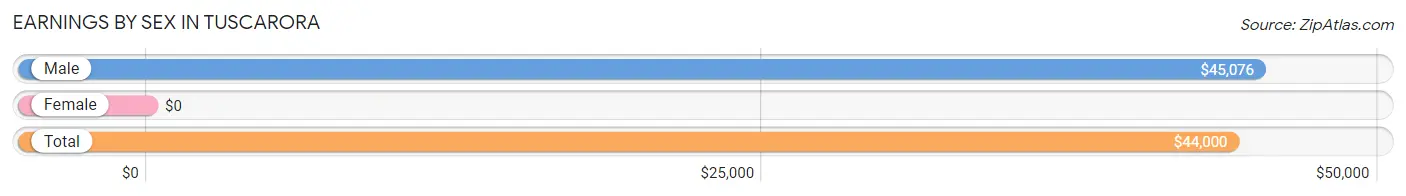
| Sex | Number | Average Earnings |
| Male | 86 (82.7%) | $45,076 |
| Female | 18 (17.3%) | $0 |
| Total | 104 (100.0%) | $44,000 |
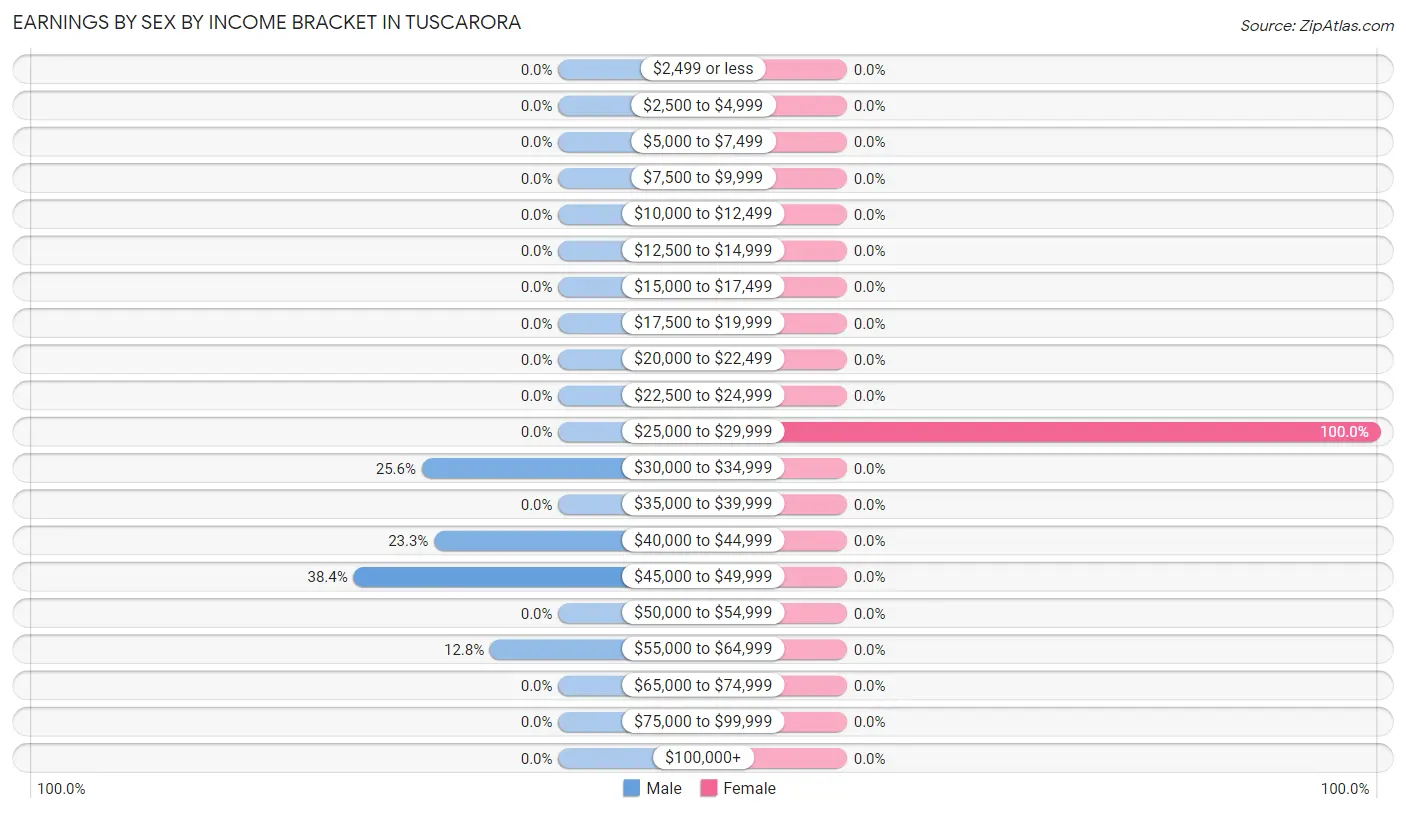
Earnings by Sex by Income Bracket in Tuscarora
The most common earnings brackets in Tuscarora are $45,000 to $49,999 for men (33 | 38.4%) and $25,000 to $29,999 for women (18 | 100.0%).
| Income | Male | Female |
| $2,499 or less | 0 (0.0%) | 0 (0.0%) |
| $2,500 to $4,999 | 0 (0.0%) | 0 (0.0%) |
| $5,000 to $7,499 | 0 (0.0%) | 0 (0.0%) |
| $7,500 to $9,999 | 0 (0.0%) | 0 (0.0%) |
| $10,000 to $12,499 | 0 (0.0%) | 0 (0.0%) |
| $12,500 to $14,999 | 0 (0.0%) | 0 (0.0%) |
| $15,000 to $17,499 | 0 (0.0%) | 0 (0.0%) |
| $17,500 to $19,999 | 0 (0.0%) | 0 (0.0%) |
| $20,000 to $22,499 | 0 (0.0%) | 0 (0.0%) |
| $22,500 to $24,999 | 0 (0.0%) | 0 (0.0%) |
| $25,000 to $29,999 | 0 (0.0%) | 18 (100.0%) |
| $30,000 to $34,999 | 22 (25.6%) | 0 (0.0%) |
| $35,000 to $39,999 | 0 (0.0%) | 0 (0.0%) |
| $40,000 to $44,999 | 20 (23.3%) | 0 (0.0%) |
| $45,000 to $49,999 | 33 (38.4%) | 0 (0.0%) |
| $50,000 to $54,999 | 0 (0.0%) | 0 (0.0%) |
| $55,000 to $64,999 | 11 (12.8%) | 0 (0.0%) |
| $65,000 to $74,999 | 0 (0.0%) | 0 (0.0%) |
| $75,000 to $99,999 | 0 (0.0%) | 0 (0.0%) |
| $100,000+ | 0 (0.0%) | 0 (0.0%) |
| Total | 86 (100.0%) | 18 (100.0%) |
Earnings by Sex by Educational Attainment in Tuscarora
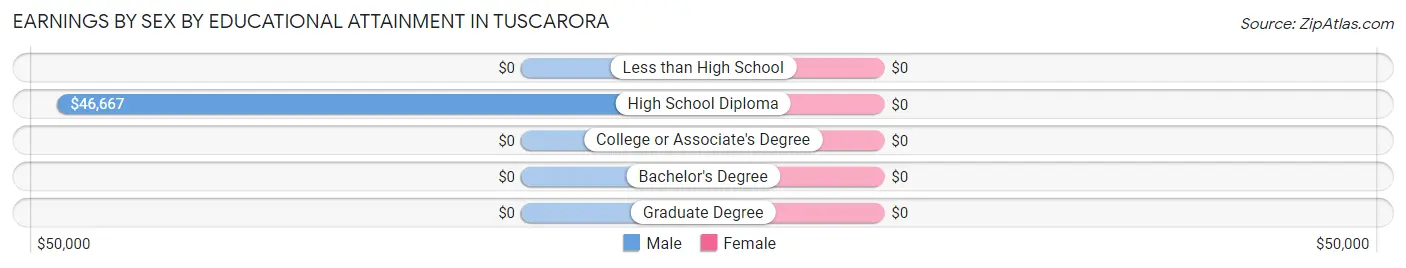
| Educational Attainment | Male Income | Female Income |
| Less than High School | - | - |
| High School Diploma | $46,667 | $0 |
| College or Associate's Degree | - | - |
| Bachelor's Degree | - | - |
| Graduate Degree | - | - |
| Total | $45,076 | $0 |
Family Income in Tuscarora
Family Income Brackets in Tuscarora
According to the Tuscarora family income data, there are 30 families falling into the $75,000 to $99,999 income range, which is the most common income bracket and makes up 76.9% of all families.
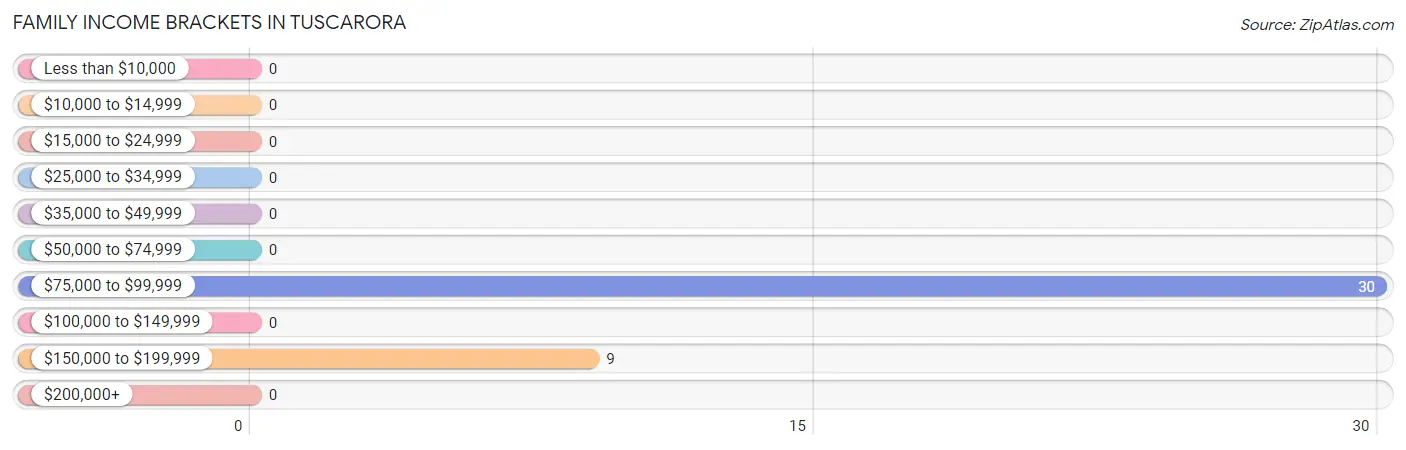
| Income Bracket | # Families | % Families |
| Less than $10,000 | 0 | 0.0% |
| $10,000 to $14,999 | 0 | 0.0% |
| $15,000 to $24,999 | 0 | 0.0% |
| $25,000 to $34,999 | 0 | 0.0% |
| $35,000 to $49,999 | 0 | 0.0% |
| $50,000 to $74,999 | 0 | 0.0% |
| $75,000 to $99,999 | 30 | 76.9% |
| $100,000 to $149,999 | 0 | 0.0% |
| $150,000 to $199,999 | 9 | 23.1% |
| $200,000+ | 0 | 0.0% |
Family Income by Famaliy Size in Tuscarora
| Income Bracket | # Families | Median Income |
| 2-Person Families | 16 (41.0%) | $0 |
| 3-Person Families | 23 (59.0%) | $0 |
| 4-Person Families | 0 (0.0%) | $0 |
| 5-Person Families | 0 (0.0%) | $0 |
| 6-Person Families | 0 (0.0%) | $0 |
| 7+ Person Families | 0 (0.0%) | $0 |
| Total | 39 (100.0%) | $78,125 |
Family Income by Number of Earners in Tuscarora
| Number of Earners | # Families | Median Income |
| No Earners | 16 (41.0%) | $0 |
| 1 Earner | 9 (23.1%) | $0 |
| 2 Earners | 14 (35.9%) | $0 |
| 3+ Earners | 0 (0.0%) | $0 |
| Total | 39 (100.0%) | $78,125 |
Household Income in Tuscarora
Household Income Brackets in Tuscarora
With 30 households falling in the category, the $75,000 to $99,999 income range is the most frequent in Tuscarora, accounting for 50.8% of all households.
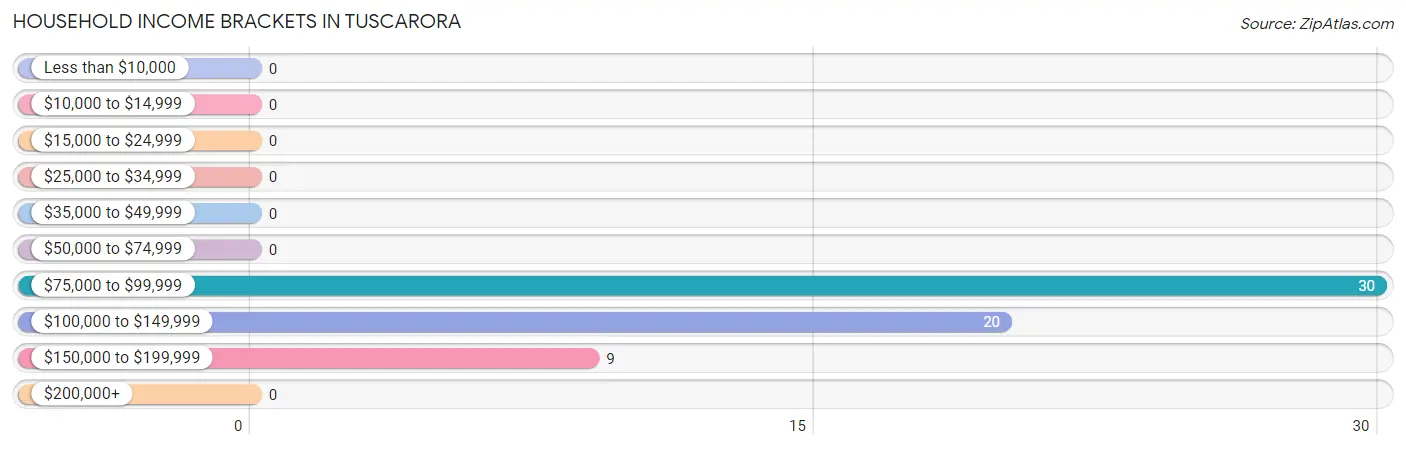
| Income Bracket | # Households | % Households |
| Less than $10,000 | 0 | 0.0% |
| $10,000 to $14,999 | 0 | 0.0% |
| $15,000 to $24,999 | 0 | 0.0% |
| $25,000 to $34,999 | 0 | 0.0% |
| $35,000 to $49,999 | 0 | 0.0% |
| $50,000 to $74,999 | 0 | 0.0% |
| $75,000 to $99,999 | 30 | 50.8% |
| $100,000 to $149,999 | 20 | 33.9% |
| $150,000 to $199,999 | 9 | 15.3% |
| $200,000+ | 0 | 0.0% |
Household Income by Householder Age in Tuscarora
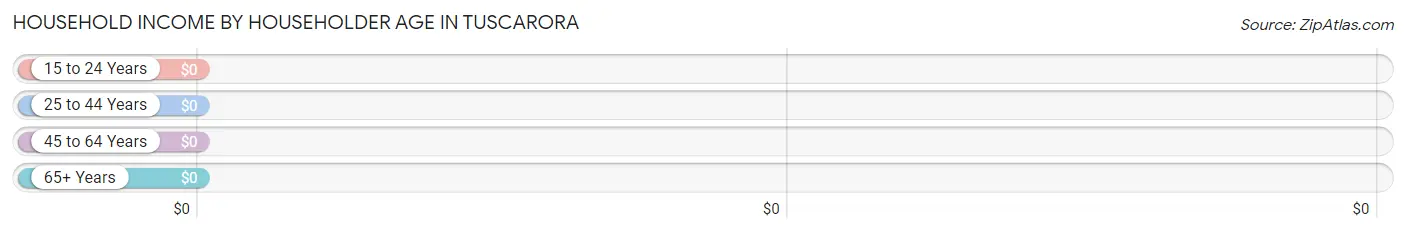
| Income Bracket | # Households | Median Income |
| 15 to 24 Years | 0 (0.0%) | $0 |
| 25 to 44 Years | 0 (0.0%) | $0 |
| 45 to 64 Years | 34 (57.6%) | $0 |
| 65+ Years | 25 (42.4%) | $0 |
| Total | 59 (100.0%) | $0 |
Poverty in Tuscarora
Income Below Poverty by Sex and Age in Tuscarora
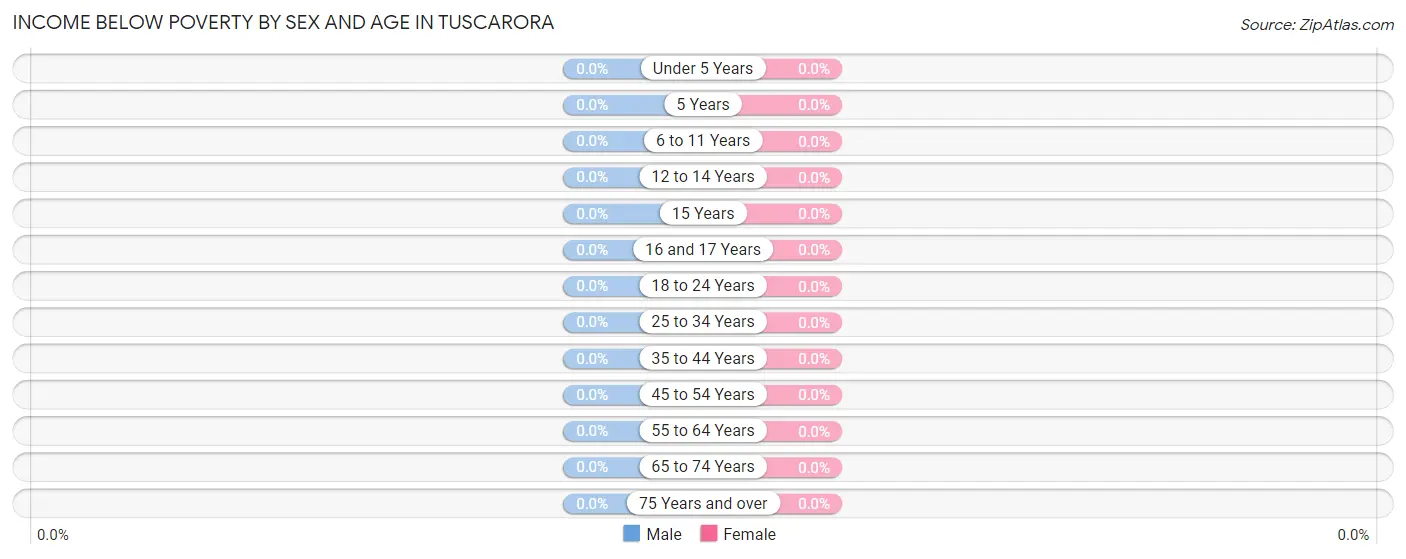
| Age Bracket | Male | Female |
| Under 5 Years | 0 (0.0%) | 0 (0.0%) |
| 5 Years | 0 (0.0%) | 0 (0.0%) |
| 6 to 11 Years | 0 (0.0%) | 0 (0.0%) |
| 12 to 14 Years | 0 (0.0%) | 0 (0.0%) |
| 15 Years | 0 (0.0%) | 0 (0.0%) |
| 16 and 17 Years | 0 (0.0%) | 0 (0.0%) |
| 18 to 24 Years | 0 (0.0%) | 0 (0.0%) |
| 25 to 34 Years | 0 (0.0%) | 0 (0.0%) |
| 35 to 44 Years | 0 (0.0%) | 0 (0.0%) |
| 45 to 54 Years | 0 (0.0%) | 0 (0.0%) |
| 55 to 64 Years | 0 (0.0%) | 0 (0.0%) |
| 65 to 74 Years | 0 (0.0%) | 0 (0.0%) |
| 75 Years and over | 0 (0.0%) | 0 (0.0%) |
| Total | 0 (0.0%) | 0 (0.0%) |
Income Above Poverty by Sex and Age in Tuscarora
According to the poverty statistics in Tuscarora, males aged 25 to 34 years and females aged 35 to 44 years are the age groups that are most secure financially, with 100.0% of males and 100.0% of females in these age groups living above the poverty line.
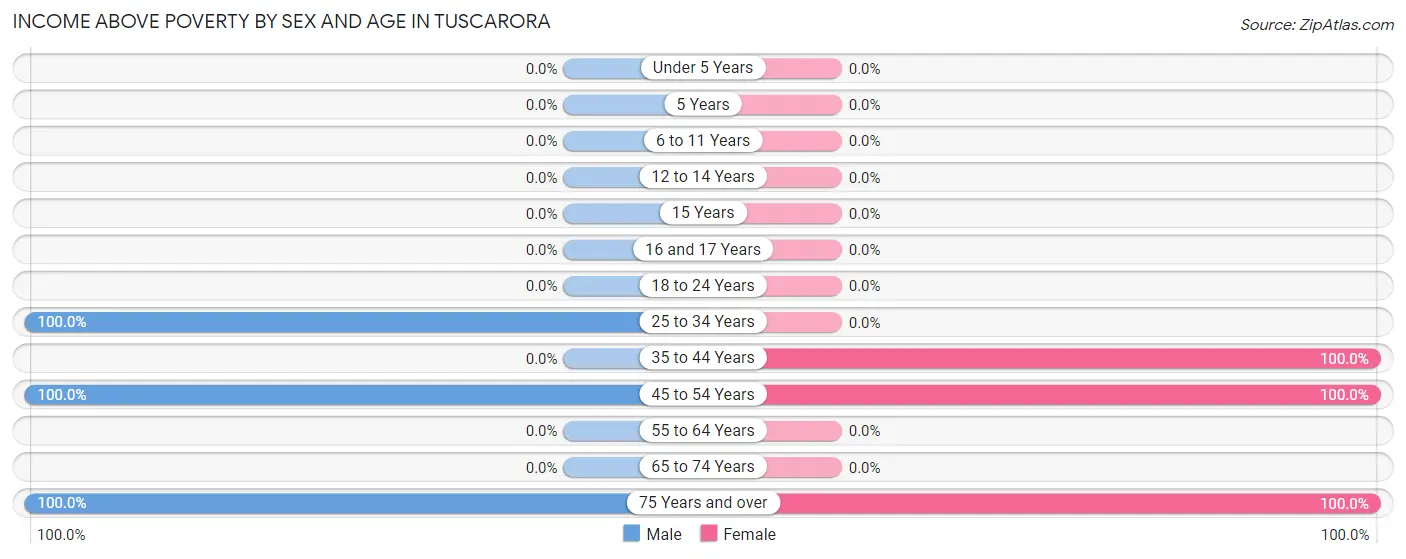
| Age Bracket | Male | Female |
| Under 5 Years | 0 (0.0%) | 0 (0.0%) |
| 5 Years | 0 (0.0%) | 0 (0.0%) |
| 6 to 11 Years | 0 (0.0%) | 0 (0.0%) |
| 12 to 14 Years | 0 (0.0%) | 0 (0.0%) |
| 15 Years | 0 (0.0%) | 0 (0.0%) |
| 16 and 17 Years | 0 (0.0%) | 0 (0.0%) |
| 18 to 24 Years | 0 (0.0%) | 0 (0.0%) |
| 25 to 34 Years | 22 (100.0%) | 0 (0.0%) |
| 35 to 44 Years | 0 (0.0%) | 18 (100.0%) |
| 45 to 54 Years | 64 (100.0%) | 17 (100.0%) |
| 55 to 64 Years | 0 (0.0%) | 0 (0.0%) |
| 65 to 74 Years | 0 (0.0%) | 0 (0.0%) |
| 75 Years and over | 23 (100.0%) | 23 (100.0%) |
| Total | 109 (100.0%) | 58 (100.0%) |
Income Below Poverty Among Married-Couple Families in Tuscarora
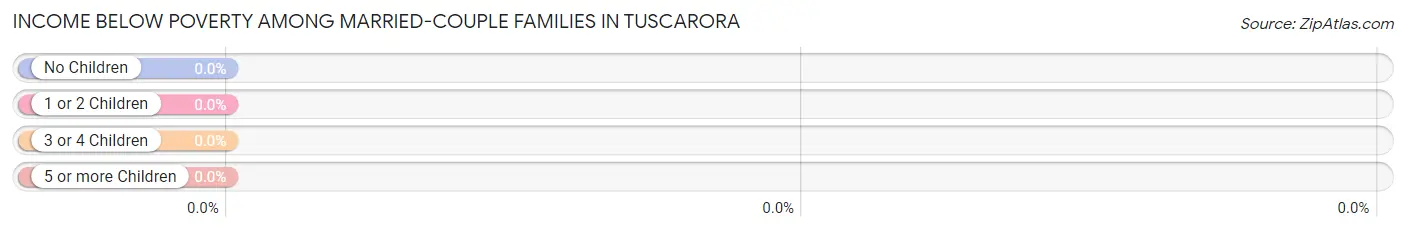
| Children | Above Poverty | Below Poverty |
| No Children | 39 (100.0%) | 0 (0.0%) |
| 1 or 2 Children | 0 (0.0%) | 0 (0.0%) |
| 3 or 4 Children | 0 (0.0%) | 0 (0.0%) |
| 5 or more Children | 0 (0.0%) | 0 (0.0%) |
| Total | 39 (100.0%) | 0 (0.0%) |
Income Below Poverty Among Single-Parent Households in Tuscarora
| Children | Single Father | Single Mother |
| No Children | 0 (0.0%) | 0 (0.0%) |
| 1 or 2 Children | 0 (0.0%) | 0 (0.0%) |
| 3 or 4 Children | 0 (0.0%) | 0 (0.0%) |
| 5 or more Children | 0 (0.0%) | 0 (0.0%) |
| Total | 0 (0.0%) | 0 (0.0%) |
Income Below Poverty Among Married-Couple vs Single-Parent Households in Tuscarora
| Children | Married-Couple Families | Single-Parent Households |
| No Children | 0 (0.0%) | 0 (0.0%) |
| 1 or 2 Children | 0 (0.0%) | 0 (0.0%) |
| 3 or 4 Children | 0 (0.0%) | 0 (0.0%) |
| 5 or more Children | 0 (0.0%) | 0 (0.0%) |
| Total | 0 (0.0%) | 0 (0.0%) |
Race in Tuscarora
The most populous races in Tuscarora are , and White / Caucasian (167 | 100.0%).
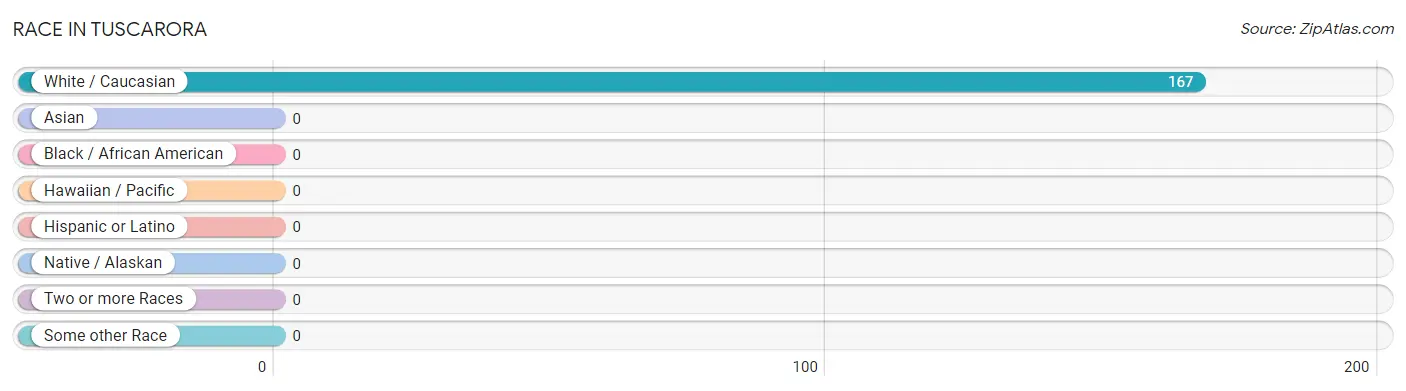
| Race | # Population | % Population |
| Asian | 0 | 0.0% |
| Black / African American | 0 | 0.0% |
| Hawaiian / Pacific | 0 | 0.0% |
| Hispanic or Latino | 0 | 0.0% |
| Native / Alaskan | 0 | 0.0% |
| White / Caucasian | 167 | 100.0% |
| Two or more Races | 0 | 0.0% |
| Some other Race | 0 | 0.0% |
| Total | 167 | 100.0% |
Ancestry in Tuscarora
The most populous ancestries reported in Tuscarora are German (107 | 64.1%), Irish (55 | 32.9%), Italian (20 | 12.0%), and Polish (16 | 9.6%), together accounting for 118.6% of all Tuscarora residents.
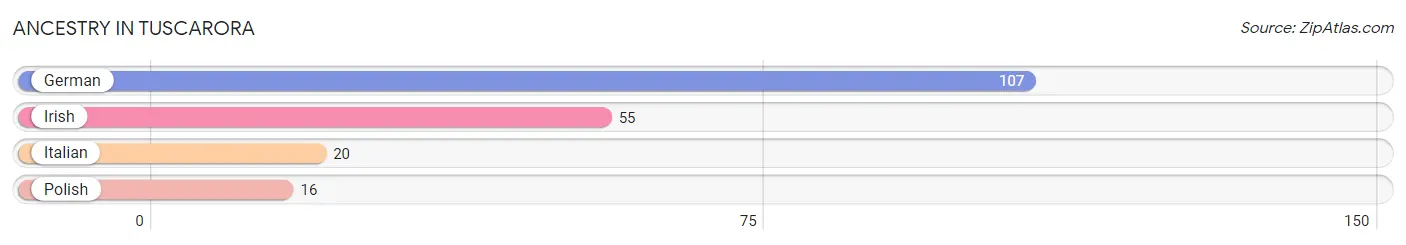
| Ancestry | # Population | % Population |
| German | 107 | 64.1% |
| Irish | 55 | 32.9% |
| Italian | 20 | 12.0% |
| Polish | 16 | 9.6% | View All 4 Rows |
Immigrants in Tuscarora

| Immigration Origin | # Population | % Population | View All 0 Rows |
Sex and Age in Tuscarora
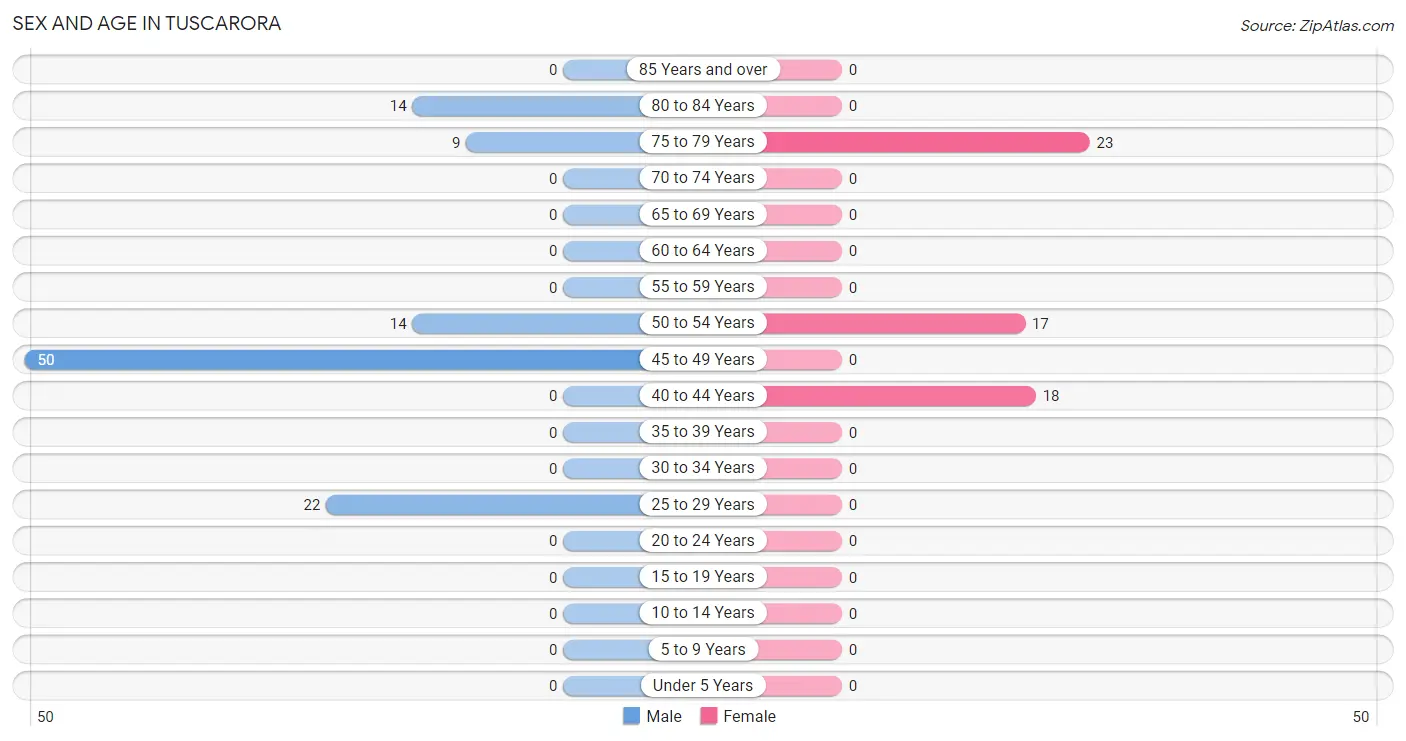
Sex and Age in Tuscarora
The most populous age groups in Tuscarora are 45 to 49 Years (50 | 45.9%) for men and 75 to 79 Years (23 | 39.7%) for women.
| Age Bracket | Male | Female |
| Under 5 Years | 0 (0.0%) | 0 (0.0%) |
| 5 to 9 Years | 0 (0.0%) | 0 (0.0%) |
| 10 to 14 Years | 0 (0.0%) | 0 (0.0%) |
| 15 to 19 Years | 0 (0.0%) | 0 (0.0%) |
| 20 to 24 Years | 0 (0.0%) | 0 (0.0%) |
| 25 to 29 Years | 22 (20.2%) | 0 (0.0%) |
| 30 to 34 Years | 0 (0.0%) | 0 (0.0%) |
| 35 to 39 Years | 0 (0.0%) | 0 (0.0%) |
| 40 to 44 Years | 0 (0.0%) | 18 (31.0%) |
| 45 to 49 Years | 50 (45.9%) | 0 (0.0%) |
| 50 to 54 Years | 14 (12.8%) | 17 (29.3%) |
| 55 to 59 Years | 0 (0.0%) | 0 (0.0%) |
| 60 to 64 Years | 0 (0.0%) | 0 (0.0%) |
| 65 to 69 Years | 0 (0.0%) | 0 (0.0%) |
| 70 to 74 Years | 0 (0.0%) | 0 (0.0%) |
| 75 to 79 Years | 9 (8.3%) | 23 (39.7%) |
| 80 to 84 Years | 14 (12.8%) | 0 (0.0%) |
| 85 Years and over | 0 (0.0%) | 0 (0.0%) |
| Total | 109 (100.0%) | 58 (100.0%) |
Families and Households in Tuscarora
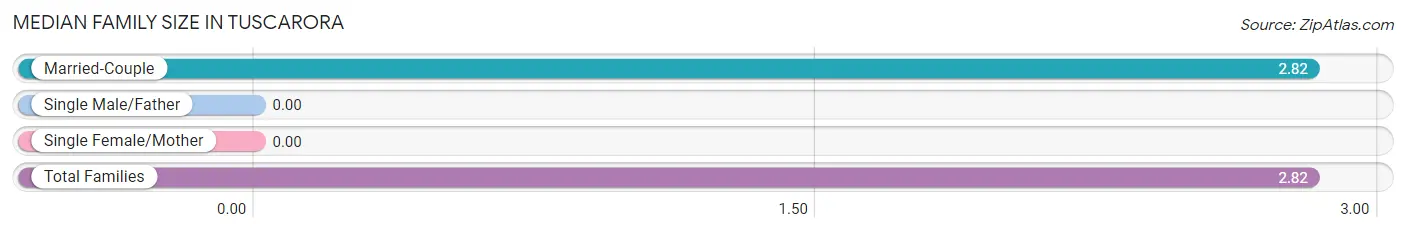
Median Family Size in Tuscarora
| Family Type | # Families | Family Size |
| Married-Couple | 39 (100.0%) | 2.82 |
| Single Male/Father | 0 (0.0%) | - |
| Single Female/Mother | 0 (0.0%) | - |
| Total Families | 39 (100.0%) | 2.82 |
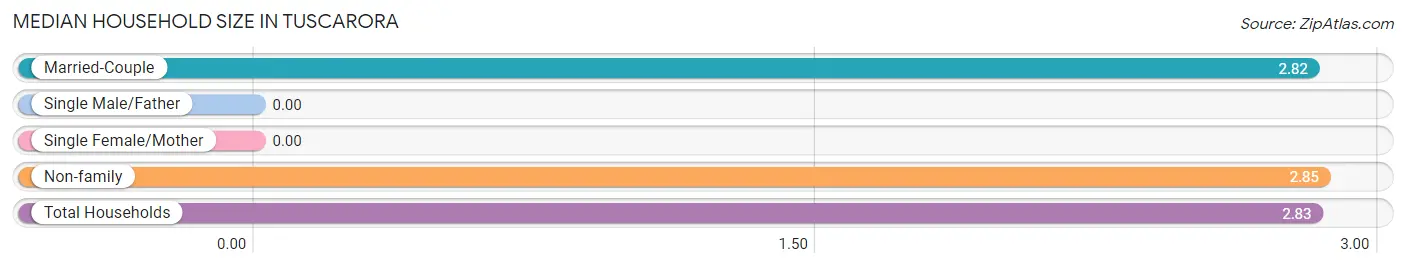
Median Household Size in Tuscarora
| Household Type | # Households | Household Size |
| Married-Couple | 39 (66.1%) | 2.82 |
| Single Male/Father | 0 (0.0%) | - |
| Single Female/Mother | 0 (0.0%) | - |
| Non-family | 20 (33.9%) | 2.85 |
| Total Households | 59 (100.0%) | 2.83 |
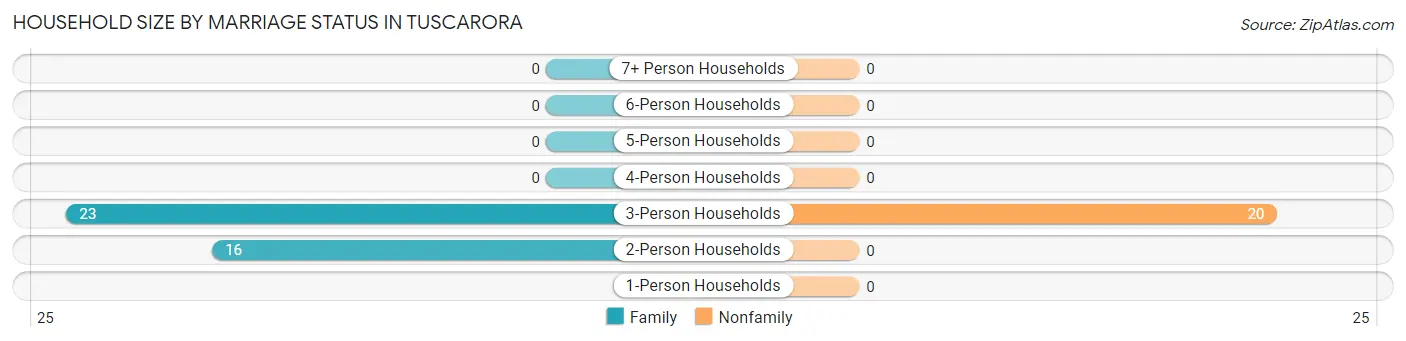
Household Size by Marriage Status in Tuscarora
Out of a total of 59 households in Tuscarora, 39 (66.1%) are family households, while 20 (33.9%) are nonfamily households. The most numerous type of family households are 3-person households, comprising 23, and the most common type of nonfamily households are 3-person households, comprising 20.
| Household Size | Family Households | Nonfamily Households |
| 1-Person Households | - | 0 (0.0%) |
| 2-Person Households | 16 (27.1%) | 0 (0.0%) |
| 3-Person Households | 23 (39.0%) | 20 (33.9%) |
| 4-Person Households | 0 (0.0%) | 0 (0.0%) |
| 5-Person Households | 0 (0.0%) | 0 (0.0%) |
| 6-Person Households | 0 (0.0%) | 0 (0.0%) |
| 7+ Person Households | 0 (0.0%) | 0 (0.0%) |
| Total | 39 (66.1%) | 20 (33.9%) |
Female Fertility in Tuscarora
Fertility by Age in Tuscarora
| Age Bracket | Women with Births | Births / 1,000 Women |
| 15 to 19 years | 0 (0.0%) | 0.0 |
| 20 to 34 years | 0 (0.0%) | 0.0 |
| 35 to 50 years | 0 (0.0%) | 0.0 |
| Total | 0 (0.0%) | 0.0 |
Fertility by Age by Marriage Status in Tuscarora
| Age Bracket | Married | Unmarried |
| 15 to 19 years | 0 (0.0%) | 0 (0.0%) |
| 20 to 34 years | 0 (0.0%) | 0 (0.0%) |
| 35 to 50 years | 0 (0.0%) | 0 (0.0%) |
| Total | 0 (0.0%) | 0 (0.0%) |
Fertility by Education in Tuscarora
| Educational Attainment | Women with Births | Births / 1,000 Women |
| Less than High School | 0 (0.0%) | 0.0 |
| High School Diploma | 0 (0.0%) | 0.0 |
| College or Associate's Degree | 0 (0.0%) | 0.0 |
| Bachelor's Degree | 0 (0.0%) | 0.0 |
| Graduate Degree | 0 (0.0%) | 0.0 |
| Total | 0 (0.0%) | 0.0 |
Fertility by Education by Marriage Status in Tuscarora
| Educational Attainment | Married | Unmarried |
| Less than High School | 0 (0.0%) | 0 (0.0%) |
| High School Diploma | 0 (0.0%) | 0 (0.0%) |
| College or Associate's Degree | 0 (0.0%) | 0 (0.0%) |
| Bachelor's Degree | 0 (0.0%) | 0 (0.0%) |
| Graduate Degree | 0 (0.0%) | 0 (0.0%) |
| Total | 0 (0.0%) | 0 (0.0%) |
Employment Characteristics in Tuscarora
Employment by Class of Employer in Tuscarora
Among the 90 employed individuals in Tuscarora, private company employees (51 | 56.7%), and state government employees (39 | 43.3%) make up the most common classes of employment.
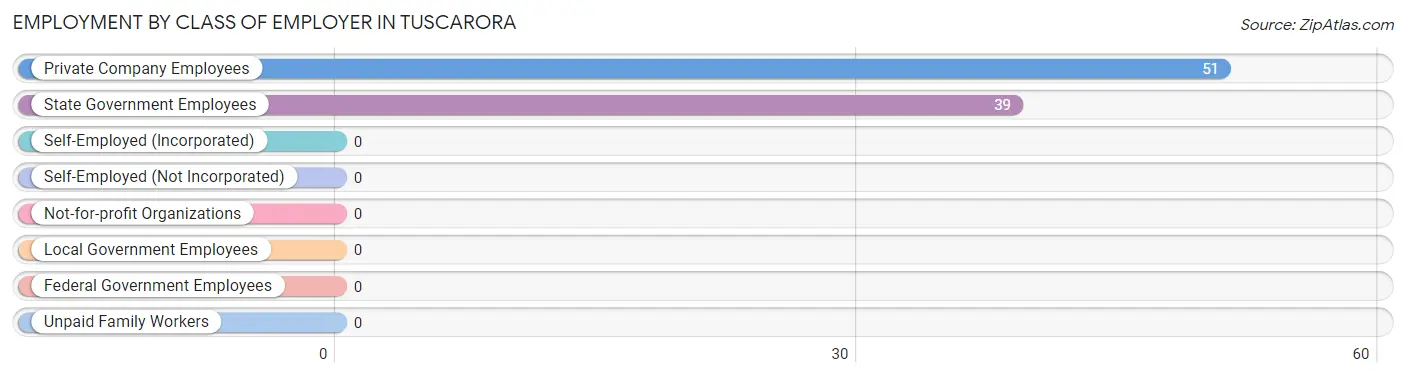
| Employer Class | # Employees | % Employees |
| Private Company Employees | 51 | 56.7% |
| Self-Employed (Incorporated) | 0 | 0.0% |
| Self-Employed (Not Incorporated) | 0 | 0.0% |
| Not-for-profit Organizations | 0 | 0.0% |
| Local Government Employees | 0 | 0.0% |
| State Government Employees | 39 | 43.3% |
| Federal Government Employees | 0 | 0.0% |
| Unpaid Family Workers | 0 | 0.0% |
| Total | 90 | 100.0% |
Employment Status by Age in Tuscarora
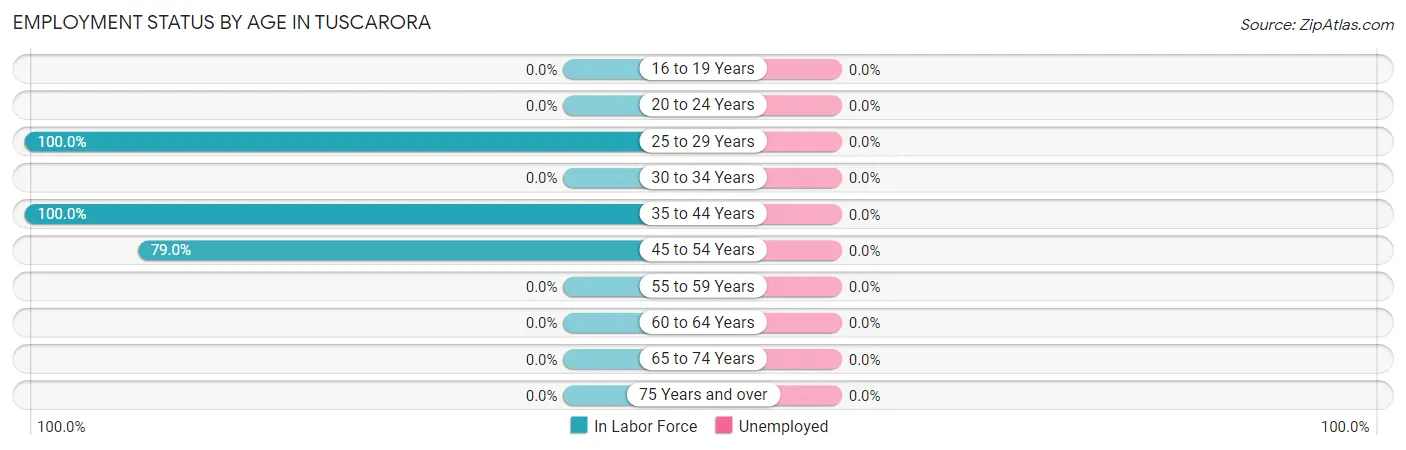
| Age Bracket | In Labor Force | Unemployed |
| 16 to 19 Years | 0 (0.0%) | 0 (0.0%) |
| 20 to 24 Years | 0 (0.0%) | 0 (0.0%) |
| 25 to 29 Years | 22 (100.0%) | 0 (0.0%) |
| 30 to 34 Years | 0 (0.0%) | 0 (0.0%) |
| 35 to 44 Years | 18 (100.0%) | 0 (0.0%) |
| 45 to 54 Years | 64 (79.0%) | 0 (0.0%) |
| 55 to 59 Years | 0 (0.0%) | 0 (0.0%) |
| 60 to 64 Years | 0 (0.0%) | 0 (0.0%) |
| 65 to 74 Years | 0 (0.0%) | 0 (0.0%) |
| 75 Years and over | 0 (0.0%) | 0 (0.0%) |
| Total | 104 (62.3%) | 0 (0.0%) |
Employment Status by Educational Attainment in Tuscarora
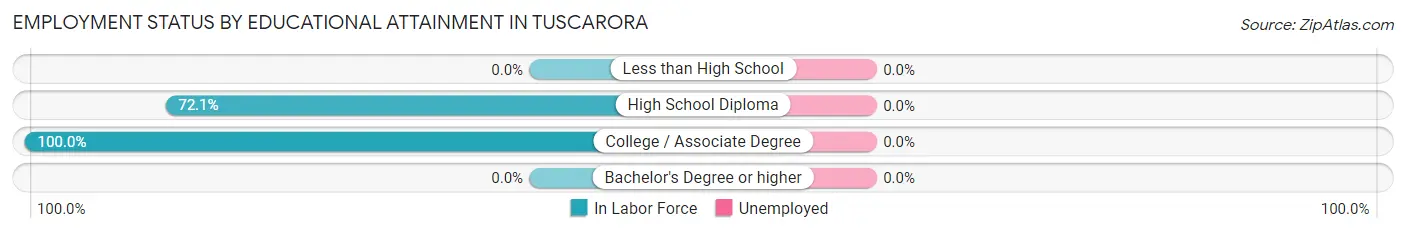
| Educational Attainment | In Labor Force | Unemployed |
| Less than High School | 0 (0.0%) | 0 (0.0%) |
| High School Diploma | 44 (72.1%) | 0 (0.0%) |
| College / Associate Degree | 60 (100.0%) | 0 (0.0%) |
| Bachelor's Degree or higher | 0 (0.0%) | 0 (0.0%) |
| Total | 104 (86.0%) | 0 (0.0%) |
Employment Occupations by Sex in Tuscarora
Management, Business, Science and Arts Occupations
The most common Management, Business, Science and Arts occupations in Tuscarora are , and Management (22 | 21.1%).
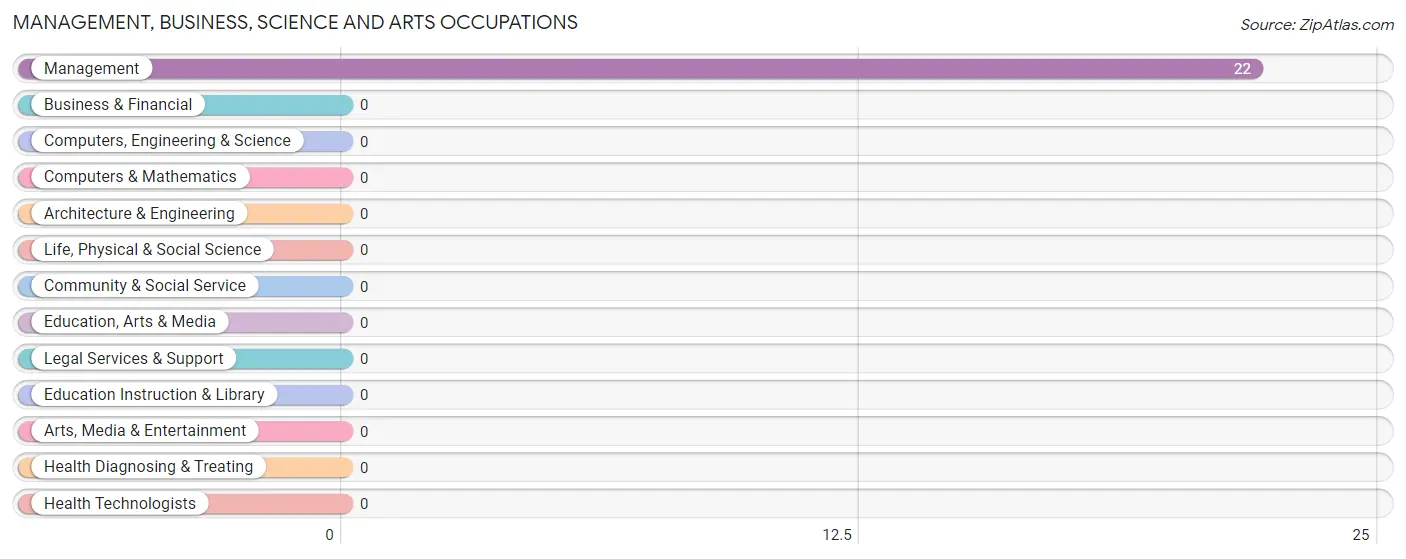
Management, Business, Science and Arts Occupations by Sex
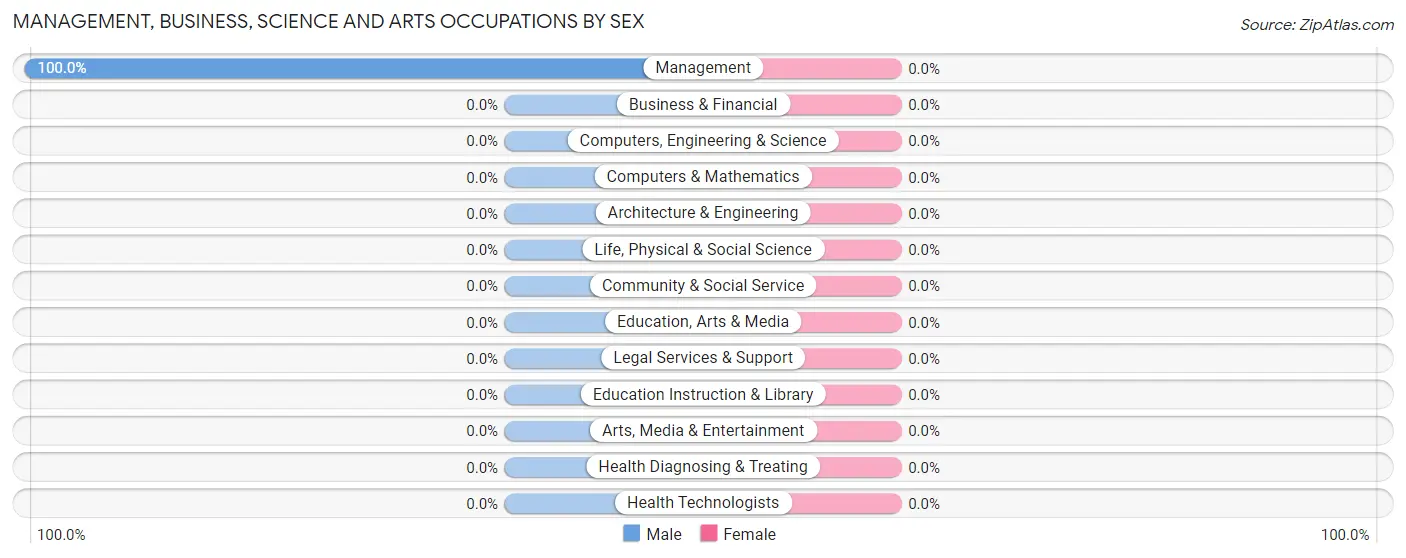
| Occupation | Male | Female |
| Management | 22 (100.0%) | 0 (0.0%) |
| Business & Financial | 0 (0.0%) | 0 (0.0%) |
| Computers, Engineering & Science | 0 (0.0%) | 0 (0.0%) |
| Computers & Mathematics | 0 (0.0%) | 0 (0.0%) |
| Architecture & Engineering | 0 (0.0%) | 0 (0.0%) |
| Life, Physical & Social Science | 0 (0.0%) | 0 (0.0%) |
| Community & Social Service | 0 (0.0%) | 0 (0.0%) |
| Education, Arts & Media | 0 (0.0%) | 0 (0.0%) |
| Legal Services & Support | 0 (0.0%) | 0 (0.0%) |
| Education Instruction & Library | 0 (0.0%) | 0 (0.0%) |
| Arts, Media & Entertainment | 0 (0.0%) | 0 (0.0%) |
| Health Diagnosing & Treating | 0 (0.0%) | 0 (0.0%) |
| Health Technologists | 0 (0.0%) | 0 (0.0%) |
| Total (Category) | 22 (100.0%) | 0 (0.0%) |
| Total (Overall) | 86 (82.7%) | 18 (17.3%) |
Services Occupations
The most common Services occupations in Tuscarora are , and Cleaning & Maintenance (19 | 18.3%).
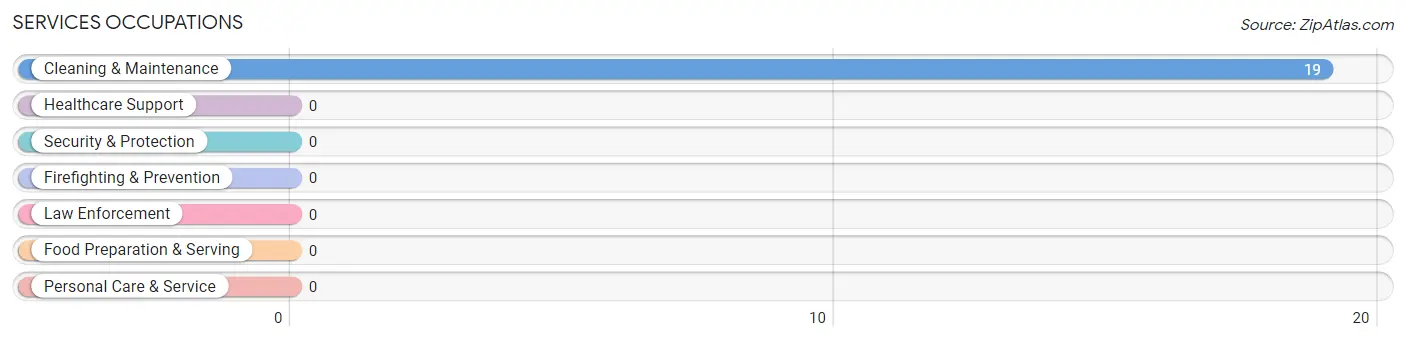
Services Occupations by Sex
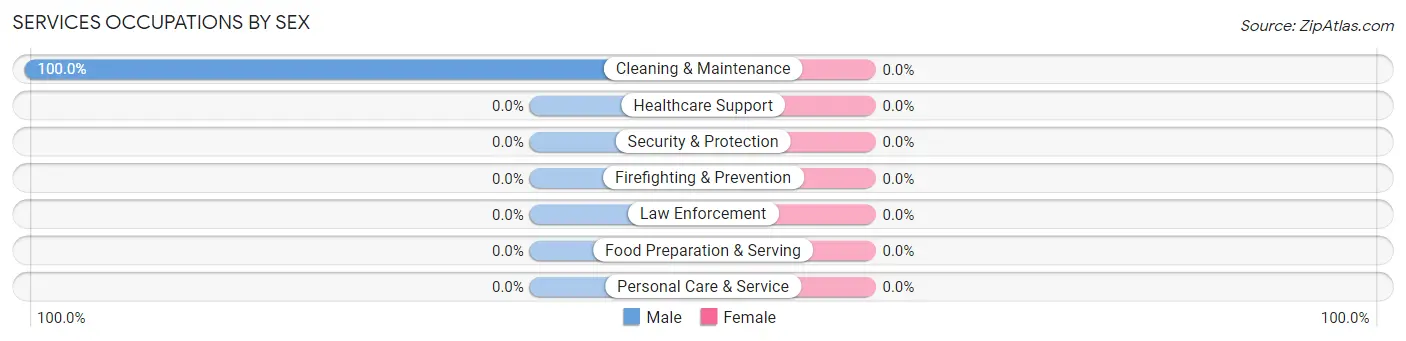
| Occupation | Male | Female |
| Healthcare Support | 0 (0.0%) | 0 (0.0%) |
| Security & Protection | 0 (0.0%) | 0 (0.0%) |
| Firefighting & Prevention | 0 (0.0%) | 0 (0.0%) |
| Law Enforcement | 0 (0.0%) | 0 (0.0%) |
| Food Preparation & Serving | 0 (0.0%) | 0 (0.0%) |
| Cleaning & Maintenance | 19 (100.0%) | 0 (0.0%) |
| Personal Care & Service | 0 (0.0%) | 0 (0.0%) |
| Total (Category) | 19 (100.0%) | 0 (0.0%) |
| Total (Overall) | 86 (82.7%) | 18 (17.3%) |
Sales and Office Occupations
The most common Sales and Office occupations in Tuscarora are , and Office & Administration (18 | 17.3%).

Sales and Office Occupations by Sex

| Occupation | Male | Female |
| Sales & Related | 0 (0.0%) | 0 (0.0%) |
| Office & Administration | 0 (0.0%) | 18 (100.0%) |
| Total (Category) | 0 (0.0%) | 18 (100.0%) |
| Total (Overall) | 86 (82.7%) | 18 (17.3%) |
Natural Resources, Construction and Maintenance Occupations
The most common Natural Resources, Construction and Maintenance occupations in Tuscarora are , and Construction & Extraction (31 | 29.8%).
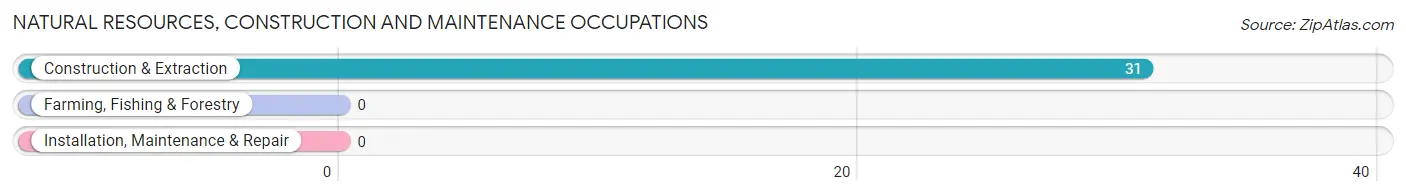
Natural Resources, Construction and Maintenance Occupations by Sex

| Occupation | Male | Female |
| Farming, Fishing & Forestry | 0 (0.0%) | 0 (0.0%) |
| Construction & Extraction | 31 (100.0%) | 0 (0.0%) |
| Installation, Maintenance & Repair | 0 (0.0%) | 0 (0.0%) |
| Total (Category) | 31 (100.0%) | 0 (0.0%) |
| Total (Overall) | 86 (82.7%) | 18 (17.3%) |
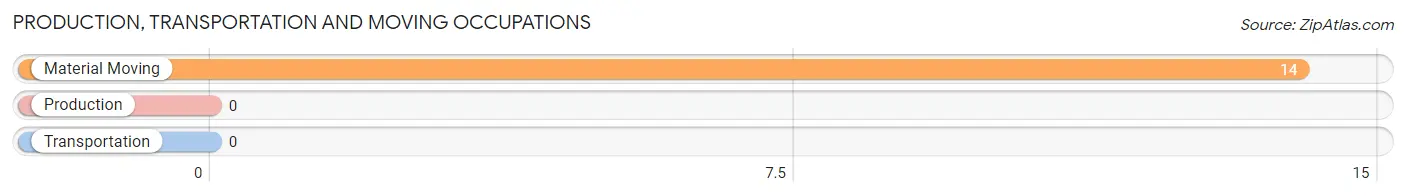
Production, Transportation and Moving Occupations
The most common Production, Transportation and Moving occupations in Tuscarora are , and Material Moving (14 | 13.5%).
Production, Transportation and Moving Occupations by Sex
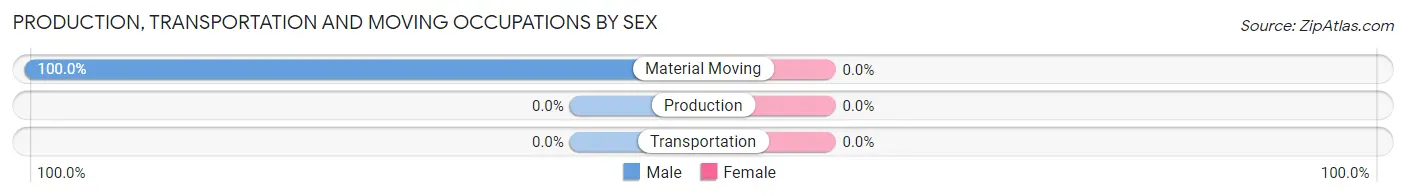
| Occupation | Male | Female |
| Production | 0 (0.0%) | 0 (0.0%) |
| Transportation | 0 (0.0%) | 0 (0.0%) |
| Material Moving | 14 (100.0%) | 0 (0.0%) |
| Total (Category) | 14 (100.0%) | 0 (0.0%) |
| Total (Overall) | 86 (82.7%) | 18 (17.3%) |
Employment Industries by Sex in Tuscarora
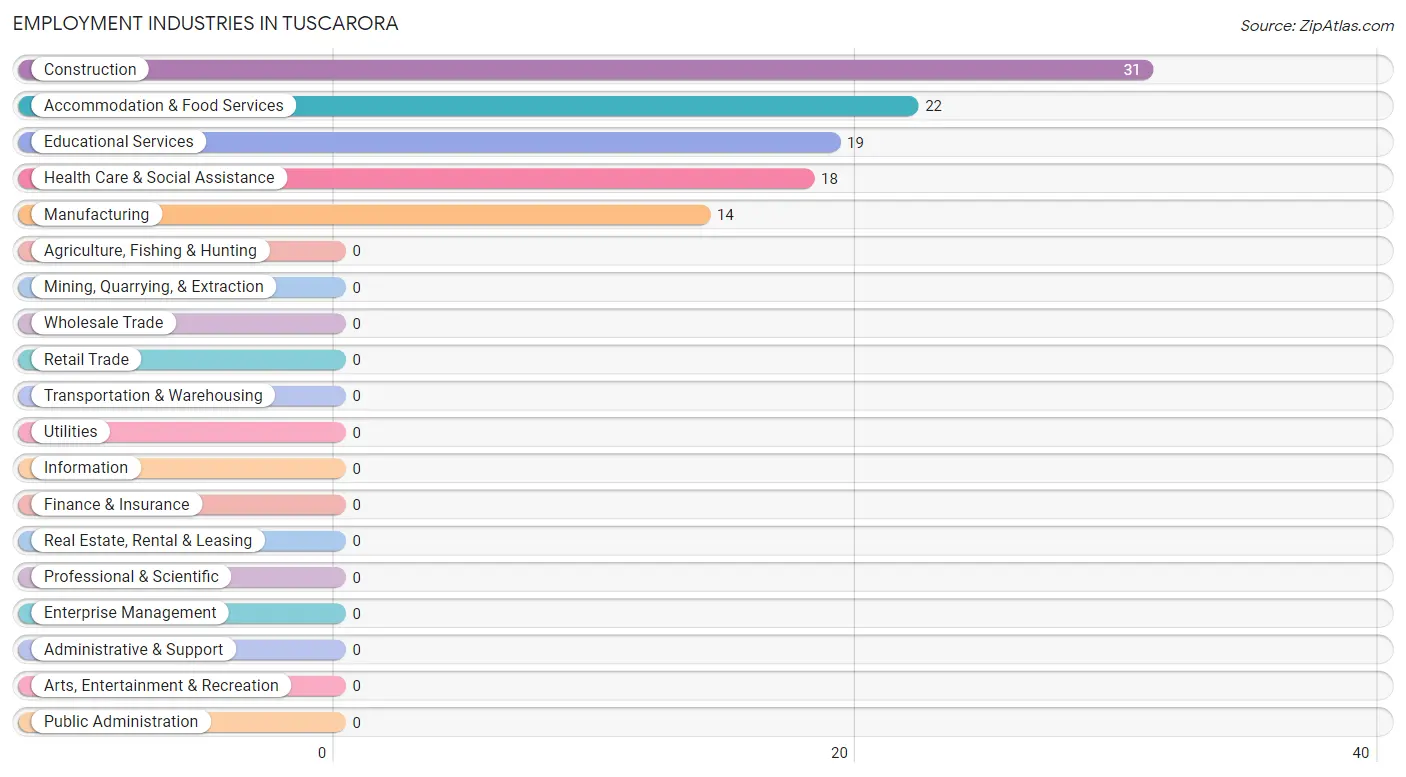
Employment Industries in Tuscarora
The major employment industries in Tuscarora include Construction (31 | 29.8%), Accommodation & Food Services (22 | 21.1%), Educational Services (19 | 18.3%), Health Care & Social Assistance (18 | 17.3%), and Manufacturing (14 | 13.5%).
Employment Industries by Sex in Tuscarora
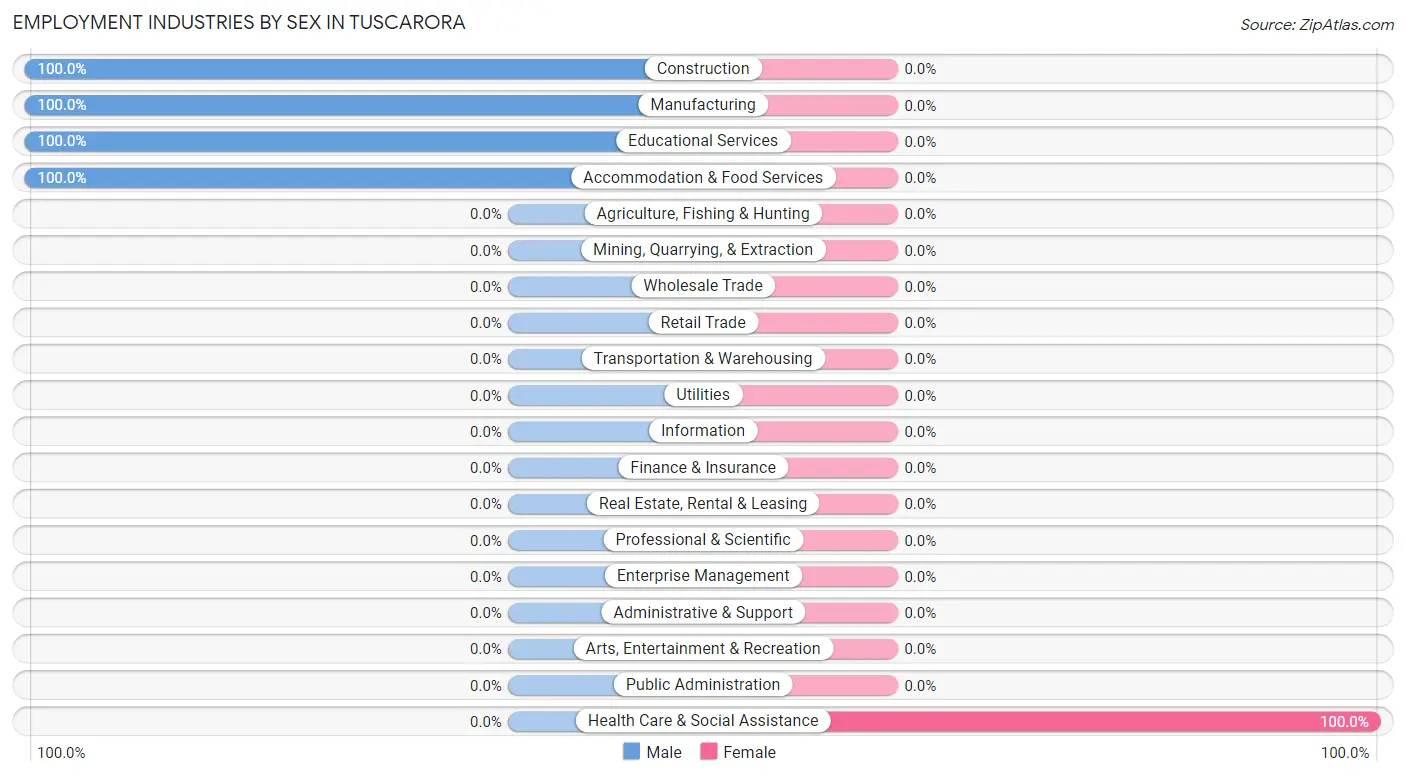
| Industry | Male | Female |
| Agriculture, Fishing & Hunting | 0 (0.0%) | 0 (0.0%) |
| Mining, Quarrying, & Extraction | 0 (0.0%) | 0 (0.0%) |
| Construction | 31 (100.0%) | 0 (0.0%) |
| Manufacturing | 14 (100.0%) | 0 (0.0%) |
| Wholesale Trade | 0 (0.0%) | 0 (0.0%) |
| Retail Trade | 0 (0.0%) | 0 (0.0%) |
| Transportation & Warehousing | 0 (0.0%) | 0 (0.0%) |
| Utilities | 0 (0.0%) | 0 (0.0%) |
| Information | 0 (0.0%) | 0 (0.0%) |
| Finance & Insurance | 0 (0.0%) | 0 (0.0%) |
| Real Estate, Rental & Leasing | 0 (0.0%) | 0 (0.0%) |
| Professional & Scientific | 0 (0.0%) | 0 (0.0%) |
| Enterprise Management | 0 (0.0%) | 0 (0.0%) |
| Administrative & Support | 0 (0.0%) | 0 (0.0%) |
| Educational Services | 19 (100.0%) | 0 (0.0%) |
| Health Care & Social Assistance | 0 (0.0%) | 18 (100.0%) |
| Arts, Entertainment & Recreation | 0 (0.0%) | 0 (0.0%) |
| Accommodation & Food Services | 22 (100.0%) | 0 (0.0%) |
| Public Administration | 0 (0.0%) | 0 (0.0%) |
| Total | 86 (82.7%) | 18 (17.3%) |
Education in Tuscarora
School Enrollment in Tuscarora
| School Level | # Students | % Students |
| Nursery / Preschool | 0 | 0.0% |
| Kindergarten | 0 | 0.0% |
| Elementary School | 0 | 0.0% |
| Middle School | 0 | 0.0% |
| High School | 0 | 0.0% |
| College / Undergraduate | 0 | 0.0% |
| Graduate / Professional | 0 | 0.0% |
| Total | 0 | 0.0% |
School Enrollment by Age by Funding Source in Tuscarora
| Age Bracket | Public School | Private School |
| 3 to 4 Year Olds | 0 (0.0%) | 0 (0.0%) |
| 5 to 9 Year Old | 0 (0.0%) | 0 (0.0%) |
| 10 to 14 Year Olds | 0 (0.0%) | 0 (0.0%) |
| 15 to 17 Year Olds | 0 (0.0%) | 0 (0.0%) |
| 18 to 19 Year Olds | 0 (0.0%) | 0 (0.0%) |
| 20 to 24 Year Olds | 0 (0.0%) | 0 (0.0%) |
| 25 to 34 Year Olds | 0 (0.0%) | 0 (0.0%) |
| 35 Years and over | 0 (0.0%) | 0 (0.0%) |
| Total | 0 (0.0%) | 0 (0.0%) |
Educational Attainment by Field of Study in Tuscarora
Science & technology (16 | 69.6%), and education (7 | 30.4%) are the most common fields of study among 23 individuals in Tuscarora who have obtained a bachelor's degree or higher.
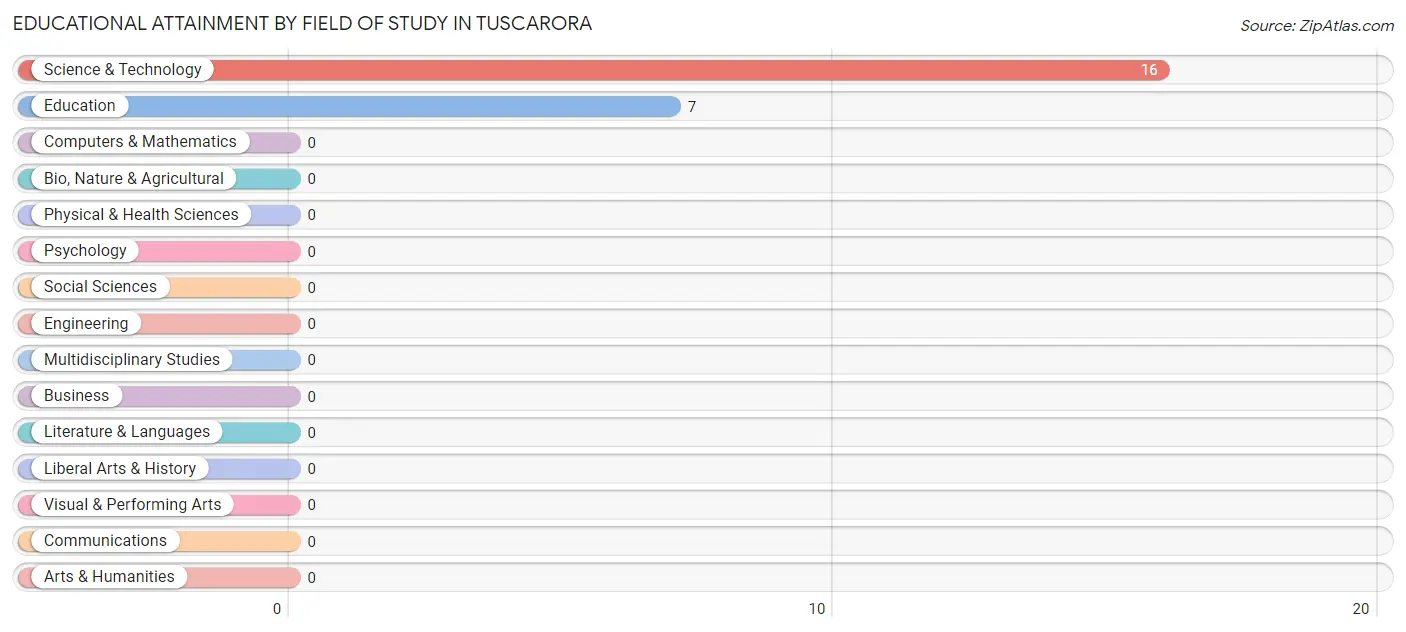
| Field of Study | # Graduates | % Graduates |
| Computers & Mathematics | 0 | 0.0% |
| Bio, Nature & Agricultural | 0 | 0.0% |
| Physical & Health Sciences | 0 | 0.0% |
| Psychology | 0 | 0.0% |
| Social Sciences | 0 | 0.0% |
| Engineering | 0 | 0.0% |
| Multidisciplinary Studies | 0 | 0.0% |
| Science & Technology | 16 | 69.6% |
| Business | 0 | 0.0% |
| Education | 7 | 30.4% |
| Literature & Languages | 0 | 0.0% |
| Liberal Arts & History | 0 | 0.0% |
| Visual & Performing Arts | 0 | 0.0% |
| Communications | 0 | 0.0% |
| Arts & Humanities | 0 | 0.0% |
| Total | 23 | 100.0% |
Transportation & Commute in Tuscarora
Vehicle Availability by Sex in Tuscarora
The most prevalent vehicle ownership categories in Tuscarora are males with 3 vehicles (50, accounting for 69.4%) and females with 3 vehicles (18, making up 277.8%).
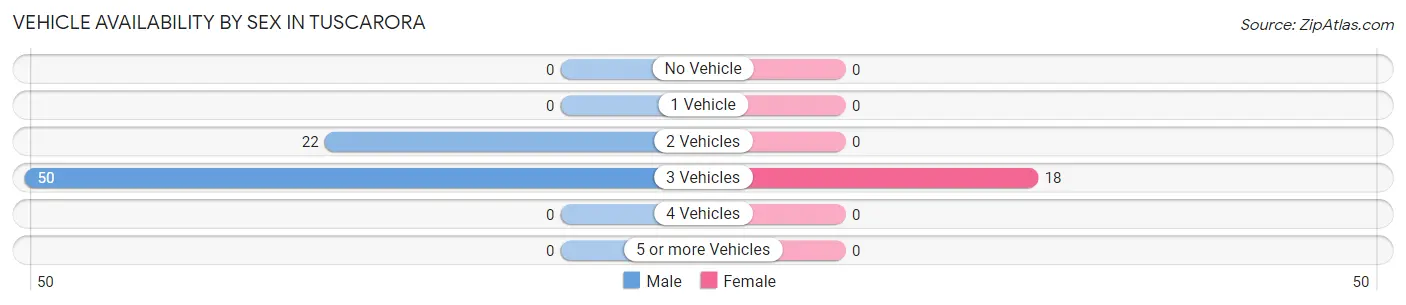
| Vehicles Available | Male | Female |
| No Vehicle | 0 (0.0%) | 0 (0.0%) |
| 1 Vehicle | 0 (0.0%) | 0 (0.0%) |
| 2 Vehicles | 22 (30.6%) | 0 (0.0%) |
| 3 Vehicles | 50 (69.4%) | 18 (100.0%) |
| 4 Vehicles | 0 (0.0%) | 0 (0.0%) |
| 5 or more Vehicles | 0 (0.0%) | 0 (0.0%) |
| Total | 72 (100.0%) | 18 (100.0%) |
Commute Time in Tuscarora
The most frequently occuring commute durations in Tuscarora are 15 to 19 minutes (40 commuters, 44.4%), 30 to 34 minutes (20 commuters, 22.2%), and 25 to 29 minutes (19 commuters, 21.1%).
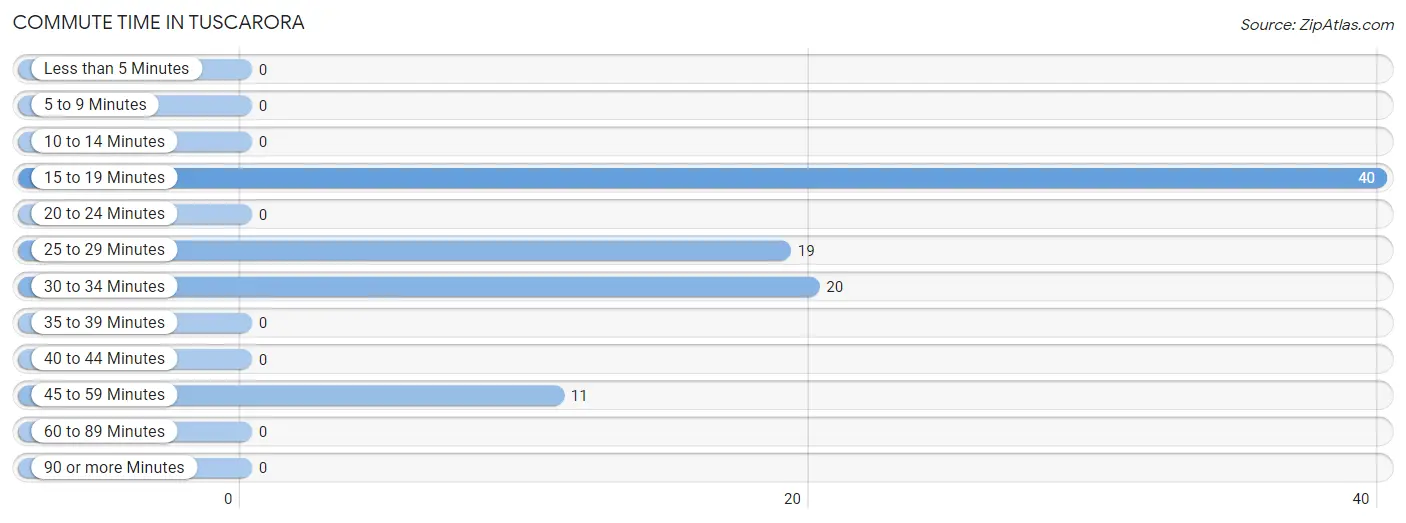
| Commute Time | # Commuters | % Commuters |
| Less than 5 Minutes | 0 | 0.0% |
| 5 to 9 Minutes | 0 | 0.0% |
| 10 to 14 Minutes | 0 | 0.0% |
| 15 to 19 Minutes | 40 | 44.4% |
| 20 to 24 Minutes | 0 | 0.0% |
| 25 to 29 Minutes | 19 | 21.1% |
| 30 to 34 Minutes | 20 | 22.2% |
| 35 to 39 Minutes | 0 | 0.0% |
| 40 to 44 Minutes | 0 | 0.0% |
| 45 to 59 Minutes | 11 | 12.2% |
| 60 to 89 Minutes | 0 | 0.0% |
| 90 or more Minutes | 0 | 0.0% |
Commute Time by Sex in Tuscarora
The most common commute times in Tuscarora are 15 to 19 minutes (22 commuters, 30.6%) for males and 15 to 19 minutes (18 commuters, 100.0%) for females.
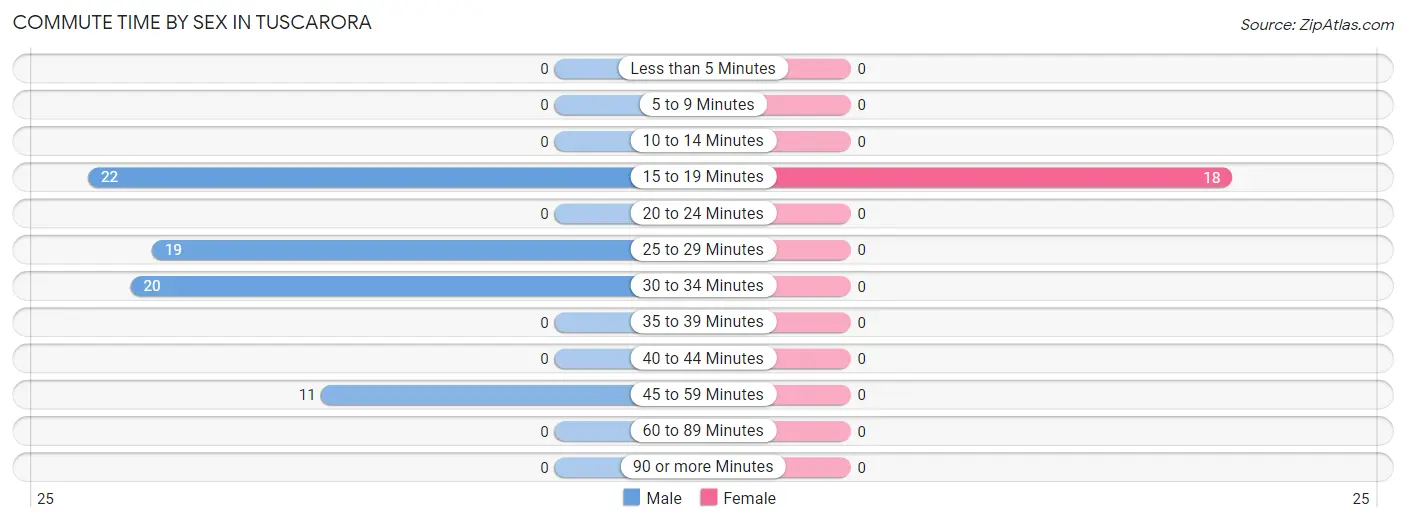
| Commute Time | Male | Female |
| Less than 5 Minutes | 0 (0.0%) | 0 (0.0%) |
| 5 to 9 Minutes | 0 (0.0%) | 0 (0.0%) |
| 10 to 14 Minutes | 0 (0.0%) | 0 (0.0%) |
| 15 to 19 Minutes | 22 (30.6%) | 18 (100.0%) |
| 20 to 24 Minutes | 0 (0.0%) | 0 (0.0%) |
| 25 to 29 Minutes | 19 (26.4%) | 0 (0.0%) |
| 30 to 34 Minutes | 20 (27.8%) | 0 (0.0%) |
| 35 to 39 Minutes | 0 (0.0%) | 0 (0.0%) |
| 40 to 44 Minutes | 0 (0.0%) | 0 (0.0%) |
| 45 to 59 Minutes | 11 (15.3%) | 0 (0.0%) |
| 60 to 89 Minutes | 0 (0.0%) | 0 (0.0%) |
| 90 or more Minutes | 0 (0.0%) | 0 (0.0%) |
Time of Departure to Work by Sex in Tuscarora
The most frequent times of departure to work in Tuscarora are 11:00 AM to 11:59 AM (22, 30.6%) for males and 7:00 AM to 7:29 AM (18, 100.0%) for females.
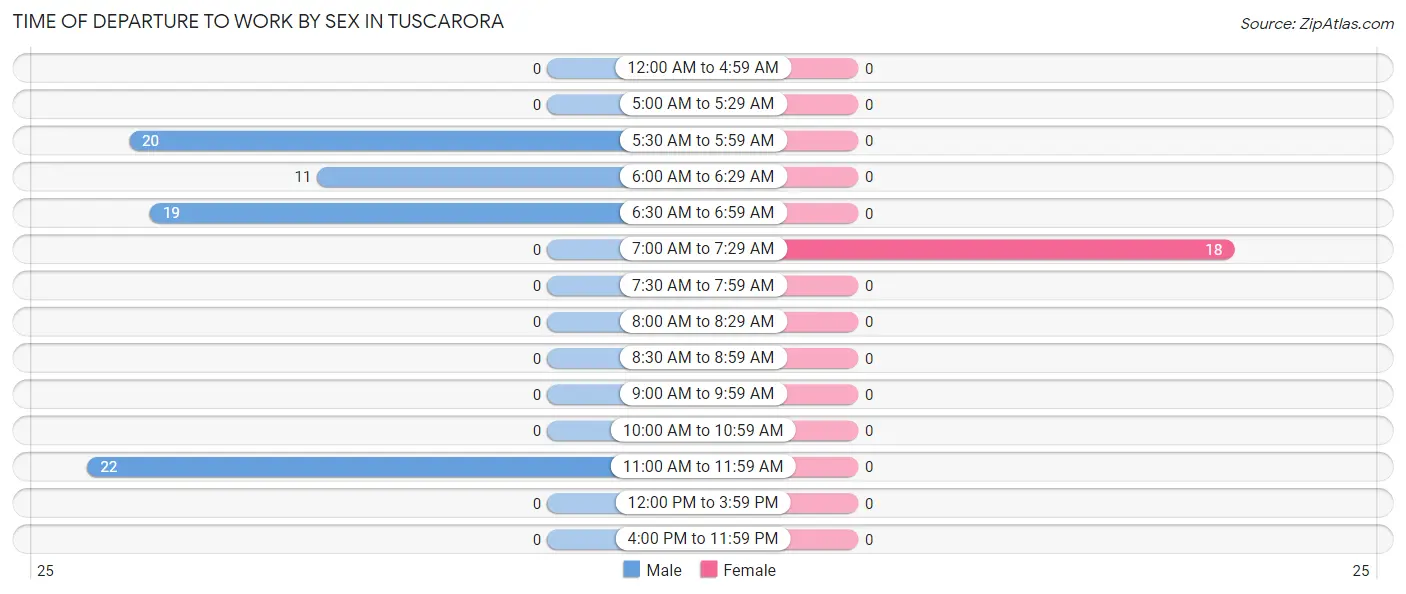
| Time of Departure | Male | Female |
| 12:00 AM to 4:59 AM | 0 (0.0%) | 0 (0.0%) |
| 5:00 AM to 5:29 AM | 0 (0.0%) | 0 (0.0%) |
| 5:30 AM to 5:59 AM | 20 (27.8%) | 0 (0.0%) |
| 6:00 AM to 6:29 AM | 11 (15.3%) | 0 (0.0%) |
| 6:30 AM to 6:59 AM | 19 (26.4%) | 0 (0.0%) |
| 7:00 AM to 7:29 AM | 0 (0.0%) | 18 (100.0%) |
| 7:30 AM to 7:59 AM | 0 (0.0%) | 0 (0.0%) |
| 8:00 AM to 8:29 AM | 0 (0.0%) | 0 (0.0%) |
| 8:30 AM to 8:59 AM | 0 (0.0%) | 0 (0.0%) |
| 9:00 AM to 9:59 AM | 0 (0.0%) | 0 (0.0%) |
| 10:00 AM to 10:59 AM | 0 (0.0%) | 0 (0.0%) |
| 11:00 AM to 11:59 AM | 22 (30.6%) | 0 (0.0%) |
| 12:00 PM to 3:59 PM | 0 (0.0%) | 0 (0.0%) |
| 4:00 PM to 11:59 PM | 0 (0.0%) | 0 (0.0%) |
| Total | 72 (100.0%) | 18 (100.0%) |
Housing Occupancy in Tuscarora
Occupancy by Ownership in Tuscarora
Of the total 59 dwellings in Tuscarora, owner-occupied units account for 59 (100.0%), while renter-occupied units make up 0 (0.0%).
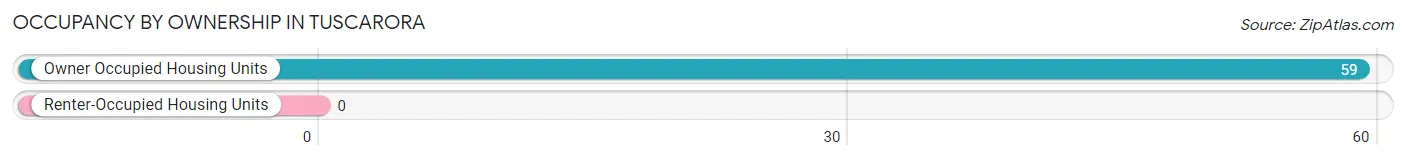
| Occupancy | # Housing Units | % Housing Units |
| Owner Occupied Housing Units | 59 | 100.0% |
| Renter-Occupied Housing Units | 0 | 0.0% |
| Total Occupied Housing Units | 59 | 100.0% |
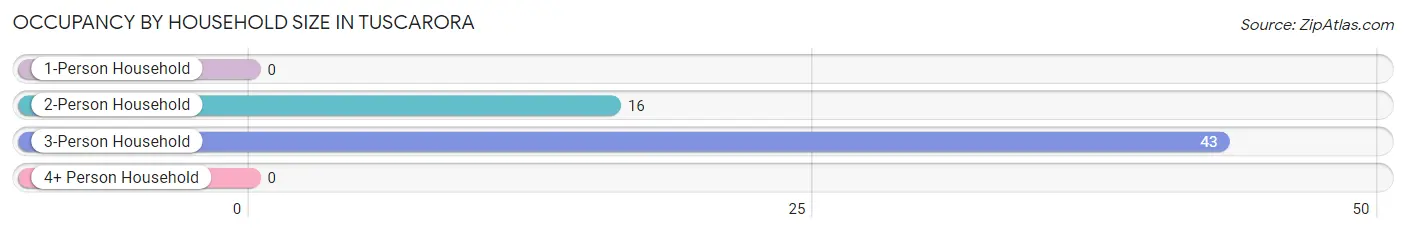
Occupancy by Household Size in Tuscarora
| Household Size | # Housing Units | % Housing Units |
| 1-Person Household | 0 | 0.0% |
| 2-Person Household | 16 | 27.1% |
| 3-Person Household | 43 | 72.9% |
| 4+ Person Household | 0 | 0.0% |
| Total Housing Units | 59 | 100.0% |
Occupancy by Ownership by Household Size in Tuscarora
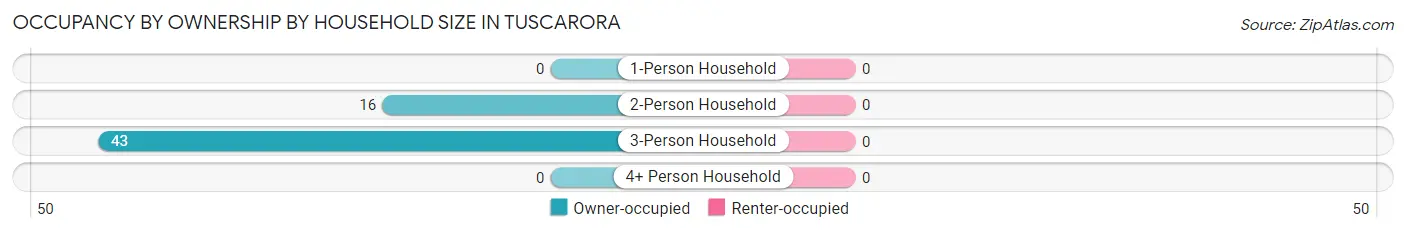
| Household Size | Owner-occupied | Renter-occupied |
| 1-Person Household | 0 (0.0%) | 0 (0.0%) |
| 2-Person Household | 16 (100.0%) | 0 (0.0%) |
| 3-Person Household | 43 (100.0%) | 0 (0.0%) |
| 4+ Person Household | 0 (0.0%) | 0 (0.0%) |
| Total Housing Units | 59 (100.0%) | 0 (0.0%) |
Occupancy by Educational Attainment in Tuscarora
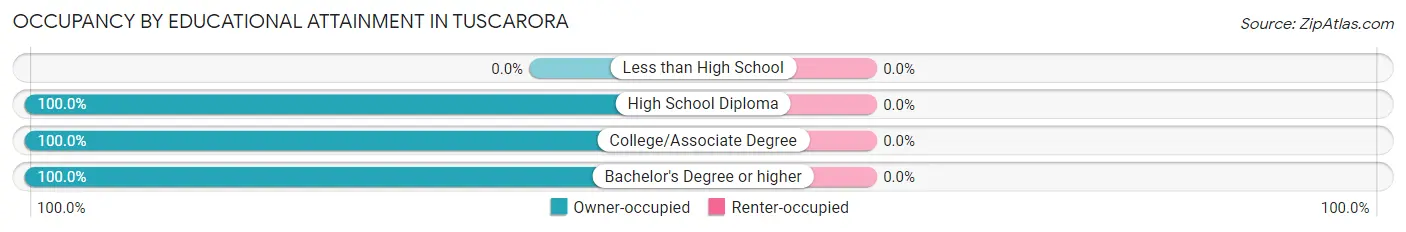
| Household Size | Owner-occupied | Renter-occupied |
| Less than High School | 0 (0.0%) | 0 (0.0%) |
| High School Diploma | 23 (100.0%) | 0 (0.0%) |
| College/Associate Degree | 20 (100.0%) | 0 (0.0%) |
| Bachelor's Degree or higher | 16 (100.0%) | 0 (0.0%) |
Occupancy by Age of Householder in Tuscarora
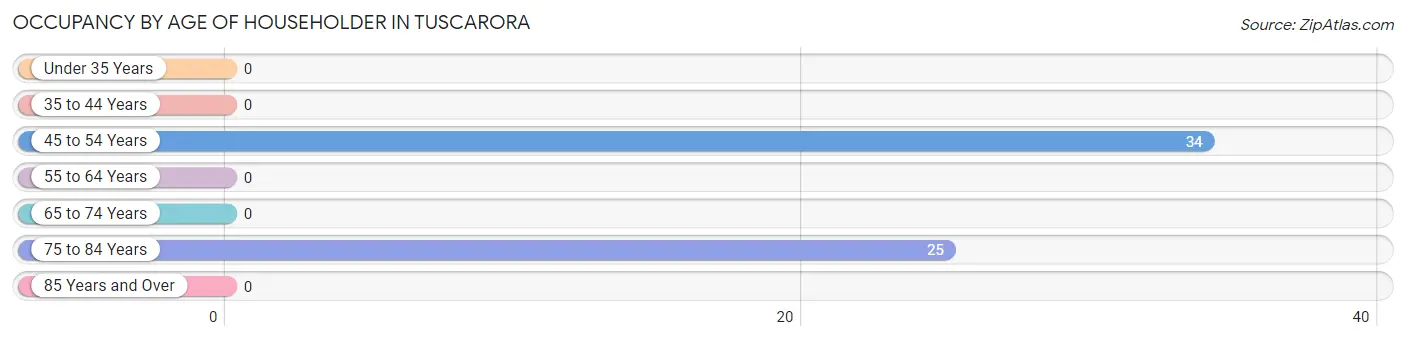
| Age Bracket | # Households | % Households |
| Under 35 Years | 0 | 0.0% |
| 35 to 44 Years | 0 | 0.0% |
| 45 to 54 Years | 34 | 57.6% |
| 55 to 64 Years | 0 | 0.0% |
| 65 to 74 Years | 0 | 0.0% |
| 75 to 84 Years | 25 | 42.4% |
| 85 Years and Over | 0 | 0.0% |
| Total | 59 | 100.0% |
Housing Finances in Tuscarora
Median Income by Occupancy in Tuscarora
| Occupancy Type | # Households | Median Income |
| Owner-Occupied | 59 (100.0%) | $0 |
| Renter-Occupied | 0 (0.0%) | $0 |
| Average | 59 (100.0%) | $0 |
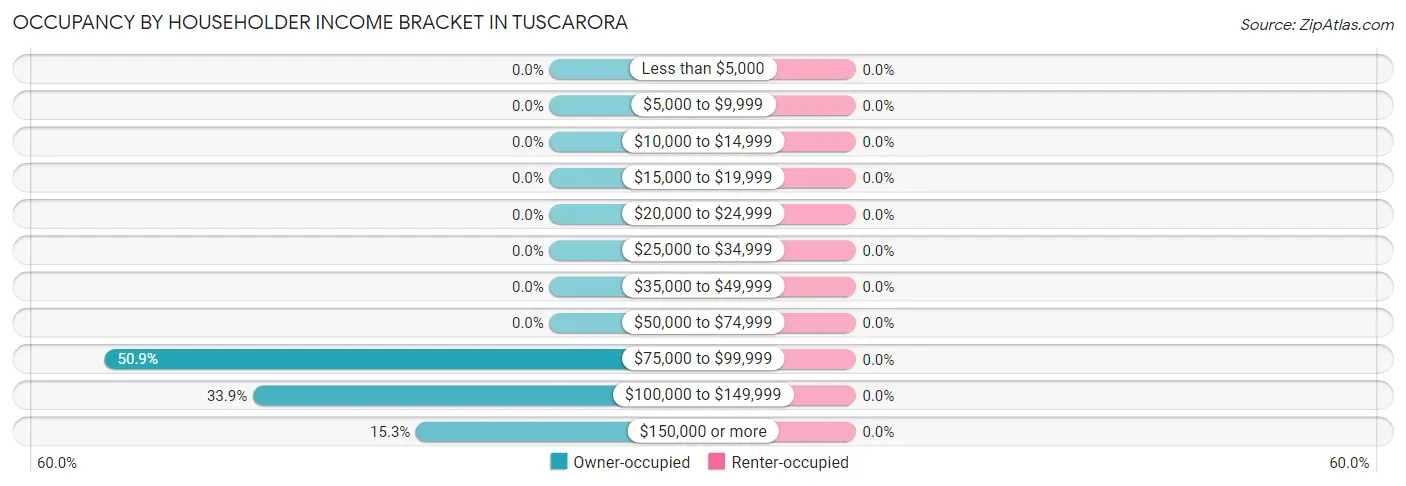
Occupancy by Householder Income Bracket in Tuscarora
| Income Bracket | Owner-occupied | Renter-occupied |
| Less than $5,000 | 0 (0.0%) | 0 (0.0%) |
| $5,000 to $9,999 | 0 (0.0%) | 0 (0.0%) |
| $10,000 to $14,999 | 0 (0.0%) | 0 (0.0%) |
| $15,000 to $19,999 | 0 (0.0%) | 0 (0.0%) |
| $20,000 to $24,999 | 0 (0.0%) | 0 (0.0%) |
| $25,000 to $34,999 | 0 (0.0%) | 0 (0.0%) |
| $35,000 to $49,999 | 0 (0.0%) | 0 (0.0%) |
| $50,000 to $74,999 | 0 (0.0%) | 0 (0.0%) |
| $75,000 to $99,999 | 30 (50.8%) | 0 (0.0%) |
| $100,000 to $149,999 | 20 (33.9%) | 0 (0.0%) |
| $150,000 or more | 9 (15.2%) | 0 (0.0%) |
| Total | 59 (100.0%) | 0 (0.0%) |
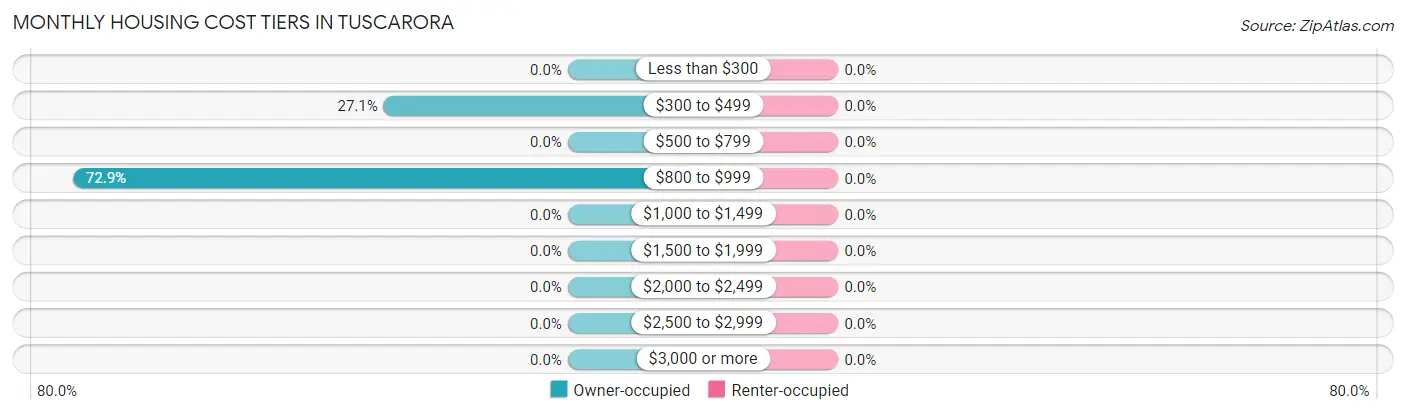
Monthly Housing Cost Tiers in Tuscarora
| Monthly Cost | Owner-occupied | Renter-occupied |
| Less than $300 | 0 (0.0%) | 0 (0.0%) |
| $300 to $499 | 16 (27.1%) | 0 (0.0%) |
| $500 to $799 | 0 (0.0%) | 0 (0.0%) |
| $800 to $999 | 43 (72.9%) | 0 (0.0%) |
| $1,000 to $1,499 | 0 (0.0%) | 0 (0.0%) |
| $1,500 to $1,999 | 0 (0.0%) | 0 (0.0%) |
| $2,000 to $2,499 | 0 (0.0%) | 0 (0.0%) |
| $2,500 to $2,999 | 0 (0.0%) | 0 (0.0%) |
| $3,000 or more | 0 (0.0%) | 0 (0.0%) |
| Total | 59 (100.0%) | 0 (0.0%) |
Physical Housing Characteristics in Tuscarora
Housing Structures in Tuscarora
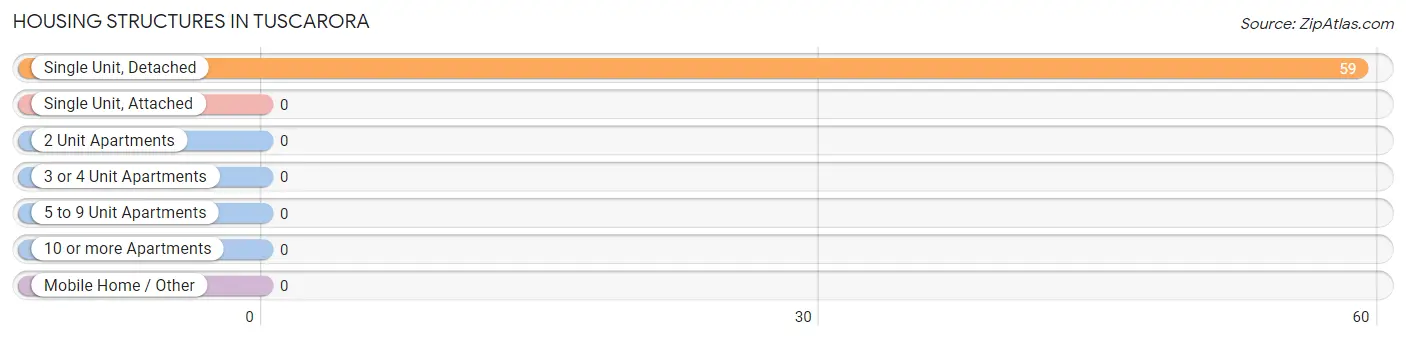
| Structure Type | # Housing Units | % Housing Units |
| Single Unit, Detached | 59 | 100.0% |
| Single Unit, Attached | 0 | 0.0% |
| 2 Unit Apartments | 0 | 0.0% |
| 3 or 4 Unit Apartments | 0 | 0.0% |
| 5 to 9 Unit Apartments | 0 | 0.0% |
| 10 or more Apartments | 0 | 0.0% |
| Mobile Home / Other | 0 | 0.0% |
| Total | 59 | 100.0% |
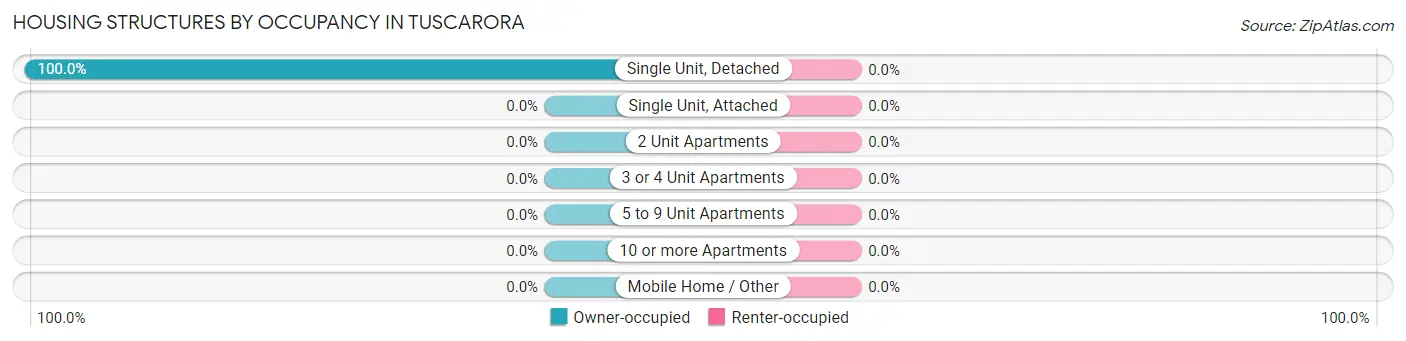
Housing Structures by Occupancy in Tuscarora
| Structure Type | Owner-occupied | Renter-occupied |
| Single Unit, Detached | 59 (100.0%) | 0 (0.0%) |
| Single Unit, Attached | 0 (0.0%) | 0 (0.0%) |
| 2 Unit Apartments | 0 (0.0%) | 0 (0.0%) |
| 3 or 4 Unit Apartments | 0 (0.0%) | 0 (0.0%) |
| 5 to 9 Unit Apartments | 0 (0.0%) | 0 (0.0%) |
| 10 or more Apartments | 0 (0.0%) | 0 (0.0%) |
| Mobile Home / Other | 0 (0.0%) | 0 (0.0%) |
| Total | 59 (100.0%) | 0 (0.0%) |
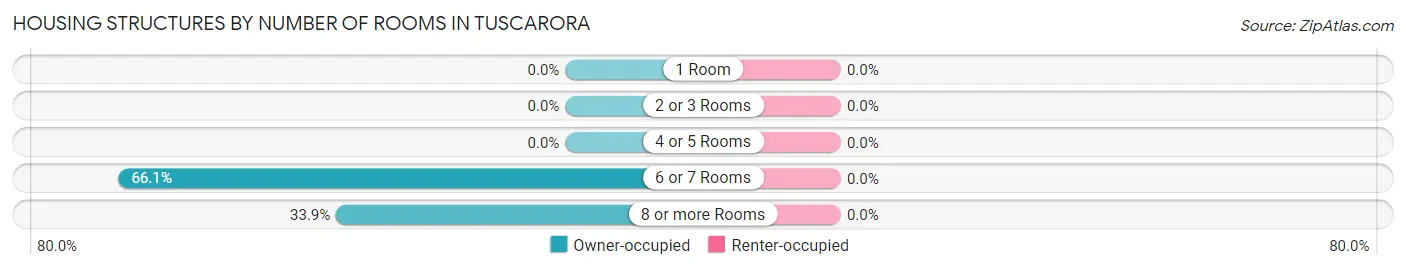
Housing Structures by Number of Rooms in Tuscarora
| Number of Rooms | Owner-occupied | Renter-occupied |
| 1 Room | 0 (0.0%) | 0 (0.0%) |
| 2 or 3 Rooms | 0 (0.0%) | 0 (0.0%) |
| 4 or 5 Rooms | 0 (0.0%) | 0 (0.0%) |
| 6 or 7 Rooms | 39 (66.1%) | 0 (0.0%) |
| 8 or more Rooms | 20 (33.9%) | 0 (0.0%) |
| Total | 59 (100.0%) | 0 (0.0%) |
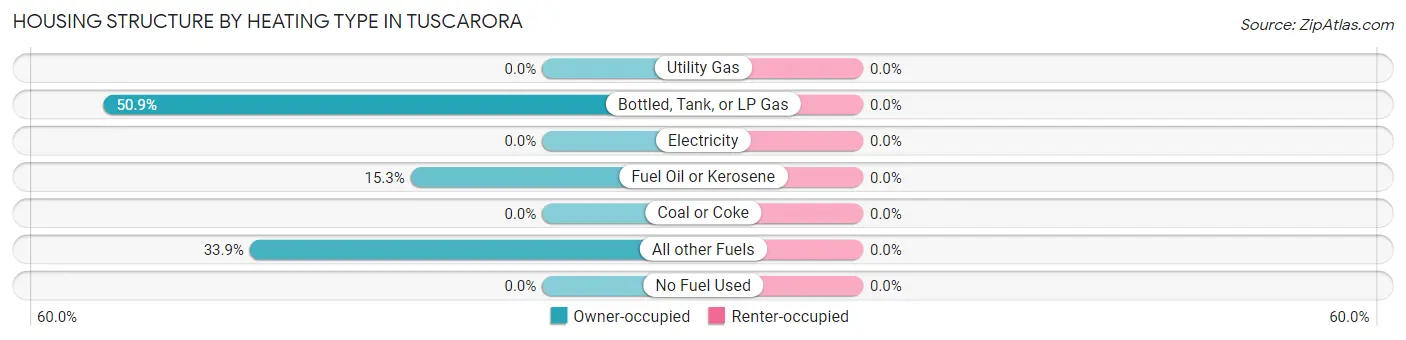
Housing Structure by Heating Type in Tuscarora
| Heating Type | Owner-occupied | Renter-occupied |
| Utility Gas | 0 (0.0%) | 0 (0.0%) |
| Bottled, Tank, or LP Gas | 30 (50.8%) | 0 (0.0%) |
| Electricity | 0 (0.0%) | 0 (0.0%) |
| Fuel Oil or Kerosene | 9 (15.2%) | 0 (0.0%) |
| Coal or Coke | 0 (0.0%) | 0 (0.0%) |
| All other Fuels | 20 (33.9%) | 0 (0.0%) |
| No Fuel Used | 0 (0.0%) | 0 (0.0%) |
| Total | 59 (100.0%) | 0 (0.0%) |
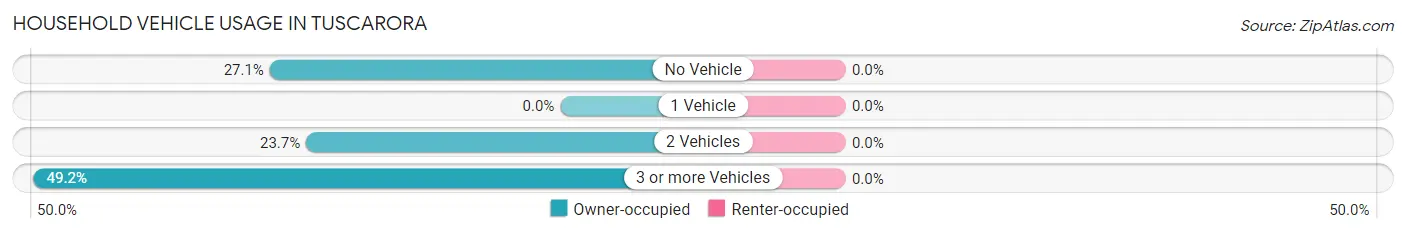
Household Vehicle Usage in Tuscarora
| Vehicles per Household | Owner-occupied | Renter-occupied |
| No Vehicle | 16 (27.1%) | 0 (0.0%) |
| 1 Vehicle | 0 (0.0%) | 0 (0.0%) |
| 2 Vehicles | 14 (23.7%) | 0 (0.0%) |
| 3 or more Vehicles | 29 (49.1%) | 0 (0.0%) |
| Total | 59 (100.0%) | 0 (0.0%) |
Real Estate & Mortgages in Tuscarora
Real Estate and Mortgage Overview in Tuscarora
| Characteristic | Without Mortgage | With Mortgage |
| Housing Units | 25 | 34 |
| Median Property Value | - | - |
| Median Household Income | - | - |
| Monthly Housing Costs | - | - |
| Real Estate Taxes | - | - |
Property Value by Mortgage Status in Tuscarora
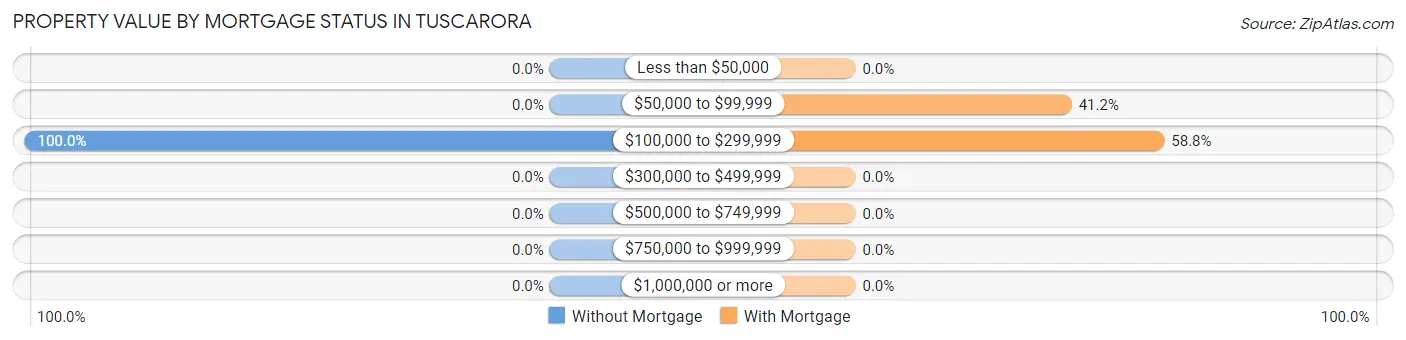
| Property Value | Without Mortgage | With Mortgage |
| Less than $50,000 | 0 (0.0%) | 0 (0.0%) |
| $50,000 to $99,999 | 0 (0.0%) | 14 (41.2%) |
| $100,000 to $299,999 | 25 (100.0%) | 20 (58.8%) |
| $300,000 to $499,999 | 0 (0.0%) | 0 (0.0%) |
| $500,000 to $749,999 | 0 (0.0%) | 0 (0.0%) |
| $750,000 to $999,999 | 0 (0.0%) | 0 (0.0%) |
| $1,000,000 or more | 0 (0.0%) | 0 (0.0%) |
| Total | 25 (100.0%) | 34 (100.0%) |
Household Income by Mortgage Status in Tuscarora
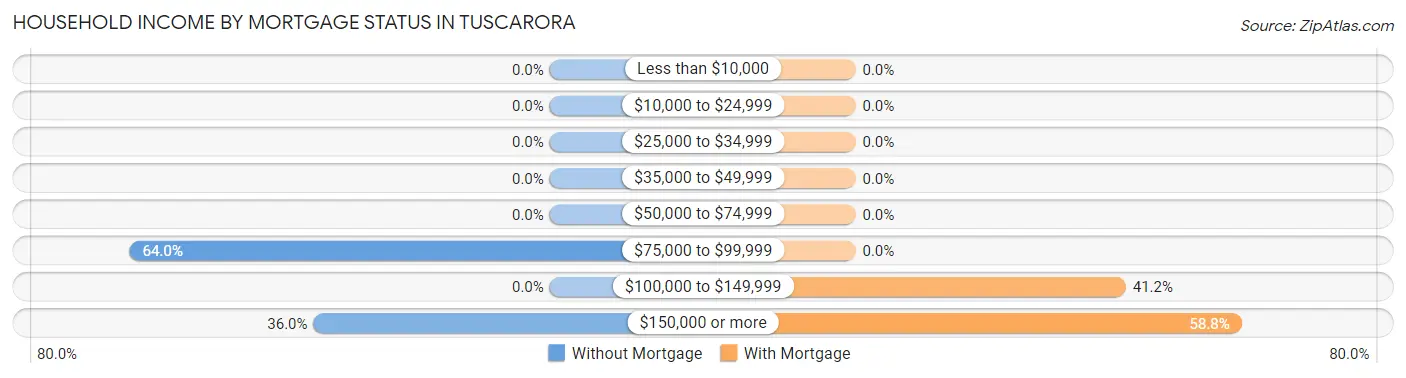
| Household Income | Without Mortgage | With Mortgage |
| Less than $10,000 | 0 (0.0%) | 0 (0.0%) |
| $10,000 to $24,999 | 0 (0.0%) | 0 (0.0%) |
| $25,000 to $34,999 | 0 (0.0%) | 0 (0.0%) |
| $35,000 to $49,999 | 0 (0.0%) | 0 (0.0%) |
| $50,000 to $74,999 | 0 (0.0%) | 0 (0.0%) |
| $75,000 to $99,999 | 16 (64.0%) | 0 (0.0%) |
| $100,000 to $149,999 | 0 (0.0%) | 14 (41.2%) |
| $150,000 or more | 9 (36.0%) | 20 (58.8%) |
| Total | 25 (100.0%) | 34 (100.0%) |
Property Value to Household Income Ratio in Tuscarora
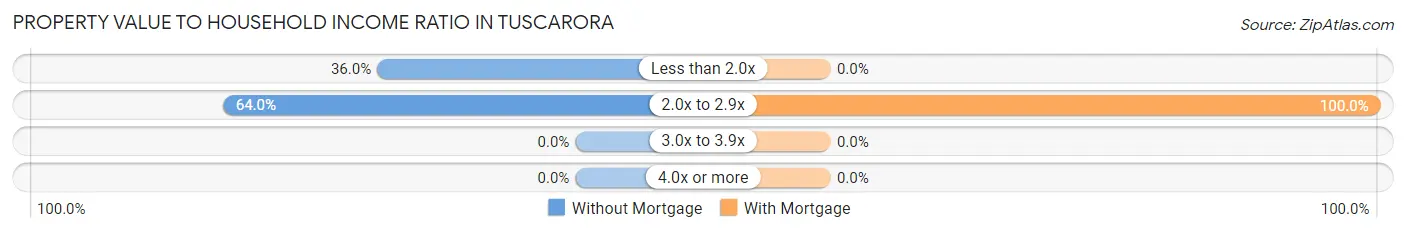
| Value-to-Income Ratio | Without Mortgage | With Mortgage |
| Less than 2.0x | 9 (36.0%) | 0 (0.0%) |
| 2.0x to 2.9x | 16 (64.0%) | 34 (100.0%) |
| 3.0x to 3.9x | 0 (0.0%) | 0 (0.0%) |
| 4.0x or more | 0 (0.0%) | 0 (0.0%) |
| Total | 25 (100.0%) | 34 (100.0%) |
Real Estate Taxes by Mortgage Status in Tuscarora

| Property Taxes | Without Mortgage | With Mortgage |
| Less than $800 | 0 (0.0%) | 0 (0.0%) |
| $800 to $1,499 | 0 (0.0%) | 0 (0.0%) |
| $800 to $1,499 | 25 (100.0%) | 0 (0.0%) |
| Total | 25 (100.0%) | 34 (100.0%) |
Health & Disability in Tuscarora
Health Insurance Coverage by Age in Tuscarora
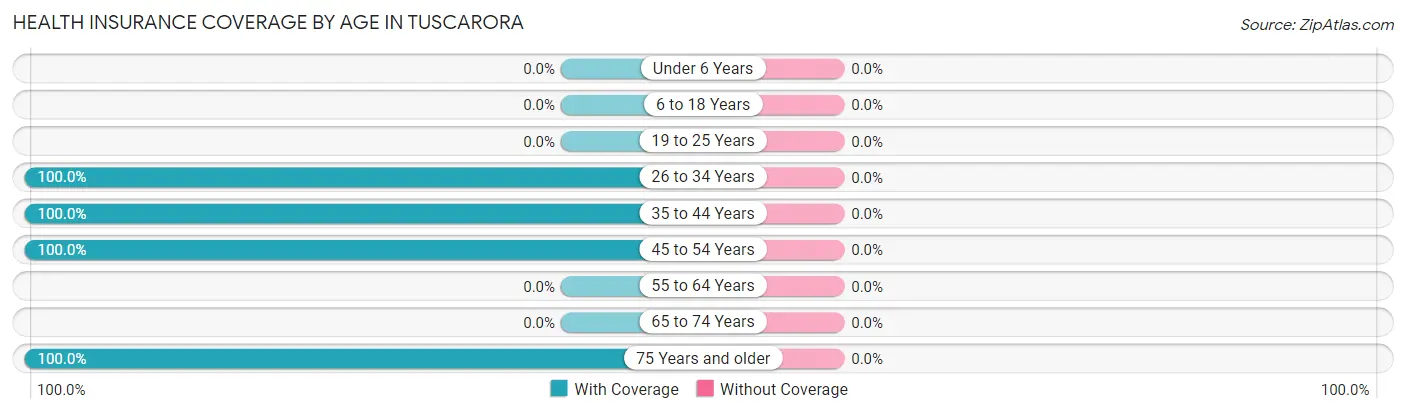
| Age Bracket | With Coverage | Without Coverage |
| Under 6 Years | 0 (0.0%) | 0 (0.0%) |
| 6 to 18 Years | 0 (0.0%) | 0 (0.0%) |
| 19 to 25 Years | 0 (0.0%) | 0 (0.0%) |
| 26 to 34 Years | 22 (100.0%) | 0 (0.0%) |
| 35 to 44 Years | 18 (100.0%) | 0 (0.0%) |
| 45 to 54 Years | 81 (100.0%) | 0 (0.0%) |
| 55 to 64 Years | 0 (0.0%) | 0 (0.0%) |
| 65 to 74 Years | 0 (0.0%) | 0 (0.0%) |
| 75 Years and older | 46 (100.0%) | 0 (0.0%) |
| Total | 167 (100.0%) | 0 (0.0%) |
Health Insurance Coverage by Citizenship Status in Tuscarora

| Citizenship Status | With Coverage | Without Coverage |
| Native Born | 0 (0.0%) | 0 (0.0%) |
| Foreign Born, Citizen | 0 (0.0%) | 0 (0.0%) |
| Foreign Born, not a Citizen | 0 (0.0%) | 0 (0.0%) |
Health Insurance Coverage by Household Income in Tuscarora
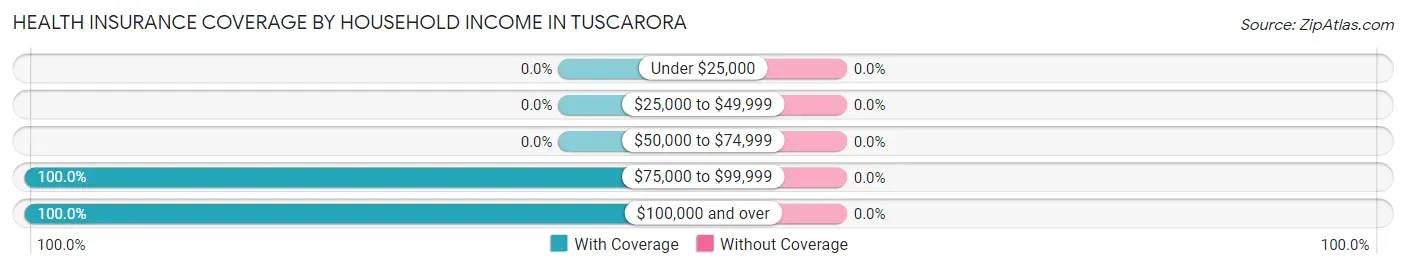
| Household Income | With Coverage | Without Coverage |
| Under $25,000 | 0 (0.0%) | 0 (0.0%) |
| $25,000 to $49,999 | 0 (0.0%) | 0 (0.0%) |
| $50,000 to $74,999 | 0 (0.0%) | 0 (0.0%) |
| $75,000 to $99,999 | 83 (100.0%) | 0 (0.0%) |
| $100,000 and over | 84 (100.0%) | 0 (0.0%) |
Public vs Private Health Insurance Coverage by Age in Tuscarora
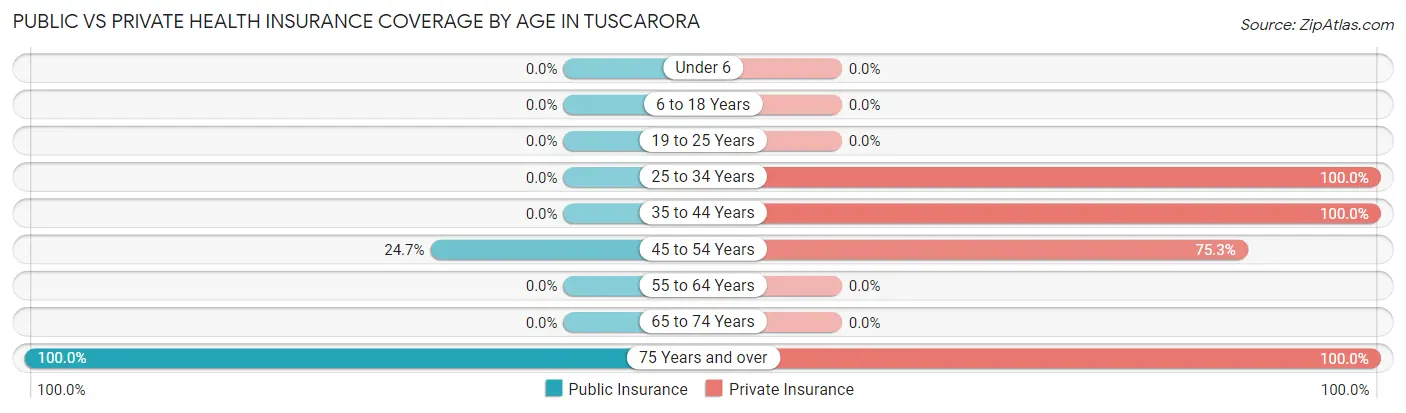
| Age Bracket | Public Insurance | Private Insurance |
| Under 6 | 0 (0.0%) | 0 (0.0%) |
| 6 to 18 Years | 0 (0.0%) | 0 (0.0%) |
| 19 to 25 Years | 0 (0.0%) | 0 (0.0%) |
| 25 to 34 Years | 0 (0.0%) | 22 (100.0%) |
| 35 to 44 Years | 0 (0.0%) | 18 (100.0%) |
| 45 to 54 Years | 20 (24.7%) | 61 (75.3%) |
| 55 to 64 Years | 0 (0.0%) | 0 (0.0%) |
| 65 to 74 Years | 0 (0.0%) | 0 (0.0%) |
| 75 Years and over | 46 (100.0%) | 46 (100.0%) |
| Total | 66 (39.5%) | 147 (88.0%) |
Disability Status by Sex by Age in Tuscarora
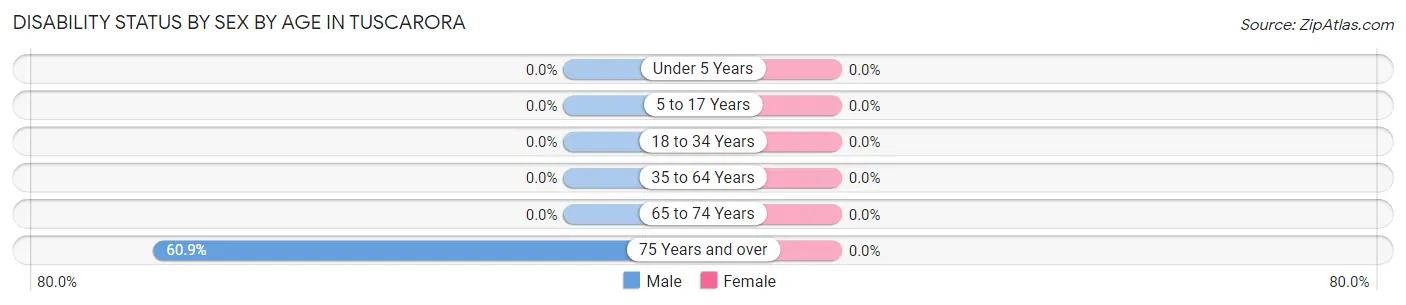
| Age Bracket | Male | Female |
| Under 5 Years | 0 (0.0%) | 0 (0.0%) |
| 5 to 17 Years | 0 (0.0%) | 0 (0.0%) |
| 18 to 34 Years | 0 (0.0%) | 0 (0.0%) |
| 35 to 64 Years | 0 (0.0%) | 0 (0.0%) |
| 65 to 74 Years | 0 (0.0%) | 0 (0.0%) |
| 75 Years and over | 14 (60.9%) | 0 (0.0%) |
Disability Class by Sex by Age in Tuscarora
Disability Class: Hearing Difficulty
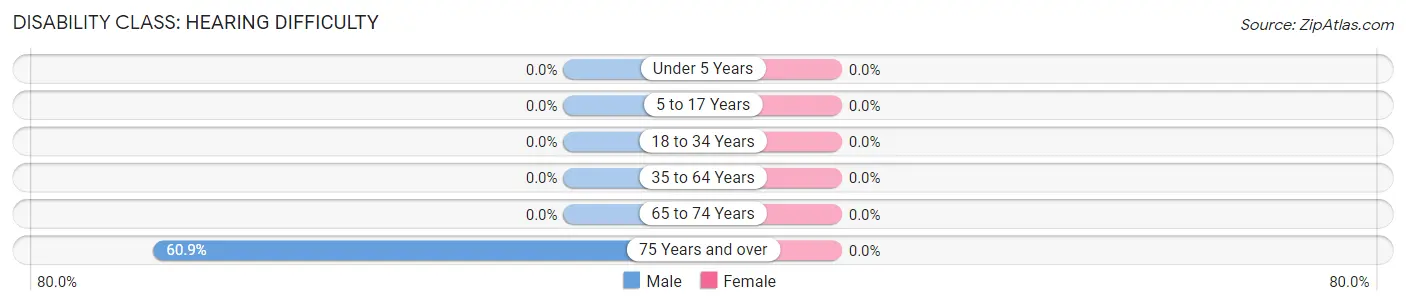
| Age Bracket | Male | Female |
| Under 5 Years | 0 (0.0%) | 0 (0.0%) |
| 5 to 17 Years | 0 (0.0%) | 0 (0.0%) |
| 18 to 34 Years | 0 (0.0%) | 0 (0.0%) |
| 35 to 64 Years | 0 (0.0%) | 0 (0.0%) |
| 65 to 74 Years | 0 (0.0%) | 0 (0.0%) |
| 75 Years and over | 14 (60.9%) | 0 (0.0%) |
Disability Class: Vision Difficulty
| Age Bracket | Male | Female |
| Under 5 Years | 0 (0.0%) | 0 (0.0%) |
| 5 to 17 Years | 0 (0.0%) | 0 (0.0%) |
| 18 to 34 Years | 0 (0.0%) | 0 (0.0%) |
| 35 to 64 Years | 0 (0.0%) | 0 (0.0%) |
| 65 to 74 Years | 0 (0.0%) | 0 (0.0%) |
| 75 Years and over | 0 (0.0%) | 0 (0.0%) |
Disability Class: Cognitive Difficulty
| Age Bracket | Male | Female |
| 5 to 17 Years | 0 (0.0%) | 0 (0.0%) |
| 18 to 34 Years | 0 (0.0%) | 0 (0.0%) |
| 35 to 64 Years | 0 (0.0%) | 0 (0.0%) |
| 65 to 74 Years | 0 (0.0%) | 0 (0.0%) |
| 75 Years and over | 0 (0.0%) | 0 (0.0%) |
Disability Class: Ambulatory Difficulty
| Age Bracket | Male | Female |
| 5 to 17 Years | 0 (0.0%) | 0 (0.0%) |
| 18 to 34 Years | 0 (0.0%) | 0 (0.0%) |
| 35 to 64 Years | 0 (0.0%) | 0 (0.0%) |
| 65 to 74 Years | 0 (0.0%) | 0 (0.0%) |
| 75 Years and over | 0 (0.0%) | 0 (0.0%) |
Disability Class: Self-Care Difficulty

| Age Bracket | Male | Female |
| 5 to 17 Years | 0 (0.0%) | 0 (0.0%) |
| 18 to 34 Years | 0 (0.0%) | 0 (0.0%) |
| 35 to 64 Years | 0 (0.0%) | 0 (0.0%) |
| 65 to 74 Years | 0 (0.0%) | 0 (0.0%) |
| 75 Years and over | 0 (0.0%) | 0 (0.0%) |
Technology Access in Tuscarora
Computing Device Access in Tuscarora
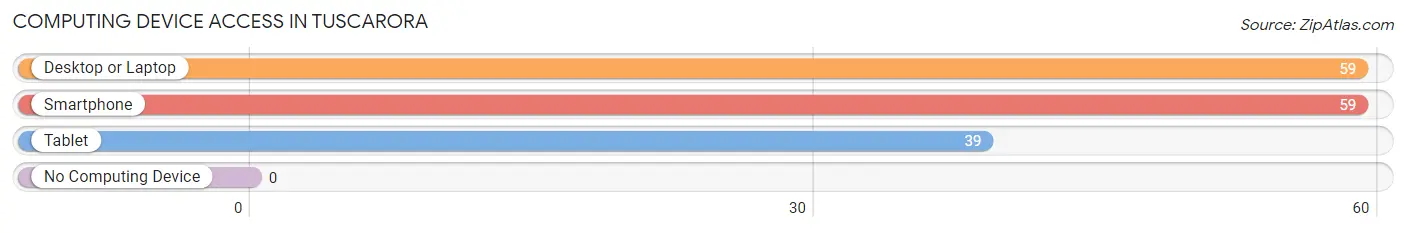
| Device Type | # Households | % Households |
| Desktop or Laptop | 59 | 100.0% |
| Smartphone | 59 | 100.0% |
| Tablet | 39 | 66.1% |
| No Computing Device | 0 | 0.0% |
| Total | 59 | 100.0% |
Internet Access in Tuscarora
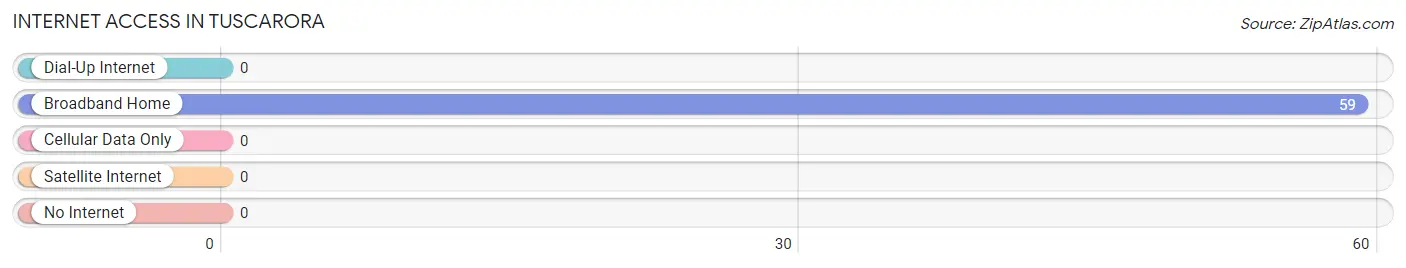
| Internet Type | # Households | % Households |
| Dial-Up Internet | 0 | 0.0% |
| Broadband Home | 59 | 100.0% |
| Cellular Data Only | 0 | 0.0% |
| Satellite Internet | 0 | 0.0% |
| No Internet | 0 | 0.0% |
| Total | 59 | 100.0% |
Tuscarora Summary
Tuscarora, New York is a small town located in Niagara County, New York. It is situated on the Niagara River, just north of the city of Niagara Falls. The town was founded in 1812 and has a population of approximately 1,500 people.
Geography
Tuscarora is located in the Niagara River Valley, which is part of the Great Lakes region. The town is situated on the Niagara River, just north of the city of Niagara Falls. The town is bordered by the towns of Lewiston to the north, Porter to the east, and Niagara Falls to the south. The town is also bordered by the Niagara River to the west. The town is located at an elevation of approximately 500 feet above sea level.
The town is home to several parks and recreational areas, including the Tuscarora State Park, which offers camping, fishing, and hiking opportunities. The park is also home to a variety of wildlife, including deer, foxes, and coyotes.
Economy
Tuscarora is primarily a residential community, with most of its residents employed in the service industry. The town is home to several small businesses, including restaurants, retail stores, and professional services. The town is also home to a number of manufacturing companies, including a paper mill and a plastics factory.
The town is also home to a number of tourist attractions, including the Niagara Falls State Park, the Niagara Gorge, and the Niagara Aquarium. The town is also home to a number of wineries, which offer tours and tastings.
Demographics
As of the 2010 census, the population of Tuscarora was 1,500 people. The racial makeup of the town was 97.3% White, 0.7% African American, 0.3% Native American, 0.3% Asian, and 1.3% from other races. The median household income was $45,000, and the median family income was $50,000.
The town is home to a number of churches, including the First Presbyterian Church, the First Baptist Church, and the St. Mary's Catholic Church. The town is also home to a number of schools, including the Tuscarora Elementary School, the Tuscarora Middle School, and the Tuscarora High School.
Conclusion
Tuscarora, New York is a small town located in Niagara County, New York. It is situated on the Niagara River, just north of the city of Niagara Falls. The town was founded in 1812 and has a population of approximately 1,500 people. The town is primarily a residential community, with most of its residents employed in the service industry. The town is also home to a number of tourist attractions, including the Niagara Falls State Park, the Niagara Gorge, and the Niagara Aquarium. The town is also home to a number of wineries, which offer tours and tastings. The racial makeup of the town was 97.3% White, 0.7% African American, 0.3% Native American, 0.3% Asian, and 1.3% from other races. The median household income was $45,000, and the median family income was $50,000.
Common Questions
What is Per Capita Income in Tuscarora?
Per Capita income in Tuscarora is $39,989.
What is the Median Family Income in Tuscarora?
Median Family Income in Tuscarora is $78,125.
What is Inequality or Gini Index in Tuscarora?
Inequality or Gini Index in Tuscarora is 0.17.
What is the Total Population of Tuscarora?
Total Population of Tuscarora is 167.
What is the Total Male Population of Tuscarora?
Total Male Population of Tuscarora is 109.
What is the Total Female Population of Tuscarora?
Total Female Population of Tuscarora is 58.
What is the Ratio of Males per 100 Females in Tuscarora?
There are 187.93 Males per 100 Females in Tuscarora.
What is the Ratio of Females per 100 Males in Tuscarora?
There are 53.21 Females per 100 Males in Tuscarora.
What is the Median Population Age in Tuscarora?
Median Population Age in Tuscarora is 46.8 Years.
What is the Average Family Size in Tuscarora
Average Family Size in Tuscarora is 2.8 People.
What is the Average Household Size in Tuscarora
Average Household Size in Tuscarora is 2.8 People.
How Large is the Labor Force in Tuscarora?
There are 104 People in the Labor Forcein in Tuscarora.
What is the Percentage of People in the Labor Force in Tuscarora?
62.3% of People are in the Labor Force in Tuscarora.